Myerstown borough, PA Map & Demographics
Myerstown borough Overview
$28,632
PER CAPITA INCOME
$58,966
AVG FAMILY INCOME
$52,429
AVG HOUSEHOLD INCOME
39.1%
WAGE / INCOME GAP [ % ]
60.9¢/ $1
WAGE / INCOME GAP [ $ ]
0.40
INEQUALITY / GINI INDEX
3,107
TOTAL POPULATION
1,715
MALE POPULATION
1,392
FEMALE POPULATION
123.20
MALES / 100 FEMALES
81.17
FEMALES / 100 MALES
43.1
MEDIAN AGE
2.9
AVG FAMILY SIZE
2.4
AVG HOUSEHOLD SIZE
1,437
LABOR FORCE [ PEOPLE ]
58.5%
PERCENT IN LABOR FORCE
4.4%
UNEMPLOYMENT RATE
Income in Myerstown borough
Income Overview in Myerstown borough
Per Capita Income in Myerstown borough is $28,632, while median incomes of families and households are $58,966 and $52,429 respectively.
| Characteristic | Number | Measure |
| Per Capita Income | 3,107 | $28,632 |
| Median Family Income | 754 | $58,966 |
| Mean Family Income | 754 | $77,548 |
| Median Household Income | 1,258 | $52,429 |
| Mean Household Income | 1,258 | $68,363 |
| Income Deficit | 754 | $0 |
| Wage / Income Gap (%) | 3,107 | 39.08% |
| Wage / Income Gap ($) | 3,107 | 60.92¢ per $1 |
| Gini / Inequality Index | 3,107 | 0.40 |
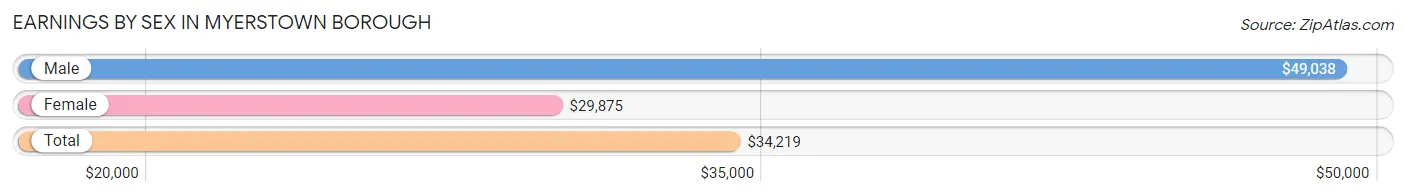
Earnings by Sex in Myerstown borough
Average Earnings in Myerstown borough are $34,219, $49,038 for men and $29,875 for women, a difference of 39.1%.
| Sex | Number | Average Earnings |
| Male | 852 (55.8%) | $49,038 |
| Female | 676 (44.2%) | $29,875 |
| Total | 1,528 (100.0%) | $34,219 |
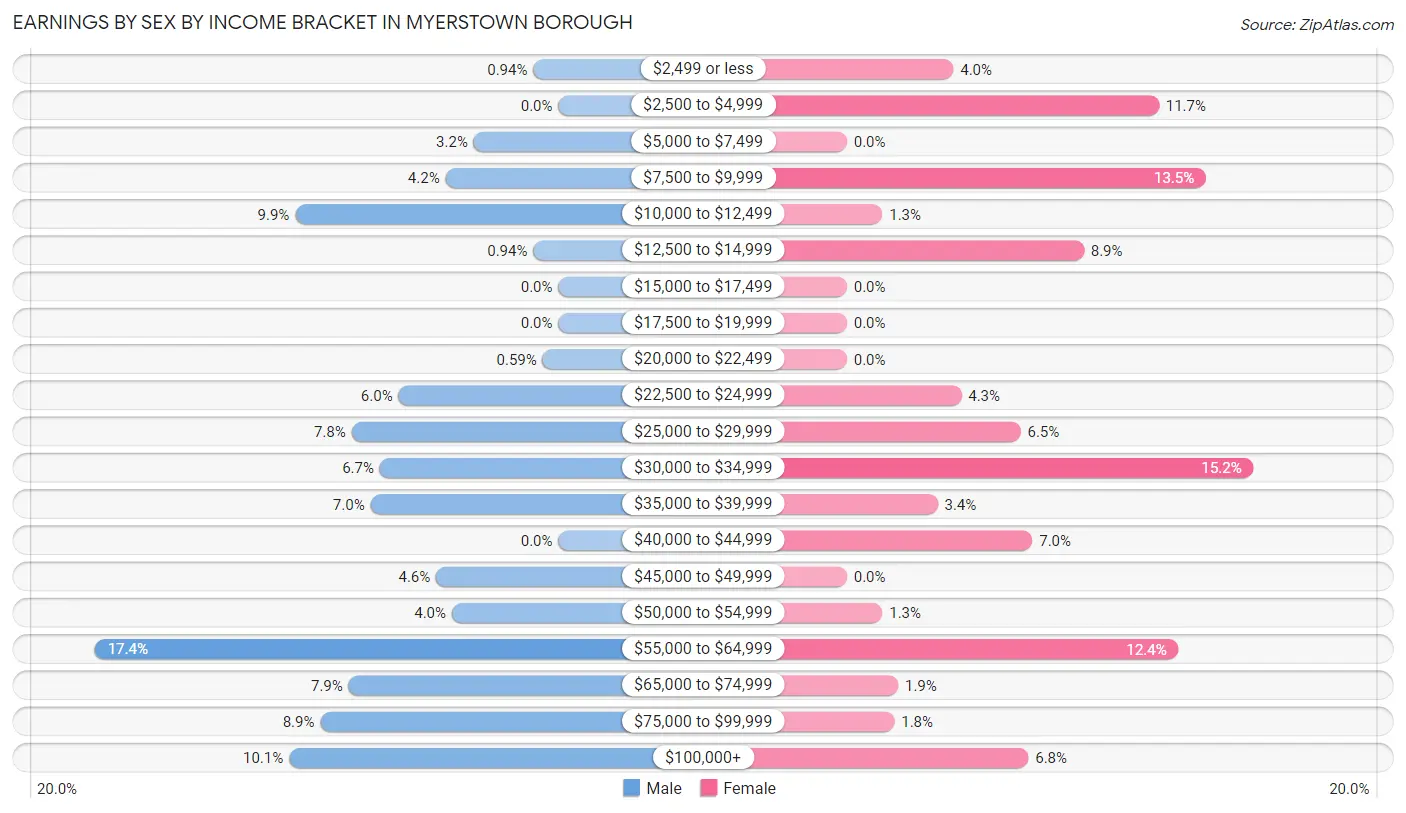
Earnings by Sex by Income Bracket in Myerstown borough
The most common earnings brackets in Myerstown borough are $55,000 to $64,999 for men (148 | 17.4%) and $30,000 to $34,999 for women (103 | 15.2%).
| Income | Male | Female |
| $2,499 or less | 8 (0.9%) | 27 (4.0%) |
| $2,500 to $4,999 | 0 (0.0%) | 79 (11.7%) |
| $5,000 to $7,499 | 27 (3.2%) | 0 (0.0%) |
| $7,500 to $9,999 | 36 (4.2%) | 91 (13.5%) |
| $10,000 to $12,499 | 84 (9.9%) | 9 (1.3%) |
| $12,500 to $14,999 | 8 (0.9%) | 60 (8.9%) |
| $15,000 to $17,499 | 0 (0.0%) | 0 (0.0%) |
| $17,500 to $19,999 | 0 (0.0%) | 0 (0.0%) |
| $20,000 to $22,499 | 5 (0.6%) | 0 (0.0%) |
| $22,500 to $24,999 | 51 (6.0%) | 29 (4.3%) |
| $25,000 to $29,999 | 66 (7.7%) | 44 (6.5%) |
| $30,000 to $34,999 | 57 (6.7%) | 103 (15.2%) |
| $35,000 to $39,999 | 60 (7.0%) | 23 (3.4%) |
| $40,000 to $44,999 | 0 (0.0%) | 47 (7.0%) |
| $45,000 to $49,999 | 39 (4.6%) | 0 (0.0%) |
| $50,000 to $54,999 | 34 (4.0%) | 9 (1.3%) |
| $55,000 to $64,999 | 148 (17.4%) | 84 (12.4%) |
| $65,000 to $74,999 | 67 (7.9%) | 13 (1.9%) |
| $75,000 to $99,999 | 76 (8.9%) | 12 (1.8%) |
| $100,000+ | 86 (10.1%) | 46 (6.8%) |
| Total | 852 (100.0%) | 676 (100.0%) |
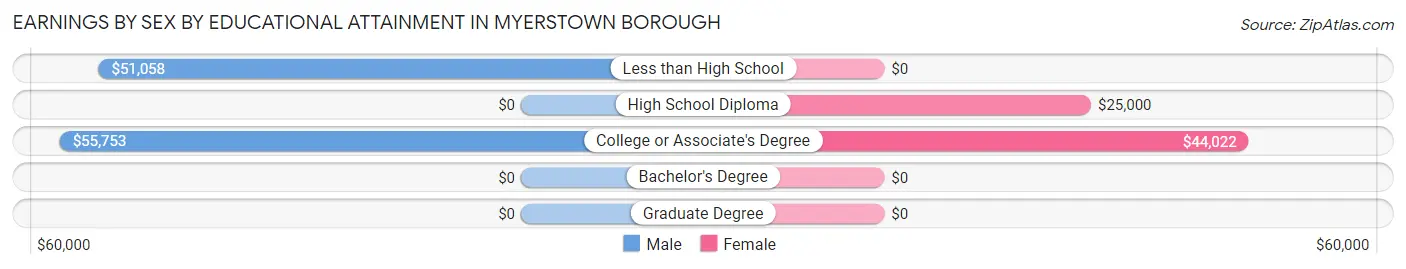
Earnings by Sex by Educational Attainment in Myerstown borough
Average earnings in Myerstown borough are $53,036 for men and $32,262 for women, a difference of 39.2%. Men with an educational attainment of college or associate's degree enjoy the highest average annual earnings of $55,753, while those with less than high school education earn the least with $51,058. Women with an educational attainment of college or associate's degree earn the most with the average annual earnings of $44,022, while those with high school diploma education have the smallest earnings of $25,000.
| Educational Attainment | Male Income | Female Income |
| Less than High School | $51,058 | $0 |
| High School Diploma | - | - |
| College or Associate's Degree | $55,753 | $44,022 |
| Bachelor's Degree | - | - |
| Graduate Degree | - | - |
| Total | $53,036 | $32,262 |
Family Income in Myerstown borough
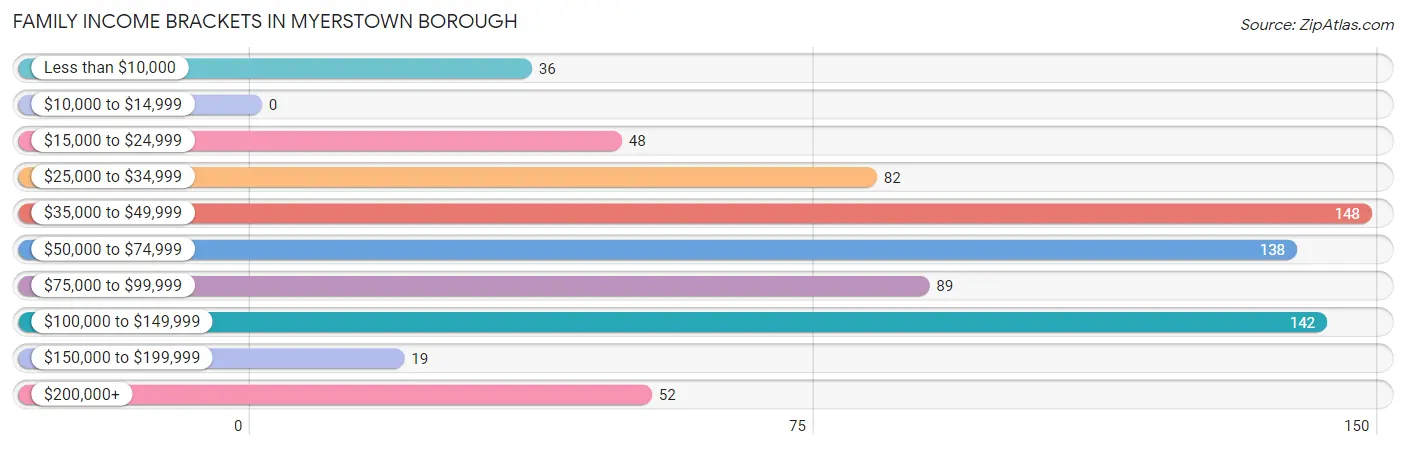
Family Income Brackets in Myerstown borough
According to the Myerstown borough family income data, there are 148 families falling into the $35,000 to $49,999 income range, which is the most common income bracket and makes up 19.6% of all families.
| Income Bracket | # Families | % Families |
| Less than $10,000 | 36 | 4.8% |
| $10,000 to $14,999 | 0 | 0.0% |
| $15,000 to $24,999 | 48 | 6.4% |
| $25,000 to $34,999 | 82 | 10.9% |
| $35,000 to $49,999 | 148 | 19.6% |
| $50,000 to $74,999 | 138 | 18.3% |
| $75,000 to $99,999 | 89 | 11.8% |
| $100,000 to $149,999 | 142 | 18.8% |
| $150,000 to $199,999 | 19 | 2.5% |
| $200,000+ | 52 | 6.9% |
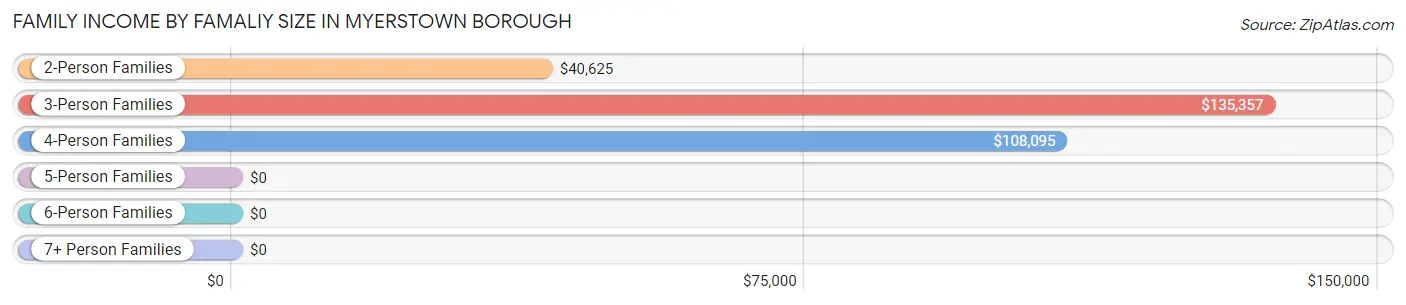
Family Income by Famaliy Size in Myerstown borough
3-person families (84 | 11.1%) account for the highest median family income in Myerstown borough with $135,357 per family, while 3-person families (84 | 11.1%) have the highest median income of $45,119 per family member.
| Income Bracket | # Families | Median Income |
| 2-Person Families | 429 (56.9%) | $40,625 |
| 3-Person Families | 84 (11.1%) | $135,357 |
| 4-Person Families | 190 (25.2%) | $108,095 |
| 5-Person Families | 31 (4.1%) | $0 |
| 6-Person Families | 0 (0.0%) | $0 |
| 7+ Person Families | 20 (2.6%) | $0 |
| Total | 754 (100.0%) | $58,966 |
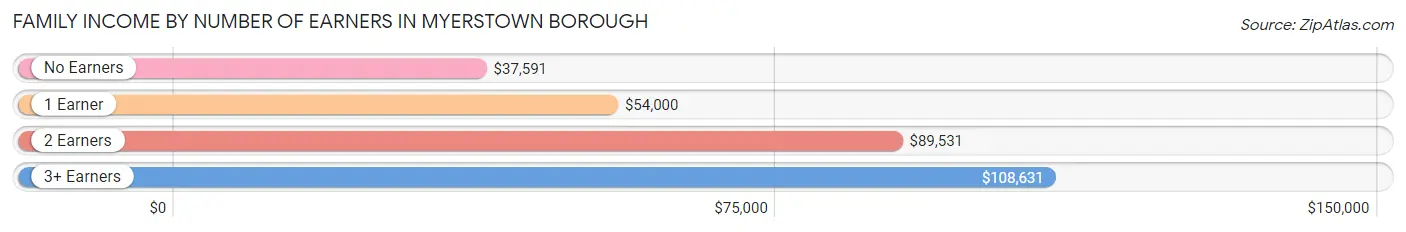
Family Income by Number of Earners in Myerstown borough
The median family income in Myerstown borough is $58,966, with families comprising 3+ earners (75) having the highest median family income of $108,631, while families with no earners (205) have the lowest median family income of $37,591, accounting for 10.0% and 27.2% of families, respectively.
| Number of Earners | # Families | Median Income |
| No Earners | 205 (27.2%) | $37,591 |
| 1 Earner | 220 (29.2%) | $54,000 |
| 2 Earners | 254 (33.7%) | $89,531 |
| 3+ Earners | 75 (10.0%) | $108,631 |
| Total | 754 (100.0%) | $58,966 |
Household Income in Myerstown borough
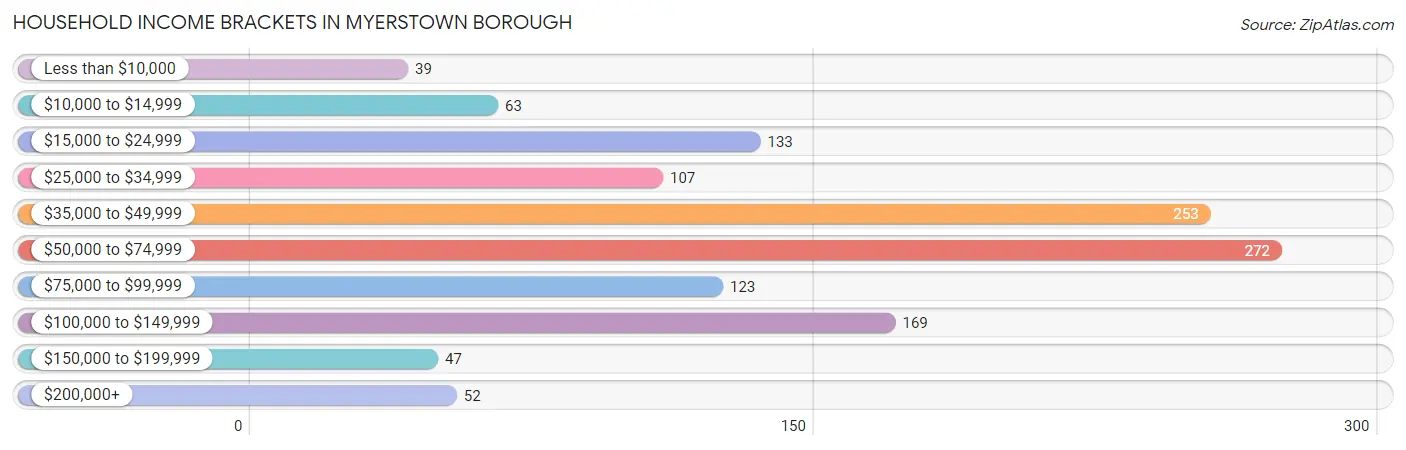
Household Income Brackets in Myerstown borough
With 272 households falling in the category, the $50,000 to $74,999 income range is the most frequent in Myerstown borough, accounting for 21.6% of all households. In contrast, only 39 households (3.1%) fall into the less than $10,000 income bracket, making it the least populous group.
| Income Bracket | # Households | % Households |
| Less than $10,000 | 39 | 3.1% |
| $10,000 to $14,999 | 63 | 5.0% |
| $15,000 to $24,999 | 133 | 10.6% |
| $25,000 to $34,999 | 107 | 8.5% |
| $35,000 to $49,999 | 253 | 20.1% |
| $50,000 to $74,999 | 272 | 21.6% |
| $75,000 to $99,999 | 123 | 9.8% |
| $100,000 to $149,999 | 169 | 13.4% |
| $150,000 to $199,999 | 47 | 3.7% |
| $200,000+ | 52 | 4.1% |
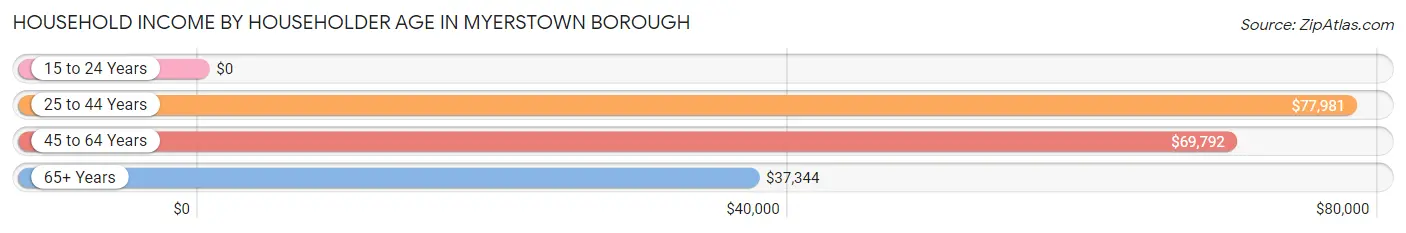
Household Income by Householder Age in Myerstown borough
The median household income in Myerstown borough is $52,429, with the highest median household income of $77,981 found in the 25 to 44 years age bracket for the primary householder. A total of 469 households (37.3%) fall into this category. Meanwhile, the 15 to 24 years age bracket for the primary householder has the lowest median household income of $0, with 65 households (5.2%) in this group.
| Income Bracket | # Households | Median Income |
| 15 to 24 Years | 65 (5.2%) | $0 |
| 25 to 44 Years | 469 (37.3%) | $77,981 |
| 45 to 64 Years | 337 (26.8%) | $69,792 |
| 65+ Years | 387 (30.8%) | $37,344 |
| Total | 1,258 (100.0%) | $52,429 |
Poverty in Myerstown borough
Income Below Poverty by Sex and Age in Myerstown borough
With 10.0% poverty level for males and 16.2% for females among the residents of Myerstown borough, 18 to 24 year old males and 25 to 34 year old females are the most vulnerable to poverty, with 73 males (42.4%) and 48 females (54.5%) in their respective age groups living below the poverty level.
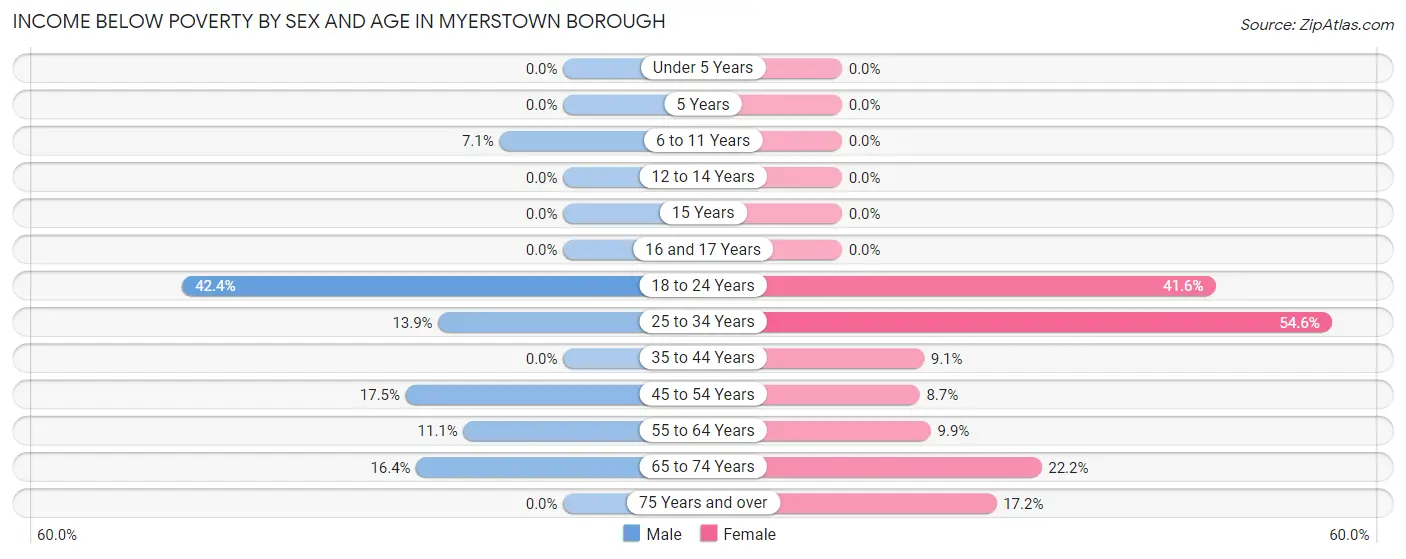
| Age Bracket | Male | Female |
| Under 5 Years | 0 (0.0%) | 0 (0.0%) |
| 5 Years | 0 (0.0%) | 0 (0.0%) |
| 6 to 11 Years | 17 (7.1%) | 0 (0.0%) |
| 12 to 14 Years | 0 (0.0%) | 0 (0.0%) |
| 15 Years | 0 (0.0%) | 0 (0.0%) |
| 16 and 17 Years | 0 (0.0%) | 0 (0.0%) |
| 18 to 24 Years | 73 (42.4%) | 47 (41.6%) |
| 25 to 34 Years | 16 (13.9%) | 48 (54.5%) |
| 35 to 44 Years | 0 (0.0%) | 24 (9.1%) |
| 45 to 54 Years | 30 (17.5%) | 9 (8.6%) |
| 55 to 64 Years | 13 (11.1%) | 18 (9.9%) |
| 65 to 74 Years | 18 (16.4%) | 30 (22.2%) |
| 75 Years and over | 0 (0.0%) | 32 (17.2%) |
| Total | 167 (10.0%) | 208 (16.2%) |
Income Above Poverty by Sex and Age in Myerstown borough
According to the poverty statistics in Myerstown borough, males aged under 5 years and females aged under 5 years are the age groups that are most secure financially, with 100.0% of males and 100.0% of females in these age groups living above the poverty line.
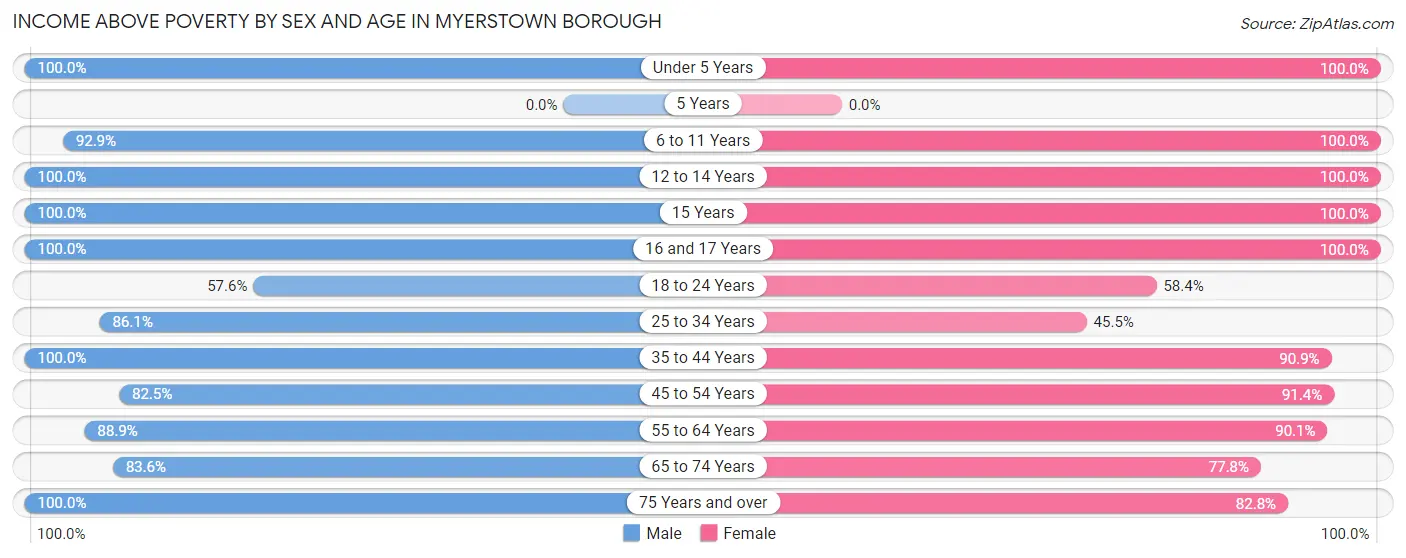
| Age Bracket | Male | Female |
| Under 5 Years | 34 (100.0%) | 41 (100.0%) |
| 5 Years | 0 (0.0%) | 0 (0.0%) |
| 6 to 11 Years | 222 (92.9%) | 82 (100.0%) |
| 12 to 14 Years | 85 (100.0%) | 54 (100.0%) |
| 15 Years | 78 (100.0%) | 14 (100.0%) |
| 16 and 17 Years | 24 (100.0%) | 24 (100.0%) |
| 18 to 24 Years | 99 (57.6%) | 66 (58.4%) |
| 25 to 34 Years | 99 (86.1%) | 40 (45.5%) |
| 35 to 44 Years | 344 (100.0%) | 239 (90.9%) |
| 45 to 54 Years | 141 (82.5%) | 95 (91.3%) |
| 55 to 64 Years | 104 (88.9%) | 164 (90.1%) |
| 65 to 74 Years | 92 (83.6%) | 105 (77.8%) |
| 75 Years and over | 174 (100.0%) | 154 (82.8%) |
| Total | 1,496 (90.0%) | 1,078 (83.8%) |
Income Below Poverty Among Married-Couple Families in Myerstown borough
The poverty statistics for married-couple families in Myerstown borough show that 3.3% or 19 of the total 569 families live below the poverty line. Families with no children have the highest poverty rate of 5.3%, comprising of 19 families. On the other hand, families with 1 or 2 children have the lowest poverty rate of 0.0%, which includes 0 families.
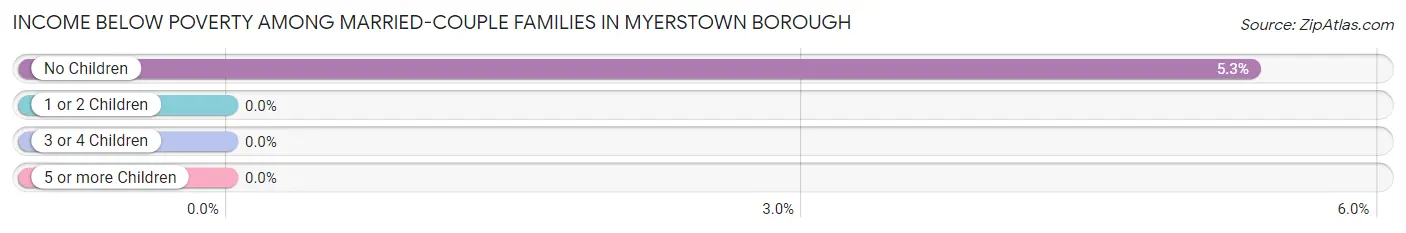
| Children | Above Poverty | Below Poverty |
| No Children | 337 (94.7%) | 19 (5.3%) |
| 1 or 2 Children | 162 (100.0%) | 0 (0.0%) |
| 3 or 4 Children | 31 (100.0%) | 0 (0.0%) |
| 5 or more Children | 20 (100.0%) | 0 (0.0%) |
| Total | 550 (96.7%) | 19 (3.3%) |
Income Below Poverty Among Single-Parent Households in Myerstown borough
According to the poverty data in Myerstown borough, 15.5% or 9 single-father households and 21.3% or 27 single-mother households are living below the poverty line. Among single-father households, those with no children have the highest poverty rate, with 9 households (40.9%) experiencing poverty. Likewise, among single-mother households, those with 1 or 2 children have the highest poverty rate, with 16 households (40.0%) falling below the poverty line.
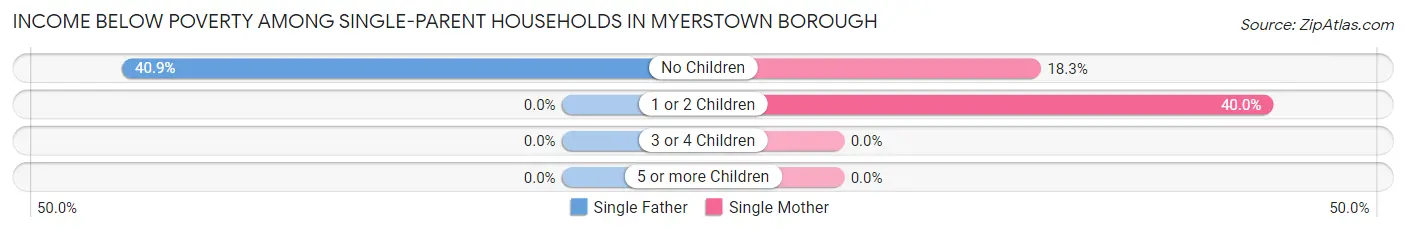
| Children | Single Father | Single Mother |
| No Children | 9 (40.9%) | 11 (18.3%) |
| 1 or 2 Children | 0 (0.0%) | 16 (40.0%) |
| 3 or 4 Children | 0 (0.0%) | 0 (0.0%) |
| 5 or more Children | 0 (0.0%) | 0 (0.0%) |
| Total | 9 (15.5%) | 27 (21.3%) |
Income Below Poverty Among Married-Couple vs Single-Parent Households in Myerstown borough
The poverty data for Myerstown borough shows that 19 of the married-couple family households (3.3%) and 36 of the single-parent households (19.5%) are living below the poverty level. Within the married-couple family households, those with no children have the highest poverty rate, with 19 households (5.3%) falling below the poverty line. Among the single-parent households, those with no children have the highest poverty rate, with 20 household (24.4%) living below poverty.
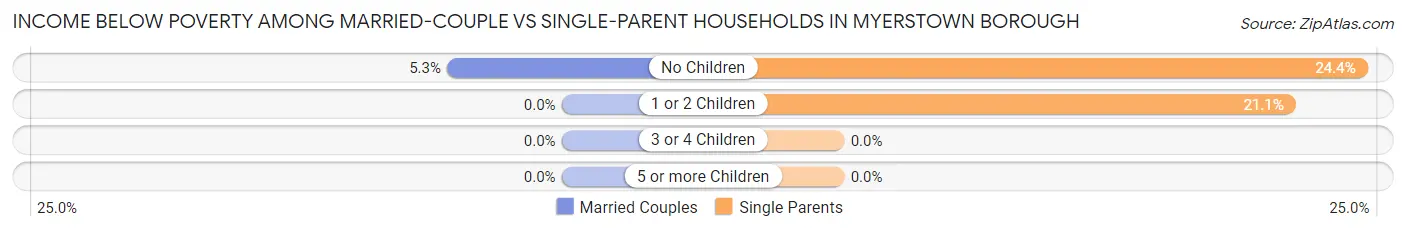
| Children | Married-Couple Families | Single-Parent Households |
| No Children | 19 (5.3%) | 20 (24.4%) |
| 1 or 2 Children | 0 (0.0%) | 16 (21.0%) |
| 3 or 4 Children | 0 (0.0%) | 0 (0.0%) |
| 5 or more Children | 0 (0.0%) | 0 (0.0%) |
| Total | 19 (3.3%) | 36 (19.5%) |
Race in Myerstown borough
The most populous races in Myerstown borough are White / Caucasian (2,987 | 96.1%), Black / African American (54 | 1.7%), and Hispanic or Latino (52 | 1.7%).
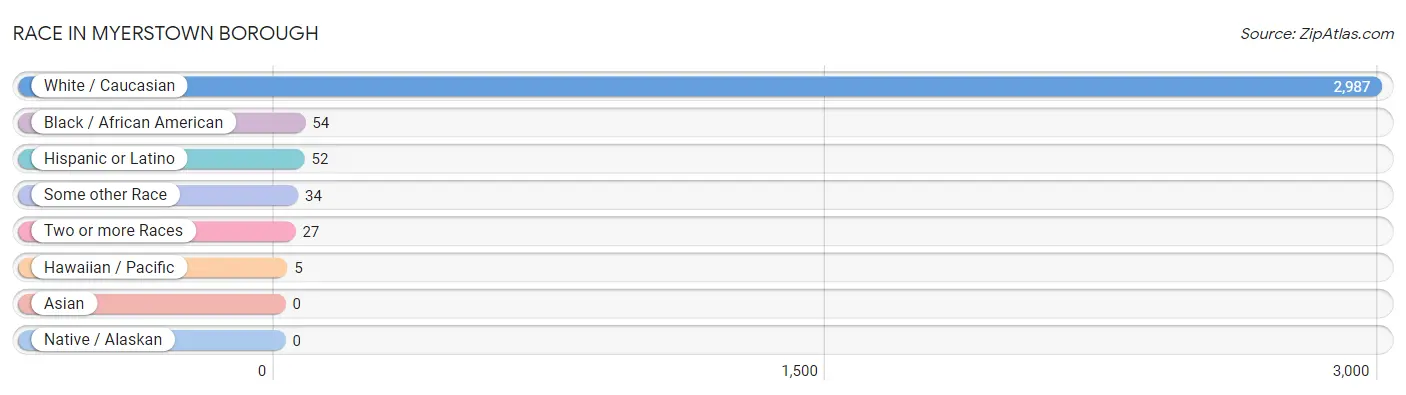
| Race | # Population | % Population |
| Asian | 0 | 0.0% |
| Black / African American | 54 | 1.7% |
| Hawaiian / Pacific | 5 | 0.2% |
| Hispanic or Latino | 52 | 1.7% |
| Native / Alaskan | 0 | 0.0% |
| White / Caucasian | 2,987 | 96.1% |
| Two or more Races | 27 | 0.9% |
| Some other Race | 34 | 1.1% |
| Total | 3,107 | 100.0% |
Ancestry in Myerstown borough
The most populous ancestries reported in Myerstown borough are German (1,103 | 35.5%), English (234 | 7.5%), Irish (204 | 6.6%), Pennsylvania German (169 | 5.4%), and Italian (150 | 4.8%), together accounting for 59.9% of all Myerstown borough residents.
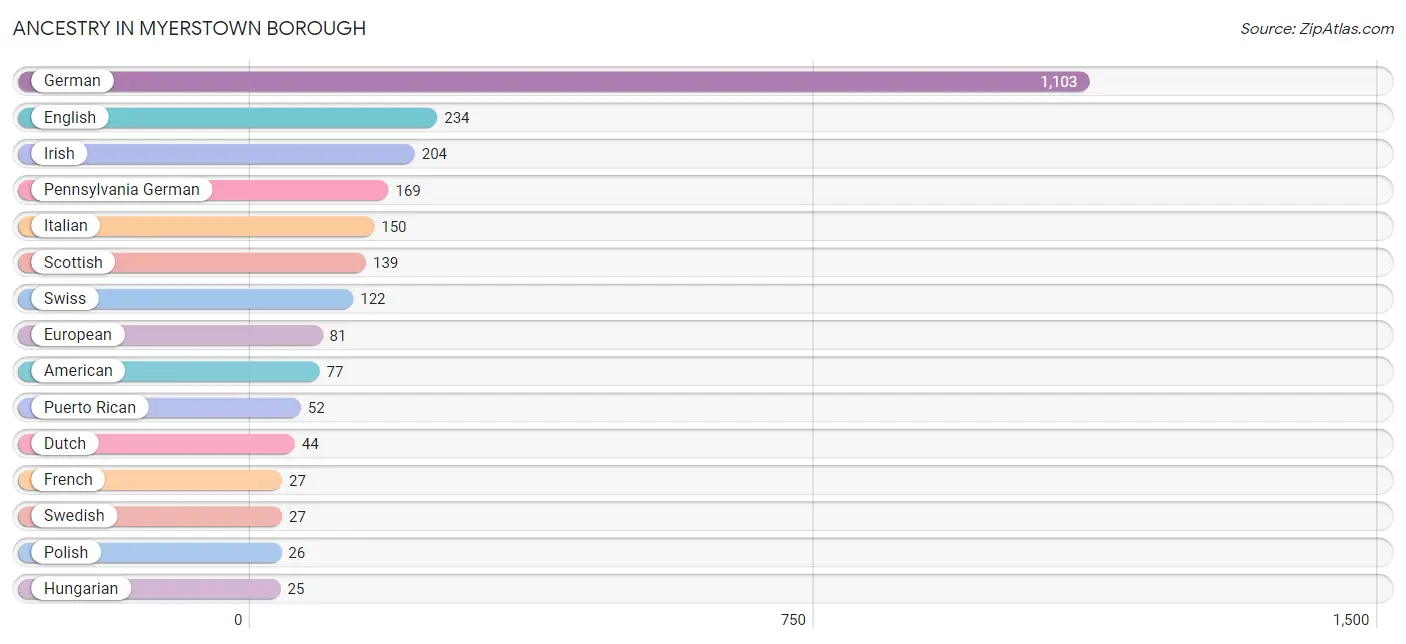
| Ancestry | # Population | % Population |
| American | 77 | 2.5% |
| Blackfeet | 9 | 0.3% |
| Dutch | 44 | 1.4% |
| English | 234 | 7.5% |
| European | 81 | 2.6% |
| French | 27 | 0.9% |
| German | 1,103 | 35.5% |
| Guamanian / Chamorro | 5 | 0.2% |
| Hungarian | 25 | 0.8% |
| Irish | 204 | 6.6% |
| Italian | 150 | 4.8% |
| Pennsylvania German | 169 | 5.4% |
| Polish | 26 | 0.8% |
| Puerto Rican | 52 | 1.7% |
| Scottish | 139 | 4.5% |
| Slovak | 19 | 0.6% |
| Swedish | 27 | 0.9% |
| Swiss | 122 | 3.9% |
| Ukrainian | 15 | 0.5% |
| Welsh | 19 | 0.6% | View All 20 Rows |
Immigrants in Myerstown borough
The most numerous immigrant groups reported in Myerstown borough came from Europe (8 | 0.3%), Ireland (8 | 0.3%), and Northern Europe (8 | 0.3%), together accounting for 0.8% of all Myerstown borough residents.
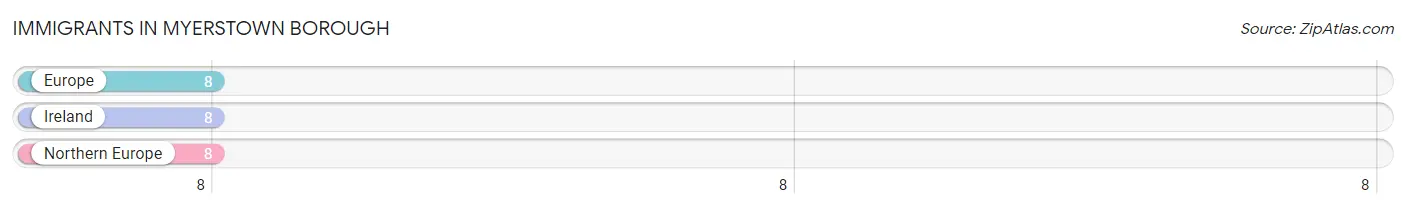
| Immigration Origin | # Population | % Population |
| Europe | 8 | 0.3% |
| Ireland | 8 | 0.3% |
| Northern Europe | 8 | 0.3% | View All 3 Rows |
Sex and Age in Myerstown borough
Sex and Age in Myerstown borough
The most populous age groups in Myerstown borough are 10 to 14 Years (204 | 11.9%) for men and 40 to 44 Years (182 | 13.1%) for women.
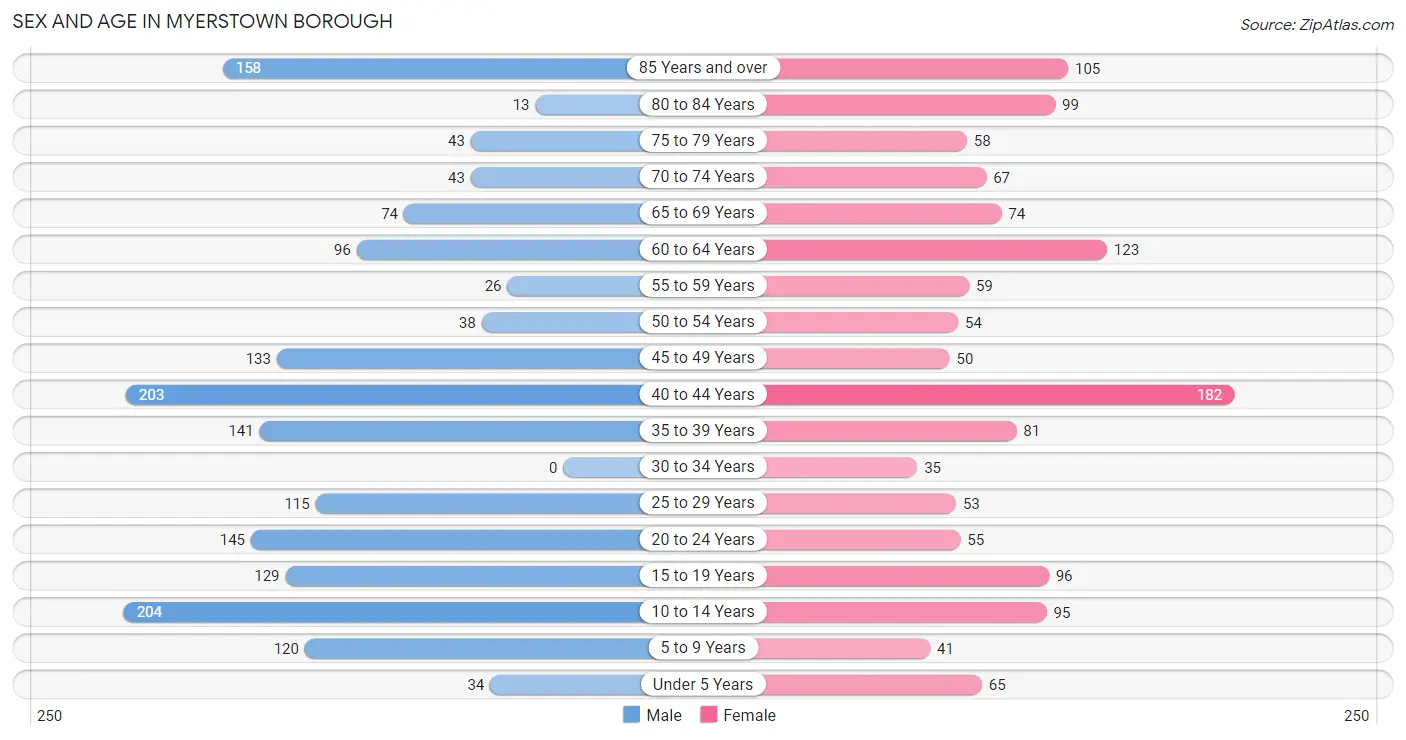
| Age Bracket | Male | Female |
| Under 5 Years | 34 (2.0%) | 65 (4.7%) |
| 5 to 9 Years | 120 (7.0%) | 41 (2.9%) |
| 10 to 14 Years | 204 (11.9%) | 95 (6.8%) |
| 15 to 19 Years | 129 (7.5%) | 96 (6.9%) |
| 20 to 24 Years | 145 (8.5%) | 55 (4.0%) |
| 25 to 29 Years | 115 (6.7%) | 53 (3.8%) |
| 30 to 34 Years | 0 (0.0%) | 35 (2.5%) |
| 35 to 39 Years | 141 (8.2%) | 81 (5.8%) |
| 40 to 44 Years | 203 (11.8%) | 182 (13.1%) |
| 45 to 49 Years | 133 (7.8%) | 50 (3.6%) |
| 50 to 54 Years | 38 (2.2%) | 54 (3.9%) |
| 55 to 59 Years | 26 (1.5%) | 59 (4.2%) |
| 60 to 64 Years | 96 (5.6%) | 123 (8.8%) |
| 65 to 69 Years | 74 (4.3%) | 74 (5.3%) |
| 70 to 74 Years | 43 (2.5%) | 67 (4.8%) |
| 75 to 79 Years | 43 (2.5%) | 58 (4.2%) |
| 80 to 84 Years | 13 (0.8%) | 99 (7.1%) |
| 85 Years and over | 158 (9.2%) | 105 (7.5%) |
| Total | 1,715 (100.0%) | 1,392 (100.0%) |
Families and Households in Myerstown borough
Median Family Size in Myerstown borough
The median family size in Myerstown borough is 2.90 persons per family, with married-couple families (569 | 75.5%) accounting for the largest median family size of 2.99 persons per family. On the other hand, single male/father families (58 | 7.7%) represent the smallest median family size with 2.29 persons per family.
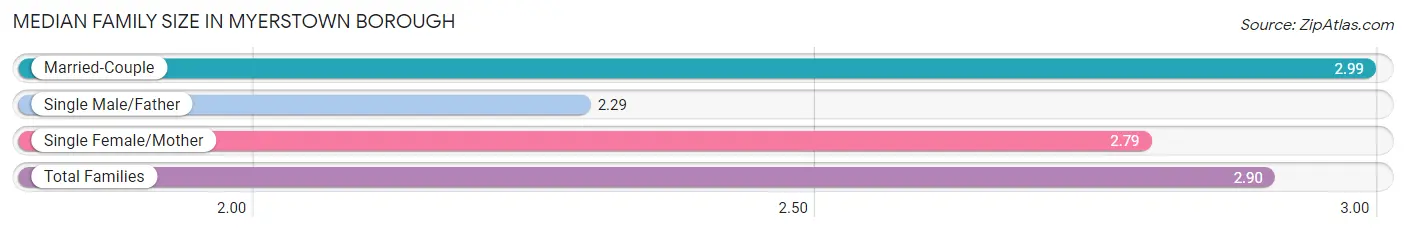
| Family Type | # Families | Family Size |
| Married-Couple | 569 (75.5%) | 2.99 |
| Single Male/Father | 58 (7.7%) | 2.29 |
| Single Female/Mother | 127 (16.8%) | 2.79 |
| Total Families | 754 (100.0%) | 2.90 |
Median Household Size in Myerstown borough
The median household size in Myerstown borough is 2.36 persons per household, with single female/mother households (127 | 10.1%) accounting for the largest median household size of 3.09 persons per household. non-family households (504 | 40.1%) represent the smallest median household size with 1.37 persons per household.
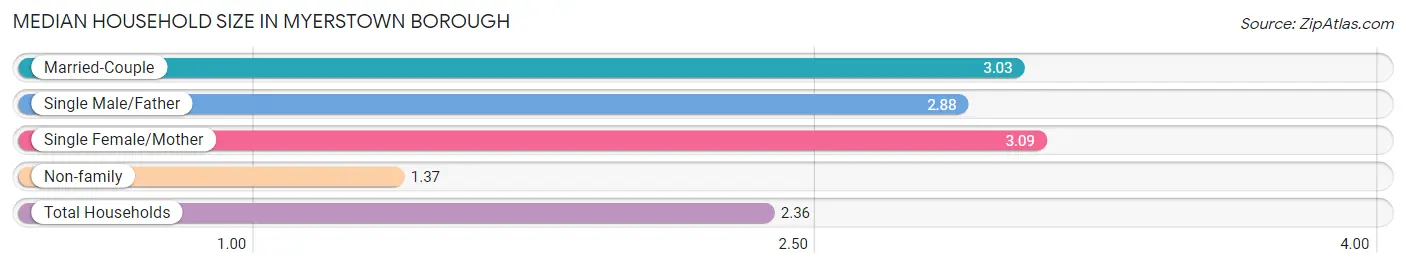
| Household Type | # Households | Household Size |
| Married-Couple | 569 (45.2%) | 3.03 |
| Single Male/Father | 58 (4.6%) | 2.88 |
| Single Female/Mother | 127 (10.1%) | 3.09 |
| Non-family | 504 (40.1%) | 1.37 |
| Total Households | 1,258 (100.0%) | 2.36 |
Household Size by Marriage Status in Myerstown borough
Out of a total of 1,258 households in Myerstown borough, 754 (59.9%) are family households, while 504 (40.1%) are nonfamily households. The most numerous type of family households are 2-person households, comprising 353, and the most common type of nonfamily households are 1-person households, comprising 345.
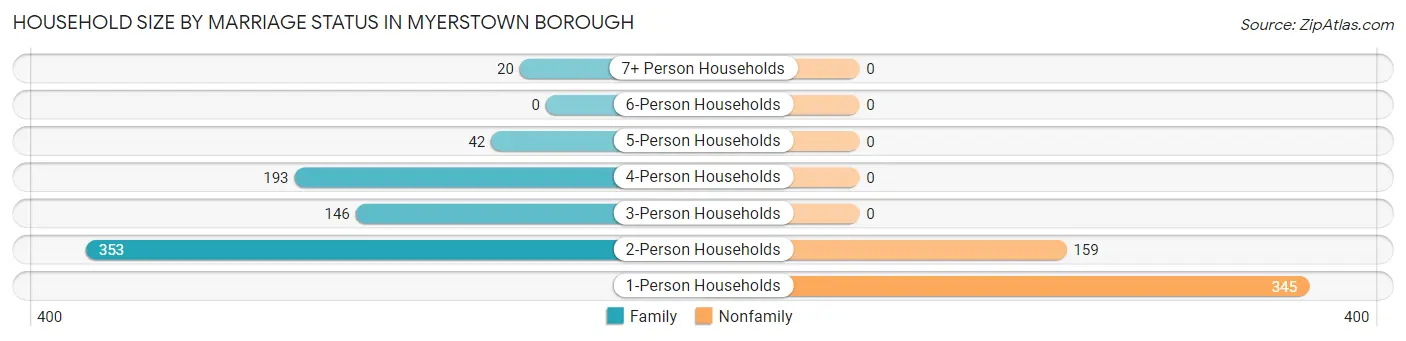
| Household Size | Family Households | Nonfamily Households |
| 1-Person Households | - | 345 (27.4%) |
| 2-Person Households | 353 (28.1%) | 159 (12.6%) |
| 3-Person Households | 146 (11.6%) | 0 (0.0%) |
| 4-Person Households | 193 (15.3%) | 0 (0.0%) |
| 5-Person Households | 42 (3.3%) | 0 (0.0%) |
| 6-Person Households | 0 (0.0%) | 0 (0.0%) |
| 7+ Person Households | 20 (1.6%) | 0 (0.0%) |
| Total | 754 (59.9%) | 504 (40.1%) |
Female Fertility in Myerstown borough
Fertility by Age in Myerstown borough
| Age Bracket | Women with Births | Births / 1,000 Women |
| 15 to 19 years | 0 (0.0%) | 0.0 |
| 20 to 34 years | 0 (0.0%) | 0.0 |
| 35 to 50 years | 0 (0.0%) | 0.0 |
| Total | 0 (0.0%) | 0.0 |
Fertility by Age by Marriage Status in Myerstown borough
| Age Bracket | Married | Unmarried |
| 15 to 19 years | 0 (0.0%) | 0 (0.0%) |
| 20 to 34 years | 0 (0.0%) | 0 (0.0%) |
| 35 to 50 years | 0 (0.0%) | 0 (0.0%) |
| Total | 0 (0.0%) | 0 (0.0%) |
Fertility by Education in Myerstown borough
| Educational Attainment | Women with Births | Births / 1,000 Women |
| Less than High School | 0 (0.0%) | 0.0 |
| High School Diploma | 0 (0.0%) | 0.0 |
| College or Associate's Degree | 0 (0.0%) | 0.0 |
| Bachelor's Degree | 0 (0.0%) | 0.0 |
| Graduate Degree | 0 (0.0%) | 0.0 |
| Total | 0 (0.0%) | 0.0 |
Fertility by Education by Marriage Status in Myerstown borough
| Educational Attainment | Married | Unmarried |
| Less than High School | 0 (0.0%) | 0 (0.0%) |
| High School Diploma | 0 (0.0%) | 0 (0.0%) |
| College or Associate's Degree | 0 (0.0%) | 0 (0.0%) |
| Bachelor's Degree | 0 (0.0%) | 0 (0.0%) |
| Graduate Degree | 0 (0.0%) | 0 (0.0%) |
| Total | 0 (0.0%) | 0 (0.0%) |
Employment Characteristics in Myerstown borough
Employment by Class of Employer in Myerstown borough
Among the 1,373 employed individuals in Myerstown borough, private company employees (931 | 67.8%), not-for-profit organizations (171 | 12.4%), and self-employed (not incorporated) (156 | 11.4%) make up the most common classes of employment.
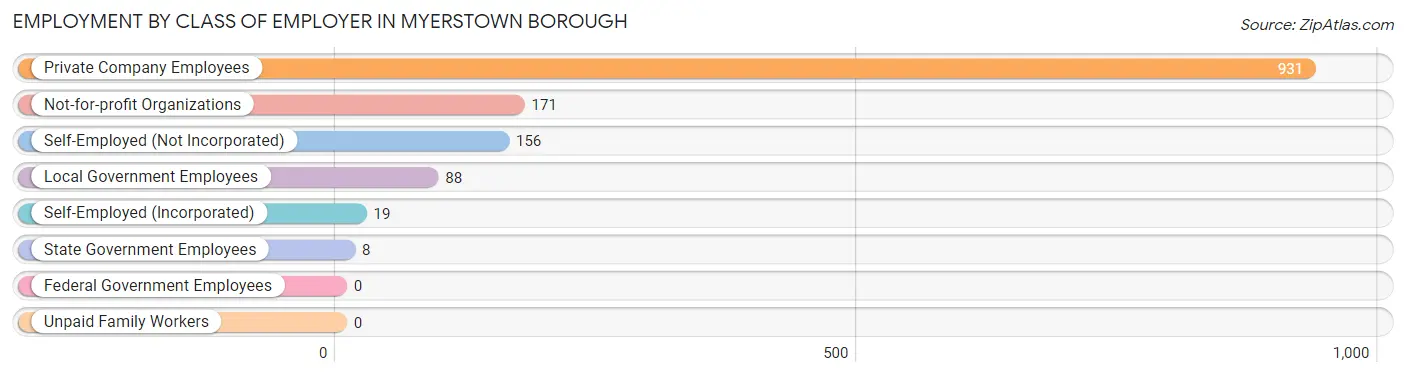
| Employer Class | # Employees | % Employees |
| Private Company Employees | 931 | 67.8% |
| Self-Employed (Incorporated) | 19 | 1.4% |
| Self-Employed (Not Incorporated) | 156 | 11.4% |
| Not-for-profit Organizations | 171 | 12.4% |
| Local Government Employees | 88 | 6.4% |
| State Government Employees | 8 | 0.6% |
| Federal Government Employees | 0 | 0.0% |
| Unpaid Family Workers | 0 | 0.0% |
| Total | 1,373 | 100.0% |
Employment Status by Age in Myerstown borough
According to the labor force statistics for Myerstown borough, out of the total population over 16 years of age (2,456), 58.5% or 1,437 individuals are in the labor force, with 4.4% or 63 of them unemployed. The age group with the highest labor force participation rate is 35 to 44 years, with 97.4% or 591 individuals in the labor force. Within the labor force, the 16 to 19 years age range has the highest percentage of unemployed individuals, with 24.4% or 22 of them being unemployed.
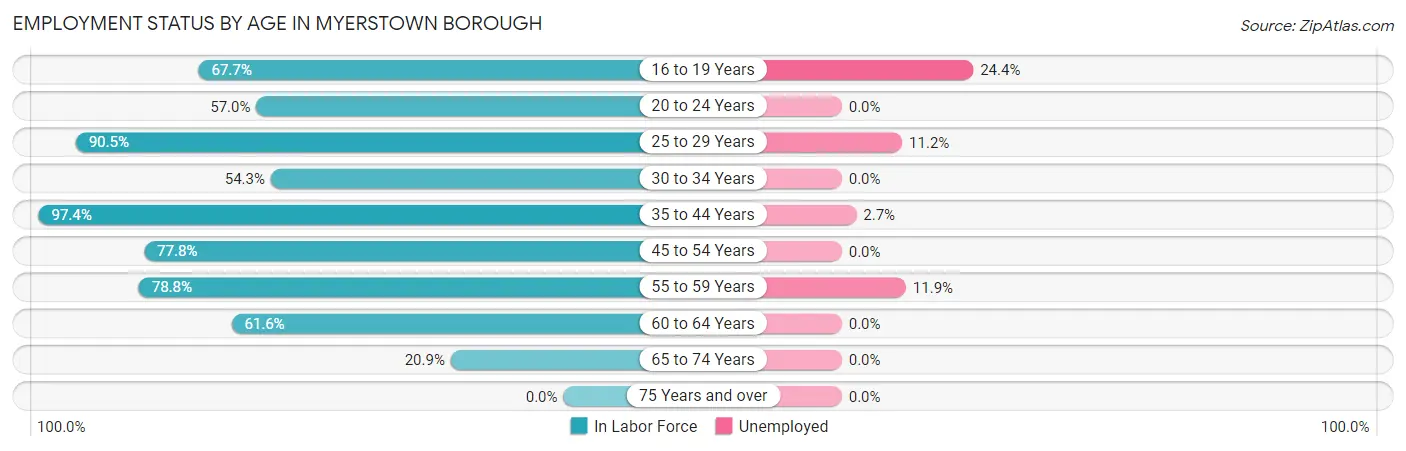
| Age Bracket | In Labor Force | Unemployed |
| 16 to 19 Years | 90 (67.7%) | 22 (24.4%) |
| 20 to 24 Years | 114 (57.0%) | 0 (0.0%) |
| 25 to 29 Years | 152 (90.5%) | 17 (11.2%) |
| 30 to 34 Years | 19 (54.3%) | 0 (0.0%) |
| 35 to 44 Years | 591 (97.4%) | 16 (2.7%) |
| 45 to 54 Years | 214 (77.8%) | 0 (0.0%) |
| 55 to 59 Years | 67 (78.8%) | 8 (11.9%) |
| 60 to 64 Years | 135 (61.6%) | 0 (0.0%) |
| 65 to 74 Years | 54 (20.9%) | 0 (0.0%) |
| 75 Years and over | 0 (0.0%) | 0 (0.0%) |
| Total | 1,437 (58.5%) | 63 (4.4%) |
Employment Status by Educational Attainment in Myerstown borough
According to labor force statistics for Myerstown borough, 84.8% of individuals (1,178) out of the total population between 25 and 64 years of age (1,389) are in the labor force, with 3.5% or 41 of them being unemployed. The group with the highest labor force participation rate are those with the educational attainment of college / associate degree, with 93.4% or 351 individuals in the labor force. Within the labor force, individuals with high school diploma education have the highest percentage of unemployment, with 6.8% or 41 of them being unemployed.
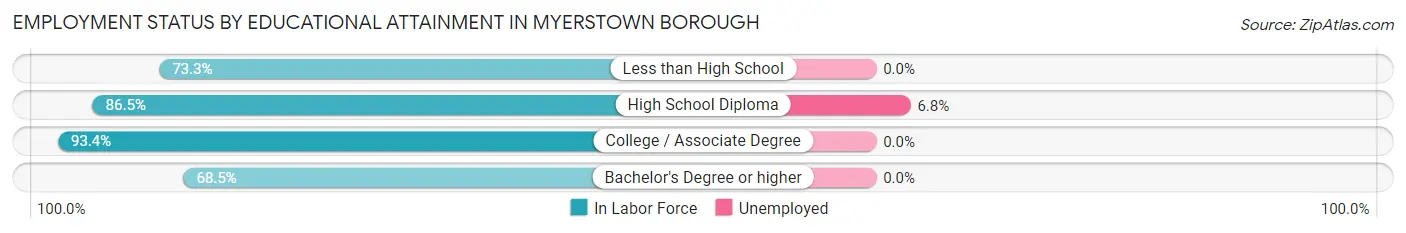
| Educational Attainment | In Labor Force | Unemployed |
| Less than High School | 126 (73.3%) | 0 (0.0%) |
| High School Diploma | 601 (86.5%) | 47 (6.8%) |
| College / Associate Degree | 351 (93.4%) | 0 (0.0%) |
| Bachelor's Degree or higher | 100 (68.5%) | 0 (0.0%) |
| Total | 1,178 (84.8%) | 49 (3.5%) |
Employment Occupations by Sex in Myerstown borough
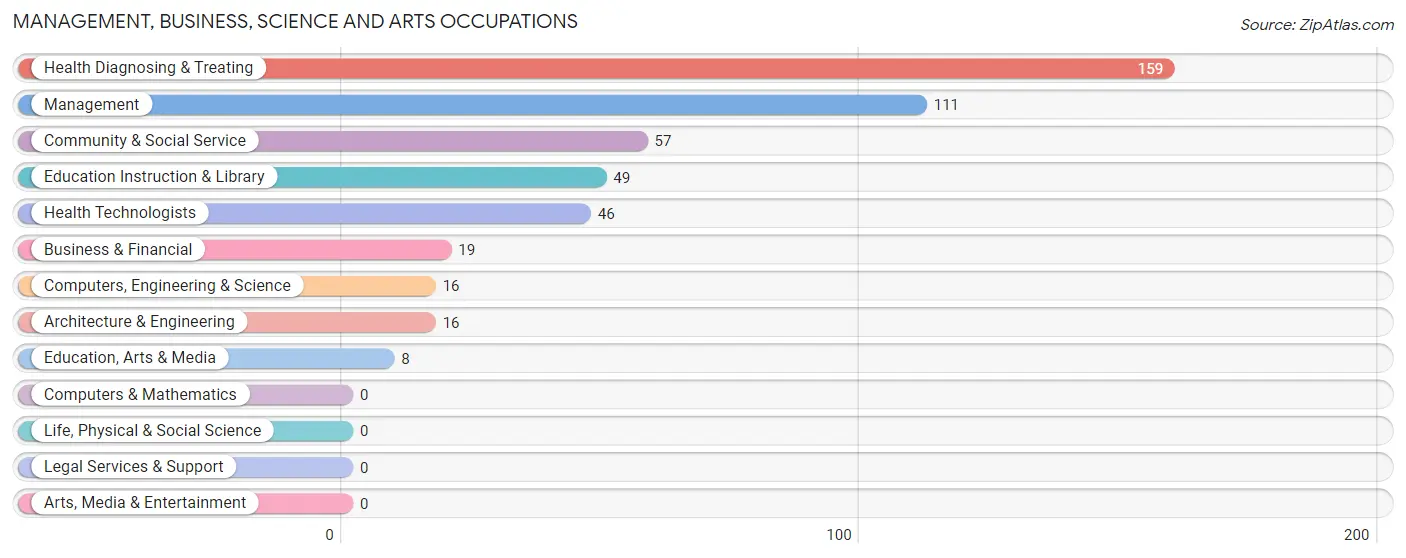
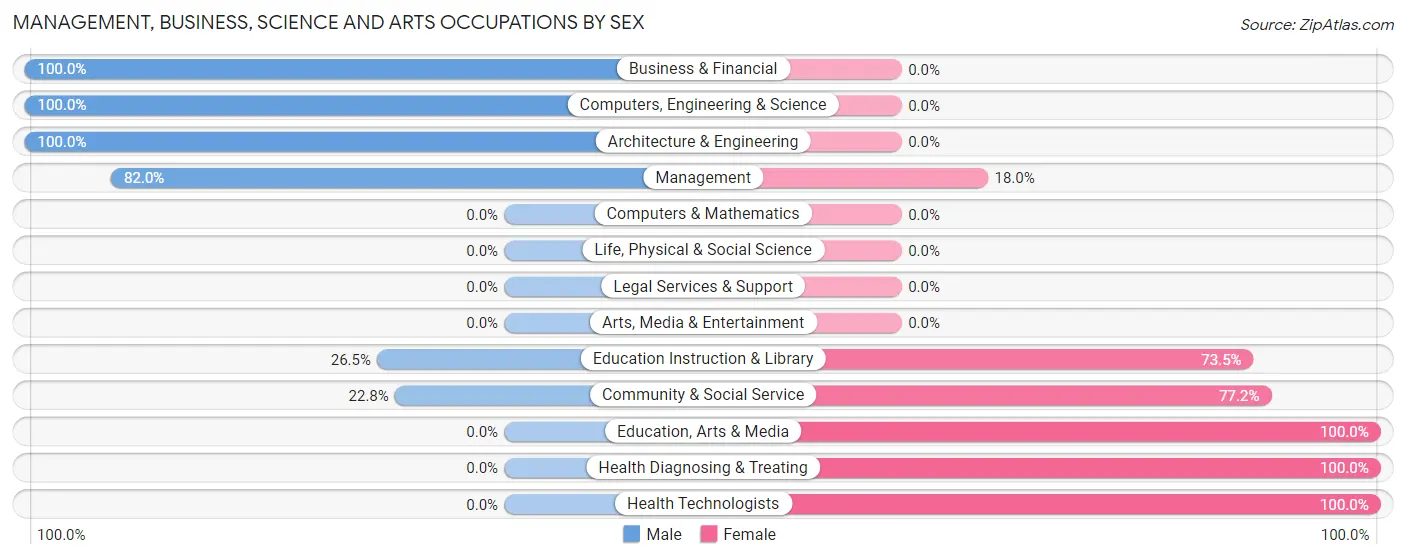
Management, Business, Science and Arts Occupations
The most common Management, Business, Science and Arts occupations in Myerstown borough are Health Diagnosing & Treating (159 | 11.6%), Management (111 | 8.1%), Community & Social Service (57 | 4.2%), Education Instruction & Library (49 | 3.6%), and Health Technologists (46 | 3.4%).
Management, Business, Science and Arts Occupations by Sex
Within the Management, Business, Science and Arts occupations in Myerstown borough, the most male-oriented occupations are Business & Financial (100.0%), Computers, Engineering & Science (100.0%), and Architecture & Engineering (100.0%), while the most female-oriented occupations are Education, Arts & Media (100.0%), Health Diagnosing & Treating (100.0%), and Health Technologists (100.0%).
| Occupation | Male | Female |
| Management | 91 (82.0%) | 20 (18.0%) |
| Business & Financial | 19 (100.0%) | 0 (0.0%) |
| Computers, Engineering & Science | 16 (100.0%) | 0 (0.0%) |
| Computers & Mathematics | 0 (0.0%) | 0 (0.0%) |
| Architecture & Engineering | 16 (100.0%) | 0 (0.0%) |
| Life, Physical & Social Science | 0 (0.0%) | 0 (0.0%) |
| Community & Social Service | 13 (22.8%) | 44 (77.2%) |
| Education, Arts & Media | 0 (0.0%) | 8 (100.0%) |
| Legal Services & Support | 0 (0.0%) | 0 (0.0%) |
| Education Instruction & Library | 13 (26.5%) | 36 (73.5%) |
| Arts, Media & Entertainment | 0 (0.0%) | 0 (0.0%) |
| Health Diagnosing & Treating | 0 (0.0%) | 159 (100.0%) |
| Health Technologists | 0 (0.0%) | 46 (100.0%) |
| Total (Category) | 139 (38.4%) | 223 (61.6%) |
| Total (Overall) | 756 (55.1%) | 617 (44.9%) |
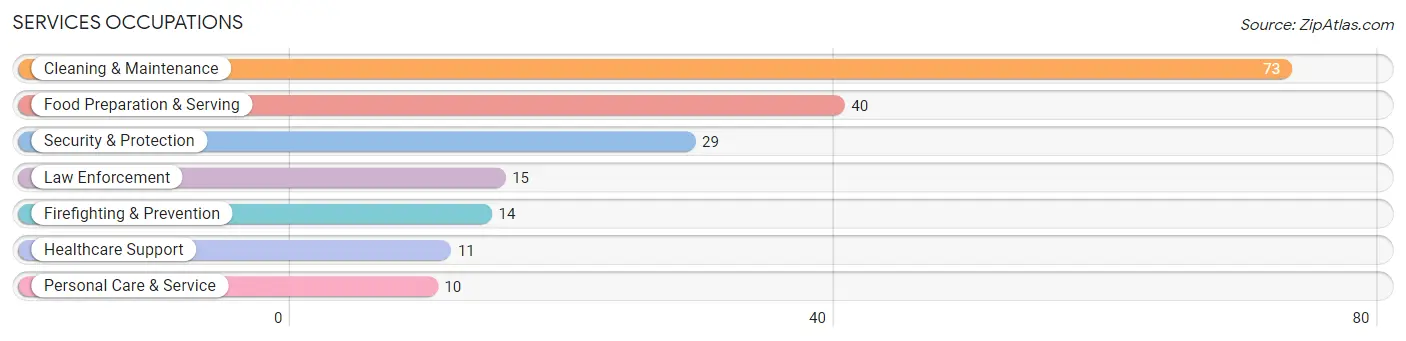
Services Occupations
The most common Services occupations in Myerstown borough are Cleaning & Maintenance (73 | 5.3%), Food Preparation & Serving (40 | 2.9%), Security & Protection (29 | 2.1%), Law Enforcement (15 | 1.1%), and Firefighting & Prevention (14 | 1.0%).
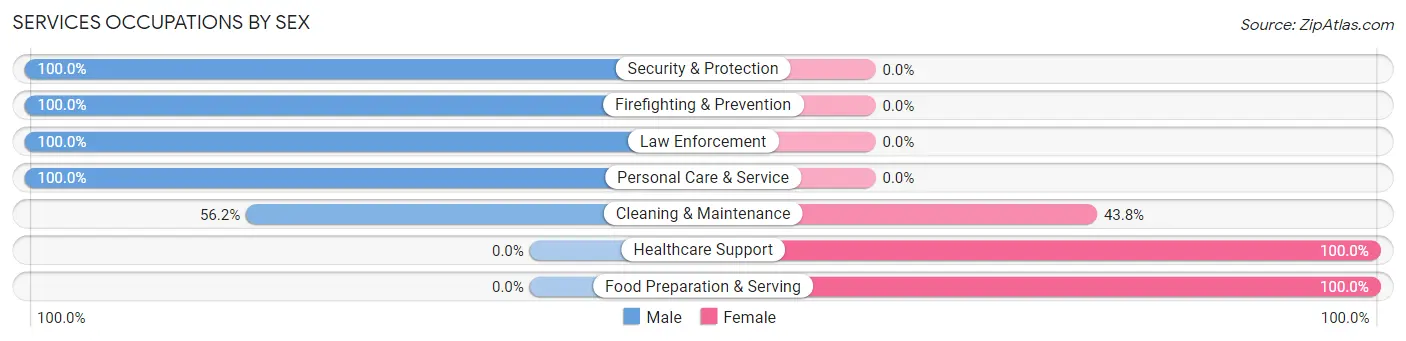
Services Occupations by Sex
Within the Services occupations in Myerstown borough, the most male-oriented occupations are Security & Protection (100.0%), Firefighting & Prevention (100.0%), and Law Enforcement (100.0%), while the most female-oriented occupations are Healthcare Support (100.0%), Food Preparation & Serving (100.0%), and Cleaning & Maintenance (43.8%).
| Occupation | Male | Female |
| Healthcare Support | 0 (0.0%) | 11 (100.0%) |
| Security & Protection | 29 (100.0%) | 0 (0.0%) |
| Firefighting & Prevention | 14 (100.0%) | 0 (0.0%) |
| Law Enforcement | 15 (100.0%) | 0 (0.0%) |
| Food Preparation & Serving | 0 (0.0%) | 40 (100.0%) |
| Cleaning & Maintenance | 41 (56.2%) | 32 (43.8%) |
| Personal Care & Service | 10 (100.0%) | 0 (0.0%) |
| Total (Category) | 80 (49.1%) | 83 (50.9%) |
| Total (Overall) | 756 (55.1%) | 617 (44.9%) |
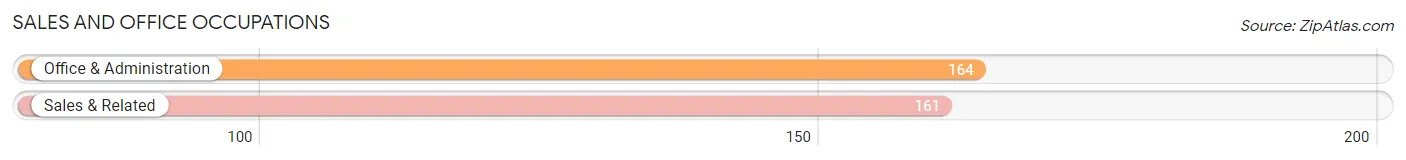
Sales and Office Occupations
The most common Sales and Office occupations in Myerstown borough are Office & Administration (164 | 11.9%), and Sales & Related (161 | 11.7%).
Sales and Office Occupations by Sex

| Occupation | Male | Female |
| Sales & Related | 102 (63.3%) | 59 (36.6%) |
| Office & Administration | 0 (0.0%) | 164 (100.0%) |
| Total (Category) | 102 (31.4%) | 223 (68.6%) |
| Total (Overall) | 756 (55.1%) | 617 (44.9%) |
Natural Resources, Construction and Maintenance Occupations
The most common Natural Resources, Construction and Maintenance occupations in Myerstown borough are Construction & Extraction (74 | 5.4%), Installation, Maintenance & Repair (60 | 4.4%), and Farming, Fishing & Forestry (22 | 1.6%).
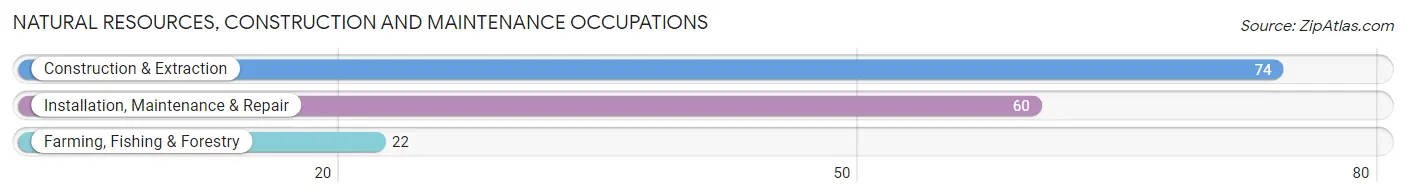
Natural Resources, Construction and Maintenance Occupations by Sex

| Occupation | Male | Female |
| Farming, Fishing & Forestry | 22 (100.0%) | 0 (0.0%) |
| Construction & Extraction | 74 (100.0%) | 0 (0.0%) |
| Installation, Maintenance & Repair | 60 (100.0%) | 0 (0.0%) |
| Total (Category) | 156 (100.0%) | 0 (0.0%) |
| Total (Overall) | 756 (55.1%) | 617 (44.9%) |
Production, Transportation and Moving Occupations
The most common Production, Transportation and Moving occupations in Myerstown borough are Production (232 | 16.9%), Material Moving (84 | 6.1%), and Transportation (51 | 3.7%).
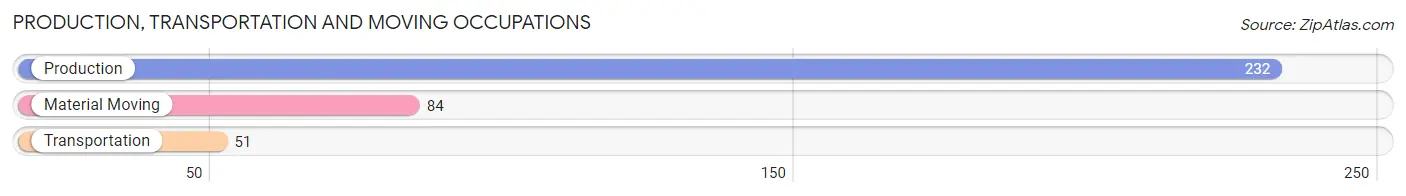
Production, Transportation and Moving Occupations by Sex
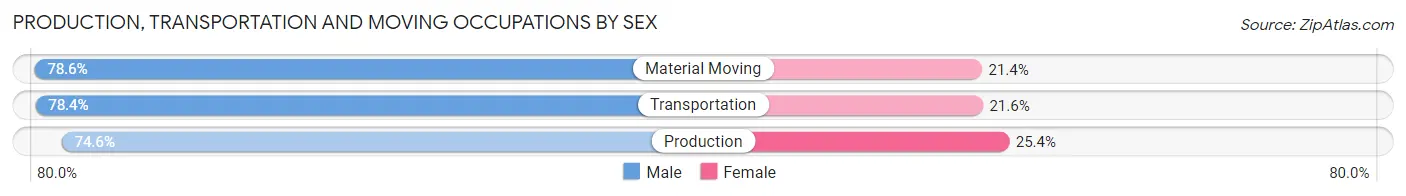
| Occupation | Male | Female |
| Production | 173 (74.6%) | 59 (25.4%) |
| Transportation | 40 (78.4%) | 11 (21.6%) |
| Material Moving | 66 (78.6%) | 18 (21.4%) |
| Total (Category) | 279 (76.0%) | 88 (24.0%) |
| Total (Overall) | 756 (55.1%) | 617 (44.9%) |
Employment Industries by Sex in Myerstown borough
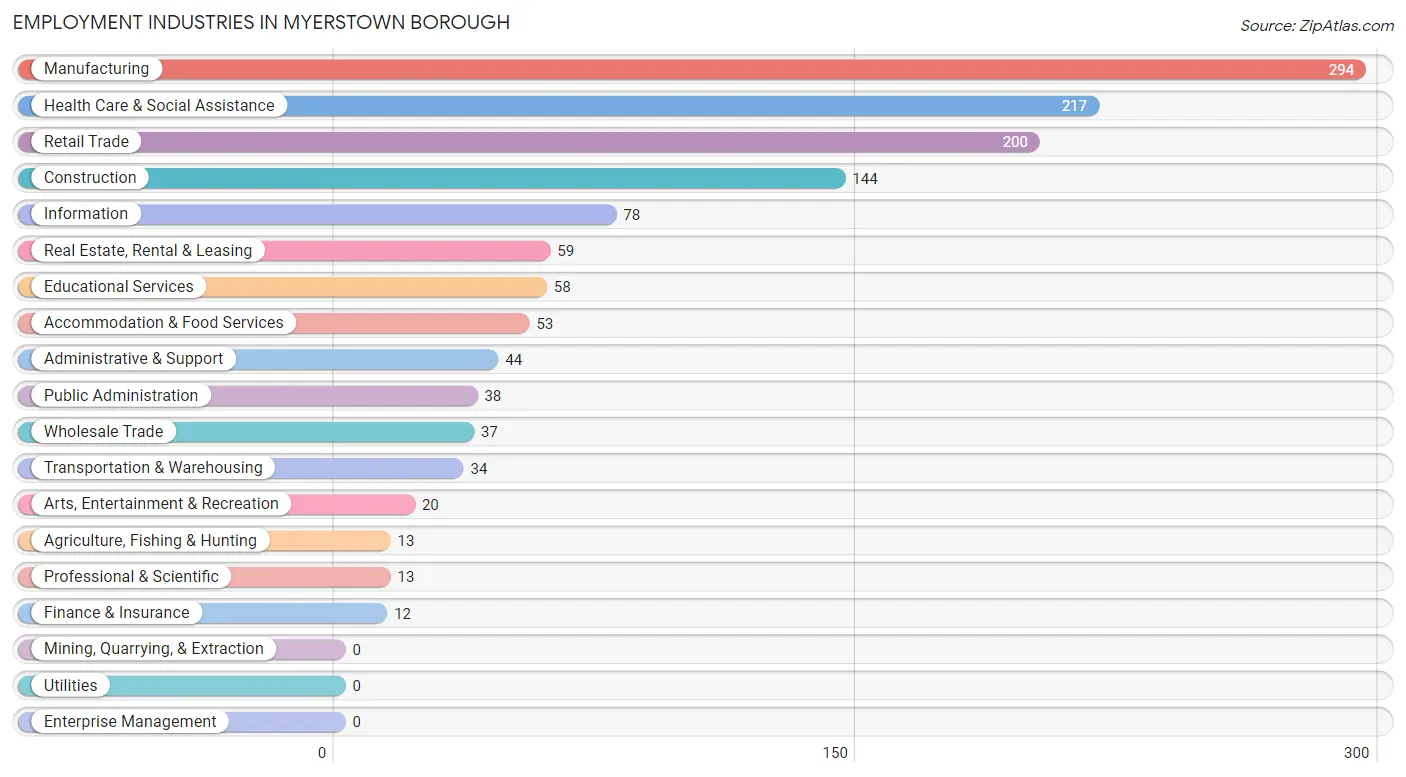
Employment Industries in Myerstown borough
The major employment industries in Myerstown borough include Manufacturing (294 | 21.4%), Health Care & Social Assistance (217 | 15.8%), Retail Trade (200 | 14.6%), Construction (144 | 10.5%), and Information (78 | 5.7%).
Employment Industries by Sex in Myerstown borough
The Myerstown borough industries that see more men than women are Agriculture, Fishing & Hunting (100.0%), Transportation & Warehousing (100.0%), and Information (100.0%), whereas the industries that tend to have a higher number of women are Finance & Insurance (100.0%), Health Care & Social Assistance (100.0%), and Arts, Entertainment & Recreation (100.0%).
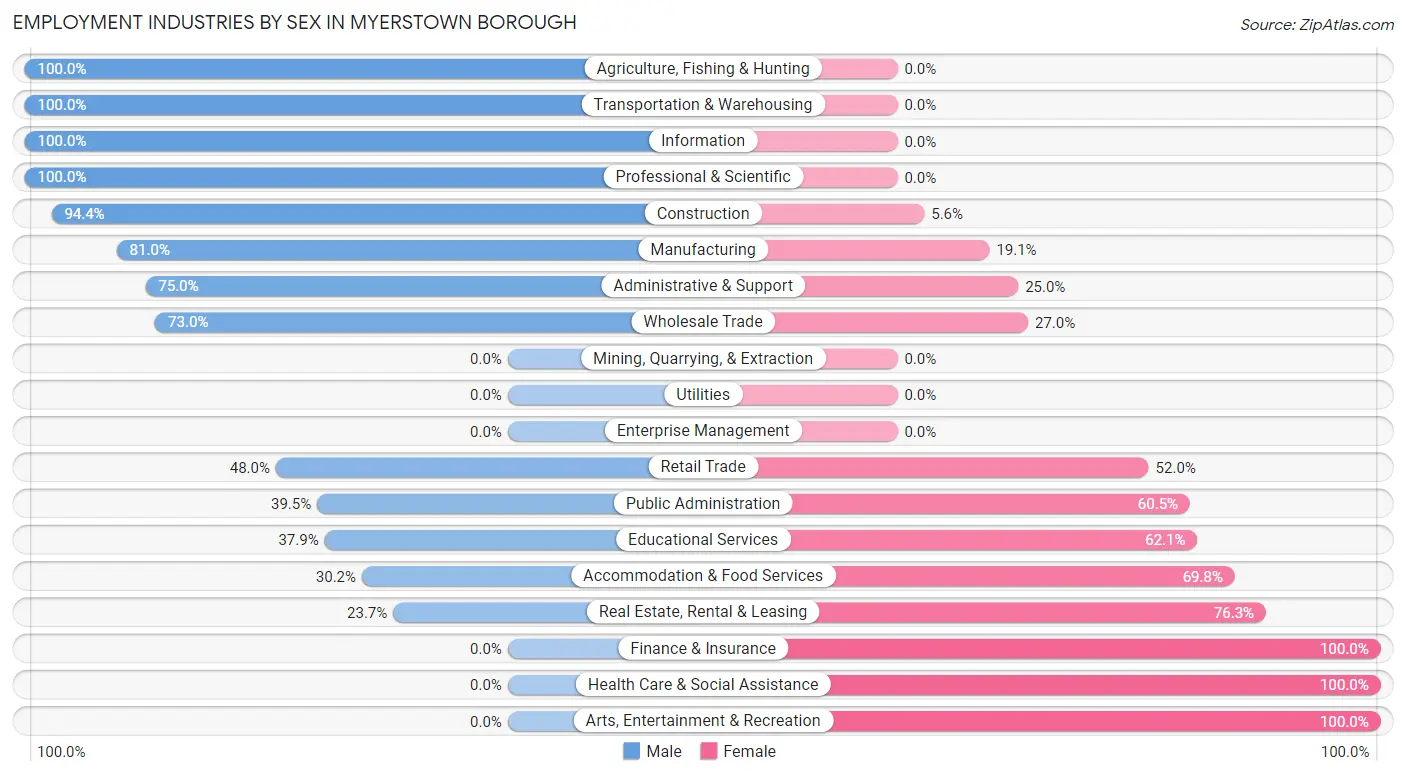
| Industry | Male | Female |
| Agriculture, Fishing & Hunting | 13 (100.0%) | 0 (0.0%) |
| Mining, Quarrying, & Extraction | 0 (0.0%) | 0 (0.0%) |
| Construction | 136 (94.4%) | 8 (5.6%) |
| Manufacturing | 238 (80.9%) | 56 (19.1%) |
| Wholesale Trade | 27 (73.0%) | 10 (27.0%) |
| Retail Trade | 96 (48.0%) | 104 (52.0%) |
| Transportation & Warehousing | 34 (100.0%) | 0 (0.0%) |
| Utilities | 0 (0.0%) | 0 (0.0%) |
| Information | 78 (100.0%) | 0 (0.0%) |
| Finance & Insurance | 0 (0.0%) | 12 (100.0%) |
| Real Estate, Rental & Leasing | 14 (23.7%) | 45 (76.3%) |
| Professional & Scientific | 13 (100.0%) | 0 (0.0%) |
| Enterprise Management | 0 (0.0%) | 0 (0.0%) |
| Administrative & Support | 33 (75.0%) | 11 (25.0%) |
| Educational Services | 22 (37.9%) | 36 (62.1%) |
| Health Care & Social Assistance | 0 (0.0%) | 217 (100.0%) |
| Arts, Entertainment & Recreation | 0 (0.0%) | 20 (100.0%) |
| Accommodation & Food Services | 16 (30.2%) | 37 (69.8%) |
| Public Administration | 15 (39.5%) | 23 (60.5%) |
| Total | 756 (55.1%) | 617 (44.9%) |
Education in Myerstown borough
School Enrollment in Myerstown borough
The most common levels of schooling among the 655 students in Myerstown borough are elementary school (264 | 40.3%), high school (154 | 23.5%), and middle school (152 | 23.2%).
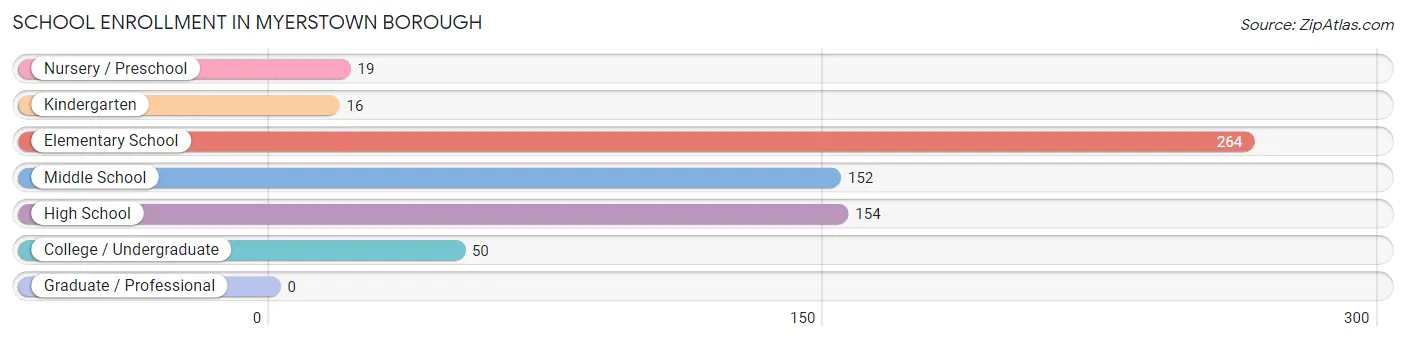
| School Level | # Students | % Students |
| Nursery / Preschool | 19 | 2.9% |
| Kindergarten | 16 | 2.4% |
| Elementary School | 264 | 40.3% |
| Middle School | 152 | 23.2% |
| High School | 154 | 23.5% |
| College / Undergraduate | 50 | 7.6% |
| Graduate / Professional | 0 | 0.0% |
| Total | 655 | 100.0% |
School Enrollment by Age by Funding Source in Myerstown borough
Out of a total of 655 students who are enrolled in schools in Myerstown borough, 133 (20.3%) attend a private institution, while the remaining 522 (79.7%) are enrolled in public schools. The age group of 35 years and over has the highest likelihood of being enrolled in private schools, with 13 (100.0% in the age bracket) enrolled. Conversely, the age group of 3 to 4 year olds has the lowest likelihood of being enrolled in a private school, with 19 (100.0% in the age bracket) attending a public institution.
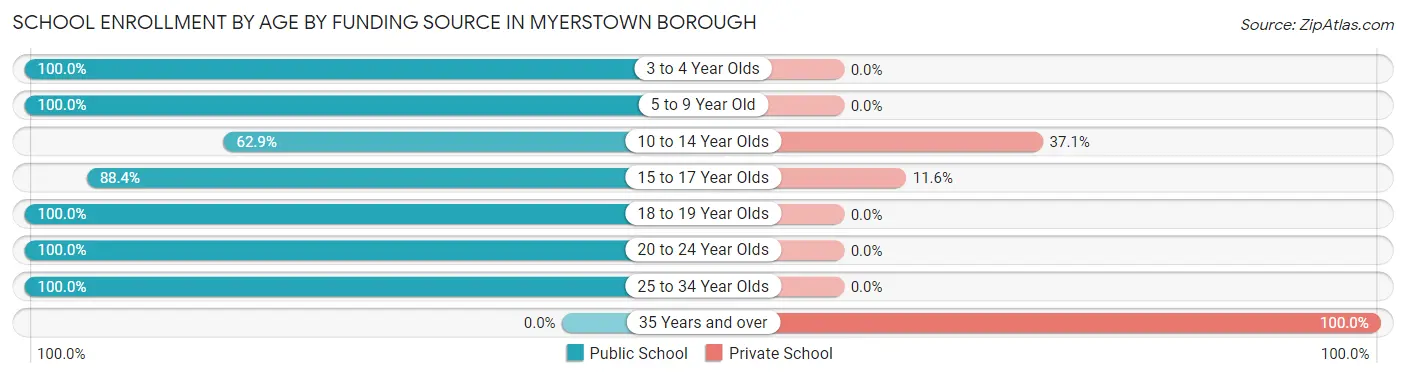
| Age Bracket | Public School | Private School |
| 3 to 4 Year Olds | 19 (100.0%) | 0 (0.0%) |
| 5 to 9 Year Old | 161 (100.0%) | 0 (0.0%) |
| 10 to 14 Year Olds | 180 (62.9%) | 106 (37.1%) |
| 15 to 17 Year Olds | 107 (88.4%) | 14 (11.6%) |
| 18 to 19 Year Olds | 37 (100.0%) | 0 (0.0%) |
| 20 to 24 Year Olds | 7 (100.0%) | 0 (0.0%) |
| 25 to 34 Year Olds | 11 (100.0%) | 0 (0.0%) |
| 35 Years and over | 0 (0.0%) | 13 (100.0%) |
| Total | 522 (79.7%) | 133 (20.3%) |
Educational Attainment by Field of Study in Myerstown borough
Business (48 | 20.6%), science & technology (32 | 13.7%), education (32 | 13.7%), visual & performing arts (20 | 8.6%), and physical & health sciences (17 | 7.3%) are the most common fields of study among 233 individuals in Myerstown borough who have obtained a bachelor's degree or higher.
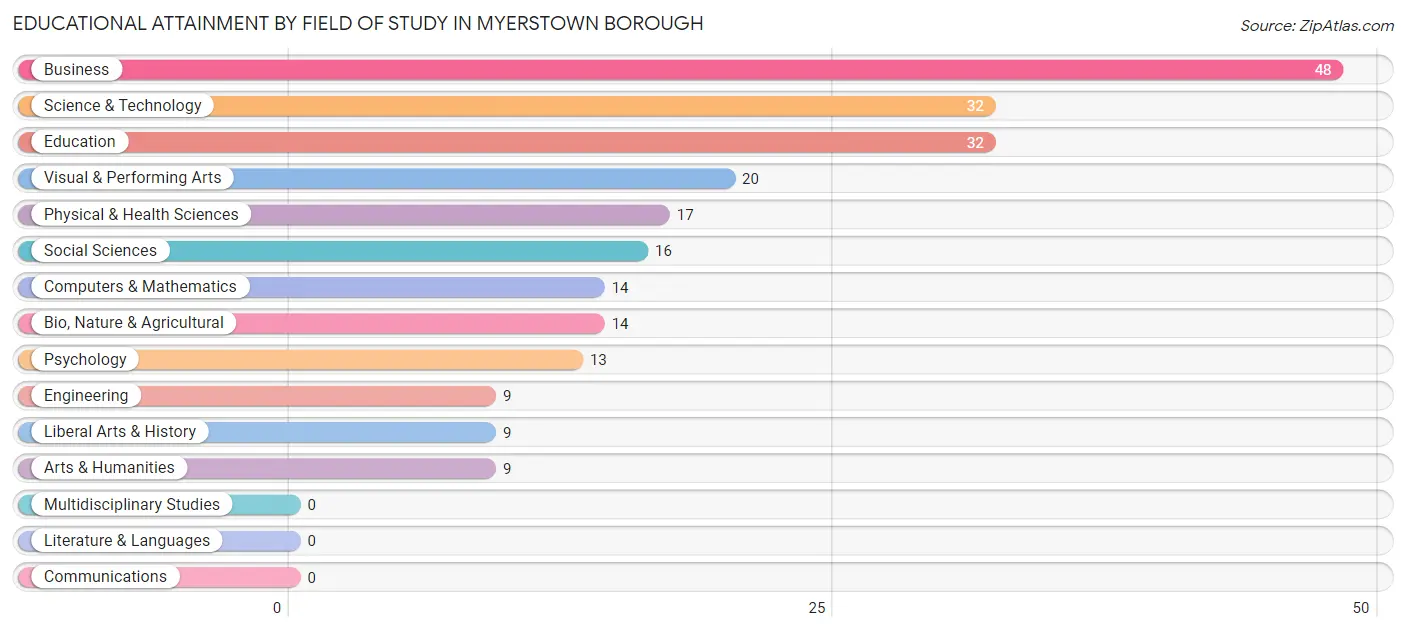
| Field of Study | # Graduates | % Graduates |
| Computers & Mathematics | 14 | 6.0% |
| Bio, Nature & Agricultural | 14 | 6.0% |
| Physical & Health Sciences | 17 | 7.3% |
| Psychology | 13 | 5.6% |
| Social Sciences | 16 | 6.9% |
| Engineering | 9 | 3.9% |
| Multidisciplinary Studies | 0 | 0.0% |
| Science & Technology | 32 | 13.7% |
| Business | 48 | 20.6% |
| Education | 32 | 13.7% |
| Literature & Languages | 0 | 0.0% |
| Liberal Arts & History | 9 | 3.9% |
| Visual & Performing Arts | 20 | 8.6% |
| Communications | 0 | 0.0% |
| Arts & Humanities | 9 | 3.9% |
| Total | 233 | 100.0% |
Transportation & Commute in Myerstown borough
Vehicle Availability by Sex in Myerstown borough
The most prevalent vehicle ownership categories in Myerstown borough are males with 2 vehicles (488, accounting for 64.5%) and females with 2 vehicles (398, making up 79.1%).
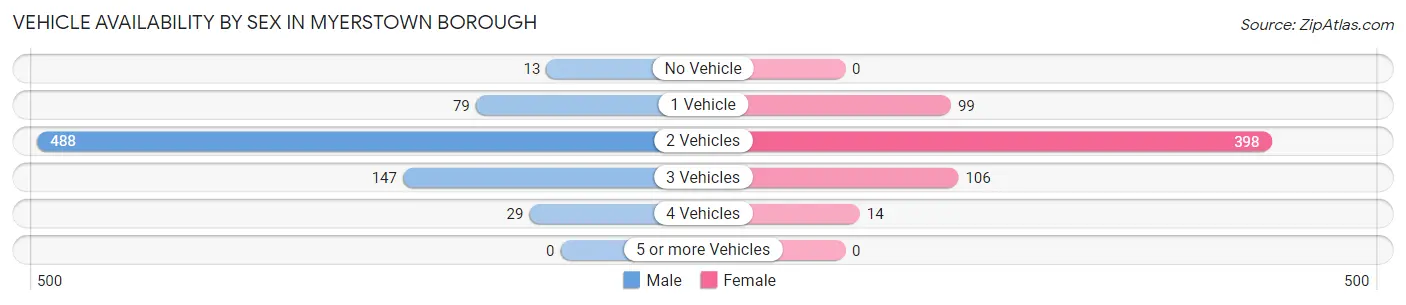
| Vehicles Available | Male | Female |
| No Vehicle | 13 (1.7%) | 0 (0.0%) |
| 1 Vehicle | 79 (10.4%) | 99 (16.1%) |
| 2 Vehicles | 488 (64.5%) | 398 (64.5%) |
| 3 Vehicles | 147 (19.4%) | 106 (17.2%) |
| 4 Vehicles | 29 (3.8%) | 14 (2.3%) |
| 5 or more Vehicles | 0 (0.0%) | 0 (0.0%) |
| Total | 756 (100.0%) | 617 (100.0%) |
Commute Time in Myerstown borough
The most frequently occuring commute durations in Myerstown borough are 5 to 9 minutes (239 commuters, 19.4%), less than 5 minutes (219 commuters, 17.8%), and 15 to 19 minutes (207 commuters, 16.8%).
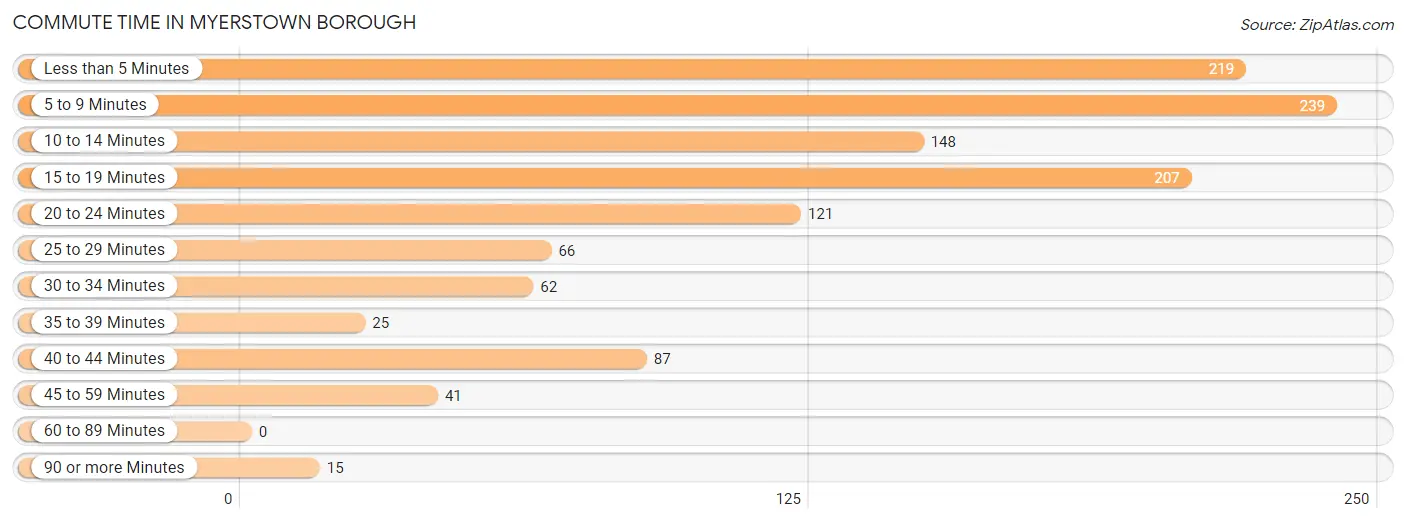
| Commute Time | # Commuters | % Commuters |
| Less than 5 Minutes | 219 | 17.8% |
| 5 to 9 Minutes | 239 | 19.4% |
| 10 to 14 Minutes | 148 | 12.0% |
| 15 to 19 Minutes | 207 | 16.8% |
| 20 to 24 Minutes | 121 | 9.8% |
| 25 to 29 Minutes | 66 | 5.4% |
| 30 to 34 Minutes | 62 | 5.0% |
| 35 to 39 Minutes | 25 | 2.0% |
| 40 to 44 Minutes | 87 | 7.1% |
| 45 to 59 Minutes | 41 | 3.3% |
| 60 to 89 Minutes | 0 | 0.0% |
| 90 or more Minutes | 15 | 1.2% |
Commute Time by Sex in Myerstown borough
The most common commute times in Myerstown borough are 5 to 9 minutes (173 commuters, 26.8%) for males and less than 5 minutes (152 commuters, 26.0%) for females.
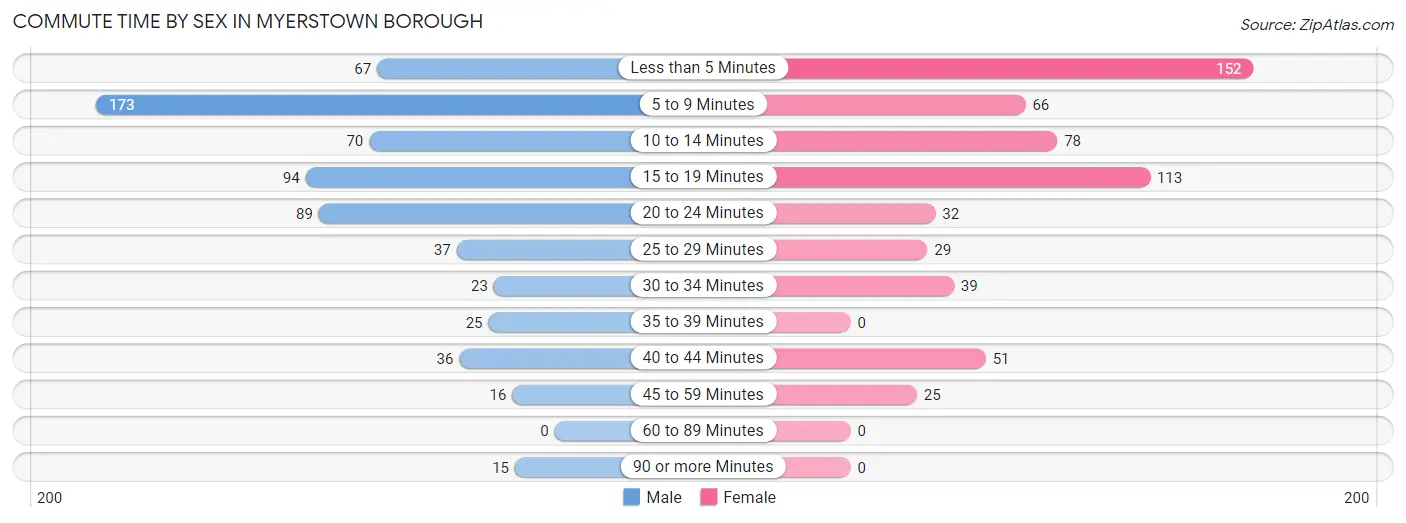
| Commute Time | Male | Female |
| Less than 5 Minutes | 67 (10.4%) | 152 (26.0%) |
| 5 to 9 Minutes | 173 (26.8%) | 66 (11.3%) |
| 10 to 14 Minutes | 70 (10.8%) | 78 (13.3%) |
| 15 to 19 Minutes | 94 (14.6%) | 113 (19.3%) |
| 20 to 24 Minutes | 89 (13.8%) | 32 (5.5%) |
| 25 to 29 Minutes | 37 (5.7%) | 29 (5.0%) |
| 30 to 34 Minutes | 23 (3.6%) | 39 (6.7%) |
| 35 to 39 Minutes | 25 (3.9%) | 0 (0.0%) |
| 40 to 44 Minutes | 36 (5.6%) | 51 (8.7%) |
| 45 to 59 Minutes | 16 (2.5%) | 25 (4.3%) |
| 60 to 89 Minutes | 0 (0.0%) | 0 (0.0%) |
| 90 or more Minutes | 15 (2.3%) | 0 (0.0%) |
Time of Departure to Work by Sex in Myerstown borough
The most frequent times of departure to work in Myerstown borough are 5:30 AM to 5:59 AM (104, 16.1%) for males and 7:30 AM to 7:59 AM (132, 22.6%) for females.
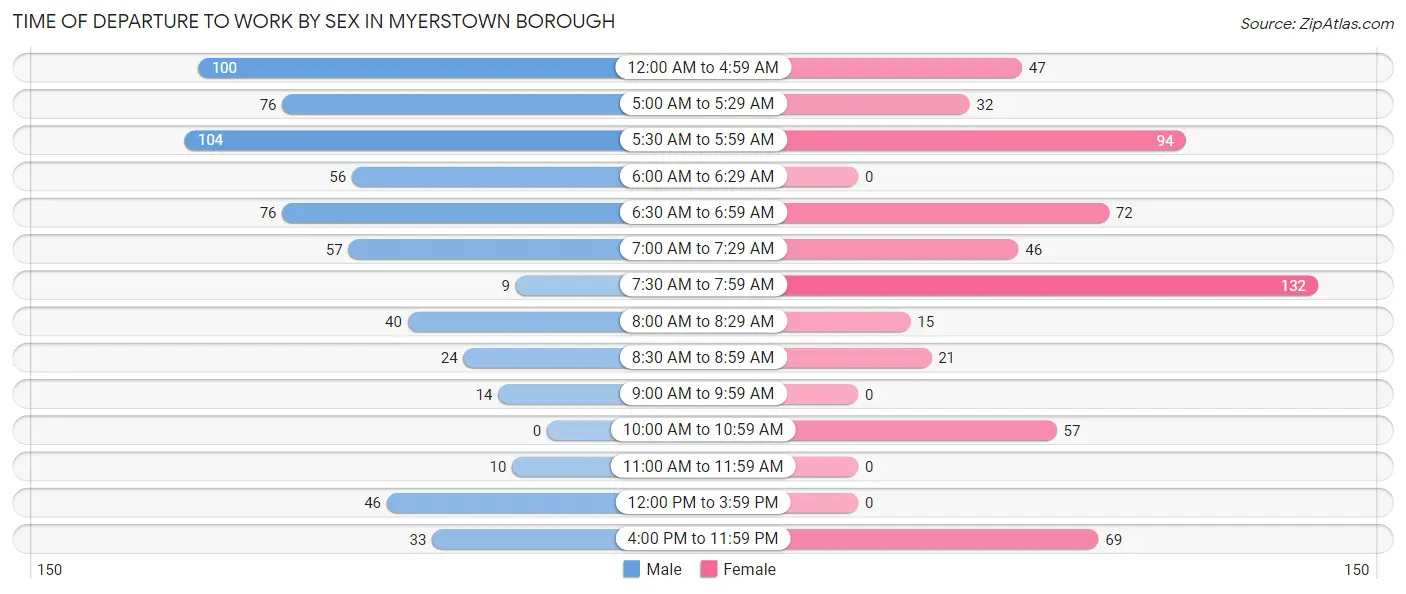
| Time of Departure | Male | Female |
| 12:00 AM to 4:59 AM | 100 (15.5%) | 47 (8.0%) |
| 5:00 AM to 5:29 AM | 76 (11.8%) | 32 (5.5%) |
| 5:30 AM to 5:59 AM | 104 (16.1%) | 94 (16.1%) |
| 6:00 AM to 6:29 AM | 56 (8.7%) | 0 (0.0%) |
| 6:30 AM to 6:59 AM | 76 (11.8%) | 72 (12.3%) |
| 7:00 AM to 7:29 AM | 57 (8.8%) | 46 (7.9%) |
| 7:30 AM to 7:59 AM | 9 (1.4%) | 132 (22.6%) |
| 8:00 AM to 8:29 AM | 40 (6.2%) | 15 (2.6%) |
| 8:30 AM to 8:59 AM | 24 (3.7%) | 21 (3.6%) |
| 9:00 AM to 9:59 AM | 14 (2.2%) | 0 (0.0%) |
| 10:00 AM to 10:59 AM | 0 (0.0%) | 57 (9.7%) |
| 11:00 AM to 11:59 AM | 10 (1.5%) | 0 (0.0%) |
| 12:00 PM to 3:59 PM | 46 (7.1%) | 0 (0.0%) |
| 4:00 PM to 11:59 PM | 33 (5.1%) | 69 (11.8%) |
| Total | 645 (100.0%) | 585 (100.0%) |
Housing Occupancy in Myerstown borough
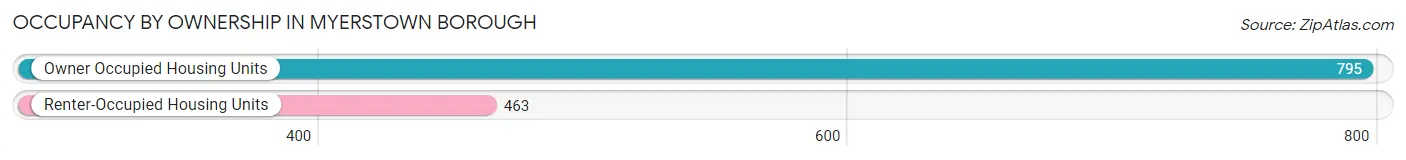
Occupancy by Ownership in Myerstown borough
Of the total 1,258 dwellings in Myerstown borough, owner-occupied units account for 795 (63.2%), while renter-occupied units make up 463 (36.8%).
| Occupancy | # Housing Units | % Housing Units |
| Owner Occupied Housing Units | 795 | 63.2% |
| Renter-Occupied Housing Units | 463 | 36.8% |
| Total Occupied Housing Units | 1,258 | 100.0% |
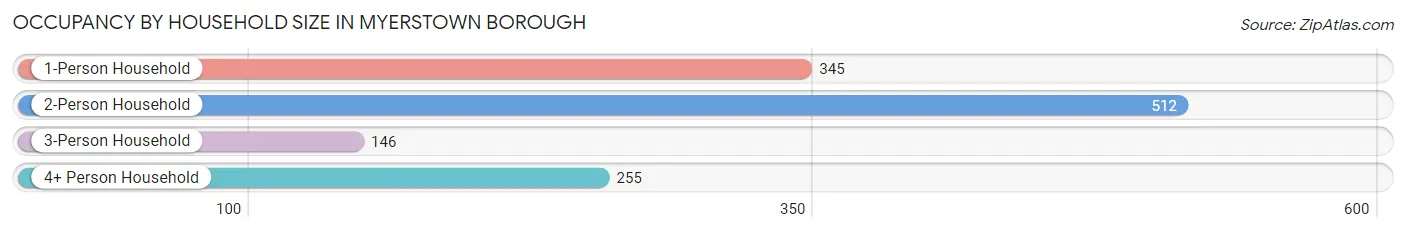
Occupancy by Household Size in Myerstown borough
| Household Size | # Housing Units | % Housing Units |
| 1-Person Household | 345 | 27.4% |
| 2-Person Household | 512 | 40.7% |
| 3-Person Household | 146 | 11.6% |
| 4+ Person Household | 255 | 20.3% |
| Total Housing Units | 1,258 | 100.0% |
Occupancy by Ownership by Household Size in Myerstown borough
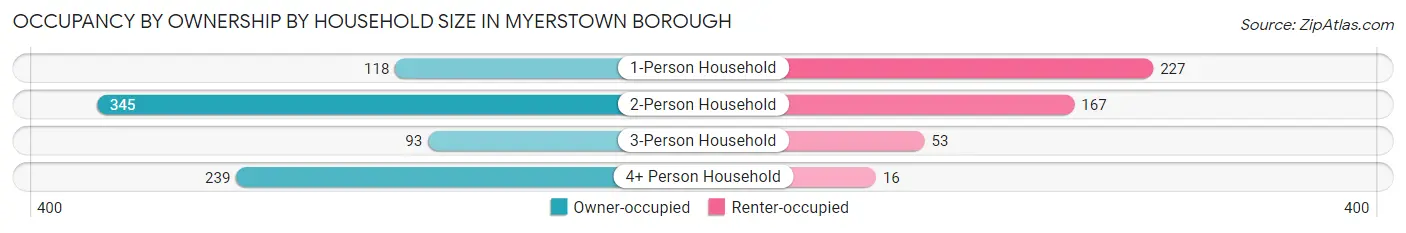
| Household Size | Owner-occupied | Renter-occupied |
| 1-Person Household | 118 (34.2%) | 227 (65.8%) |
| 2-Person Household | 345 (67.4%) | 167 (32.6%) |
| 3-Person Household | 93 (63.7%) | 53 (36.3%) |
| 4+ Person Household | 239 (93.7%) | 16 (6.3%) |
| Total Housing Units | 795 (63.2%) | 463 (36.8%) |
Occupancy by Educational Attainment in Myerstown borough
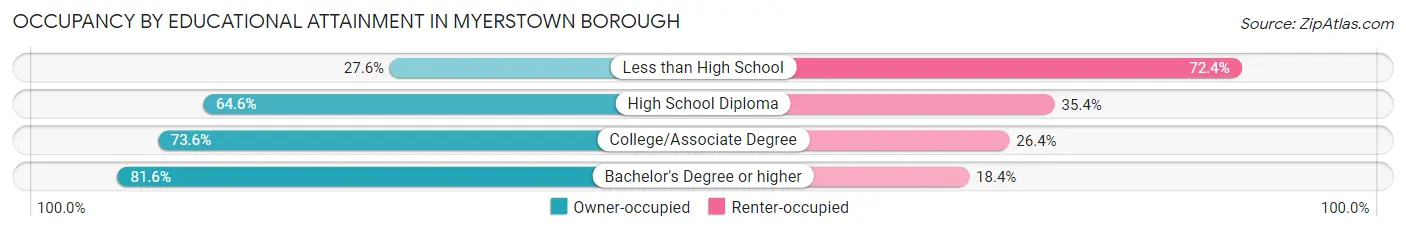
| Household Size | Owner-occupied | Renter-occupied |
| Less than High School | 51 (27.6%) | 134 (72.4%) |
| High School Diploma | 409 (64.6%) | 224 (35.4%) |
| College/Associate Degree | 220 (73.6%) | 79 (26.4%) |
| Bachelor's Degree or higher | 115 (81.6%) | 26 (18.4%) |
Occupancy by Age of Householder in Myerstown borough
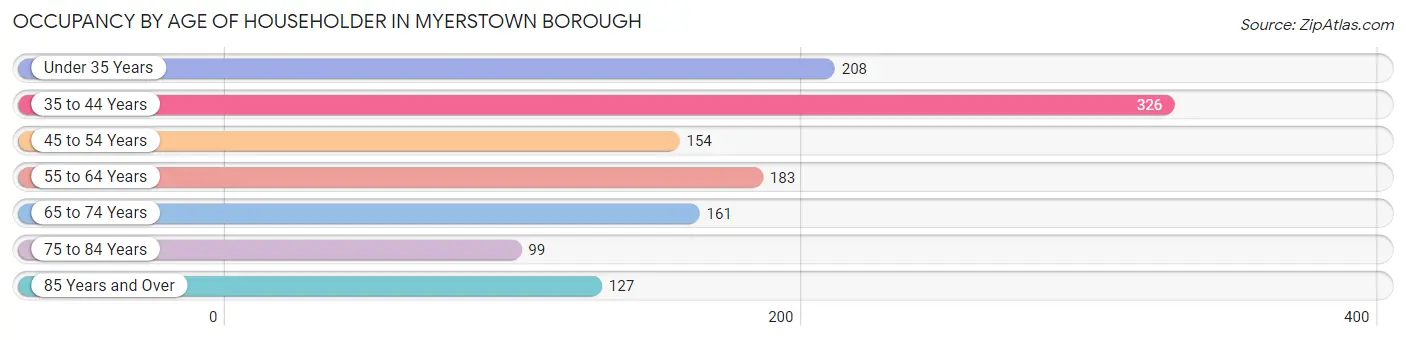
| Age Bracket | # Households | % Households |
| Under 35 Years | 208 | 16.5% |
| 35 to 44 Years | 326 | 25.9% |
| 45 to 54 Years | 154 | 12.2% |
| 55 to 64 Years | 183 | 14.5% |
| 65 to 74 Years | 161 | 12.8% |
| 75 to 84 Years | 99 | 7.9% |
| 85 Years and Over | 127 | 10.1% |
| Total | 1,258 | 100.0% |
Housing Finances in Myerstown borough
Median Income by Occupancy in Myerstown borough
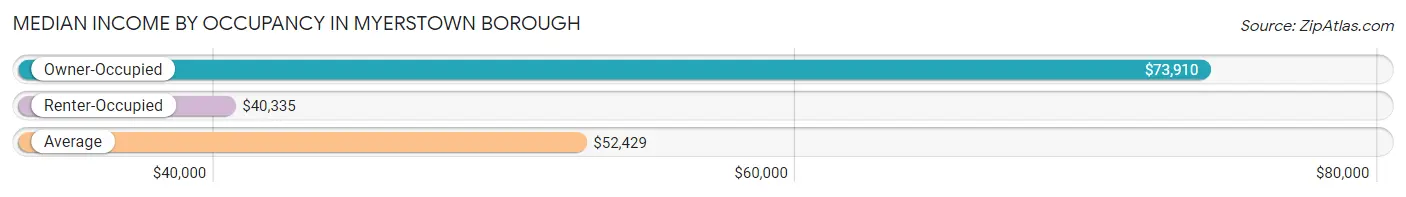
| Occupancy Type | # Households | Median Income |
| Owner-Occupied | 795 (63.2%) | $73,910 |
| Renter-Occupied | 463 (36.8%) | $40,335 |
| Average | 1,258 (100.0%) | $52,429 |
Occupancy by Householder Income Bracket in Myerstown borough
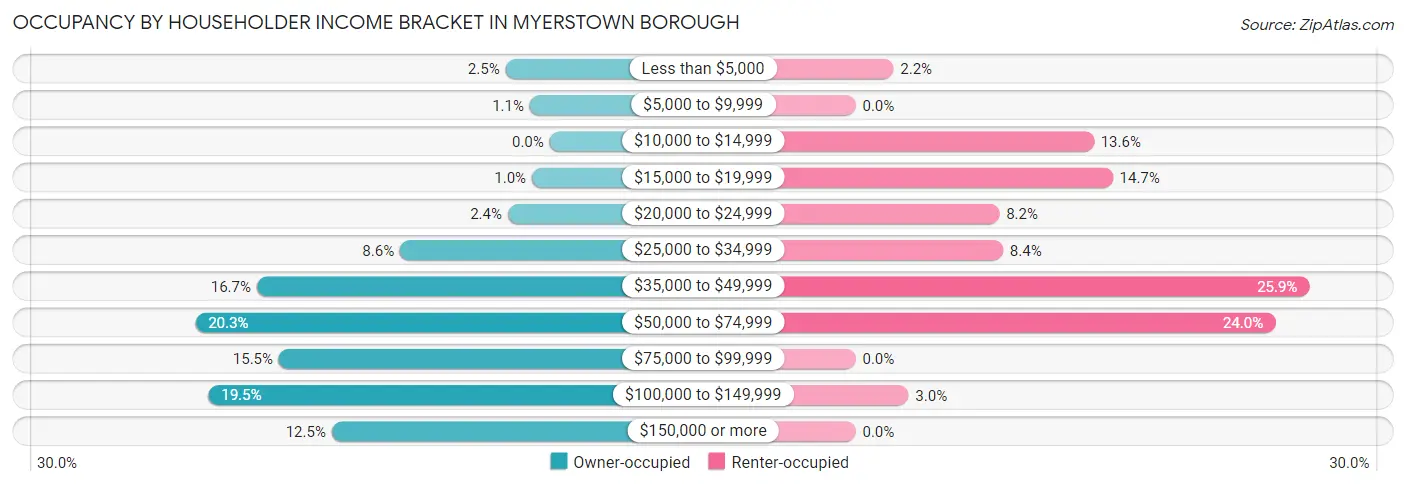
| Income Bracket | Owner-occupied | Renter-occupied |
| Less than $5,000 | 20 (2.5%) | 10 (2.2%) |
| $5,000 to $9,999 | 9 (1.1%) | 0 (0.0%) |
| $10,000 to $14,999 | 0 (0.0%) | 63 (13.6%) |
| $15,000 to $19,999 | 8 (1.0%) | 68 (14.7%) |
| $20,000 to $24,999 | 19 (2.4%) | 38 (8.2%) |
| $25,000 to $34,999 | 68 (8.6%) | 39 (8.4%) |
| $35,000 to $49,999 | 133 (16.7%) | 120 (25.9%) |
| $50,000 to $74,999 | 161 (20.3%) | 111 (24.0%) |
| $75,000 to $99,999 | 123 (15.5%) | 0 (0.0%) |
| $100,000 to $149,999 | 155 (19.5%) | 14 (3.0%) |
| $150,000 or more | 99 (12.4%) | 0 (0.0%) |
| Total | 795 (100.0%) | 463 (100.0%) |
Monthly Housing Cost Tiers in Myerstown borough
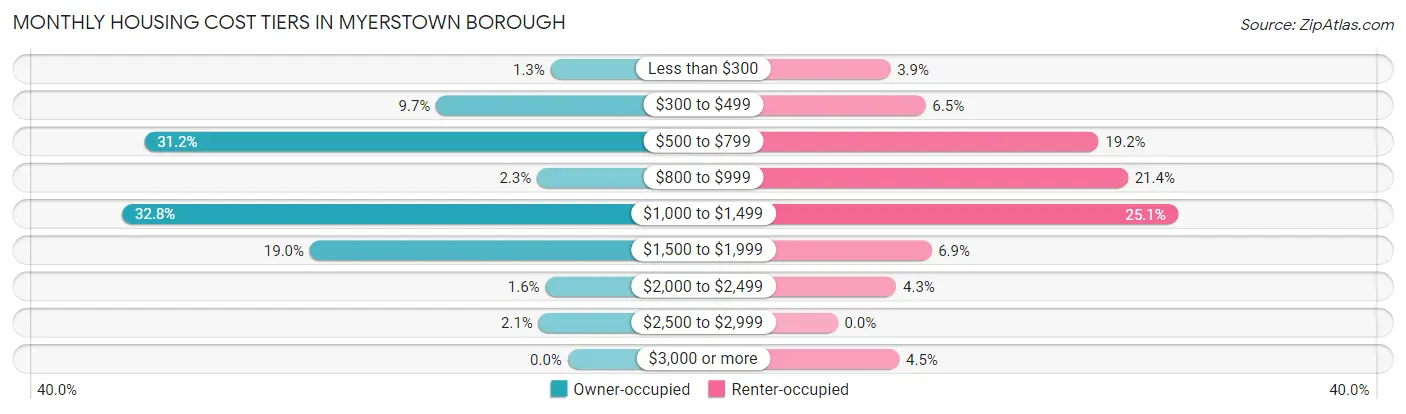
| Monthly Cost | Owner-occupied | Renter-occupied |
| Less than $300 | 10 (1.3%) | 18 (3.9%) |
| $300 to $499 | 77 (9.7%) | 30 (6.5%) |
| $500 to $799 | 248 (31.2%) | 89 (19.2%) |
| $800 to $999 | 18 (2.3%) | 99 (21.4%) |
| $1,000 to $1,499 | 261 (32.8%) | 116 (25.1%) |
| $1,500 to $1,999 | 151 (19.0%) | 32 (6.9%) |
| $2,000 to $2,499 | 13 (1.6%) | 20 (4.3%) |
| $2,500 to $2,999 | 17 (2.1%) | 0 (0.0%) |
| $3,000 or more | 0 (0.0%) | 21 (4.5%) |
| Total | 795 (100.0%) | 463 (100.0%) |
Physical Housing Characteristics in Myerstown borough
Housing Structures in Myerstown borough
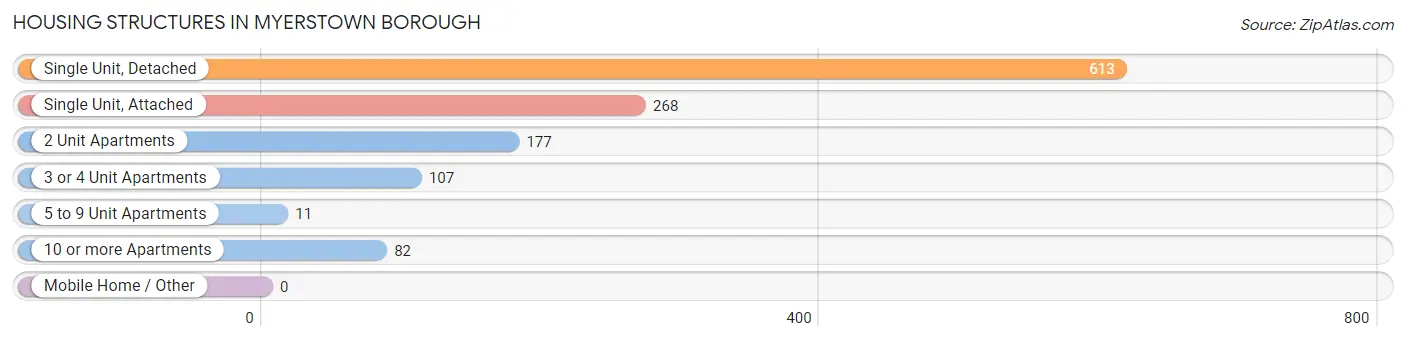
| Structure Type | # Housing Units | % Housing Units |
| Single Unit, Detached | 613 | 48.7% |
| Single Unit, Attached | 268 | 21.3% |
| 2 Unit Apartments | 177 | 14.1% |
| 3 or 4 Unit Apartments | 107 | 8.5% |
| 5 to 9 Unit Apartments | 11 | 0.9% |
| 10 or more Apartments | 82 | 6.5% |
| Mobile Home / Other | 0 | 0.0% |
| Total | 1,258 | 100.0% |
Housing Structures by Occupancy in Myerstown borough
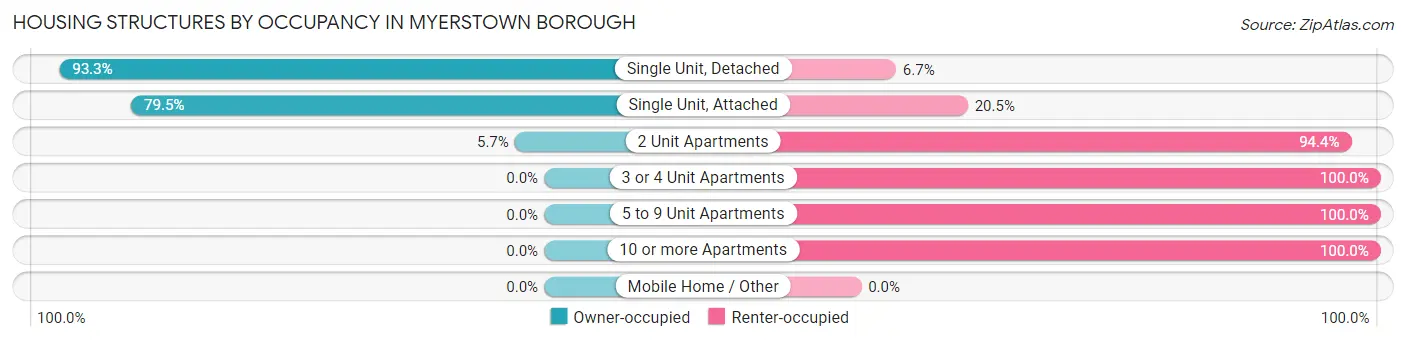
| Structure Type | Owner-occupied | Renter-occupied |
| Single Unit, Detached | 572 (93.3%) | 41 (6.7%) |
| Single Unit, Attached | 213 (79.5%) | 55 (20.5%) |
| 2 Unit Apartments | 10 (5.7%) | 167 (94.4%) |
| 3 or 4 Unit Apartments | 0 (0.0%) | 107 (100.0%) |
| 5 to 9 Unit Apartments | 0 (0.0%) | 11 (100.0%) |
| 10 or more Apartments | 0 (0.0%) | 82 (100.0%) |
| Mobile Home / Other | 0 (0.0%) | 0 (0.0%) |
| Total | 795 (63.2%) | 463 (36.8%) |
Housing Structures by Number of Rooms in Myerstown borough
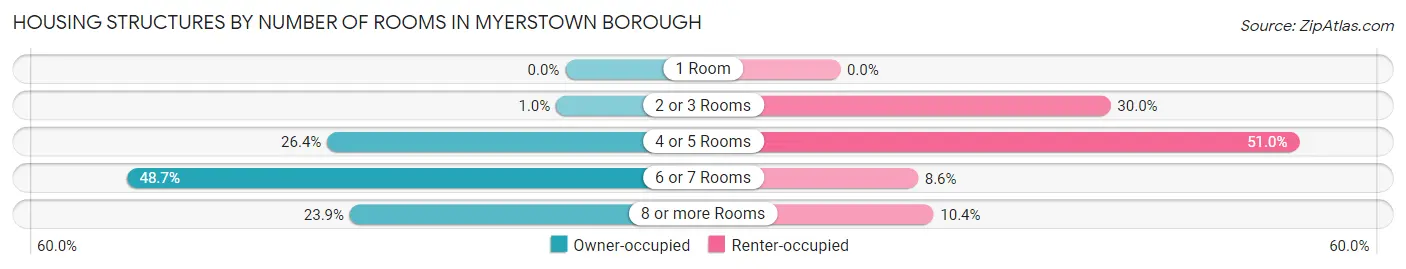
| Number of Rooms | Owner-occupied | Renter-occupied |
| 1 Room | 0 (0.0%) | 0 (0.0%) |
| 2 or 3 Rooms | 8 (1.0%) | 139 (30.0%) |
| 4 or 5 Rooms | 210 (26.4%) | 236 (51.0%) |
| 6 or 7 Rooms | 387 (48.7%) | 40 (8.6%) |
| 8 or more Rooms | 190 (23.9%) | 48 (10.4%) |
| Total | 795 (100.0%) | 463 (100.0%) |
Housing Structure by Heating Type in Myerstown borough
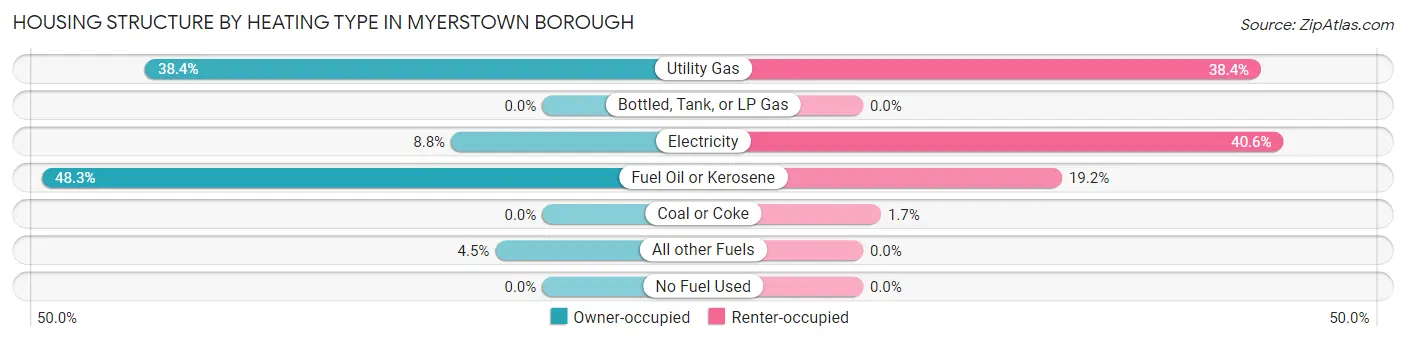
| Heating Type | Owner-occupied | Renter-occupied |
| Utility Gas | 305 (38.4%) | 178 (38.4%) |
| Bottled, Tank, or LP Gas | 0 (0.0%) | 0 (0.0%) |
| Electricity | 70 (8.8%) | 188 (40.6%) |
| Fuel Oil or Kerosene | 384 (48.3%) | 89 (19.2%) |
| Coal or Coke | 0 (0.0%) | 8 (1.7%) |
| All other Fuels | 36 (4.5%) | 0 (0.0%) |
| No Fuel Used | 0 (0.0%) | 0 (0.0%) |
| Total | 795 (100.0%) | 463 (100.0%) |
Household Vehicle Usage in Myerstown borough
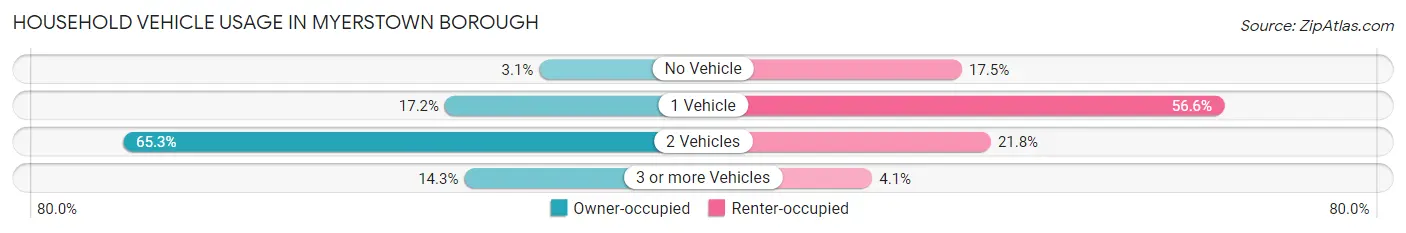
| Vehicles per Household | Owner-occupied | Renter-occupied |
| No Vehicle | 25 (3.1%) | 81 (17.5%) |
| 1 Vehicle | 137 (17.2%) | 262 (56.6%) |
| 2 Vehicles | 519 (65.3%) | 101 (21.8%) |
| 3 or more Vehicles | 114 (14.3%) | 19 (4.1%) |
| Total | 795 (100.0%) | 463 (100.0%) |
Real Estate & Mortgages in Myerstown borough
Real Estate and Mortgage Overview in Myerstown borough
| Characteristic | Without Mortgage | With Mortgage |
| Housing Units | 336 | 459 |
| Median Property Value | $162,000 | $177,700 |
| Median Household Income | $56,389 | $55 |
| Monthly Housing Costs | $610 | $0 |
| Real Estate Taxes | $2,771 | $0 |
Property Value by Mortgage Status in Myerstown borough
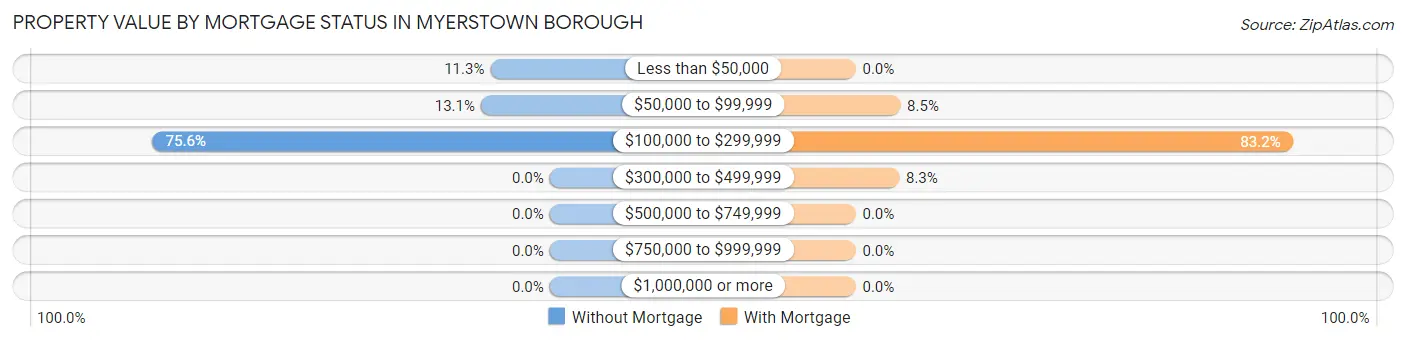
| Property Value | Without Mortgage | With Mortgage |
| Less than $50,000 | 38 (11.3%) | 0 (0.0%) |
| $50,000 to $99,999 | 44 (13.1%) | 39 (8.5%) |
| $100,000 to $299,999 | 254 (75.6%) | 382 (83.2%) |
| $300,000 to $499,999 | 0 (0.0%) | 38 (8.3%) |
| $500,000 to $749,999 | 0 (0.0%) | 0 (0.0%) |
| $750,000 to $999,999 | 0 (0.0%) | 0 (0.0%) |
| $1,000,000 or more | 0 (0.0%) | 0 (0.0%) |
| Total | 336 (100.0%) | 459 (100.0%) |
Household Income by Mortgage Status in Myerstown borough
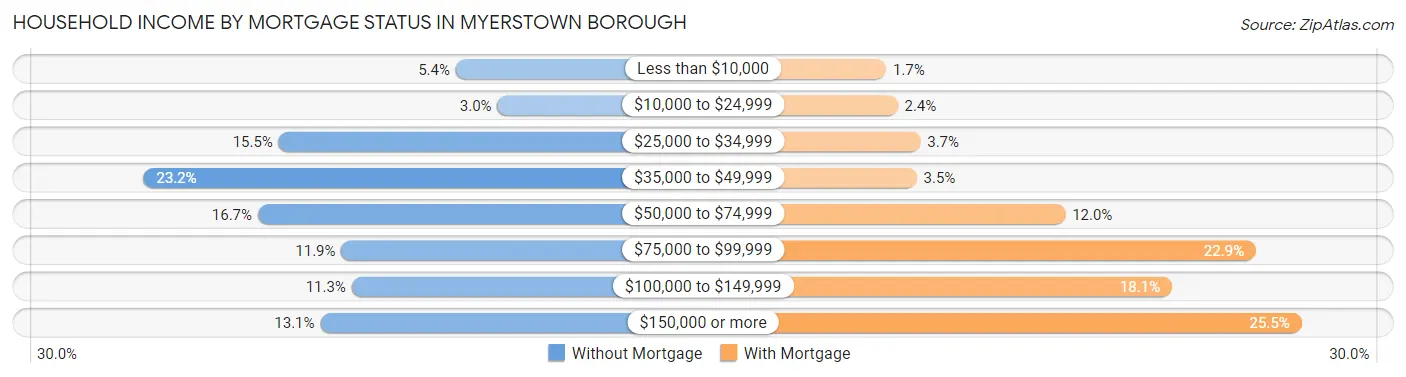
| Household Income | Without Mortgage | With Mortgage |
| Less than $10,000 | 18 (5.4%) | 8 (1.7%) |
| $10,000 to $24,999 | 10 (3.0%) | 11 (2.4%) |
| $25,000 to $34,999 | 52 (15.5%) | 17 (3.7%) |
| $35,000 to $49,999 | 78 (23.2%) | 16 (3.5%) |
| $50,000 to $74,999 | 56 (16.7%) | 55 (12.0%) |
| $75,000 to $99,999 | 40 (11.9%) | 105 (22.9%) |
| $100,000 to $149,999 | 38 (11.3%) | 83 (18.1%) |
| $150,000 or more | 44 (13.1%) | 117 (25.5%) |
| Total | 336 (100.0%) | 459 (100.0%) |
Property Value to Household Income Ratio in Myerstown borough
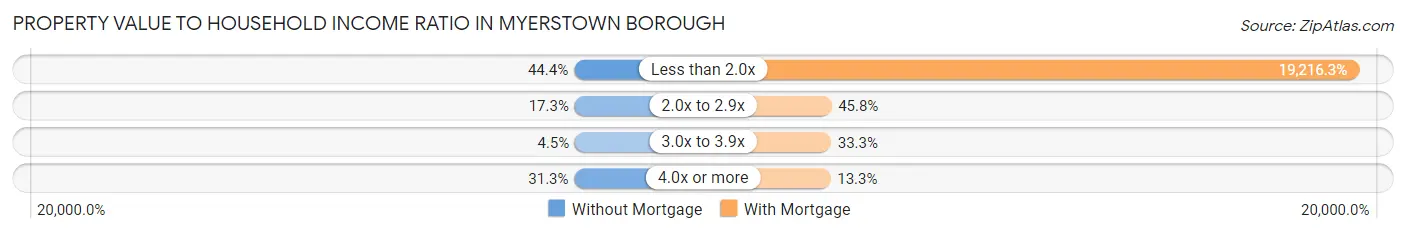
| Value-to-Income Ratio | Without Mortgage | With Mortgage |
| Less than 2.0x | 149 (44.4%) | 88,203 (19,216.3%) |
| 2.0x to 2.9x | 58 (17.3%) | 210 (45.8%) |
| 3.0x to 3.9x | 15 (4.5%) | 153 (33.3%) |
| 4.0x or more | 105 (31.2%) | 61 (13.3%) |
| Total | 336 (100.0%) | 459 (100.0%) |
Real Estate Taxes by Mortgage Status in Myerstown borough
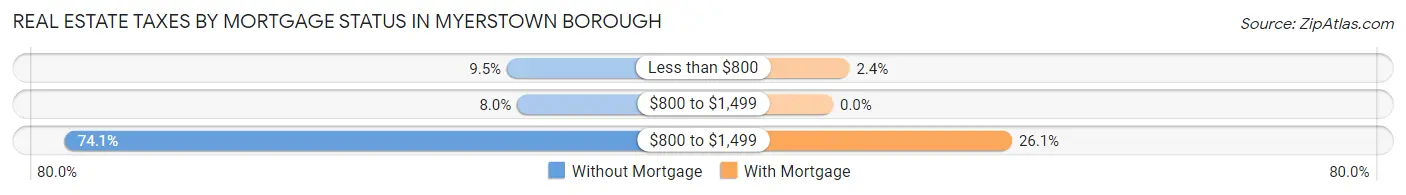
| Property Taxes | Without Mortgage | With Mortgage |
| Less than $800 | 32 (9.5%) | 11 (2.4%) |
| $800 to $1,499 | 27 (8.0%) | 0 (0.0%) |
| $800 to $1,499 | 249 (74.1%) | 120 (26.1%) |
| Total | 336 (100.0%) | 459 (100.0%) |
Health & Disability in Myerstown borough
Health Insurance Coverage by Age in Myerstown borough
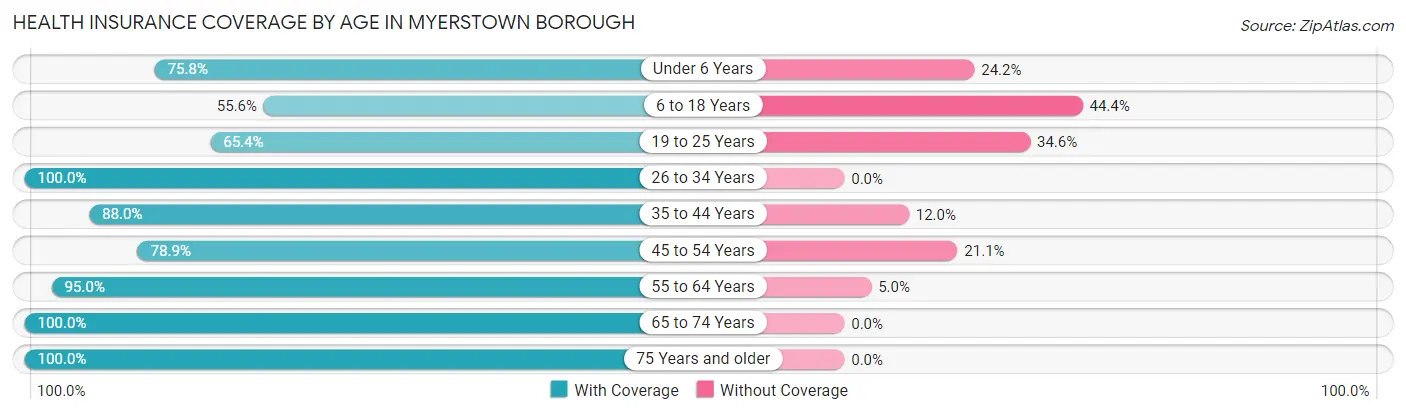
| Age Bracket | With Coverage | Without Coverage |
| Under 6 Years | 75 (75.8%) | 24 (24.2%) |
| 6 to 18 Years | 354 (55.6%) | 283 (44.4%) |
| 19 to 25 Years | 183 (65.4%) | 97 (34.6%) |
| 26 to 34 Years | 171 (100.0%) | 0 (0.0%) |
| 35 to 44 Years | 534 (88.0%) | 73 (12.0%) |
| 45 to 54 Years | 217 (78.9%) | 58 (21.1%) |
| 55 to 64 Years | 284 (95.0%) | 15 (5.0%) |
| 65 to 74 Years | 245 (100.0%) | 0 (0.0%) |
| 75 Years and older | 360 (100.0%) | 0 (0.0%) |
| Total | 2,423 (81.5%) | 550 (18.5%) |
Health Insurance Coverage by Citizenship Status in Myerstown borough
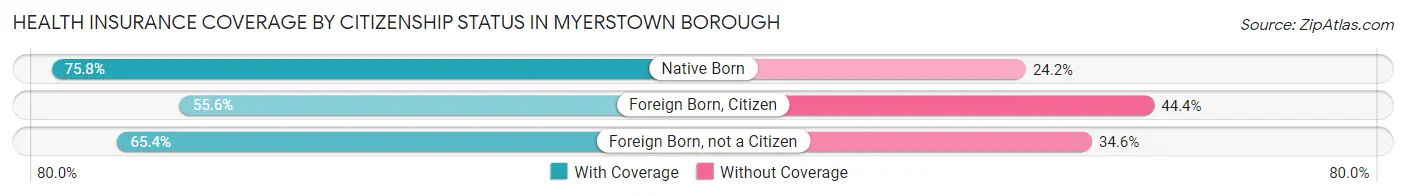
| Citizenship Status | With Coverage | Without Coverage |
| Native Born | 75 (75.8%) | 24 (24.2%) |
| Foreign Born, Citizen | 354 (55.6%) | 283 (44.4%) |
| Foreign Born, not a Citizen | 183 (65.4%) | 97 (34.6%) |
Health Insurance Coverage by Household Income in Myerstown borough
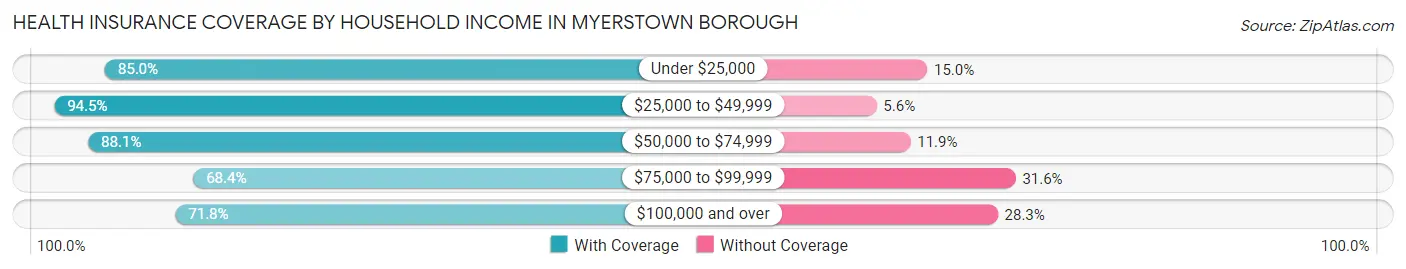
| Household Income | With Coverage | Without Coverage |
| Under $25,000 | 305 (85.0%) | 54 (15.0%) |
| $25,000 to $49,999 | 681 (94.5%) | 40 (5.6%) |
| $50,000 to $74,999 | 504 (88.1%) | 68 (11.9%) |
| $75,000 to $99,999 | 303 (68.4%) | 140 (31.6%) |
| $100,000 and over | 630 (71.8%) | 248 (28.2%) |
Public vs Private Health Insurance Coverage by Age in Myerstown borough
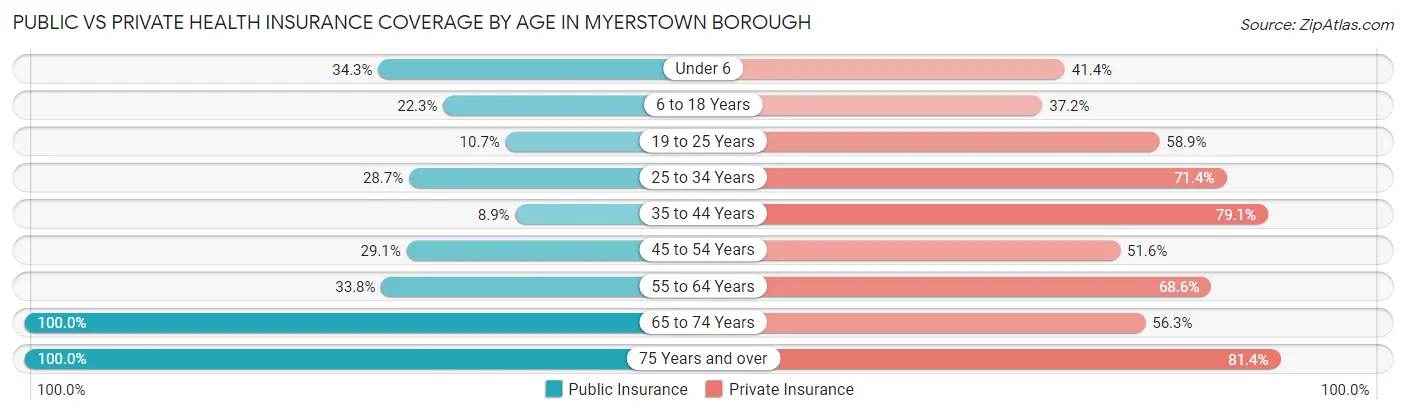
| Age Bracket | Public Insurance | Private Insurance |
| Under 6 | 34 (34.3%) | 41 (41.4%) |
| 6 to 18 Years | 142 (22.3%) | 237 (37.2%) |
| 19 to 25 Years | 30 (10.7%) | 165 (58.9%) |
| 25 to 34 Years | 49 (28.6%) | 122 (71.4%) |
| 35 to 44 Years | 54 (8.9%) | 480 (79.1%) |
| 45 to 54 Years | 80 (29.1%) | 142 (51.6%) |
| 55 to 64 Years | 101 (33.8%) | 205 (68.6%) |
| 65 to 74 Years | 245 (100.0%) | 138 (56.3%) |
| 75 Years and over | 360 (100.0%) | 293 (81.4%) |
| Total | 1,095 (36.8%) | 1,823 (61.3%) |
Disability Status by Sex by Age in Myerstown borough
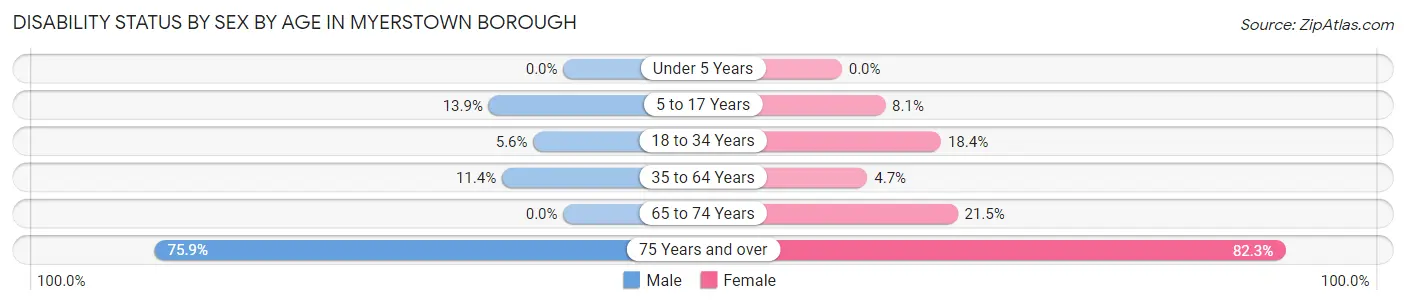
| Age Bracket | Male | Female |
| Under 5 Years | 0 (0.0%) | 0 (0.0%) |
| 5 to 17 Years | 59 (13.9%) | 14 (8.1%) |
| 18 to 34 Years | 16 (5.6%) | 37 (18.4%) |
| 35 to 64 Years | 72 (11.4%) | 26 (4.7%) |
| 65 to 74 Years | 0 (0.0%) | 29 (21.5%) |
| 75 Years and over | 132 (75.9%) | 153 (82.3%) |
Disability Class by Sex by Age in Myerstown borough
Disability Class: Hearing Difficulty
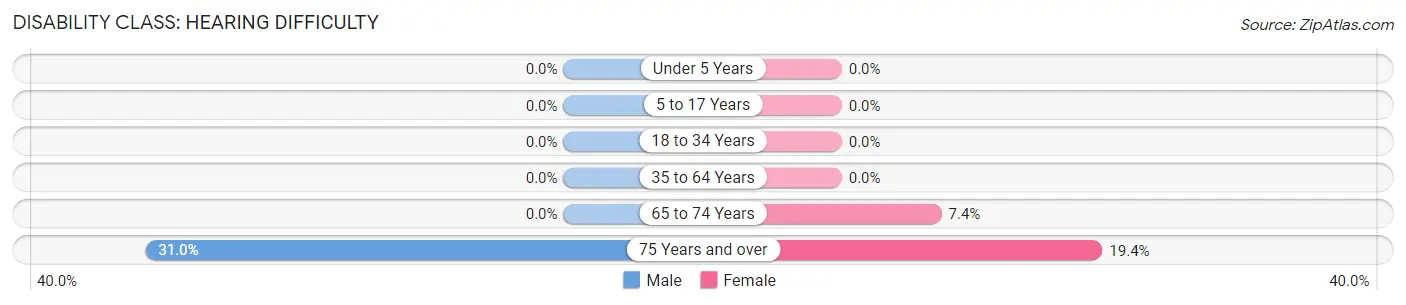
| Age Bracket | Male | Female |
| Under 5 Years | 0 (0.0%) | 0 (0.0%) |
| 5 to 17 Years | 0 (0.0%) | 0 (0.0%) |
| 18 to 34 Years | 0 (0.0%) | 0 (0.0%) |
| 35 to 64 Years | 0 (0.0%) | 0 (0.0%) |
| 65 to 74 Years | 0 (0.0%) | 10 (7.4%) |
| 75 Years and over | 54 (31.0%) | 36 (19.4%) |
Disability Class: Vision Difficulty
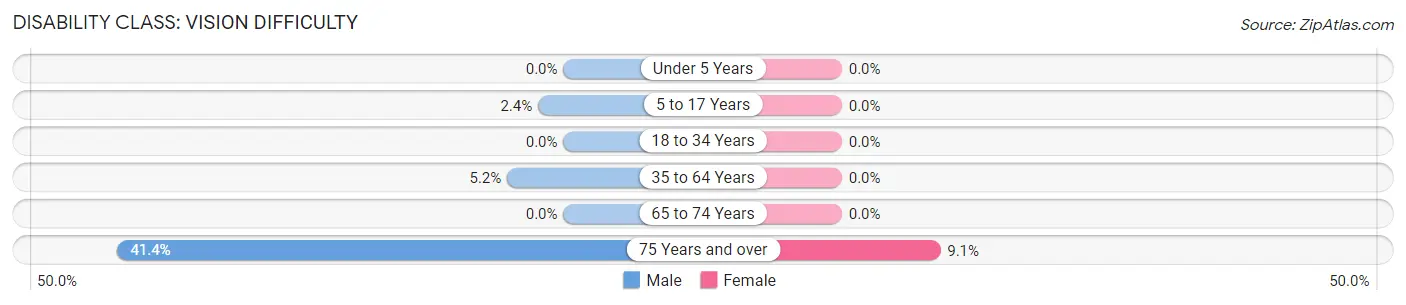
| Age Bracket | Male | Female |
| Under 5 Years | 0 (0.0%) | 0 (0.0%) |
| 5 to 17 Years | 10 (2.4%) | 0 (0.0%) |
| 18 to 34 Years | 0 (0.0%) | 0 (0.0%) |
| 35 to 64 Years | 33 (5.2%) | 0 (0.0%) |
| 65 to 74 Years | 0 (0.0%) | 0 (0.0%) |
| 75 Years and over | 72 (41.4%) | 17 (9.1%) |
Disability Class: Cognitive Difficulty
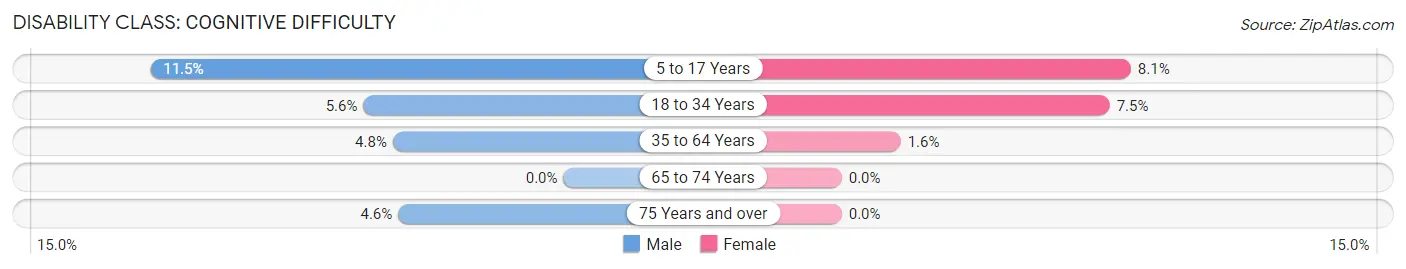
| Age Bracket | Male | Female |
| 5 to 17 Years | 49 (11.5%) | 14 (8.1%) |
| 18 to 34 Years | 16 (5.6%) | 15 (7.5%) |
| 35 to 64 Years | 30 (4.8%) | 9 (1.6%) |
| 65 to 74 Years | 0 (0.0%) | 0 (0.0%) |
| 75 Years and over | 8 (4.6%) | 0 (0.0%) |
Disability Class: Ambulatory Difficulty
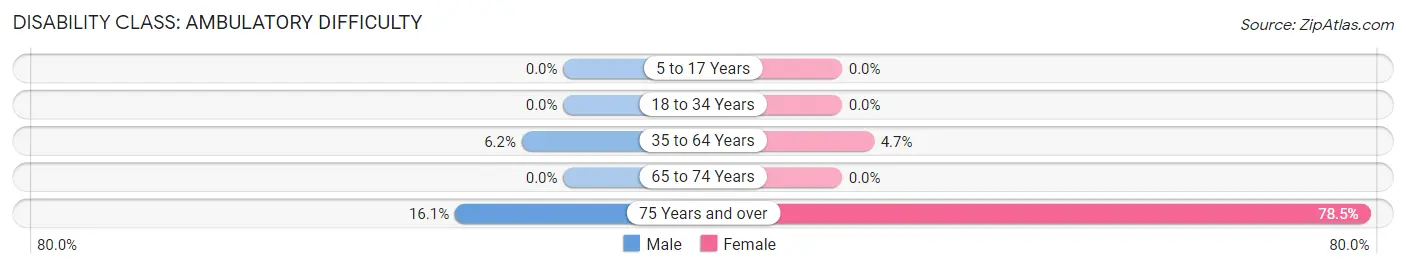
| Age Bracket | Male | Female |
| 5 to 17 Years | 0 (0.0%) | 0 (0.0%) |
| 18 to 34 Years | 0 (0.0%) | 0 (0.0%) |
| 35 to 64 Years | 39 (6.2%) | 26 (4.7%) |
| 65 to 74 Years | 0 (0.0%) | 0 (0.0%) |
| 75 Years and over | 28 (16.1%) | 146 (78.5%) |
Disability Class: Self-Care Difficulty
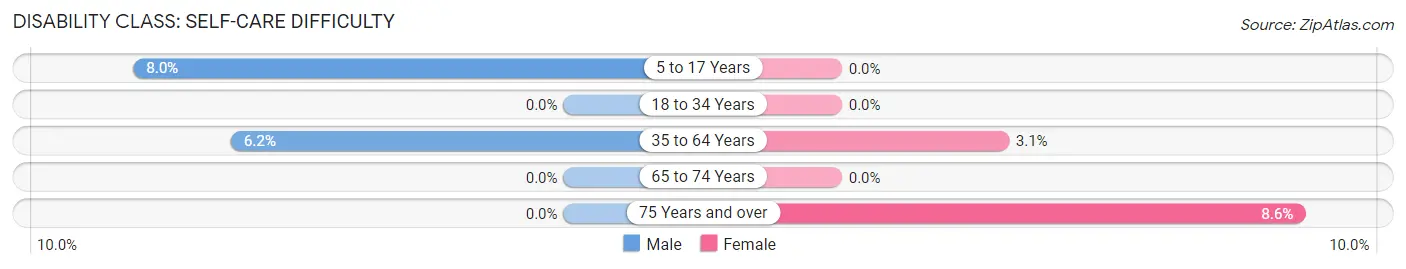
| Age Bracket | Male | Female |
| 5 to 17 Years | 34 (8.0%) | 0 (0.0%) |
| 18 to 34 Years | 0 (0.0%) | 0 (0.0%) |
| 35 to 64 Years | 39 (6.2%) | 17 (3.1%) |
| 65 to 74 Years | 0 (0.0%) | 0 (0.0%) |
| 75 Years and over | 0 (0.0%) | 16 (8.6%) |
Technology Access in Myerstown borough
Computing Device Access in Myerstown borough
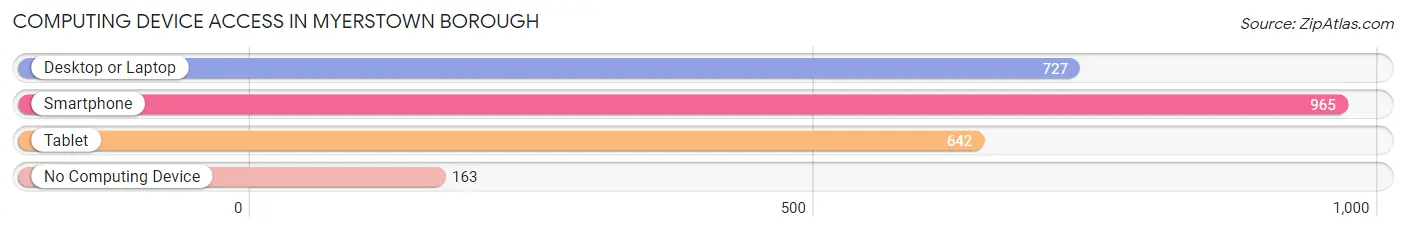
| Device Type | # Households | % Households |
| Desktop or Laptop | 727 | 57.8% |
| Smartphone | 965 | 76.7% |
| Tablet | 642 | 51.0% |
| No Computing Device | 163 | 13.0% |
| Total | 1,258 | 100.0% |
Internet Access in Myerstown borough
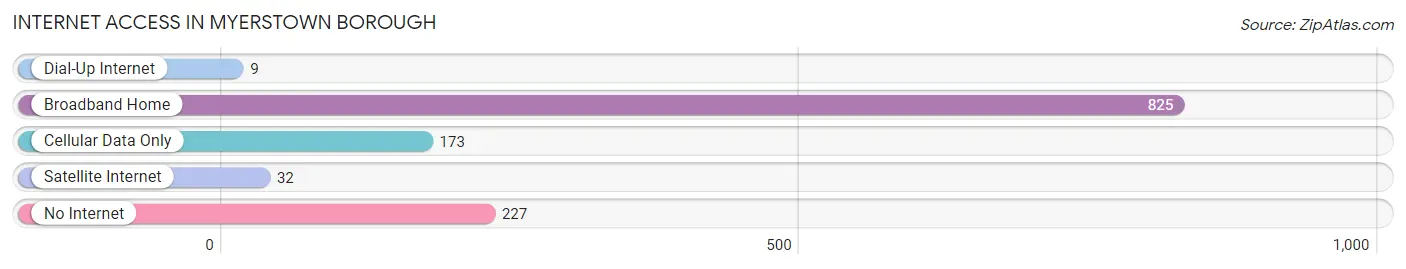
| Internet Type | # Households | % Households |
| Dial-Up Internet | 9 | 0.7% |
| Broadband Home | 825 | 65.6% |
| Cellular Data Only | 173 | 13.8% |
| Satellite Internet | 32 | 2.5% |
| No Internet | 227 | 18.0% |
| Total | 1,258 | 100.0% |
Myerstown borough Summary
Myerstown Borough is a small borough located in Lebanon County, Pennsylvania. It is situated in the southeastern part of the state, approximately 10 miles east of the city of Lebanon. The borough is part of the Lebanon Metropolitan Statistical Area and has a population of approximately 2,500 people.
History
Myerstown Borough was founded in 1755 by John Myer, a German immigrant. The town was originally known as Myer's Town, but the name was changed to Myerstown in 1845. The town was incorporated as a borough in 1851.
Myerstown was an important stop on the Reading Railroad, which ran through the town from 1837 to 1952. The railroad was a major factor in the growth of the town, as it allowed for the transportation of goods and people.
The town was also home to a number of industries, including a brickyard, a tannery, a sawmill, and a flour mill. The town was also home to a number of churches, including the First United Methodist Church, which was founded in 1845.
Geography
Myerstown Borough is located in the southeastern part of Lebanon County, Pennsylvania. It is situated in the Appalachian Mountains, approximately 10 miles east of the city of Lebanon. The borough is bordered by Jackson Township to the north, Heidelberg Township to the east, Bethel Township to the south, and Millcreek Township to the west.
The borough has a total area of 1.2 square miles, all of which is land. The borough is located in the Susquehanna River watershed and is home to several creeks, including Mill Creek, which runs through the center of town.
Economy
Myerstown Borough is a small, rural community with a population of approximately 2,500 people. The town is home to a number of small businesses, including restaurants, retail stores, and service providers. The town is also home to a number of manufacturing companies, including a furniture manufacturer, a plastics manufacturer, and a metal fabricator.
The town is also home to a number of agricultural operations, including dairy farms, poultry farms, and vegetable farms. The town is also home to a number of wineries and breweries, as well as a number of tourist attractions, including the Myerstown Historical Society Museum and the Myerstown Railroad Museum.
Demographics
As of the 2010 census, Myerstown Borough had a population of 2,521 people. The racial makeup of the borough was 97.3% White, 0.7% African American, 0.2% Native American, 0.4% Asian, 0.1% Pacific Islander, 0.4% from other races, and 0.9% from two or more races. Hispanic or Latino of any race were 1.2% of the population.
The median household income in Myerstown Borough was $45,938, and the median family income was $54,844. The per capita income for the borough was $21,945. About 8.2% of families and 10.2% of the population were below the poverty line, including 14.2% of those under age 18 and 6.2% of those age 65 or over.
Common Questions
What is Per Capita Income in Myerstown borough?
Per Capita income in Myerstown borough is $28,632.
What is the Median Family Income in Myerstown borough?
Median Family Income in Myerstown borough is $58,966.
What is the Median Household income in Myerstown borough?
Median Household Income in Myerstown borough is $52,429.
What is Income or Wage Gap in Myerstown borough?
Income or Wage Gap in Myerstown borough is 39.1%.
Women in Myerstown borough earn 60.9 cents for every dollar earned by a man.
What is Inequality or Gini Index in Myerstown borough?
Inequality or Gini Index in Myerstown borough is 0.40.
What is the Total Population of Myerstown borough?
Total Population of Myerstown borough is 3,107.
What is the Total Male Population of Myerstown borough?
Total Male Population of Myerstown borough is 1,715.
What is the Total Female Population of Myerstown borough?
Total Female Population of Myerstown borough is 1,392.
What is the Ratio of Males per 100 Females in Myerstown borough?
There are 123.20 Males per 100 Females in Myerstown borough.
What is the Ratio of Females per 100 Males in Myerstown borough?
There are 81.17 Females per 100 Males in Myerstown borough.
What is the Median Population Age in Myerstown borough?
Median Population Age in Myerstown borough is 43.1 Years.
What is the Average Family Size in Myerstown borough
Average Family Size in Myerstown borough is 2.9 People.
What is the Average Household Size in Myerstown borough
Average Household Size in Myerstown borough is 2.4 People.
How Large is the Labor Force in Myerstown borough?
There are 1,437 People in the Labor Forcein in Myerstown borough.
What is the Percentage of People in the Labor Force in Myerstown borough?
58.5% of People are in the Labor Force in Myerstown borough.
What is the Unemployment Rate in Myerstown borough?
Unemployment Rate in Myerstown borough is 4.4%.