Witmer, PA Map & Demographics
Witmer Map
Witmer Overview
$24,916
PER CAPITA INCOME
$94,803
AVG FAMILY INCOME
$93,421
AVG HOUSEHOLD INCOME
77.5%
WAGE / INCOME GAP [ % ]
22.5¢/ $1
WAGE / INCOME GAP [ $ ]
0.22
INEQUALITY / GINI INDEX
247
TOTAL POPULATION
132
MALE POPULATION
115
FEMALE POPULATION
114.78
MALES / 100 FEMALES
87.12
FEMALES / 100 MALES
31.0
MEDIAN AGE
3.3
AVG FAMILY SIZE
2.9
AVG HOUSEHOLD SIZE
148
LABOR FORCE [ PEOPLE ]
74.4%
PERCENT IN LABOR FORCE
Witmer Area Codes
Income in Witmer
Income Overview in Witmer
Per Capita Income in Witmer is $24,916, while median incomes of families and households are $94,803 and $93,421 respectively.
| Characteristic | Number | Measure |
| Per Capita Income | 247 | $24,916 |
| Median Family Income | 61 | $94,803 |
| Mean Family Income | 61 | $83,661 |
| Median Household Income | 82 | $93,421 |
| Mean Household Income | 82 | $72,412 |
| Income Deficit | 61 | $0 |
| Wage / Income Gap (%) | 247 | 77.54% |
| Wage / Income Gap ($) | 247 | 22.46¢ per $1 |
| Gini / Inequality Index | 247 | 0.22 |
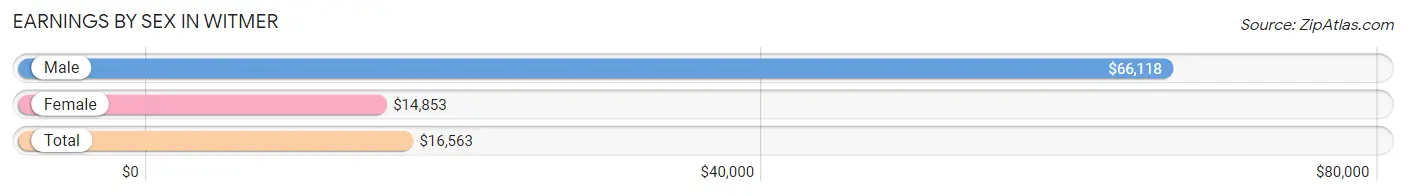
Earnings by Sex in Witmer
Average Earnings in Witmer are $16,563, $66,118 for men and $14,853 for women, a difference of 77.5%.
| Sex | Number | Average Earnings |
| Male | 83 (55.0%) | $66,118 |
| Female | 68 (45.0%) | $14,853 |
| Total | 151 (100.0%) | $16,563 |
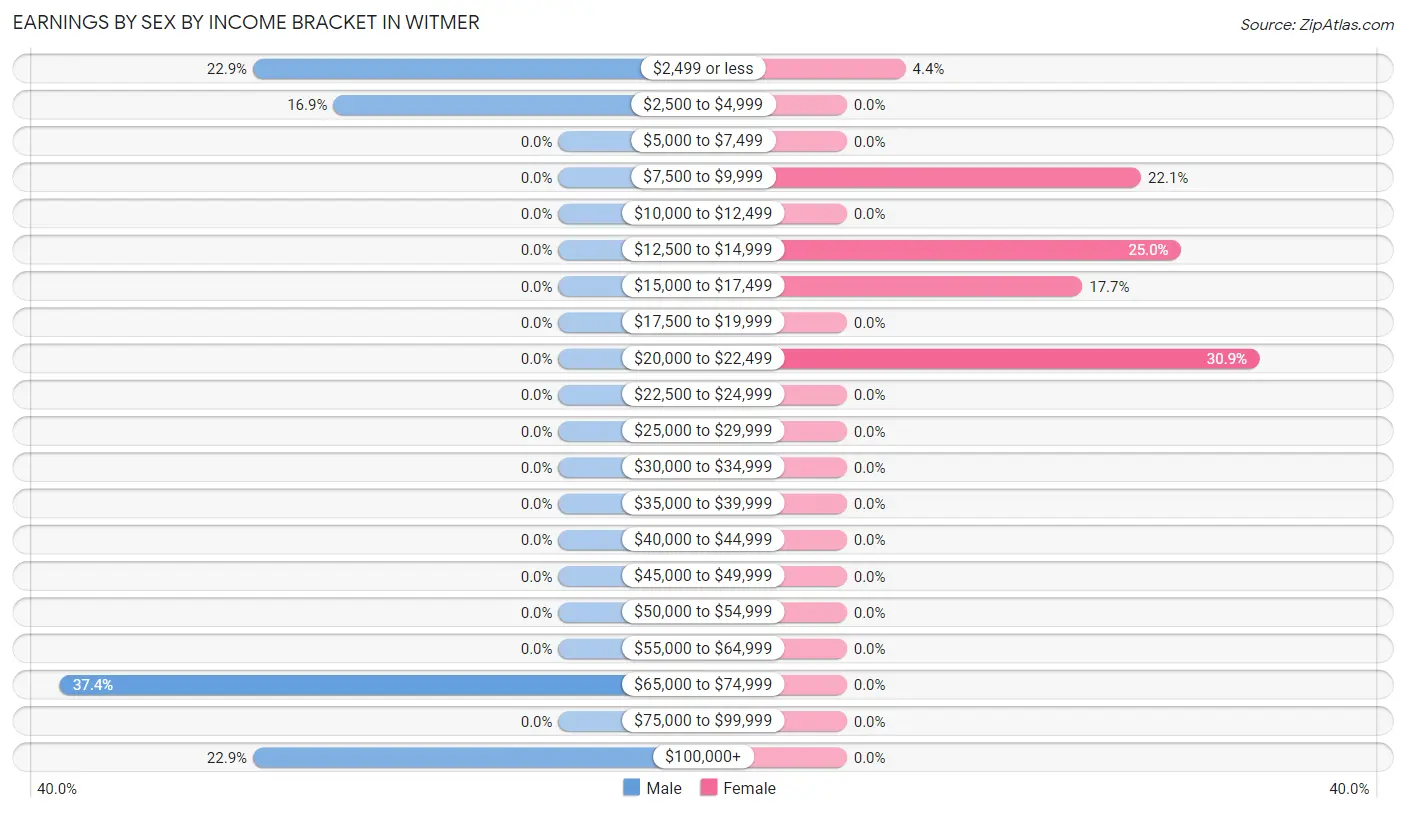
Earnings by Sex by Income Bracket in Witmer
The most common earnings brackets in Witmer are $65,000 to $74,999 for men (31 | 37.3%) and $20,000 to $22,499 for women (21 | 30.9%).
| Income | Male | Female |
| $2,499 or less | 19 (22.9%) | 3 (4.4%) |
| $2,500 to $4,999 | 14 (16.9%) | 0 (0.0%) |
| $5,000 to $7,499 | 0 (0.0%) | 0 (0.0%) |
| $7,500 to $9,999 | 0 (0.0%) | 15 (22.1%) |
| $10,000 to $12,499 | 0 (0.0%) | 0 (0.0%) |
| $12,500 to $14,999 | 0 (0.0%) | 17 (25.0%) |
| $15,000 to $17,499 | 0 (0.0%) | 12 (17.6%) |
| $17,500 to $19,999 | 0 (0.0%) | 0 (0.0%) |
| $20,000 to $22,499 | 0 (0.0%) | 21 (30.9%) |
| $22,500 to $24,999 | 0 (0.0%) | 0 (0.0%) |
| $25,000 to $29,999 | 0 (0.0%) | 0 (0.0%) |
| $30,000 to $34,999 | 0 (0.0%) | 0 (0.0%) |
| $35,000 to $39,999 | 0 (0.0%) | 0 (0.0%) |
| $40,000 to $44,999 | 0 (0.0%) | 0 (0.0%) |
| $45,000 to $49,999 | 0 (0.0%) | 0 (0.0%) |
| $50,000 to $54,999 | 0 (0.0%) | 0 (0.0%) |
| $55,000 to $64,999 | 0 (0.0%) | 0 (0.0%) |
| $65,000 to $74,999 | 31 (37.3%) | 0 (0.0%) |
| $75,000 to $99,999 | 0 (0.0%) | 0 (0.0%) |
| $100,000+ | 19 (22.9%) | 0 (0.0%) |
| Total | 83 (100.0%) | 68 (100.0%) |
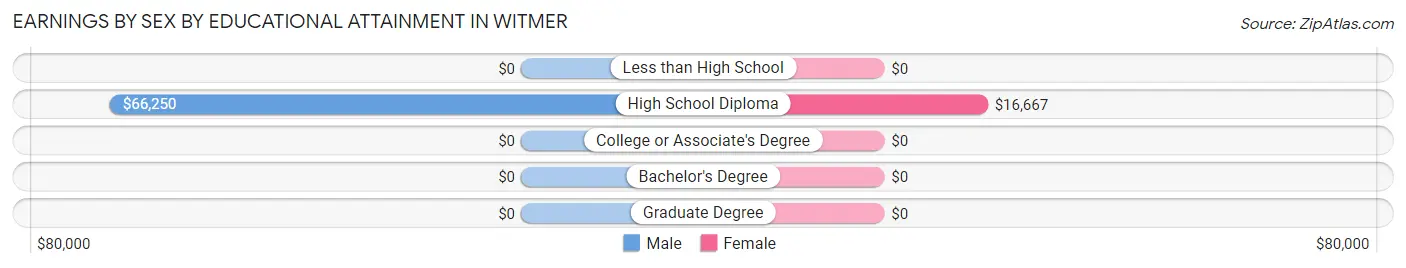
Earnings by Sex by Educational Attainment in Witmer
Average earnings in Witmer are $67,039 for men and $16,667 for women, a difference of 75.1%. Men with an educational attainment of high school diploma enjoy the highest average annual earnings of $66,250, while those with high school diploma education earn the least with $66,250. Women with an educational attainment of high school diploma earn the most with the average annual earnings of $16,667, while those with high school diploma education have the smallest earnings of $16,667.
| Educational Attainment | Male Income | Female Income |
| Less than High School | - | - |
| High School Diploma | $66,250 | $16,667 |
| College or Associate's Degree | - | - |
| Bachelor's Degree | - | - |
| Graduate Degree | - | - |
| Total | $67,039 | $16,667 |
Family Income in Witmer
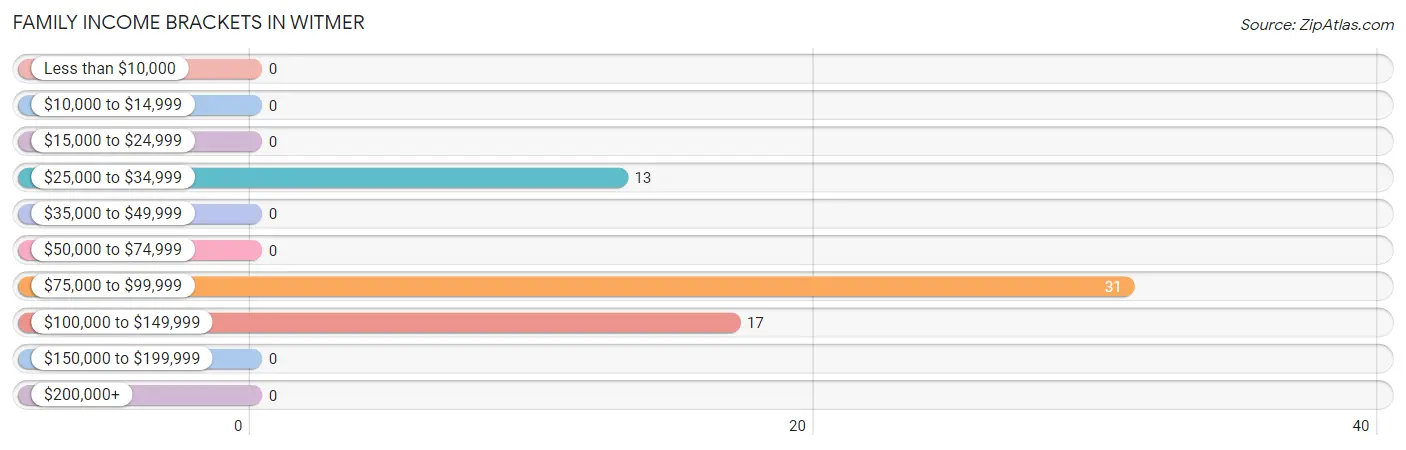
Family Income Brackets in Witmer
According to the Witmer family income data, there are 31 families falling into the $75,000 to $99,999 income range, which is the most common income bracket and makes up 50.8% of all families.
| Income Bracket | # Families | % Families |
| Less than $10,000 | 0 | 0.0% |
| $10,000 to $14,999 | 0 | 0.0% |
| $15,000 to $24,999 | 0 | 0.0% |
| $25,000 to $34,999 | 13 | 21.3% |
| $35,000 to $49,999 | 0 | 0.0% |
| $50,000 to $74,999 | 0 | 0.0% |
| $75,000 to $99,999 | 31 | 50.8% |
| $100,000 to $149,999 | 17 | 27.9% |
| $150,000 to $199,999 | 0 | 0.0% |
| $200,000+ | 0 | 0.0% |
Family Income by Famaliy Size in Witmer
| Income Bracket | # Families | Median Income |
| 2-Person Families | 36 (59.0%) | $0 |
| 3-Person Families | 0 (0.0%) | $0 |
| 4-Person Families | 12 (19.7%) | $0 |
| 5-Person Families | 0 (0.0%) | $0 |
| 6-Person Families | 13 (21.3%) | $0 |
| 7+ Person Families | 0 (0.0%) | $0 |
| Total | 61 (100.0%) | $94,803 |
Family Income by Number of Earners in Witmer
| Number of Earners | # Families | Median Income |
| No Earners | 0 (0.0%) | $0 |
| 1 Earner | 30 (49.2%) | $0 |
| 2 Earners | 19 (31.1%) | $0 |
| 3+ Earners | 12 (19.7%) | $0 |
| Total | 61 (100.0%) | $94,803 |
Household Income in Witmer
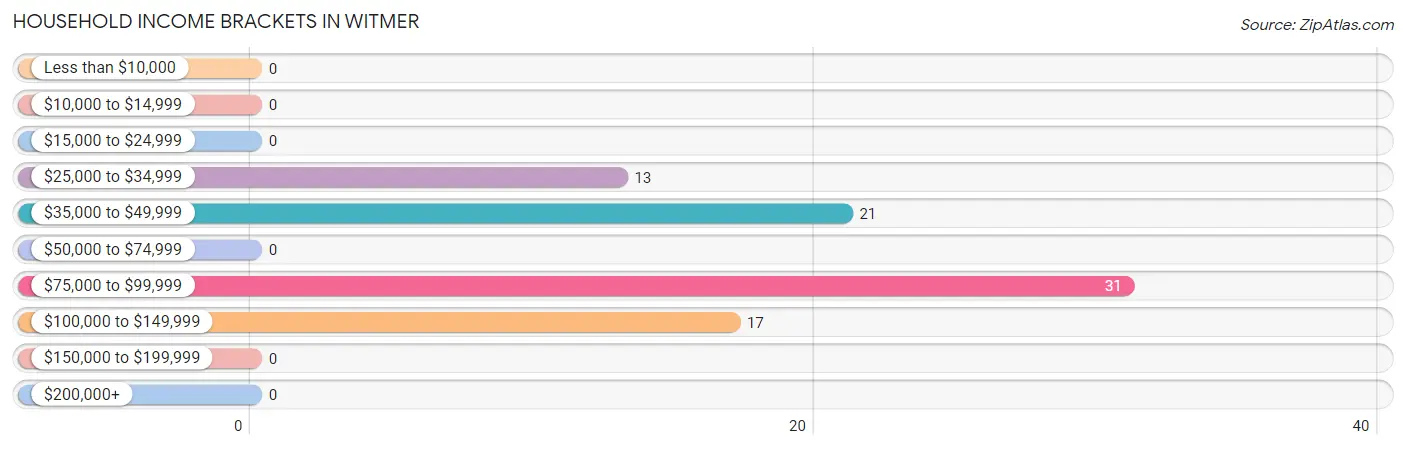
Household Income Brackets in Witmer
With 31 households falling in the category, the $75,000 to $99,999 income range is the most frequent in Witmer, accounting for 37.8% of all households.
| Income Bracket | # Households | % Households |
| Less than $10,000 | 0 | 0.0% |
| $10,000 to $14,999 | 0 | 0.0% |
| $15,000 to $24,999 | 0 | 0.0% |
| $25,000 to $34,999 | 13 | 15.9% |
| $35,000 to $49,999 | 21 | 25.6% |
| $50,000 to $74,999 | 0 | 0.0% |
| $75,000 to $99,999 | 31 | 37.8% |
| $100,000 to $149,999 | 17 | 20.7% |
| $150,000 to $199,999 | 0 | 0.0% |
| $200,000+ | 0 | 0.0% |
Household Income by Householder Age in Witmer
The median household income in Witmer is $93,421, with the highest median household income of $96,042 found in the 45 to 64 years age bracket for the primary householder. A total of 48 households (58.5%) fall into this category.
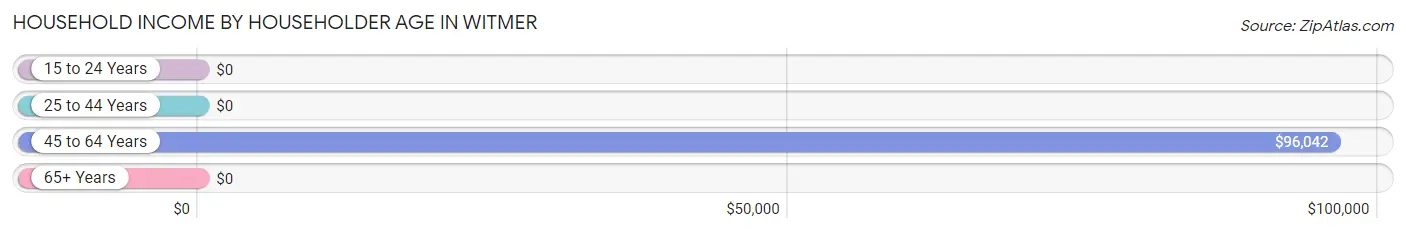
| Income Bracket | # Households | Median Income |
| 15 to 24 Years | 0 (0.0%) | $0 |
| 25 to 44 Years | 13 (15.9%) | $0 |
| 45 to 64 Years | 48 (58.5%) | $96,042 |
| 65+ Years | 21 (25.6%) | $0 |
| Total | 82 (100.0%) | $93,421 |
Poverty in Witmer
Income Below Poverty by Sex and Age in Witmer
With 51.5% poverty level for males and 26.1% for females among the residents of Witmer, under 5 year old males and 6 to 11 year old females are the most vulnerable to poverty, with 24 males (100.0%) and 12 females (100.0%) in their respective age groups living below the poverty level.
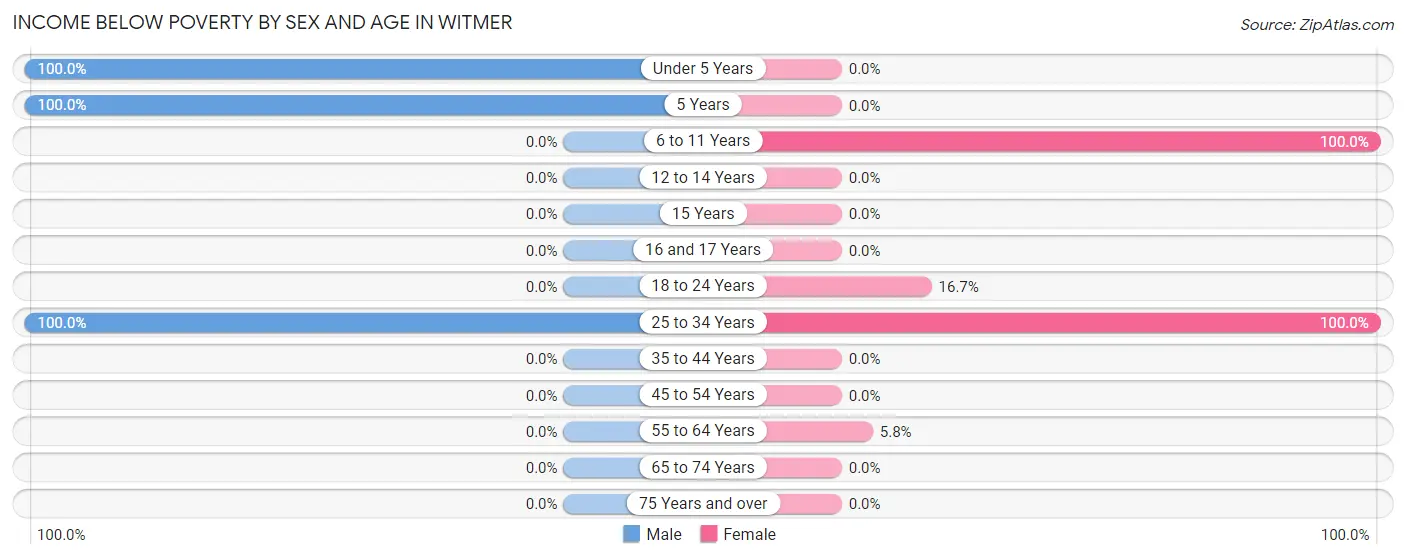
| Age Bracket | Male | Female |
| Under 5 Years | 24 (100.0%) | 0 (0.0%) |
| 5 Years | 12 (100.0%) | 0 (0.0%) |
| 6 to 11 Years | 0 (0.0%) | 12 (100.0%) |
| 12 to 14 Years | 0 (0.0%) | 0 (0.0%) |
| 15 Years | 0 (0.0%) | 0 (0.0%) |
| 16 and 17 Years | 0 (0.0%) | 0 (0.0%) |
| 18 to 24 Years | 0 (0.0%) | 3 (16.7%) |
| 25 to 34 Years | 32 (100.0%) | 12 (100.0%) |
| 35 to 44 Years | 0 (0.0%) | 0 (0.0%) |
| 45 to 54 Years | 0 (0.0%) | 0 (0.0%) |
| 55 to 64 Years | 0 (0.0%) | 3 (5.8%) |
| 65 to 74 Years | 0 (0.0%) | 0 (0.0%) |
| 75 Years and over | 0 (0.0%) | 0 (0.0%) |
| Total | 68 (51.5%) | 30 (26.1%) |
Income Above Poverty by Sex and Age in Witmer
According to the poverty statistics in Witmer, males aged 16 and 17 years and females aged 65 to 74 years are the age groups that are most secure financially, with 100.0% of males and 100.0% of females in these age groups living above the poverty line.
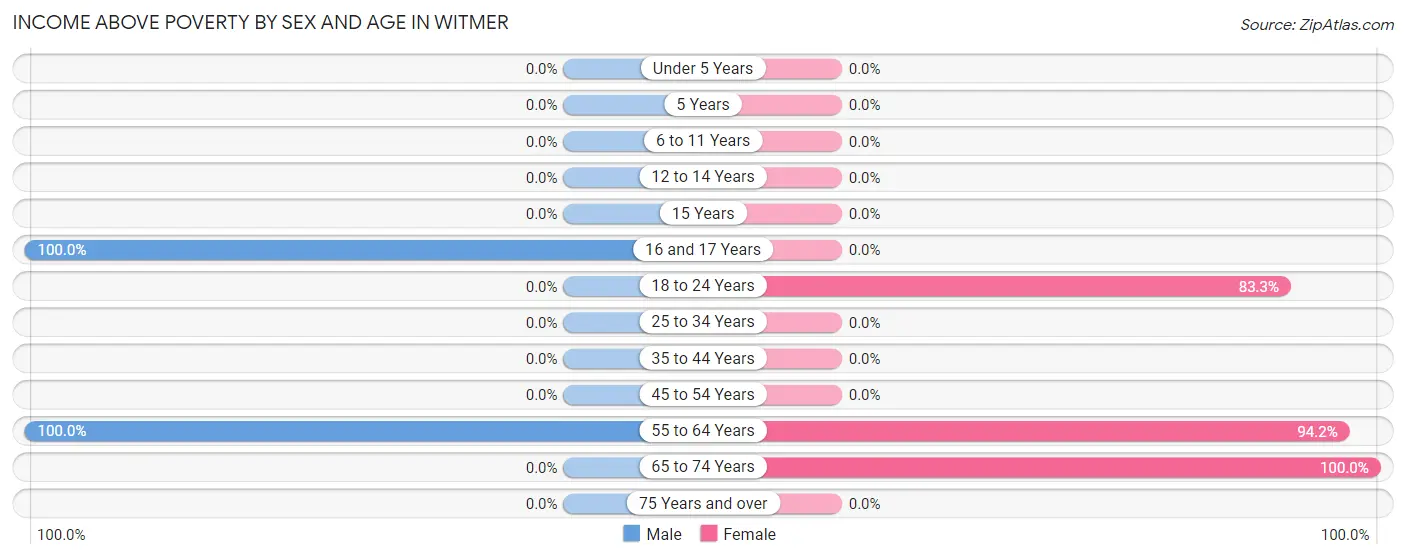
| Age Bracket | Male | Female |
| Under 5 Years | 0 (0.0%) | 0 (0.0%) |
| 5 Years | 0 (0.0%) | 0 (0.0%) |
| 6 to 11 Years | 0 (0.0%) | 0 (0.0%) |
| 12 to 14 Years | 0 (0.0%) | 0 (0.0%) |
| 15 Years | 0 (0.0%) | 0 (0.0%) |
| 16 and 17 Years | 14 (100.0%) | 0 (0.0%) |
| 18 to 24 Years | 0 (0.0%) | 15 (83.3%) |
| 25 to 34 Years | 0 (0.0%) | 0 (0.0%) |
| 35 to 44 Years | 0 (0.0%) | 0 (0.0%) |
| 45 to 54 Years | 0 (0.0%) | 0 (0.0%) |
| 55 to 64 Years | 50 (100.0%) | 49 (94.2%) |
| 65 to 74 Years | 0 (0.0%) | 21 (100.0%) |
| 75 Years and over | 0 (0.0%) | 0 (0.0%) |
| Total | 64 (48.5%) | 85 (73.9%) |
Income Below Poverty Among Married-Couple Families in Witmer
The poverty statistics for married-couple families in Witmer show that 21.3% or 13 of the total 61 families live below the poverty line. Families with 3 or 4 children have the highest poverty rate of 100.0%, comprising of 13 families. On the other hand, families with no children have the lowest poverty rate of 0.0%, which includes 0 families.
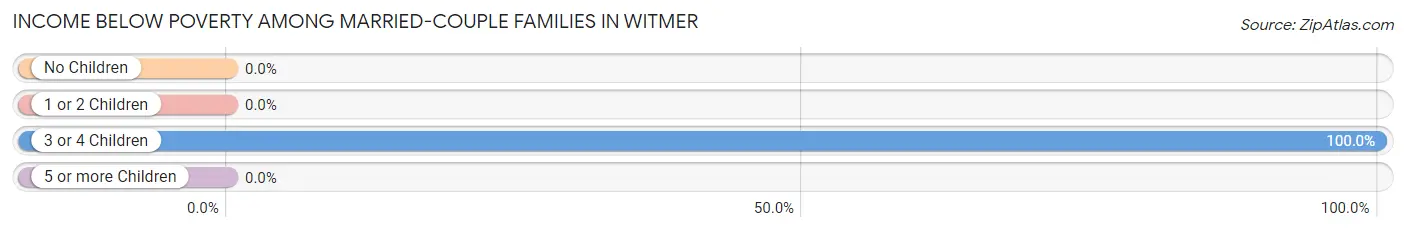
| Children | Above Poverty | Below Poverty |
| No Children | 36 (100.0%) | 0 (0.0%) |
| 1 or 2 Children | 12 (100.0%) | 0 (0.0%) |
| 3 or 4 Children | 0 (0.0%) | 13 (100.0%) |
| 5 or more Children | 0 (0.0%) | 0 (0.0%) |
| Total | 48 (78.7%) | 13 (21.3%) |
Income Below Poverty Among Single-Parent Households in Witmer
| Children | Single Father | Single Mother |
| No Children | 0 (0.0%) | 0 (0.0%) |
| 1 or 2 Children | 0 (0.0%) | 0 (0.0%) |
| 3 or 4 Children | 0 (0.0%) | 0 (0.0%) |
| 5 or more Children | 0 (0.0%) | 0 (0.0%) |
| Total | 0 (0.0%) | 0 (0.0%) |
Income Below Poverty Among Married-Couple vs Single-Parent Households in Witmer
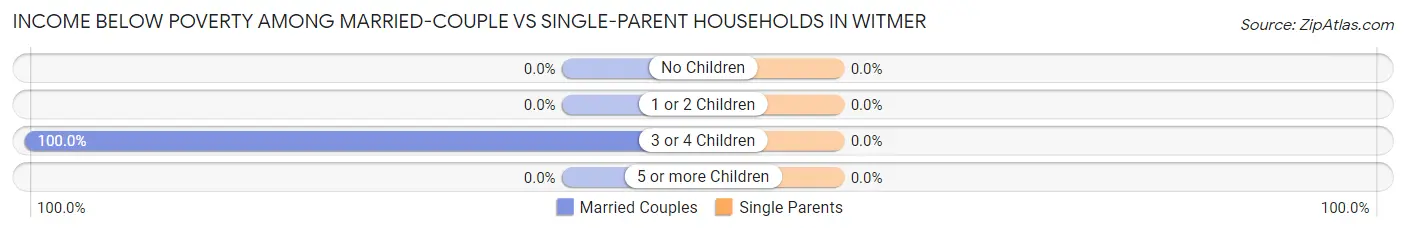
| Children | Married-Couple Families | Single-Parent Households |
| No Children | 0 (0.0%) | 0 (0.0%) |
| 1 or 2 Children | 0 (0.0%) | 0 (0.0%) |
| 3 or 4 Children | 13 (100.0%) | 0 (0.0%) |
| 5 or more Children | 0 (0.0%) | 0 (0.0%) |
| Total | 13 (21.3%) | 0 (0.0%) |
Race in Witmer
The most populous races in Witmer are White / Caucasian (244 | 98.8%), and Black / African American (3 | 1.2%).
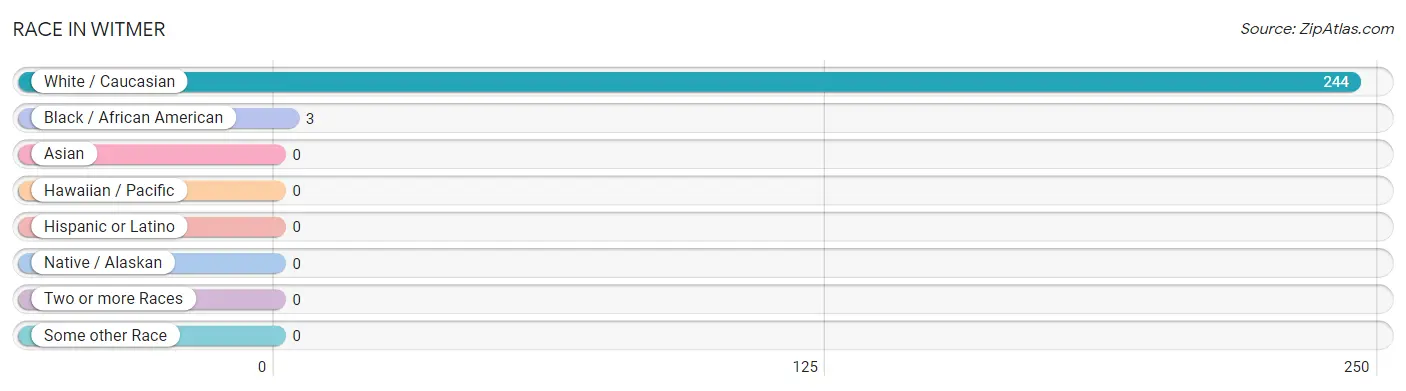
| Race | # Population | % Population |
| Asian | 0 | 0.0% |
| Black / African American | 3 | 1.2% |
| Hawaiian / Pacific | 0 | 0.0% |
| Hispanic or Latino | 0 | 0.0% |
| Native / Alaskan | 0 | 0.0% |
| White / Caucasian | 244 | 98.8% |
| Two or more Races | 0 | 0.0% |
| Some other Race | 0 | 0.0% |
| Total | 247 | 100.0% |
Ancestry in Witmer
The most populous ancestries reported in Witmer are German (57 | 23.1%), English (3 | 1.2%), and Irish (3 | 1.2%), together accounting for 25.5% of all Witmer residents.
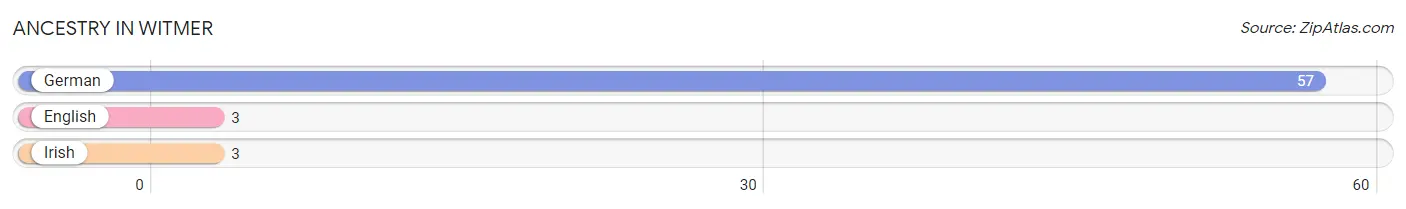
| Ancestry | # Population | % Population |
| English | 3 | 1.2% |
| German | 57 | 23.1% |
| Irish | 3 | 1.2% | View All 3 Rows |
Immigrants in Witmer
The most numerous immigrant groups reported in Witmer came from Eastern Europe (12 | 4.9%), Europe (12 | 4.9%), and Romania (12 | 4.9%), together accounting for 14.6% of all Witmer residents.
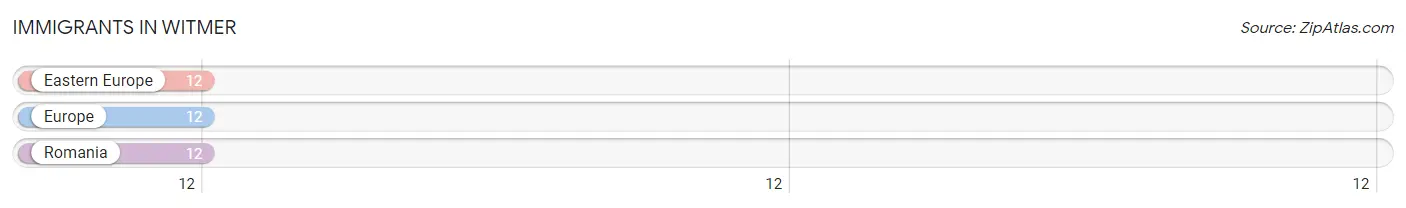
| Immigration Origin | # Population | % Population |
| Eastern Europe | 12 | 4.9% |
| Europe | 12 | 4.9% |
| Romania | 12 | 4.9% | View All 3 Rows |
Sex and Age in Witmer
Sex and Age in Witmer
The most populous age groups in Witmer are 60 to 64 Years (50 | 37.9%) for men and 55 to 59 Years (32 | 27.8%) for women.
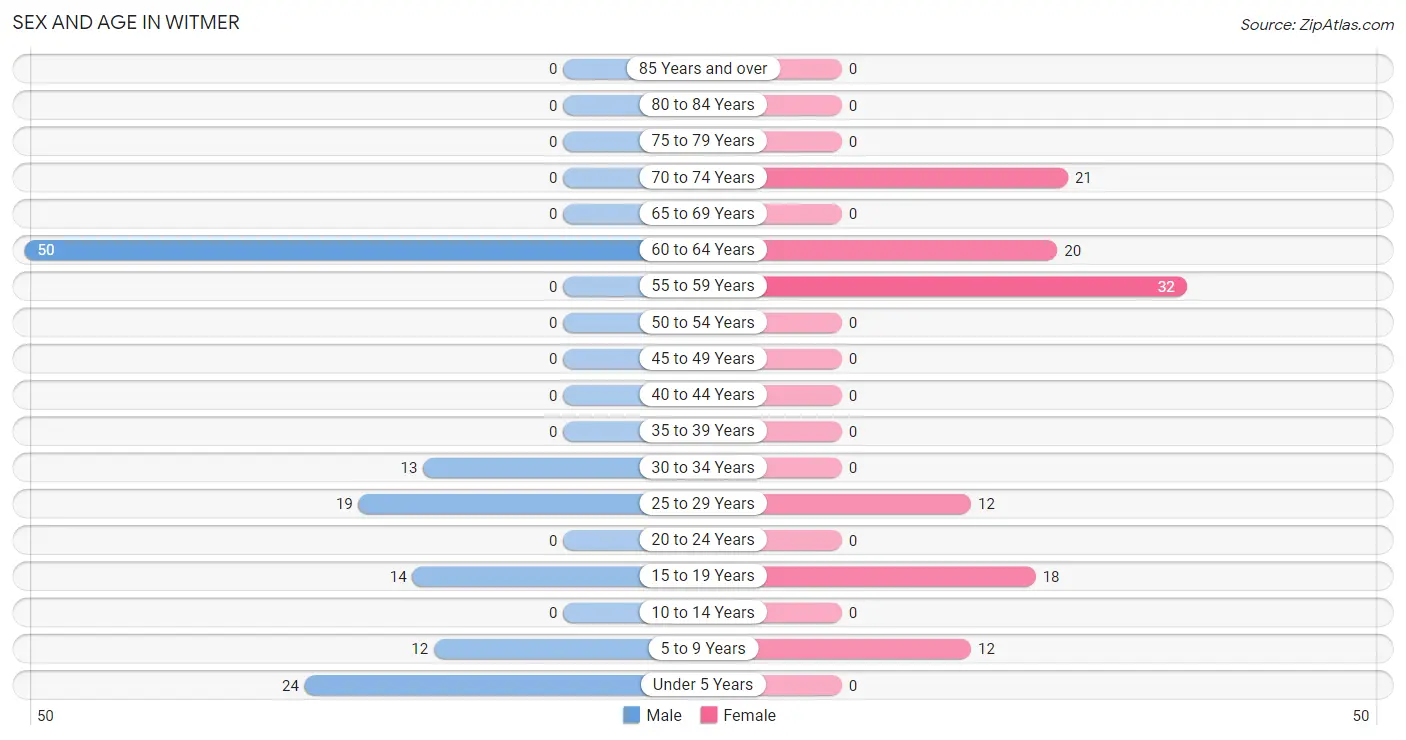
| Age Bracket | Male | Female |
| Under 5 Years | 24 (18.2%) | 0 (0.0%) |
| 5 to 9 Years | 12 (9.1%) | 12 (10.4%) |
| 10 to 14 Years | 0 (0.0%) | 0 (0.0%) |
| 15 to 19 Years | 14 (10.6%) | 18 (15.7%) |
| 20 to 24 Years | 0 (0.0%) | 0 (0.0%) |
| 25 to 29 Years | 19 (14.4%) | 12 (10.4%) |
| 30 to 34 Years | 13 (9.9%) | 0 (0.0%) |
| 35 to 39 Years | 0 (0.0%) | 0 (0.0%) |
| 40 to 44 Years | 0 (0.0%) | 0 (0.0%) |
| 45 to 49 Years | 0 (0.0%) | 0 (0.0%) |
| 50 to 54 Years | 0 (0.0%) | 0 (0.0%) |
| 55 to 59 Years | 0 (0.0%) | 32 (27.8%) |
| 60 to 64 Years | 50 (37.9%) | 20 (17.4%) |
| 65 to 69 Years | 0 (0.0%) | 0 (0.0%) |
| 70 to 74 Years | 0 (0.0%) | 21 (18.3%) |
| 75 to 79 Years | 0 (0.0%) | 0 (0.0%) |
| 80 to 84 Years | 0 (0.0%) | 0 (0.0%) |
| 85 Years and over | 0 (0.0%) | 0 (0.0%) |
| Total | 132 (100.0%) | 115 (100.0%) |
Families and Households in Witmer
Median Family Size in Witmer
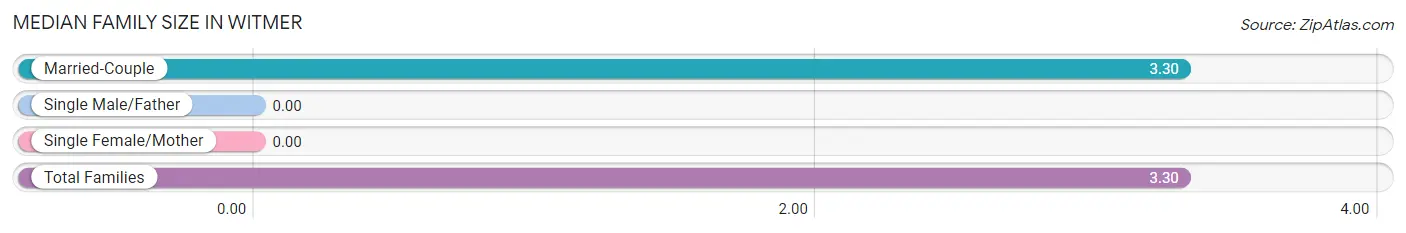
| Family Type | # Families | Family Size |
| Married-Couple | 61 (100.0%) | 3.30 |
| Single Male/Father | 0 (0.0%) | - |
| Single Female/Mother | 0 (0.0%) | - |
| Total Families | 61 (100.0%) | 3.30 |
Median Household Size in Witmer
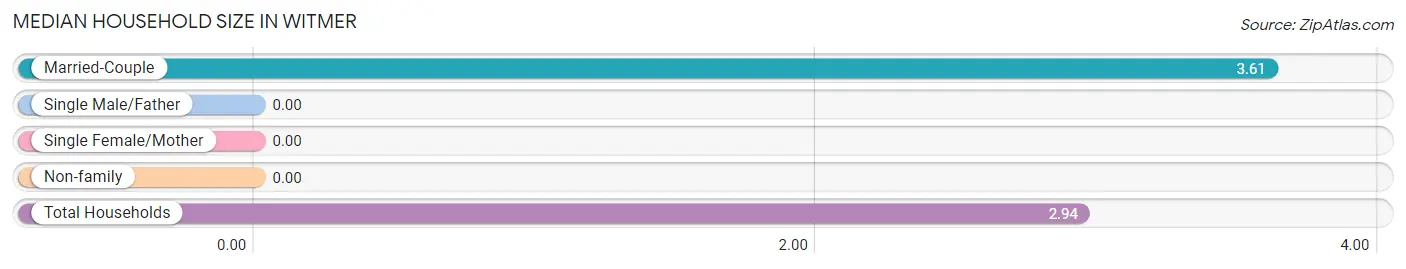
| Household Type | # Households | Household Size |
| Married-Couple | 61 (74.4%) | 3.61 |
| Single Male/Father | 0 (0.0%) | - |
| Single Female/Mother | 0 (0.0%) | - |
| Non-family | 21 (25.6%) | - |
| Total Households | 82 (100.0%) | 2.94 |
Household Size by Marriage Status in Witmer
Out of a total of 82 households in Witmer, 61 (74.4%) are family households, while 21 (25.6%) are nonfamily households. The most numerous type of family households are 2-person households, comprising 19, and the most common type of nonfamily households are 1-person households, comprising 21.
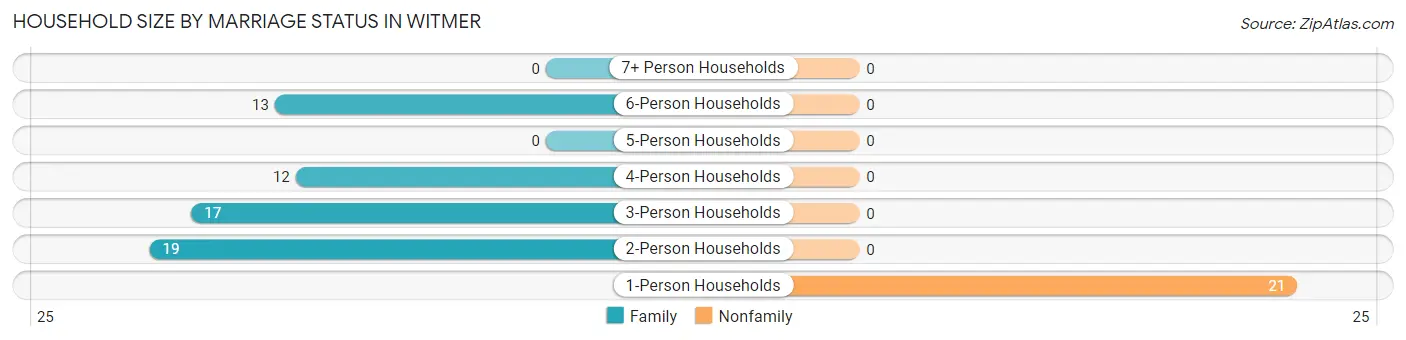
| Household Size | Family Households | Nonfamily Households |
| 1-Person Households | - | 21 (25.6%) |
| 2-Person Households | 19 (23.2%) | 0 (0.0%) |
| 3-Person Households | 17 (20.7%) | 0 (0.0%) |
| 4-Person Households | 12 (14.6%) | 0 (0.0%) |
| 5-Person Households | 0 (0.0%) | 0 (0.0%) |
| 6-Person Households | 13 (15.9%) | 0 (0.0%) |
| 7+ Person Households | 0 (0.0%) | 0 (0.0%) |
| Total | 61 (74.4%) | 21 (25.6%) |
Female Fertility in Witmer
Fertility by Age in Witmer
| Age Bracket | Women with Births | Births / 1,000 Women |
| 15 to 19 years | 0 (0.0%) | 0.0 |
| 20 to 34 years | 0 (0.0%) | 0.0 |
| 35 to 50 years | 0 (0.0%) | 0.0 |
| Total | 0 (0.0%) | 0.0 |
Fertility by Age by Marriage Status in Witmer
| Age Bracket | Married | Unmarried |
| 15 to 19 years | 0 (0.0%) | 0 (0.0%) |
| 20 to 34 years | 0 (0.0%) | 0 (0.0%) |
| 35 to 50 years | 0 (0.0%) | 0 (0.0%) |
| Total | 0 (0.0%) | 0 (0.0%) |
Fertility by Education in Witmer
| Educational Attainment | Women with Births | Births / 1,000 Women |
| Less than High School | 0 (0.0%) | 0.0 |
| High School Diploma | 0 (0.0%) | 0.0 |
| College or Associate's Degree | 0 (0.0%) | 0.0 |
| Bachelor's Degree | 0 (0.0%) | 0.0 |
| Graduate Degree | 0 (0.0%) | 0.0 |
| Total | 0 (0.0%) | 0.0 |
Fertility by Education by Marriage Status in Witmer
| Educational Attainment | Married | Unmarried |
| Less than High School | 0 (0.0%) | 0 (0.0%) |
| High School Diploma | 0 (0.0%) | 0 (0.0%) |
| College or Associate's Degree | 0 (0.0%) | 0 (0.0%) |
| Bachelor's Degree | 0 (0.0%) | 0 (0.0%) |
| Graduate Degree | 0 (0.0%) | 0 (0.0%) |
| Total | 0 (0.0%) | 0 (0.0%) |
Employment Characteristics in Witmer
Employment by Class of Employer in Witmer
Among the 148 employed individuals in Witmer, , and private company employees (148 | 100.0%) make up the most common classes of employment.
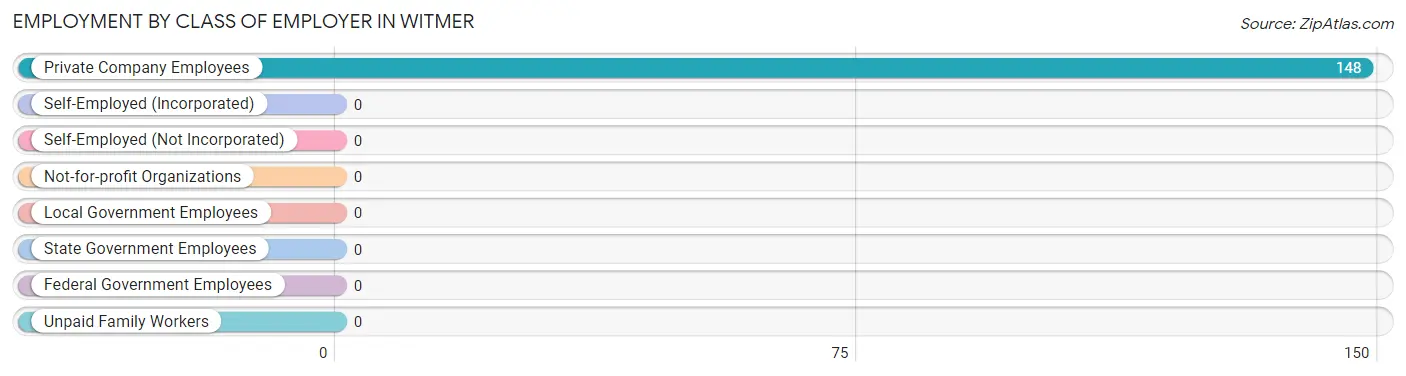
| Employer Class | # Employees | % Employees |
| Private Company Employees | 148 | 100.0% |
| Self-Employed (Incorporated) | 0 | 0.0% |
| Self-Employed (Not Incorporated) | 0 | 0.0% |
| Not-for-profit Organizations | 0 | 0.0% |
| Local Government Employees | 0 | 0.0% |
| State Government Employees | 0 | 0.0% |
| Federal Government Employees | 0 | 0.0% |
| Unpaid Family Workers | 0 | 0.0% |
| Total | 148 | 100.0% |
Employment Status by Age in Witmer
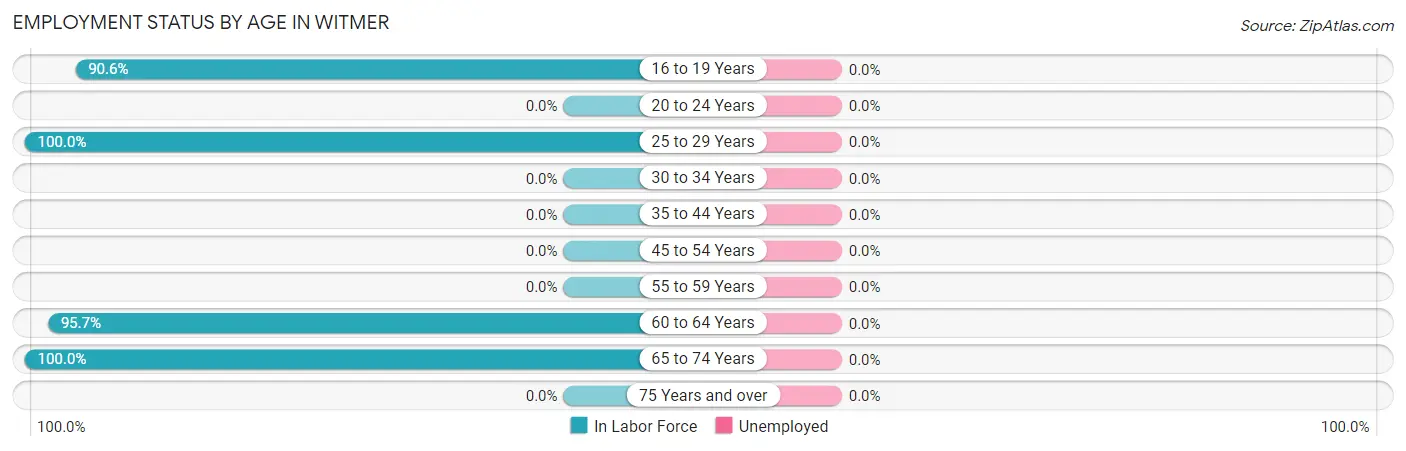
| Age Bracket | In Labor Force | Unemployed |
| 16 to 19 Years | 29 (90.6%) | 0 (0.0%) |
| 20 to 24 Years | 0 (0.0%) | 0 (0.0%) |
| 25 to 29 Years | 31 (100.0%) | 0 (0.0%) |
| 30 to 34 Years | 0 (0.0%) | 0 (0.0%) |
| 35 to 44 Years | 0 (0.0%) | 0 (0.0%) |
| 45 to 54 Years | 0 (0.0%) | 0 (0.0%) |
| 55 to 59 Years | 0 (0.0%) | 0 (0.0%) |
| 60 to 64 Years | 67 (95.7%) | 0 (0.0%) |
| 65 to 74 Years | 21 (100.0%) | 0 (0.0%) |
| 75 Years and over | 0 (0.0%) | 0 (0.0%) |
| Total | 148 (74.4%) | 0 (0.0%) |
Employment Status by Educational Attainment in Witmer
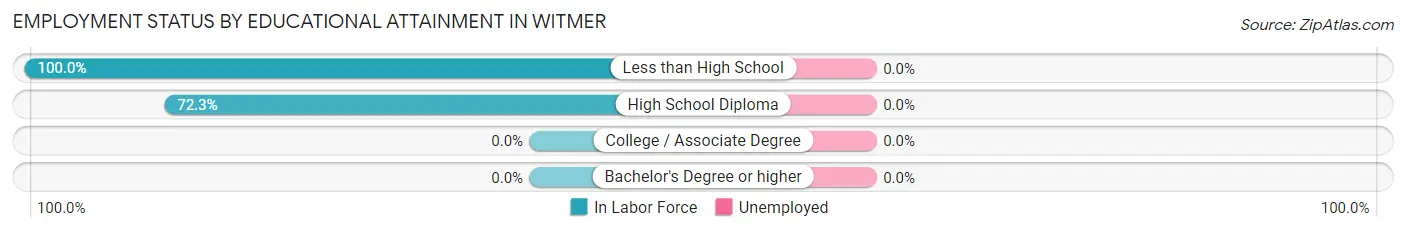
| Educational Attainment | In Labor Force | Unemployed |
| Less than High School | 12 (100.0%) | 0 (0.0%) |
| High School Diploma | 86 (72.3%) | 0 (0.0%) |
| College / Associate Degree | 0 (0.0%) | 0 (0.0%) |
| Bachelor's Degree or higher | 0 (0.0%) | 0 (0.0%) |
| Total | 98 (67.1%) | 0 (0.0%) |
Employment Occupations by Sex in Witmer
Management, Business, Science and Arts Occupations
The most common Management, Business, Science and Arts occupations in Witmer are Management (31 | 20.9%), Community & Social Service (15 | 10.1%), and Education Instruction & Library (15 | 10.1%).
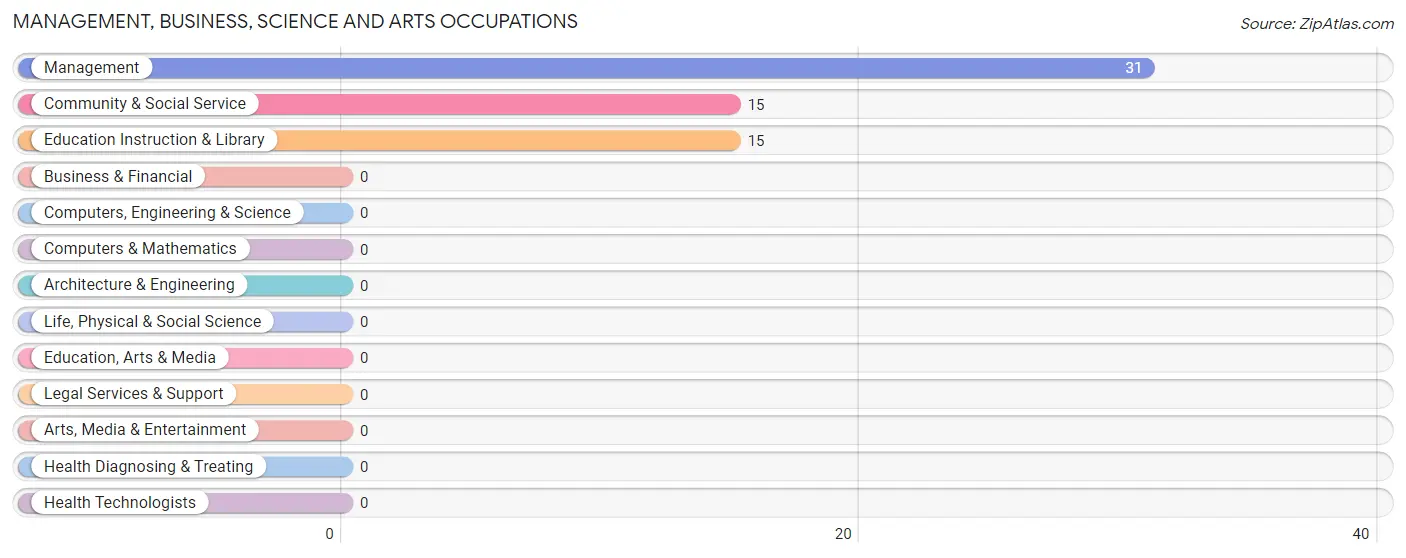
Management, Business, Science and Arts Occupations by Sex
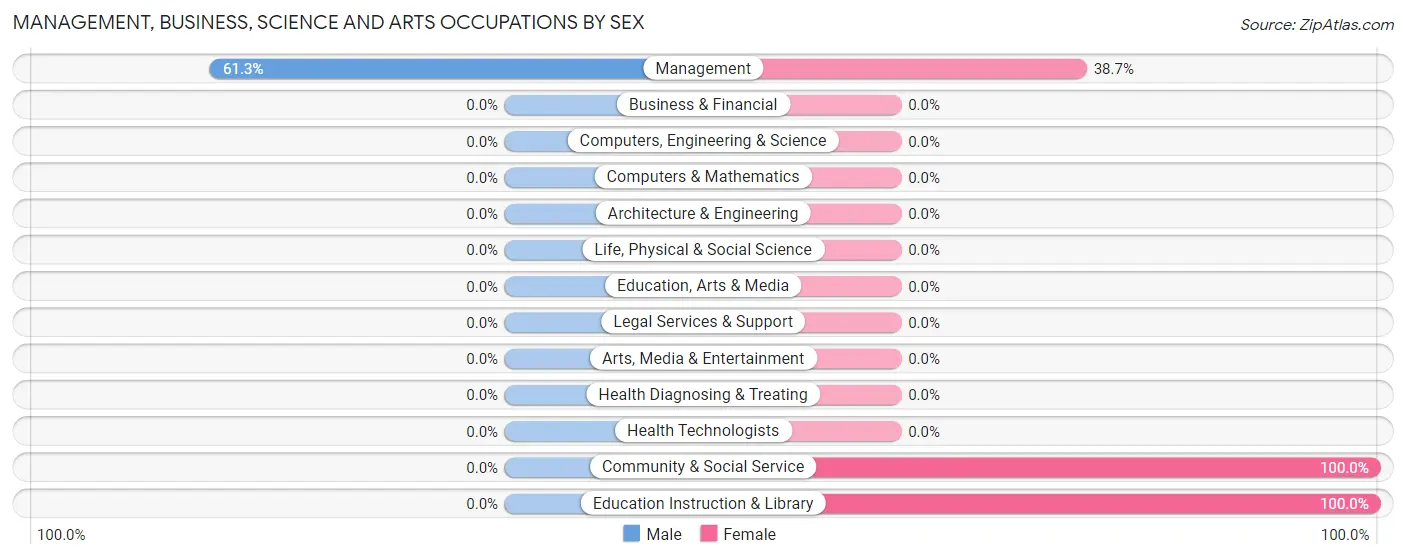
| Occupation | Male | Female |
| Management | 19 (61.3%) | 12 (38.7%) |
| Business & Financial | 0 (0.0%) | 0 (0.0%) |
| Computers, Engineering & Science | 0 (0.0%) | 0 (0.0%) |
| Computers & Mathematics | 0 (0.0%) | 0 (0.0%) |
| Architecture & Engineering | 0 (0.0%) | 0 (0.0%) |
| Life, Physical & Social Science | 0 (0.0%) | 0 (0.0%) |
| Community & Social Service | 0 (0.0%) | 15 (100.0%) |
| Education, Arts & Media | 0 (0.0%) | 0 (0.0%) |
| Legal Services & Support | 0 (0.0%) | 0 (0.0%) |
| Education Instruction & Library | 0 (0.0%) | 15 (100.0%) |
| Arts, Media & Entertainment | 0 (0.0%) | 0 (0.0%) |
| Health Diagnosing & Treating | 0 (0.0%) | 0 (0.0%) |
| Health Technologists | 0 (0.0%) | 0 (0.0%) |
| Total (Category) | 19 (41.3%) | 27 (58.7%) |
| Total (Overall) | 83 (56.1%) | 65 (43.9%) |
Services Occupations
The most common Services occupations in Witmer are , and Food Preparation & Serving (17 | 11.5%).
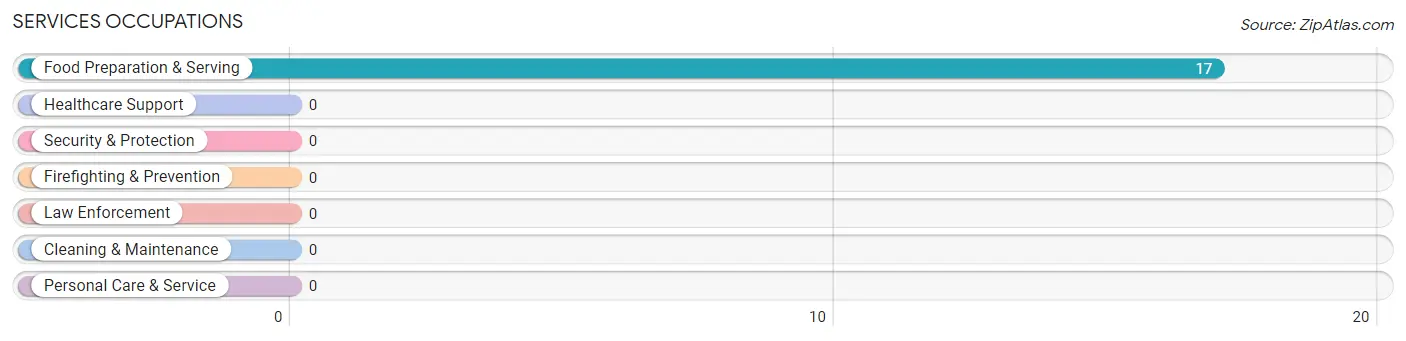
Services Occupations by Sex
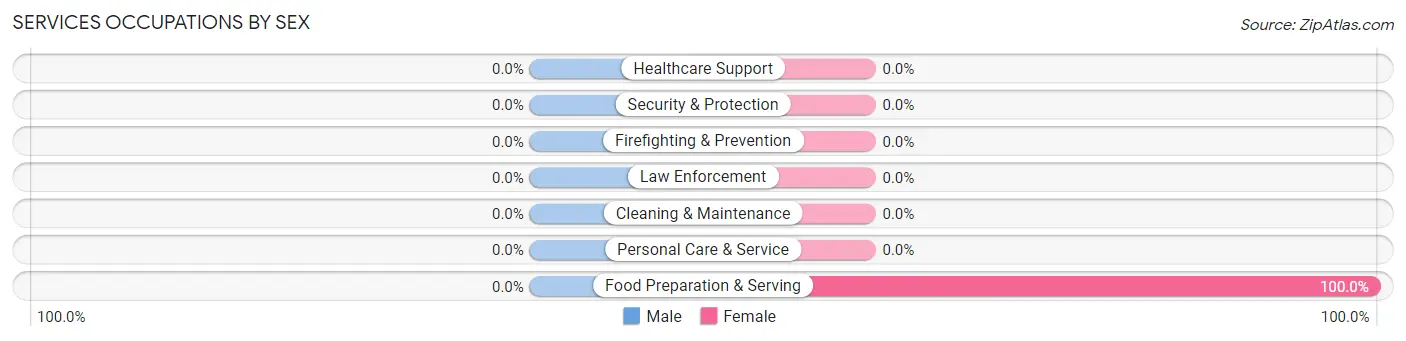
| Occupation | Male | Female |
| Healthcare Support | 0 (0.0%) | 0 (0.0%) |
| Security & Protection | 0 (0.0%) | 0 (0.0%) |
| Firefighting & Prevention | 0 (0.0%) | 0 (0.0%) |
| Law Enforcement | 0 (0.0%) | 0 (0.0%) |
| Food Preparation & Serving | 0 (0.0%) | 17 (100.0%) |
| Cleaning & Maintenance | 0 (0.0%) | 0 (0.0%) |
| Personal Care & Service | 0 (0.0%) | 0 (0.0%) |
| Total (Category) | 0 (0.0%) | 17 (100.0%) |
| Total (Overall) | 83 (56.1%) | 65 (43.9%) |
Sales and Office Occupations
The most common Sales and Office occupations in Witmer are Sales & Related (52 | 35.1%), and Office & Administration (21 | 14.2%).
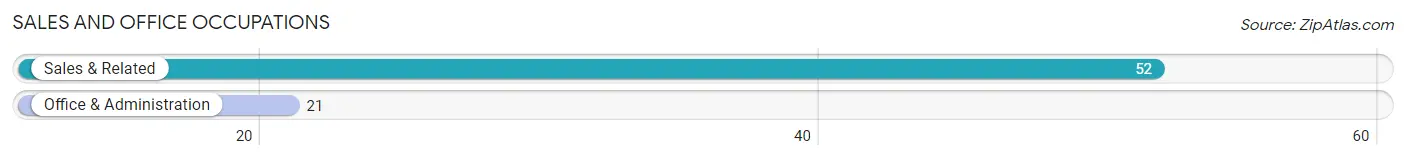
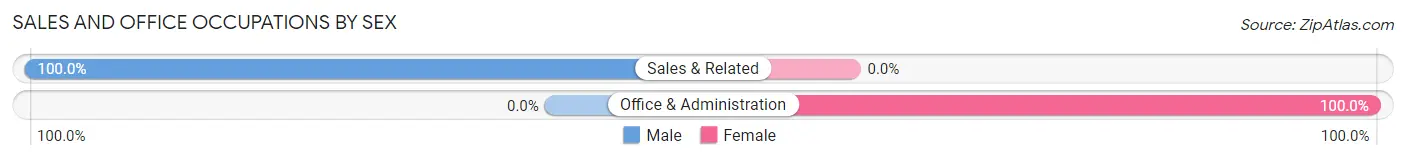
Sales and Office Occupations by Sex
| Occupation | Male | Female |
| Sales & Related | 52 (100.0%) | 0 (0.0%) |
| Office & Administration | 0 (0.0%) | 21 (100.0%) |
| Total (Category) | 52 (71.2%) | 21 (28.8%) |
| Total (Overall) | 83 (56.1%) | 65 (43.9%) |
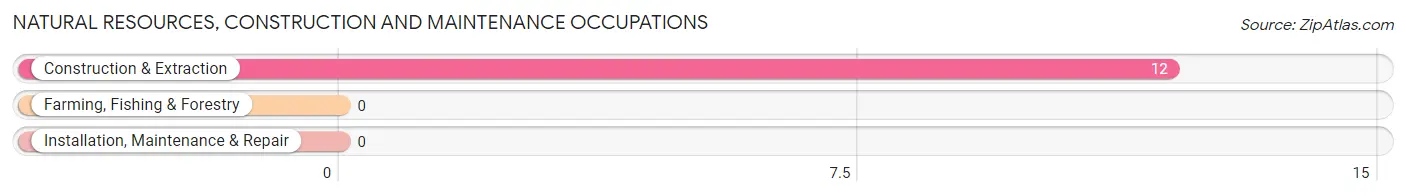
Natural Resources, Construction and Maintenance Occupations
The most common Natural Resources, Construction and Maintenance occupations in Witmer are , and Construction & Extraction (12 | 8.1%).
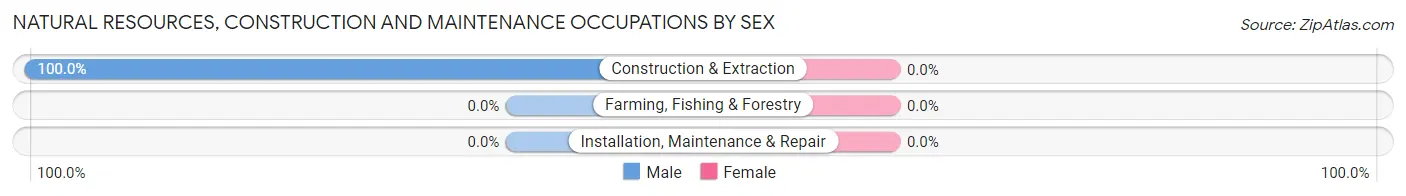
Natural Resources, Construction and Maintenance Occupations by Sex
| Occupation | Male | Female |
| Farming, Fishing & Forestry | 0 (0.0%) | 0 (0.0%) |
| Construction & Extraction | 12 (100.0%) | 0 (0.0%) |
| Installation, Maintenance & Repair | 0 (0.0%) | 0 (0.0%) |
| Total (Category) | 12 (100.0%) | 0 (0.0%) |
| Total (Overall) | 83 (56.1%) | 65 (43.9%) |
Production, Transportation and Moving Occupations
Production, Transportation and Moving Occupations by Sex
| Occupation | Male | Female |
| Production | 0 (0.0%) | 0 (0.0%) |
| Transportation | 0 (0.0%) | 0 (0.0%) |
| Material Moving | 0 (0.0%) | 0 (0.0%) |
| Total (Category) | 0 (0.0%) | 0 (0.0%) |
| Total (Overall) | 83 (56.1%) | 65 (43.9%) |
Employment Industries by Sex in Witmer
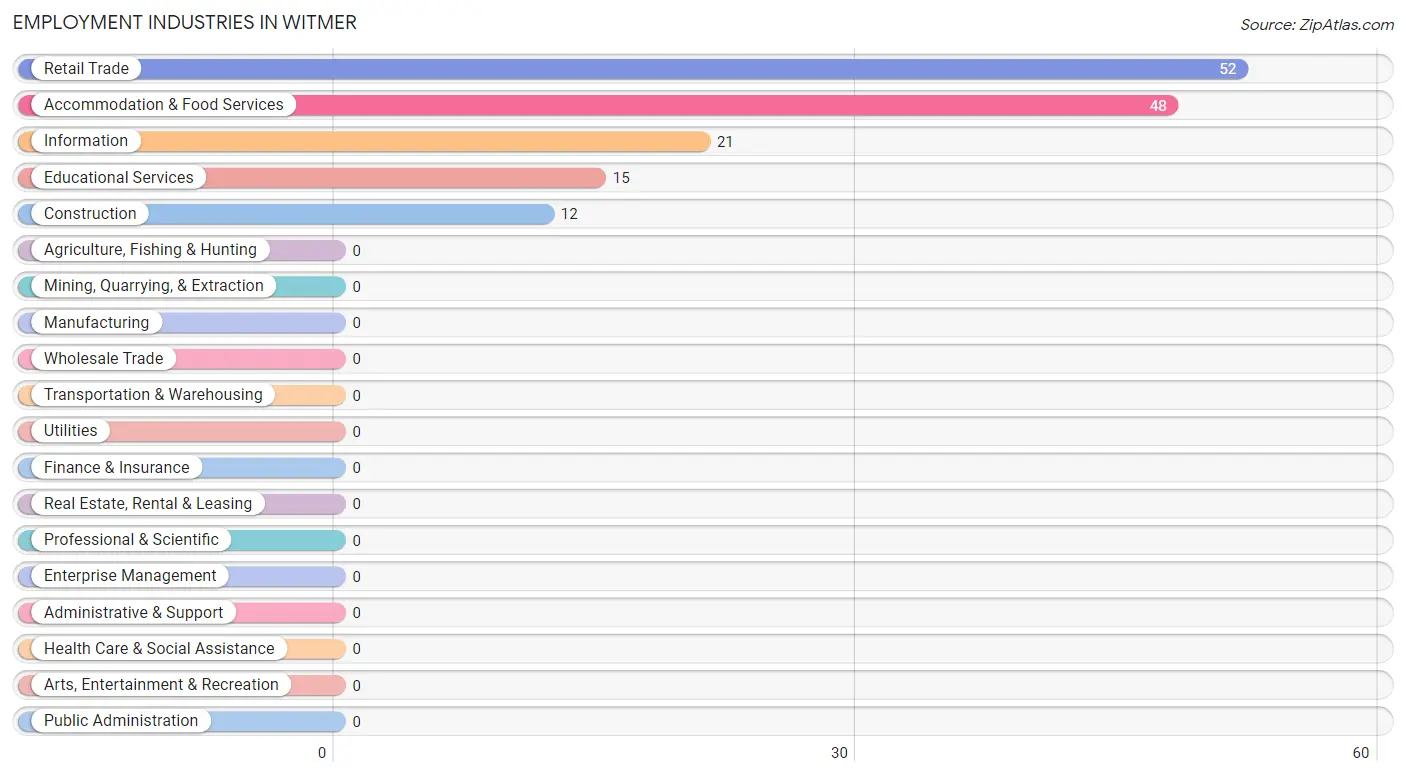
Employment Industries in Witmer
The major employment industries in Witmer include Retail Trade (52 | 35.1%), Accommodation & Food Services (48 | 32.4%), Information (21 | 14.2%), Educational Services (15 | 10.1%), and Construction (12 | 8.1%).
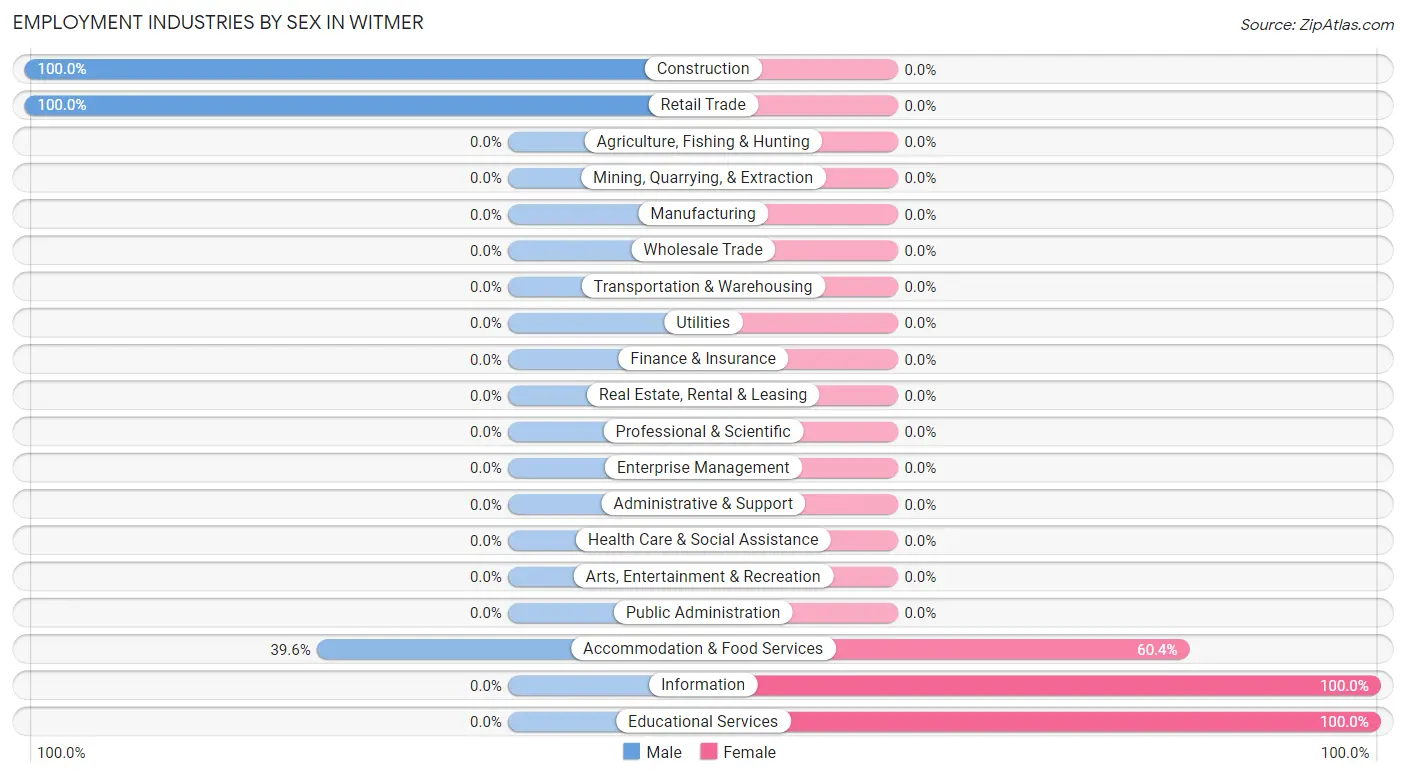
Employment Industries by Sex in Witmer
The Witmer industries that see more men than women are Construction (100.0%), Retail Trade (100.0%), and Accommodation & Food Services (39.6%), whereas the industries that tend to have a higher number of women are Information (100.0%), Educational Services (100.0%), and Accommodation & Food Services (60.4%).
| Industry | Male | Female |
| Agriculture, Fishing & Hunting | 0 (0.0%) | 0 (0.0%) |
| Mining, Quarrying, & Extraction | 0 (0.0%) | 0 (0.0%) |
| Construction | 12 (100.0%) | 0 (0.0%) |
| Manufacturing | 0 (0.0%) | 0 (0.0%) |
| Wholesale Trade | 0 (0.0%) | 0 (0.0%) |
| Retail Trade | 52 (100.0%) | 0 (0.0%) |
| Transportation & Warehousing | 0 (0.0%) | 0 (0.0%) |
| Utilities | 0 (0.0%) | 0 (0.0%) |
| Information | 0 (0.0%) | 21 (100.0%) |
| Finance & Insurance | 0 (0.0%) | 0 (0.0%) |
| Real Estate, Rental & Leasing | 0 (0.0%) | 0 (0.0%) |
| Professional & Scientific | 0 (0.0%) | 0 (0.0%) |
| Enterprise Management | 0 (0.0%) | 0 (0.0%) |
| Administrative & Support | 0 (0.0%) | 0 (0.0%) |
| Educational Services | 0 (0.0%) | 15 (100.0%) |
| Health Care & Social Assistance | 0 (0.0%) | 0 (0.0%) |
| Arts, Entertainment & Recreation | 0 (0.0%) | 0 (0.0%) |
| Accommodation & Food Services | 19 (39.6%) | 29 (60.4%) |
| Public Administration | 0 (0.0%) | 0 (0.0%) |
| Total | 83 (56.1%) | 65 (43.9%) |
Education in Witmer
School Enrollment in Witmer
The most common levels of schooling among the 38 students in Witmer are high school (14 | 36.8%), kindergarten (12 | 31.6%), and elementary school (12 | 31.6%).
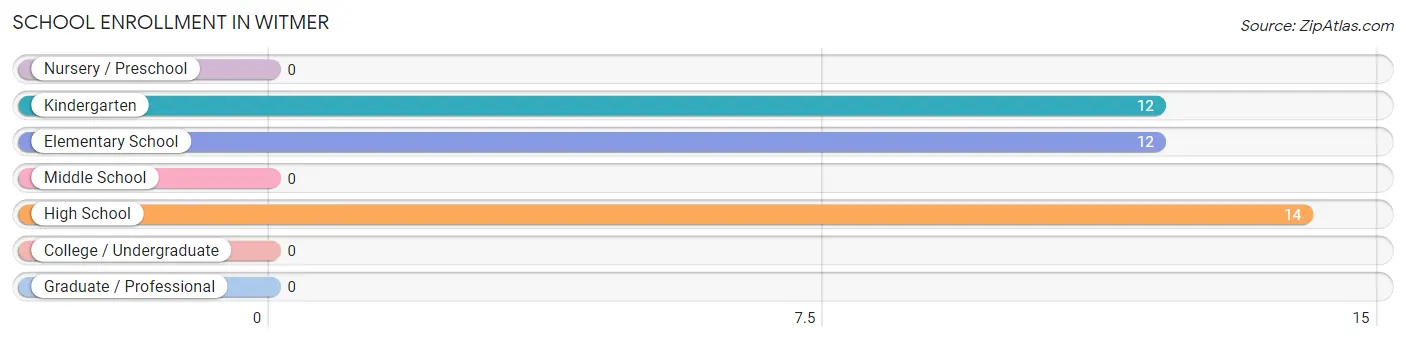
| School Level | # Students | % Students |
| Nursery / Preschool | 0 | 0.0% |
| Kindergarten | 12 | 31.6% |
| Elementary School | 12 | 31.6% |
| Middle School | 0 | 0.0% |
| High School | 14 | 36.8% |
| College / Undergraduate | 0 | 0.0% |
| Graduate / Professional | 0 | 0.0% |
| Total | 38 | 100.0% |
School Enrollment by Age by Funding Source in Witmer
Out of a total of 38 students who are enrolled in schools in Witmer, 24 (63.2%) attend a private institution, while the remaining 14 (36.8%) are enrolled in public schools. The age group of 5 to 9 year old has the highest likelihood of being enrolled in private schools, with 24 (100.0% in the age bracket) enrolled. Conversely, the age group of 15 to 17 year olds has the lowest likelihood of being enrolled in a private school, with 14 (100.0% in the age bracket) attending a public institution.
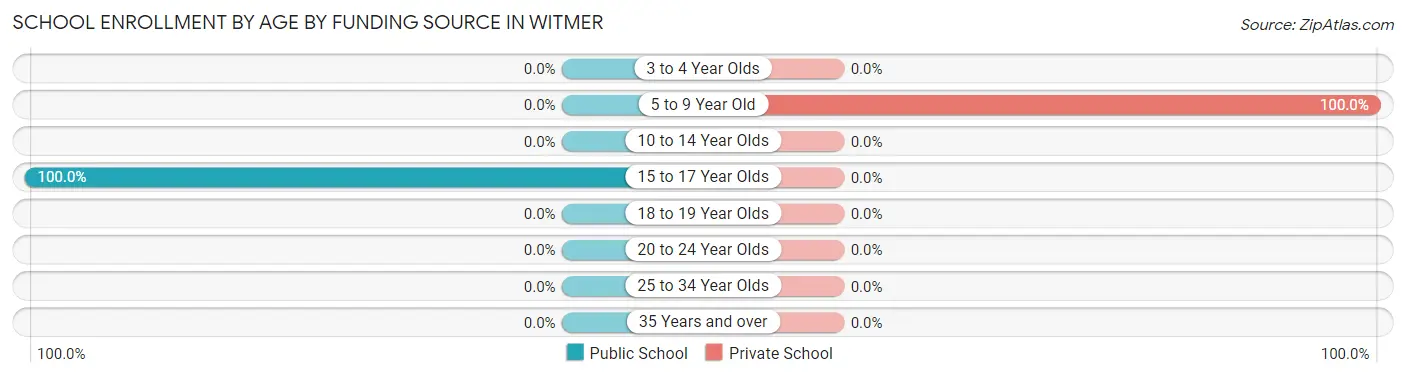
| Age Bracket | Public School | Private School |
| 3 to 4 Year Olds | 0 (0.0%) | 0 (0.0%) |
| 5 to 9 Year Old | 0 (0.0%) | 24 (100.0%) |
| 10 to 14 Year Olds | 0 (0.0%) | 0 (0.0%) |
| 15 to 17 Year Olds | 14 (100.0%) | 0 (0.0%) |
| 18 to 19 Year Olds | 0 (0.0%) | 0 (0.0%) |
| 20 to 24 Year Olds | 0 (0.0%) | 0 (0.0%) |
| 25 to 34 Year Olds | 0 (0.0%) | 0 (0.0%) |
| 35 Years and over | 0 (0.0%) | 0 (0.0%) |
| Total | 14 (36.8%) | 24 (63.2%) |
Educational Attainment by Field of Study in Witmer
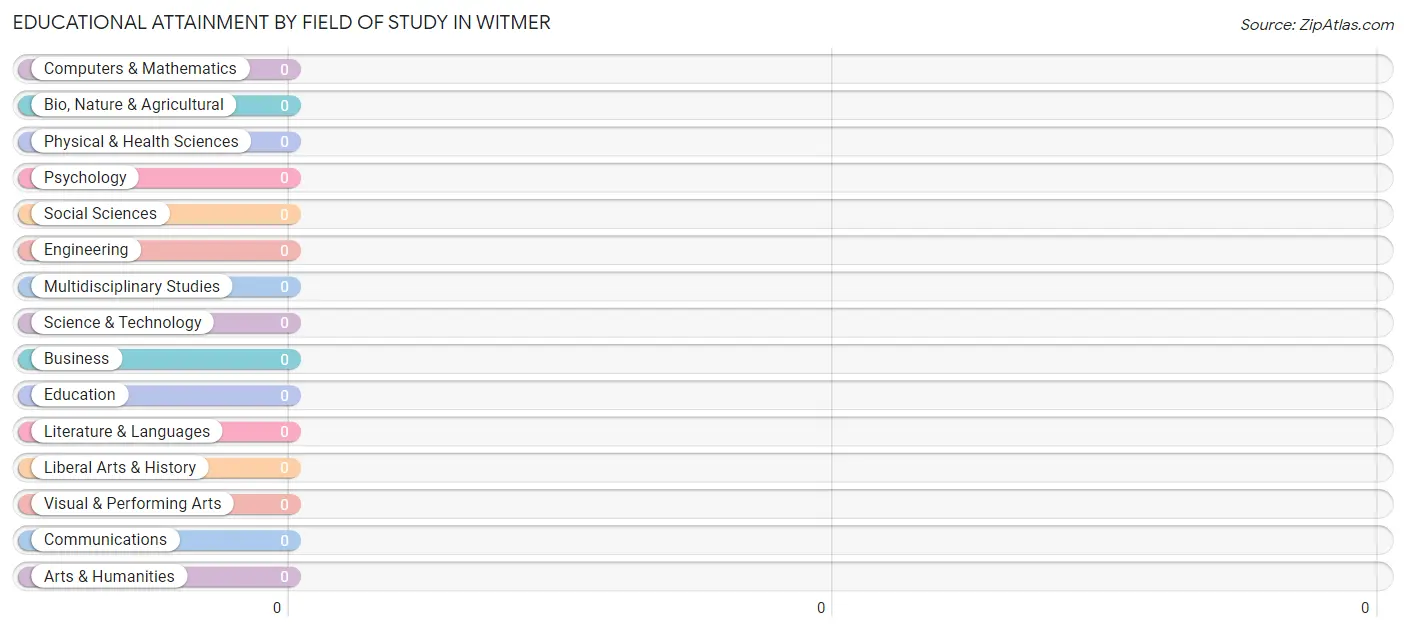
| Field of Study | # Graduates | % Graduates |
| Computers & Mathematics | 0 | 0.0% |
| Bio, Nature & Agricultural | 0 | 0.0% |
| Physical & Health Sciences | 0 | 0.0% |
| Psychology | 0 | 0.0% |
| Social Sciences | 0 | 0.0% |
| Engineering | 0 | 0.0% |
| Multidisciplinary Studies | 0 | 0.0% |
| Science & Technology | 0 | 0.0% |
| Business | 0 | 0.0% |
| Education | 0 | 0.0% |
| Literature & Languages | 0 | 0.0% |
| Liberal Arts & History | 0 | 0.0% |
| Visual & Performing Arts | 0 | 0.0% |
| Communications | 0 | 0.0% |
| Arts & Humanities | 0 | 0.0% |
| Total | 0 | 0.0% |
Transportation & Commute in Witmer
Vehicle Availability by Sex in Witmer
The most prevalent vehicle ownership categories in Witmer are males with 2 vehicles (57, accounting for 68.7%) and females with 2 vehicles (17, making up 87.7%).
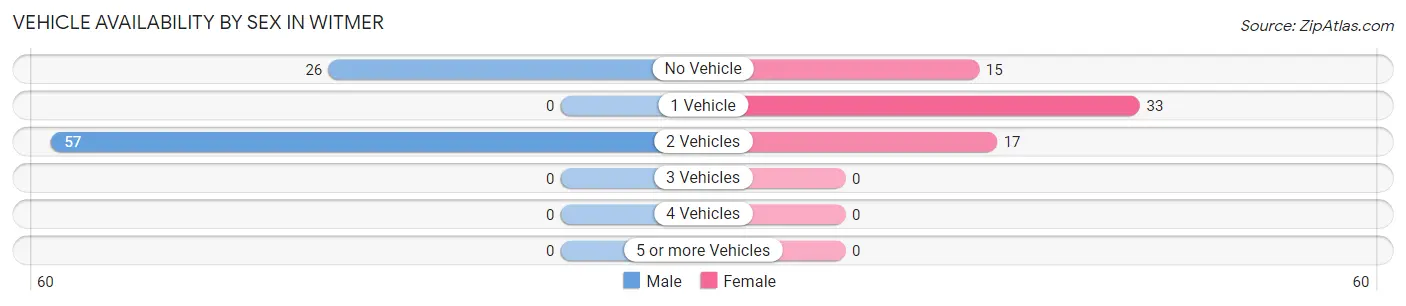
| Vehicles Available | Male | Female |
| No Vehicle | 26 (31.3%) | 15 (23.1%) |
| 1 Vehicle | 0 (0.0%) | 33 (50.8%) |
| 2 Vehicles | 57 (68.7%) | 17 (26.2%) |
| 3 Vehicles | 0 (0.0%) | 0 (0.0%) |
| 4 Vehicles | 0 (0.0%) | 0 (0.0%) |
| 5 or more Vehicles | 0 (0.0%) | 0 (0.0%) |
| Total | 83 (100.0%) | 65 (100.0%) |
Commute Time in Witmer
The most frequently occuring commute durations in Witmer are 15 to 19 minutes (81 commuters, 54.7%), 20 to 24 minutes (29 commuters, 19.6%), and 45 to 59 minutes (19 commuters, 12.8%).
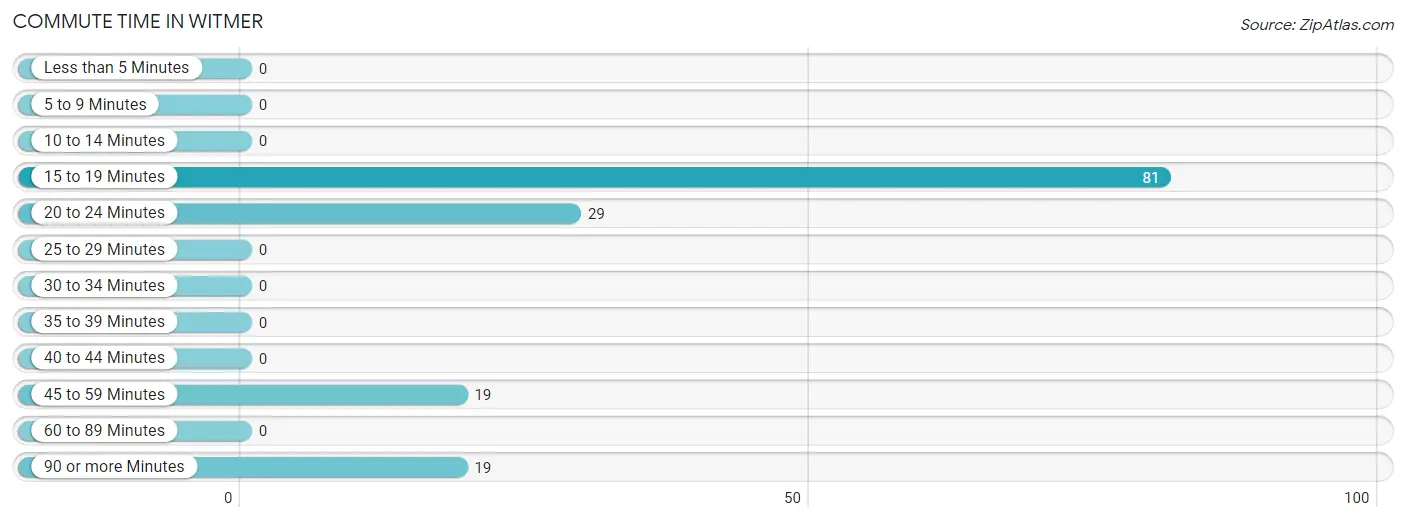
| Commute Time | # Commuters | % Commuters |
| Less than 5 Minutes | 0 | 0.0% |
| 5 to 9 Minutes | 0 | 0.0% |
| 10 to 14 Minutes | 0 | 0.0% |
| 15 to 19 Minutes | 81 | 54.7% |
| 20 to 24 Minutes | 29 | 19.6% |
| 25 to 29 Minutes | 0 | 0.0% |
| 30 to 34 Minutes | 0 | 0.0% |
| 35 to 39 Minutes | 0 | 0.0% |
| 40 to 44 Minutes | 0 | 0.0% |
| 45 to 59 Minutes | 19 | 12.8% |
| 60 to 89 Minutes | 0 | 0.0% |
| 90 or more Minutes | 19 | 12.8% |
Commute Time by Sex in Witmer
The most common commute times in Witmer are 15 to 19 minutes (31 commuters, 37.3%) for males and 15 to 19 minutes (50 commuters, 76.9%) for females.
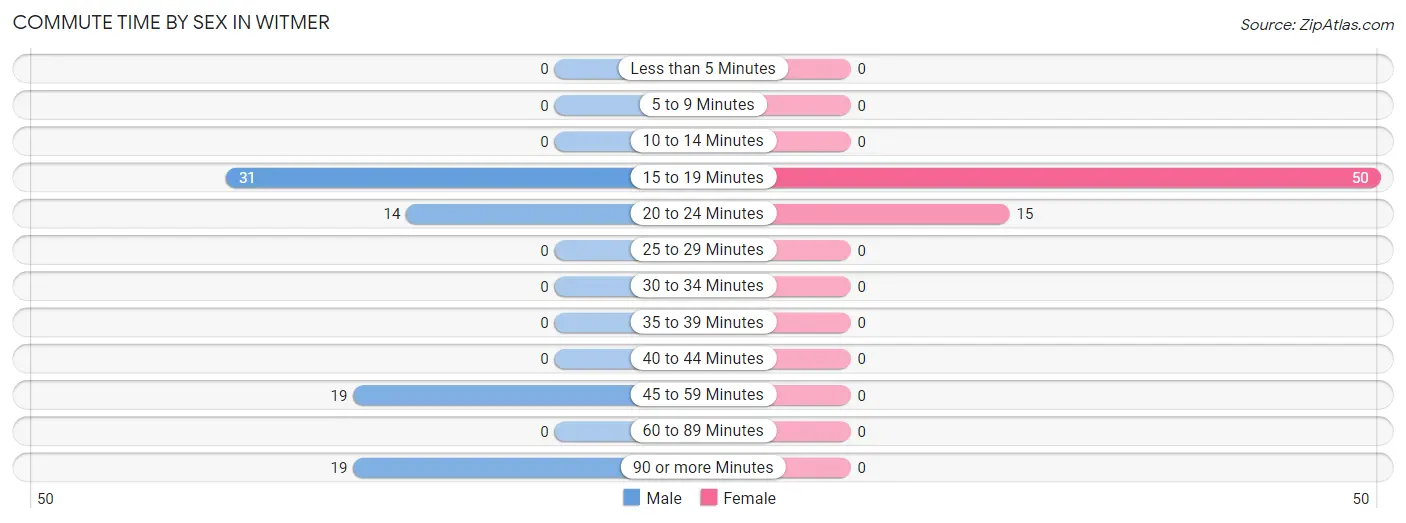
| Commute Time | Male | Female |
| Less than 5 Minutes | 0 (0.0%) | 0 (0.0%) |
| 5 to 9 Minutes | 0 (0.0%) | 0 (0.0%) |
| 10 to 14 Minutes | 0 (0.0%) | 0 (0.0%) |
| 15 to 19 Minutes | 31 (37.3%) | 50 (76.9%) |
| 20 to 24 Minutes | 14 (16.9%) | 15 (23.1%) |
| 25 to 29 Minutes | 0 (0.0%) | 0 (0.0%) |
| 30 to 34 Minutes | 0 (0.0%) | 0 (0.0%) |
| 35 to 39 Minutes | 0 (0.0%) | 0 (0.0%) |
| 40 to 44 Minutes | 0 (0.0%) | 0 (0.0%) |
| 45 to 59 Minutes | 19 (22.9%) | 0 (0.0%) |
| 60 to 89 Minutes | 0 (0.0%) | 0 (0.0%) |
| 90 or more Minutes | 19 (22.9%) | 0 (0.0%) |
Time of Departure to Work by Sex in Witmer
The most frequent times of departure to work in Witmer are 6:00 AM to 6:29 AM (26, 31.3%) for males and 10:00 AM to 10:59 AM (38, 58.5%) for females.
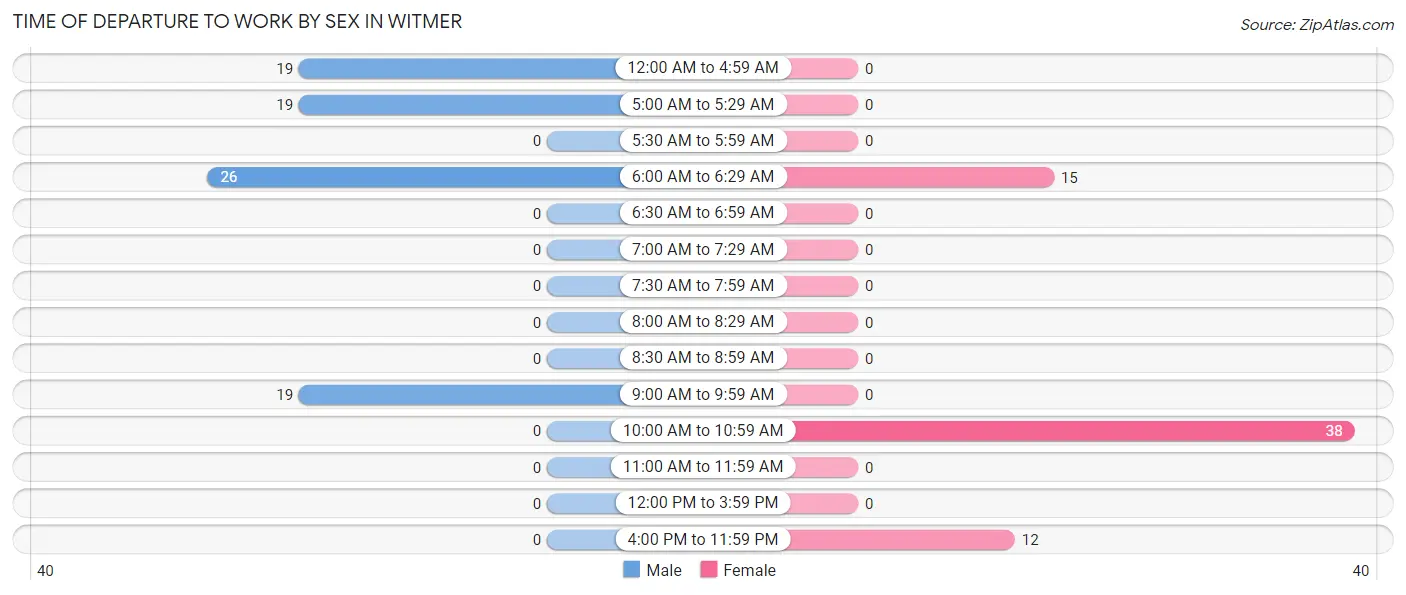
| Time of Departure | Male | Female |
| 12:00 AM to 4:59 AM | 19 (22.9%) | 0 (0.0%) |
| 5:00 AM to 5:29 AM | 19 (22.9%) | 0 (0.0%) |
| 5:30 AM to 5:59 AM | 0 (0.0%) | 0 (0.0%) |
| 6:00 AM to 6:29 AM | 26 (31.3%) | 15 (23.1%) |
| 6:30 AM to 6:59 AM | 0 (0.0%) | 0 (0.0%) |
| 7:00 AM to 7:29 AM | 0 (0.0%) | 0 (0.0%) |
| 7:30 AM to 7:59 AM | 0 (0.0%) | 0 (0.0%) |
| 8:00 AM to 8:29 AM | 0 (0.0%) | 0 (0.0%) |
| 8:30 AM to 8:59 AM | 0 (0.0%) | 0 (0.0%) |
| 9:00 AM to 9:59 AM | 19 (22.9%) | 0 (0.0%) |
| 10:00 AM to 10:59 AM | 0 (0.0%) | 38 (58.5%) |
| 11:00 AM to 11:59 AM | 0 (0.0%) | 0 (0.0%) |
| 12:00 PM to 3:59 PM | 0 (0.0%) | 0 (0.0%) |
| 4:00 PM to 11:59 PM | 0 (0.0%) | 12 (18.5%) |
| Total | 83 (100.0%) | 65 (100.0%) |
Housing Occupancy in Witmer
Occupancy by Ownership in Witmer
Of the total 82 dwellings in Witmer, owner-occupied units account for 82 (100.0%), while renter-occupied units make up 0 (0.0%).
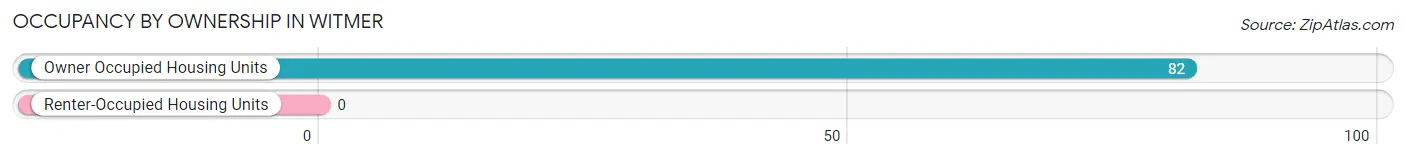
| Occupancy | # Housing Units | % Housing Units |
| Owner Occupied Housing Units | 82 | 100.0% |
| Renter-Occupied Housing Units | 0 | 0.0% |
| Total Occupied Housing Units | 82 | 100.0% |
Occupancy by Household Size in Witmer
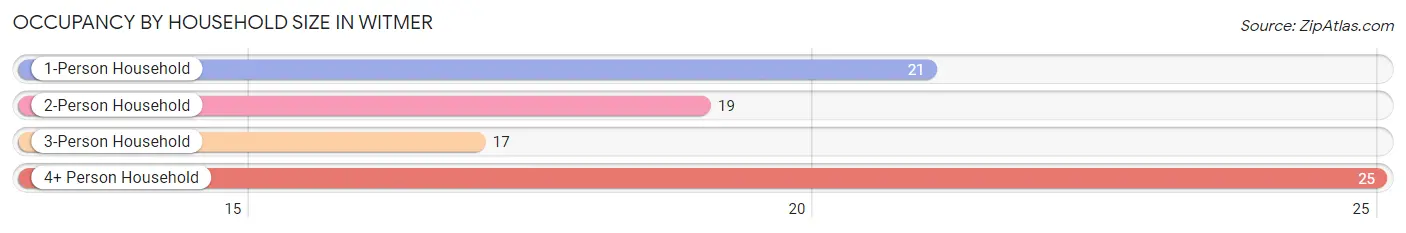
| Household Size | # Housing Units | % Housing Units |
| 1-Person Household | 21 | 25.6% |
| 2-Person Household | 19 | 23.2% |
| 3-Person Household | 17 | 20.7% |
| 4+ Person Household | 25 | 30.5% |
| Total Housing Units | 82 | 100.0% |
Occupancy by Ownership by Household Size in Witmer
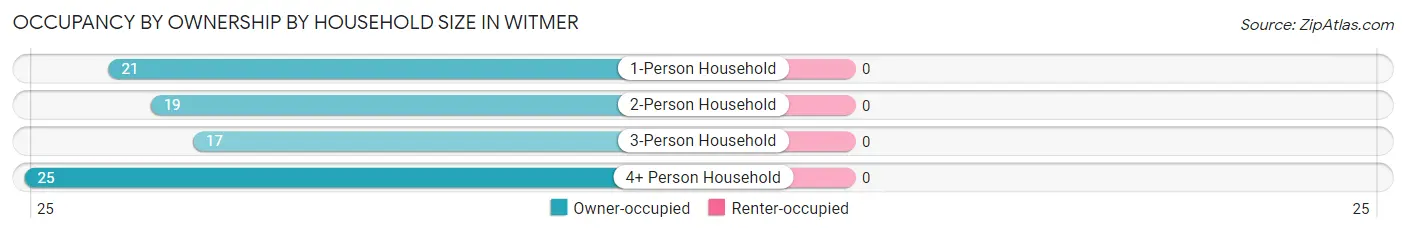
| Household Size | Owner-occupied | Renter-occupied |
| 1-Person Household | 21 (100.0%) | 0 (0.0%) |
| 2-Person Household | 19 (100.0%) | 0 (0.0%) |
| 3-Person Household | 17 (100.0%) | 0 (0.0%) |
| 4+ Person Household | 25 (100.0%) | 0 (0.0%) |
| Total Housing Units | 82 (100.0%) | 0 (0.0%) |
Occupancy by Educational Attainment in Witmer
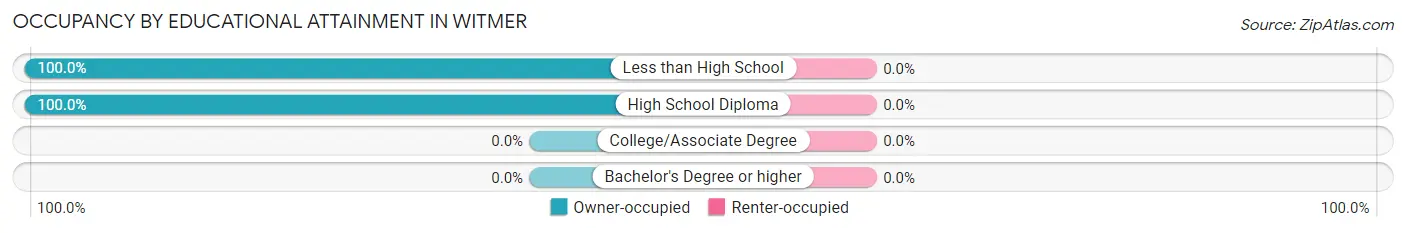
| Household Size | Owner-occupied | Renter-occupied |
| Less than High School | 12 (100.0%) | 0 (0.0%) |
| High School Diploma | 70 (100.0%) | 0 (0.0%) |
| College/Associate Degree | 0 (0.0%) | 0 (0.0%) |
| Bachelor's Degree or higher | 0 (0.0%) | 0 (0.0%) |
Occupancy by Age of Householder in Witmer
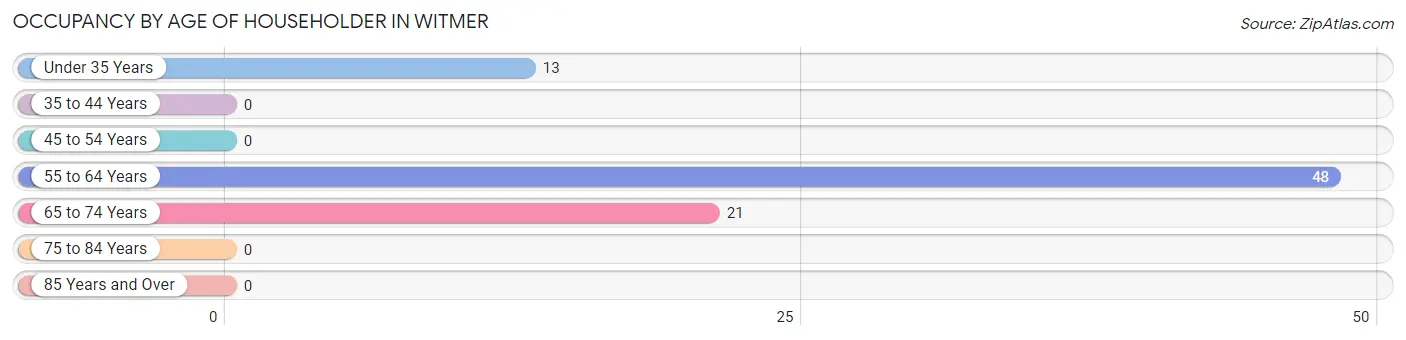
| Age Bracket | # Households | % Households |
| Under 35 Years | 13 | 15.9% |
| 35 to 44 Years | 0 | 0.0% |
| 45 to 54 Years | 0 | 0.0% |
| 55 to 64 Years | 48 | 58.5% |
| 65 to 74 Years | 21 | 25.6% |
| 75 to 84 Years | 0 | 0.0% |
| 85 Years and Over | 0 | 0.0% |
| Total | 82 | 100.0% |
Housing Finances in Witmer
Median Income by Occupancy in Witmer
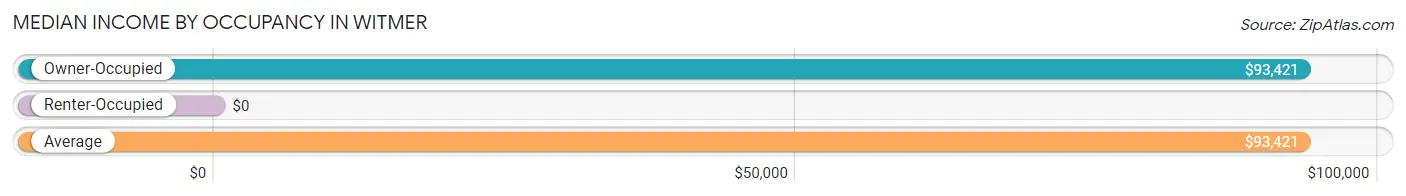
| Occupancy Type | # Households | Median Income |
| Owner-Occupied | 82 (100.0%) | $93,421 |
| Renter-Occupied | 0 (0.0%) | $0 |
| Average | 82 (100.0%) | $93,421 |
Occupancy by Householder Income Bracket in Witmer
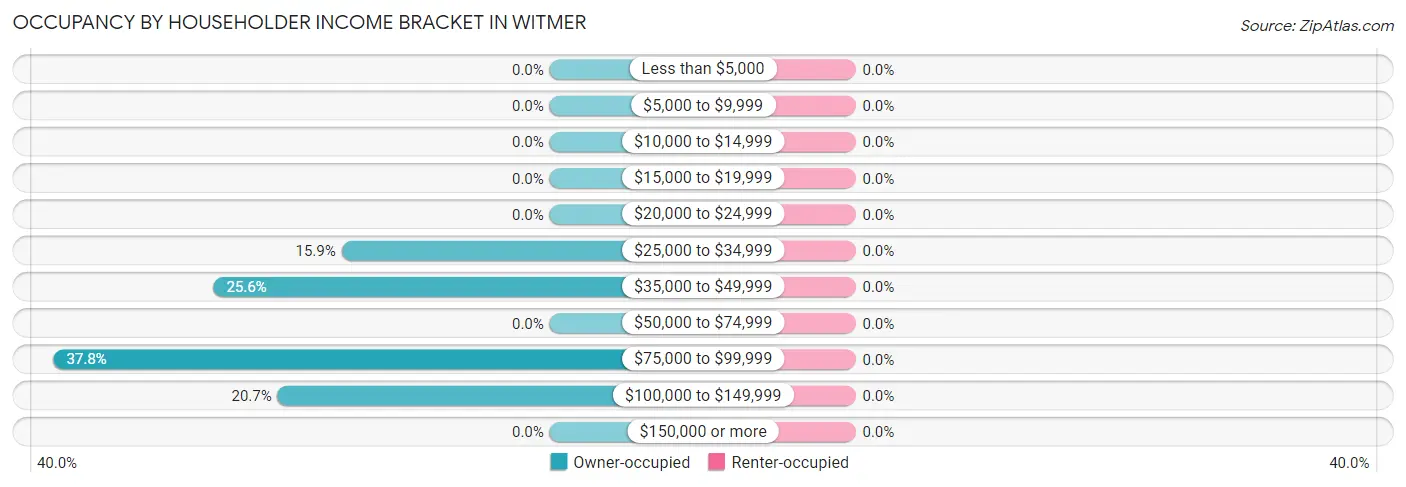
| Income Bracket | Owner-occupied | Renter-occupied |
| Less than $5,000 | 0 (0.0%) | 0 (0.0%) |
| $5,000 to $9,999 | 0 (0.0%) | 0 (0.0%) |
| $10,000 to $14,999 | 0 (0.0%) | 0 (0.0%) |
| $15,000 to $19,999 | 0 (0.0%) | 0 (0.0%) |
| $20,000 to $24,999 | 0 (0.0%) | 0 (0.0%) |
| $25,000 to $34,999 | 13 (15.9%) | 0 (0.0%) |
| $35,000 to $49,999 | 21 (25.6%) | 0 (0.0%) |
| $50,000 to $74,999 | 0 (0.0%) | 0 (0.0%) |
| $75,000 to $99,999 | 31 (37.8%) | 0 (0.0%) |
| $100,000 to $149,999 | 17 (20.7%) | 0 (0.0%) |
| $150,000 or more | 0 (0.0%) | 0 (0.0%) |
| Total | 82 (100.0%) | 0 (0.0%) |
Monthly Housing Cost Tiers in Witmer
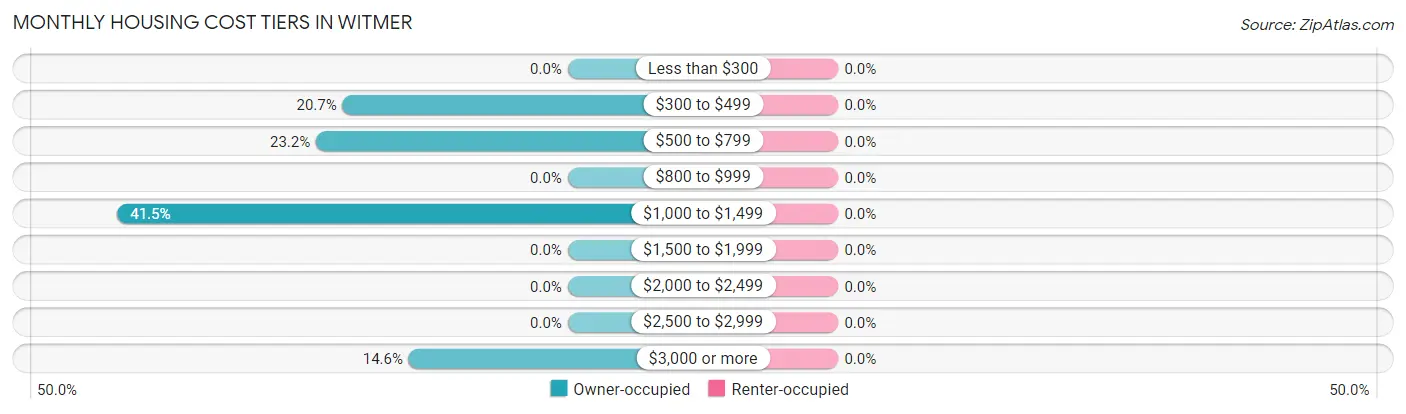
| Monthly Cost | Owner-occupied | Renter-occupied |
| Less than $300 | 0 (0.0%) | 0 (0.0%) |
| $300 to $499 | 17 (20.7%) | 0 (0.0%) |
| $500 to $799 | 19 (23.2%) | 0 (0.0%) |
| $800 to $999 | 0 (0.0%) | 0 (0.0%) |
| $1,000 to $1,499 | 34 (41.5%) | 0 (0.0%) |
| $1,500 to $1,999 | 0 (0.0%) | 0 (0.0%) |
| $2,000 to $2,499 | 0 (0.0%) | 0 (0.0%) |
| $2,500 to $2,999 | 0 (0.0%) | 0 (0.0%) |
| $3,000 or more | 12 (14.6%) | 0 (0.0%) |
| Total | 82 (100.0%) | 0 (0.0%) |
Physical Housing Characteristics in Witmer
Housing Structures in Witmer
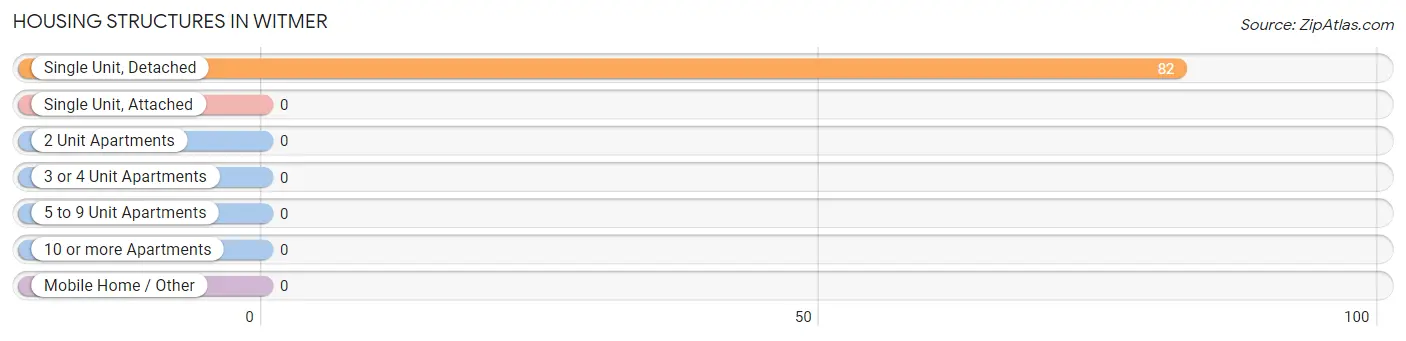
| Structure Type | # Housing Units | % Housing Units |
| Single Unit, Detached | 82 | 100.0% |
| Single Unit, Attached | 0 | 0.0% |
| 2 Unit Apartments | 0 | 0.0% |
| 3 or 4 Unit Apartments | 0 | 0.0% |
| 5 to 9 Unit Apartments | 0 | 0.0% |
| 10 or more Apartments | 0 | 0.0% |
| Mobile Home / Other | 0 | 0.0% |
| Total | 82 | 100.0% |
Housing Structures by Occupancy in Witmer
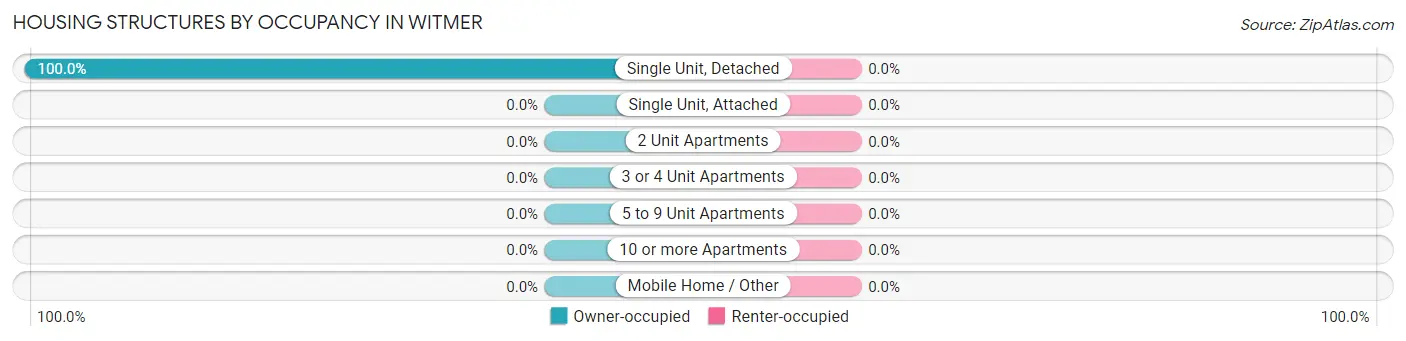
| Structure Type | Owner-occupied | Renter-occupied |
| Single Unit, Detached | 82 (100.0%) | 0 (0.0%) |
| Single Unit, Attached | 0 (0.0%) | 0 (0.0%) |
| 2 Unit Apartments | 0 (0.0%) | 0 (0.0%) |
| 3 or 4 Unit Apartments | 0 (0.0%) | 0 (0.0%) |
| 5 to 9 Unit Apartments | 0 (0.0%) | 0 (0.0%) |
| 10 or more Apartments | 0 (0.0%) | 0 (0.0%) |
| Mobile Home / Other | 0 (0.0%) | 0 (0.0%) |
| Total | 82 (100.0%) | 0 (0.0%) |
Housing Structures by Number of Rooms in Witmer
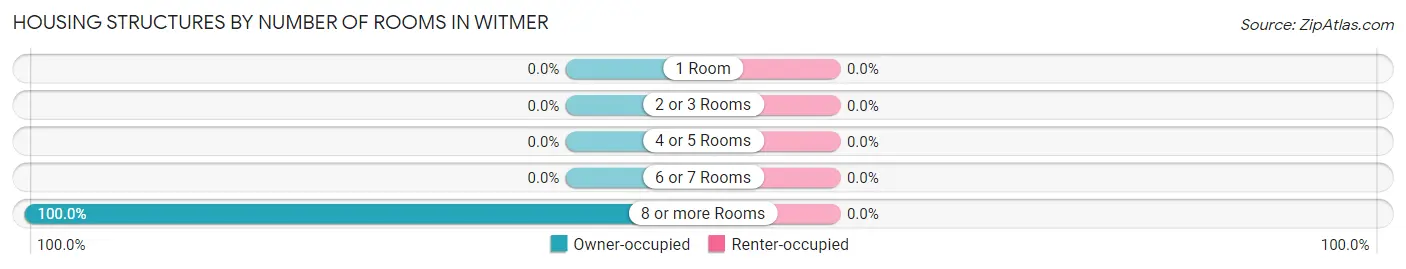
| Number of Rooms | Owner-occupied | Renter-occupied |
| 1 Room | 0 (0.0%) | 0 (0.0%) |
| 2 or 3 Rooms | 0 (0.0%) | 0 (0.0%) |
| 4 or 5 Rooms | 0 (0.0%) | 0 (0.0%) |
| 6 or 7 Rooms | 0 (0.0%) | 0 (0.0%) |
| 8 or more Rooms | 82 (100.0%) | 0 (0.0%) |
| Total | 82 (100.0%) | 0 (0.0%) |
Housing Structure by Heating Type in Witmer
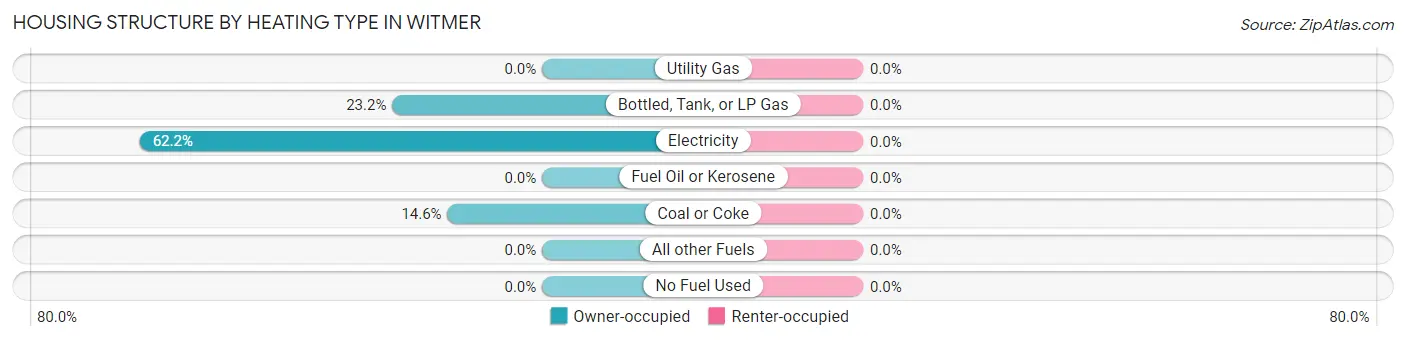
| Heating Type | Owner-occupied | Renter-occupied |
| Utility Gas | 0 (0.0%) | 0 (0.0%) |
| Bottled, Tank, or LP Gas | 19 (23.2%) | 0 (0.0%) |
| Electricity | 51 (62.2%) | 0 (0.0%) |
| Fuel Oil or Kerosene | 0 (0.0%) | 0 (0.0%) |
| Coal or Coke | 12 (14.6%) | 0 (0.0%) |
| All other Fuels | 0 (0.0%) | 0 (0.0%) |
| No Fuel Used | 0 (0.0%) | 0 (0.0%) |
| Total | 82 (100.0%) | 0 (0.0%) |
Household Vehicle Usage in Witmer
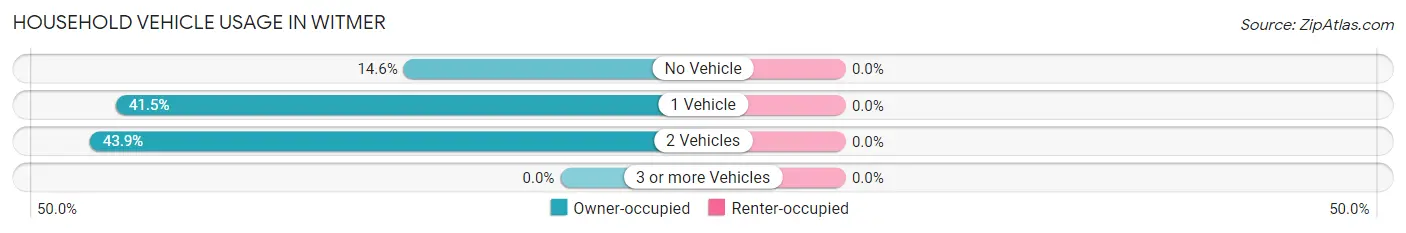
| Vehicles per Household | Owner-occupied | Renter-occupied |
| No Vehicle | 12 (14.6%) | 0 (0.0%) |
| 1 Vehicle | 34 (41.5%) | 0 (0.0%) |
| 2 Vehicles | 36 (43.9%) | 0 (0.0%) |
| 3 or more Vehicles | 0 (0.0%) | 0 (0.0%) |
| Total | 82 (100.0%) | 0 (0.0%) |
Real Estate & Mortgages in Witmer
Real Estate and Mortgage Overview in Witmer
| Characteristic | Without Mortgage | With Mortgage |
| Housing Units | 36 | 46 |
| Median Property Value | - | - |
| Median Household Income | - | - |
| Monthly Housing Costs | - | - |
| Real Estate Taxes | - | - |
Property Value by Mortgage Status in Witmer
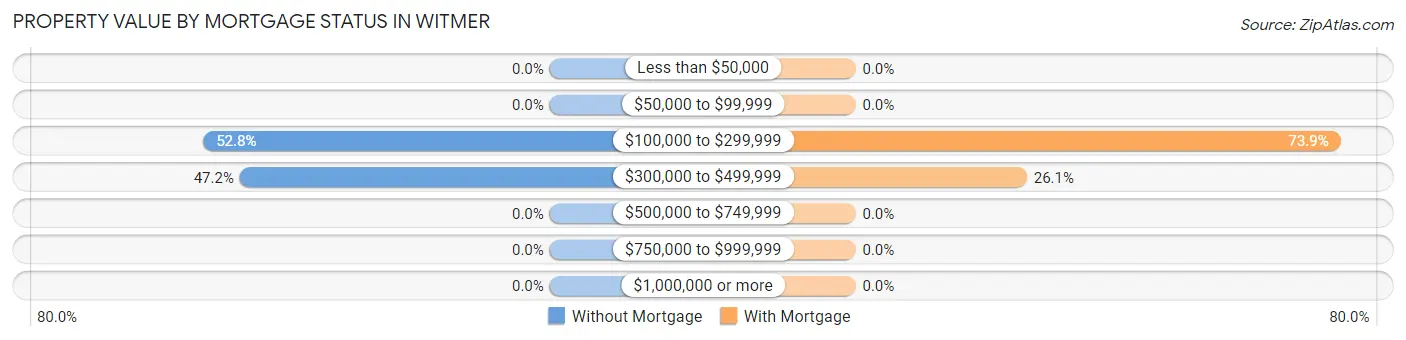
| Property Value | Without Mortgage | With Mortgage |
| Less than $50,000 | 0 (0.0%) | 0 (0.0%) |
| $50,000 to $99,999 | 0 (0.0%) | 0 (0.0%) |
| $100,000 to $299,999 | 19 (52.8%) | 34 (73.9%) |
| $300,000 to $499,999 | 17 (47.2%) | 12 (26.1%) |
| $500,000 to $749,999 | 0 (0.0%) | 0 (0.0%) |
| $750,000 to $999,999 | 0 (0.0%) | 0 (0.0%) |
| $1,000,000 or more | 0 (0.0%) | 0 (0.0%) |
| Total | 36 (100.0%) | 46 (100.0%) |
Household Income by Mortgage Status in Witmer
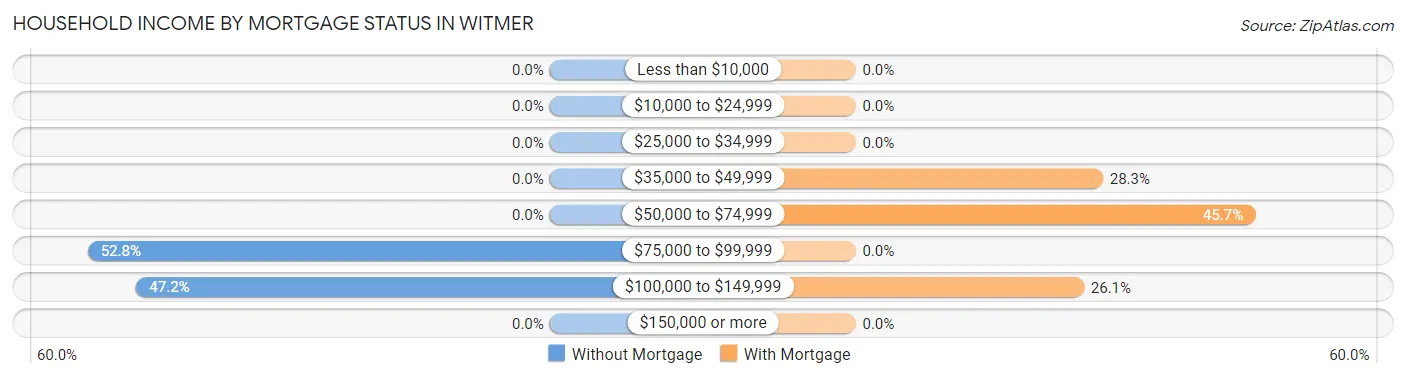
| Household Income | Without Mortgage | With Mortgage |
| Less than $10,000 | 0 (0.0%) | 0 (0.0%) |
| $10,000 to $24,999 | 0 (0.0%) | 0 (0.0%) |
| $25,000 to $34,999 | 0 (0.0%) | 0 (0.0%) |
| $35,000 to $49,999 | 0 (0.0%) | 13 (28.3%) |
| $50,000 to $74,999 | 0 (0.0%) | 21 (45.7%) |
| $75,000 to $99,999 | 19 (52.8%) | 0 (0.0%) |
| $100,000 to $149,999 | 17 (47.2%) | 12 (26.1%) |
| $150,000 or more | 0 (0.0%) | 0 (0.0%) |
| Total | 36 (100.0%) | 46 (100.0%) |
Property Value to Household Income Ratio in Witmer
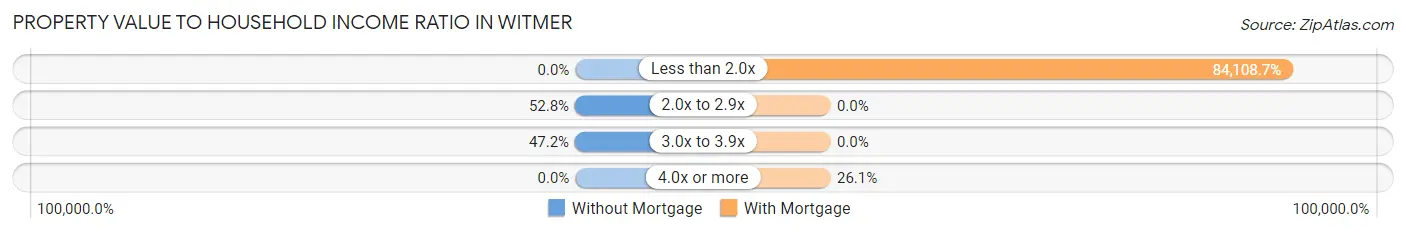
| Value-to-Income Ratio | Without Mortgage | With Mortgage |
| Less than 2.0x | 0 (0.0%) | 38,690 (84,108.7%) |
| 2.0x to 2.9x | 19 (52.8%) | 0 (0.0%) |
| 3.0x to 3.9x | 17 (47.2%) | 0 (0.0%) |
| 4.0x or more | 0 (0.0%) | 12 (26.1%) |
| Total | 36 (100.0%) | 46 (100.0%) |
Real Estate Taxes by Mortgage Status in Witmer
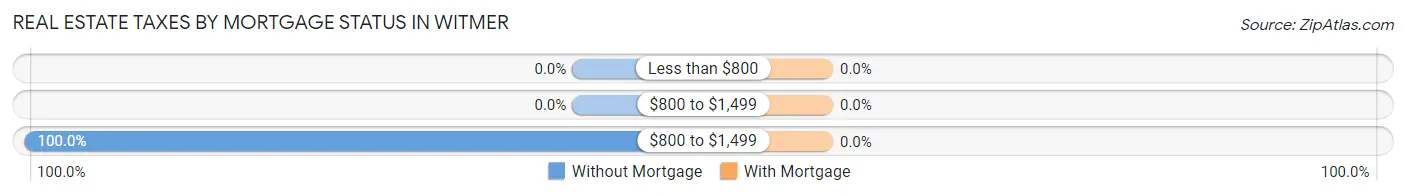
| Property Taxes | Without Mortgage | With Mortgage |
| Less than $800 | 0 (0.0%) | 0 (0.0%) |
| $800 to $1,499 | 0 (0.0%) | 0 (0.0%) |
| $800 to $1,499 | 36 (100.0%) | 0 (0.0%) |
| Total | 36 (100.0%) | 46 (100.0%) |
Health & Disability in Witmer
Health Insurance Coverage by Age in Witmer
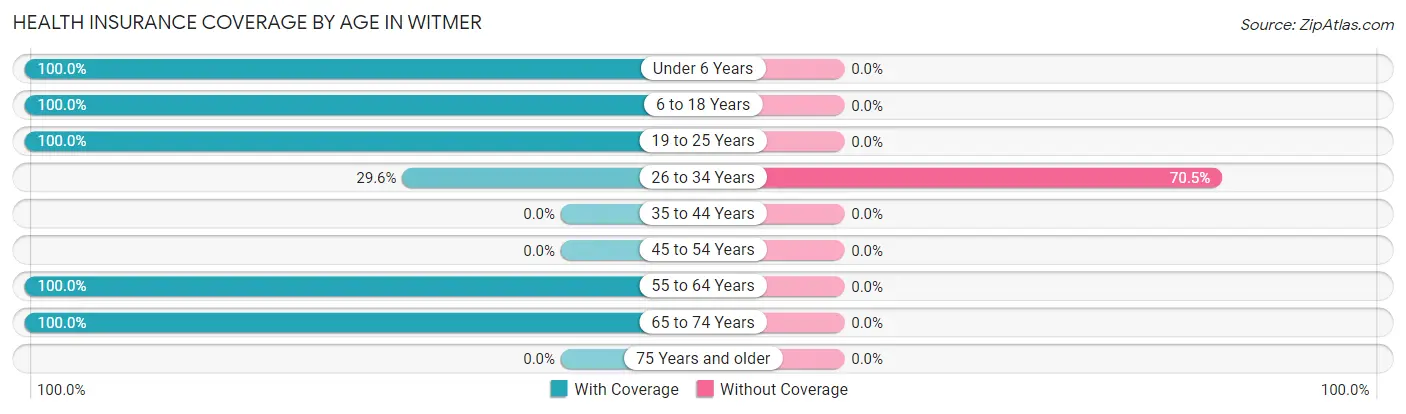
| Age Bracket | With Coverage | Without Coverage |
| Under 6 Years | 36 (100.0%) | 0 (0.0%) |
| 6 to 18 Years | 41 (100.0%) | 0 (0.0%) |
| 19 to 25 Years | 3 (100.0%) | 0 (0.0%) |
| 26 to 34 Years | 13 (29.5%) | 31 (70.5%) |
| 35 to 44 Years | 0 (0.0%) | 0 (0.0%) |
| 45 to 54 Years | 0 (0.0%) | 0 (0.0%) |
| 55 to 64 Years | 102 (100.0%) | 0 (0.0%) |
| 65 to 74 Years | 21 (100.0%) | 0 (0.0%) |
| 75 Years and older | 0 (0.0%) | 0 (0.0%) |
| Total | 216 (87.5%) | 31 (12.6%) |
Health Insurance Coverage by Citizenship Status in Witmer
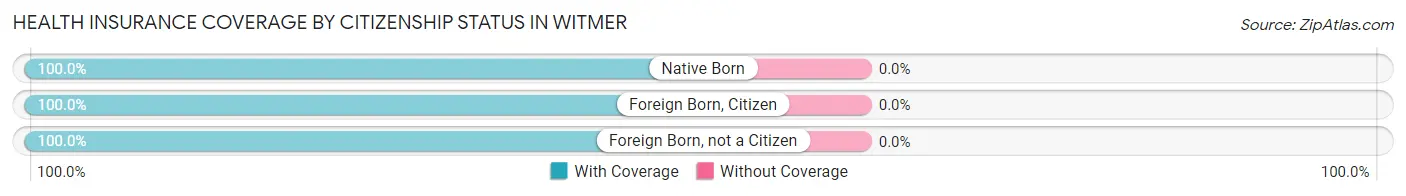
| Citizenship Status | With Coverage | Without Coverage |
| Native Born | 36 (100.0%) | 0 (0.0%) |
| Foreign Born, Citizen | 41 (100.0%) | 0 (0.0%) |
| Foreign Born, not a Citizen | 3 (100.0%) | 0 (0.0%) |
Health Insurance Coverage by Household Income in Witmer
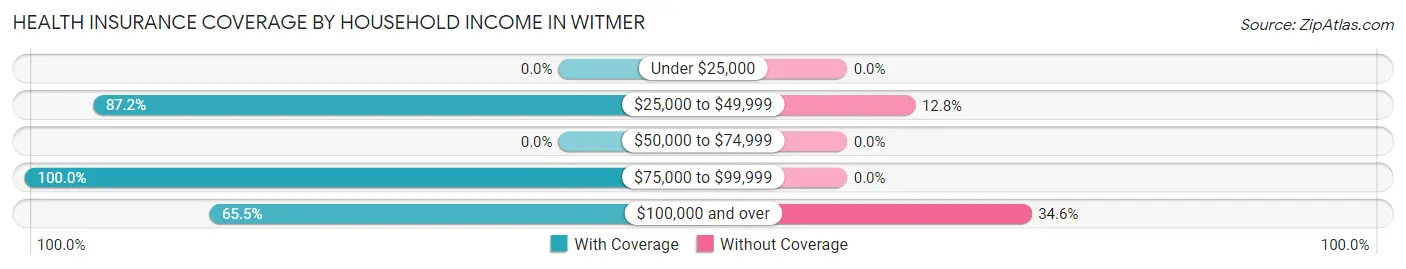
| Household Income | With Coverage | Without Coverage |
| Under $25,000 | 0 (0.0%) | 0 (0.0%) |
| $25,000 to $49,999 | 82 (87.2%) | 12 (12.8%) |
| $50,000 to $74,999 | 0 (0.0%) | 0 (0.0%) |
| $75,000 to $99,999 | 92 (100.0%) | 0 (0.0%) |
| $100,000 and over | 36 (65.4%) | 19 (34.5%) |
Public vs Private Health Insurance Coverage by Age in Witmer
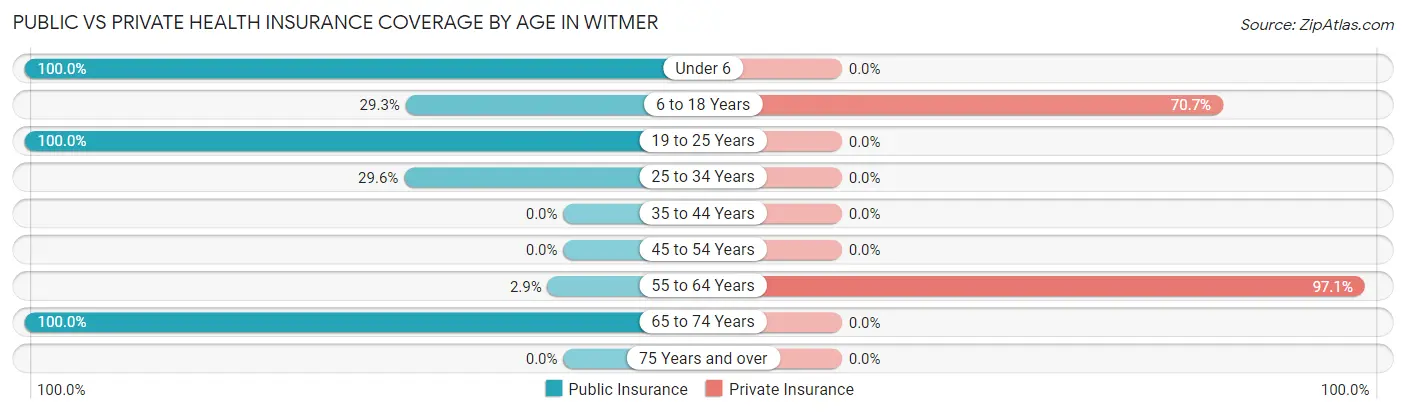
| Age Bracket | Public Insurance | Private Insurance |
| Under 6 | 36 (100.0%) | 0 (0.0%) |
| 6 to 18 Years | 12 (29.3%) | 29 (70.7%) |
| 19 to 25 Years | 3 (100.0%) | 0 (0.0%) |
| 25 to 34 Years | 13 (29.5%) | 0 (0.0%) |
| 35 to 44 Years | 0 (0.0%) | 0 (0.0%) |
| 45 to 54 Years | 0 (0.0%) | 0 (0.0%) |
| 55 to 64 Years | 3 (2.9%) | 99 (97.1%) |
| 65 to 74 Years | 21 (100.0%) | 0 (0.0%) |
| 75 Years and over | 0 (0.0%) | 0 (0.0%) |
| Total | 88 (35.6%) | 128 (51.8%) |
Disability Status by Sex by Age in Witmer
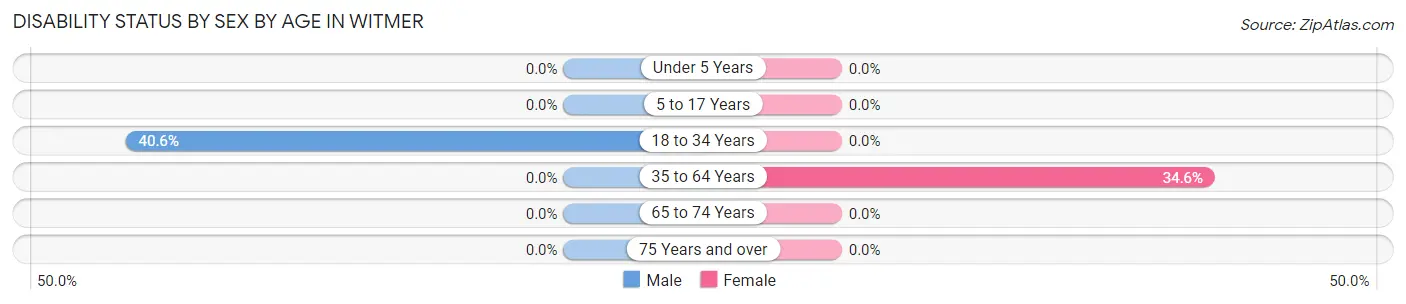
| Age Bracket | Male | Female |
| Under 5 Years | 0 (0.0%) | 0 (0.0%) |
| 5 to 17 Years | 0 (0.0%) | 0 (0.0%) |
| 18 to 34 Years | 13 (40.6%) | 0 (0.0%) |
| 35 to 64 Years | 0 (0.0%) | 18 (34.6%) |
| 65 to 74 Years | 0 (0.0%) | 0 (0.0%) |
| 75 Years and over | 0 (0.0%) | 0 (0.0%) |
Disability Class by Sex by Age in Witmer
Disability Class: Hearing Difficulty
| Age Bracket | Male | Female |
| Under 5 Years | 0 (0.0%) | 0 (0.0%) |
| 5 to 17 Years | 0 (0.0%) | 0 (0.0%) |
| 18 to 34 Years | 0 (0.0%) | 0 (0.0%) |
| 35 to 64 Years | 0 (0.0%) | 0 (0.0%) |
| 65 to 74 Years | 0 (0.0%) | 0 (0.0%) |
| 75 Years and over | 0 (0.0%) | 0 (0.0%) |
Disability Class: Vision Difficulty
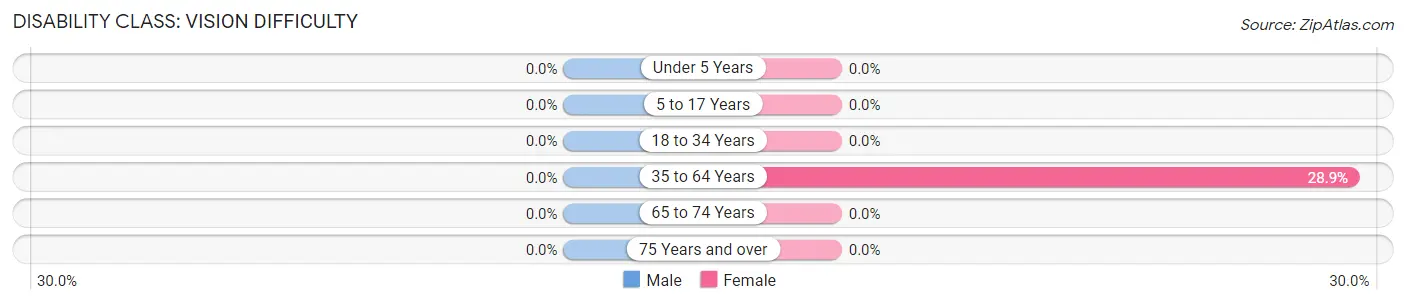
| Age Bracket | Male | Female |
| Under 5 Years | 0 (0.0%) | 0 (0.0%) |
| 5 to 17 Years | 0 (0.0%) | 0 (0.0%) |
| 18 to 34 Years | 0 (0.0%) | 0 (0.0%) |
| 35 to 64 Years | 0 (0.0%) | 15 (28.8%) |
| 65 to 74 Years | 0 (0.0%) | 0 (0.0%) |
| 75 Years and over | 0 (0.0%) | 0 (0.0%) |
Disability Class: Cognitive Difficulty
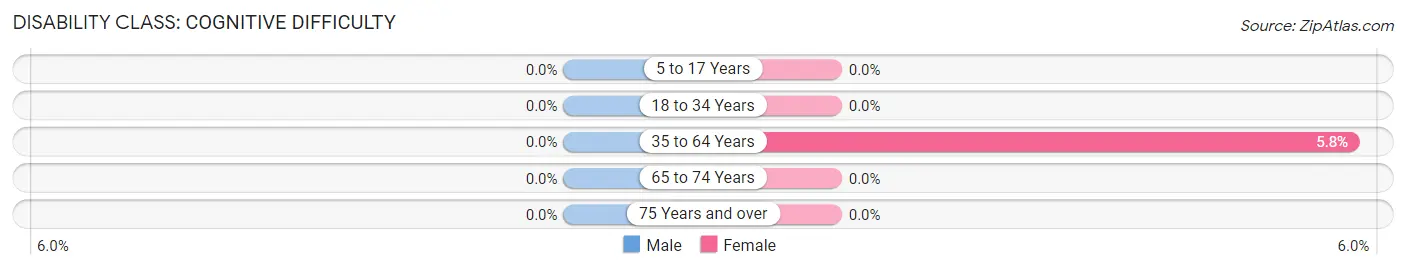
| Age Bracket | Male | Female |
| 5 to 17 Years | 0 (0.0%) | 0 (0.0%) |
| 18 to 34 Years | 0 (0.0%) | 0 (0.0%) |
| 35 to 64 Years | 0 (0.0%) | 3 (5.8%) |
| 65 to 74 Years | 0 (0.0%) | 0 (0.0%) |
| 75 Years and over | 0 (0.0%) | 0 (0.0%) |
Disability Class: Ambulatory Difficulty
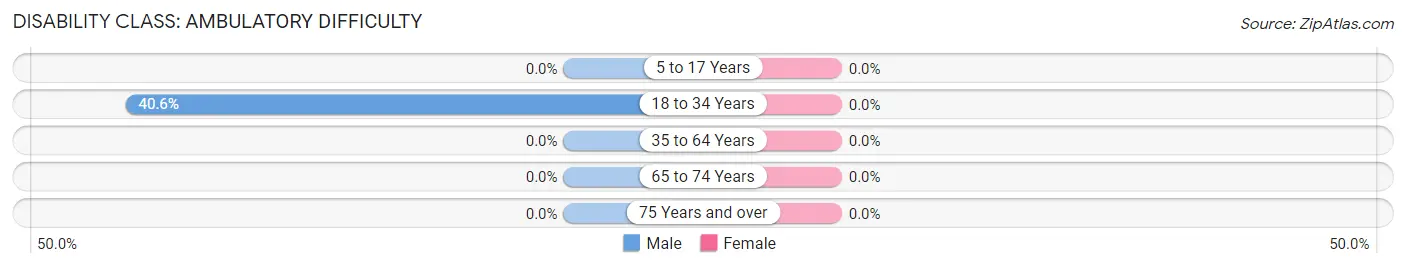
| Age Bracket | Male | Female |
| 5 to 17 Years | 0 (0.0%) | 0 (0.0%) |
| 18 to 34 Years | 13 (40.6%) | 0 (0.0%) |
| 35 to 64 Years | 0 (0.0%) | 0 (0.0%) |
| 65 to 74 Years | 0 (0.0%) | 0 (0.0%) |
| 75 Years and over | 0 (0.0%) | 0 (0.0%) |
Disability Class: Self-Care Difficulty
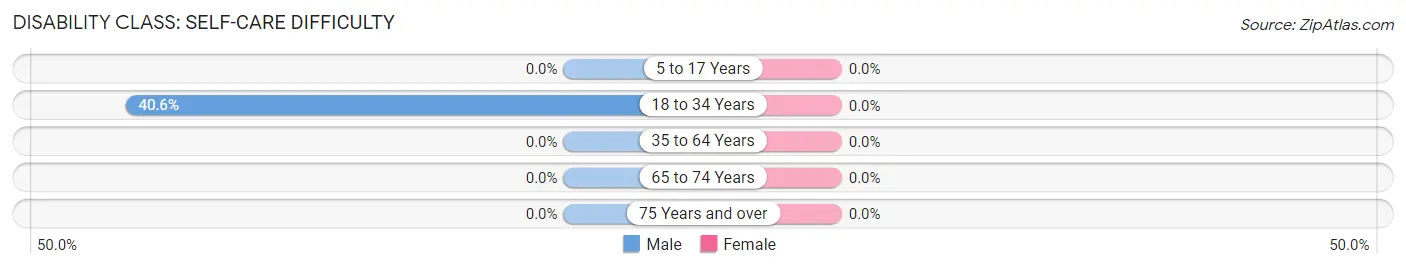
| Age Bracket | Male | Female |
| 5 to 17 Years | 0 (0.0%) | 0 (0.0%) |
| 18 to 34 Years | 13 (40.6%) | 0 (0.0%) |
| 35 to 64 Years | 0 (0.0%) | 0 (0.0%) |
| 65 to 74 Years | 0 (0.0%) | 0 (0.0%) |
| 75 Years and over | 0 (0.0%) | 0 (0.0%) |
Technology Access in Witmer
Computing Device Access in Witmer
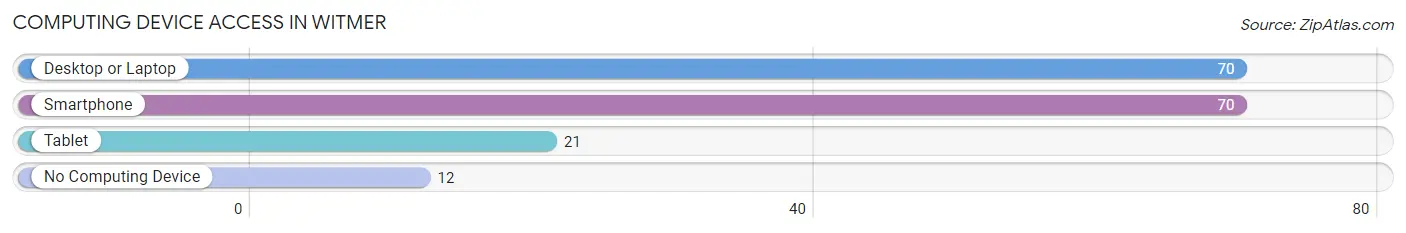
| Device Type | # Households | % Households |
| Desktop or Laptop | 70 | 85.4% |
| Smartphone | 70 | 85.4% |
| Tablet | 21 | 25.6% |
| No Computing Device | 12 | 14.6% |
| Total | 82 | 100.0% |
Internet Access in Witmer
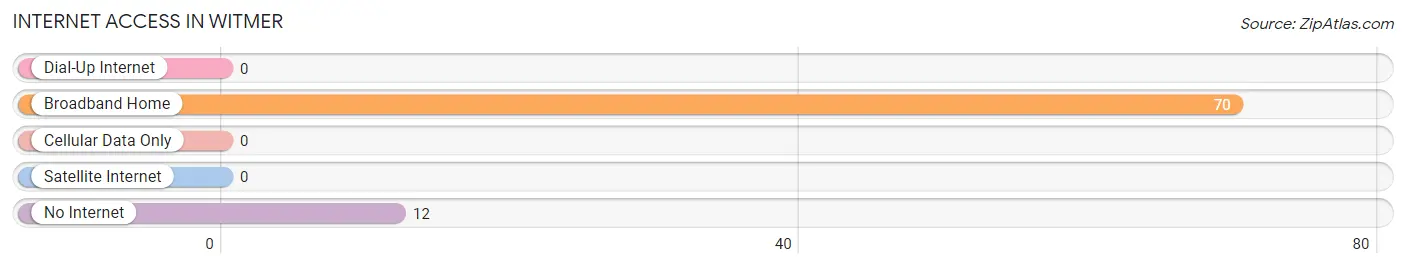
| Internet Type | # Households | % Households |
| Dial-Up Internet | 0 | 0.0% |
| Broadband Home | 70 | 85.4% |
| Cellular Data Only | 0 | 0.0% |
| Satellite Internet | 0 | 0.0% |
| No Internet | 12 | 14.6% |
| Total | 82 | 100.0% |
Witmer Summary
Witmer is an unincorporated community located in West Lampeter Township, Lancaster County, Pennsylvania. It is situated in the southeastern part of the state, approximately 10 miles west of the city of Lancaster. The community is home to a population of approximately 1,000 people and is part of the Lancaster Metropolitan Statistical Area.
Geography
Witmer is located at an elevation of 441 feet above sea level. It is situated in the southeastern part of Lancaster County, approximately 10 miles west of the city of Lancaster. The community is bordered by the townships of West Lampeter, East Lampeter, and Manor. The nearest major cities are Philadelphia, Harrisburg, and Reading.
The climate in Witmer is classified as humid continental, with hot summers and cold winters. The average annual temperature is around 50 degrees Fahrenheit, with an average high of around 75 degrees in the summer and an average low of around 25 degrees in the winter. The average annual precipitation is around 40 inches.
Economy
The economy of Witmer is largely based on agriculture. The area is home to several farms, which produce a variety of crops, including corn, soybeans, wheat, and hay. The community also has a few small businesses, including a grocery store, a hardware store, and a few restaurants.
Demographics
As of the 2010 census, the population of Witmer was 1,000. The racial makeup of the community was 97.2% White, 0.7% African American, 0.3% Native American, 0.3% Asian, 0.1% Pacific Islander, 0.3% from other races, and 1.3% from two or more races. Hispanic or Latino of any race were 1.3% of the population.
The median household income in Witmer was $50,000, and the median family income was $54,000. The per capita income was $21,000. About 8.3% of families and 10.3% of the population were below the poverty line, including 14.3% of those under age 18 and 6.3% of those age 65 or over.
History
Witmer was first settled in the late 1700s by German immigrants. The community was named after the Witmer family, who were among the first settlers. The area was primarily agricultural, and the community grew slowly over the years.
In the early 1900s, Witmer was home to a number of small businesses, including a general store, a blacksmith shop, and a post office. The community also had a school, which was built in the late 1800s and served the area until the 1950s.
In the late 20th century, Witmer began to experience a population decline as many of its residents moved away in search of better job opportunities. Despite this, the community has managed to maintain its rural character and remains a popular destination for visitors looking to experience the area’s rural charm.
Common Questions
What is Per Capita Income in Witmer?
Per Capita income in Witmer is $24,916.
What is the Median Family Income in Witmer?
Median Family Income in Witmer is $94,803.
What is the Median Household income in Witmer?
Median Household Income in Witmer is $93,421.
What is Income or Wage Gap in Witmer?
Income or Wage Gap in Witmer is 77.5%.
Women in Witmer earn 22.5 cents for every dollar earned by a man.
What is Inequality or Gini Index in Witmer?
Inequality or Gini Index in Witmer is 0.22.
What is the Total Population of Witmer?
Total Population of Witmer is 247.
What is the Total Male Population of Witmer?
Total Male Population of Witmer is 132.
What is the Total Female Population of Witmer?
Total Female Population of Witmer is 115.
What is the Ratio of Males per 100 Females in Witmer?
There are 114.78 Males per 100 Females in Witmer.
What is the Ratio of Females per 100 Males in Witmer?
There are 87.12 Females per 100 Males in Witmer.
What is the Median Population Age in Witmer?
Median Population Age in Witmer is 31.0 Years.
What is the Average Family Size in Witmer
Average Family Size in Witmer is 3.3 People.
What is the Average Household Size in Witmer
Average Household Size in Witmer is 2.9 People.
How Large is the Labor Force in Witmer?
There are 148 People in the Labor Forcein in Witmer.
What is the Percentage of People in the Labor Force in Witmer?
74.4% of People are in the Labor Force in Witmer.