Frankfort Springs borough, PA Map & Demographics
Frankfort Springs borough Overview
$25,835
PER CAPITA INCOME
$71,250
AVG FAMILY INCOME
$66,250
AVG HOUSEHOLD INCOME
0.33
INEQUALITY / GINI INDEX
156
TOTAL POPULATION
76
MALE POPULATION
80
FEMALE POPULATION
95.00
MALES / 100 FEMALES
105.26
FEMALES / 100 MALES
41.1
MEDIAN AGE
3.9
AVG FAMILY SIZE
3.5
AVG HOUSEHOLD SIZE
71
LABOR FORCE [ PEOPLE ]
58.7%
PERCENT IN LABOR FORCE
7.0%
UNEMPLOYMENT RATE
Income in Frankfort Springs borough
Income Overview in Frankfort Springs borough
Per Capita Income in Frankfort Springs borough is $25,835, while median incomes of families and households are $71,250 and $66,250 respectively.
| Characteristic | Number | Measure |
| Per Capita Income | 156 | $25,835 |
| Median Family Income | 39 | $71,250 |
| Mean Family Income | 39 | $90,479 |
| Median Household Income | 45 | $66,250 |
| Mean Household Income | 45 | $87,031 |
| Income Deficit | 39 | $0 |
| Wage / Income Gap (%) | 156 | 0.00% |
| Wage / Income Gap ($) | 156 | 100.00¢ per $1 |
| Gini / Inequality Index | 156 | 0.33 |
Earnings by Sex in Frankfort Springs borough
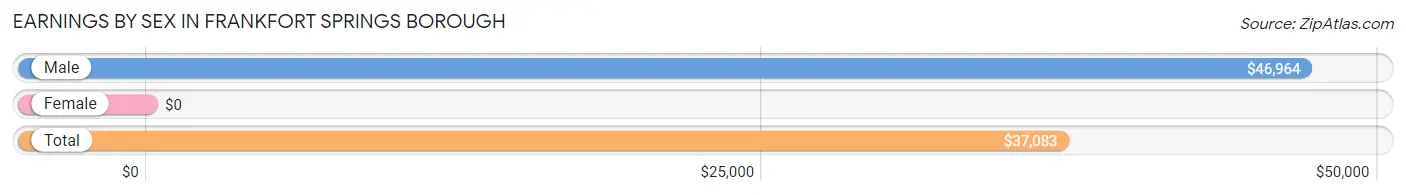
| Sex | Number | Average Earnings |
| Male | 41 (56.9%) | $46,964 |
| Female | 31 (43.1%) | $0 |
| Total | 72 (100.0%) | $37,083 |
Earnings by Sex by Income Bracket in Frankfort Springs borough
The most common earnings brackets in Frankfort Springs borough are $45,000 to $49,999 for men (13 | 31.7%) and $2,499 or less for women (6 | 19.4%).
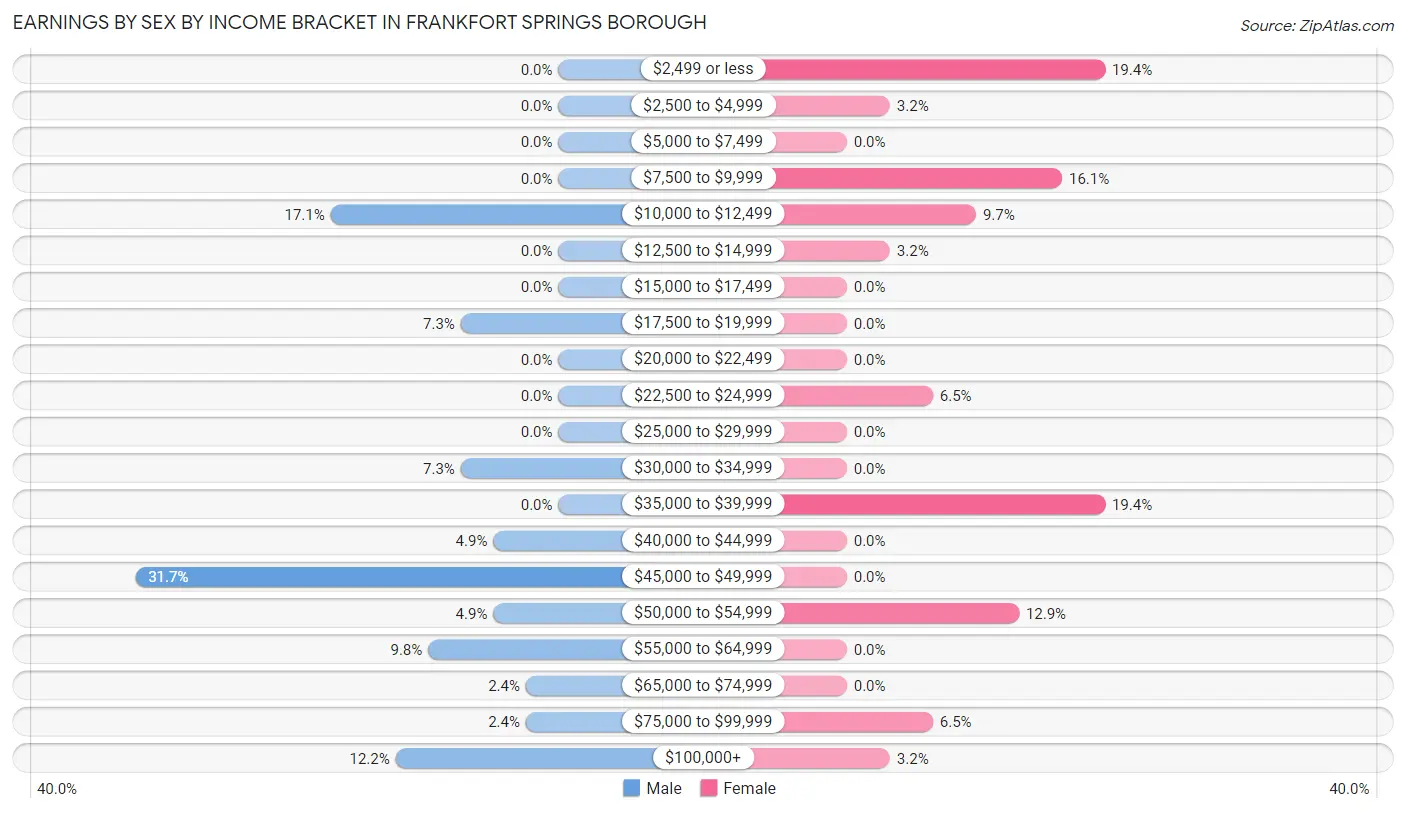
| Income | Male | Female |
| $2,499 or less | 0 (0.0%) | 6 (19.4%) |
| $2,500 to $4,999 | 0 (0.0%) | 1 (3.2%) |
| $5,000 to $7,499 | 0 (0.0%) | 0 (0.0%) |
| $7,500 to $9,999 | 0 (0.0%) | 5 (16.1%) |
| $10,000 to $12,499 | 7 (17.1%) | 3 (9.7%) |
| $12,500 to $14,999 | 0 (0.0%) | 1 (3.2%) |
| $15,000 to $17,499 | 0 (0.0%) | 0 (0.0%) |
| $17,500 to $19,999 | 3 (7.3%) | 0 (0.0%) |
| $20,000 to $22,499 | 0 (0.0%) | 0 (0.0%) |
| $22,500 to $24,999 | 0 (0.0%) | 2 (6.5%) |
| $25,000 to $29,999 | 0 (0.0%) | 0 (0.0%) |
| $30,000 to $34,999 | 3 (7.3%) | 0 (0.0%) |
| $35,000 to $39,999 | 0 (0.0%) | 6 (19.4%) |
| $40,000 to $44,999 | 2 (4.9%) | 0 (0.0%) |
| $45,000 to $49,999 | 13 (31.7%) | 0 (0.0%) |
| $50,000 to $54,999 | 2 (4.9%) | 4 (12.9%) |
| $55,000 to $64,999 | 4 (9.8%) | 0 (0.0%) |
| $65,000 to $74,999 | 1 (2.4%) | 0 (0.0%) |
| $75,000 to $99,999 | 1 (2.4%) | 2 (6.5%) |
| $100,000+ | 5 (12.2%) | 1 (3.2%) |
| Total | 41 (100.0%) | 31 (100.0%) |
Earnings by Sex by Educational Attainment in Frankfort Springs borough
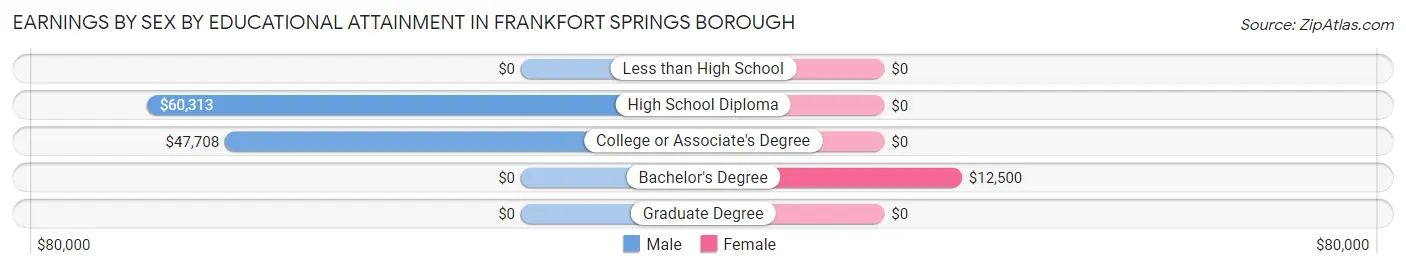
| Educational Attainment | Male Income | Female Income |
| Less than High School | - | - |
| High School Diploma | $60,313 | $0 |
| College or Associate's Degree | $47,708 | $0 |
| Bachelor's Degree | - | - |
| Graduate Degree | - | - |
| Total | $48,333 | $0 |
Family Income in Frankfort Springs borough
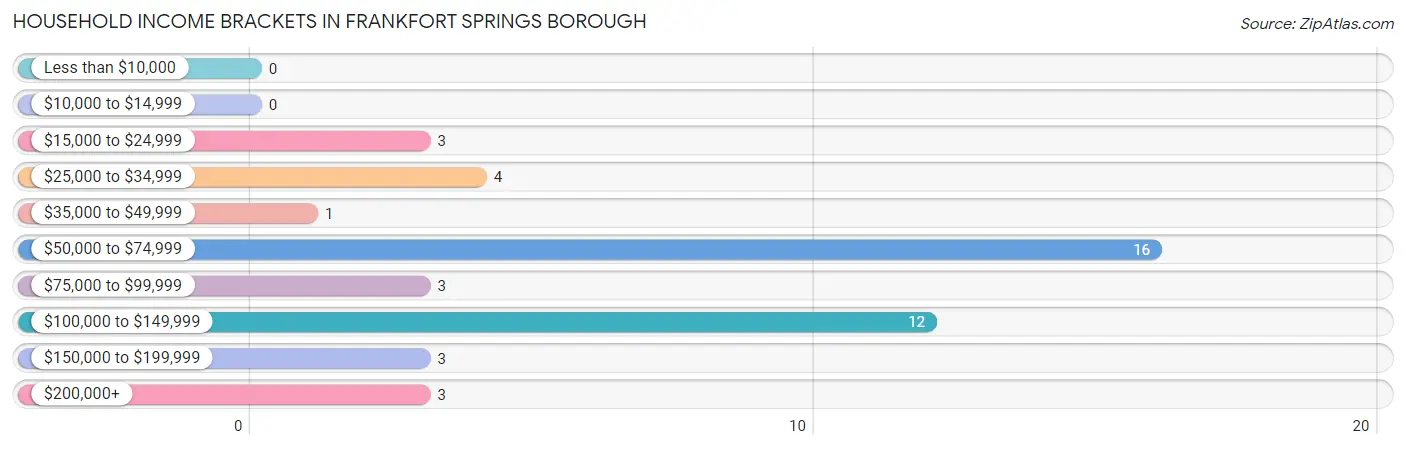
Family Income Brackets in Frankfort Springs borough
According to the Frankfort Springs borough family income data, there are 16 families falling into the $50,000 to $74,999 income range, which is the most common income bracket and makes up 41.0% of all families.
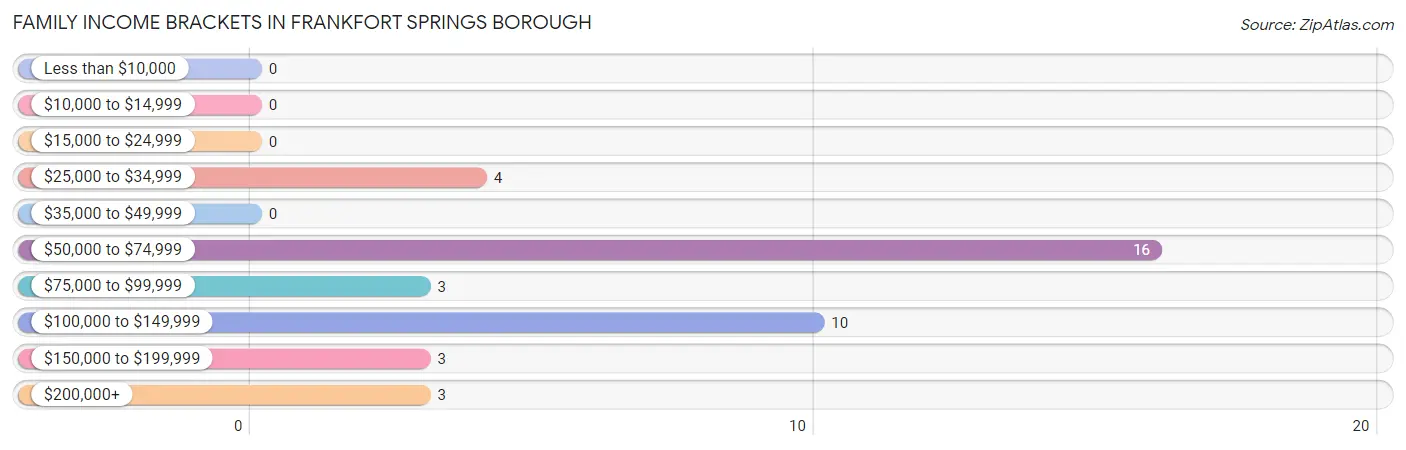
| Income Bracket | # Families | % Families |
| Less than $10,000 | 0 | 0.0% |
| $10,000 to $14,999 | 0 | 0.0% |
| $15,000 to $24,999 | 0 | 0.0% |
| $25,000 to $34,999 | 4 | 10.3% |
| $35,000 to $49,999 | 0 | 0.0% |
| $50,000 to $74,999 | 16 | 41.0% |
| $75,000 to $99,999 | 3 | 7.7% |
| $100,000 to $149,999 | 10 | 25.6% |
| $150,000 to $199,999 | 3 | 7.7% |
| $200,000+ | 3 | 7.7% |
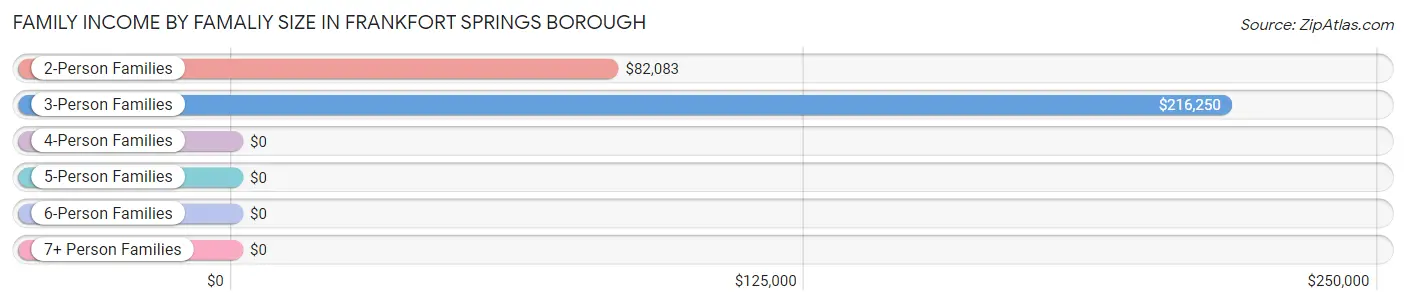
Family Income by Famaliy Size in Frankfort Springs borough
3-person families (4 | 10.3%) account for the highest median family income in Frankfort Springs borough with $216,250 per family, while 3-person families (4 | 10.3%) have the highest median income of $72,083 per family member.
| Income Bracket | # Families | Median Income |
| 2-Person Families | 13 (33.3%) | $82,083 |
| 3-Person Families | 4 (10.3%) | $216,250 |
| 4-Person Families | 9 (23.1%) | $0 |
| 5-Person Families | 11 (28.2%) | $0 |
| 6-Person Families | 2 (5.1%) | $0 |
| 7+ Person Families | 0 (0.0%) | $0 |
| Total | 39 (100.0%) | $71,250 |
Family Income by Number of Earners in Frankfort Springs borough
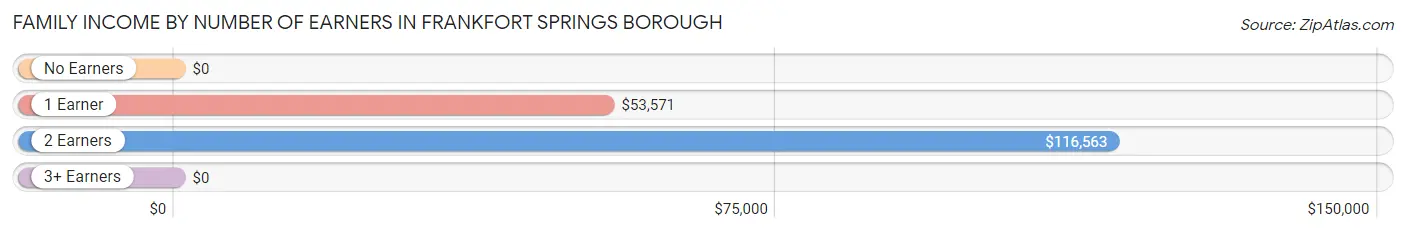
| Number of Earners | # Families | Median Income |
| No Earners | 3 (7.7%) | $0 |
| 1 Earner | 14 (35.9%) | $53,571 |
| 2 Earners | 17 (43.6%) | $116,563 |
| 3+ Earners | 5 (12.8%) | $0 |
| Total | 39 (100.0%) | $71,250 |
Household Income in Frankfort Springs borough
Household Income Brackets in Frankfort Springs borough
With 16 households falling in the category, the $50,000 to $74,999 income range is the most frequent in Frankfort Springs borough, accounting for 35.6% of all households.
| Income Bracket | # Households | % Households |
| Less than $10,000 | 0 | 0.0% |
| $10,000 to $14,999 | 0 | 0.0% |
| $15,000 to $24,999 | 3 | 6.7% |
| $25,000 to $34,999 | 4 | 8.9% |
| $35,000 to $49,999 | 1 | 2.2% |
| $50,000 to $74,999 | 16 | 35.6% |
| $75,000 to $99,999 | 3 | 6.7% |
| $100,000 to $149,999 | 12 | 26.7% |
| $150,000 to $199,999 | 3 | 6.7% |
| $200,000+ | 3 | 6.7% |
Household Income by Householder Age in Frankfort Springs borough
The median household income in Frankfort Springs borough is $66,250, with the highest median household income of $100,417 found in the 25 to 44 years age bracket for the primary householder. A total of 11 households (24.4%) fall into this category.
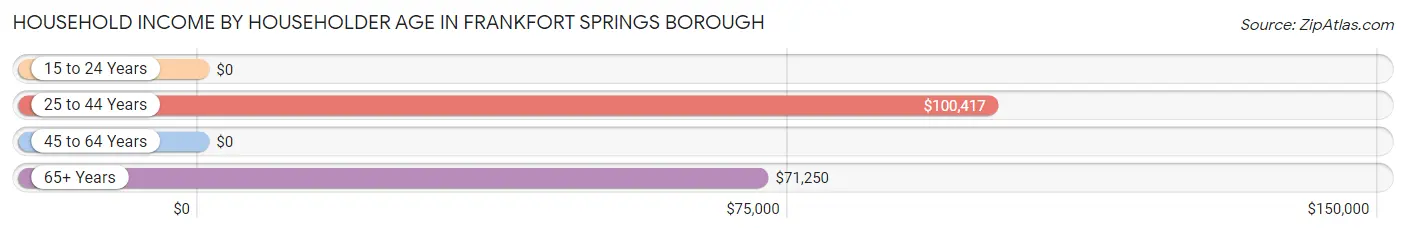
| Income Bracket | # Households | Median Income |
| 15 to 24 Years | 0 (0.0%) | $0 |
| 25 to 44 Years | 11 (24.4%) | $100,417 |
| 45 to 64 Years | 19 (42.2%) | $0 |
| 65+ Years | 15 (33.3%) | $71,250 |
| Total | 45 (100.0%) | $66,250 |
Poverty in Frankfort Springs borough
Income Below Poverty by Sex and Age in Frankfort Springs borough
With 22.4% poverty level for males and 11.3% for females among the residents of Frankfort Springs borough, 18 to 24 year old males and 25 to 34 year old females are the most vulnerable to poverty, with 7 males (100.0%) and 5 females (62.5%) in their respective age groups living below the poverty level.
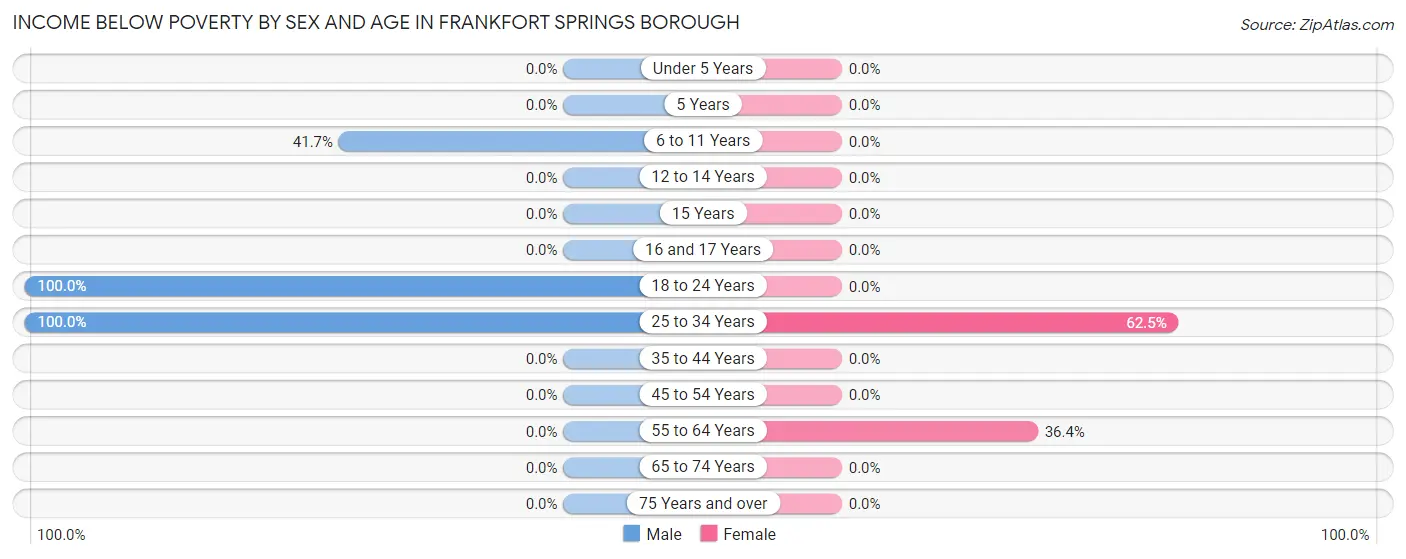
| Age Bracket | Male | Female |
| Under 5 Years | 0 (0.0%) | 0 (0.0%) |
| 5 Years | 0 (0.0%) | 0 (0.0%) |
| 6 to 11 Years | 5 (41.7%) | 0 (0.0%) |
| 12 to 14 Years | 0 (0.0%) | 0 (0.0%) |
| 15 Years | 0 (0.0%) | 0 (0.0%) |
| 16 and 17 Years | 0 (0.0%) | 0 (0.0%) |
| 18 to 24 Years | 7 (100.0%) | 0 (0.0%) |
| 25 to 34 Years | 5 (100.0%) | 5 (62.5%) |
| 35 to 44 Years | 0 (0.0%) | 0 (0.0%) |
| 45 to 54 Years | 0 (0.0%) | 0 (0.0%) |
| 55 to 64 Years | 0 (0.0%) | 4 (36.4%) |
| 65 to 74 Years | 0 (0.0%) | 0 (0.0%) |
| 75 Years and over | 0 (0.0%) | 0 (0.0%) |
| Total | 17 (22.4%) | 9 (11.3%) |
Income Above Poverty by Sex and Age in Frankfort Springs borough
According to the poverty statistics in Frankfort Springs borough, males aged 12 to 14 years and females aged under 5 years are the age groups that are most secure financially, with 100.0% of males and 100.0% of females in these age groups living above the poverty line.
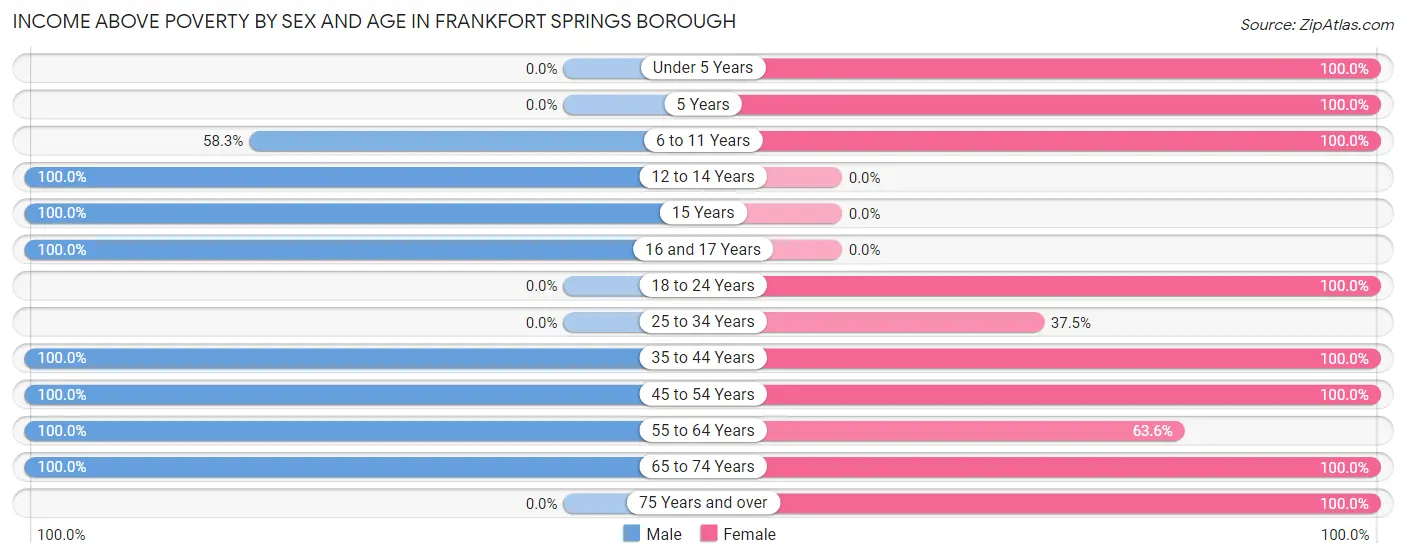
| Age Bracket | Male | Female |
| Under 5 Years | 0 (0.0%) | 2 (100.0%) |
| 5 Years | 0 (0.0%) | 2 (100.0%) |
| 6 to 11 Years | 7 (58.3%) | 10 (100.0%) |
| 12 to 14 Years | 1 (100.0%) | 0 (0.0%) |
| 15 Years | 8 (100.0%) | 0 (0.0%) |
| 16 and 17 Years | 6 (100.0%) | 0 (0.0%) |
| 18 to 24 Years | 0 (0.0%) | 12 (100.0%) |
| 25 to 34 Years | 0 (0.0%) | 3 (37.5%) |
| 35 to 44 Years | 5 (100.0%) | 15 (100.0%) |
| 45 to 54 Years | 18 (100.0%) | 2 (100.0%) |
| 55 to 64 Years | 8 (100.0%) | 7 (63.6%) |
| 65 to 74 Years | 6 (100.0%) | 8 (100.0%) |
| 75 Years and over | 0 (0.0%) | 10 (100.0%) |
| Total | 59 (77.6%) | 71 (88.7%) |
Income Below Poverty Among Married-Couple Families in Frankfort Springs borough
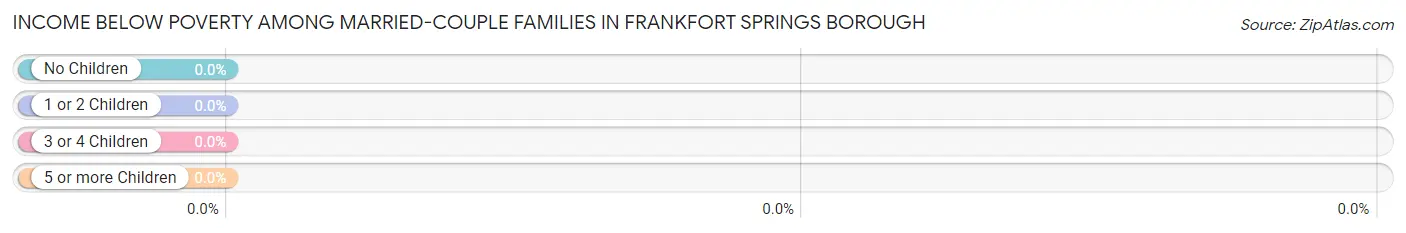
| Children | Above Poverty | Below Poverty |
| No Children | 10 (100.0%) | 0 (0.0%) |
| 1 or 2 Children | 15 (100.0%) | 0 (0.0%) |
| 3 or 4 Children | 2 (100.0%) | 0 (0.0%) |
| 5 or more Children | 0 (0.0%) | 0 (0.0%) |
| Total | 27 (100.0%) | 0 (0.0%) |
Income Below Poverty Among Single-Parent Households in Frankfort Springs borough
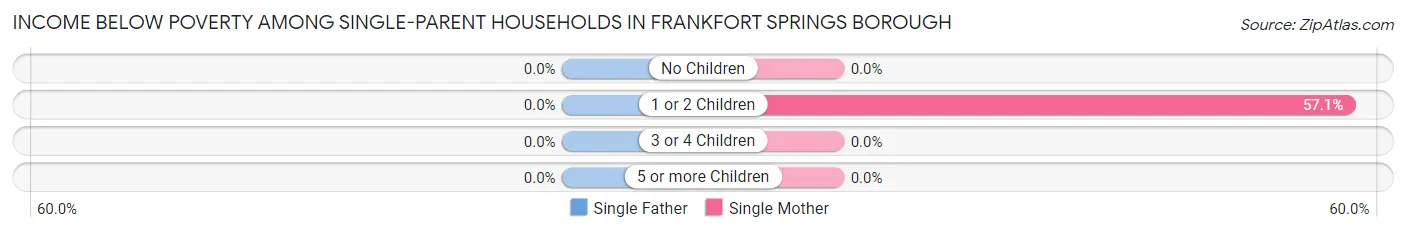
| Children | Single Father | Single Mother |
| No Children | 0 (0.0%) | 0 (0.0%) |
| 1 or 2 Children | 0 (0.0%) | 4 (57.1%) |
| 3 or 4 Children | 0 (0.0%) | 0 (0.0%) |
| 5 or more Children | 0 (0.0%) | 0 (0.0%) |
| Total | 0 (0.0%) | 4 (33.3%) |
Income Below Poverty Among Married-Couple vs Single-Parent Households in Frankfort Springs borough
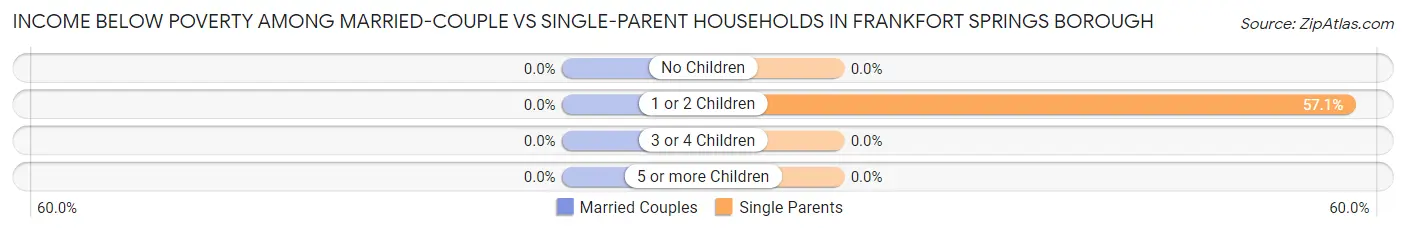
| Children | Married-Couple Families | Single-Parent Households |
| No Children | 0 (0.0%) | 0 (0.0%) |
| 1 or 2 Children | 0 (0.0%) | 4 (57.1%) |
| 3 or 4 Children | 0 (0.0%) | 0 (0.0%) |
| 5 or more Children | 0 (0.0%) | 0 (0.0%) |
| Total | 0 (0.0%) | 4 (33.3%) |
Race in Frankfort Springs borough
The most populous races in Frankfort Springs borough are White / Caucasian (147 | 94.2%), and Two or more Races (9 | 5.8%).
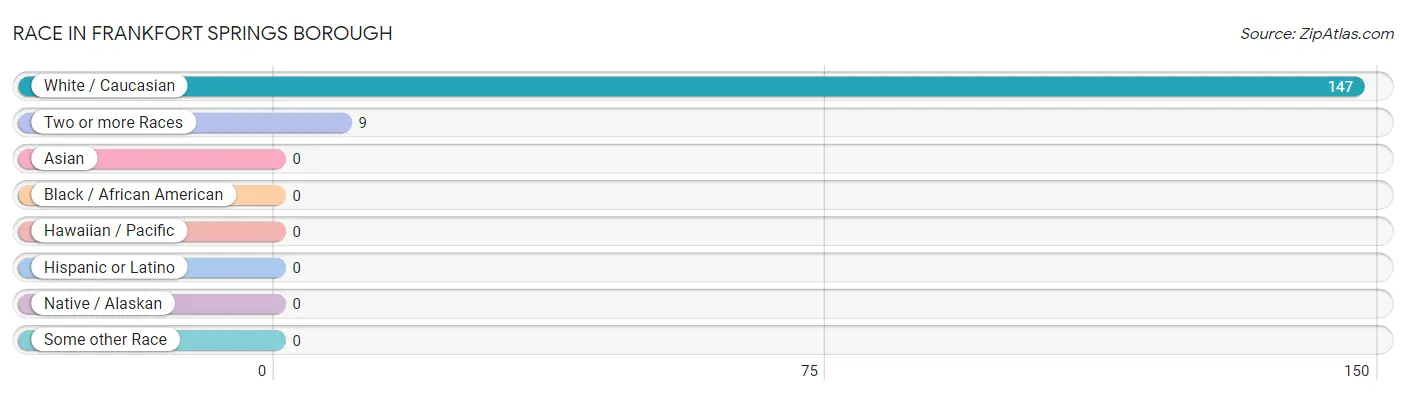
| Race | # Population | % Population |
| Asian | 0 | 0.0% |
| Black / African American | 0 | 0.0% |
| Hawaiian / Pacific | 0 | 0.0% |
| Hispanic or Latino | 0 | 0.0% |
| Native / Alaskan | 0 | 0.0% |
| White / Caucasian | 147 | 94.2% |
| Two or more Races | 9 | 5.8% |
| Some other Race | 0 | 0.0% |
| Total | 156 | 100.0% |
Ancestry in Frankfort Springs borough
The most populous ancestries reported in Frankfort Springs borough are English (45 | 28.8%), German (27 | 17.3%), Italian (24 | 15.4%), Irish (18 | 11.5%), and Polish (14 | 9.0%), together accounting for 82.0% of all Frankfort Springs borough residents.
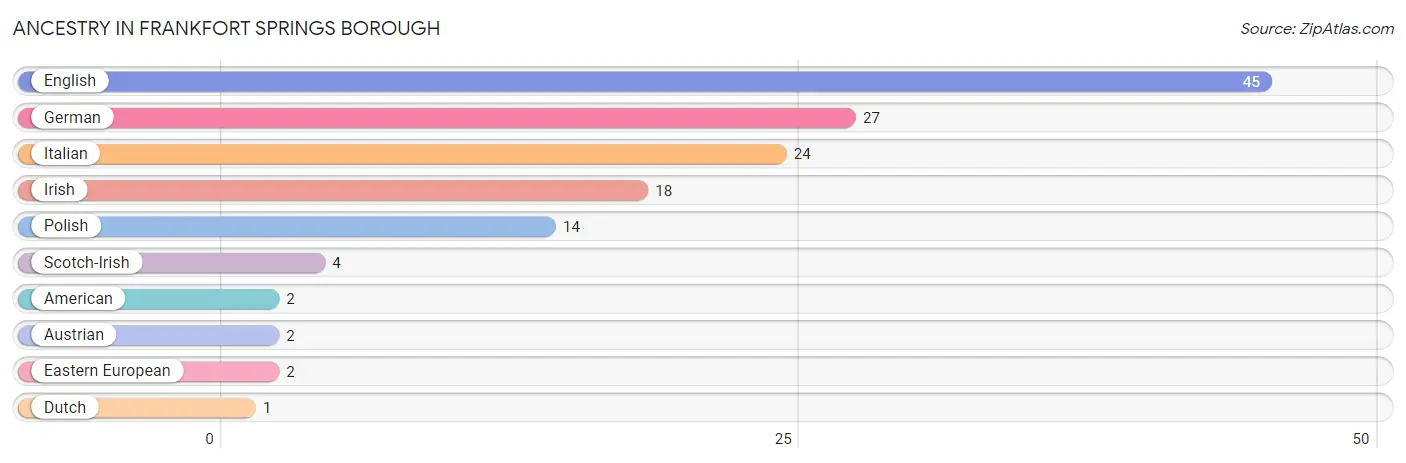
| Ancestry | # Population | % Population |
| American | 2 | 1.3% |
| Austrian | 2 | 1.3% |
| Dutch | 1 | 0.6% |
| Eastern European | 2 | 1.3% |
| English | 45 | 28.8% |
| German | 27 | 17.3% |
| Irish | 18 | 11.5% |
| Italian | 24 | 15.4% |
| Polish | 14 | 9.0% |
| Scotch-Irish | 4 | 2.6% | View All 10 Rows |
Immigrants in Frankfort Springs borough

| Immigration Origin | # Population | % Population | View All 0 Rows |
Sex and Age in Frankfort Springs borough
Sex and Age in Frankfort Springs borough
The most populous age groups in Frankfort Springs borough are 15 to 19 Years (14 | 18.4%) for men and 40 to 44 Years (13 | 16.3%) for women.
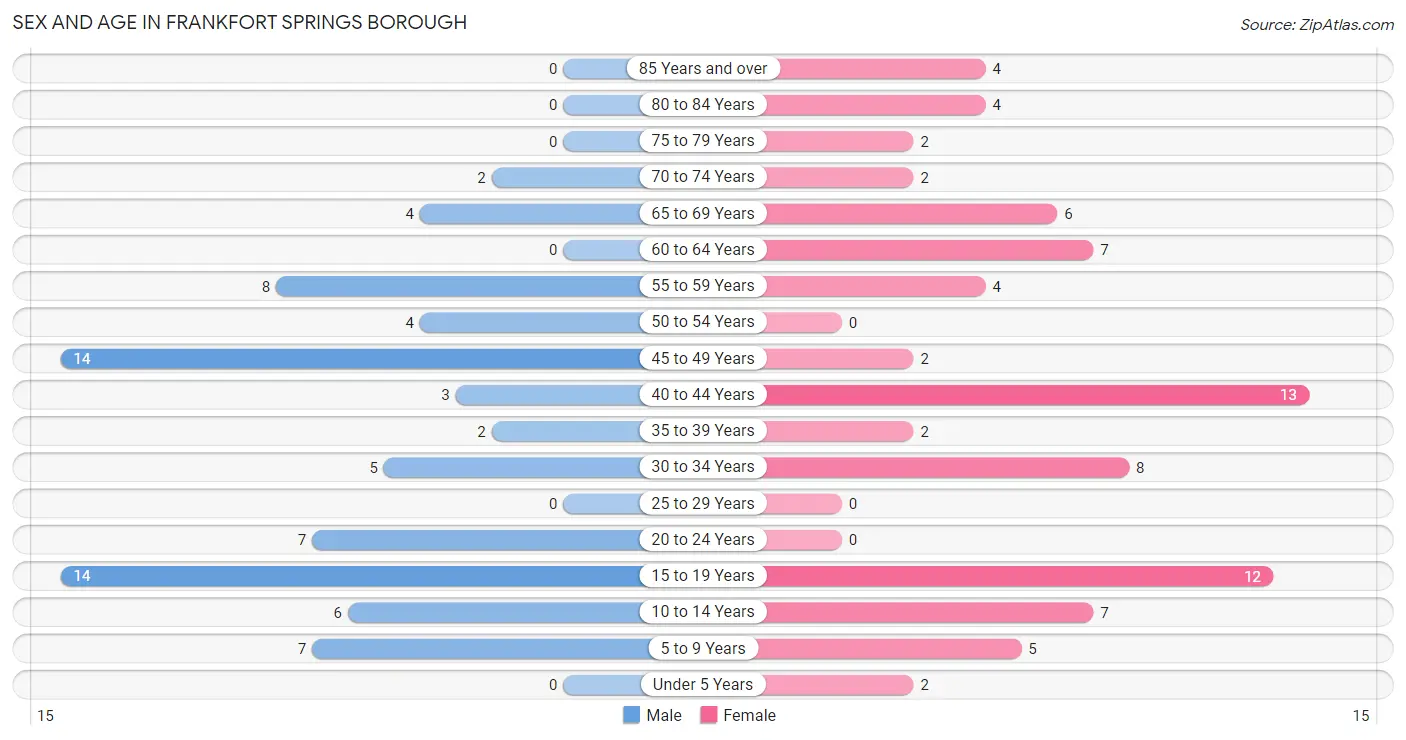
| Age Bracket | Male | Female |
| Under 5 Years | 0 (0.0%) | 2 (2.5%) |
| 5 to 9 Years | 7 (9.2%) | 5 (6.2%) |
| 10 to 14 Years | 6 (7.9%) | 7 (8.7%) |
| 15 to 19 Years | 14 (18.4%) | 12 (15.0%) |
| 20 to 24 Years | 7 (9.2%) | 0 (0.0%) |
| 25 to 29 Years | 0 (0.0%) | 0 (0.0%) |
| 30 to 34 Years | 5 (6.6%) | 8 (10.0%) |
| 35 to 39 Years | 2 (2.6%) | 2 (2.5%) |
| 40 to 44 Years | 3 (4.0%) | 13 (16.3%) |
| 45 to 49 Years | 14 (18.4%) | 2 (2.5%) |
| 50 to 54 Years | 4 (5.3%) | 0 (0.0%) |
| 55 to 59 Years | 8 (10.5%) | 4 (5.0%) |
| 60 to 64 Years | 0 (0.0%) | 7 (8.7%) |
| 65 to 69 Years | 4 (5.3%) | 6 (7.5%) |
| 70 to 74 Years | 2 (2.6%) | 2 (2.5%) |
| 75 to 79 Years | 0 (0.0%) | 2 (2.5%) |
| 80 to 84 Years | 0 (0.0%) | 4 (5.0%) |
| 85 Years and over | 0 (0.0%) | 4 (5.0%) |
| Total | 76 (100.0%) | 80 (100.0%) |
Families and Households in Frankfort Springs borough
Median Family Size in Frankfort Springs borough
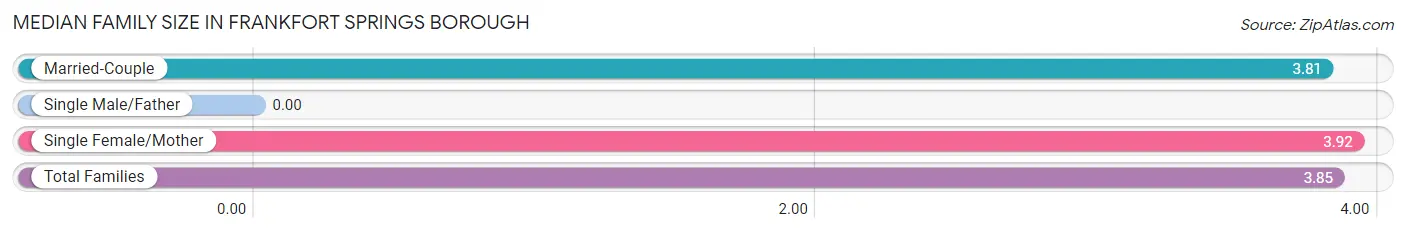
| Family Type | # Families | Family Size |
| Married-Couple | 27 (69.2%) | 3.81 |
| Single Male/Father | 0 (0.0%) | - |
| Single Female/Mother | 12 (30.8%) | 3.92 |
| Total Families | 39 (100.0%) | 3.85 |
Median Household Size in Frankfort Springs borough
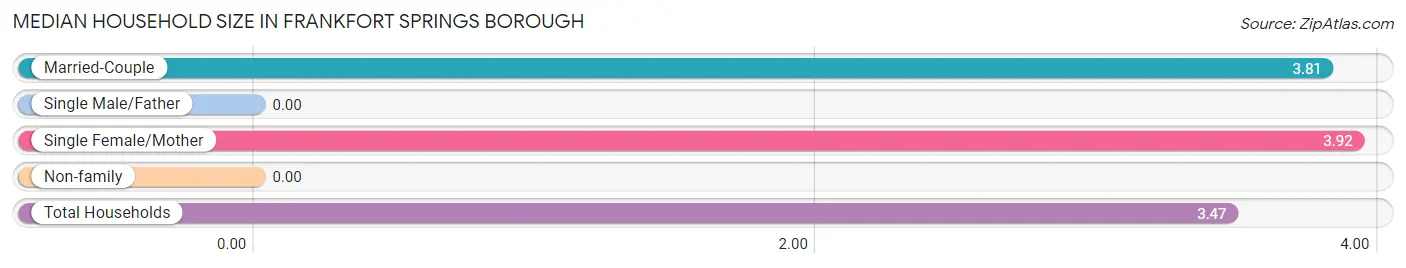
| Household Type | # Households | Household Size |
| Married-Couple | 27 (60.0%) | 3.81 |
| Single Male/Father | 0 (0.0%) | - |
| Single Female/Mother | 12 (26.7%) | 3.92 |
| Non-family | 6 (13.3%) | - |
| Total Households | 45 (100.0%) | 3.47 |
Household Size by Marriage Status in Frankfort Springs borough
Out of a total of 45 households in Frankfort Springs borough, 39 (86.7%) are family households, while 6 (13.3%) are nonfamily households. The most numerous type of family households are 2-person households, comprising 13, and the most common type of nonfamily households are 1-person households, comprising 6.
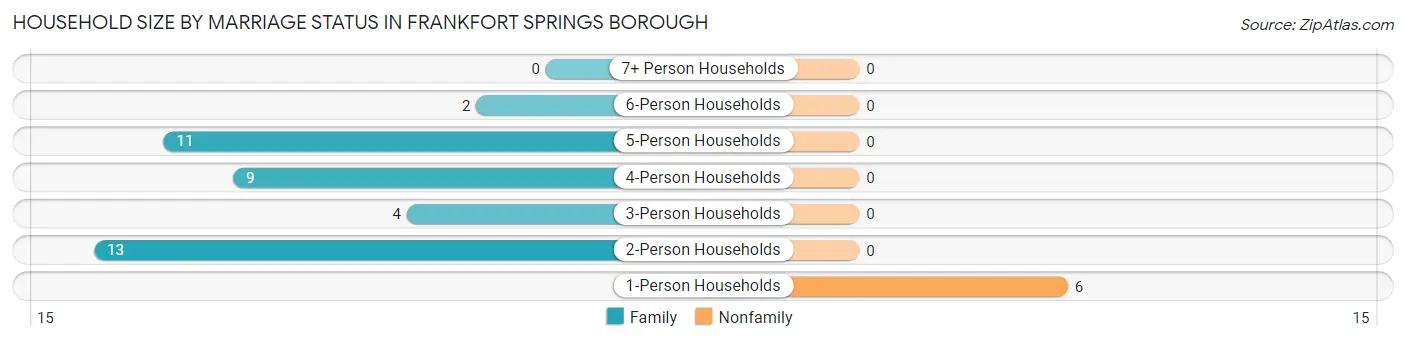
| Household Size | Family Households | Nonfamily Households |
| 1-Person Households | - | 6 (13.3%) |
| 2-Person Households | 13 (28.9%) | 0 (0.0%) |
| 3-Person Households | 4 (8.9%) | 0 (0.0%) |
| 4-Person Households | 9 (20.0%) | 0 (0.0%) |
| 5-Person Households | 11 (24.4%) | 0 (0.0%) |
| 6-Person Households | 2 (4.4%) | 0 (0.0%) |
| 7+ Person Households | 0 (0.0%) | 0 (0.0%) |
| Total | 39 (86.7%) | 6 (13.3%) |
Female Fertility in Frankfort Springs borough
Fertility by Age in Frankfort Springs borough
| Age Bracket | Women with Births | Births / 1,000 Women |
| 15 to 19 years | 0 (0.0%) | 0.0 |
| 20 to 34 years | 0 (0.0%) | 0.0 |
| 35 to 50 years | 0 (0.0%) | 0.0 |
| Total | 0 (0.0%) | 0.0 |
Fertility by Age by Marriage Status in Frankfort Springs borough
| Age Bracket | Married | Unmarried |
| 15 to 19 years | 0 (0.0%) | 0 (0.0%) |
| 20 to 34 years | 0 (0.0%) | 0 (0.0%) |
| 35 to 50 years | 0 (0.0%) | 0 (0.0%) |
| Total | 0 (0.0%) | 0 (0.0%) |
Fertility by Education in Frankfort Springs borough
| Educational Attainment | Women with Births | Births / 1,000 Women |
| Less than High School | 0 (0.0%) | 0.0 |
| High School Diploma | 0 (0.0%) | 0.0 |
| College or Associate's Degree | 0 (0.0%) | 0.0 |
| Bachelor's Degree | 0 (0.0%) | 0.0 |
| Graduate Degree | 0 (0.0%) | 0.0 |
| Total | 0 (0.0%) | 0.0 |
Fertility by Education by Marriage Status in Frankfort Springs borough
| Educational Attainment | Married | Unmarried |
| Less than High School | 0 (0.0%) | 0 (0.0%) |
| High School Diploma | 0 (0.0%) | 0 (0.0%) |
| College or Associate's Degree | 0 (0.0%) | 0 (0.0%) |
| Bachelor's Degree | 0 (0.0%) | 0 (0.0%) |
| Graduate Degree | 0 (0.0%) | 0 (0.0%) |
| Total | 0 (0.0%) | 0 (0.0%) |
Employment Characteristics in Frankfort Springs borough
Employment by Class of Employer in Frankfort Springs borough
Among the 66 employed individuals in Frankfort Springs borough, private company employees (56 | 84.9%), not-for-profit organizations (7 | 10.6%), and local government employees (3 | 4.5%) make up the most common classes of employment.
| Employer Class | # Employees | % Employees |
| Private Company Employees | 56 | 84.9% |
| Self-Employed (Incorporated) | 0 | 0.0% |
| Self-Employed (Not Incorporated) | 0 | 0.0% |
| Not-for-profit Organizations | 7 | 10.6% |
| Local Government Employees | 3 | 4.5% |
| State Government Employees | 0 | 0.0% |
| Federal Government Employees | 0 | 0.0% |
| Unpaid Family Workers | 0 | 0.0% |
| Total | 66 | 100.0% |
Employment Status by Age in Frankfort Springs borough
According to the labor force statistics for Frankfort Springs borough, out of the total population over 16 years of age (121), 58.7% or 71 individuals are in the labor force, with 7.0% or 5 of them unemployed. The age group with the highest labor force participation rate is 20 to 24 years, with 100.0% or 7 individuals in the labor force. Within the labor force, the 30 to 34 years age range has the highest percentage of unemployed individuals, with 62.5% or 5 of them being unemployed.
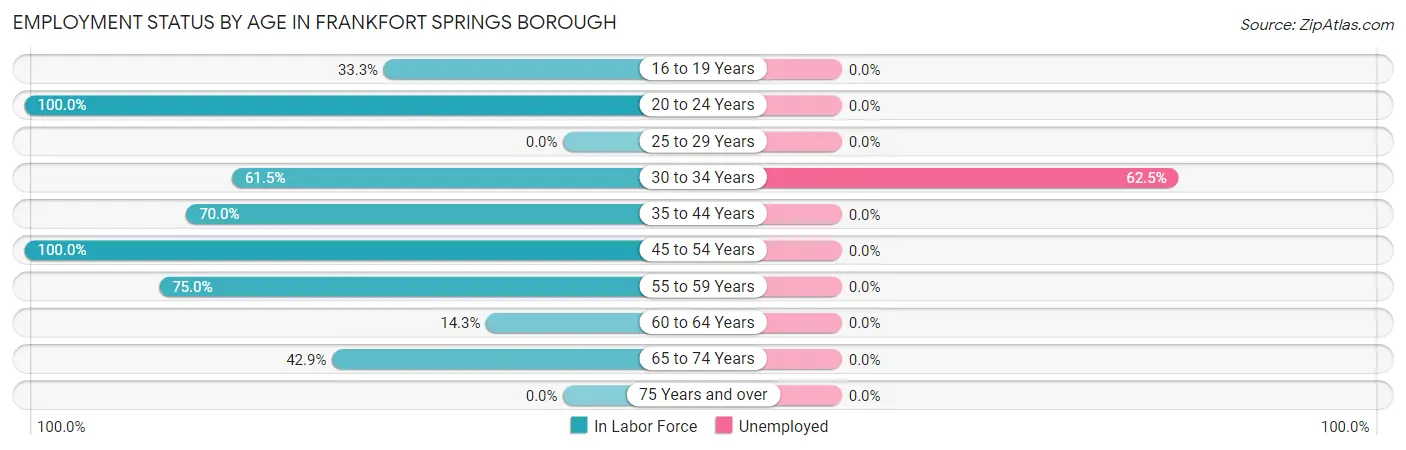
| Age Bracket | In Labor Force | Unemployed |
| 16 to 19 Years | 6 (33.3%) | 0 (0.0%) |
| 20 to 24 Years | 7 (100.0%) | 0 (0.0%) |
| 25 to 29 Years | 0 (0.0%) | 0 (0.0%) |
| 30 to 34 Years | 8 (61.5%) | 5 (62.5%) |
| 35 to 44 Years | 14 (70.0%) | 0 (0.0%) |
| 45 to 54 Years | 20 (100.0%) | 0 (0.0%) |
| 55 to 59 Years | 9 (75.0%) | 0 (0.0%) |
| 60 to 64 Years | 1 (14.3%) | 0 (0.0%) |
| 65 to 74 Years | 6 (42.9%) | 0 (0.0%) |
| 75 Years and over | 0 (0.0%) | 0 (0.0%) |
| Total | 71 (58.7%) | 5 (7.0%) |
Employment Status by Educational Attainment in Frankfort Springs borough
According to labor force statistics for Frankfort Springs borough, 72.2% of individuals (52) out of the total population between 25 and 64 years of age (72) are in the labor force, with 9.6% or 5 of them being unemployed. The group with the highest labor force participation rate are those with the educational attainment of bachelor's degree or higher, with 100.0% or 4 individuals in the labor force. Within the labor force, individuals with less than high school education have the highest percentage of unemployment, with 100.0% or 5 of them being unemployed.
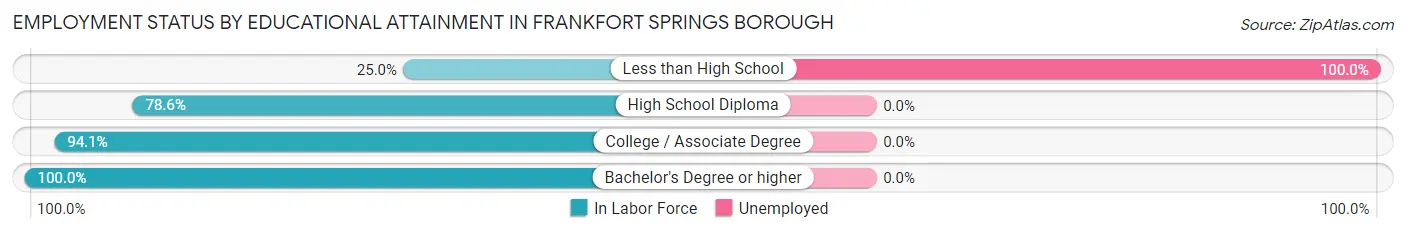
| Educational Attainment | In Labor Force | Unemployed |
| Less than High School | 5 (25.0%) | 20 (100.0%) |
| High School Diploma | 11 (78.6%) | 0 (0.0%) |
| College / Associate Degree | 32 (94.1%) | 0 (0.0%) |
| Bachelor's Degree or higher | 4 (100.0%) | 0 (0.0%) |
| Total | 52 (72.2%) | 7 (9.6%) |
Employment Occupations by Sex in Frankfort Springs borough
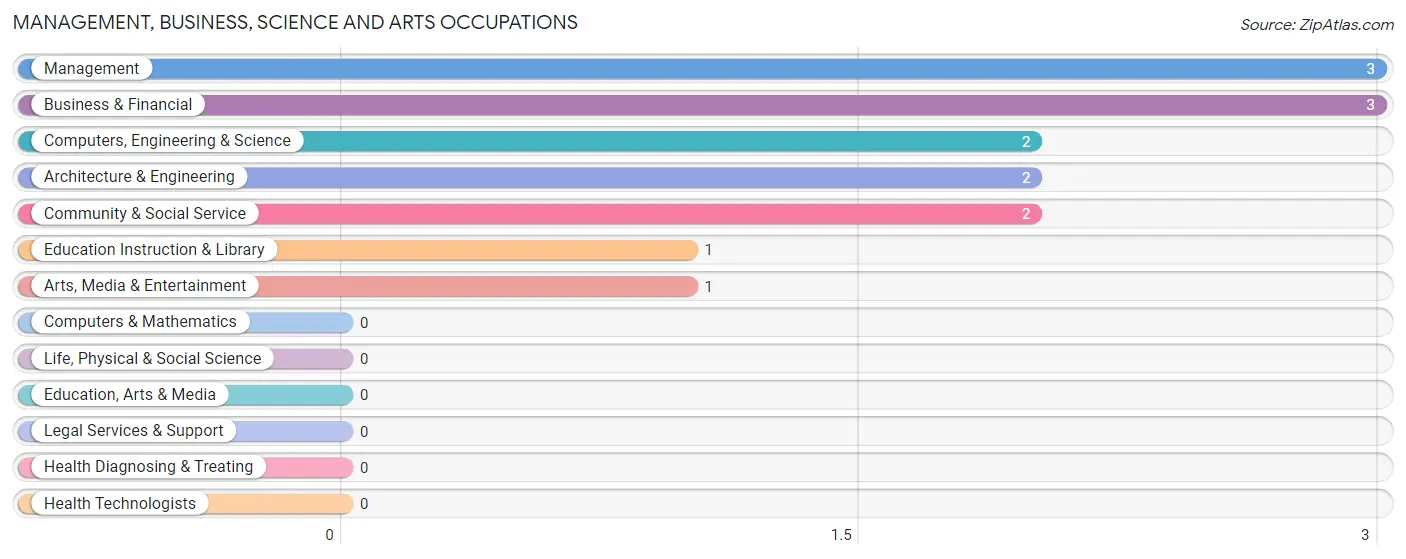
Management, Business, Science and Arts Occupations
The most common Management, Business, Science and Arts occupations in Frankfort Springs borough are Management (3 | 4.5%), Business & Financial (3 | 4.5%), Computers, Engineering & Science (2 | 3.0%), Architecture & Engineering (2 | 3.0%), and Community & Social Service (2 | 3.0%).
Management, Business, Science and Arts Occupations by Sex
Within the Management, Business, Science and Arts occupations in Frankfort Springs borough, the most male-oriented occupations are Computers, Engineering & Science (100.0%), Architecture & Engineering (100.0%), and Business & Financial (33.3%), while the most female-oriented occupations are Management (100.0%), Community & Social Service (100.0%), and Education Instruction & Library (100.0%).
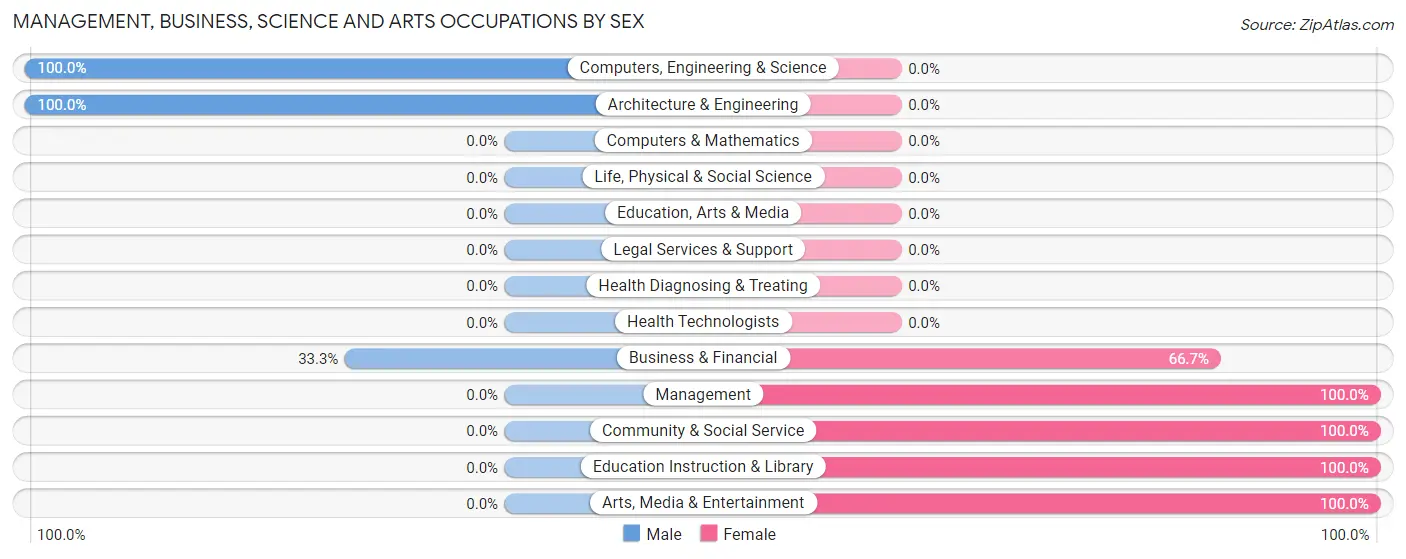
| Occupation | Male | Female |
| Management | 0 (0.0%) | 3 (100.0%) |
| Business & Financial | 1 (33.3%) | 2 (66.7%) |
| Computers, Engineering & Science | 2 (100.0%) | 0 (0.0%) |
| Computers & Mathematics | 0 (0.0%) | 0 (0.0%) |
| Architecture & Engineering | 2 (100.0%) | 0 (0.0%) |
| Life, Physical & Social Science | 0 (0.0%) | 0 (0.0%) |
| Community & Social Service | 0 (0.0%) | 2 (100.0%) |
| Education, Arts & Media | 0 (0.0%) | 0 (0.0%) |
| Legal Services & Support | 0 (0.0%) | 0 (0.0%) |
| Education Instruction & Library | 0 (0.0%) | 1 (100.0%) |
| Arts, Media & Entertainment | 0 (0.0%) | 1 (100.0%) |
| Health Diagnosing & Treating | 0 (0.0%) | 0 (0.0%) |
| Health Technologists | 0 (0.0%) | 0 (0.0%) |
| Total (Category) | 3 (30.0%) | 7 (70.0%) |
| Total (Overall) | 35 (53.0%) | 31 (47.0%) |
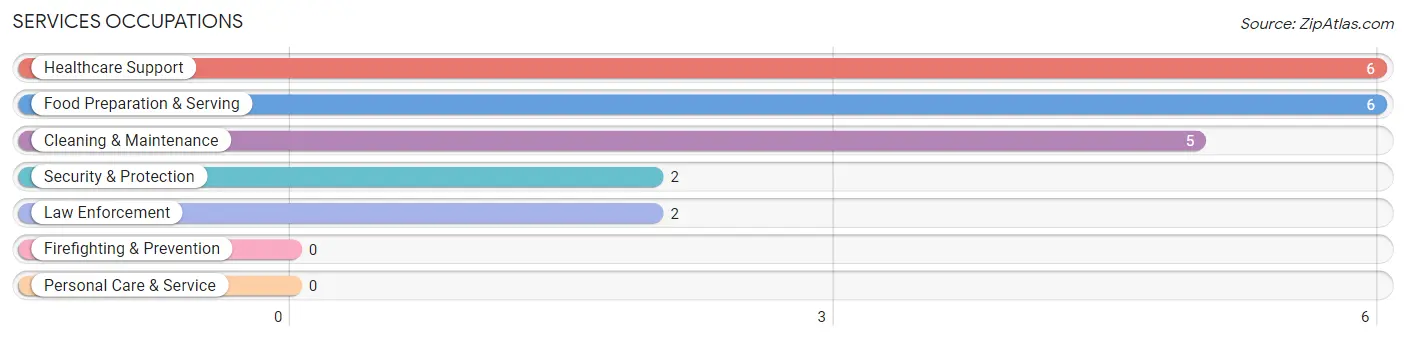
Services Occupations
The most common Services occupations in Frankfort Springs borough are Healthcare Support (6 | 9.1%), Food Preparation & Serving (6 | 9.1%), Cleaning & Maintenance (5 | 7.6%), Security & Protection (2 | 3.0%), and Law Enforcement (2 | 3.0%).
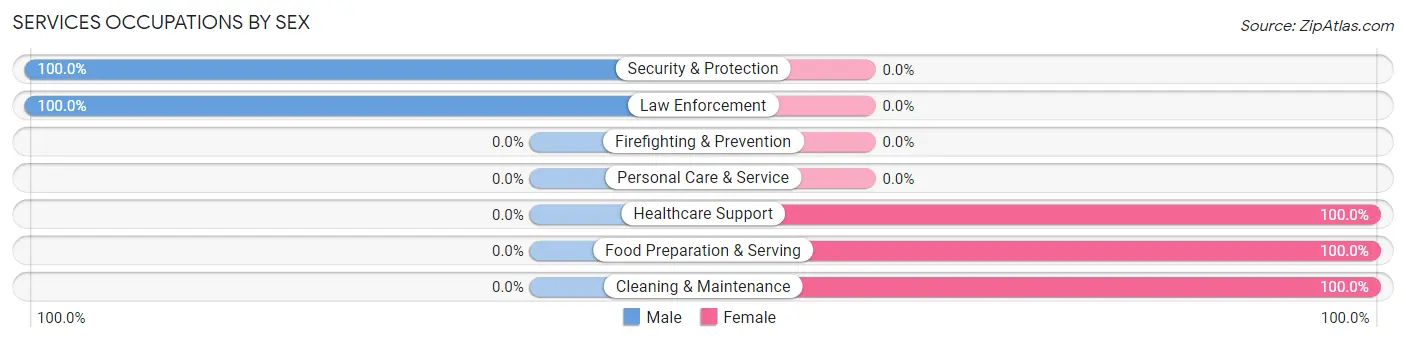
Services Occupations by Sex
Within the Services occupations in Frankfort Springs borough, the most male-oriented occupations are Security & Protection (100.0%), and Law Enforcement (100.0%), while the most female-oriented occupations are Healthcare Support (100.0%), Food Preparation & Serving (100.0%), and Cleaning & Maintenance (100.0%).
| Occupation | Male | Female |
| Healthcare Support | 0 (0.0%) | 6 (100.0%) |
| Security & Protection | 2 (100.0%) | 0 (0.0%) |
| Firefighting & Prevention | 0 (0.0%) | 0 (0.0%) |
| Law Enforcement | 2 (100.0%) | 0 (0.0%) |
| Food Preparation & Serving | 0 (0.0%) | 6 (100.0%) |
| Cleaning & Maintenance | 0 (0.0%) | 5 (100.0%) |
| Personal Care & Service | 0 (0.0%) | 0 (0.0%) |
| Total (Category) | 2 (10.5%) | 17 (89.5%) |
| Total (Overall) | 35 (53.0%) | 31 (47.0%) |
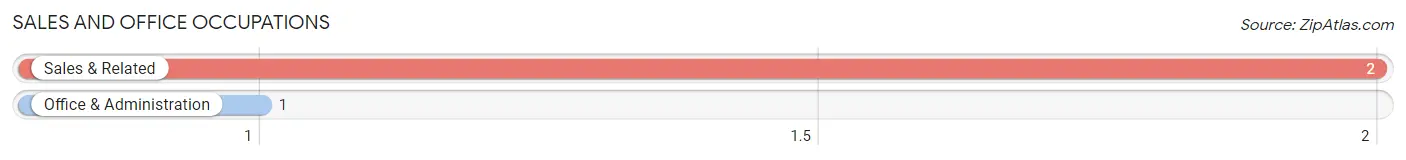
Sales and Office Occupations
The most common Sales and Office occupations in Frankfort Springs borough are Sales & Related (2 | 3.0%), and Office & Administration (1 | 1.5%).
Sales and Office Occupations by Sex
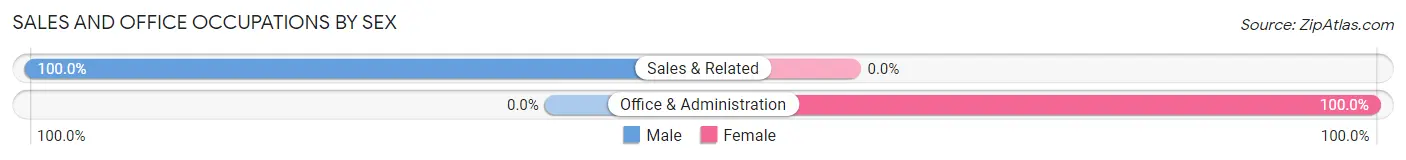
| Occupation | Male | Female |
| Sales & Related | 2 (100.0%) | 0 (0.0%) |
| Office & Administration | 0 (0.0%) | 1 (100.0%) |
| Total (Category) | 2 (66.7%) | 1 (33.3%) |
| Total (Overall) | 35 (53.0%) | 31 (47.0%) |
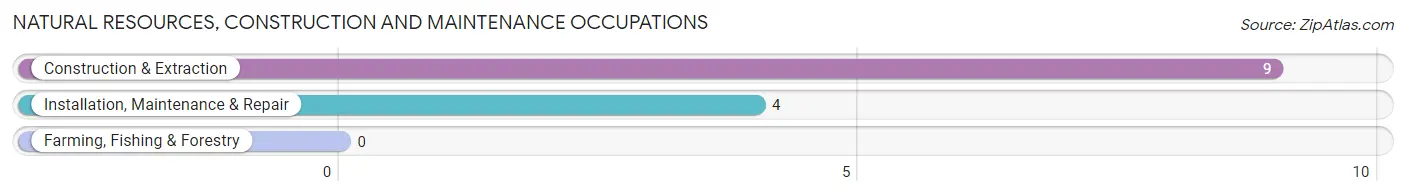
Natural Resources, Construction and Maintenance Occupations
The most common Natural Resources, Construction and Maintenance occupations in Frankfort Springs borough are Construction & Extraction (9 | 13.6%), and Installation, Maintenance & Repair (4 | 6.1%).
Natural Resources, Construction and Maintenance Occupations by Sex
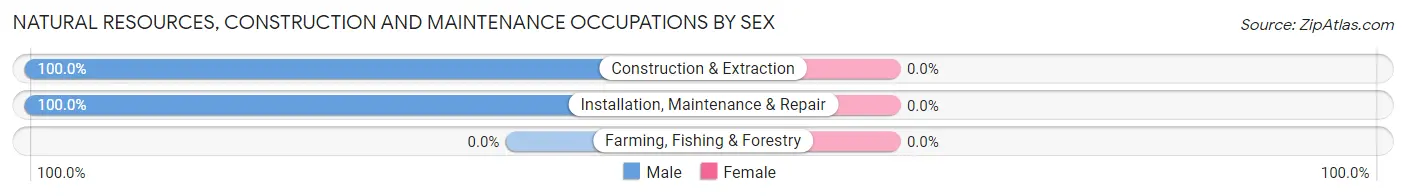
| Occupation | Male | Female |
| Farming, Fishing & Forestry | 0 (0.0%) | 0 (0.0%) |
| Construction & Extraction | 9 (100.0%) | 0 (0.0%) |
| Installation, Maintenance & Repair | 4 (100.0%) | 0 (0.0%) |
| Total (Category) | 13 (100.0%) | 0 (0.0%) |
| Total (Overall) | 35 (53.0%) | 31 (47.0%) |
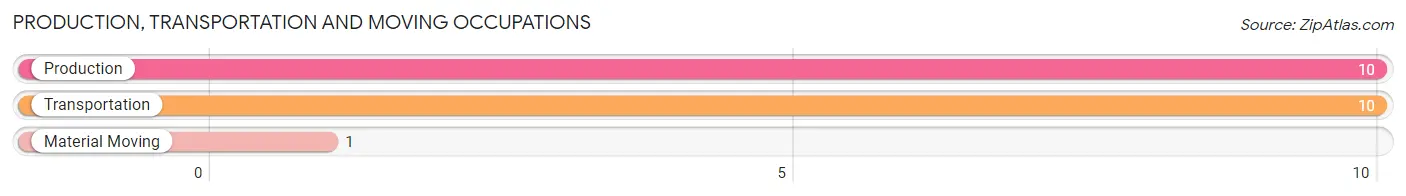
Production, Transportation and Moving Occupations
The most common Production, Transportation and Moving occupations in Frankfort Springs borough are Production (10 | 15.1%), Transportation (10 | 15.1%), and Material Moving (1 | 1.5%).
Production, Transportation and Moving Occupations by Sex
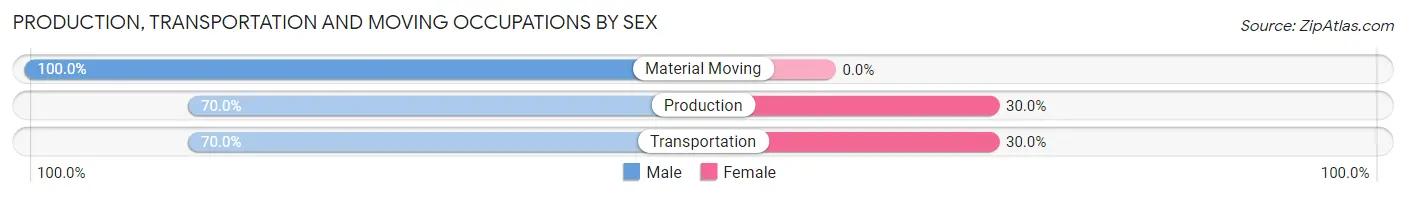
| Occupation | Male | Female |
| Production | 7 (70.0%) | 3 (30.0%) |
| Transportation | 7 (70.0%) | 3 (30.0%) |
| Material Moving | 1 (100.0%) | 0 (0.0%) |
| Total (Category) | 15 (71.4%) | 6 (28.6%) |
| Total (Overall) | 35 (53.0%) | 31 (47.0%) |
Employment Industries by Sex in Frankfort Springs borough
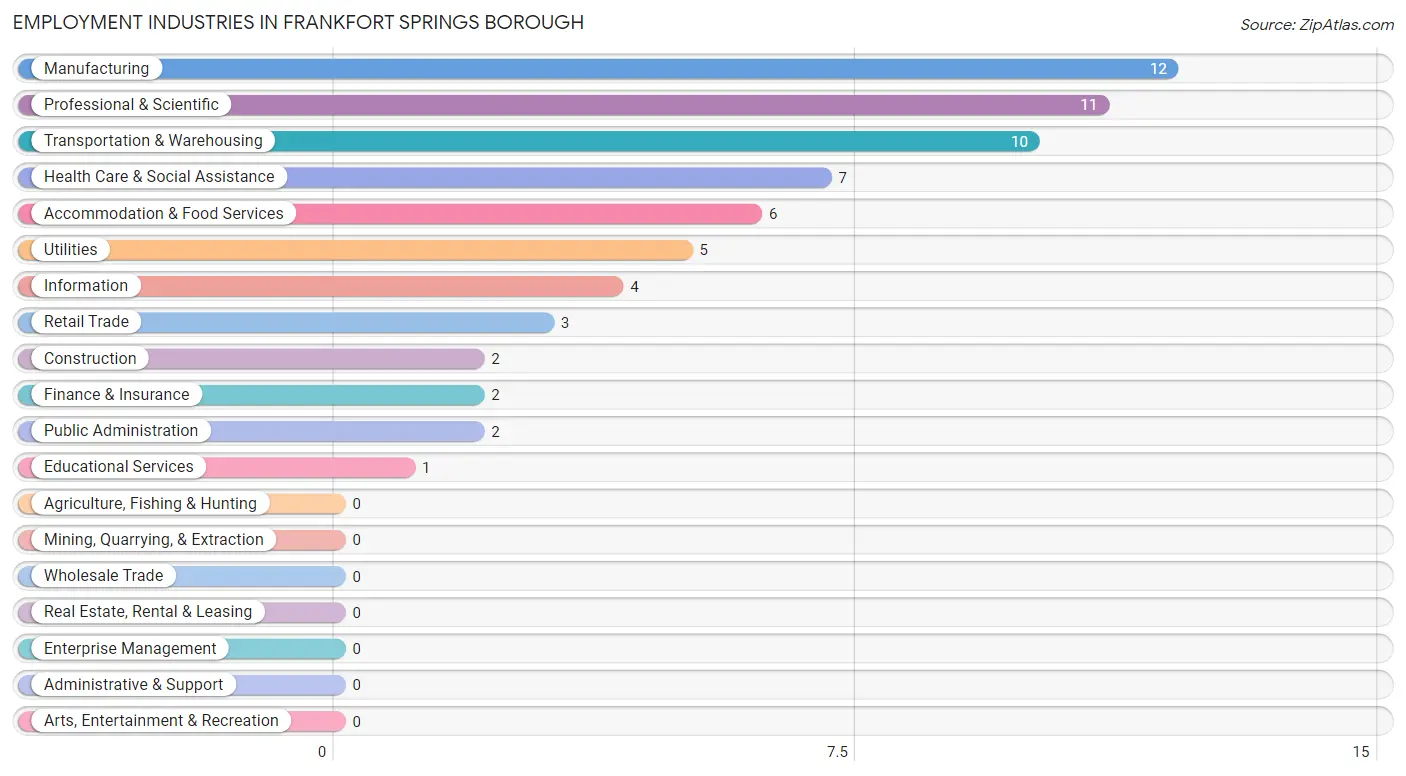
Employment Industries in Frankfort Springs borough
The major employment industries in Frankfort Springs borough include Manufacturing (12 | 18.2%), Professional & Scientific (11 | 16.7%), Transportation & Warehousing (10 | 15.1%), Health Care & Social Assistance (7 | 10.6%), and Accommodation & Food Services (6 | 9.1%).
Employment Industries by Sex in Frankfort Springs borough
The Frankfort Springs borough industries that see more men than women are Construction (100.0%), Retail Trade (100.0%), and Information (100.0%), whereas the industries that tend to have a higher number of women are Utilities (100.0%), Finance & Insurance (100.0%), and Educational Services (100.0%).
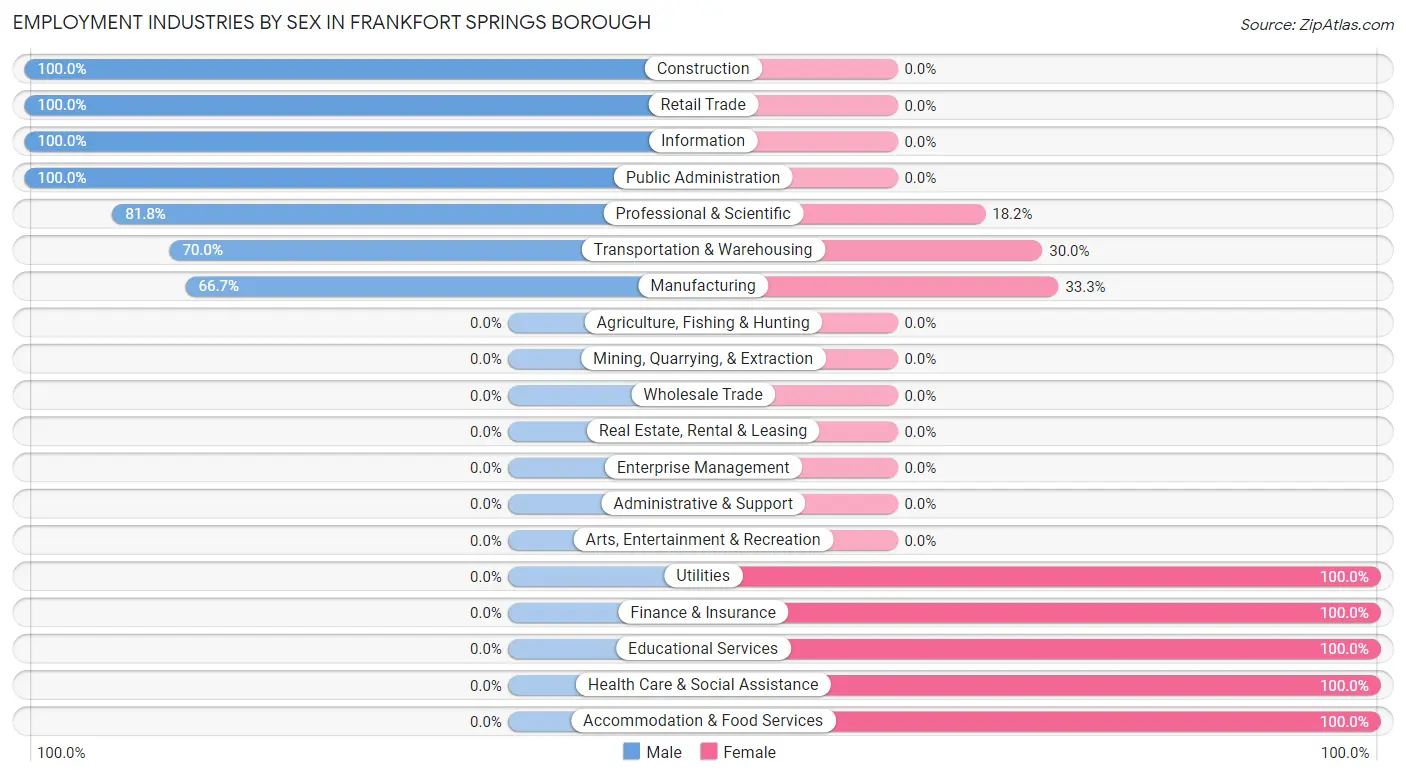
| Industry | Male | Female |
| Agriculture, Fishing & Hunting | 0 (0.0%) | 0 (0.0%) |
| Mining, Quarrying, & Extraction | 0 (0.0%) | 0 (0.0%) |
| Construction | 2 (100.0%) | 0 (0.0%) |
| Manufacturing | 8 (66.7%) | 4 (33.3%) |
| Wholesale Trade | 0 (0.0%) | 0 (0.0%) |
| Retail Trade | 3 (100.0%) | 0 (0.0%) |
| Transportation & Warehousing | 7 (70.0%) | 3 (30.0%) |
| Utilities | 0 (0.0%) | 5 (100.0%) |
| Information | 4 (100.0%) | 0 (0.0%) |
| Finance & Insurance | 0 (0.0%) | 2 (100.0%) |
| Real Estate, Rental & Leasing | 0 (0.0%) | 0 (0.0%) |
| Professional & Scientific | 9 (81.8%) | 2 (18.2%) |
| Enterprise Management | 0 (0.0%) | 0 (0.0%) |
| Administrative & Support | 0 (0.0%) | 0 (0.0%) |
| Educational Services | 0 (0.0%) | 1 (100.0%) |
| Health Care & Social Assistance | 0 (0.0%) | 7 (100.0%) |
| Arts, Entertainment & Recreation | 0 (0.0%) | 0 (0.0%) |
| Accommodation & Food Services | 0 (0.0%) | 6 (100.0%) |
| Public Administration | 2 (100.0%) | 0 (0.0%) |
| Total | 35 (53.0%) | 31 (47.0%) |
Education in Frankfort Springs borough
School Enrollment in Frankfort Springs borough
The most common levels of schooling among the 53 students in Frankfort Springs borough are high school (20 | 37.7%), middle school (13 | 24.5%), and elementary school (10 | 18.9%).
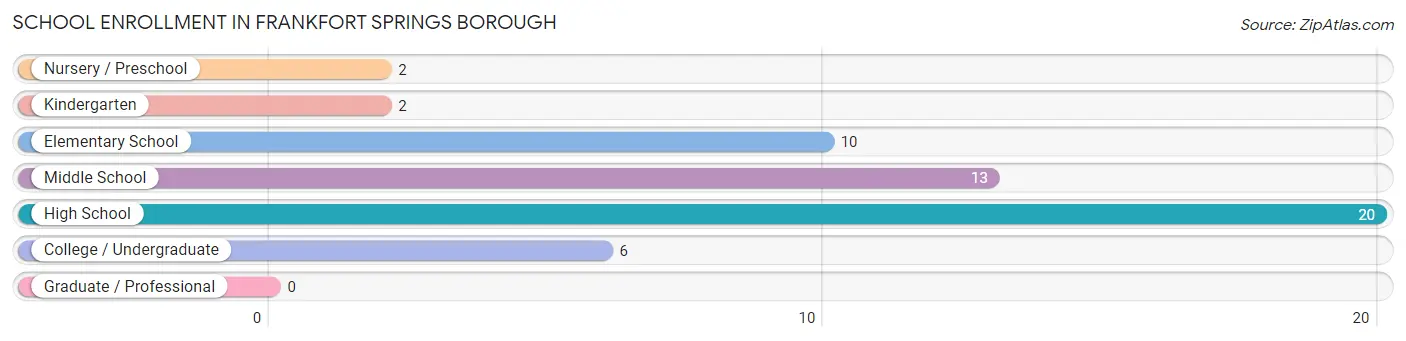
| School Level | # Students | % Students |
| Nursery / Preschool | 2 | 3.8% |
| Kindergarten | 2 | 3.8% |
| Elementary School | 10 | 18.9% |
| Middle School | 13 | 24.5% |
| High School | 20 | 37.7% |
| College / Undergraduate | 6 | 11.3% |
| Graduate / Professional | 0 | 0.0% |
| Total | 53 | 100.0% |
School Enrollment by Age by Funding Source in Frankfort Springs borough
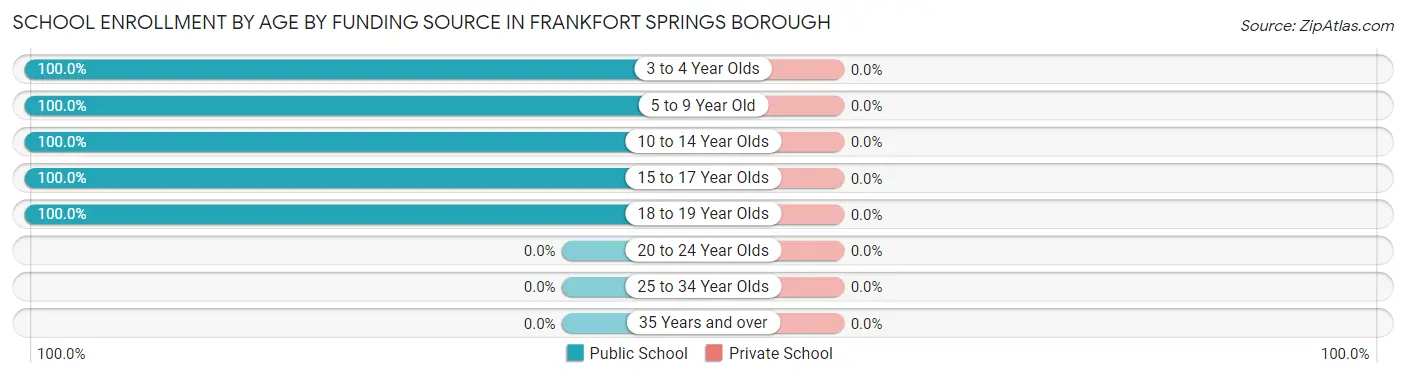
| Age Bracket | Public School | Private School |
| 3 to 4 Year Olds | 2 (100.0%) | 0 (0.0%) |
| 5 to 9 Year Old | 12 (100.0%) | 0 (0.0%) |
| 10 to 14 Year Olds | 13 (100.0%) | 0 (0.0%) |
| 15 to 17 Year Olds | 14 (100.0%) | 0 (0.0%) |
| 18 to 19 Year Olds | 12 (100.0%) | 0 (0.0%) |
| 20 to 24 Year Olds | 0 (0.0%) | 0 (0.0%) |
| 25 to 34 Year Olds | 0 (0.0%) | 0 (0.0%) |
| 35 Years and over | 0 (0.0%) | 0 (0.0%) |
| Total | 53 (100.0%) | 0 (0.0%) |
Educational Attainment by Field of Study in Frankfort Springs borough
Business (8 | 80.0%), computers & mathematics (1 | 10.0%), and education (1 | 10.0%) are the most common fields of study among 10 individuals in Frankfort Springs borough who have obtained a bachelor's degree or higher.
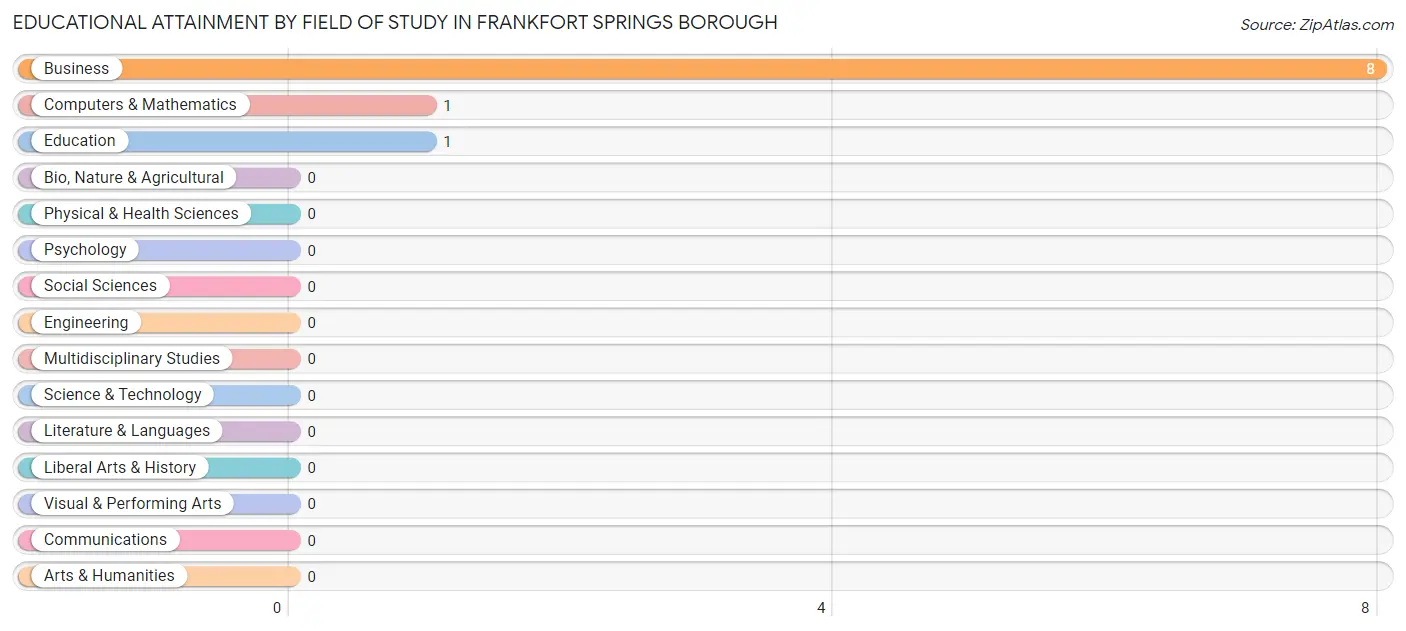
| Field of Study | # Graduates | % Graduates |
| Computers & Mathematics | 1 | 10.0% |
| Bio, Nature & Agricultural | 0 | 0.0% |
| Physical & Health Sciences | 0 | 0.0% |
| Psychology | 0 | 0.0% |
| Social Sciences | 0 | 0.0% |
| Engineering | 0 | 0.0% |
| Multidisciplinary Studies | 0 | 0.0% |
| Science & Technology | 0 | 0.0% |
| Business | 8 | 80.0% |
| Education | 1 | 10.0% |
| Literature & Languages | 0 | 0.0% |
| Liberal Arts & History | 0 | 0.0% |
| Visual & Performing Arts | 0 | 0.0% |
| Communications | 0 | 0.0% |
| Arts & Humanities | 0 | 0.0% |
| Total | 10 | 100.0% |
Transportation & Commute in Frankfort Springs borough
Vehicle Availability by Sex in Frankfort Springs borough
The most prevalent vehicle ownership categories in Frankfort Springs borough are males with 2 vehicles (16, accounting for 45.7%) and females with 2 vehicles (14, making up 51.6%).
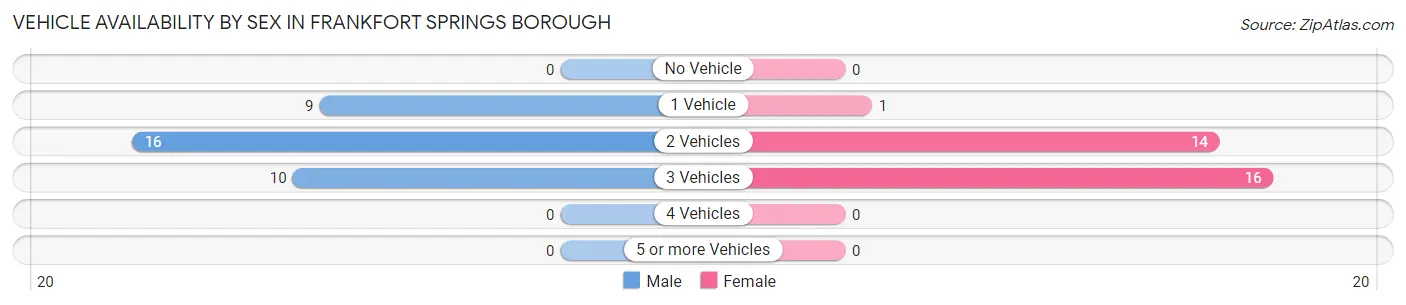
| Vehicles Available | Male | Female |
| No Vehicle | 0 (0.0%) | 0 (0.0%) |
| 1 Vehicle | 9 (25.7%) | 1 (3.2%) |
| 2 Vehicles | 16 (45.7%) | 14 (45.2%) |
| 3 Vehicles | 10 (28.6%) | 16 (51.6%) |
| 4 Vehicles | 0 (0.0%) | 0 (0.0%) |
| 5 or more Vehicles | 0 (0.0%) | 0 (0.0%) |
| Total | 35 (100.0%) | 31 (100.0%) |
Commute Time in Frankfort Springs borough
The most frequently occuring commute durations in Frankfort Springs borough are 10 to 14 minutes (12 commuters, 20.0%), 15 to 19 minutes (8 commuters, 13.3%), and 25 to 29 minutes (7 commuters, 11.7%).
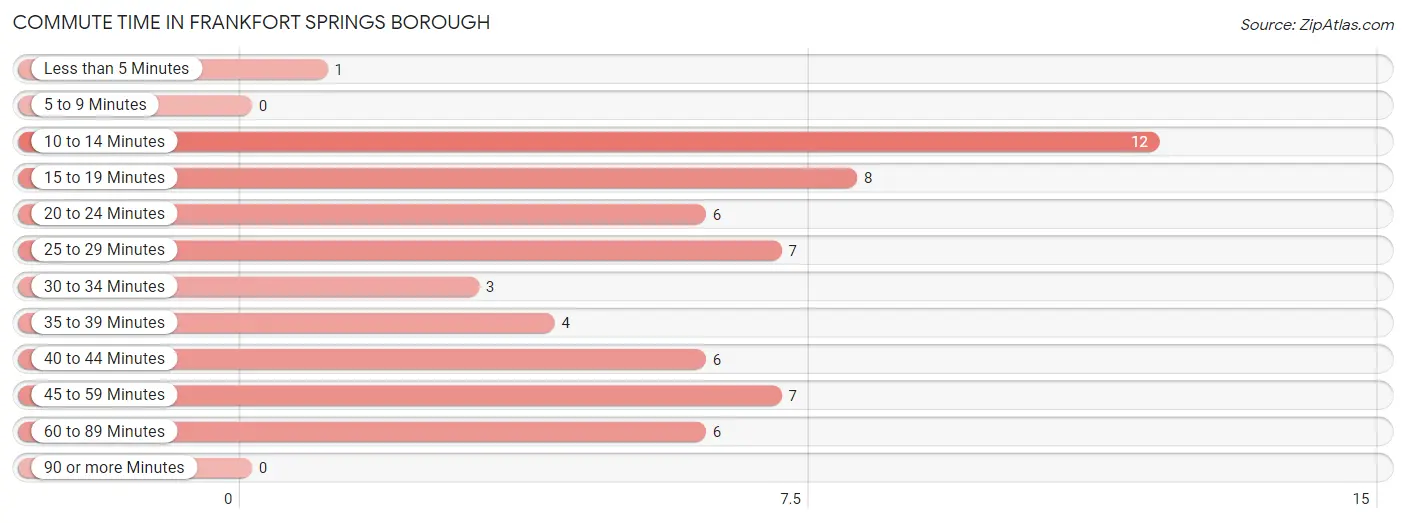
| Commute Time | # Commuters | % Commuters |
| Less than 5 Minutes | 1 | 1.7% |
| 5 to 9 Minutes | 0 | 0.0% |
| 10 to 14 Minutes | 12 | 20.0% |
| 15 to 19 Minutes | 8 | 13.3% |
| 20 to 24 Minutes | 6 | 10.0% |
| 25 to 29 Minutes | 7 | 11.7% |
| 30 to 34 Minutes | 3 | 5.0% |
| 35 to 39 Minutes | 4 | 6.7% |
| 40 to 44 Minutes | 6 | 10.0% |
| 45 to 59 Minutes | 7 | 11.7% |
| 60 to 89 Minutes | 6 | 10.0% |
| 90 or more Minutes | 0 | 0.0% |
Commute Time by Sex in Frankfort Springs borough
The most common commute times in Frankfort Springs borough are 15 to 19 minutes (8 commuters, 24.2%) for males and 10 to 14 minutes (10 commuters, 37.0%) for females.
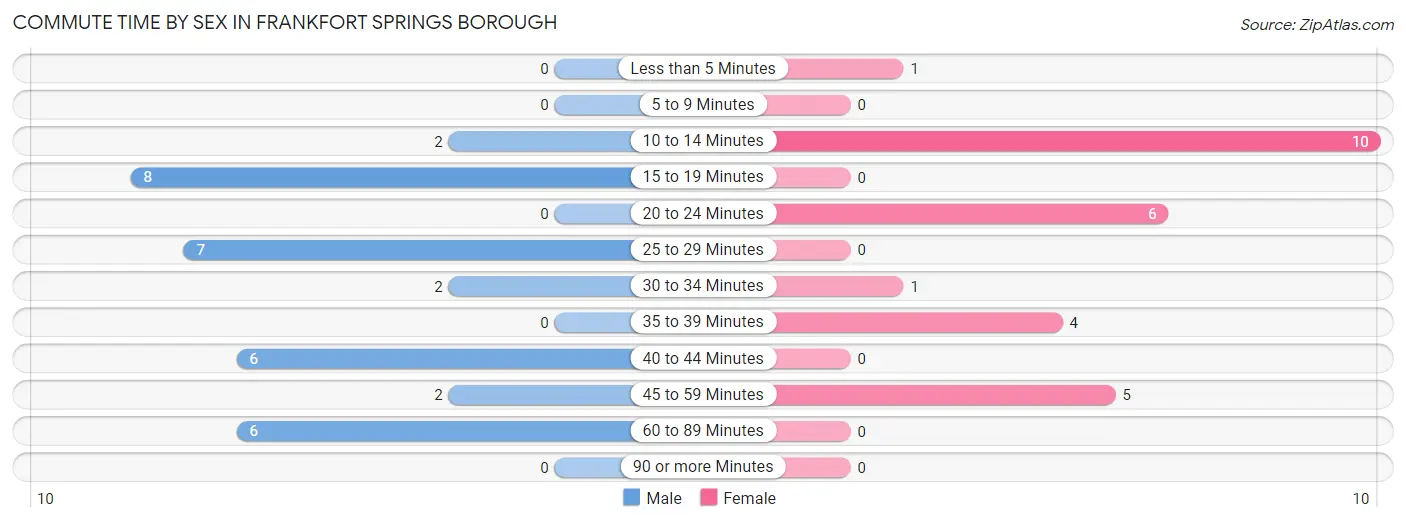
| Commute Time | Male | Female |
| Less than 5 Minutes | 0 (0.0%) | 1 (3.7%) |
| 5 to 9 Minutes | 0 (0.0%) | 0 (0.0%) |
| 10 to 14 Minutes | 2 (6.1%) | 10 (37.0%) |
| 15 to 19 Minutes | 8 (24.2%) | 0 (0.0%) |
| 20 to 24 Minutes | 0 (0.0%) | 6 (22.2%) |
| 25 to 29 Minutes | 7 (21.2%) | 0 (0.0%) |
| 30 to 34 Minutes | 2 (6.1%) | 1 (3.7%) |
| 35 to 39 Minutes | 0 (0.0%) | 4 (14.8%) |
| 40 to 44 Minutes | 6 (18.2%) | 0 (0.0%) |
| 45 to 59 Minutes | 2 (6.1%) | 5 (18.5%) |
| 60 to 89 Minutes | 6 (18.2%) | 0 (0.0%) |
| 90 or more Minutes | 0 (0.0%) | 0 (0.0%) |
Time of Departure to Work by Sex in Frankfort Springs borough
The most frequent times of departure to work in Frankfort Springs borough are 5:00 AM to 5:29 AM (10, 30.3%) for males and 12:00 PM to 3:59 PM (6, 22.2%) for females.
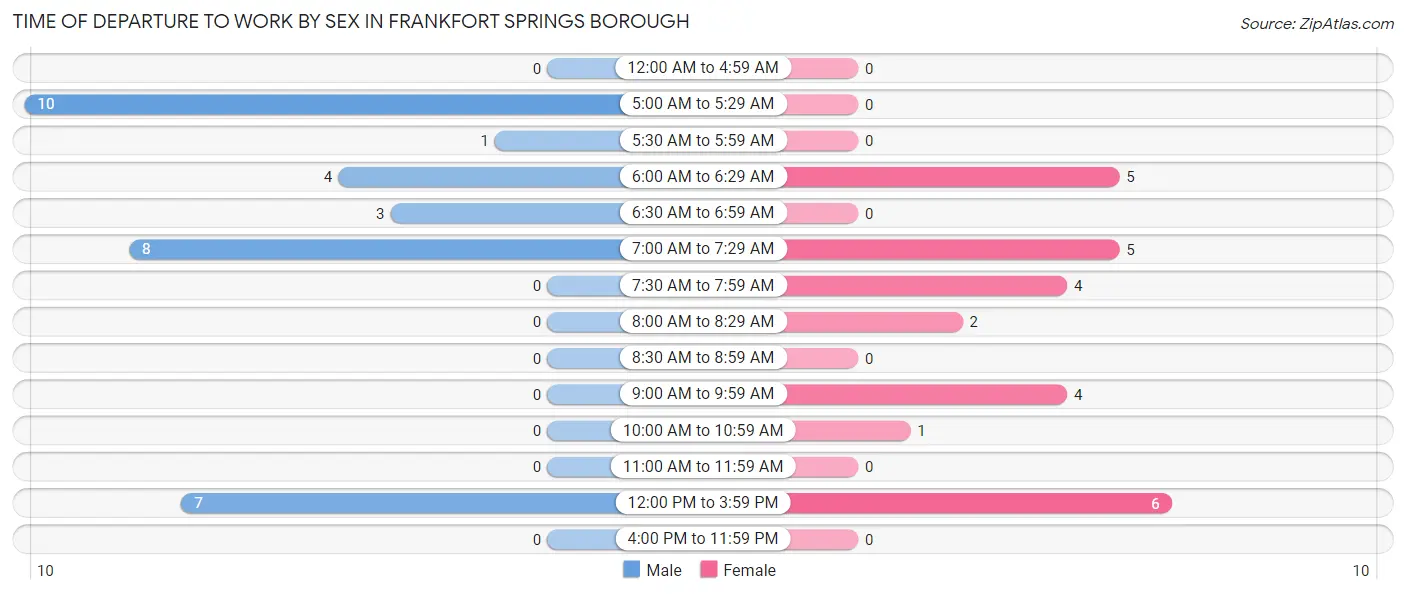
| Time of Departure | Male | Female |
| 12:00 AM to 4:59 AM | 0 (0.0%) | 0 (0.0%) |
| 5:00 AM to 5:29 AM | 10 (30.3%) | 0 (0.0%) |
| 5:30 AM to 5:59 AM | 1 (3.0%) | 0 (0.0%) |
| 6:00 AM to 6:29 AM | 4 (12.1%) | 5 (18.5%) |
| 6:30 AM to 6:59 AM | 3 (9.1%) | 0 (0.0%) |
| 7:00 AM to 7:29 AM | 8 (24.2%) | 5 (18.5%) |
| 7:30 AM to 7:59 AM | 0 (0.0%) | 4 (14.8%) |
| 8:00 AM to 8:29 AM | 0 (0.0%) | 2 (7.4%) |
| 8:30 AM to 8:59 AM | 0 (0.0%) | 0 (0.0%) |
| 9:00 AM to 9:59 AM | 0 (0.0%) | 4 (14.8%) |
| 10:00 AM to 10:59 AM | 0 (0.0%) | 1 (3.7%) |
| 11:00 AM to 11:59 AM | 0 (0.0%) | 0 (0.0%) |
| 12:00 PM to 3:59 PM | 7 (21.2%) | 6 (22.2%) |
| 4:00 PM to 11:59 PM | 0 (0.0%) | 0 (0.0%) |
| Total | 33 (100.0%) | 27 (100.0%) |
Housing Occupancy in Frankfort Springs borough
Occupancy by Ownership in Frankfort Springs borough
Of the total 45 dwellings in Frankfort Springs borough, owner-occupied units account for 34 (75.6%), while renter-occupied units make up 11 (24.4%).
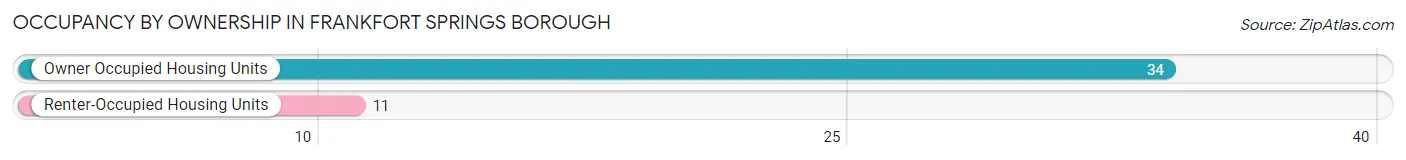
| Occupancy | # Housing Units | % Housing Units |
| Owner Occupied Housing Units | 34 | 75.6% |
| Renter-Occupied Housing Units | 11 | 24.4% |
| Total Occupied Housing Units | 45 | 100.0% |
Occupancy by Household Size in Frankfort Springs borough
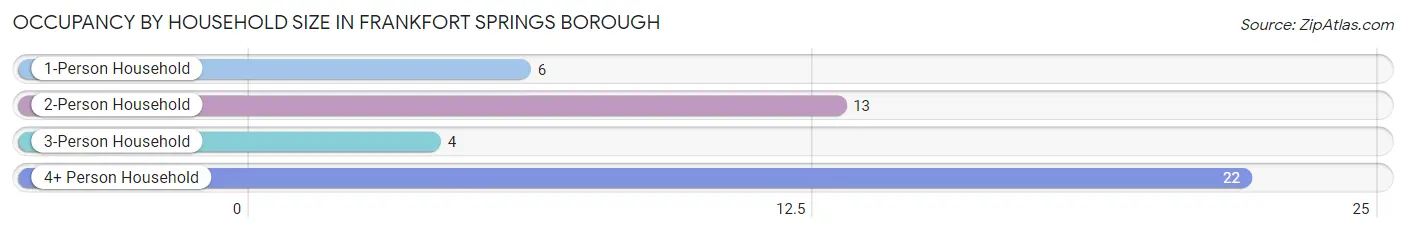
| Household Size | # Housing Units | % Housing Units |
| 1-Person Household | 6 | 13.3% |
| 2-Person Household | 13 | 28.9% |
| 3-Person Household | 4 | 8.9% |
| 4+ Person Household | 22 | 48.9% |
| Total Housing Units | 45 | 100.0% |
Occupancy by Ownership by Household Size in Frankfort Springs borough
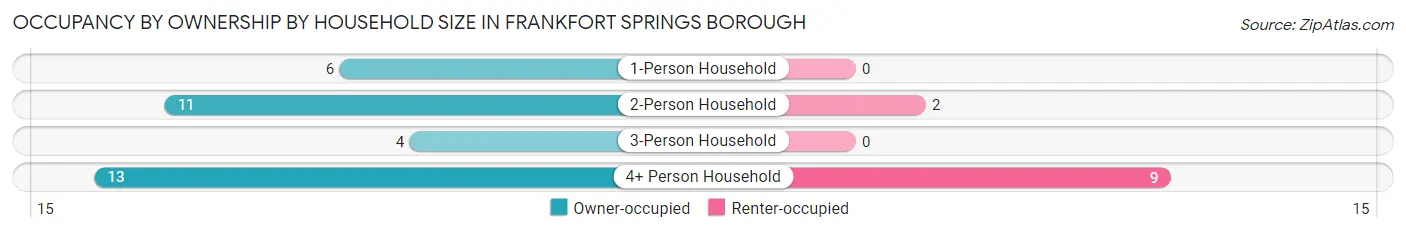
| Household Size | Owner-occupied | Renter-occupied |
| 1-Person Household | 6 (100.0%) | 0 (0.0%) |
| 2-Person Household | 11 (84.6%) | 2 (15.4%) |
| 3-Person Household | 4 (100.0%) | 0 (0.0%) |
| 4+ Person Household | 13 (59.1%) | 9 (40.9%) |
| Total Housing Units | 34 (75.6%) | 11 (24.4%) |
Occupancy by Educational Attainment in Frankfort Springs borough
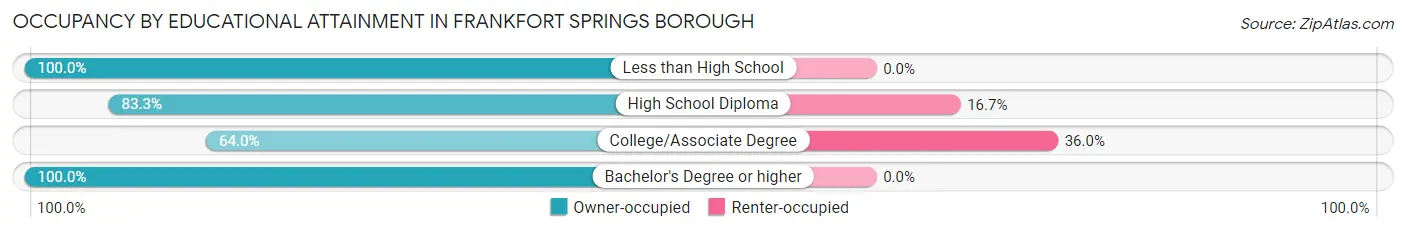
| Household Size | Owner-occupied | Renter-occupied |
| Less than High School | 4 (100.0%) | 0 (0.0%) |
| High School Diploma | 10 (83.3%) | 2 (16.7%) |
| College/Associate Degree | 16 (64.0%) | 9 (36.0%) |
| Bachelor's Degree or higher | 4 (100.0%) | 0 (0.0%) |
Occupancy by Age of Householder in Frankfort Springs borough
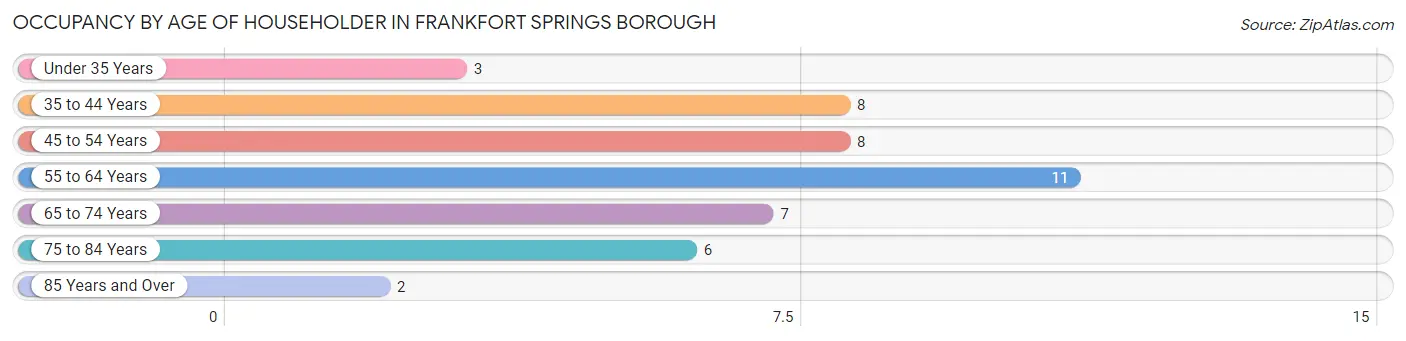
| Age Bracket | # Households | % Households |
| Under 35 Years | 3 | 6.7% |
| 35 to 44 Years | 8 | 17.8% |
| 45 to 54 Years | 8 | 17.8% |
| 55 to 64 Years | 11 | 24.4% |
| 65 to 74 Years | 7 | 15.6% |
| 75 to 84 Years | 6 | 13.3% |
| 85 Years and Over | 2 | 4.4% |
| Total | 45 | 100.0% |
Housing Finances in Frankfort Springs borough
Median Income by Occupancy in Frankfort Springs borough
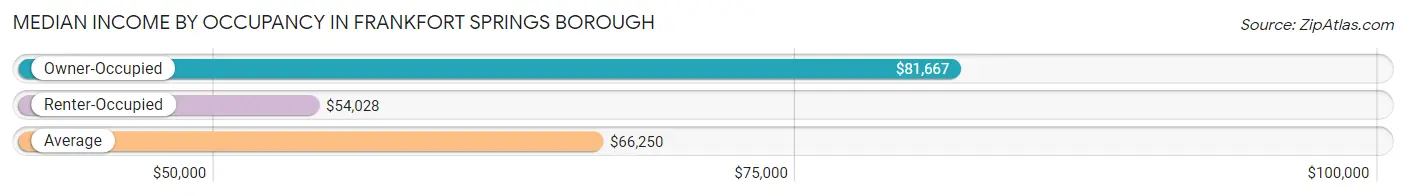
| Occupancy Type | # Households | Median Income |
| Owner-Occupied | 34 (75.6%) | $81,667 |
| Renter-Occupied | 11 (24.4%) | $54,028 |
| Average | 45 (100.0%) | $66,250 |
Occupancy by Householder Income Bracket in Frankfort Springs borough
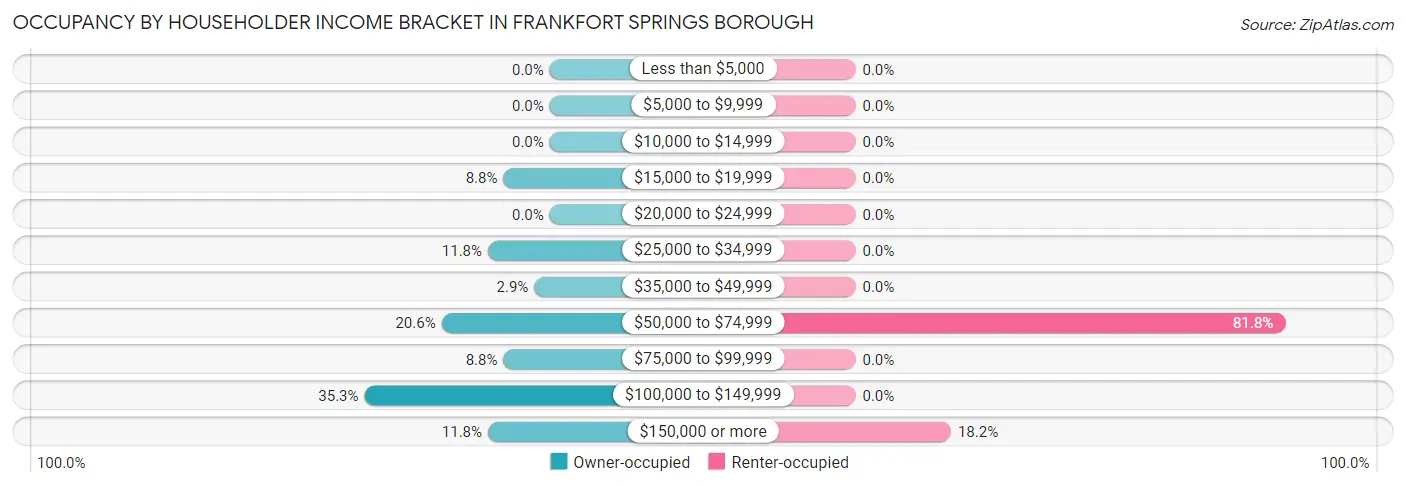
| Income Bracket | Owner-occupied | Renter-occupied |
| Less than $5,000 | 0 (0.0%) | 0 (0.0%) |
| $5,000 to $9,999 | 0 (0.0%) | 0 (0.0%) |
| $10,000 to $14,999 | 0 (0.0%) | 0 (0.0%) |
| $15,000 to $19,999 | 3 (8.8%) | 0 (0.0%) |
| $20,000 to $24,999 | 0 (0.0%) | 0 (0.0%) |
| $25,000 to $34,999 | 4 (11.8%) | 0 (0.0%) |
| $35,000 to $49,999 | 1 (2.9%) | 0 (0.0%) |
| $50,000 to $74,999 | 7 (20.6%) | 9 (81.8%) |
| $75,000 to $99,999 | 3 (8.8%) | 0 (0.0%) |
| $100,000 to $149,999 | 12 (35.3%) | 0 (0.0%) |
| $150,000 or more | 4 (11.8%) | 2 (18.2%) |
| Total | 34 (100.0%) | 11 (100.0%) |
Monthly Housing Cost Tiers in Frankfort Springs borough
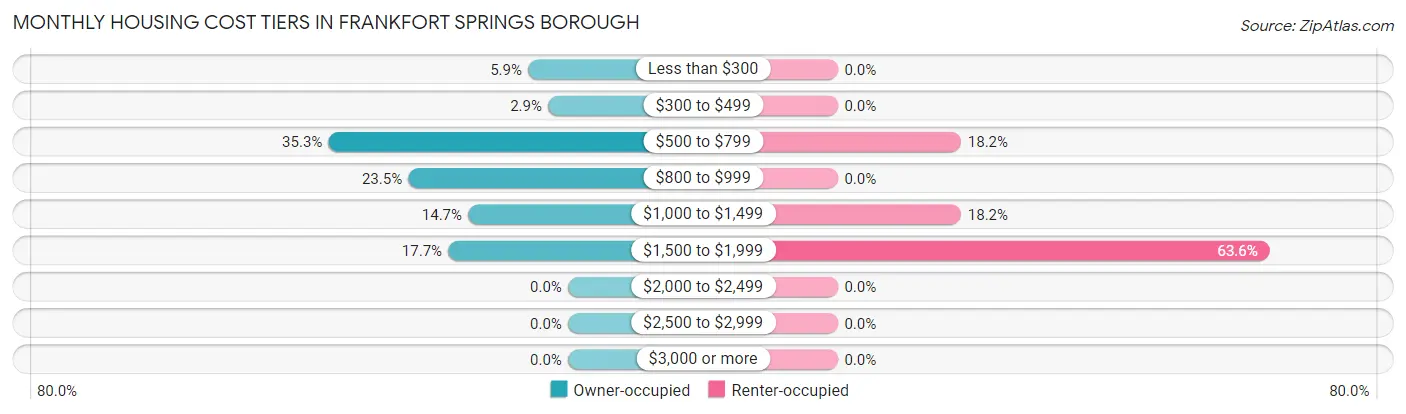
| Monthly Cost | Owner-occupied | Renter-occupied |
| Less than $300 | 2 (5.9%) | 0 (0.0%) |
| $300 to $499 | 1 (2.9%) | 0 (0.0%) |
| $500 to $799 | 12 (35.3%) | 2 (18.2%) |
| $800 to $999 | 8 (23.5%) | 0 (0.0%) |
| $1,000 to $1,499 | 5 (14.7%) | 2 (18.2%) |
| $1,500 to $1,999 | 6 (17.6%) | 7 (63.6%) |
| $2,000 to $2,499 | 0 (0.0%) | 0 (0.0%) |
| $2,500 to $2,999 | 0 (0.0%) | 0 (0.0%) |
| $3,000 or more | 0 (0.0%) | 0 (0.0%) |
| Total | 34 (100.0%) | 11 (100.0%) |
Physical Housing Characteristics in Frankfort Springs borough
Housing Structures in Frankfort Springs borough
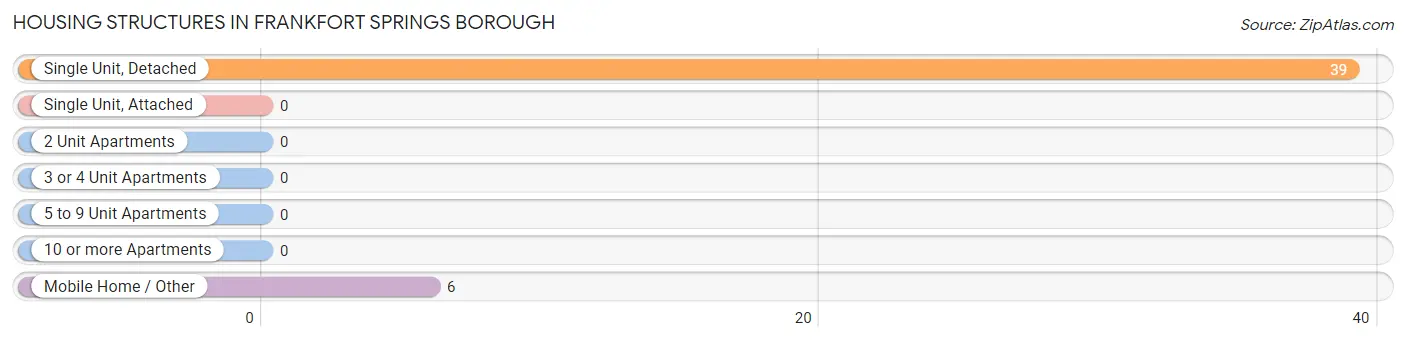
| Structure Type | # Housing Units | % Housing Units |
| Single Unit, Detached | 39 | 86.7% |
| Single Unit, Attached | 0 | 0.0% |
| 2 Unit Apartments | 0 | 0.0% |
| 3 or 4 Unit Apartments | 0 | 0.0% |
| 5 to 9 Unit Apartments | 0 | 0.0% |
| 10 or more Apartments | 0 | 0.0% |
| Mobile Home / Other | 6 | 13.3% |
| Total | 45 | 100.0% |
Housing Structures by Occupancy in Frankfort Springs borough
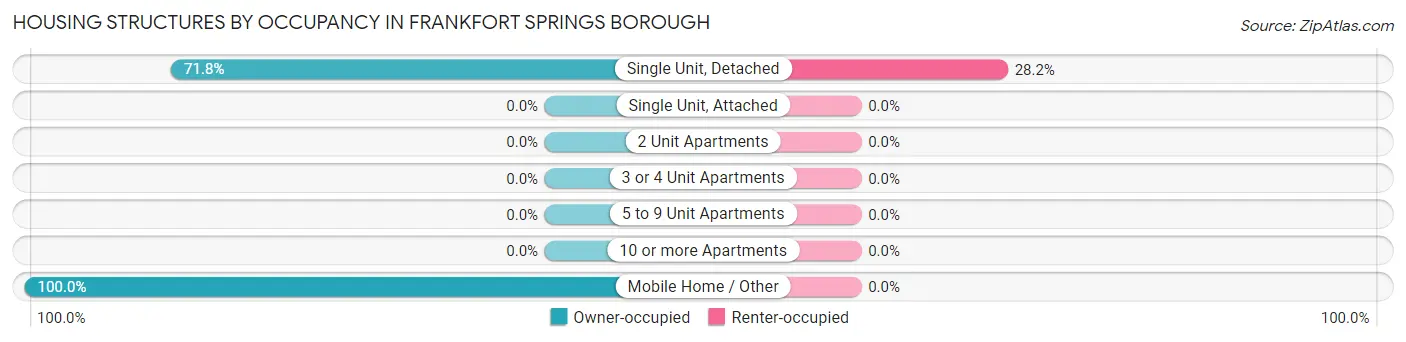
| Structure Type | Owner-occupied | Renter-occupied |
| Single Unit, Detached | 28 (71.8%) | 11 (28.2%) |
| Single Unit, Attached | 0 (0.0%) | 0 (0.0%) |
| 2 Unit Apartments | 0 (0.0%) | 0 (0.0%) |
| 3 or 4 Unit Apartments | 0 (0.0%) | 0 (0.0%) |
| 5 to 9 Unit Apartments | 0 (0.0%) | 0 (0.0%) |
| 10 or more Apartments | 0 (0.0%) | 0 (0.0%) |
| Mobile Home / Other | 6 (100.0%) | 0 (0.0%) |
| Total | 34 (75.6%) | 11 (24.4%) |
Housing Structures by Number of Rooms in Frankfort Springs borough
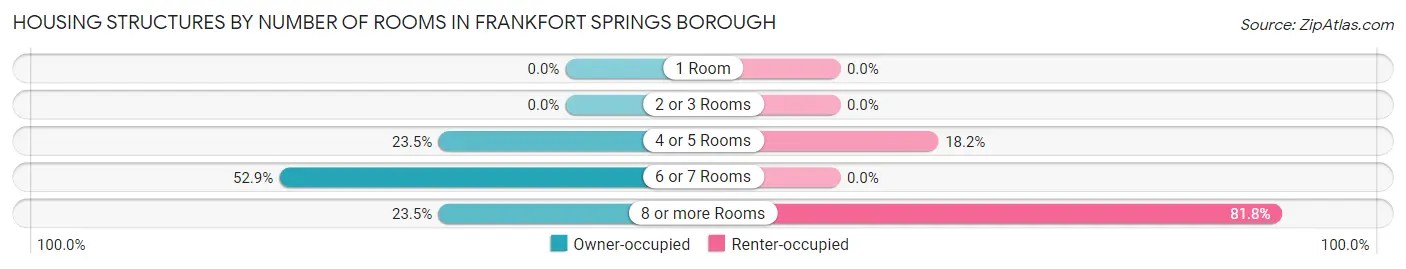
| Number of Rooms | Owner-occupied | Renter-occupied |
| 1 Room | 0 (0.0%) | 0 (0.0%) |
| 2 or 3 Rooms | 0 (0.0%) | 0 (0.0%) |
| 4 or 5 Rooms | 8 (23.5%) | 2 (18.2%) |
| 6 or 7 Rooms | 18 (52.9%) | 0 (0.0%) |
| 8 or more Rooms | 8 (23.5%) | 9 (81.8%) |
| Total | 34 (100.0%) | 11 (100.0%) |
Housing Structure by Heating Type in Frankfort Springs borough
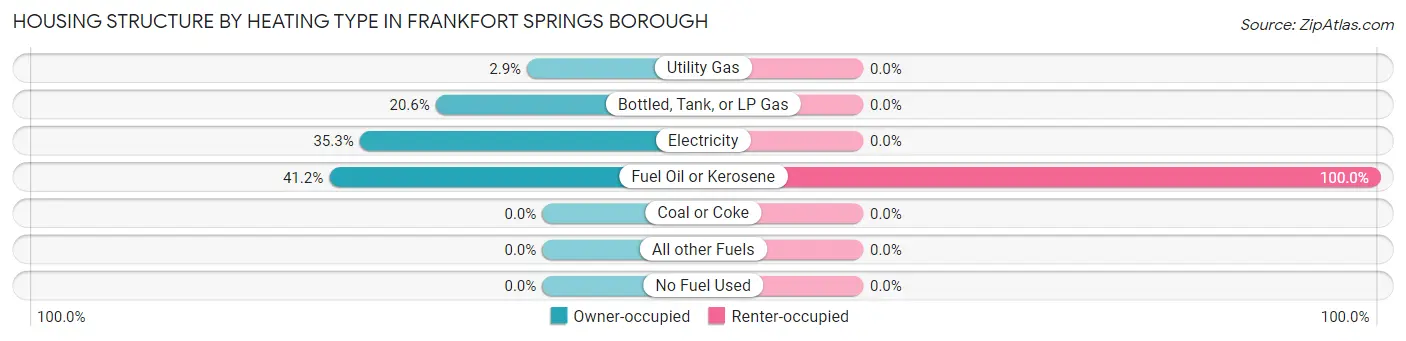
| Heating Type | Owner-occupied | Renter-occupied |
| Utility Gas | 1 (2.9%) | 0 (0.0%) |
| Bottled, Tank, or LP Gas | 7 (20.6%) | 0 (0.0%) |
| Electricity | 12 (35.3%) | 0 (0.0%) |
| Fuel Oil or Kerosene | 14 (41.2%) | 11 (100.0%) |
| Coal or Coke | 0 (0.0%) | 0 (0.0%) |
| All other Fuels | 0 (0.0%) | 0 (0.0%) |
| No Fuel Used | 0 (0.0%) | 0 (0.0%) |
| Total | 34 (100.0%) | 11 (100.0%) |
Household Vehicle Usage in Frankfort Springs borough
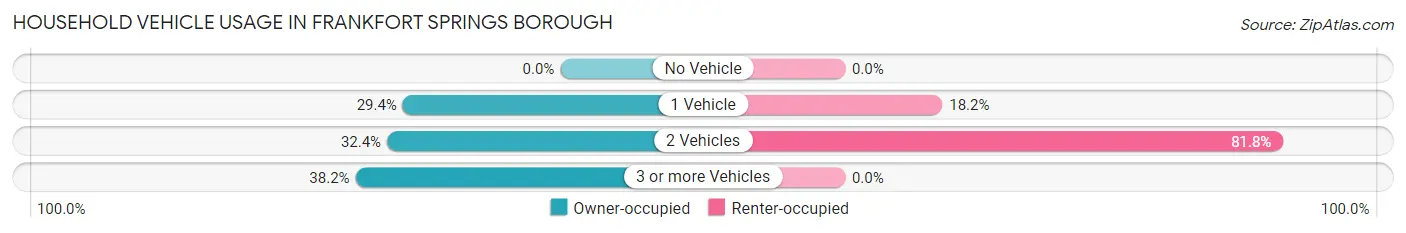
| Vehicles per Household | Owner-occupied | Renter-occupied |
| No Vehicle | 0 (0.0%) | 0 (0.0%) |
| 1 Vehicle | 10 (29.4%) | 2 (18.2%) |
| 2 Vehicles | 11 (32.4%) | 9 (81.8%) |
| 3 or more Vehicles | 13 (38.2%) | 0 (0.0%) |
| Total | 34 (100.0%) | 11 (100.0%) |
Real Estate & Mortgages in Frankfort Springs borough
Real Estate and Mortgage Overview in Frankfort Springs borough
| Characteristic | Without Mortgage | With Mortgage |
| Housing Units | 15 | 19 |
| Median Property Value | $112,500 | $152,500 |
| Median Household Income | $115,938 | $3 |
| Monthly Housing Costs | $650 | $0 |
| Real Estate Taxes | $1,321 | $0 |
Property Value by Mortgage Status in Frankfort Springs borough
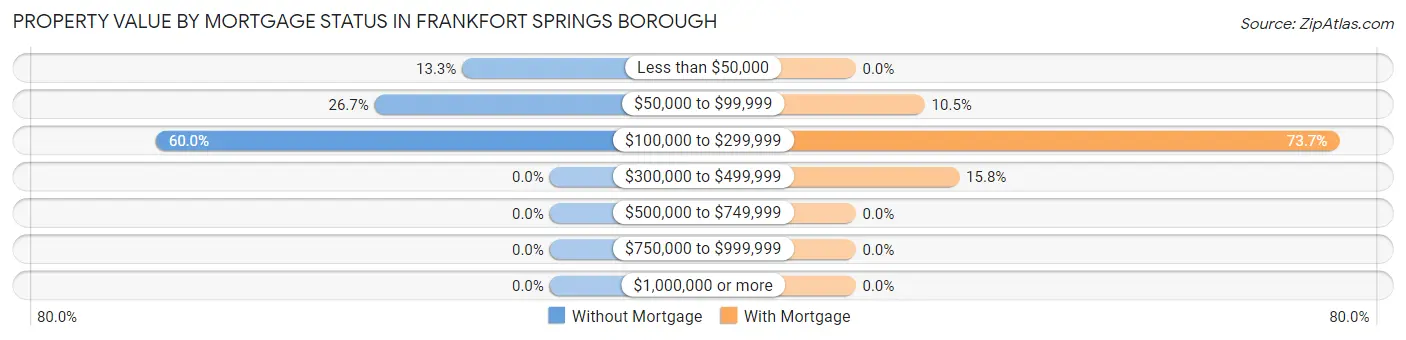
| Property Value | Without Mortgage | With Mortgage |
| Less than $50,000 | 2 (13.3%) | 0 (0.0%) |
| $50,000 to $99,999 | 4 (26.7%) | 2 (10.5%) |
| $100,000 to $299,999 | 9 (60.0%) | 14 (73.7%) |
| $300,000 to $499,999 | 0 (0.0%) | 3 (15.8%) |
| $500,000 to $749,999 | 0 (0.0%) | 0 (0.0%) |
| $750,000 to $999,999 | 0 (0.0%) | 0 (0.0%) |
| $1,000,000 or more | 0 (0.0%) | 0 (0.0%) |
| Total | 15 (100.0%) | 19 (100.0%) |
Household Income by Mortgage Status in Frankfort Springs borough
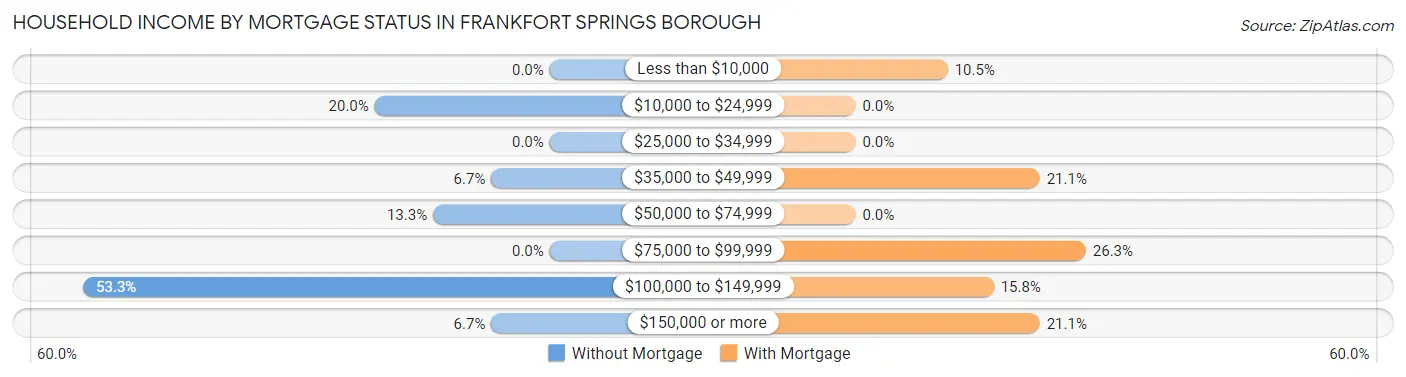
| Household Income | Without Mortgage | With Mortgage |
| Less than $10,000 | 0 (0.0%) | 2 (10.5%) |
| $10,000 to $24,999 | 3 (20.0%) | 0 (0.0%) |
| $25,000 to $34,999 | 0 (0.0%) | 0 (0.0%) |
| $35,000 to $49,999 | 1 (6.7%) | 4 (21.0%) |
| $50,000 to $74,999 | 2 (13.3%) | 0 (0.0%) |
| $75,000 to $99,999 | 0 (0.0%) | 5 (26.3%) |
| $100,000 to $149,999 | 8 (53.3%) | 3 (15.8%) |
| $150,000 or more | 1 (6.7%) | 4 (21.0%) |
| Total | 15 (100.0%) | 19 (100.0%) |
Property Value to Household Income Ratio in Frankfort Springs borough
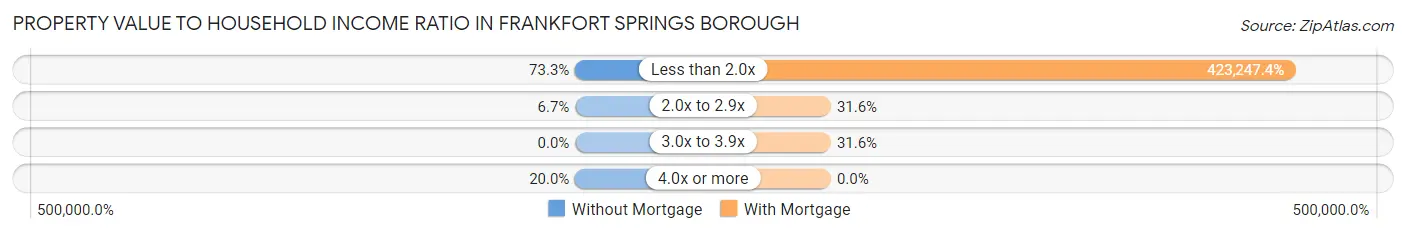
| Value-to-Income Ratio | Without Mortgage | With Mortgage |
| Less than 2.0x | 11 (73.3%) | 80,417 (423,247.4%) |
| 2.0x to 2.9x | 1 (6.7%) | 6 (31.6%) |
| 3.0x to 3.9x | 0 (0.0%) | 6 (31.6%) |
| 4.0x or more | 3 (20.0%) | 0 (0.0%) |
| Total | 15 (100.0%) | 19 (100.0%) |
Real Estate Taxes by Mortgage Status in Frankfort Springs borough
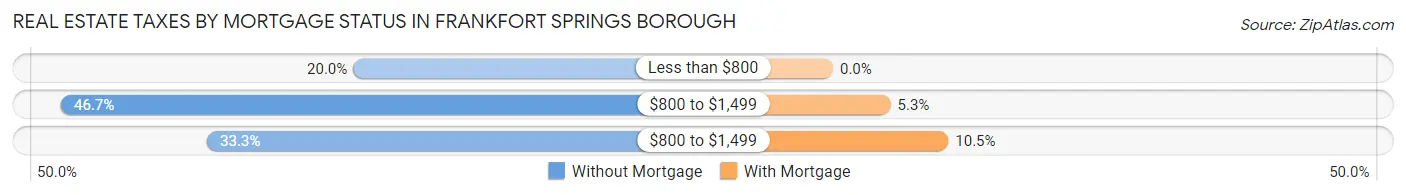
| Property Taxes | Without Mortgage | With Mortgage |
| Less than $800 | 3 (20.0%) | 0 (0.0%) |
| $800 to $1,499 | 7 (46.7%) | 1 (5.3%) |
| $800 to $1,499 | 5 (33.3%) | 2 (10.5%) |
| Total | 15 (100.0%) | 19 (100.0%) |
Health & Disability in Frankfort Springs borough
Health Insurance Coverage by Age in Frankfort Springs borough
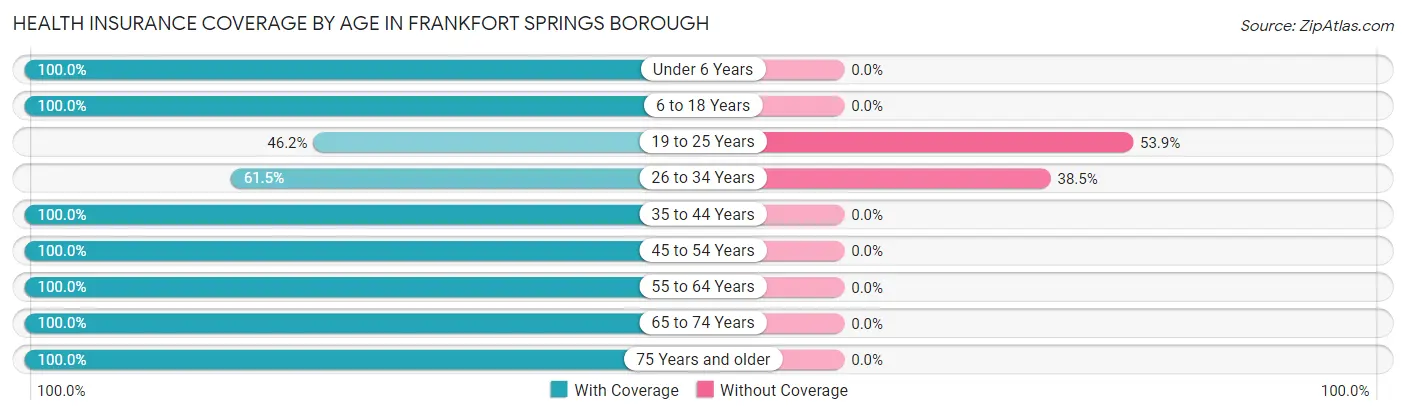
| Age Bracket | With Coverage | Without Coverage |
| Under 6 Years | 4 (100.0%) | 0 (0.0%) |
| 6 to 18 Years | 43 (100.0%) | 0 (0.0%) |
| 19 to 25 Years | 6 (46.2%) | 7 (53.8%) |
| 26 to 34 Years | 8 (61.5%) | 5 (38.5%) |
| 35 to 44 Years | 20 (100.0%) | 0 (0.0%) |
| 45 to 54 Years | 20 (100.0%) | 0 (0.0%) |
| 55 to 64 Years | 19 (100.0%) | 0 (0.0%) |
| 65 to 74 Years | 14 (100.0%) | 0 (0.0%) |
| 75 Years and older | 10 (100.0%) | 0 (0.0%) |
| Total | 144 (92.3%) | 12 (7.7%) |
Health Insurance Coverage by Citizenship Status in Frankfort Springs borough
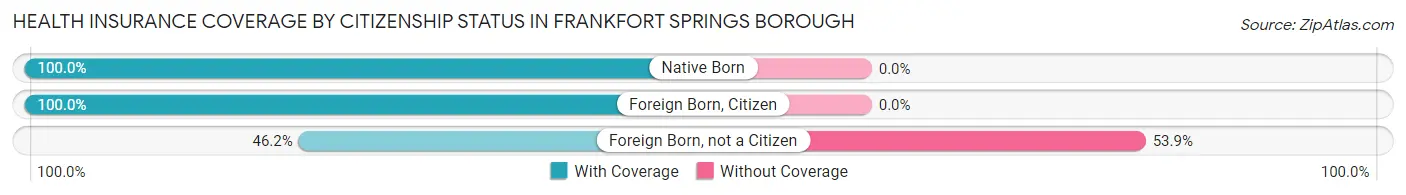
| Citizenship Status | With Coverage | Without Coverage |
| Native Born | 4 (100.0%) | 0 (0.0%) |
| Foreign Born, Citizen | 43 (100.0%) | 0 (0.0%) |
| Foreign Born, not a Citizen | 6 (46.2%) | 7 (53.8%) |
Health Insurance Coverage by Household Income in Frankfort Springs borough
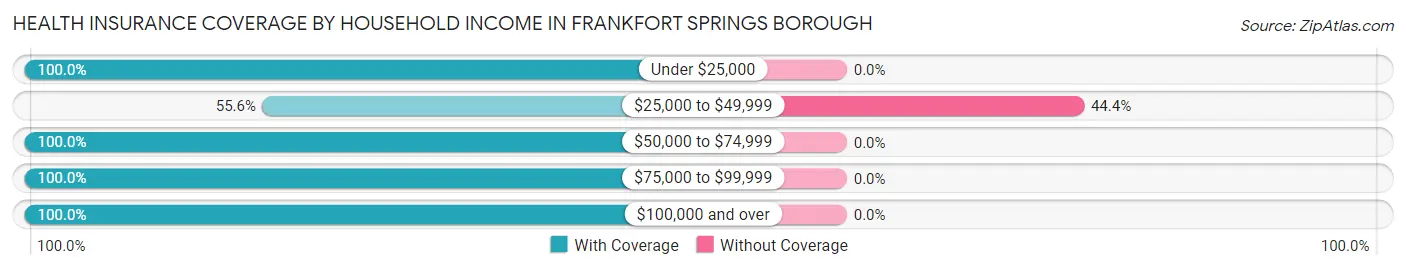
| Household Income | With Coverage | Without Coverage |
| Under $25,000 | 3 (100.0%) | 0 (0.0%) |
| $25,000 to $49,999 | 15 (55.6%) | 12 (44.4%) |
| $50,000 to $74,999 | 65 (100.0%) | 0 (0.0%) |
| $75,000 to $99,999 | 6 (100.0%) | 0 (0.0%) |
| $100,000 and over | 55 (100.0%) | 0 (0.0%) |
Public vs Private Health Insurance Coverage by Age in Frankfort Springs borough
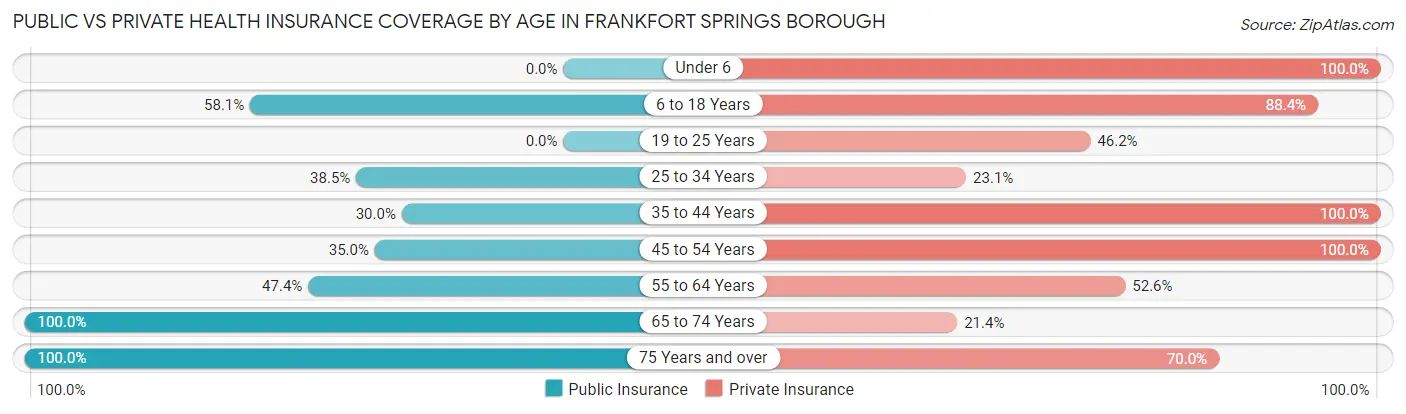
| Age Bracket | Public Insurance | Private Insurance |
| Under 6 | 0 (0.0%) | 4 (100.0%) |
| 6 to 18 Years | 25 (58.1%) | 38 (88.4%) |
| 19 to 25 Years | 0 (0.0%) | 6 (46.2%) |
| 25 to 34 Years | 5 (38.5%) | 3 (23.1%) |
| 35 to 44 Years | 6 (30.0%) | 20 (100.0%) |
| 45 to 54 Years | 7 (35.0%) | 20 (100.0%) |
| 55 to 64 Years | 9 (47.4%) | 10 (52.6%) |
| 65 to 74 Years | 14 (100.0%) | 3 (21.4%) |
| 75 Years and over | 10 (100.0%) | 7 (70.0%) |
| Total | 76 (48.7%) | 111 (71.2%) |
Disability Status by Sex by Age in Frankfort Springs borough
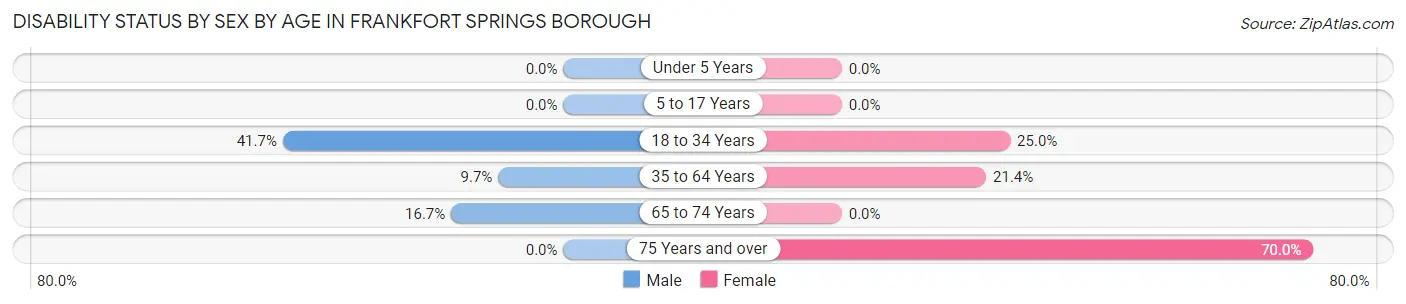
| Age Bracket | Male | Female |
| Under 5 Years | 0 (0.0%) | 0 (0.0%) |
| 5 to 17 Years | 0 (0.0%) | 0 (0.0%) |
| 18 to 34 Years | 5 (41.7%) | 5 (25.0%) |
| 35 to 64 Years | 3 (9.7%) | 6 (21.4%) |
| 65 to 74 Years | 1 (16.7%) | 0 (0.0%) |
| 75 Years and over | 0 (0.0%) | 7 (70.0%) |
Disability Class by Sex by Age in Frankfort Springs borough
Disability Class: Hearing Difficulty
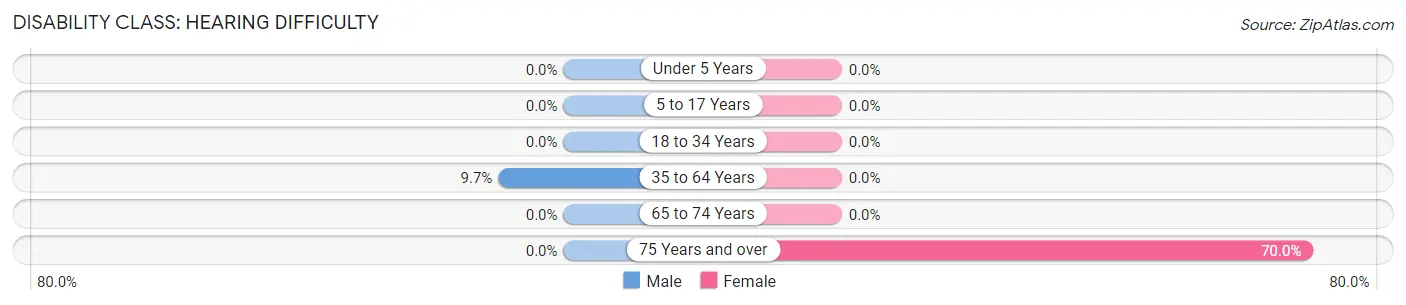
| Age Bracket | Male | Female |
| Under 5 Years | 0 (0.0%) | 0 (0.0%) |
| 5 to 17 Years | 0 (0.0%) | 0 (0.0%) |
| 18 to 34 Years | 0 (0.0%) | 0 (0.0%) |
| 35 to 64 Years | 3 (9.7%) | 0 (0.0%) |
| 65 to 74 Years | 0 (0.0%) | 0 (0.0%) |
| 75 Years and over | 0 (0.0%) | 7 (70.0%) |
Disability Class: Vision Difficulty
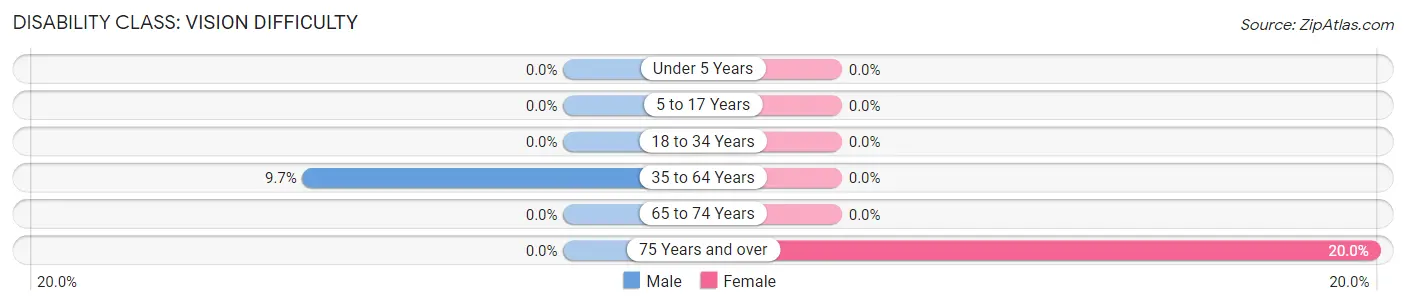
| Age Bracket | Male | Female |
| Under 5 Years | 0 (0.0%) | 0 (0.0%) |
| 5 to 17 Years | 0 (0.0%) | 0 (0.0%) |
| 18 to 34 Years | 0 (0.0%) | 0 (0.0%) |
| 35 to 64 Years | 3 (9.7%) | 0 (0.0%) |
| 65 to 74 Years | 0 (0.0%) | 0 (0.0%) |
| 75 Years and over | 0 (0.0%) | 2 (20.0%) |
Disability Class: Cognitive Difficulty
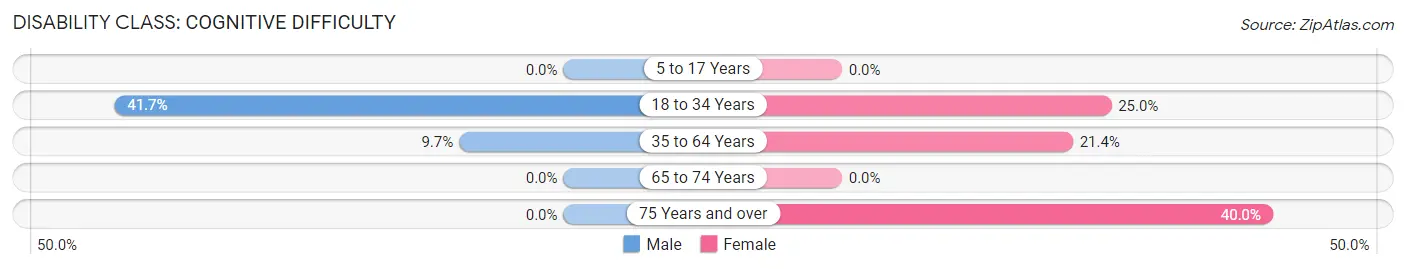
| Age Bracket | Male | Female |
| 5 to 17 Years | 0 (0.0%) | 0 (0.0%) |
| 18 to 34 Years | 5 (41.7%) | 5 (25.0%) |
| 35 to 64 Years | 3 (9.7%) | 6 (21.4%) |
| 65 to 74 Years | 0 (0.0%) | 0 (0.0%) |
| 75 Years and over | 0 (0.0%) | 4 (40.0%) |
Disability Class: Ambulatory Difficulty
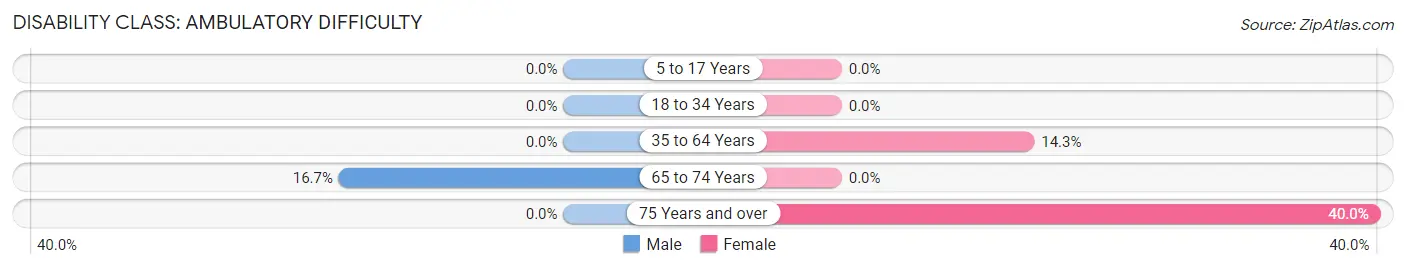
| Age Bracket | Male | Female |
| 5 to 17 Years | 0 (0.0%) | 0 (0.0%) |
| 18 to 34 Years | 0 (0.0%) | 0 (0.0%) |
| 35 to 64 Years | 0 (0.0%) | 4 (14.3%) |
| 65 to 74 Years | 1 (16.7%) | 0 (0.0%) |
| 75 Years and over | 0 (0.0%) | 4 (40.0%) |
Disability Class: Self-Care Difficulty
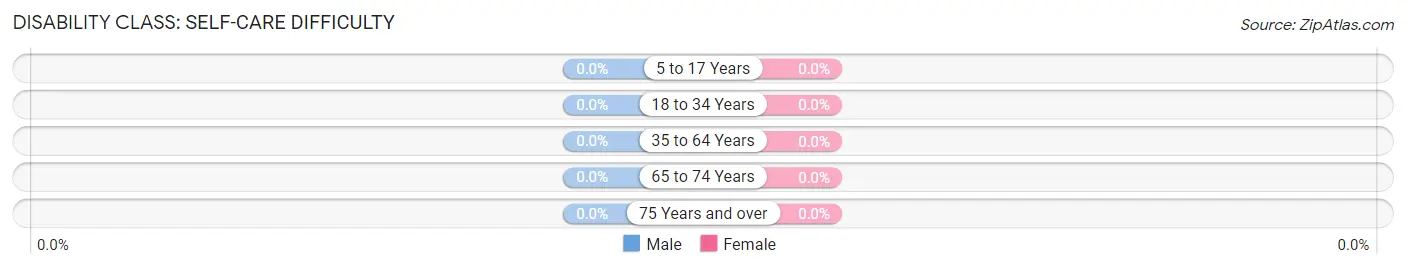
| Age Bracket | Male | Female |
| 5 to 17 Years | 0 (0.0%) | 0 (0.0%) |
| 18 to 34 Years | 0 (0.0%) | 0 (0.0%) |
| 35 to 64 Years | 0 (0.0%) | 0 (0.0%) |
| 65 to 74 Years | 0 (0.0%) | 0 (0.0%) |
| 75 Years and over | 0 (0.0%) | 0 (0.0%) |
Technology Access in Frankfort Springs borough
Computing Device Access in Frankfort Springs borough
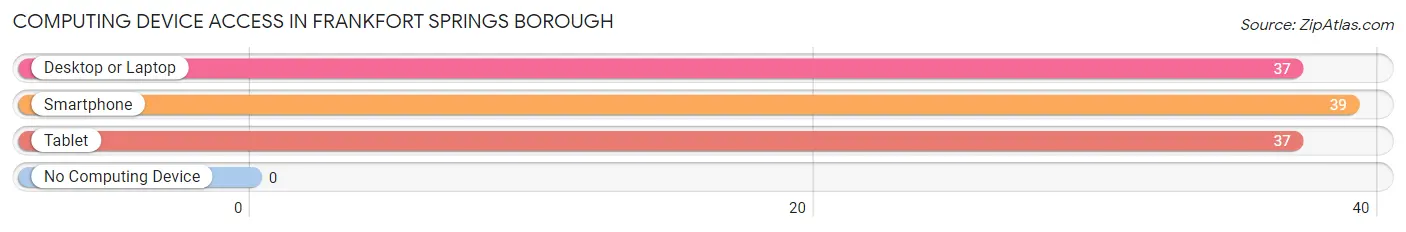
| Device Type | # Households | % Households |
| Desktop or Laptop | 37 | 82.2% |
| Smartphone | 39 | 86.7% |
| Tablet | 37 | 82.2% |
| No Computing Device | 0 | 0.0% |
| Total | 45 | 100.0% |
Internet Access in Frankfort Springs borough
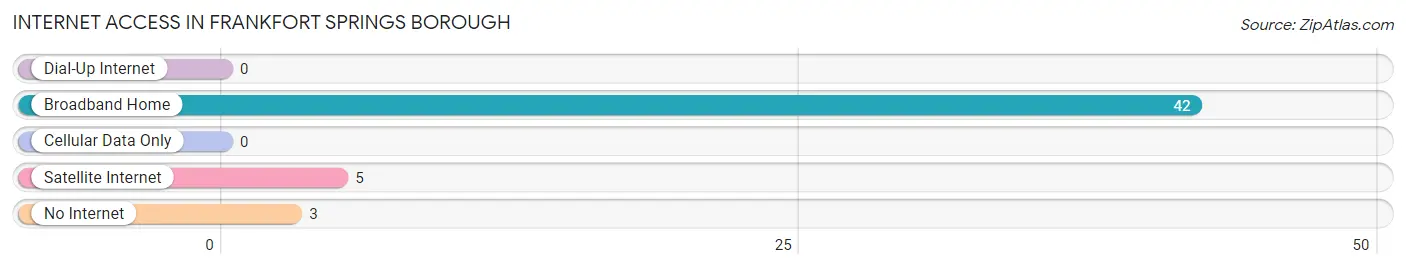
| Internet Type | # Households | % Households |
| Dial-Up Internet | 0 | 0.0% |
| Broadband Home | 42 | 93.3% |
| Cellular Data Only | 0 | 0.0% |
| Satellite Internet | 5 | 11.1% |
| No Internet | 3 | 6.7% |
| Total | 45 | 100.0% |
Frankfort Springs borough Summary
Frankfort Springs Borough is a small borough located in Beaver County, Pennsylvania. It is situated in the southwestern corner of the county, and is bordered by Hanover Township to the north, Greene Township to the east, and Independence Township to the south and west. The borough has a total area of 0.3 square miles, all of which is land.
History
Frankfort Springs Borough was founded in 1832 by a group of settlers from the nearby town of Frankfort. The settlers were looking for a place to build a new community, and they chose the area that is now Frankfort Springs. The town was named after the nearby Frankfort Springs, which were located on the banks of the nearby Big Beaver Creek.
The first settlers in the area were mostly farmers, and the town quickly grew to include a post office, a general store, a blacksmith shop, and a school. The town was incorporated as a borough in 1867.
In the late 19th century, the town was a popular destination for vacationers, who came to enjoy the natural beauty of the area. The town was also home to a number of businesses, including a grist mill, a saw mill, a tannery, and a brickyard.
Geography
Frankfort Springs Borough is located in southwestern Beaver County, Pennsylvania. It is situated in the southwestern corner of the county, and is bordered by Hanover Township to the north, Greene Township to the east, and Independence Township to the south and west. The borough has a total area of 0.3 square miles, all of which is land.
The borough is located in the Appalachian Plateau region of Pennsylvania, and is characterized by rolling hills and valleys. The borough is located in the Big Beaver Creek watershed, and is home to several small streams, including Little Beaver Creek, which flows through the center of town.
Economy
The economy of Frankfort Springs Borough is largely based on agriculture and tourism. The town is home to several small farms, which produce a variety of crops, including corn, soybeans, hay, and wheat. The town is also home to several small businesses, including a general store, a restaurant, and a bed and breakfast.
The town is also a popular destination for tourists, who come to enjoy the natural beauty of the area. The town is home to several parks, including the Frankfort Springs Nature Preserve, which is a popular spot for hiking, fishing, and bird watching.
Demographics
As of the 2010 census, the population of Frankfort Springs Borough was 545. The racial makeup of the borough was 97.3% White, 0.7% African American, 0.2% Native American, 0.2% Asian, and 1.6% from two or more races. Hispanic or Latino of any race were 0.7% of the population.
The median household income in the borough was $45,000, and the median family income was $50,000. The per capita income in the borough was $20,000. About 8.3% of families and 10.2% of the population were below the poverty line, including 14.3% of those under age 18 and 6.3% of those age 65 or over.
Common Questions
What is Per Capita Income in Frankfort Springs borough?
Per Capita income in Frankfort Springs borough is $25,835.
What is the Median Family Income in Frankfort Springs borough?
Median Family Income in Frankfort Springs borough is $71,250.
What is the Median Household income in Frankfort Springs borough?
Median Household Income in Frankfort Springs borough is $66,250.
What is Inequality or Gini Index in Frankfort Springs borough?
Inequality or Gini Index in Frankfort Springs borough is 0.33.
What is the Total Population of Frankfort Springs borough?
Total Population of Frankfort Springs borough is 156.
What is the Total Male Population of Frankfort Springs borough?
Total Male Population of Frankfort Springs borough is 76.
What is the Total Female Population of Frankfort Springs borough?
Total Female Population of Frankfort Springs borough is 80.
What is the Ratio of Males per 100 Females in Frankfort Springs borough?
There are 95.00 Males per 100 Females in Frankfort Springs borough.
What is the Ratio of Females per 100 Males in Frankfort Springs borough?
There are 105.26 Females per 100 Males in Frankfort Springs borough.
What is the Median Population Age in Frankfort Springs borough?
Median Population Age in Frankfort Springs borough is 41.1 Years.
What is the Average Family Size in Frankfort Springs borough
Average Family Size in Frankfort Springs borough is 3.9 People.
What is the Average Household Size in Frankfort Springs borough
Average Household Size in Frankfort Springs borough is 3.5 People.
How Large is the Labor Force in Frankfort Springs borough?
There are 71 People in the Labor Forcein in Frankfort Springs borough.
What is the Percentage of People in the Labor Force in Frankfort Springs borough?
58.7% of People are in the Labor Force in Frankfort Springs borough.
What is the Unemployment Rate in Frankfort Springs borough?
Unemployment Rate in Frankfort Springs borough is 7.0%.