North Warren, PA Map & Demographics
North Warren Map
North Warren Overview
$24,690
PER CAPITA INCOME
$54,190
AVG FAMILY INCOME
$53,295
AVG HOUSEHOLD INCOME
20.8%
WAGE / INCOME GAP [ % ]
79.2¢/ $1
WAGE / INCOME GAP [ $ ]
0.34
INEQUALITY / GINI INDEX
1,922
TOTAL POPULATION
1,067
MALE POPULATION
855
FEMALE POPULATION
124.80
MALES / 100 FEMALES
80.13
FEMALES / 100 MALES
44.5
MEDIAN AGE
2.9
AVG FAMILY SIZE
2.4
AVG HOUSEHOLD SIZE
893
LABOR FORCE [ PEOPLE ]
56.2%
PERCENT IN LABOR FORCE
7.6%
UNEMPLOYMENT RATE
North Warren Area Codes
Income in North Warren
Income Overview in North Warren
Per Capita Income in North Warren is $24,690, while median incomes of families and households are $54,190 and $53,295 respectively.
| Characteristic | Number | Measure |
| Per Capita Income | 1,922 | $24,690 |
| Median Family Income | 459 | $54,190 |
| Mean Family Income | 459 | $63,861 |
| Median Household Income | 766 | $53,295 |
| Mean Household Income | 766 | $57,991 |
| Income Deficit | 459 | $0 |
| Wage / Income Gap (%) | 1,922 | 20.81% |
| Wage / Income Gap ($) | 1,922 | 79.19¢ per $1 |
| Gini / Inequality Index | 1,922 | 0.34 |
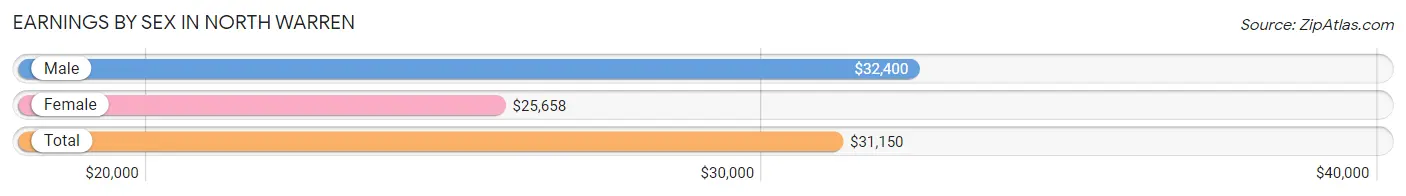
Earnings by Sex in North Warren
Average Earnings in North Warren are $31,150, $32,400 for men and $25,658 for women, a difference of 20.8%.
| Sex | Number | Average Earnings |
| Male | 598 (63.7%) | $32,400 |
| Female | 340 (36.2%) | $25,658 |
| Total | 938 (100.0%) | $31,150 |
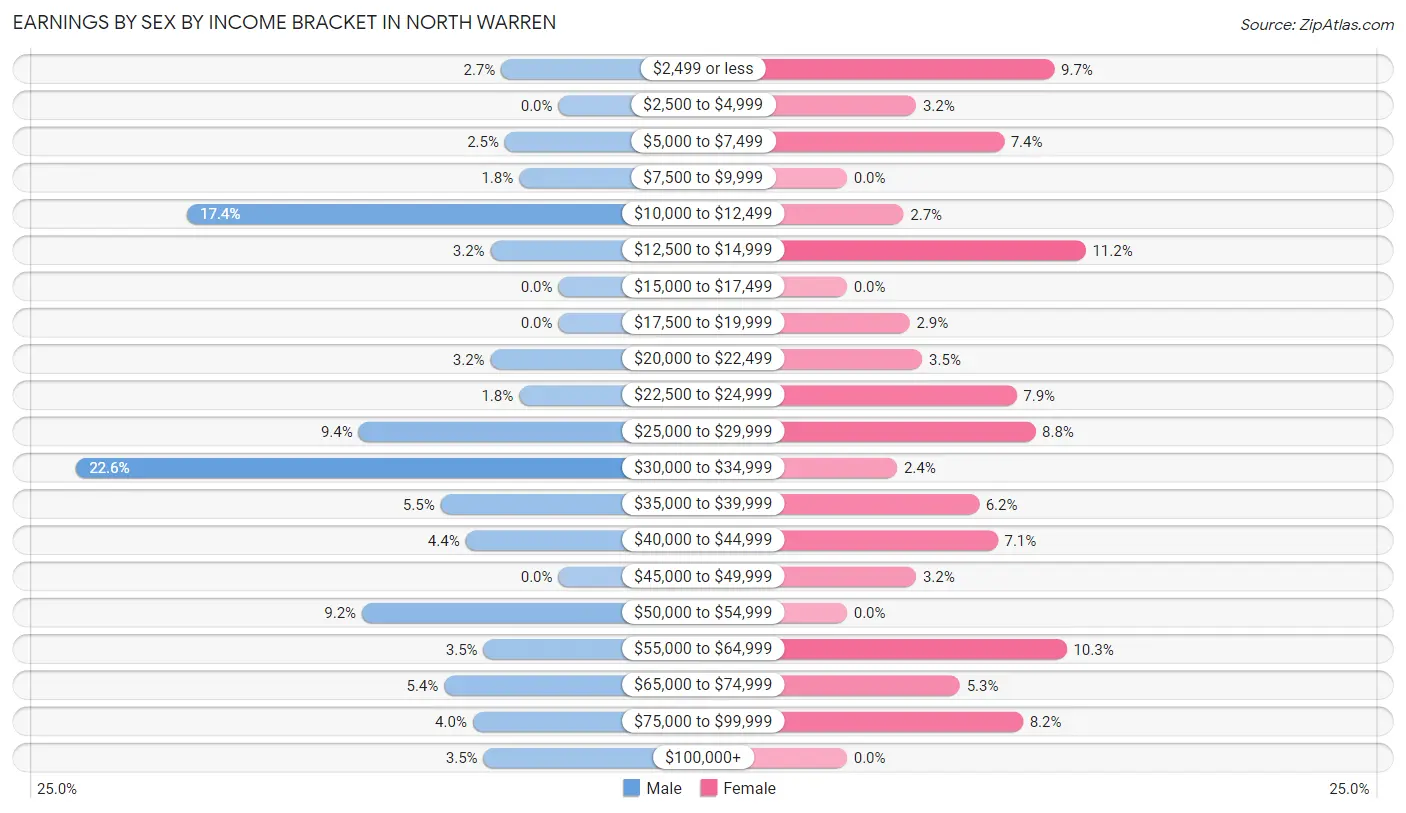
Earnings by Sex by Income Bracket in North Warren
The most common earnings brackets in North Warren are $30,000 to $34,999 for men (135 | 22.6%) and $12,500 to $14,999 for women (38 | 11.2%).
| Income | Male | Female |
| $2,499 or less | 16 (2.7%) | 33 (9.7%) |
| $2,500 to $4,999 | 0 (0.0%) | 11 (3.2%) |
| $5,000 to $7,499 | 15 (2.5%) | 25 (7.3%) |
| $7,500 to $9,999 | 11 (1.8%) | 0 (0.0%) |
| $10,000 to $12,499 | 104 (17.4%) | 9 (2.6%) |
| $12,500 to $14,999 | 19 (3.2%) | 38 (11.2%) |
| $15,000 to $17,499 | 0 (0.0%) | 0 (0.0%) |
| $17,500 to $19,999 | 0 (0.0%) | 10 (2.9%) |
| $20,000 to $22,499 | 19 (3.2%) | 12 (3.5%) |
| $22,500 to $24,999 | 11 (1.8%) | 27 (7.9%) |
| $25,000 to $29,999 | 56 (9.4%) | 30 (8.8%) |
| $30,000 to $34,999 | 135 (22.6%) | 8 (2.4%) |
| $35,000 to $39,999 | 33 (5.5%) | 21 (6.2%) |
| $40,000 to $44,999 | 26 (4.3%) | 24 (7.1%) |
| $45,000 to $49,999 | 0 (0.0%) | 11 (3.2%) |
| $50,000 to $54,999 | 55 (9.2%) | 0 (0.0%) |
| $55,000 to $64,999 | 21 (3.5%) | 35 (10.3%) |
| $65,000 to $74,999 | 32 (5.3%) | 18 (5.3%) |
| $75,000 to $99,999 | 24 (4.0%) | 28 (8.2%) |
| $100,000+ | 21 (3.5%) | 0 (0.0%) |
| Total | 598 (100.0%) | 340 (100.0%) |
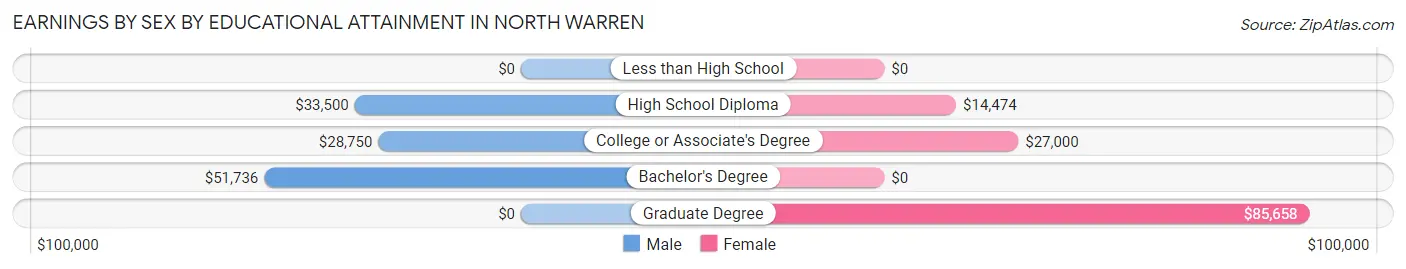
Earnings by Sex by Educational Attainment in North Warren
Average earnings in North Warren are $33,176 for men and $25,197 for women, a difference of 24.0%. Men with an educational attainment of bachelor's degree enjoy the highest average annual earnings of $51,736, while those with college or associate's degree education earn the least with $28,750. Women with an educational attainment of graduate degree earn the most with the average annual earnings of $85,658, while those with high school diploma education have the smallest earnings of $14,474.
| Educational Attainment | Male Income | Female Income |
| Less than High School | - | - |
| High School Diploma | $33,500 | $14,474 |
| College or Associate's Degree | $28,750 | $27,000 |
| Bachelor's Degree | $51,736 | $0 |
| Graduate Degree | - | - |
| Total | $33,176 | $25,197 |
Family Income in North Warren
Family Income Brackets in North Warren
According to the North Warren family income data, there are 168 families falling into the $50,000 to $74,999 income range, which is the most common income bracket and makes up 36.6% of all families.
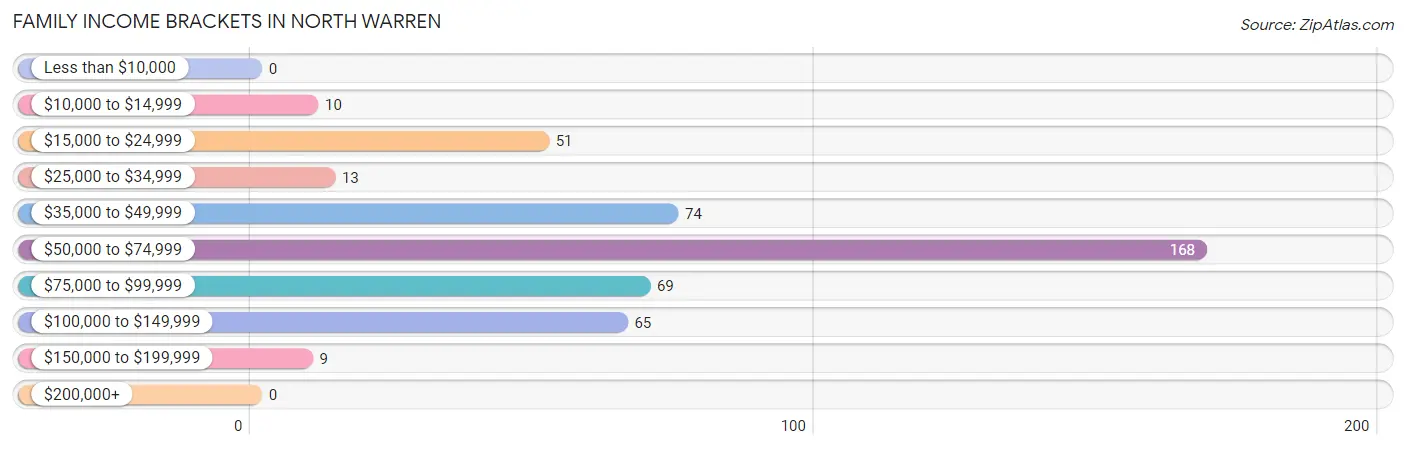
| Income Bracket | # Families | % Families |
| Less than $10,000 | 0 | 0.0% |
| $10,000 to $14,999 | 10 | 2.2% |
| $15,000 to $24,999 | 51 | 11.1% |
| $25,000 to $34,999 | 13 | 2.8% |
| $35,000 to $49,999 | 74 | 16.1% |
| $50,000 to $74,999 | 168 | 36.6% |
| $75,000 to $99,999 | 69 | 15.0% |
| $100,000 to $149,999 | 65 | 14.2% |
| $150,000 to $199,999 | 9 | 2.0% |
| $200,000+ | 0 | 0.0% |
Family Income by Famaliy Size in North Warren
4-person families (32 | 7.0%) account for the highest median family income in North Warren with $78,750 per family, while 2-person families (189 | 41.2%) have the highest median income of $28,516 per family member.
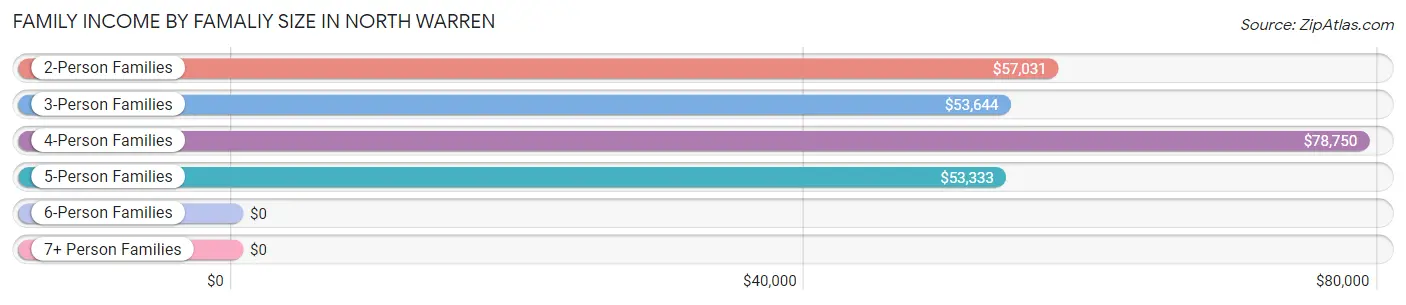
| Income Bracket | # Families | Median Income |
| 2-Person Families | 189 (41.2%) | $57,031 |
| 3-Person Families | 201 (43.8%) | $53,644 |
| 4-Person Families | 32 (7.0%) | $78,750 |
| 5-Person Families | 28 (6.1%) | $53,333 |
| 6-Person Families | 9 (2.0%) | $0 |
| 7+ Person Families | 0 (0.0%) | $0 |
| Total | 459 (100.0%) | $54,190 |
Family Income by Number of Earners in North Warren
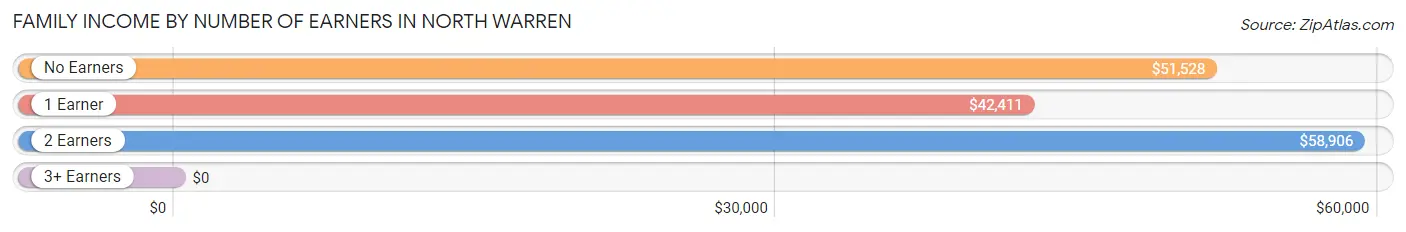
| Number of Earners | # Families | Median Income |
| No Earners | 87 (19.0%) | $51,528 |
| 1 Earner | 141 (30.7%) | $42,411 |
| 2 Earners | 231 (50.3%) | $58,906 |
| 3+ Earners | 0 (0.0%) | $0 |
| Total | 459 (100.0%) | $54,190 |
Household Income in North Warren
Household Income Brackets in North Warren
With 224 households falling in the category, the $50,000 to $74,999 income range is the most frequent in North Warren, accounting for 29.2% of all households.
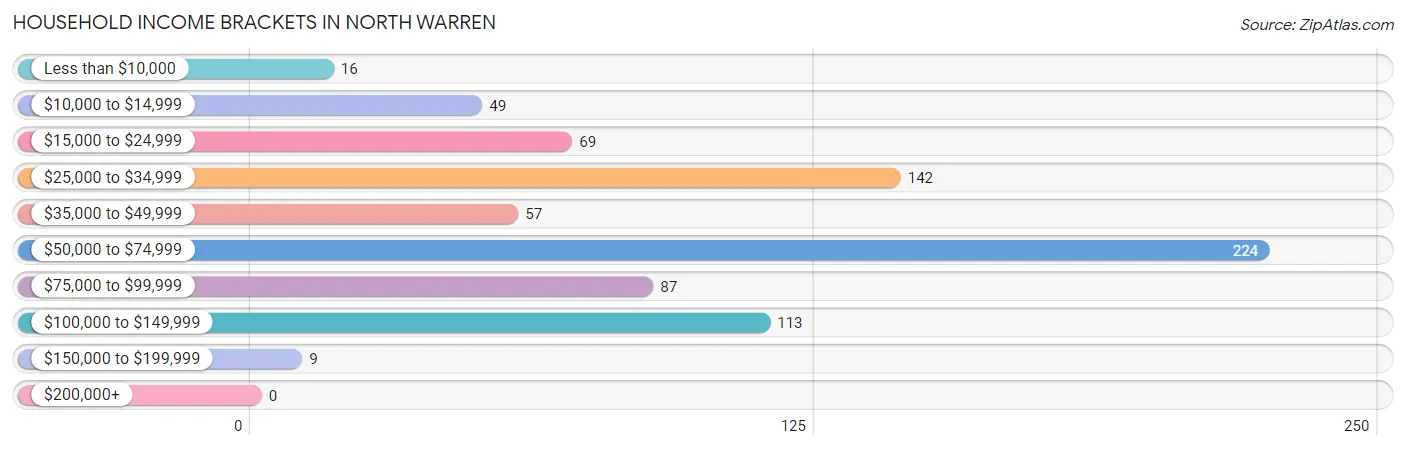
| Income Bracket | # Households | % Households |
| Less than $10,000 | 16 | 2.1% |
| $10,000 to $14,999 | 49 | 6.4% |
| $15,000 to $24,999 | 69 | 9.0% |
| $25,000 to $34,999 | 142 | 18.5% |
| $35,000 to $49,999 | 57 | 7.4% |
| $50,000 to $74,999 | 224 | 29.2% |
| $75,000 to $99,999 | 87 | 11.4% |
| $100,000 to $149,999 | 113 | 14.8% |
| $150,000 to $199,999 | 9 | 1.2% |
| $200,000+ | 0 | 0.0% |
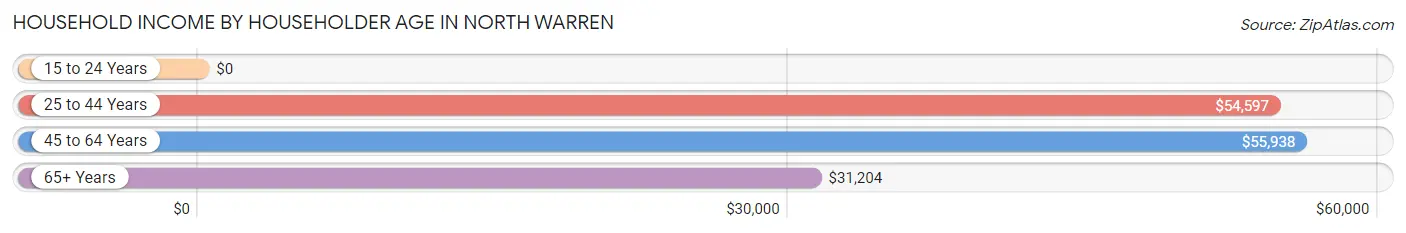
Household Income by Householder Age in North Warren
The median household income in North Warren is $53,295, with the highest median household income of $55,938 found in the 45 to 64 years age bracket for the primary householder. A total of 313 households (40.9%) fall into this category. Meanwhile, the 15 to 24 years age bracket for the primary householder has the lowest median household income of $0, with 14 households (1.8%) in this group.
| Income Bracket | # Households | Median Income |
| 15 to 24 Years | 14 (1.8%) | $0 |
| 25 to 44 Years | 219 (28.6%) | $54,597 |
| 45 to 64 Years | 313 (40.9%) | $55,938 |
| 65+ Years | 220 (28.7%) | $31,204 |
| Total | 766 (100.0%) | $53,295 |
Poverty in North Warren
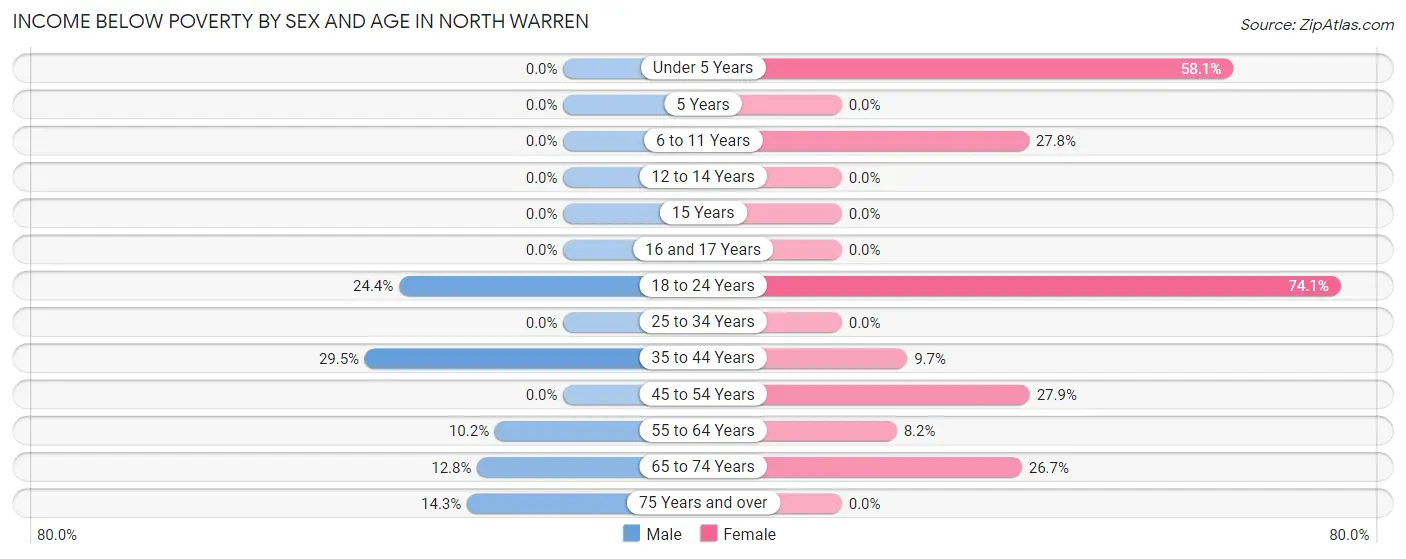
Income Below Poverty by Sex and Age in North Warren
With 9.8% poverty level for males and 21.6% for females among the residents of North Warren, 35 to 44 year old males and 18 to 24 year old females are the most vulnerable to poverty, with 33 males (29.5%) and 40 females (74.1%) in their respective age groups living below the poverty level.
| Age Bracket | Male | Female |
| Under 5 Years | 0 (0.0%) | 61 (58.1%) |
| 5 Years | 0 (0.0%) | 0 (0.0%) |
| 6 to 11 Years | 0 (0.0%) | 10 (27.8%) |
| 12 to 14 Years | 0 (0.0%) | 0 (0.0%) |
| 15 Years | 0 (0.0%) | 0 (0.0%) |
| 16 and 17 Years | 0 (0.0%) | 0 (0.0%) |
| 18 to 24 Years | 20 (24.4%) | 40 (74.1%) |
| 25 to 34 Years | 0 (0.0%) | 0 (0.0%) |
| 35 to 44 Years | 33 (29.5%) | 7 (9.7%) |
| 45 to 54 Years | 0 (0.0%) | 24 (27.9%) |
| 55 to 64 Years | 20 (10.2%) | 11 (8.2%) |
| 65 to 74 Years | 17 (12.8%) | 27 (26.7%) |
| 75 Years and over | 10 (14.3%) | 0 (0.0%) |
| Total | 100 (9.8%) | 180 (21.6%) |
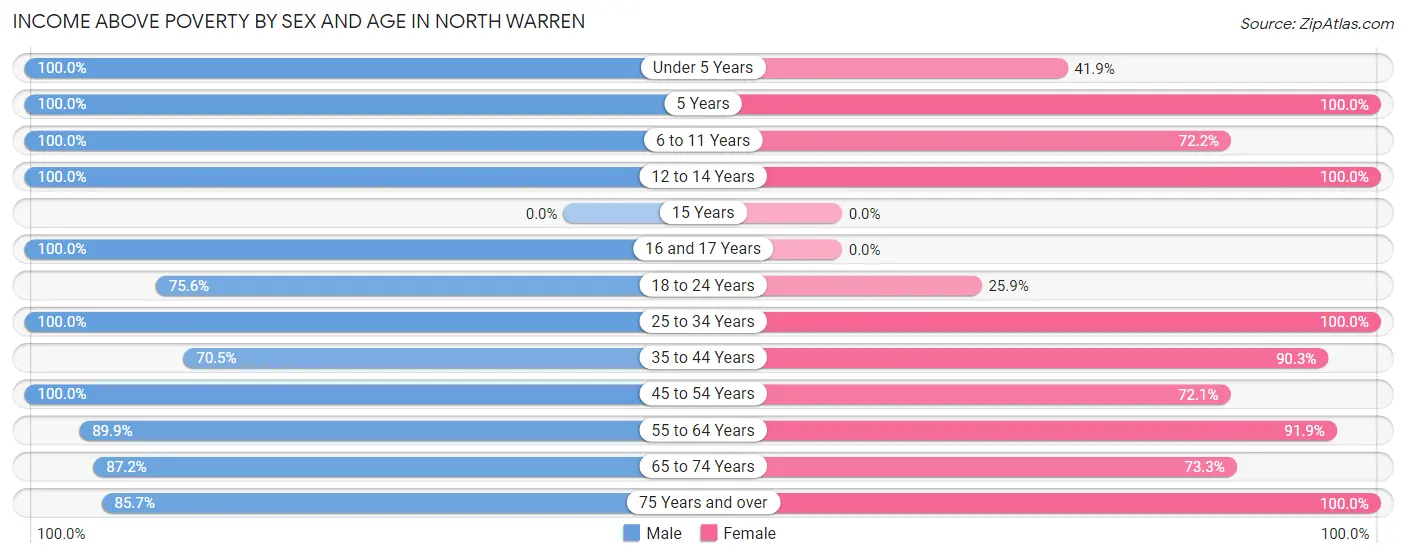
Income Above Poverty by Sex and Age in North Warren
According to the poverty statistics in North Warren, males aged under 5 years and females aged 5 years are the age groups that are most secure financially, with 100.0% of males and 100.0% of females in these age groups living above the poverty line.
| Age Bracket | Male | Female |
| Under 5 Years | 65 (100.0%) | 44 (41.9%) |
| 5 Years | 10 (100.0%) | 11 (100.0%) |
| 6 to 11 Years | 53 (100.0%) | 26 (72.2%) |
| 12 to 14 Years | 33 (100.0%) | 20 (100.0%) |
| 15 Years | 0 (0.0%) | 0 (0.0%) |
| 16 and 17 Years | 4 (100.0%) | 0 (0.0%) |
| 18 to 24 Years | 62 (75.6%) | 14 (25.9%) |
| 25 to 34 Years | 190 (100.0%) | 110 (100.0%) |
| 35 to 44 Years | 79 (70.5%) | 65 (90.3%) |
| 45 to 54 Years | 75 (100.0%) | 62 (72.1%) |
| 55 to 64 Years | 177 (89.8%) | 124 (91.8%) |
| 65 to 74 Years | 116 (87.2%) | 74 (73.3%) |
| 75 Years and over | 60 (85.7%) | 103 (100.0%) |
| Total | 924 (90.2%) | 653 (78.4%) |
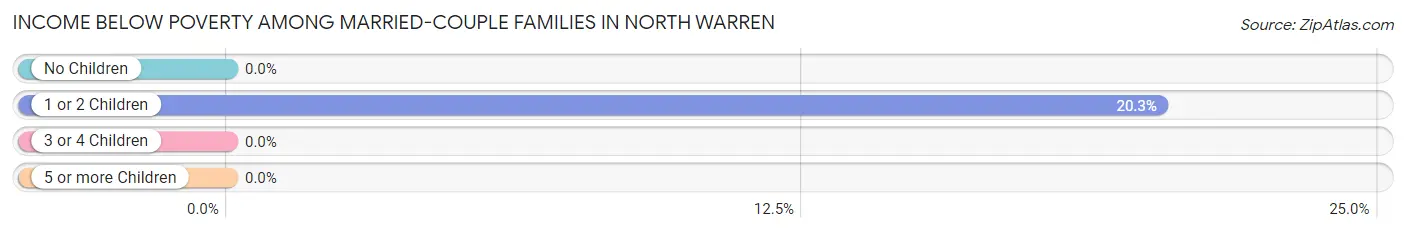
Income Below Poverty Among Married-Couple Families in North Warren
The poverty statistics for married-couple families in North Warren show that 8.7% or 33 of the total 381 families live below the poverty line. Families with 1 or 2 children have the highest poverty rate of 20.3%, comprising of 33 families. On the other hand, families with no children have the lowest poverty rate of 0.0%, which includes 0 families.
| Children | Above Poverty | Below Poverty |
| No Children | 201 (100.0%) | 0 (0.0%) |
| 1 or 2 Children | 130 (79.7%) | 33 (20.3%) |
| 3 or 4 Children | 17 (100.0%) | 0 (0.0%) |
| 5 or more Children | 0 (0.0%) | 0 (0.0%) |
| Total | 348 (91.3%) | 33 (8.7%) |
Income Below Poverty Among Single-Parent Households in North Warren
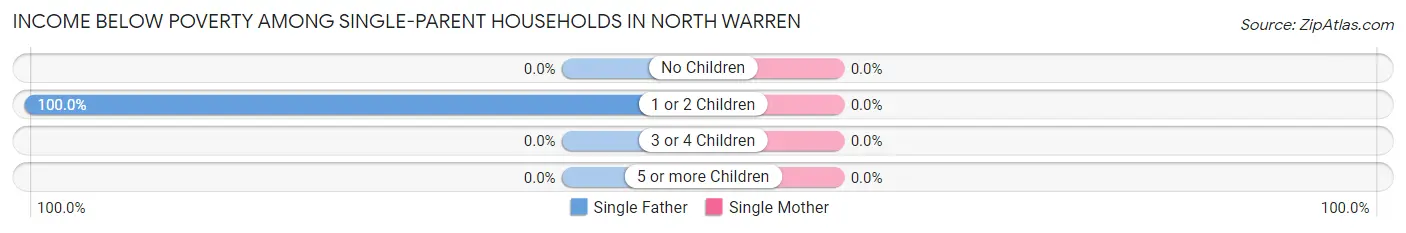
| Children | Single Father | Single Mother |
| No Children | 0 (0.0%) | 0 (0.0%) |
| 1 or 2 Children | 10 (100.0%) | 0 (0.0%) |
| 3 or 4 Children | 0 (0.0%) | 0 (0.0%) |
| 5 or more Children | 0 (0.0%) | 0 (0.0%) |
| Total | 10 (100.0%) | 0 (0.0%) |
Income Below Poverty Among Married-Couple vs Single-Parent Households in North Warren
The poverty data for North Warren shows that 33 of the married-couple family households (8.7%) and 10 of the single-parent households (12.8%) are living below the poverty level. Within the married-couple family households, those with 1 or 2 children have the highest poverty rate, with 33 households (20.3%) falling below the poverty line. Among the single-parent households, those with 1 or 2 children have the highest poverty rate, with 10 household (27.8%) living below poverty.
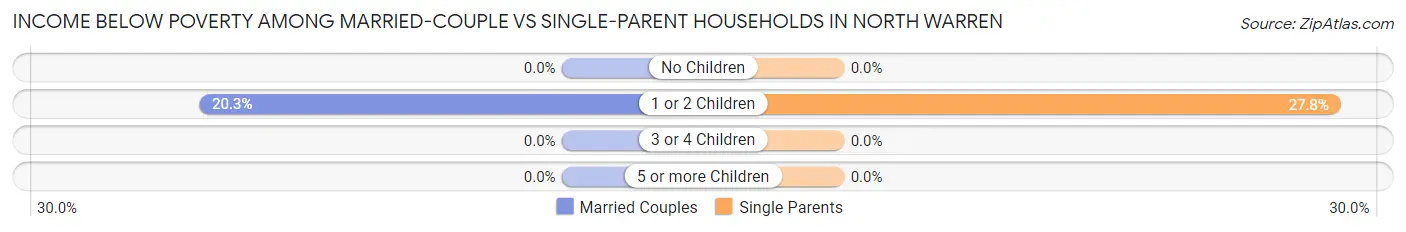
| Children | Married-Couple Families | Single-Parent Households |
| No Children | 0 (0.0%) | 0 (0.0%) |
| 1 or 2 Children | 33 (20.3%) | 10 (27.8%) |
| 3 or 4 Children | 0 (0.0%) | 0 (0.0%) |
| 5 or more Children | 0 (0.0%) | 0 (0.0%) |
| Total | 33 (8.7%) | 10 (12.8%) |
Race in North Warren
The most populous races in North Warren are White / Caucasian (1,855 | 96.5%), Two or more Races (43 | 2.2%), and Hispanic or Latino (29 | 1.5%).
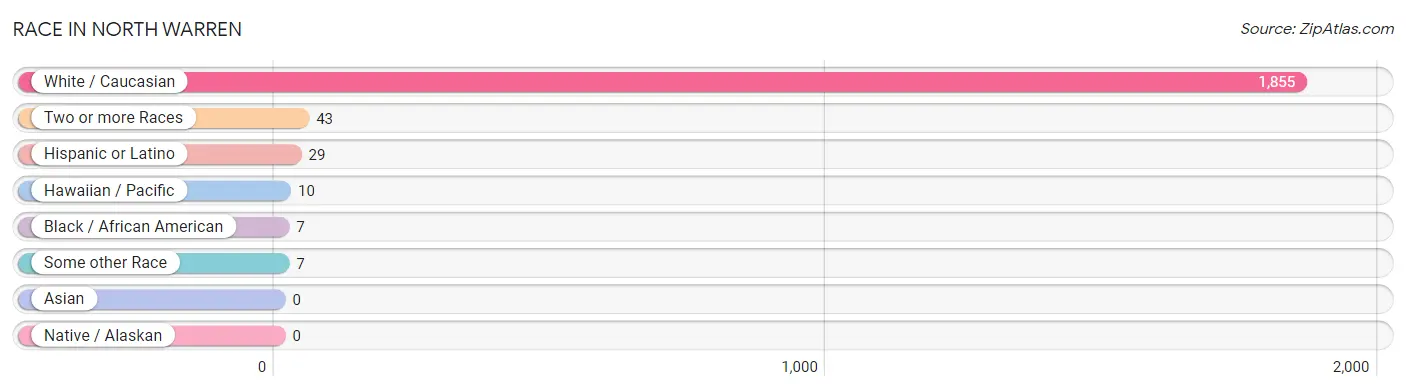
| Race | # Population | % Population |
| Asian | 0 | 0.0% |
| Black / African American | 7 | 0.4% |
| Hawaiian / Pacific | 10 | 0.5% |
| Hispanic or Latino | 29 | 1.5% |
| Native / Alaskan | 0 | 0.0% |
| White / Caucasian | 1,855 | 96.5% |
| Two or more Races | 43 | 2.2% |
| Some other Race | 7 | 0.4% |
| Total | 1,922 | 100.0% |
Ancestry in North Warren
The most populous ancestries reported in North Warren are German (504 | 26.2%), Italian (289 | 15.0%), Irish (267 | 13.9%), English (200 | 10.4%), and American (103 | 5.4%), together accounting for 70.9% of all North Warren residents.
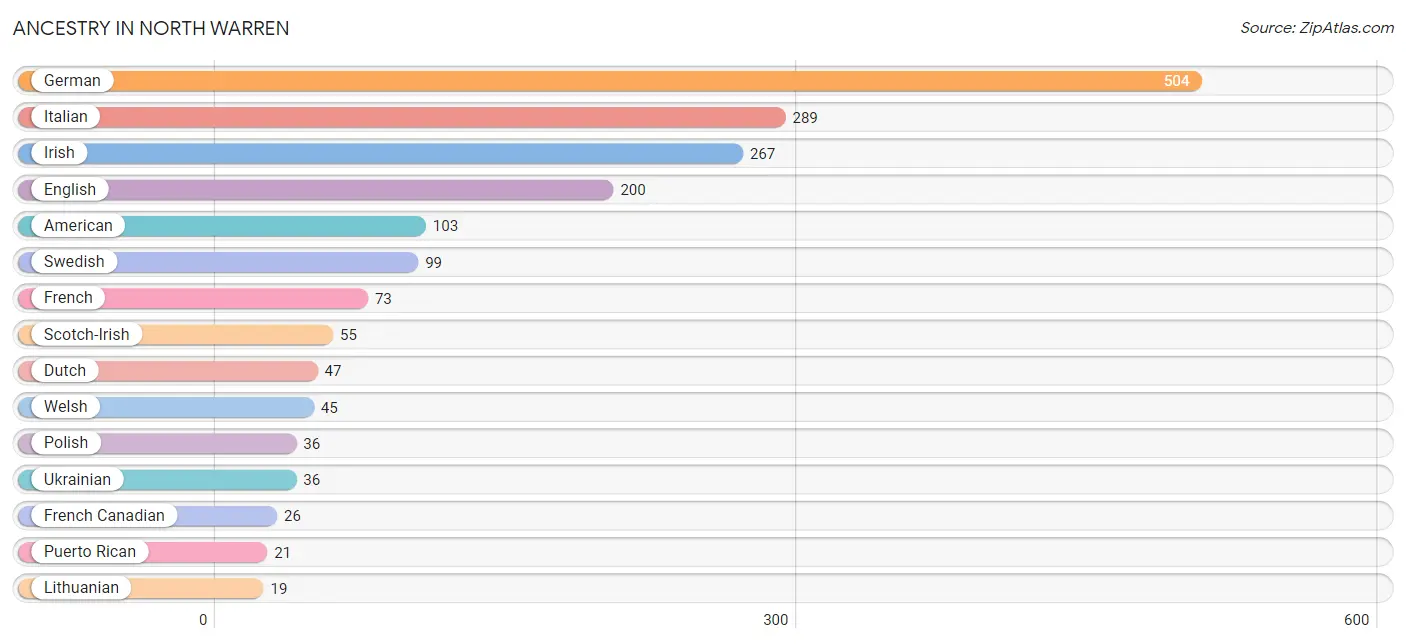
| Ancestry | # Population | % Population |
| American | 103 | 5.4% |
| Apache | 10 | 0.5% |
| Austrian | 12 | 0.6% |
| Danish | 8 | 0.4% |
| Dutch | 47 | 2.5% |
| Eastern European | 15 | 0.8% |
| English | 200 | 10.4% |
| Fijian | 10 | 0.5% |
| French | 73 | 3.8% |
| French Canadian | 26 | 1.3% |
| German | 504 | 26.2% |
| Irish | 267 | 13.9% |
| Italian | 289 | 15.0% |
| Lithuanian | 19 | 1.0% |
| Mexican | 8 | 0.4% |
| Pennsylvania German | 9 | 0.5% |
| Polish | 36 | 1.9% |
| Puerto Rican | 21 | 1.1% |
| Scotch-Irish | 55 | 2.9% |
| Scottish | 12 | 0.6% |
| Swedish | 99 | 5.1% |
| Swiss | 9 | 0.5% |
| Ukrainian | 36 | 1.9% |
| Welsh | 45 | 2.3% |
| Yugoslavian | 12 | 0.6% | View All 25 Rows |
Immigrants in North Warren

| Immigration Origin | # Population | % Population | View All 0 Rows |
Sex and Age in North Warren
Sex and Age in North Warren
The most populous age groups in North Warren are 25 to 29 Years (150 | 14.1%) for men and Under 5 Years (105 | 12.3%) for women.
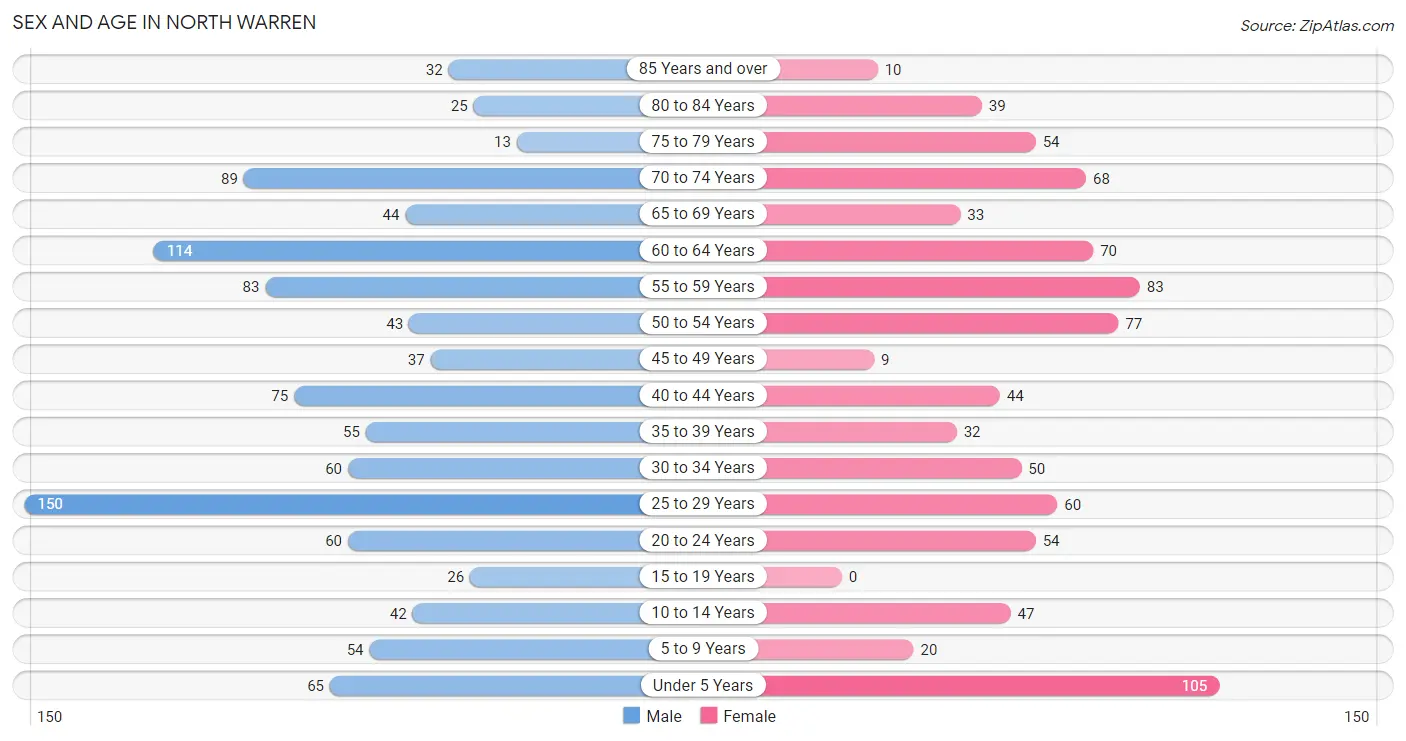
| Age Bracket | Male | Female |
| Under 5 Years | 65 (6.1%) | 105 (12.3%) |
| 5 to 9 Years | 54 (5.1%) | 20 (2.3%) |
| 10 to 14 Years | 42 (3.9%) | 47 (5.5%) |
| 15 to 19 Years | 26 (2.4%) | 0 (0.0%) |
| 20 to 24 Years | 60 (5.6%) | 54 (6.3%) |
| 25 to 29 Years | 150 (14.1%) | 60 (7.0%) |
| 30 to 34 Years | 60 (5.6%) | 50 (5.9%) |
| 35 to 39 Years | 55 (5.1%) | 32 (3.7%) |
| 40 to 44 Years | 75 (7.0%) | 44 (5.1%) |
| 45 to 49 Years | 37 (3.5%) | 9 (1.1%) |
| 50 to 54 Years | 43 (4.0%) | 77 (9.0%) |
| 55 to 59 Years | 83 (7.8%) | 83 (9.7%) |
| 60 to 64 Years | 114 (10.7%) | 70 (8.2%) |
| 65 to 69 Years | 44 (4.1%) | 33 (3.9%) |
| 70 to 74 Years | 89 (8.3%) | 68 (8.0%) |
| 75 to 79 Years | 13 (1.2%) | 54 (6.3%) |
| 80 to 84 Years | 25 (2.3%) | 39 (4.6%) |
| 85 Years and over | 32 (3.0%) | 10 (1.2%) |
| Total | 1,067 (100.0%) | 855 (100.0%) |
Families and Households in North Warren
Median Family Size in North Warren
The median family size in North Warren is 2.90 persons per family, with single female/mother families (68 | 14.8%) accounting for the largest median family size of 3.51 persons per family. On the other hand, single male/father families (10 | 2.2%) represent the smallest median family size with 2.00 persons per family.
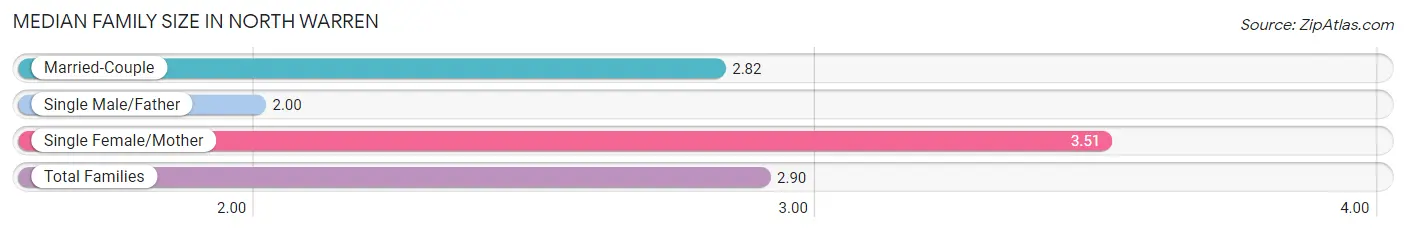
| Family Type | # Families | Family Size |
| Married-Couple | 381 (83.0%) | 2.82 |
| Single Male/Father | 10 (2.2%) | 2.00 |
| Single Female/Mother | 68 (14.8%) | 3.51 |
| Total Families | 459 (100.0%) | 2.90 |
Median Household Size in North Warren
The median household size in North Warren is 2.37 persons per household, with single female/mother households (68 | 8.9%) accounting for the largest median household size of 4.35 persons per household. non-family households (307 | 40.1%) represent the smallest median household size with 1.30 persons per household.
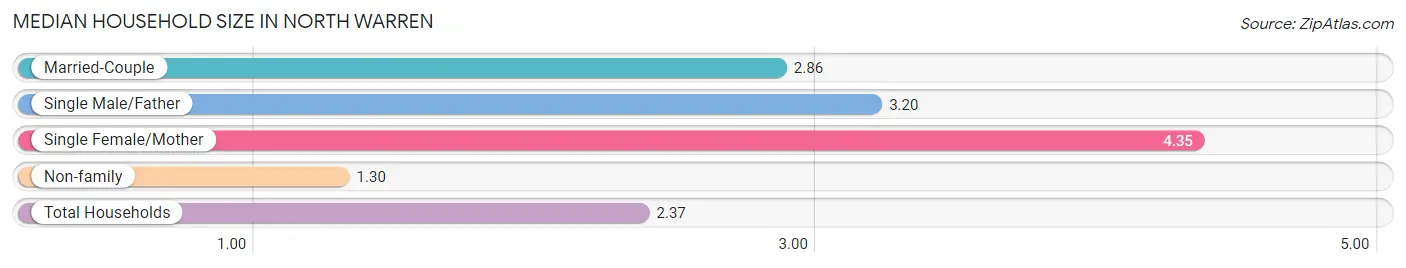
| Household Type | # Households | Household Size |
| Married-Couple | 381 (49.7%) | 2.86 |
| Single Male/Father | 10 (1.3%) | 3.20 |
| Single Female/Mother | 68 (8.9%) | 4.35 |
| Non-family | 307 (40.1%) | 1.30 |
| Total Households | 766 (100.0%) | 2.37 |
Household Size by Marriage Status in North Warren
Out of a total of 766 households in North Warren, 459 (59.9%) are family households, while 307 (40.1%) are nonfamily households. The most numerous type of family households are 3-person households, comprising 225, and the most common type of nonfamily households are 1-person households, comprising 236.
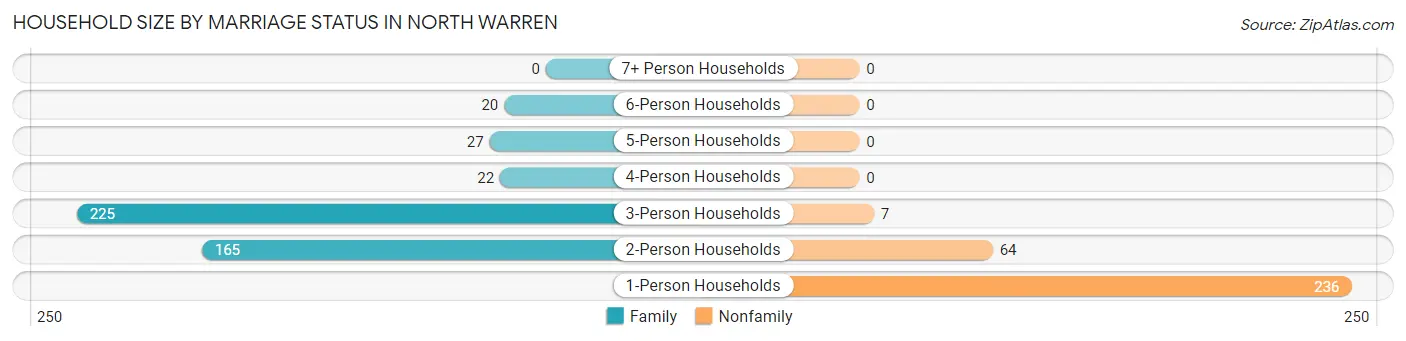
| Household Size | Family Households | Nonfamily Households |
| 1-Person Households | - | 236 (30.8%) |
| 2-Person Households | 165 (21.5%) | 64 (8.4%) |
| 3-Person Households | 225 (29.4%) | 7 (0.9%) |
| 4-Person Households | 22 (2.9%) | 0 (0.0%) |
| 5-Person Households | 27 (3.5%) | 0 (0.0%) |
| 6-Person Households | 20 (2.6%) | 0 (0.0%) |
| 7+ Person Households | 0 (0.0%) | 0 (0.0%) |
| Total | 459 (59.9%) | 307 (40.1%) |
Female Fertility in North Warren
Fertility by Age in North Warren
Average fertility rate in North Warren is 31.0 births per 1,000 women. Women in the age bracket of 35 to 50 years have the highest fertility rate with 86.0 births per 1,000 women. Women in the age bracket of 35 to 50 years acount for 100.0% of all women with births.
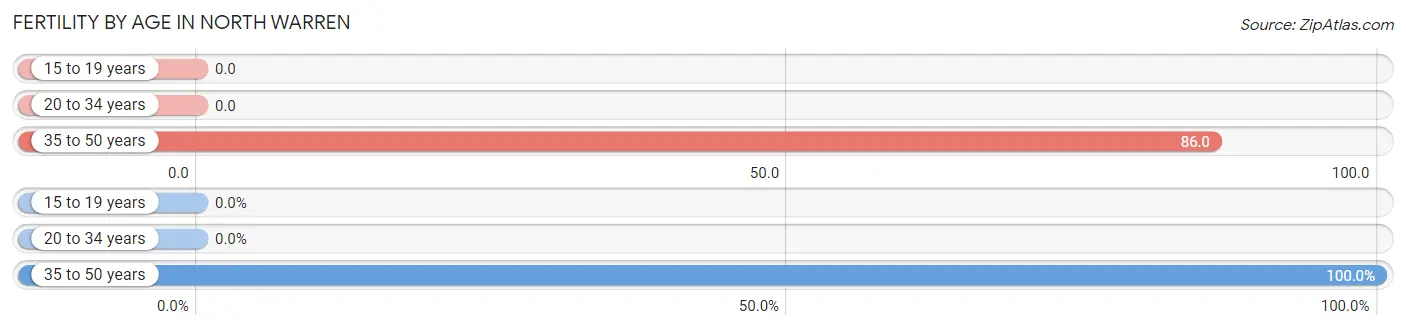
| Age Bracket | Women with Births | Births / 1,000 Women |
| 15 to 19 years | 0 (0.0%) | 0.0 |
| 20 to 34 years | 0 (0.0%) | 0.0 |
| 35 to 50 years | 8 (100.0%) | 86.0 |
| Total | 8 (100.0%) | 31.0 |
Fertility by Age by Marriage Status in North Warren
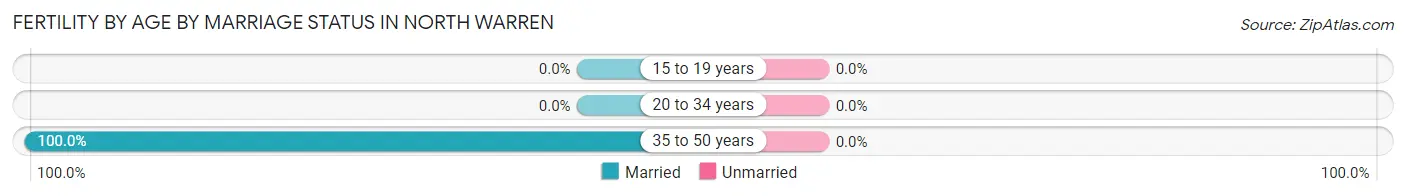
| Age Bracket | Married | Unmarried |
| 15 to 19 years | 0 (0.0%) | 0 (0.0%) |
| 20 to 34 years | 0 (0.0%) | 0 (0.0%) |
| 35 to 50 years | 8 (100.0%) | 0 (0.0%) |
| Total | 8 (100.0%) | 0 (0.0%) |
Fertility by Education in North Warren
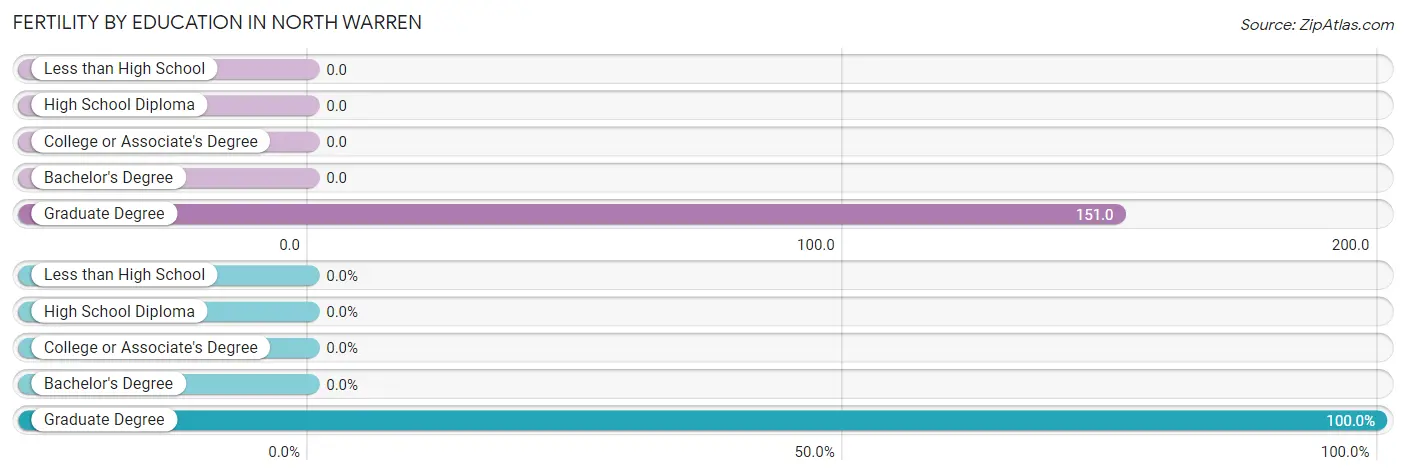
| Educational Attainment | Women with Births | Births / 1,000 Women |
| Less than High School | 0 (0.0%) | 0.0 |
| High School Diploma | 0 (0.0%) | 0.0 |
| College or Associate's Degree | 0 (0.0%) | 0.0 |
| Bachelor's Degree | 0 (0.0%) | 0.0 |
| Graduate Degree | 8 (100.0%) | 151.0 |
| Total | 8 (100.0%) | 31.0 |
Fertility by Education by Marriage Status in North Warren
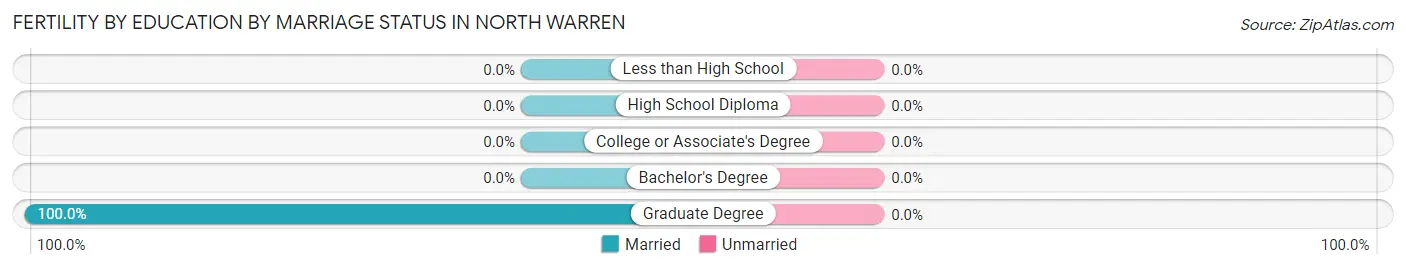
| Educational Attainment | Married | Unmarried |
| Less than High School | 0 (0.0%) | 0 (0.0%) |
| High School Diploma | 0 (0.0%) | 0 (0.0%) |
| College or Associate's Degree | 0 (0.0%) | 0 (0.0%) |
| Bachelor's Degree | 0 (0.0%) | 0 (0.0%) |
| Graduate Degree | 8 (100.0%) | 0 (0.0%) |
| Total | 8 (100.0%) | 0 (0.0%) |
Employment Characteristics in North Warren
Employment by Class of Employer in North Warren
Among the 792 employed individuals in North Warren, private company employees (544 | 68.7%), not-for-profit organizations (162 | 20.4%), and state government employees (46 | 5.8%) make up the most common classes of employment.
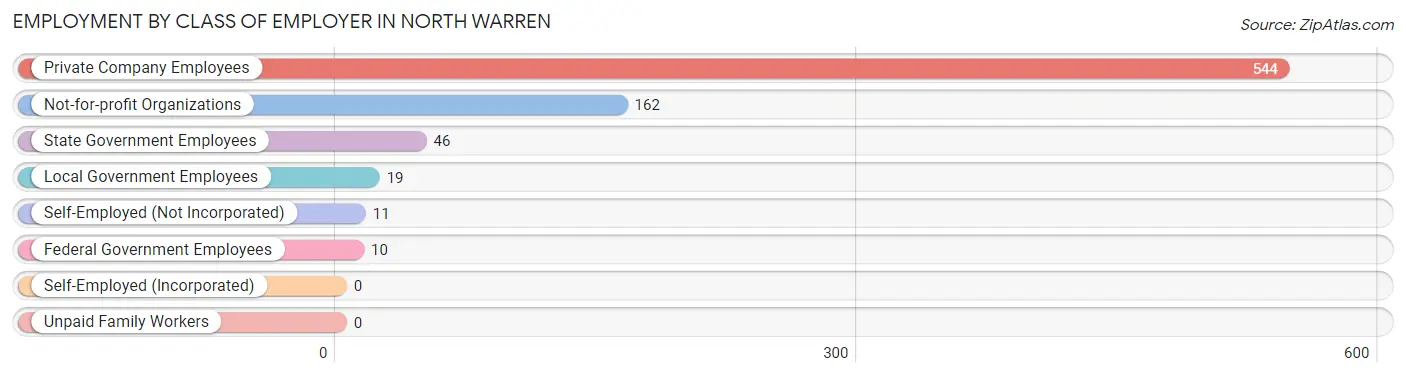
| Employer Class | # Employees | % Employees |
| Private Company Employees | 544 | 68.7% |
| Self-Employed (Incorporated) | 0 | 0.0% |
| Self-Employed (Not Incorporated) | 11 | 1.4% |
| Not-for-profit Organizations | 162 | 20.4% |
| Local Government Employees | 19 | 2.4% |
| State Government Employees | 46 | 5.8% |
| Federal Government Employees | 10 | 1.3% |
| Unpaid Family Workers | 0 | 0.0% |
| Total | 792 | 100.0% |
Employment Status by Age in North Warren
According to the labor force statistics for North Warren, out of the total population over 16 years of age (1,589), 56.2% or 893 individuals are in the labor force, with 7.6% or 68 of them unemployed. The age group with the highest labor force participation rate is 30 to 34 years, with 98.2% or 108 individuals in the labor force. Within the labor force, the 35 to 44 years age range has the highest percentage of unemployed individuals, with 30.8% or 52 of them being unemployed.
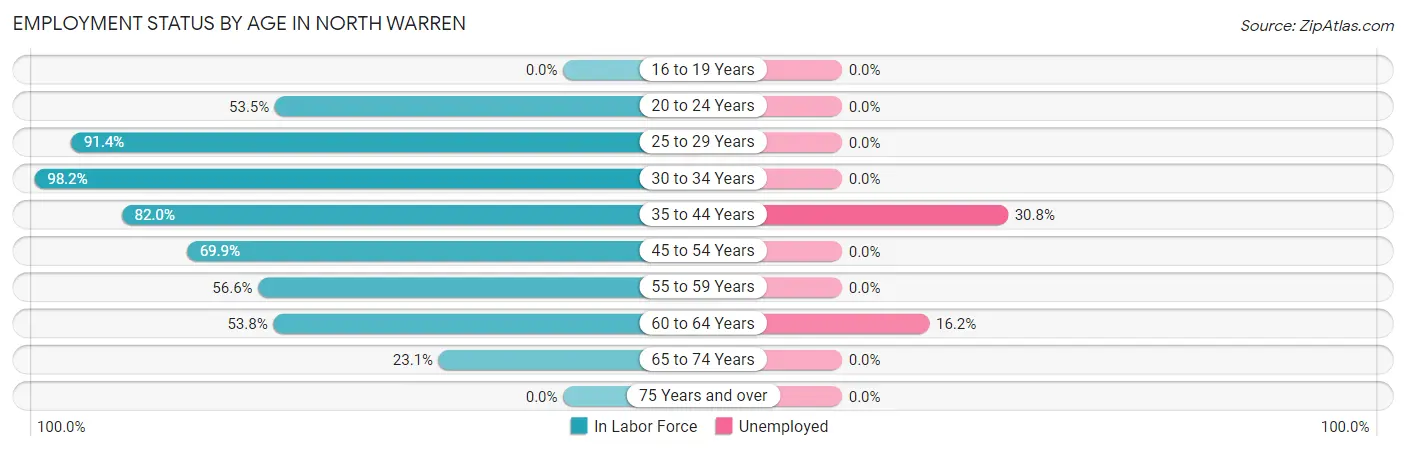
| Age Bracket | In Labor Force | Unemployed |
| 16 to 19 Years | 0 (0.0%) | 0 (0.0%) |
| 20 to 24 Years | 61 (53.5%) | 0 (0.0%) |
| 25 to 29 Years | 192 (91.4%) | 0 (0.0%) |
| 30 to 34 Years | 108 (98.2%) | 0 (0.0%) |
| 35 to 44 Years | 169 (82.0%) | 52 (30.8%) |
| 45 to 54 Years | 116 (69.9%) | 0 (0.0%) |
| 55 to 59 Years | 94 (56.6%) | 0 (0.0%) |
| 60 to 64 Years | 99 (53.8%) | 16 (16.2%) |
| 65 to 74 Years | 54 (23.1%) | 0 (0.0%) |
| 75 Years and over | 0 (0.0%) | 0 (0.0%) |
| Total | 893 (56.2%) | 68 (7.6%) |
Employment Status by Educational Attainment in North Warren
According to labor force statistics for North Warren, 74.7% of individuals (778) out of the total population between 25 and 64 years of age (1,042) are in the labor force, with 8.7% or 68 of them being unemployed. The group with the highest labor force participation rate are those with the educational attainment of less than high school, with 94.1% or 112 individuals in the labor force. Within the labor force, individuals with college / associate degree education have the highest percentage of unemployment, with 22.5% or 45 of them being unemployed.
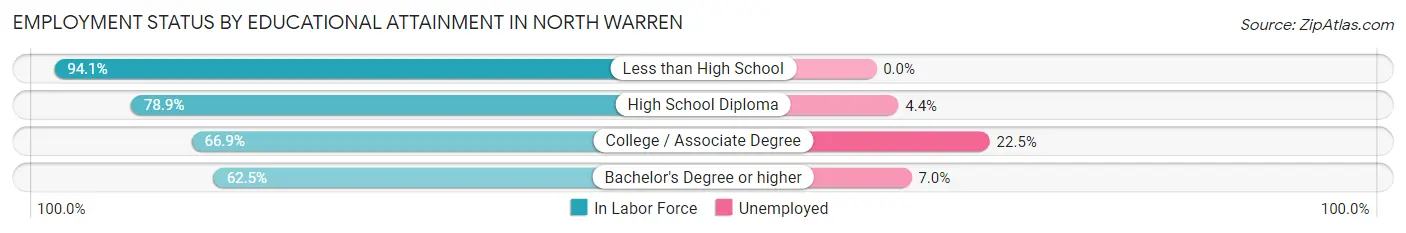
| Educational Attainment | In Labor Force | Unemployed |
| Less than High School | 112 (94.1%) | 0 (0.0%) |
| High School Diploma | 366 (78.9%) | 20 (4.4%) |
| College / Associate Degree | 200 (66.9%) | 67 (22.5%) |
| Bachelor's Degree or higher | 100 (62.5%) | 11 (7.0%) |
| Total | 778 (74.7%) | 91 (8.7%) |
Employment Occupations by Sex in North Warren
Management, Business, Science and Arts Occupations
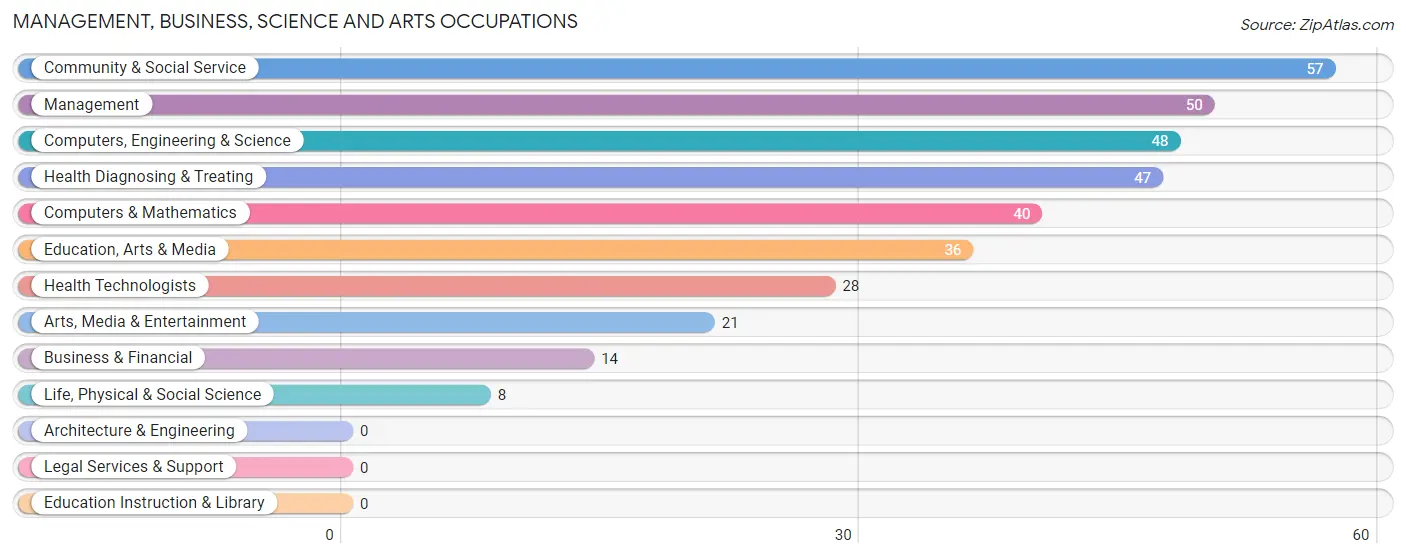
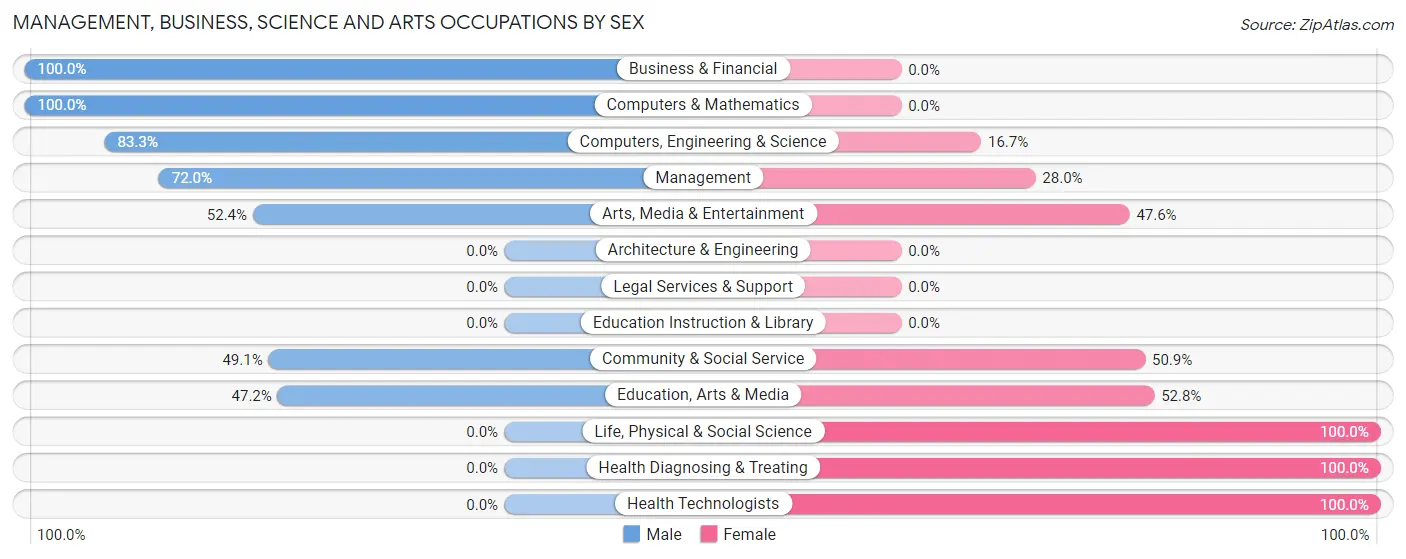
The most common Management, Business, Science and Arts occupations in North Warren are Community & Social Service (57 | 6.9%), Management (50 | 6.1%), Computers, Engineering & Science (48 | 5.8%), Health Diagnosing & Treating (47 | 5.7%), and Computers & Mathematics (40 | 4.9%).
Management, Business, Science and Arts Occupations by Sex
Within the Management, Business, Science and Arts occupations in North Warren, the most male-oriented occupations are Business & Financial (100.0%), Computers & Mathematics (100.0%), and Computers, Engineering & Science (83.3%), while the most female-oriented occupations are Life, Physical & Social Science (100.0%), Health Diagnosing & Treating (100.0%), and Health Technologists (100.0%).
| Occupation | Male | Female |
| Management | 36 (72.0%) | 14 (28.0%) |
| Business & Financial | 14 (100.0%) | 0 (0.0%) |
| Computers, Engineering & Science | 40 (83.3%) | 8 (16.7%) |
| Computers & Mathematics | 40 (100.0%) | 0 (0.0%) |
| Architecture & Engineering | 0 (0.0%) | 0 (0.0%) |
| Life, Physical & Social Science | 0 (0.0%) | 8 (100.0%) |
| Community & Social Service | 28 (49.1%) | 29 (50.9%) |
| Education, Arts & Media | 17 (47.2%) | 19 (52.8%) |
| Legal Services & Support | 0 (0.0%) | 0 (0.0%) |
| Education Instruction & Library | 0 (0.0%) | 0 (0.0%) |
| Arts, Media & Entertainment | 11 (52.4%) | 10 (47.6%) |
| Health Diagnosing & Treating | 0 (0.0%) | 47 (100.0%) |
| Health Technologists | 0 (0.0%) | 28 (100.0%) |
| Total (Category) | 118 (54.6%) | 98 (45.4%) |
| Total (Overall) | 527 (63.9%) | 298 (36.1%) |
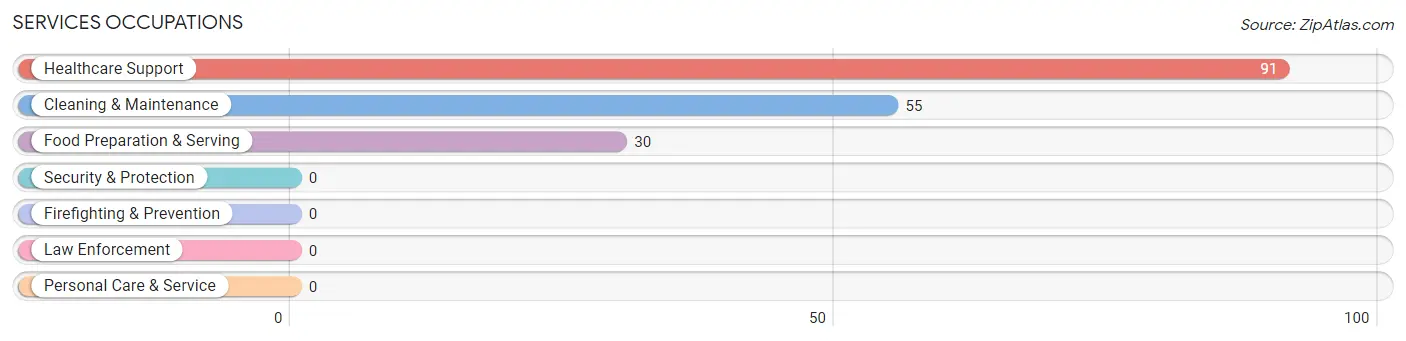
Services Occupations
The most common Services occupations in North Warren are Healthcare Support (91 | 11.0%), Cleaning & Maintenance (55 | 6.7%), and Food Preparation & Serving (30 | 3.6%).
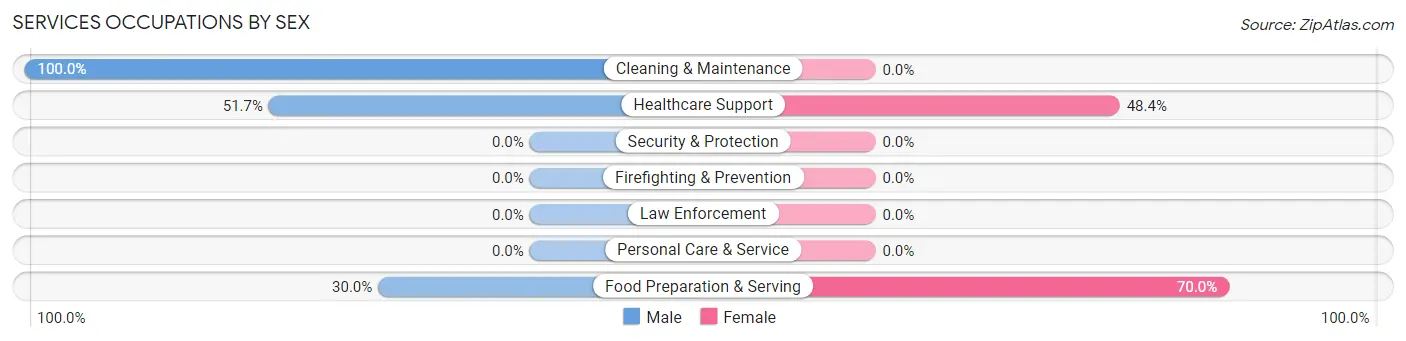
Services Occupations by Sex
Within the Services occupations in North Warren, the most male-oriented occupations are Cleaning & Maintenance (100.0%), Healthcare Support (51.6%), and Food Preparation & Serving (30.0%), while the most female-oriented occupations are Food Preparation & Serving (70.0%), and Healthcare Support (48.3%).
| Occupation | Male | Female |
| Healthcare Support | 47 (51.6%) | 44 (48.3%) |
| Security & Protection | 0 (0.0%) | 0 (0.0%) |
| Firefighting & Prevention | 0 (0.0%) | 0 (0.0%) |
| Law Enforcement | 0 (0.0%) | 0 (0.0%) |
| Food Preparation & Serving | 9 (30.0%) | 21 (70.0%) |
| Cleaning & Maintenance | 55 (100.0%) | 0 (0.0%) |
| Personal Care & Service | 0 (0.0%) | 0 (0.0%) |
| Total (Category) | 111 (63.1%) | 65 (36.9%) |
| Total (Overall) | 527 (63.9%) | 298 (36.1%) |
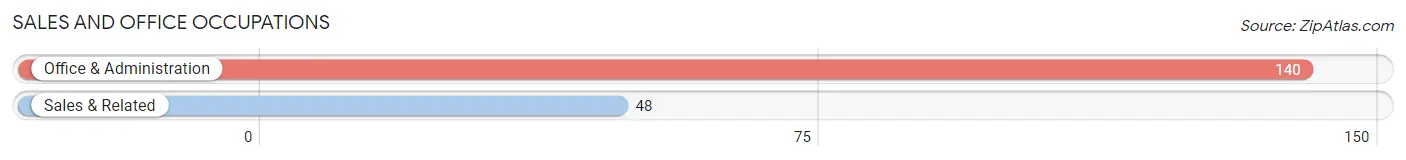
Sales and Office Occupations
The most common Sales and Office occupations in North Warren are Office & Administration (140 | 17.0%), and Sales & Related (48 | 5.8%).
Sales and Office Occupations by Sex
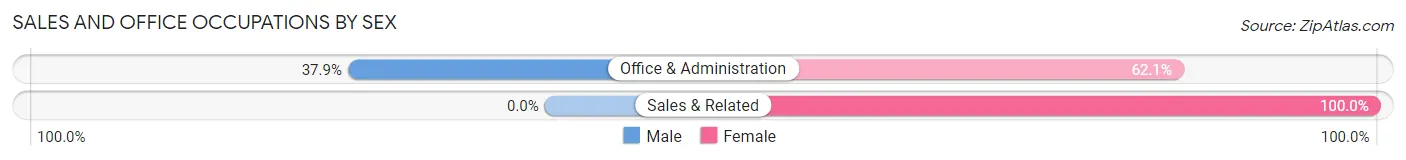
| Occupation | Male | Female |
| Sales & Related | 0 (0.0%) | 48 (100.0%) |
| Office & Administration | 53 (37.9%) | 87 (62.1%) |
| Total (Category) | 53 (28.2%) | 135 (71.8%) |
| Total (Overall) | 527 (63.9%) | 298 (36.1%) |
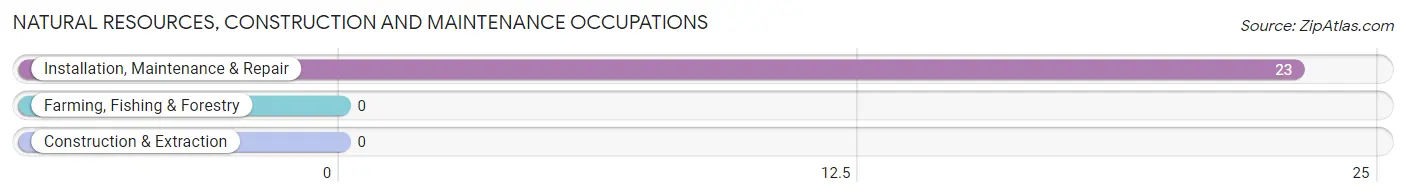
Natural Resources, Construction and Maintenance Occupations
The most common Natural Resources, Construction and Maintenance occupations in North Warren are , and Installation, Maintenance & Repair (23 | 2.8%).
Natural Resources, Construction and Maintenance Occupations by Sex
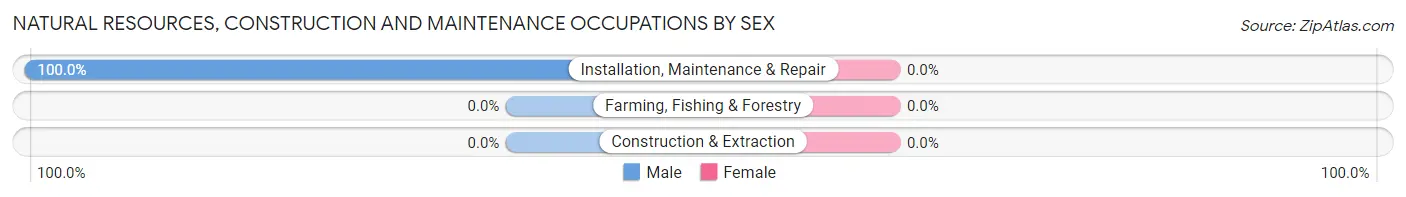
| Occupation | Male | Female |
| Farming, Fishing & Forestry | 0 (0.0%) | 0 (0.0%) |
| Construction & Extraction | 0 (0.0%) | 0 (0.0%) |
| Installation, Maintenance & Repair | 23 (100.0%) | 0 (0.0%) |
| Total (Category) | 23 (100.0%) | 0 (0.0%) |
| Total (Overall) | 527 (63.9%) | 298 (36.1%) |
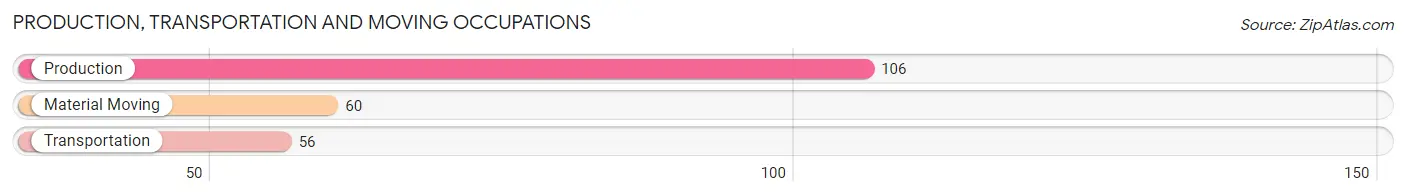
Production, Transportation and Moving Occupations
The most common Production, Transportation and Moving occupations in North Warren are Production (106 | 12.9%), Material Moving (60 | 7.3%), and Transportation (56 | 6.8%).
Production, Transportation and Moving Occupations by Sex
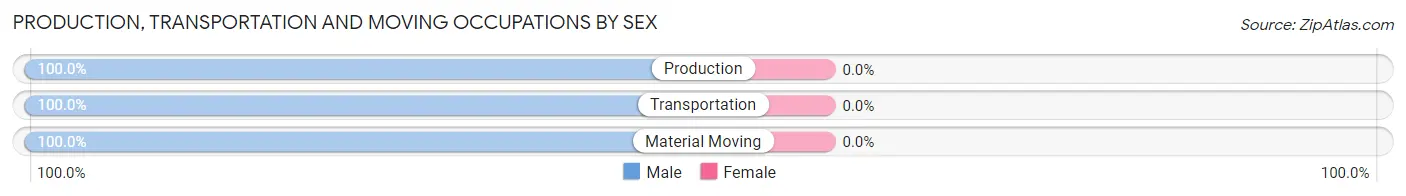
| Occupation | Male | Female |
| Production | 106 (100.0%) | 0 (0.0%) |
| Transportation | 56 (100.0%) | 0 (0.0%) |
| Material Moving | 60 (100.0%) | 0 (0.0%) |
| Total (Category) | 222 (100.0%) | 0 (0.0%) |
| Total (Overall) | 527 (63.9%) | 298 (36.1%) |
Employment Industries by Sex in North Warren
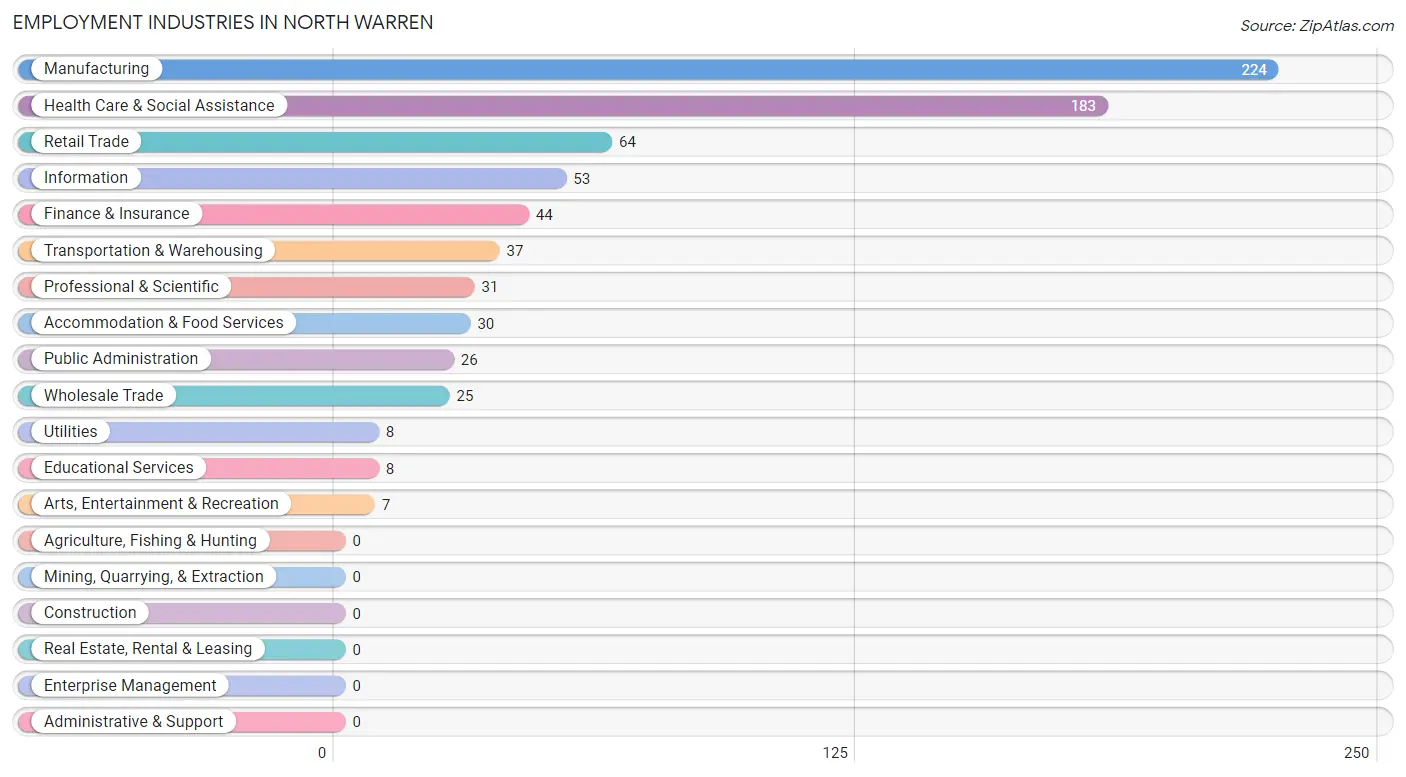
Employment Industries in North Warren
The major employment industries in North Warren include Manufacturing (224 | 27.2%), Health Care & Social Assistance (183 | 22.2%), Retail Trade (64 | 7.8%), Information (53 | 6.4%), and Finance & Insurance (44 | 5.3%).
Employment Industries by Sex in North Warren
The North Warren industries that see more men than women are Wholesale Trade (100.0%), Utilities (100.0%), and Information (100.0%), whereas the industries that tend to have a higher number of women are Educational Services (100.0%), Arts, Entertainment & Recreation (100.0%), and Health Care & Social Assistance (74.3%).
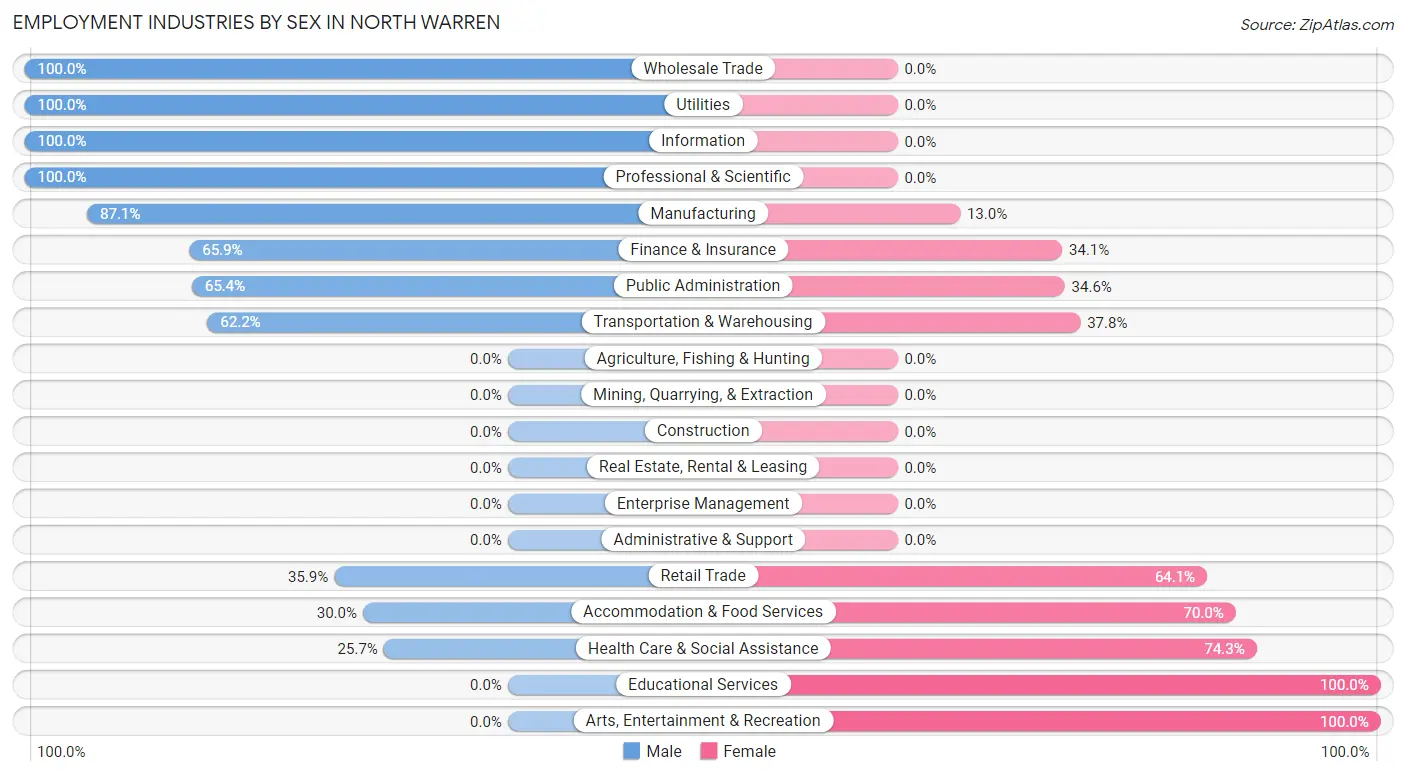
| Industry | Male | Female |
| Agriculture, Fishing & Hunting | 0 (0.0%) | 0 (0.0%) |
| Mining, Quarrying, & Extraction | 0 (0.0%) | 0 (0.0%) |
| Construction | 0 (0.0%) | 0 (0.0%) |
| Manufacturing | 195 (87.1%) | 29 (13.0%) |
| Wholesale Trade | 25 (100.0%) | 0 (0.0%) |
| Retail Trade | 23 (35.9%) | 41 (64.1%) |
| Transportation & Warehousing | 23 (62.2%) | 14 (37.8%) |
| Utilities | 8 (100.0%) | 0 (0.0%) |
| Information | 53 (100.0%) | 0 (0.0%) |
| Finance & Insurance | 29 (65.9%) | 15 (34.1%) |
| Real Estate, Rental & Leasing | 0 (0.0%) | 0 (0.0%) |
| Professional & Scientific | 31 (100.0%) | 0 (0.0%) |
| Enterprise Management | 0 (0.0%) | 0 (0.0%) |
| Administrative & Support | 0 (0.0%) | 0 (0.0%) |
| Educational Services | 0 (0.0%) | 8 (100.0%) |
| Health Care & Social Assistance | 47 (25.7%) | 136 (74.3%) |
| Arts, Entertainment & Recreation | 0 (0.0%) | 7 (100.0%) |
| Accommodation & Food Services | 9 (30.0%) | 21 (70.0%) |
| Public Administration | 17 (65.4%) | 9 (34.6%) |
| Total | 527 (63.9%) | 298 (36.1%) |
Education in North Warren
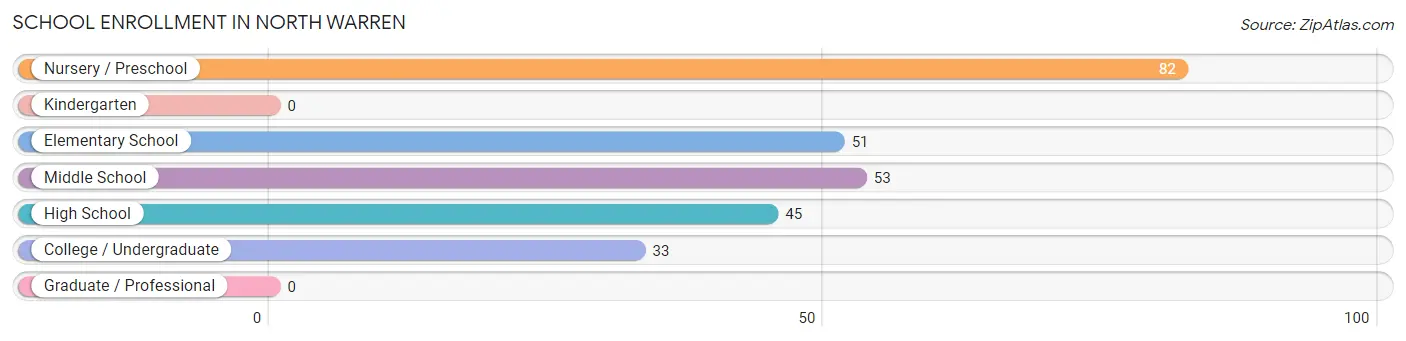
School Enrollment in North Warren
The most common levels of schooling among the 264 students in North Warren are nursery / preschool (82 | 31.1%), middle school (53 | 20.1%), and elementary school (51 | 19.3%).
| School Level | # Students | % Students |
| Nursery / Preschool | 82 | 31.1% |
| Kindergarten | 0 | 0.0% |
| Elementary School | 51 | 19.3% |
| Middle School | 53 | 20.1% |
| High School | 45 | 17.1% |
| College / Undergraduate | 33 | 12.5% |
| Graduate / Professional | 0 | 0.0% |
| Total | 264 | 100.0% |
School Enrollment by Age by Funding Source in North Warren
Out of a total of 264 students who are enrolled in schools in North Warren, 30 (11.4%) attend a private institution, while the remaining 234 (88.6%) are enrolled in public schools. The age group of 5 to 9 year old has the highest likelihood of being enrolled in private schools, with 20 (31.8% in the age bracket) enrolled. Conversely, the age group of 3 to 4 year olds has the lowest likelihood of being enrolled in a private school, with 61 (100.0% in the age bracket) attending a public institution.
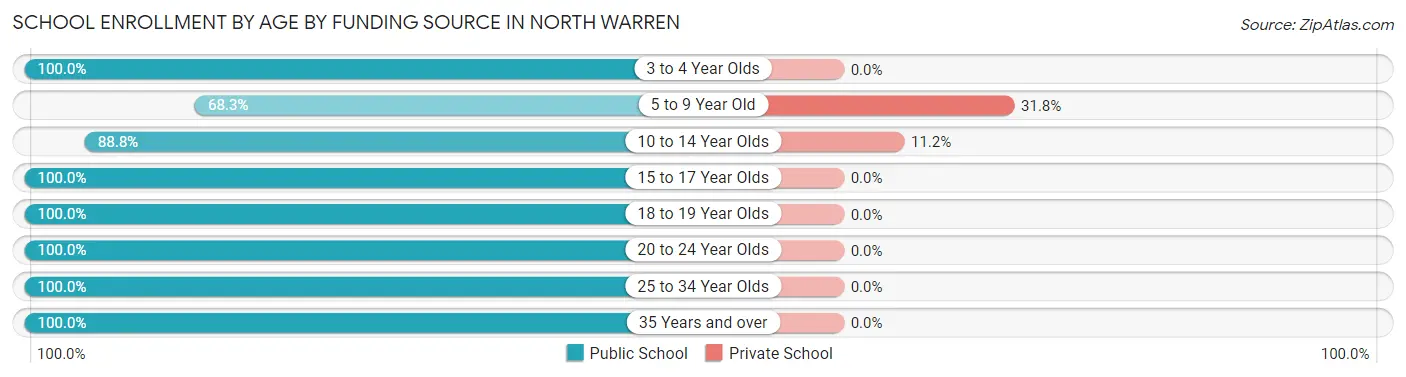
| Age Bracket | Public School | Private School |
| 3 to 4 Year Olds | 61 (100.0%) | 0 (0.0%) |
| 5 to 9 Year Old | 43 (68.2%) | 20 (31.8%) |
| 10 to 14 Year Olds | 79 (88.8%) | 10 (11.2%) |
| 15 to 17 Year Olds | 4 (100.0%) | 0 (0.0%) |
| 18 to 19 Year Olds | 10 (100.0%) | 0 (0.0%) |
| 20 to 24 Year Olds | 14 (100.0%) | 0 (0.0%) |
| 25 to 34 Year Olds | 19 (100.0%) | 0 (0.0%) |
| 35 Years and over | 4 (100.0%) | 0 (0.0%) |
| Total | 234 (88.6%) | 30 (11.4%) |
Educational Attainment by Field of Study in North Warren
Education (46 | 16.9%), social sciences (42 | 15.4%), business (42 | 15.4%), psychology (35 | 12.9%), and bio, nature & agricultural (20 | 7.3%) are the most common fields of study among 272 individuals in North Warren who have obtained a bachelor's degree or higher.
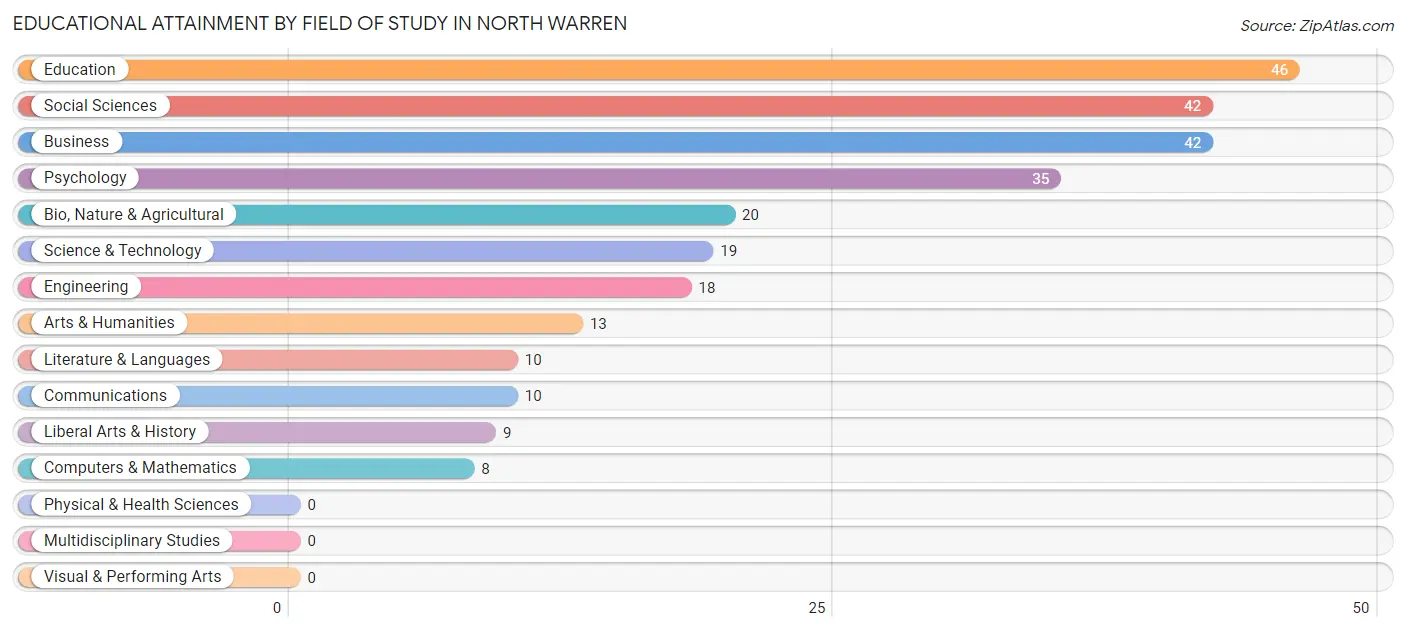
| Field of Study | # Graduates | % Graduates |
| Computers & Mathematics | 8 | 2.9% |
| Bio, Nature & Agricultural | 20 | 7.3% |
| Physical & Health Sciences | 0 | 0.0% |
| Psychology | 35 | 12.9% |
| Social Sciences | 42 | 15.4% |
| Engineering | 18 | 6.6% |
| Multidisciplinary Studies | 0 | 0.0% |
| Science & Technology | 19 | 7.0% |
| Business | 42 | 15.4% |
| Education | 46 | 16.9% |
| Literature & Languages | 10 | 3.7% |
| Liberal Arts & History | 9 | 3.3% |
| Visual & Performing Arts | 0 | 0.0% |
| Communications | 10 | 3.7% |
| Arts & Humanities | 13 | 4.8% |
| Total | 272 | 100.0% |
Transportation & Commute in North Warren
Vehicle Availability by Sex in North Warren
The most prevalent vehicle ownership categories in North Warren are males with 2 vehicles (347, accounting for 66.7%) and females with 2 vehicles (162, making up 127.6%).
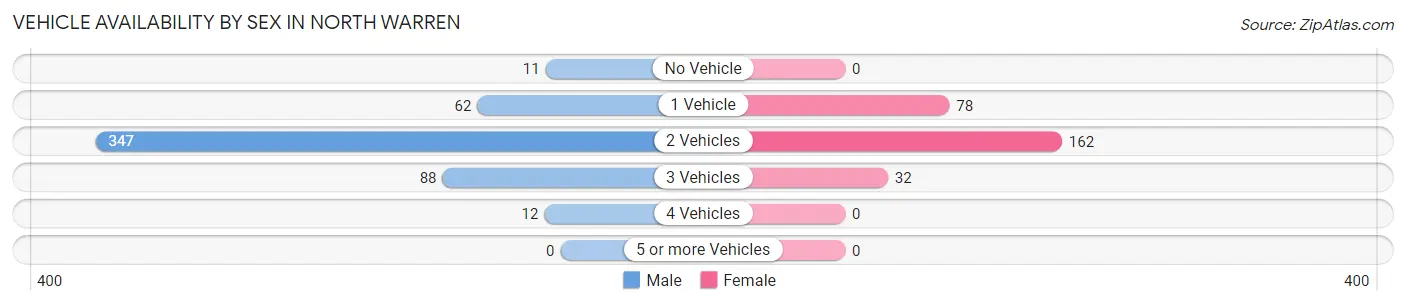
| Vehicles Available | Male | Female |
| No Vehicle | 11 (2.1%) | 0 (0.0%) |
| 1 Vehicle | 62 (11.9%) | 78 (28.7%) |
| 2 Vehicles | 347 (66.7%) | 162 (59.6%) |
| 3 Vehicles | 88 (16.9%) | 32 (11.8%) |
| 4 Vehicles | 12 (2.3%) | 0 (0.0%) |
| 5 or more Vehicles | 0 (0.0%) | 0 (0.0%) |
| Total | 520 (100.0%) | 272 (100.0%) |
Commute Time in North Warren
The most frequently occuring commute durations in North Warren are 10 to 14 minutes (189 commuters, 24.6%), 15 to 19 minutes (160 commuters, 20.8%), and 5 to 9 minutes (113 commuters, 14.7%).
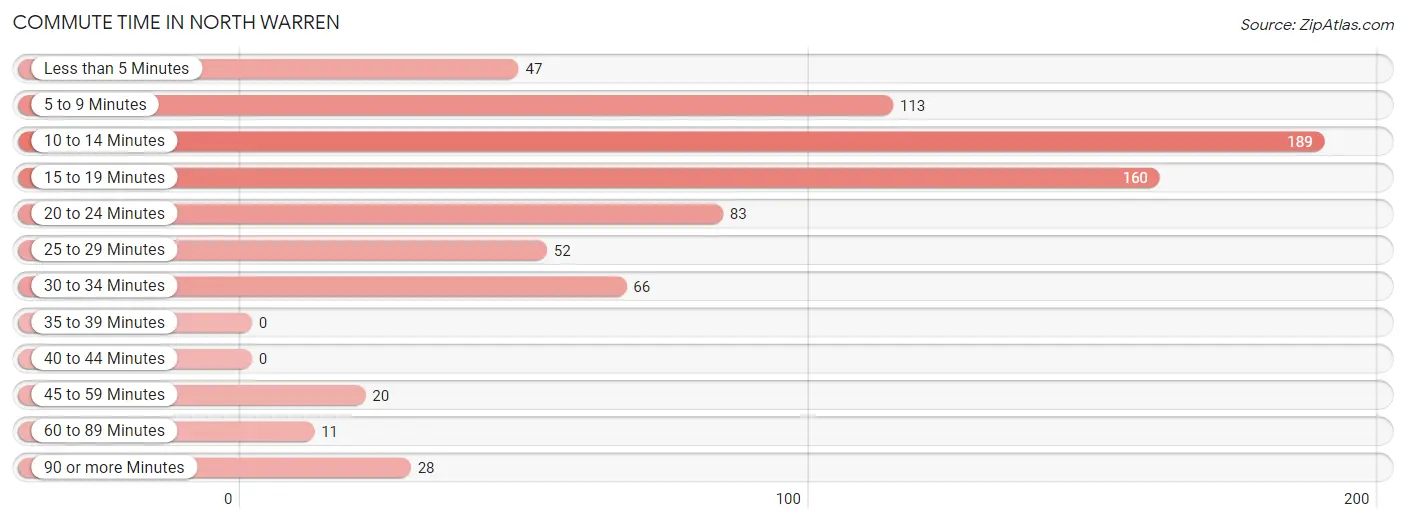
| Commute Time | # Commuters | % Commuters |
| Less than 5 Minutes | 47 | 6.1% |
| 5 to 9 Minutes | 113 | 14.7% |
| 10 to 14 Minutes | 189 | 24.6% |
| 15 to 19 Minutes | 160 | 20.8% |
| 20 to 24 Minutes | 83 | 10.8% |
| 25 to 29 Minutes | 52 | 6.8% |
| 30 to 34 Minutes | 66 | 8.6% |
| 35 to 39 Minutes | 0 | 0.0% |
| 40 to 44 Minutes | 0 | 0.0% |
| 45 to 59 Minutes | 20 | 2.6% |
| 60 to 89 Minutes | 11 | 1.4% |
| 90 or more Minutes | 28 | 3.6% |
Commute Time by Sex in North Warren
The most common commute times in North Warren are 10 to 14 minutes (148 commuters, 29.2%) for males and 5 to 9 minutes (63 commuters, 23.9%) for females.
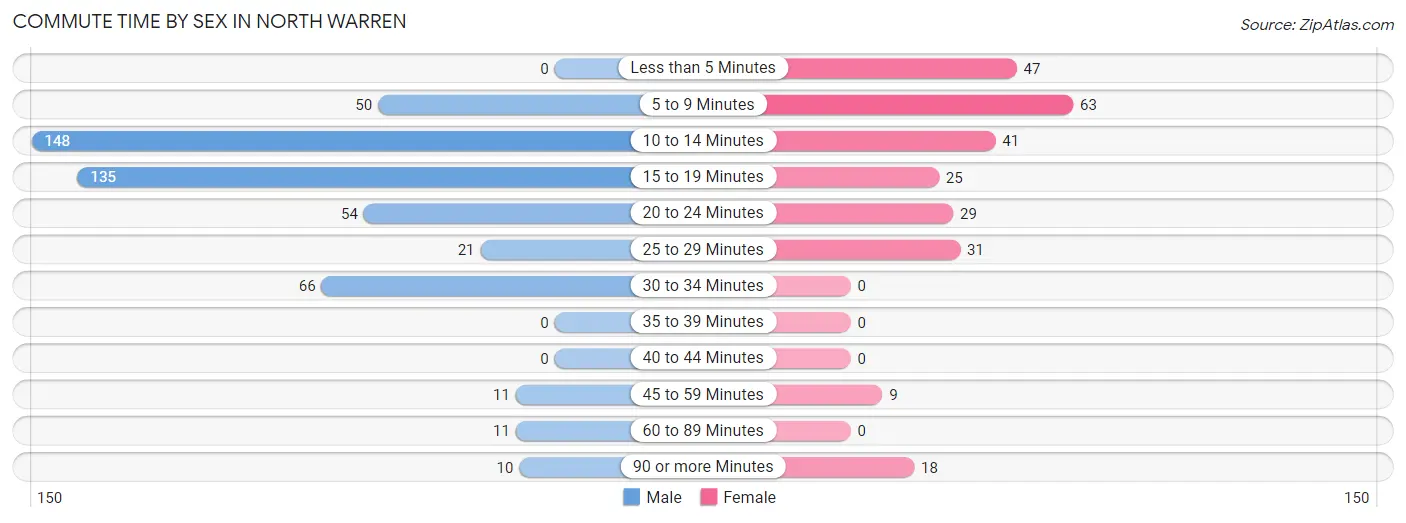
| Commute Time | Male | Female |
| Less than 5 Minutes | 0 (0.0%) | 47 (17.9%) |
| 5 to 9 Minutes | 50 (9.9%) | 63 (23.9%) |
| 10 to 14 Minutes | 148 (29.2%) | 41 (15.6%) |
| 15 to 19 Minutes | 135 (26.7%) | 25 (9.5%) |
| 20 to 24 Minutes | 54 (10.7%) | 29 (11.0%) |
| 25 to 29 Minutes | 21 (4.2%) | 31 (11.8%) |
| 30 to 34 Minutes | 66 (13.0%) | 0 (0.0%) |
| 35 to 39 Minutes | 0 (0.0%) | 0 (0.0%) |
| 40 to 44 Minutes | 0 (0.0%) | 0 (0.0%) |
| 45 to 59 Minutes | 11 (2.2%) | 9 (3.4%) |
| 60 to 89 Minutes | 11 (2.2%) | 0 (0.0%) |
| 90 or more Minutes | 10 (2.0%) | 18 (6.8%) |
Time of Departure to Work by Sex in North Warren
The most frequent times of departure to work in North Warren are 12:00 PM to 3:59 PM (98, 19.4%) for males and 12:00 PM to 3:59 PM (70, 26.6%) for females.
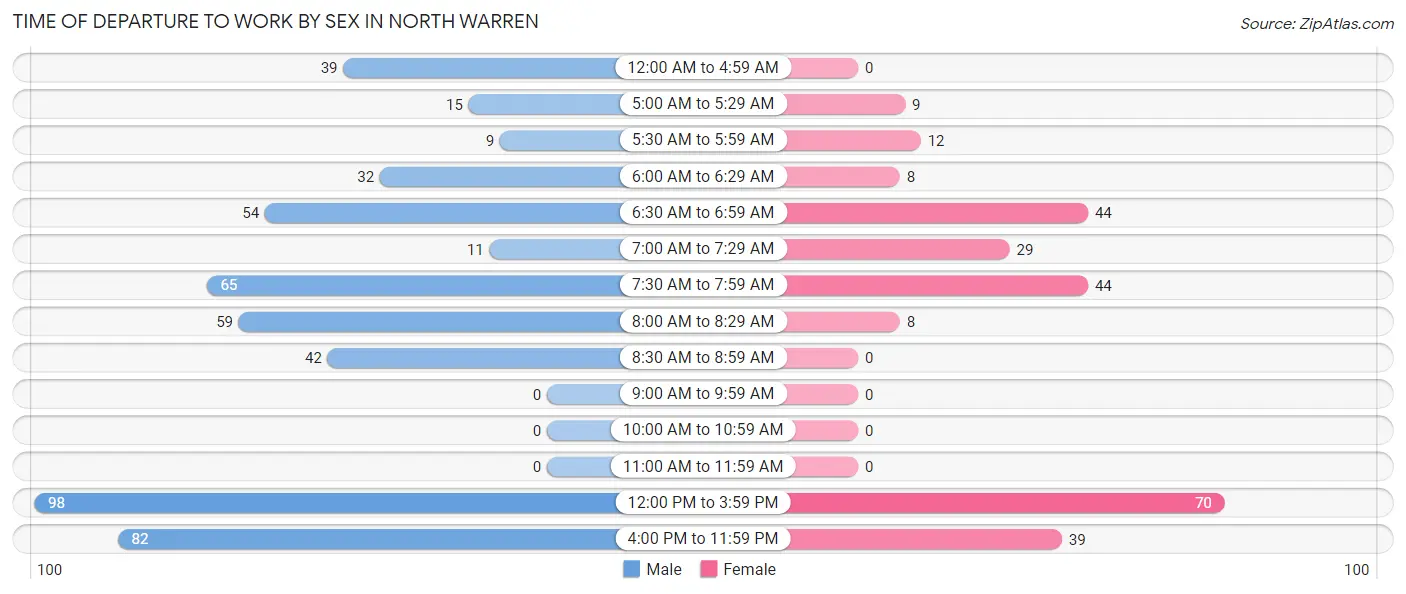
| Time of Departure | Male | Female |
| 12:00 AM to 4:59 AM | 39 (7.7%) | 0 (0.0%) |
| 5:00 AM to 5:29 AM | 15 (3.0%) | 9 (3.4%) |
| 5:30 AM to 5:59 AM | 9 (1.8%) | 12 (4.6%) |
| 6:00 AM to 6:29 AM | 32 (6.3%) | 8 (3.0%) |
| 6:30 AM to 6:59 AM | 54 (10.7%) | 44 (16.7%) |
| 7:00 AM to 7:29 AM | 11 (2.2%) | 29 (11.0%) |
| 7:30 AM to 7:59 AM | 65 (12.9%) | 44 (16.7%) |
| 8:00 AM to 8:29 AM | 59 (11.7%) | 8 (3.0%) |
| 8:30 AM to 8:59 AM | 42 (8.3%) | 0 (0.0%) |
| 9:00 AM to 9:59 AM | 0 (0.0%) | 0 (0.0%) |
| 10:00 AM to 10:59 AM | 0 (0.0%) | 0 (0.0%) |
| 11:00 AM to 11:59 AM | 0 (0.0%) | 0 (0.0%) |
| 12:00 PM to 3:59 PM | 98 (19.4%) | 70 (26.6%) |
| 4:00 PM to 11:59 PM | 82 (16.2%) | 39 (14.8%) |
| Total | 506 (100.0%) | 263 (100.0%) |
Housing Occupancy in North Warren
Occupancy by Ownership in North Warren
Of the total 766 dwellings in North Warren, owner-occupied units account for 690 (90.1%), while renter-occupied units make up 76 (9.9%).
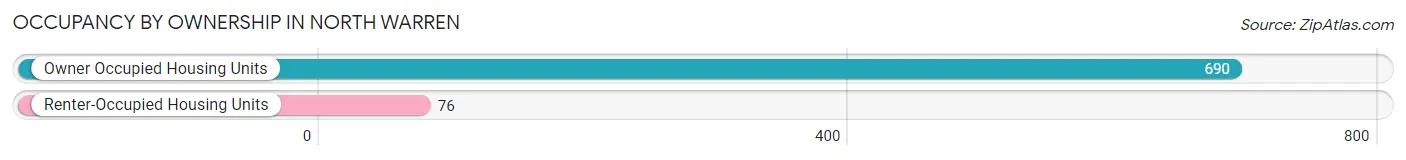
| Occupancy | # Housing Units | % Housing Units |
| Owner Occupied Housing Units | 690 | 90.1% |
| Renter-Occupied Housing Units | 76 | 9.9% |
| Total Occupied Housing Units | 766 | 100.0% |
Occupancy by Household Size in North Warren
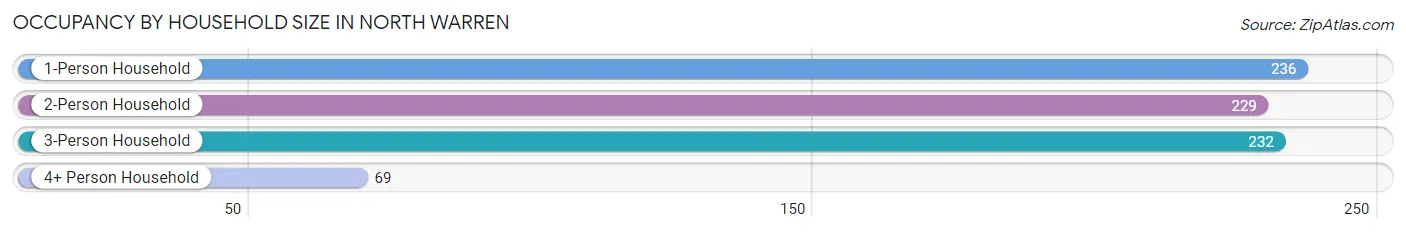
| Household Size | # Housing Units | % Housing Units |
| 1-Person Household | 236 | 30.8% |
| 2-Person Household | 229 | 29.9% |
| 3-Person Household | 232 | 30.3% |
| 4+ Person Household | 69 | 9.0% |
| Total Housing Units | 766 | 100.0% |
Occupancy by Ownership by Household Size in North Warren
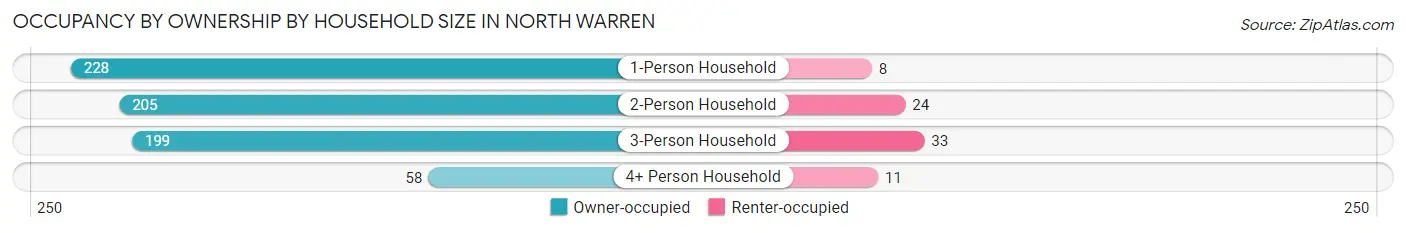
| Household Size | Owner-occupied | Renter-occupied |
| 1-Person Household | 228 (96.6%) | 8 (3.4%) |
| 2-Person Household | 205 (89.5%) | 24 (10.5%) |
| 3-Person Household | 199 (85.8%) | 33 (14.2%) |
| 4+ Person Household | 58 (84.1%) | 11 (15.9%) |
| Total Housing Units | 690 (90.1%) | 76 (9.9%) |
Occupancy by Educational Attainment in North Warren
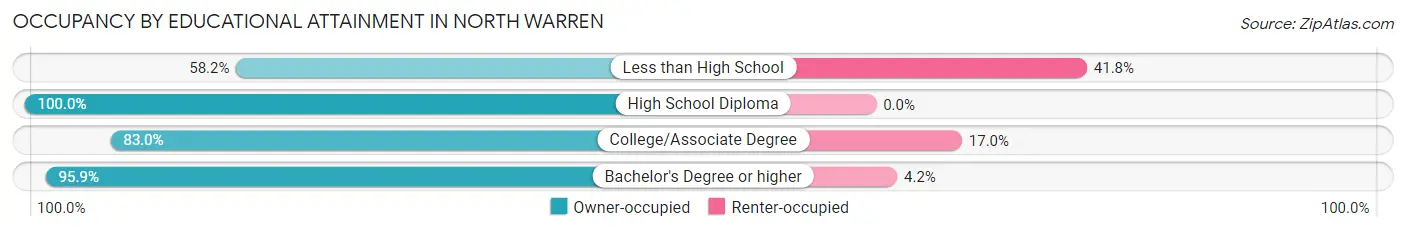
| Household Size | Owner-occupied | Renter-occupied |
| Less than High School | 46 (58.2%) | 33 (41.8%) |
| High School Diploma | 288 (100.0%) | 0 (0.0%) |
| College/Associate Degree | 171 (83.0%) | 35 (17.0%) |
| Bachelor's Degree or higher | 185 (95.9%) | 8 (4.2%) |
Occupancy by Age of Householder in North Warren
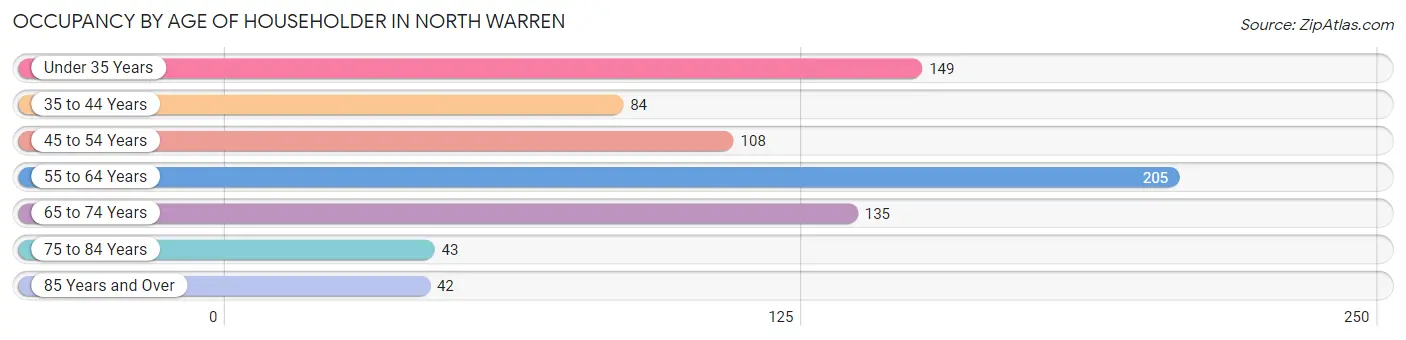
| Age Bracket | # Households | % Households |
| Under 35 Years | 149 | 19.5% |
| 35 to 44 Years | 84 | 11.0% |
| 45 to 54 Years | 108 | 14.1% |
| 55 to 64 Years | 205 | 26.8% |
| 65 to 74 Years | 135 | 17.6% |
| 75 to 84 Years | 43 | 5.6% |
| 85 Years and Over | 42 | 5.5% |
| Total | 766 | 100.0% |
Housing Finances in North Warren
Median Income by Occupancy in North Warren
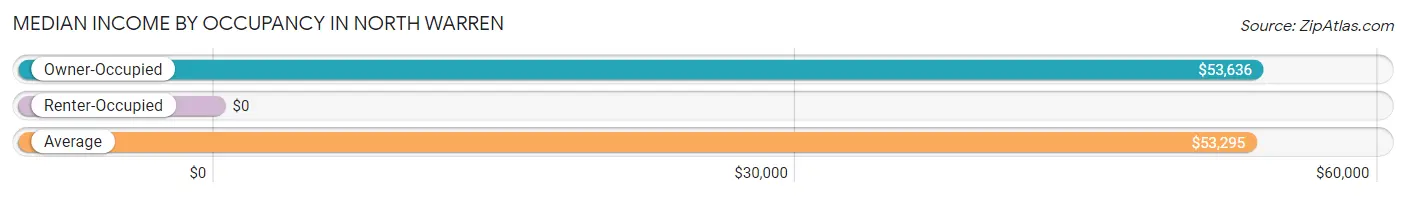
| Occupancy Type | # Households | Median Income |
| Owner-Occupied | 690 (90.1%) | $53,636 |
| Renter-Occupied | 76 (9.9%) | $0 |
| Average | 766 (100.0%) | $53,295 |
Occupancy by Householder Income Bracket in North Warren
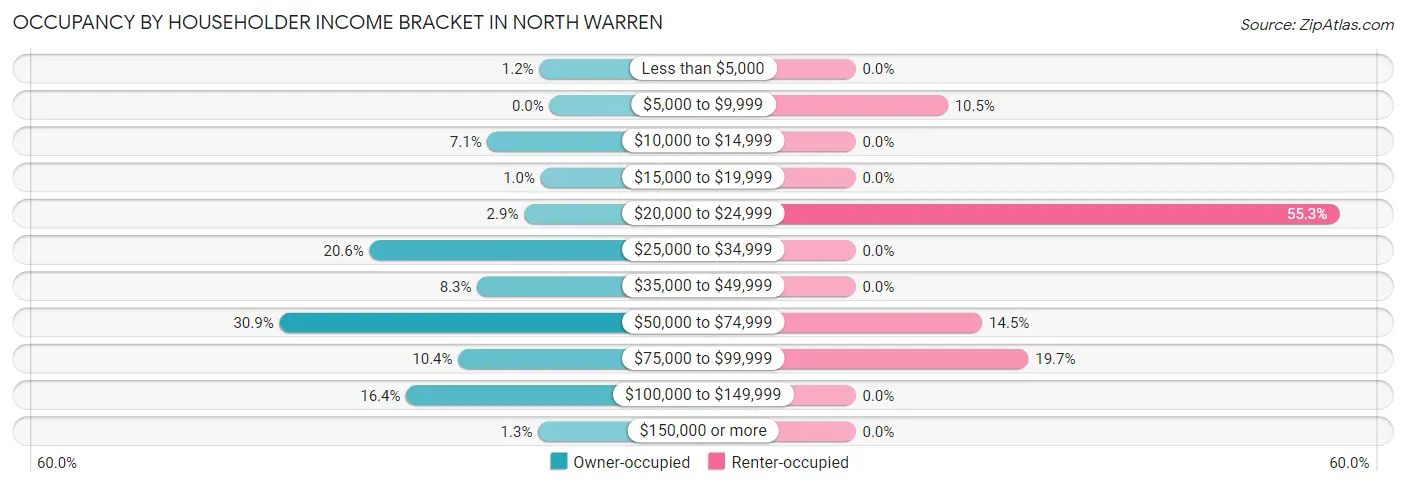
| Income Bracket | Owner-occupied | Renter-occupied |
| Less than $5,000 | 8 (1.2%) | 0 (0.0%) |
| $5,000 to $9,999 | 0 (0.0%) | 8 (10.5%) |
| $10,000 to $14,999 | 49 (7.1%) | 0 (0.0%) |
| $15,000 to $19,999 | 7 (1.0%) | 0 (0.0%) |
| $20,000 to $24,999 | 20 (2.9%) | 42 (55.3%) |
| $25,000 to $34,999 | 142 (20.6%) | 0 (0.0%) |
| $35,000 to $49,999 | 57 (8.3%) | 0 (0.0%) |
| $50,000 to $74,999 | 213 (30.9%) | 11 (14.5%) |
| $75,000 to $99,999 | 72 (10.4%) | 15 (19.7%) |
| $100,000 to $149,999 | 113 (16.4%) | 0 (0.0%) |
| $150,000 or more | 9 (1.3%) | 0 (0.0%) |
| Total | 690 (100.0%) | 76 (100.0%) |
Monthly Housing Cost Tiers in North Warren
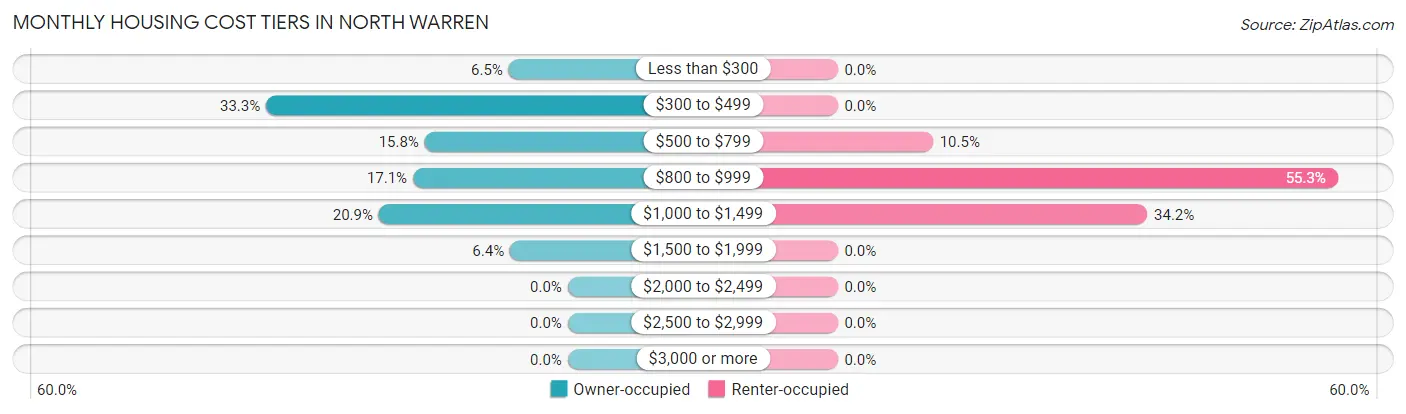
| Monthly Cost | Owner-occupied | Renter-occupied |
| Less than $300 | 45 (6.5%) | 0 (0.0%) |
| $300 to $499 | 230 (33.3%) | 0 (0.0%) |
| $500 to $799 | 109 (15.8%) | 8 (10.5%) |
| $800 to $999 | 118 (17.1%) | 42 (55.3%) |
| $1,000 to $1,499 | 144 (20.9%) | 26 (34.2%) |
| $1,500 to $1,999 | 44 (6.4%) | 0 (0.0%) |
| $2,000 to $2,499 | 0 (0.0%) | 0 (0.0%) |
| $2,500 to $2,999 | 0 (0.0%) | 0 (0.0%) |
| $3,000 or more | 0 (0.0%) | 0 (0.0%) |
| Total | 690 (100.0%) | 76 (100.0%) |
Physical Housing Characteristics in North Warren
Housing Structures in North Warren
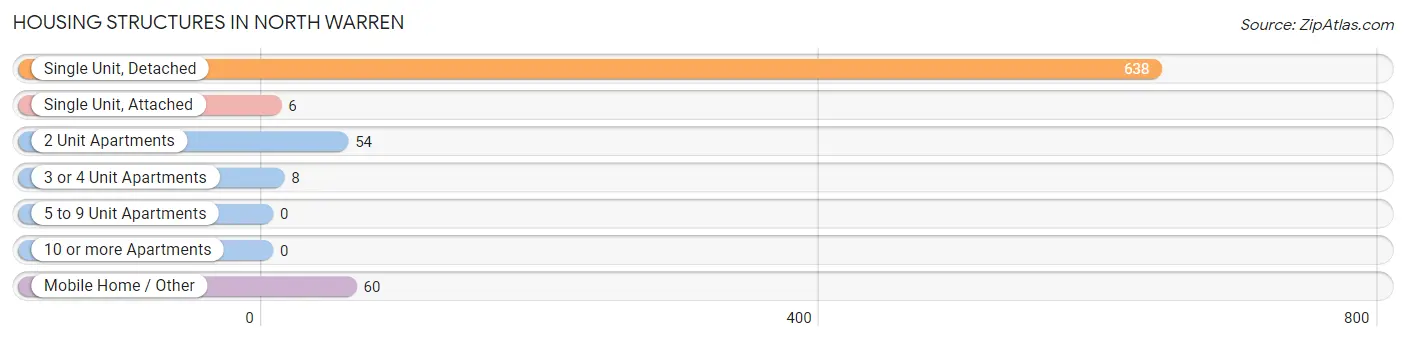
| Structure Type | # Housing Units | % Housing Units |
| Single Unit, Detached | 638 | 83.3% |
| Single Unit, Attached | 6 | 0.8% |
| 2 Unit Apartments | 54 | 7.0% |
| 3 or 4 Unit Apartments | 8 | 1.0% |
| 5 to 9 Unit Apartments | 0 | 0.0% |
| 10 or more Apartments | 0 | 0.0% |
| Mobile Home / Other | 60 | 7.8% |
| Total | 766 | 100.0% |
Housing Structures by Occupancy in North Warren
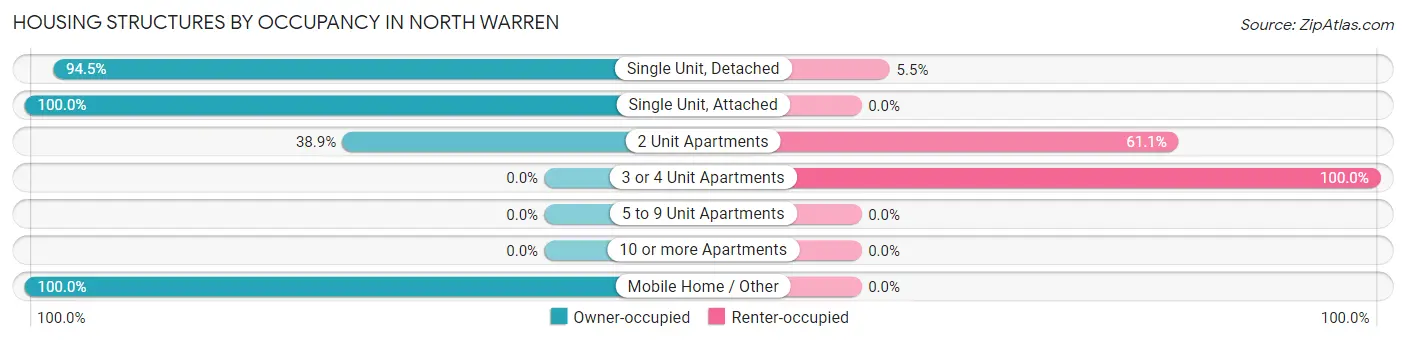
| Structure Type | Owner-occupied | Renter-occupied |
| Single Unit, Detached | 603 (94.5%) | 35 (5.5%) |
| Single Unit, Attached | 6 (100.0%) | 0 (0.0%) |
| 2 Unit Apartments | 21 (38.9%) | 33 (61.1%) |
| 3 or 4 Unit Apartments | 0 (0.0%) | 8 (100.0%) |
| 5 to 9 Unit Apartments | 0 (0.0%) | 0 (0.0%) |
| 10 or more Apartments | 0 (0.0%) | 0 (0.0%) |
| Mobile Home / Other | 60 (100.0%) | 0 (0.0%) |
| Total | 690 (90.1%) | 76 (9.9%) |
Housing Structures by Number of Rooms in North Warren
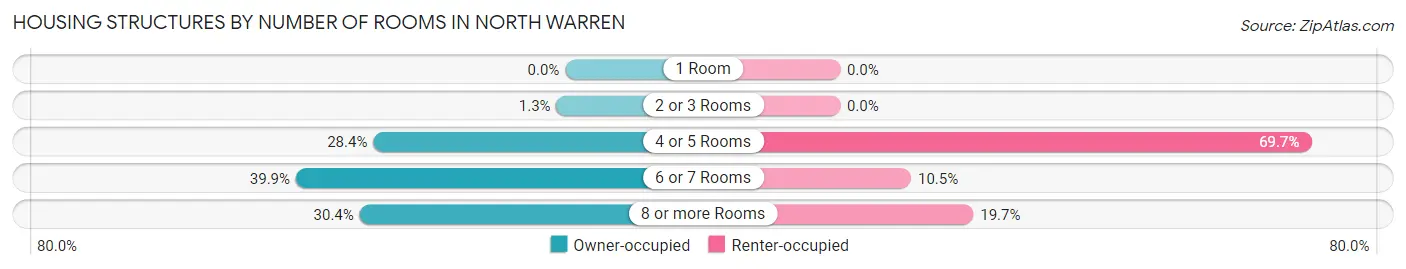
| Number of Rooms | Owner-occupied | Renter-occupied |
| 1 Room | 0 (0.0%) | 0 (0.0%) |
| 2 or 3 Rooms | 9 (1.3%) | 0 (0.0%) |
| 4 or 5 Rooms | 196 (28.4%) | 53 (69.7%) |
| 6 or 7 Rooms | 275 (39.9%) | 8 (10.5%) |
| 8 or more Rooms | 210 (30.4%) | 15 (19.7%) |
| Total | 690 (100.0%) | 76 (100.0%) |
Housing Structure by Heating Type in North Warren
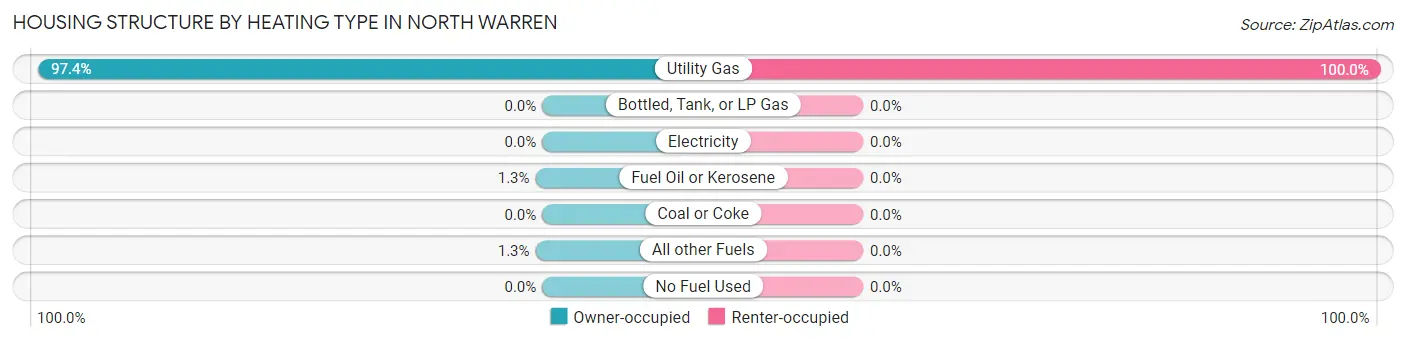
| Heating Type | Owner-occupied | Renter-occupied |
| Utility Gas | 672 (97.4%) | 76 (100.0%) |
| Bottled, Tank, or LP Gas | 0 (0.0%) | 0 (0.0%) |
| Electricity | 0 (0.0%) | 0 (0.0%) |
| Fuel Oil or Kerosene | 9 (1.3%) | 0 (0.0%) |
| Coal or Coke | 0 (0.0%) | 0 (0.0%) |
| All other Fuels | 9 (1.3%) | 0 (0.0%) |
| No Fuel Used | 0 (0.0%) | 0 (0.0%) |
| Total | 690 (100.0%) | 76 (100.0%) |
Household Vehicle Usage in North Warren
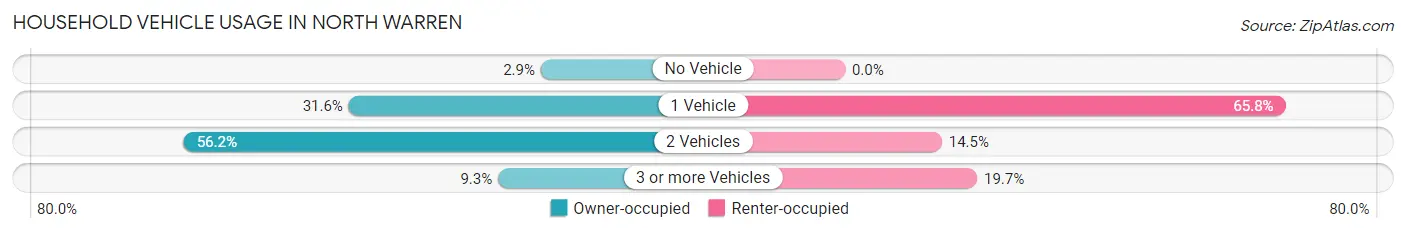
| Vehicles per Household | Owner-occupied | Renter-occupied |
| No Vehicle | 20 (2.9%) | 0 (0.0%) |
| 1 Vehicle | 218 (31.6%) | 50 (65.8%) |
| 2 Vehicles | 388 (56.2%) | 11 (14.5%) |
| 3 or more Vehicles | 64 (9.3%) | 15 (19.7%) |
| Total | 690 (100.0%) | 76 (100.0%) |
Real Estate & Mortgages in North Warren
Real Estate and Mortgage Overview in North Warren
| Characteristic | Without Mortgage | With Mortgage |
| Housing Units | 338 | 352 |
| Median Property Value | $113,800 | $93,800 |
| Median Household Income | $38,750 | $0 |
| Monthly Housing Costs | $445 | $0 |
| Real Estate Taxes | $1,632 | $0 |
Property Value by Mortgage Status in North Warren
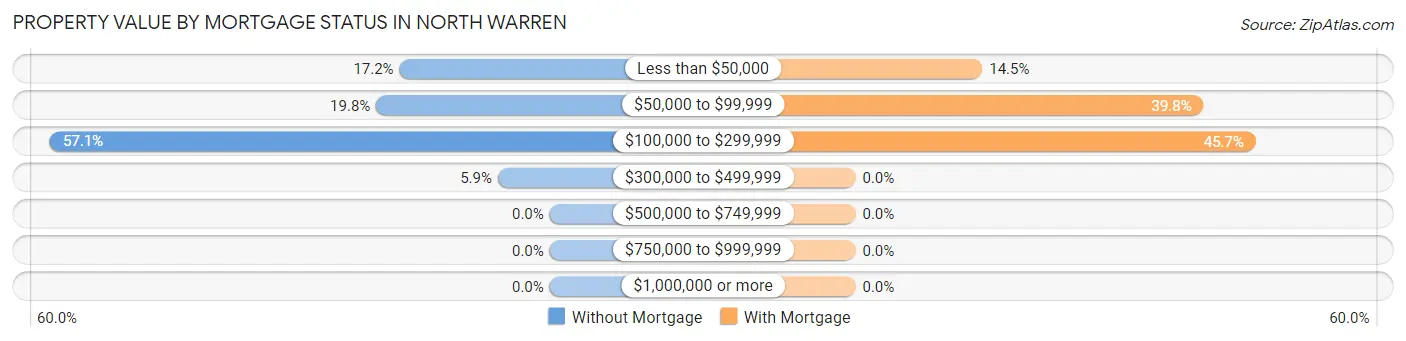
| Property Value | Without Mortgage | With Mortgage |
| Less than $50,000 | 58 (17.2%) | 51 (14.5%) |
| $50,000 to $99,999 | 67 (19.8%) | 140 (39.8%) |
| $100,000 to $299,999 | 193 (57.1%) | 161 (45.7%) |
| $300,000 to $499,999 | 20 (5.9%) | 0 (0.0%) |
| $500,000 to $749,999 | 0 (0.0%) | 0 (0.0%) |
| $750,000 to $999,999 | 0 (0.0%) | 0 (0.0%) |
| $1,000,000 or more | 0 (0.0%) | 0 (0.0%) |
| Total | 338 (100.0%) | 352 (100.0%) |
Household Income by Mortgage Status in North Warren
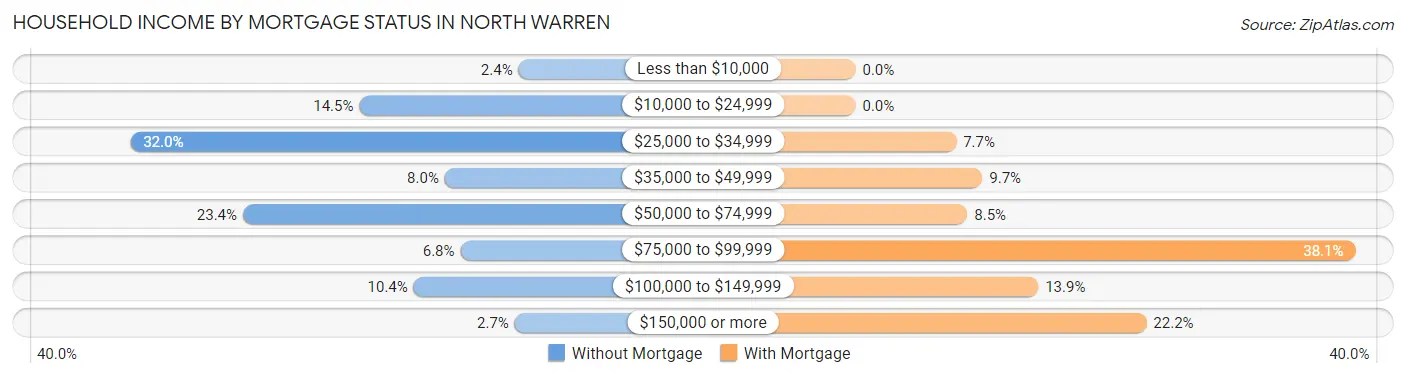
| Household Income | Without Mortgage | With Mortgage |
| Less than $10,000 | 8 (2.4%) | 0 (0.0%) |
| $10,000 to $24,999 | 49 (14.5%) | 0 (0.0%) |
| $25,000 to $34,999 | 108 (32.0%) | 27 (7.7%) |
| $35,000 to $49,999 | 27 (8.0%) | 34 (9.7%) |
| $50,000 to $74,999 | 79 (23.4%) | 30 (8.5%) |
| $75,000 to $99,999 | 23 (6.8%) | 134 (38.1%) |
| $100,000 to $149,999 | 35 (10.4%) | 49 (13.9%) |
| $150,000 or more | 9 (2.7%) | 78 (22.2%) |
| Total | 338 (100.0%) | 352 (100.0%) |
Property Value to Household Income Ratio in North Warren
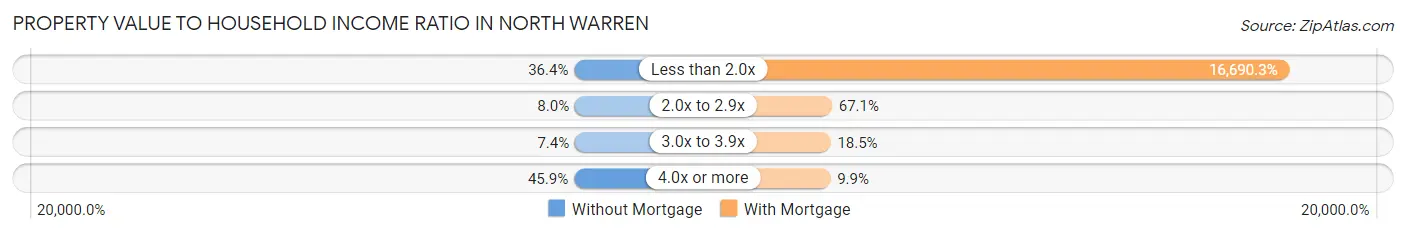
| Value-to-Income Ratio | Without Mortgage | With Mortgage |
| Less than 2.0x | 123 (36.4%) | 58,750 (16,690.3%) |
| 2.0x to 2.9x | 27 (8.0%) | 236 (67.0%) |
| 3.0x to 3.9x | 25 (7.4%) | 65 (18.5%) |
| 4.0x or more | 155 (45.9%) | 35 (9.9%) |
| Total | 338 (100.0%) | 352 (100.0%) |
Real Estate Taxes by Mortgage Status in North Warren
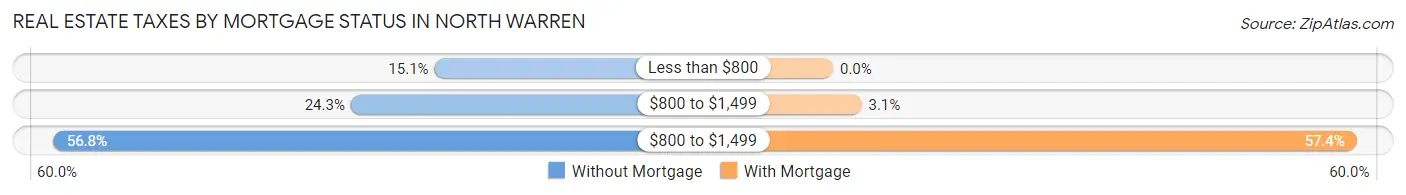
| Property Taxes | Without Mortgage | With Mortgage |
| Less than $800 | 51 (15.1%) | 0 (0.0%) |
| $800 to $1,499 | 82 (24.3%) | 11 (3.1%) |
| $800 to $1,499 | 192 (56.8%) | 202 (57.4%) |
| Total | 338 (100.0%) | 352 (100.0%) |
Health & Disability in North Warren
Health Insurance Coverage by Age in North Warren
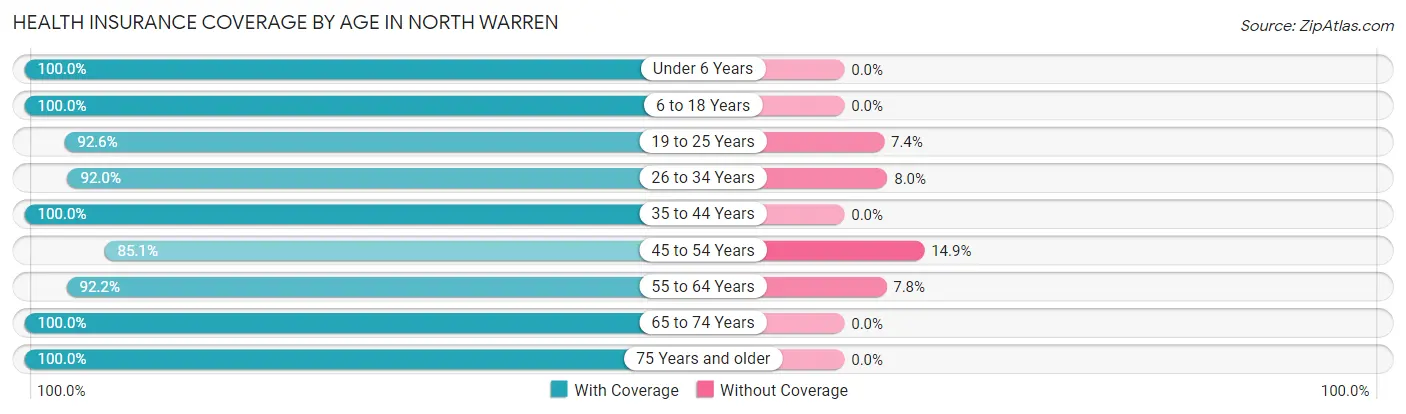
| Age Bracket | With Coverage | Without Coverage |
| Under 6 Years | 191 (100.0%) | 0 (0.0%) |
| 6 to 18 Years | 156 (100.0%) | 0 (0.0%) |
| 19 to 25 Years | 175 (92.6%) | 14 (7.4%) |
| 26 to 34 Years | 218 (92.0%) | 19 (8.0%) |
| 35 to 44 Years | 184 (100.0%) | 0 (0.0%) |
| 45 to 54 Years | 137 (85.1%) | 24 (14.9%) |
| 55 to 64 Years | 306 (92.2%) | 26 (7.8%) |
| 65 to 74 Years | 234 (100.0%) | 0 (0.0%) |
| 75 Years and older | 173 (100.0%) | 0 (0.0%) |
| Total | 1,774 (95.5%) | 83 (4.5%) |
Health Insurance Coverage by Citizenship Status in North Warren
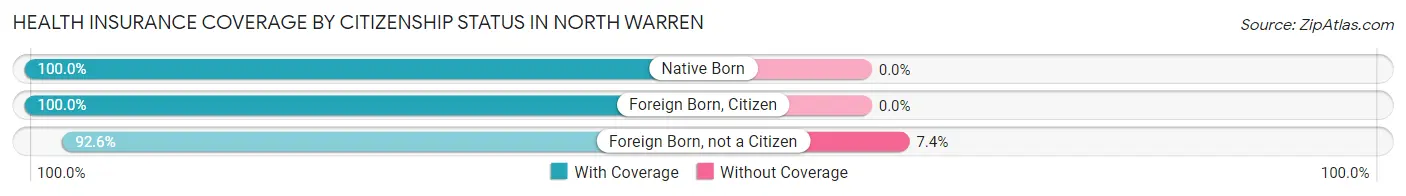
| Citizenship Status | With Coverage | Without Coverage |
| Native Born | 191 (100.0%) | 0 (0.0%) |
| Foreign Born, Citizen | 156 (100.0%) | 0 (0.0%) |
| Foreign Born, not a Citizen | 175 (92.6%) | 14 (7.4%) |
Health Insurance Coverage by Household Income in North Warren
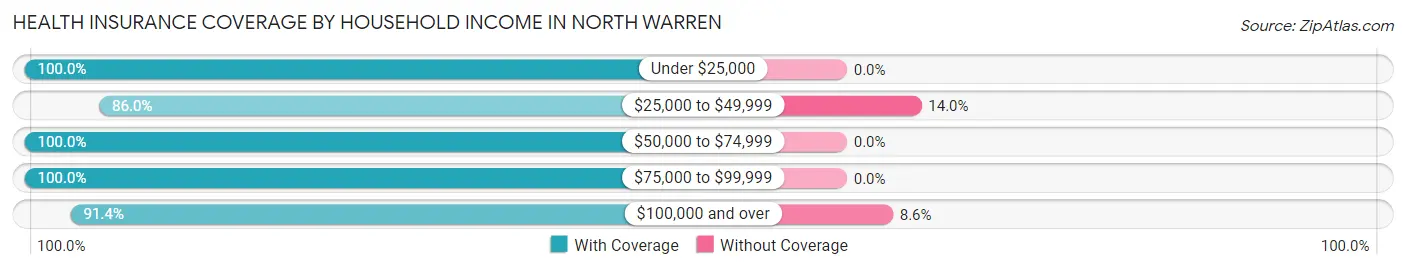
| Household Income | With Coverage | Without Coverage |
| Under $25,000 | 268 (100.0%) | 0 (0.0%) |
| $25,000 to $49,999 | 308 (86.0%) | 50 (14.0%) |
| $50,000 to $74,999 | 593 (100.0%) | 0 (0.0%) |
| $75,000 to $99,999 | 212 (100.0%) | 0 (0.0%) |
| $100,000 and over | 350 (91.4%) | 33 (8.6%) |
Public vs Private Health Insurance Coverage by Age in North Warren
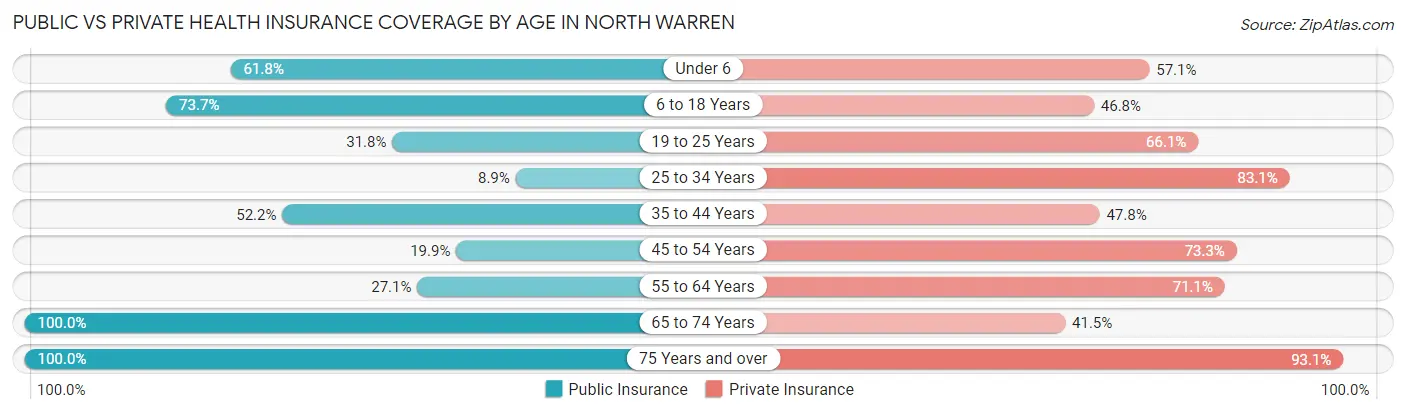
| Age Bracket | Public Insurance | Private Insurance |
| Under 6 | 118 (61.8%) | 109 (57.1%) |
| 6 to 18 Years | 115 (73.7%) | 73 (46.8%) |
| 19 to 25 Years | 60 (31.8%) | 125 (66.1%) |
| 25 to 34 Years | 21 (8.9%) | 197 (83.1%) |
| 35 to 44 Years | 96 (52.2%) | 88 (47.8%) |
| 45 to 54 Years | 32 (19.9%) | 118 (73.3%) |
| 55 to 64 Years | 90 (27.1%) | 236 (71.1%) |
| 65 to 74 Years | 234 (100.0%) | 97 (41.4%) |
| 75 Years and over | 173 (100.0%) | 161 (93.1%) |
| Total | 939 (50.6%) | 1,204 (64.8%) |
Disability Status by Sex by Age in North Warren
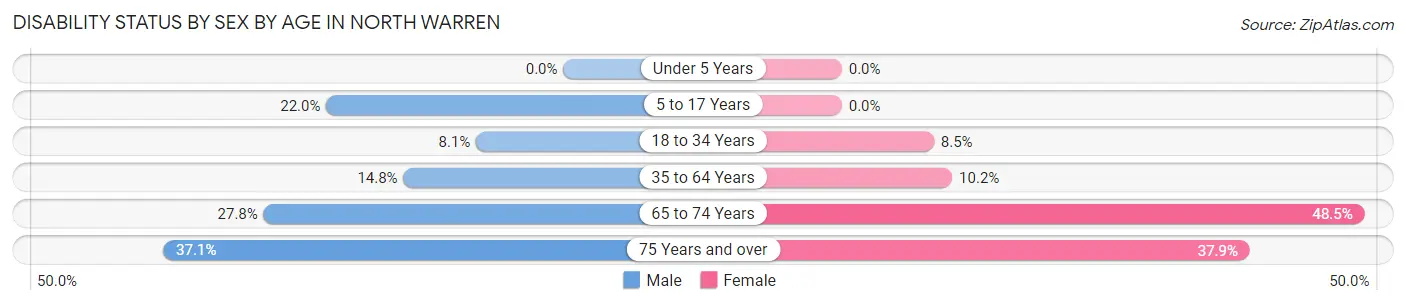
| Age Bracket | Male | Female |
| Under 5 Years | 0 (0.0%) | 0 (0.0%) |
| 5 to 17 Years | 22 (22.0%) | 0 (0.0%) |
| 18 to 34 Years | 22 (8.1%) | 14 (8.5%) |
| 35 to 64 Years | 57 (14.8%) | 30 (10.2%) |
| 65 to 74 Years | 37 (27.8%) | 49 (48.5%) |
| 75 Years and over | 26 (37.1%) | 39 (37.9%) |
Disability Class by Sex by Age in North Warren
Disability Class: Hearing Difficulty
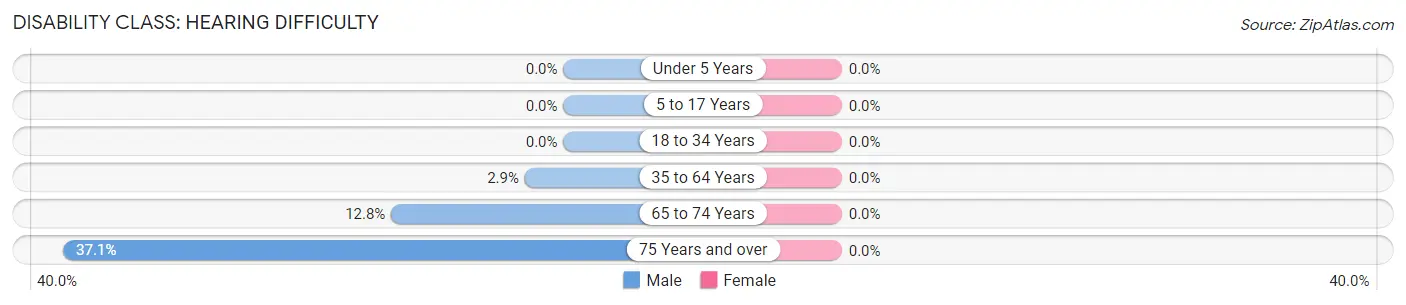
| Age Bracket | Male | Female |
| Under 5 Years | 0 (0.0%) | 0 (0.0%) |
| 5 to 17 Years | 0 (0.0%) | 0 (0.0%) |
| 18 to 34 Years | 0 (0.0%) | 0 (0.0%) |
| 35 to 64 Years | 11 (2.9%) | 0 (0.0%) |
| 65 to 74 Years | 17 (12.8%) | 0 (0.0%) |
| 75 Years and over | 26 (37.1%) | 0 (0.0%) |
Disability Class: Vision Difficulty
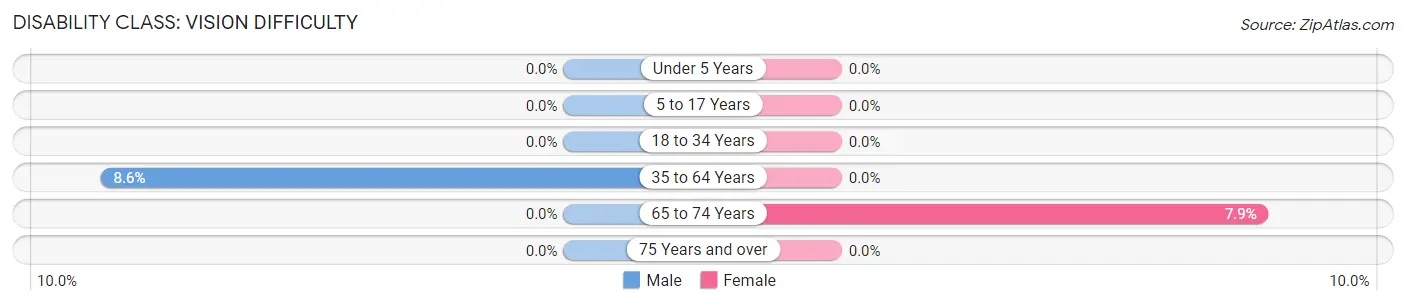
| Age Bracket | Male | Female |
| Under 5 Years | 0 (0.0%) | 0 (0.0%) |
| 5 to 17 Years | 0 (0.0%) | 0 (0.0%) |
| 18 to 34 Years | 0 (0.0%) | 0 (0.0%) |
| 35 to 64 Years | 33 (8.6%) | 0 (0.0%) |
| 65 to 74 Years | 0 (0.0%) | 8 (7.9%) |
| 75 Years and over | 0 (0.0%) | 0 (0.0%) |
Disability Class: Cognitive Difficulty
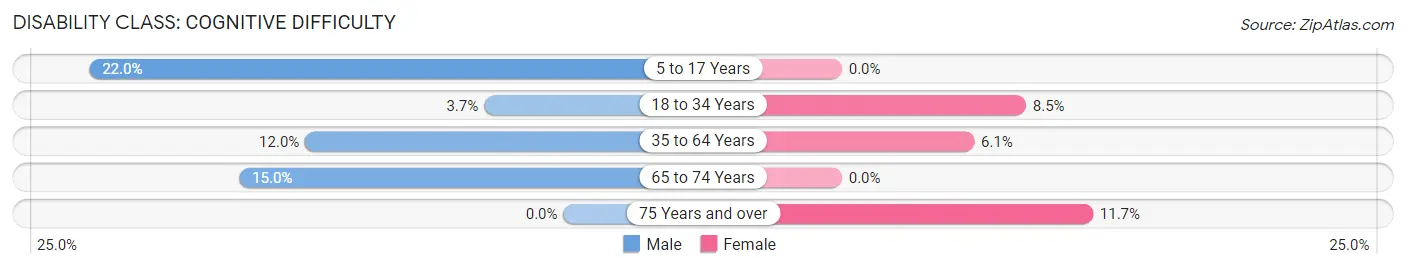
| Age Bracket | Male | Female |
| 5 to 17 Years | 22 (22.0%) | 0 (0.0%) |
| 18 to 34 Years | 10 (3.7%) | 14 (8.5%) |
| 35 to 64 Years | 46 (12.0%) | 18 (6.1%) |
| 65 to 74 Years | 20 (15.0%) | 0 (0.0%) |
| 75 Years and over | 0 (0.0%) | 12 (11.7%) |
Disability Class: Ambulatory Difficulty
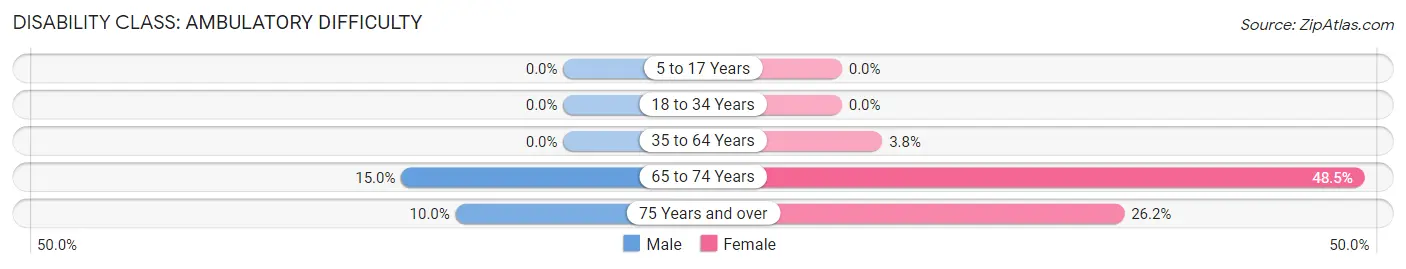
| Age Bracket | Male | Female |
| 5 to 17 Years | 0 (0.0%) | 0 (0.0%) |
| 18 to 34 Years | 0 (0.0%) | 0 (0.0%) |
| 35 to 64 Years | 0 (0.0%) | 11 (3.7%) |
| 65 to 74 Years | 20 (15.0%) | 49 (48.5%) |
| 75 Years and over | 7 (10.0%) | 27 (26.2%) |
Disability Class: Self-Care Difficulty
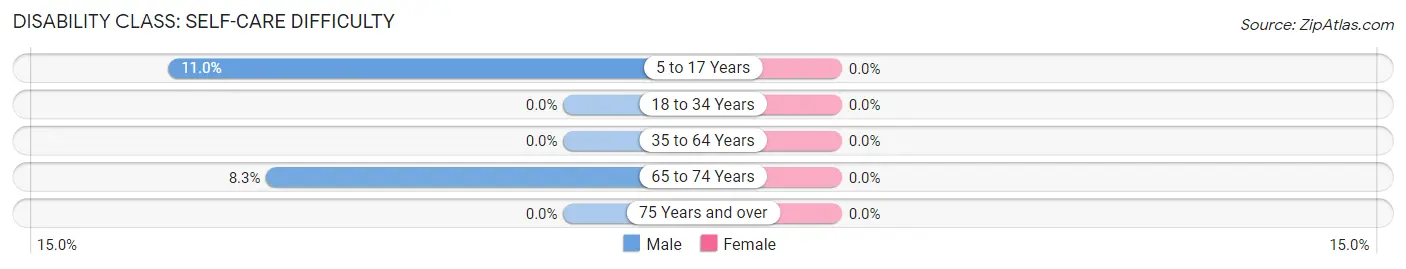
| Age Bracket | Male | Female |
| 5 to 17 Years | 11 (11.0%) | 0 (0.0%) |
| 18 to 34 Years | 0 (0.0%) | 0 (0.0%) |
| 35 to 64 Years | 0 (0.0%) | 0 (0.0%) |
| 65 to 74 Years | 11 (8.3%) | 0 (0.0%) |
| 75 Years and over | 0 (0.0%) | 0 (0.0%) |
Technology Access in North Warren
Computing Device Access in North Warren
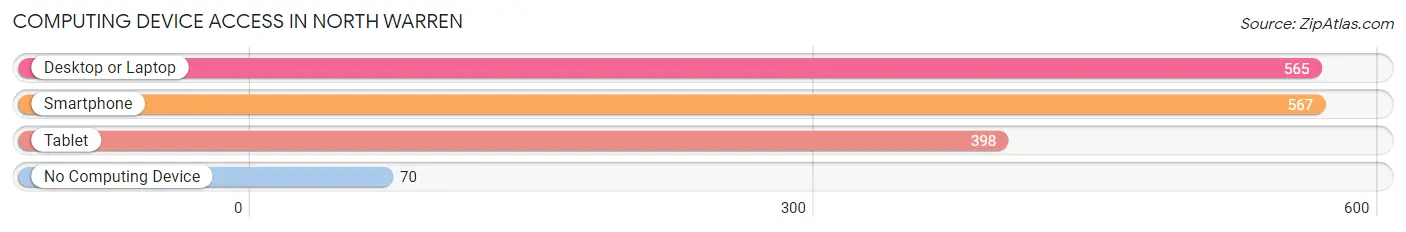
| Device Type | # Households | % Households |
| Desktop or Laptop | 565 | 73.8% |
| Smartphone | 567 | 74.0% |
| Tablet | 398 | 52.0% |
| No Computing Device | 70 | 9.1% |
| Total | 766 | 100.0% |
Internet Access in North Warren
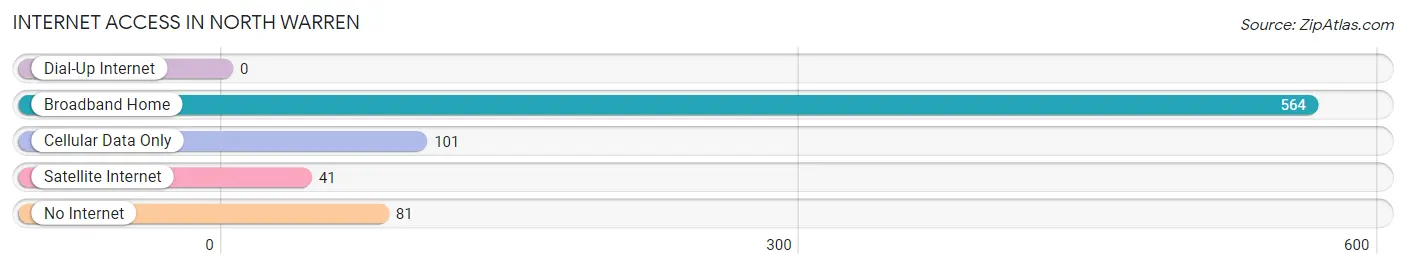
| Internet Type | # Households | % Households |
| Dial-Up Internet | 0 | 0.0% |
| Broadband Home | 564 | 73.6% |
| Cellular Data Only | 101 | 13.2% |
| Satellite Internet | 41 | 5.3% |
| No Internet | 81 | 10.6% |
| Total | 766 | 100.0% |
North Warren Summary
History
North Warren is a borough located in Warren County, Pennsylvania. It is situated in the northwestern corner of the state, near the border of New York. The borough was founded in 1837 and was originally known as North Easton. The name was changed to North Warren in 1845.
The area was first settled by Europeans in the late 1700s. The first settlers were mostly of German and English descent. The area was primarily used for farming and logging. In the early 1800s, the area began to develop into a small town. The first post office was established in 1837 and the first school was built in 1845.
The borough was officially incorporated in 1845. At the time, the population was around 500 people. The town grew slowly over the next few decades, reaching a population of 1,000 by the turn of the century.
The borough experienced a period of growth in the early 1900s. The population increased to 1,500 by 1910 and to 2,000 by 1920. The population continued to grow steadily throughout the 20th century, reaching a peak of 3,000 in the 1970s.
Geography
North Warren is located in the northwestern corner of Pennsylvania, near the border of New York. The borough is situated in the Allegheny Plateau region of the state. The terrain is mostly hilly and forested, with some areas of flat land. The borough is located in the Allegheny River watershed.
The borough covers an area of 1.3 square miles. The climate is humid continental, with cold winters and warm summers. The average annual temperature is around 50 degrees Fahrenheit.
Economy
The economy of North Warren is largely based on tourism and manufacturing. The borough is home to several small businesses, including restaurants, retail stores, and service providers. The borough is also home to several manufacturing companies, including a paper mill and a plastics factory.
The borough is also home to several educational institutions, including a community college and a technical school. The borough is also home to a hospital and several medical centers.
Demographics
As of the 2010 census, the population of North Warren was 2,845. The racial makeup of the borough was 97.3% White, 0.7% African American, 0.3% Native American, 0.3% Asian, and 1.4% from other races. Hispanic or Latino of any race were 1.2% of the population.
The median household income in North Warren was $37,917, and the median family income was $45,938. The per capita income was $20,945. About 11.3% of families and 14.2% of the population were below the poverty line.
Common Questions
What is Per Capita Income in North Warren?
Per Capita income in North Warren is $24,690.
What is the Median Family Income in North Warren?
Median Family Income in North Warren is $54,190.
What is the Median Household income in North Warren?
Median Household Income in North Warren is $53,295.
What is Income or Wage Gap in North Warren?
Income or Wage Gap in North Warren is 20.8%.
Women in North Warren earn 79.2 cents for every dollar earned by a man.
What is Inequality or Gini Index in North Warren?
Inequality or Gini Index in North Warren is 0.34.
What is the Total Population of North Warren?
Total Population of North Warren is 1,922.
What is the Total Male Population of North Warren?
Total Male Population of North Warren is 1,067.
What is the Total Female Population of North Warren?
Total Female Population of North Warren is 855.
What is the Ratio of Males per 100 Females in North Warren?
There are 124.80 Males per 100 Females in North Warren.
What is the Ratio of Females per 100 Males in North Warren?
There are 80.13 Females per 100 Males in North Warren.
What is the Median Population Age in North Warren?
Median Population Age in North Warren is 44.5 Years.
What is the Average Family Size in North Warren
Average Family Size in North Warren is 2.9 People.
What is the Average Household Size in North Warren
Average Household Size in North Warren is 2.4 People.
How Large is the Labor Force in North Warren?
There are 893 People in the Labor Forcein in North Warren.
What is the Percentage of People in the Labor Force in North Warren?
56.2% of People are in the Labor Force in North Warren.
What is the Unemployment Rate in North Warren?
Unemployment Rate in North Warren is 7.6%.