Delaware Water Gap borough, PA Map & Demographics
Delaware Water Gap borough Overview
$40,537
PER CAPITA INCOME
$98,958
AVG FAMILY INCOME
$60,139
AVG HOUSEHOLD INCOME
9.9%
WAGE / INCOME GAP [ % ]
90.1¢/ $1
WAGE / INCOME GAP [ $ ]
0.43
INEQUALITY / GINI INDEX
652
TOTAL POPULATION
357
MALE POPULATION
295
FEMALE POPULATION
121.02
MALES / 100 FEMALES
82.63
FEMALES / 100 MALES
48.1
MEDIAN AGE
3.2
AVG FAMILY SIZE
2.1
AVG HOUSEHOLD SIZE
373
LABOR FORCE [ PEOPLE ]
62.9%
PERCENT IN LABOR FORCE
6.2%
UNEMPLOYMENT RATE
Income in Delaware Water Gap borough
Income Overview in Delaware Water Gap borough
Per Capita Income in Delaware Water Gap borough is $40,537, while median incomes of families and households are $98,958 and $60,139 respectively.
| Characteristic | Number | Measure |
| Per Capita Income | 652 | $40,537 |
| Median Family Income | 135 | $98,958 |
| Mean Family Income | 135 | $113,055 |
| Median Household Income | 316 | $60,139 |
| Mean Household Income | 316 | $81,881 |
| Income Deficit | 135 | $0 |
| Wage / Income Gap (%) | 652 | 9.93% |
| Wage / Income Gap ($) | 652 | 90.07¢ per $1 |
| Gini / Inequality Index | 652 | 0.43 |
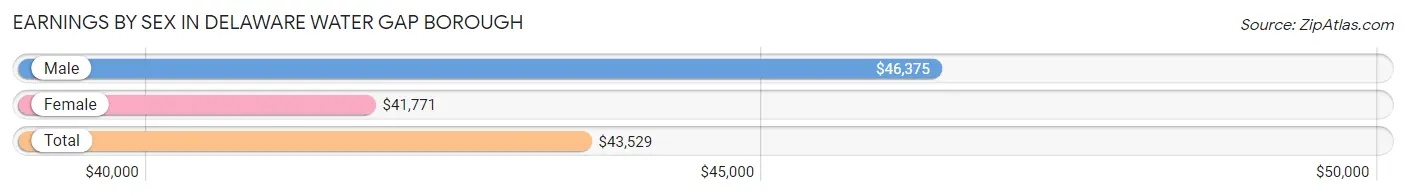
Earnings by Sex in Delaware Water Gap borough
Average Earnings in Delaware Water Gap borough are $43,529, $46,375 for men and $41,771 for women, a difference of 9.9%.
| Sex | Number | Average Earnings |
| Male | 215 (54.3%) | $46,375 |
| Female | 181 (45.7%) | $41,771 |
| Total | 396 (100.0%) | $43,529 |
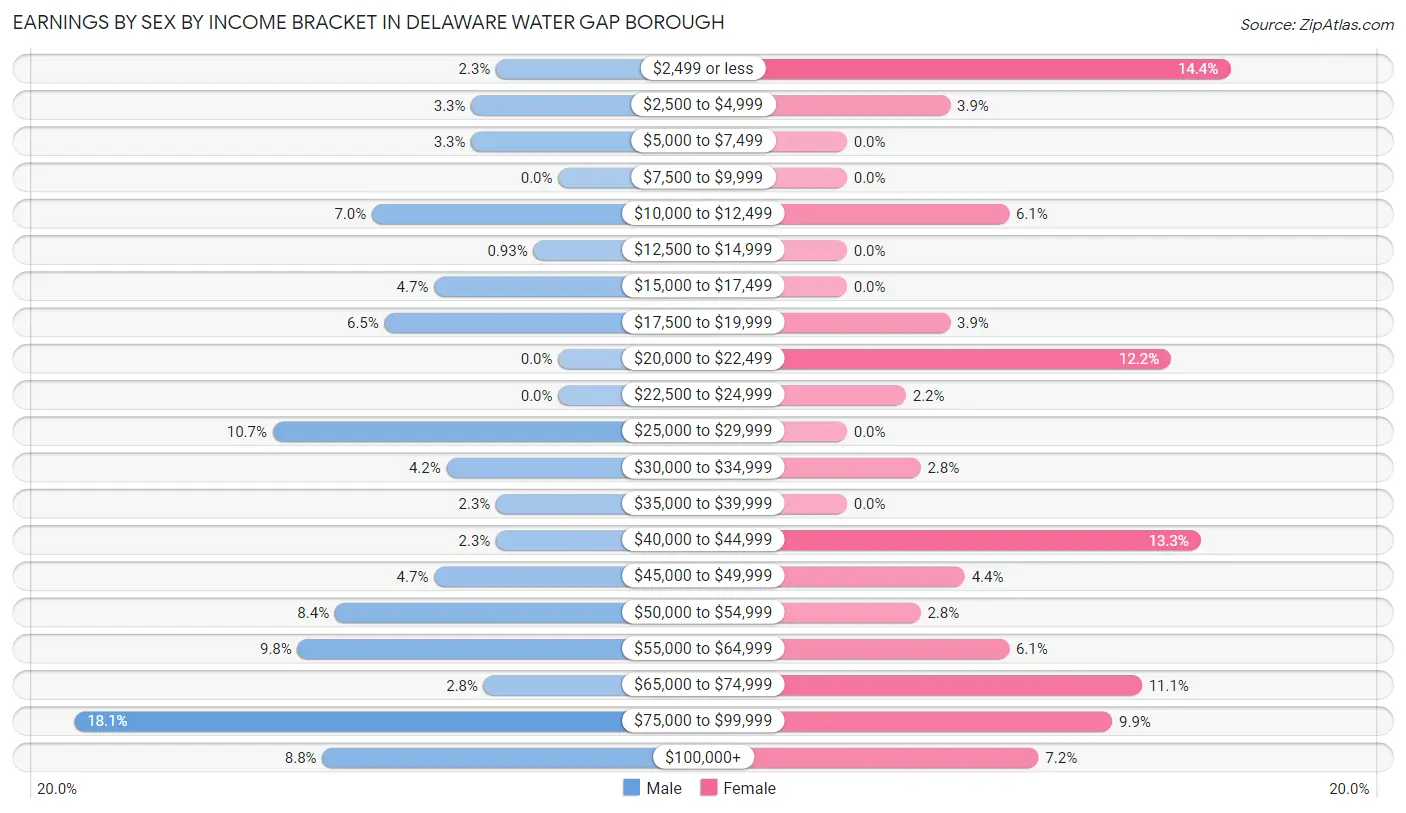
Earnings by Sex by Income Bracket in Delaware Water Gap borough
The most common earnings brackets in Delaware Water Gap borough are $75,000 to $99,999 for men (39 | 18.1%) and $2,499 or less for women (26 | 14.4%).
| Income | Male | Female |
| $2,499 or less | 5 (2.3%) | 26 (14.4%) |
| $2,500 to $4,999 | 7 (3.3%) | 7 (3.9%) |
| $5,000 to $7,499 | 7 (3.3%) | 0 (0.0%) |
| $7,500 to $9,999 | 0 (0.0%) | 0 (0.0%) |
| $10,000 to $12,499 | 15 (7.0%) | 11 (6.1%) |
| $12,500 to $14,999 | 2 (0.9%) | 0 (0.0%) |
| $15,000 to $17,499 | 10 (4.6%) | 0 (0.0%) |
| $17,500 to $19,999 | 14 (6.5%) | 7 (3.9%) |
| $20,000 to $22,499 | 0 (0.0%) | 22 (12.1%) |
| $22,500 to $24,999 | 0 (0.0%) | 4 (2.2%) |
| $25,000 to $29,999 | 23 (10.7%) | 0 (0.0%) |
| $30,000 to $34,999 | 9 (4.2%) | 5 (2.8%) |
| $35,000 to $39,999 | 5 (2.3%) | 0 (0.0%) |
| $40,000 to $44,999 | 5 (2.3%) | 24 (13.3%) |
| $45,000 to $49,999 | 10 (4.6%) | 8 (4.4%) |
| $50,000 to $54,999 | 18 (8.4%) | 5 (2.8%) |
| $55,000 to $64,999 | 21 (9.8%) | 11 (6.1%) |
| $65,000 to $74,999 | 6 (2.8%) | 20 (11.1%) |
| $75,000 to $99,999 | 39 (18.1%) | 18 (9.9%) |
| $100,000+ | 19 (8.8%) | 13 (7.2%) |
| Total | 215 (100.0%) | 181 (100.0%) |
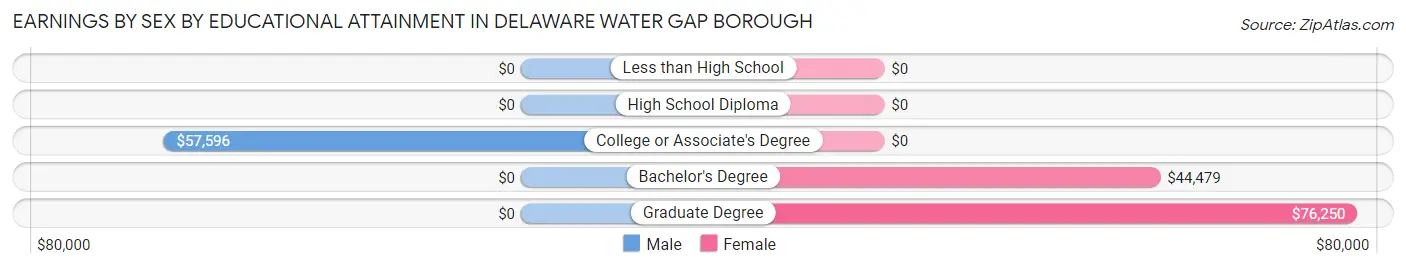
Earnings by Sex by Educational Attainment in Delaware Water Gap borough
Average earnings in Delaware Water Gap borough are $53,438 for men and $46,250 for women, a difference of 13.5%. Men with an educational attainment of college or associate's degree enjoy the highest average annual earnings of $57,596, while those with college or associate's degree education earn the least with $57,596. Women with an educational attainment of graduate degree earn the most with the average annual earnings of $76,250, while those with bachelor's degree education have the smallest earnings of $44,479.
| Educational Attainment | Male Income | Female Income |
| Less than High School | - | - |
| High School Diploma | - | - |
| College or Associate's Degree | $57,596 | $0 |
| Bachelor's Degree | - | - |
| Graduate Degree | - | - |
| Total | $53,438 | $46,250 |
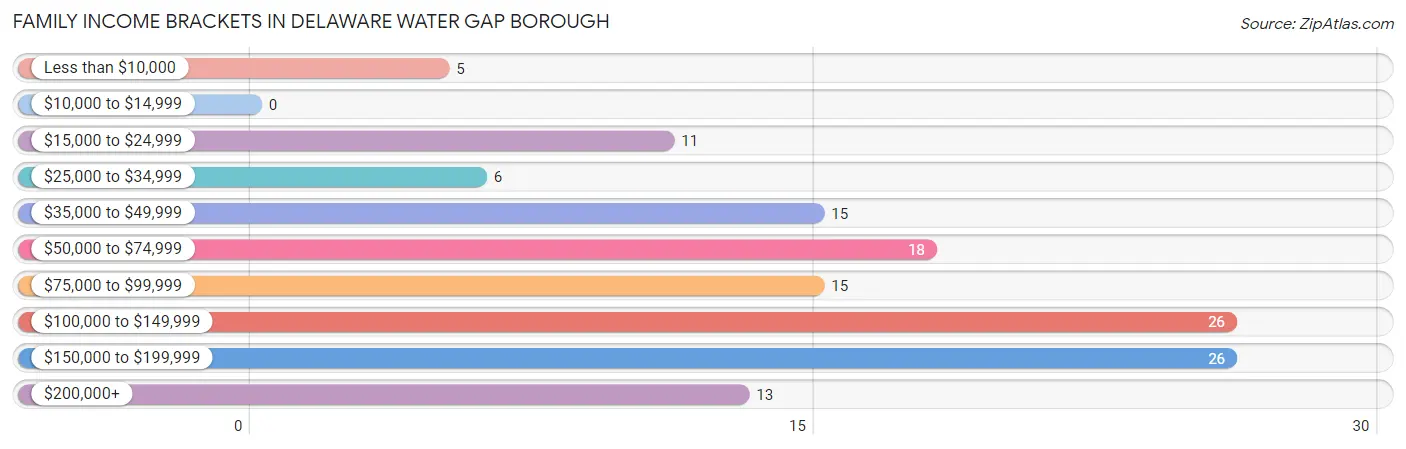
Family Income in Delaware Water Gap borough
Family Income Brackets in Delaware Water Gap borough
According to the Delaware Water Gap borough family income data, there are 26 families falling into the $100,000 to $149,999 income range, which is the most common income bracket and makes up 19.3% of all families.
| Income Bracket | # Families | % Families |
| Less than $10,000 | 5 | 3.7% |
| $10,000 to $14,999 | 0 | 0.0% |
| $15,000 to $24,999 | 11 | 8.1% |
| $25,000 to $34,999 | 6 | 4.4% |
| $35,000 to $49,999 | 15 | 11.1% |
| $50,000 to $74,999 | 18 | 13.3% |
| $75,000 to $99,999 | 15 | 11.1% |
| $100,000 to $149,999 | 26 | 19.3% |
| $150,000 to $199,999 | 26 | 19.3% |
| $200,000+ | 13 | 9.6% |
Family Income by Famaliy Size in Delaware Water Gap borough
4-person families (40 | 29.6%) account for the highest median family income in Delaware Water Gap borough with $131,250 per family, while 2-person families (69 | 51.1%) have the highest median income of $44,125 per family member.
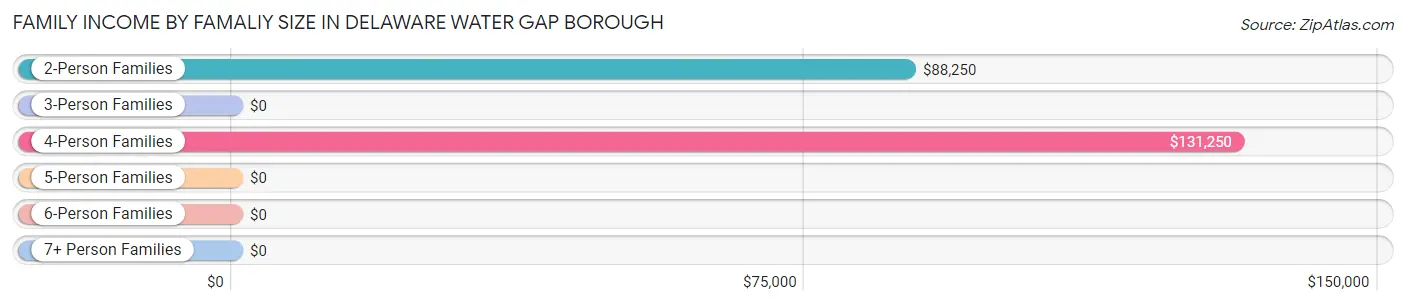
| Income Bracket | # Families | Median Income |
| 2-Person Families | 69 (51.1%) | $88,250 |
| 3-Person Families | 21 (15.6%) | $0 |
| 4-Person Families | 40 (29.6%) | $131,250 |
| 5-Person Families | 5 (3.7%) | $0 |
| 6-Person Families | 0 (0.0%) | $0 |
| 7+ Person Families | 0 (0.0%) | $0 |
| Total | 135 (100.0%) | $98,958 |
Family Income by Number of Earners in Delaware Water Gap borough
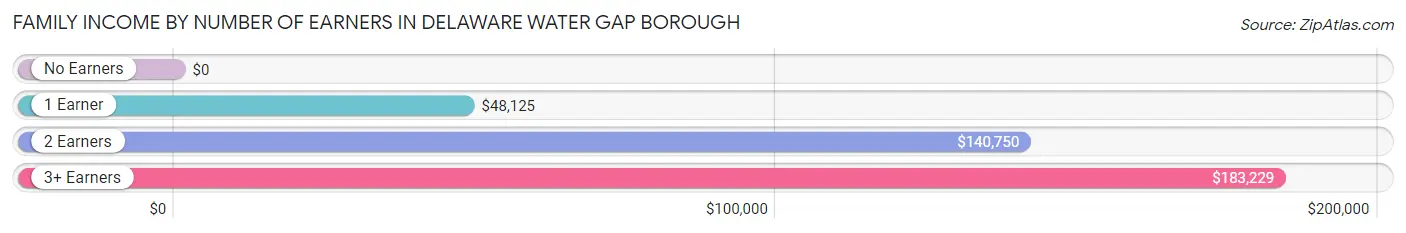
| Number of Earners | # Families | Median Income |
| No Earners | 30 (22.2%) | $0 |
| 1 Earner | 39 (28.9%) | $48,125 |
| 2 Earners | 39 (28.9%) | $140,750 |
| 3+ Earners | 27 (20.0%) | $183,229 |
| Total | 135 (100.0%) | $98,958 |
Household Income in Delaware Water Gap borough
Household Income Brackets in Delaware Water Gap borough
With 55 households falling in the category, the $50,000 to $74,999 income range is the most frequent in Delaware Water Gap borough, accounting for 17.4% of all households. In contrast, only 11 households (3.5%) fall into the $10,000 to $14,999 income bracket, making it the least populous group.
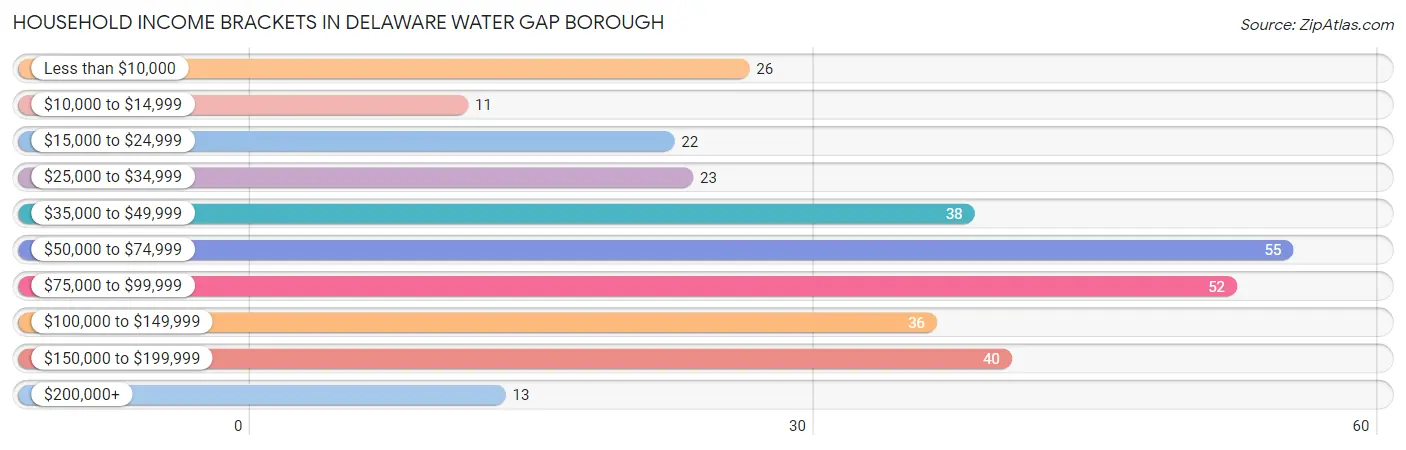
| Income Bracket | # Households | % Households |
| Less than $10,000 | 26 | 8.2% |
| $10,000 to $14,999 | 11 | 3.5% |
| $15,000 to $24,999 | 22 | 7.0% |
| $25,000 to $34,999 | 23 | 7.3% |
| $35,000 to $49,999 | 38 | 12.0% |
| $50,000 to $74,999 | 55 | 17.4% |
| $75,000 to $99,999 | 52 | 16.5% |
| $100,000 to $149,999 | 36 | 11.4% |
| $150,000 to $199,999 | 40 | 12.7% |
| $200,000+ | 13 | 4.1% |
Household Income by Householder Age in Delaware Water Gap borough
The median household income in Delaware Water Gap borough is $60,139, with the highest median household income of $86,071 found in the 45 to 64 years age bracket for the primary householder. A total of 162 households (51.3%) fall into this category. Meanwhile, the 15 to 24 years age bracket for the primary householder has the lowest median household income of $0, with 17 households (5.4%) in this group.
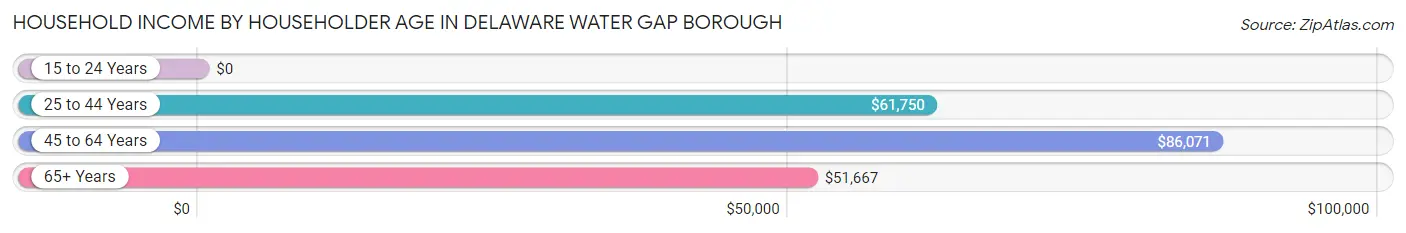
| Income Bracket | # Households | Median Income |
| 15 to 24 Years | 17 (5.4%) | $0 |
| 25 to 44 Years | 41 (13.0%) | $61,750 |
| 45 to 64 Years | 162 (51.3%) | $86,071 |
| 65+ Years | 96 (30.4%) | $51,667 |
| Total | 316 (100.0%) | $60,139 |
Poverty in Delaware Water Gap borough
Income Below Poverty by Sex and Age in Delaware Water Gap borough
With 15.1% poverty level for males and 13.2% for females among the residents of Delaware Water Gap borough, 25 to 34 year old males and 25 to 34 year old females are the most vulnerable to poverty, with 7 males (43.8%) and 6 females (42.9%) in their respective age groups living below the poverty level.
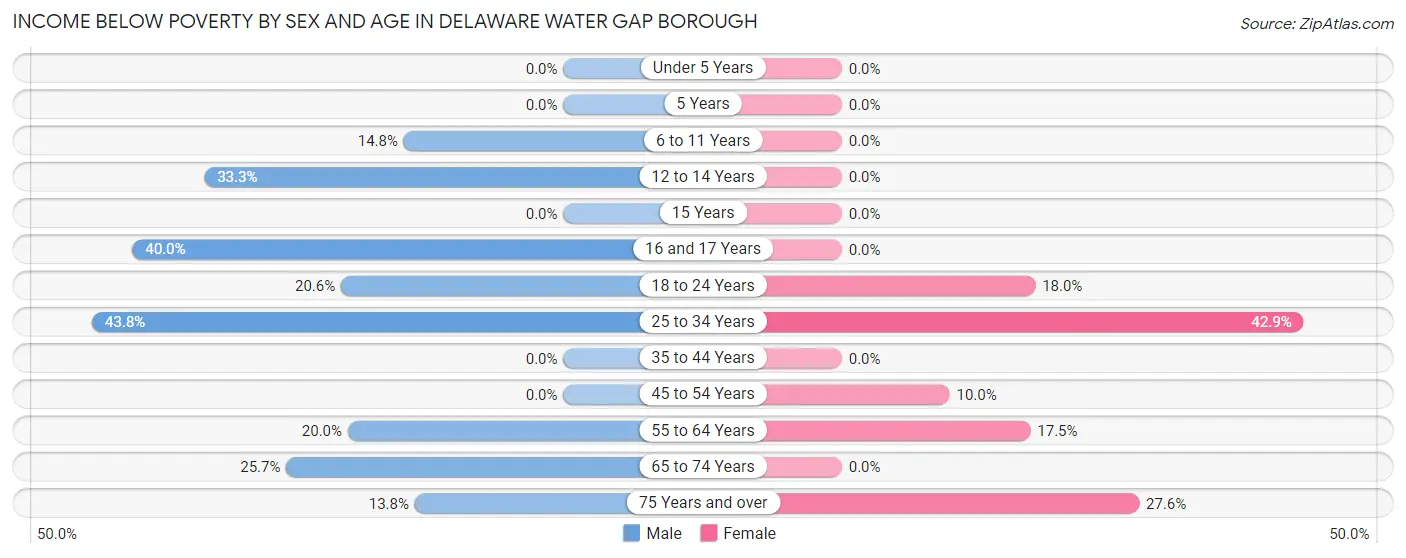
| Age Bracket | Male | Female |
| Under 5 Years | 0 (0.0%) | 0 (0.0%) |
| 5 Years | 0 (0.0%) | 0 (0.0%) |
| 6 to 11 Years | 4 (14.8%) | 0 (0.0%) |
| 12 to 14 Years | 3 (33.3%) | 0 (0.0%) |
| 15 Years | 0 (0.0%) | 0 (0.0%) |
| 16 and 17 Years | 2 (40.0%) | 0 (0.0%) |
| 18 to 24 Years | 13 (20.6%) | 7 (17.9%) |
| 25 to 34 Years | 7 (43.8%) | 6 (42.9%) |
| 35 to 44 Years | 0 (0.0%) | 0 (0.0%) |
| 45 to 54 Years | 0 (0.0%) | 4 (10.0%) |
| 55 to 64 Years | 12 (20.0%) | 14 (17.5%) |
| 65 to 74 Years | 9 (25.7%) | 0 (0.0%) |
| 75 Years and over | 4 (13.8%) | 8 (27.6%) |
| Total | 54 (15.1%) | 39 (13.2%) |
Income Above Poverty by Sex and Age in Delaware Water Gap borough
According to the poverty statistics in Delaware Water Gap borough, males aged 15 years and females aged under 5 years are the age groups that are most secure financially, with 100.0% of males and 100.0% of females in these age groups living above the poverty line.
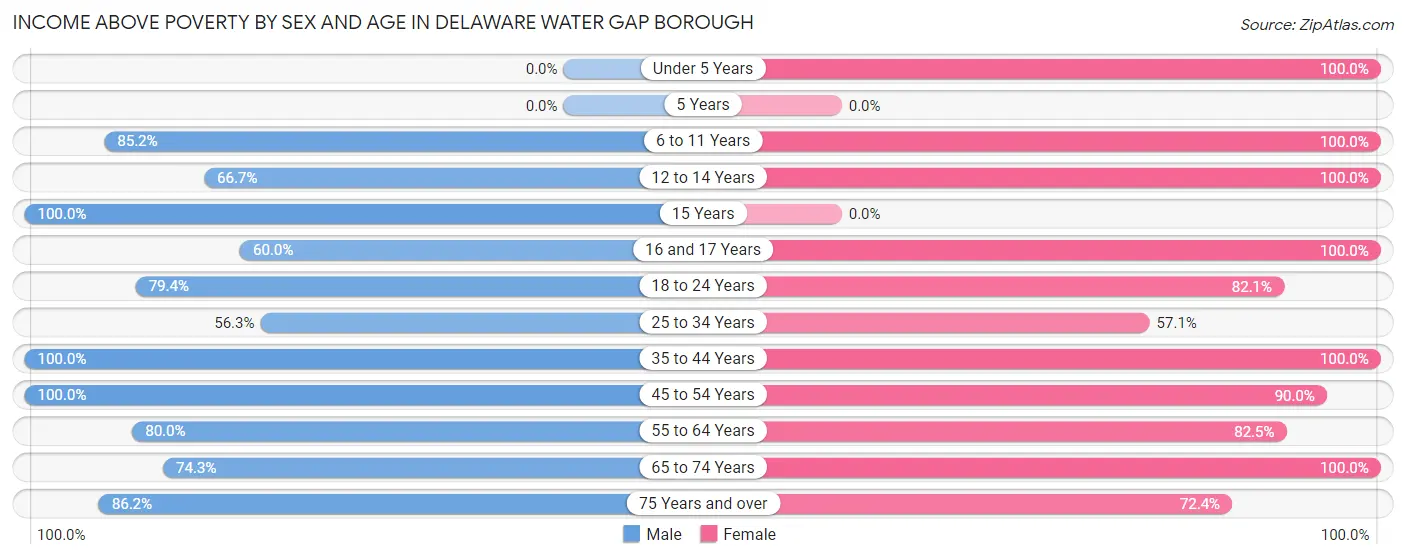
| Age Bracket | Male | Female |
| Under 5 Years | 0 (0.0%) | 10 (100.0%) |
| 5 Years | 0 (0.0%) | 0 (0.0%) |
| 6 to 11 Years | 23 (85.2%) | 5 (100.0%) |
| 12 to 14 Years | 6 (66.7%) | 5 (100.0%) |
| 15 Years | 3 (100.0%) | 0 (0.0%) |
| 16 and 17 Years | 3 (60.0%) | 13 (100.0%) |
| 18 to 24 Years | 50 (79.4%) | 32 (82.1%) |
| 25 to 34 Years | 9 (56.2%) | 8 (57.1%) |
| 35 to 44 Years | 38 (100.0%) | 30 (100.0%) |
| 45 to 54 Years | 72 (100.0%) | 36 (90.0%) |
| 55 to 64 Years | 48 (80.0%) | 66 (82.5%) |
| 65 to 74 Years | 26 (74.3%) | 30 (100.0%) |
| 75 Years and over | 25 (86.2%) | 21 (72.4%) |
| Total | 303 (84.9%) | 256 (86.8%) |
Income Below Poverty Among Married-Couple Families in Delaware Water Gap borough
The poverty statistics for married-couple families in Delaware Water Gap borough show that 6.4% or 7 of the total 109 families live below the poverty line. Families with no children have the highest poverty rate of 8.9%, comprising of 7 families. On the other hand, families with 1 or 2 children have the lowest poverty rate of 0.0%, which includes 0 families.
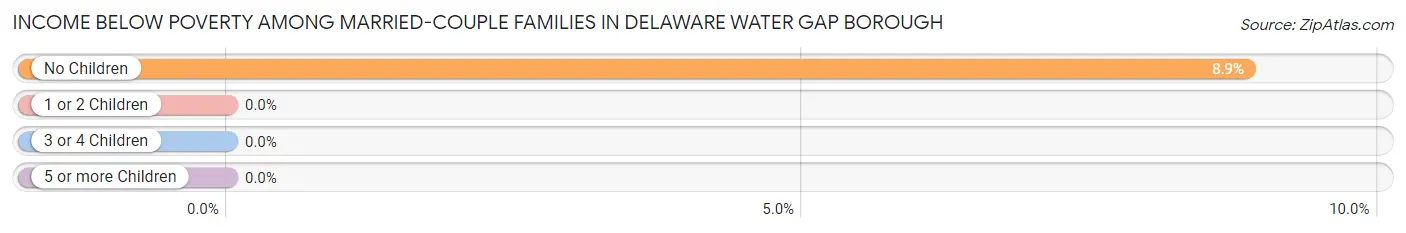
| Children | Above Poverty | Below Poverty |
| No Children | 72 (91.1%) | 7 (8.9%) |
| 1 or 2 Children | 30 (100.0%) | 0 (0.0%) |
| 3 or 4 Children | 0 (0.0%) | 0 (0.0%) |
| 5 or more Children | 0 (0.0%) | 0 (0.0%) |
| Total | 102 (93.6%) | 7 (6.4%) |
Income Below Poverty Among Single-Parent Households in Delaware Water Gap borough
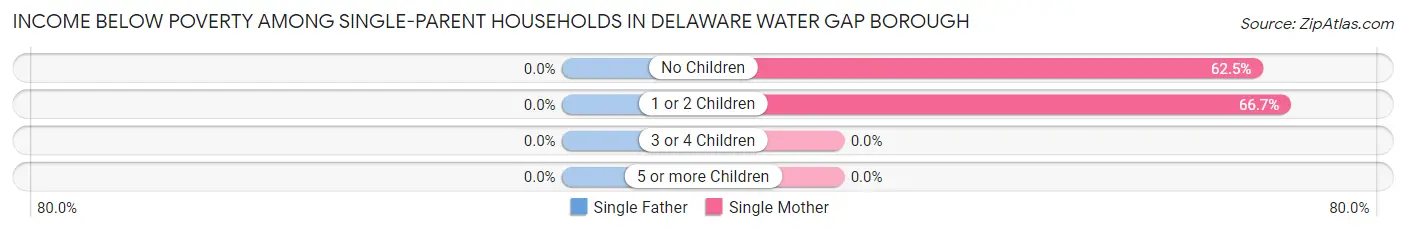
| Children | Single Father | Single Mother |
| No Children | 0 (0.0%) | 5 (62.5%) |
| 1 or 2 Children | 0 (0.0%) | 4 (66.7%) |
| 3 or 4 Children | 0 (0.0%) | 0 (0.0%) |
| 5 or more Children | 0 (0.0%) | 0 (0.0%) |
| Total | 0 (0.0%) | 9 (64.3%) |
Income Below Poverty Among Married-Couple vs Single-Parent Households in Delaware Water Gap borough
The poverty data for Delaware Water Gap borough shows that 7 of the married-couple family households (6.4%) and 9 of the single-parent households (34.6%) are living below the poverty level. Within the married-couple family households, those with no children have the highest poverty rate, with 7 households (8.9%) falling below the poverty line. Among the single-parent households, those with no children have the highest poverty rate, with 5 household (62.5%) living below poverty.
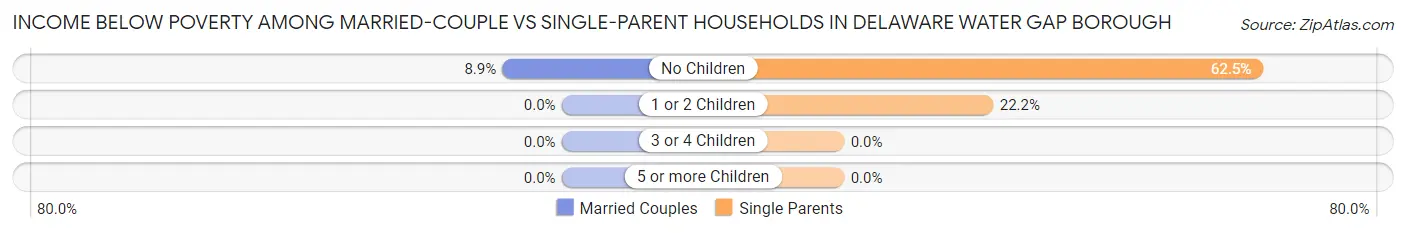
| Children | Married-Couple Families | Single-Parent Households |
| No Children | 7 (8.9%) | 5 (62.5%) |
| 1 or 2 Children | 0 (0.0%) | 4 (22.2%) |
| 3 or 4 Children | 0 (0.0%) | 0 (0.0%) |
| 5 or more Children | 0 (0.0%) | 0 (0.0%) |
| Total | 7 (6.4%) | 9 (34.6%) |
Race in Delaware Water Gap borough
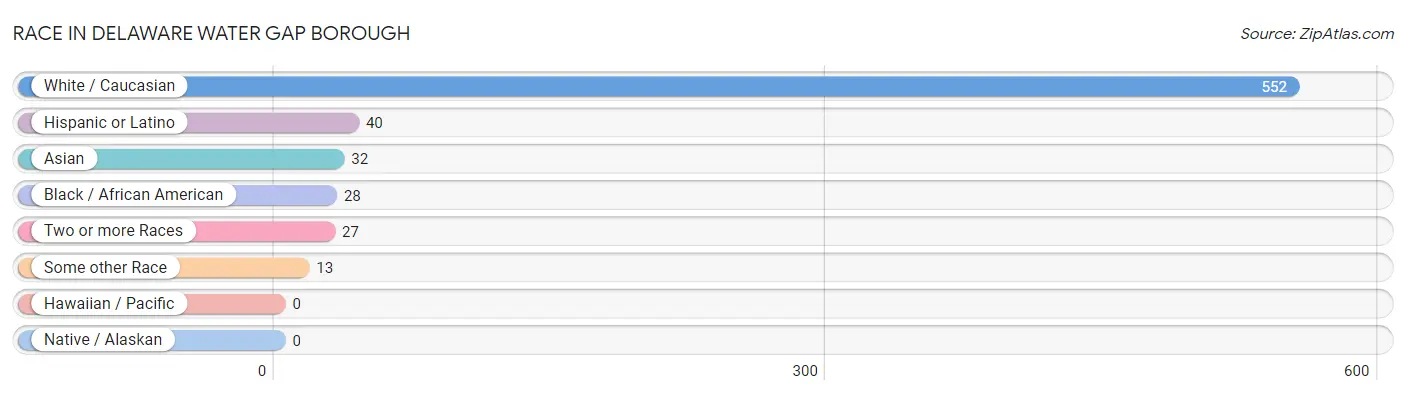
The most populous races in Delaware Water Gap borough are White / Caucasian (552 | 84.7%), Hispanic or Latino (40 | 6.1%), and Asian (32 | 4.9%).
| Race | # Population | % Population |
| Asian | 32 | 4.9% |
| Black / African American | 28 | 4.3% |
| Hawaiian / Pacific | 0 | 0.0% |
| Hispanic or Latino | 40 | 6.1% |
| Native / Alaskan | 0 | 0.0% |
| White / Caucasian | 552 | 84.7% |
| Two or more Races | 27 | 4.1% |
| Some other Race | 13 | 2.0% |
| Total | 652 | 100.0% |
Ancestry in Delaware Water Gap borough
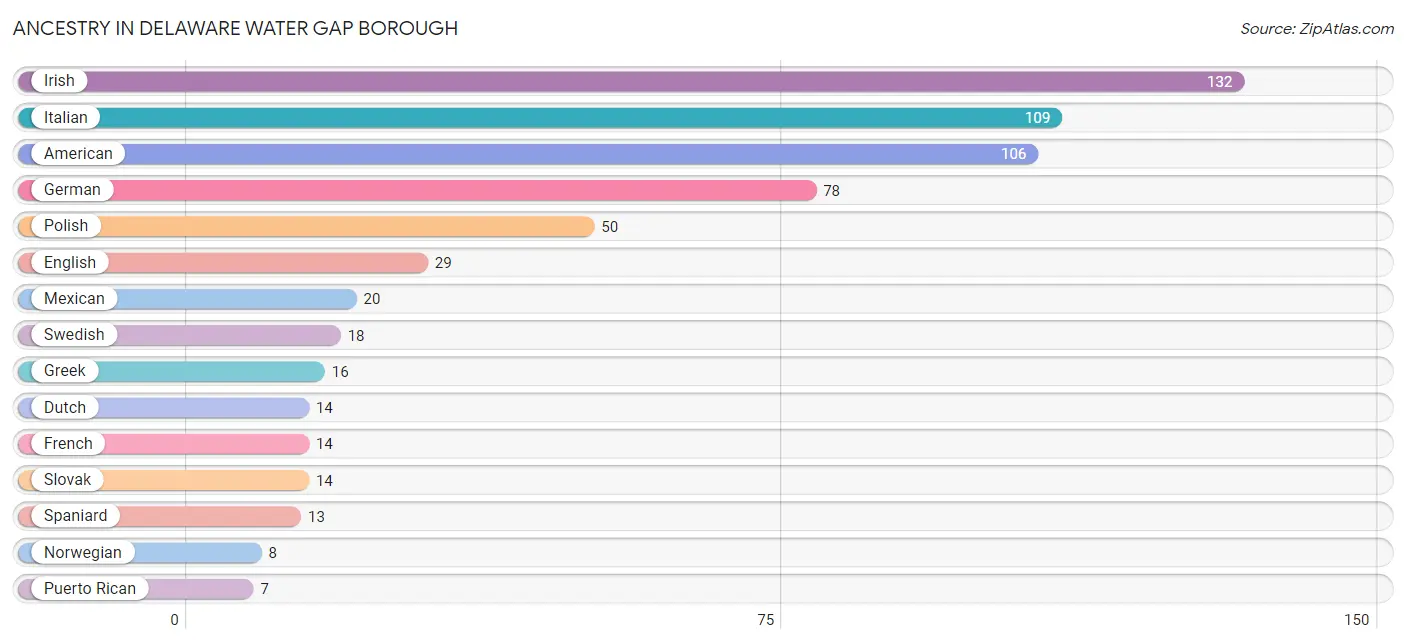
The most populous ancestries reported in Delaware Water Gap borough are Irish (132 | 20.3%), Italian (109 | 16.7%), American (106 | 16.3%), German (78 | 12.0%), and Polish (50 | 7.7%), together accounting for 72.9% of all Delaware Water Gap borough residents.
| Ancestry | # Population | % Population |
| American | 106 | 16.3% |
| Croatian | 4 | 0.6% |
| Czechoslovakian | 4 | 0.6% |
| Dutch | 14 | 2.1% |
| English | 29 | 4.4% |
| Finnish | 5 | 0.8% |
| French | 14 | 2.1% |
| German | 78 | 12.0% |
| Greek | 16 | 2.5% |
| Irish | 132 | 20.3% |
| Italian | 109 | 16.7% |
| Mexican | 20 | 3.1% |
| Norwegian | 8 | 1.2% |
| Pennsylvania German | 3 | 0.5% |
| Polish | 50 | 7.7% |
| Puerto Rican | 7 | 1.1% |
| Russian | 4 | 0.6% |
| Scandinavian | 5 | 0.8% |
| Slavic | 6 | 0.9% |
| Slovak | 14 | 2.1% |
| Spaniard | 13 | 2.0% |
| Swedish | 18 | 2.8% |
| Welsh | 5 | 0.8% | View All 23 Rows |
Immigrants in Delaware Water Gap borough
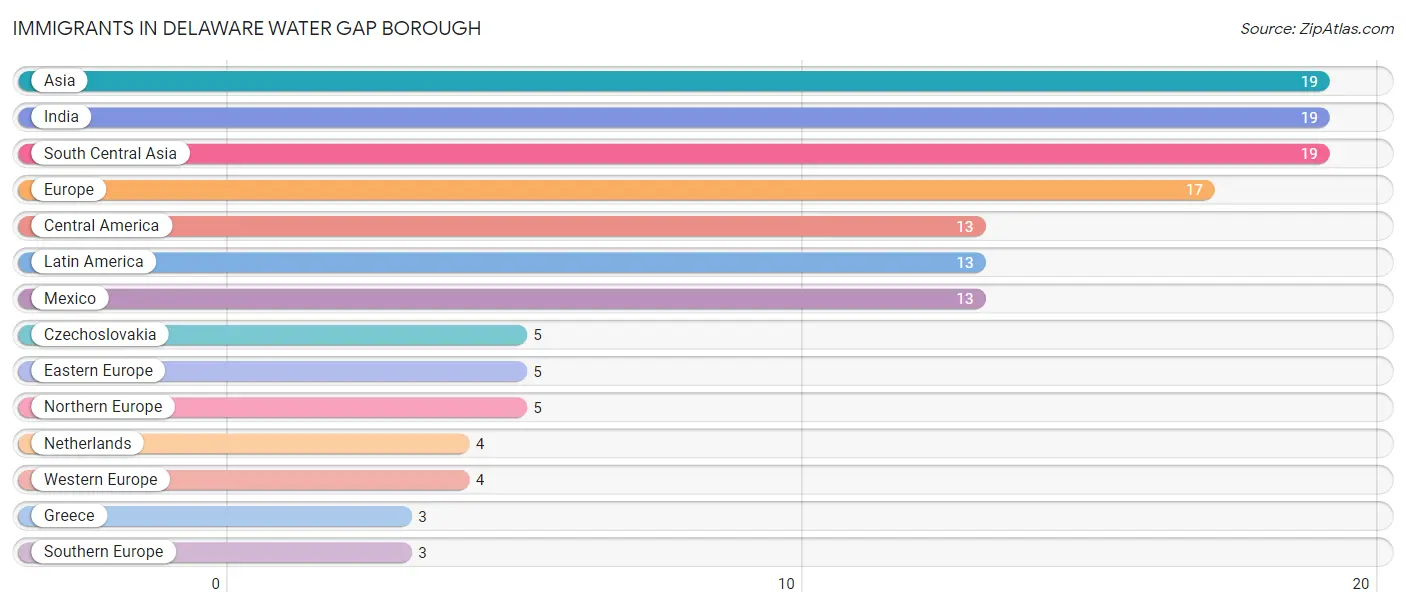
The most numerous immigrant groups reported in Delaware Water Gap borough came from Asia (19 | 2.9%), India (19 | 2.9%), South Central Asia (19 | 2.9%), Europe (17 | 2.6%), and Central America (13 | 2.0%), together accounting for 13.3% of all Delaware Water Gap borough residents.
| Immigration Origin | # Population | % Population |
| Asia | 19 | 2.9% |
| Central America | 13 | 2.0% |
| Czechoslovakia | 5 | 0.8% |
| Eastern Europe | 5 | 0.8% |
| Europe | 17 | 2.6% |
| Greece | 3 | 0.5% |
| India | 19 | 2.9% |
| Latin America | 13 | 2.0% |
| Mexico | 13 | 2.0% |
| Netherlands | 4 | 0.6% |
| Northern Europe | 5 | 0.8% |
| South Central Asia | 19 | 2.9% |
| Southern Europe | 3 | 0.5% |
| Western Europe | 4 | 0.6% | View All 14 Rows |
Sex and Age in Delaware Water Gap borough
Sex and Age in Delaware Water Gap borough
The most populous age groups in Delaware Water Gap borough are 45 to 49 Years (49 | 13.7%) for men and 15 to 19 Years (52 | 17.6%) for women.
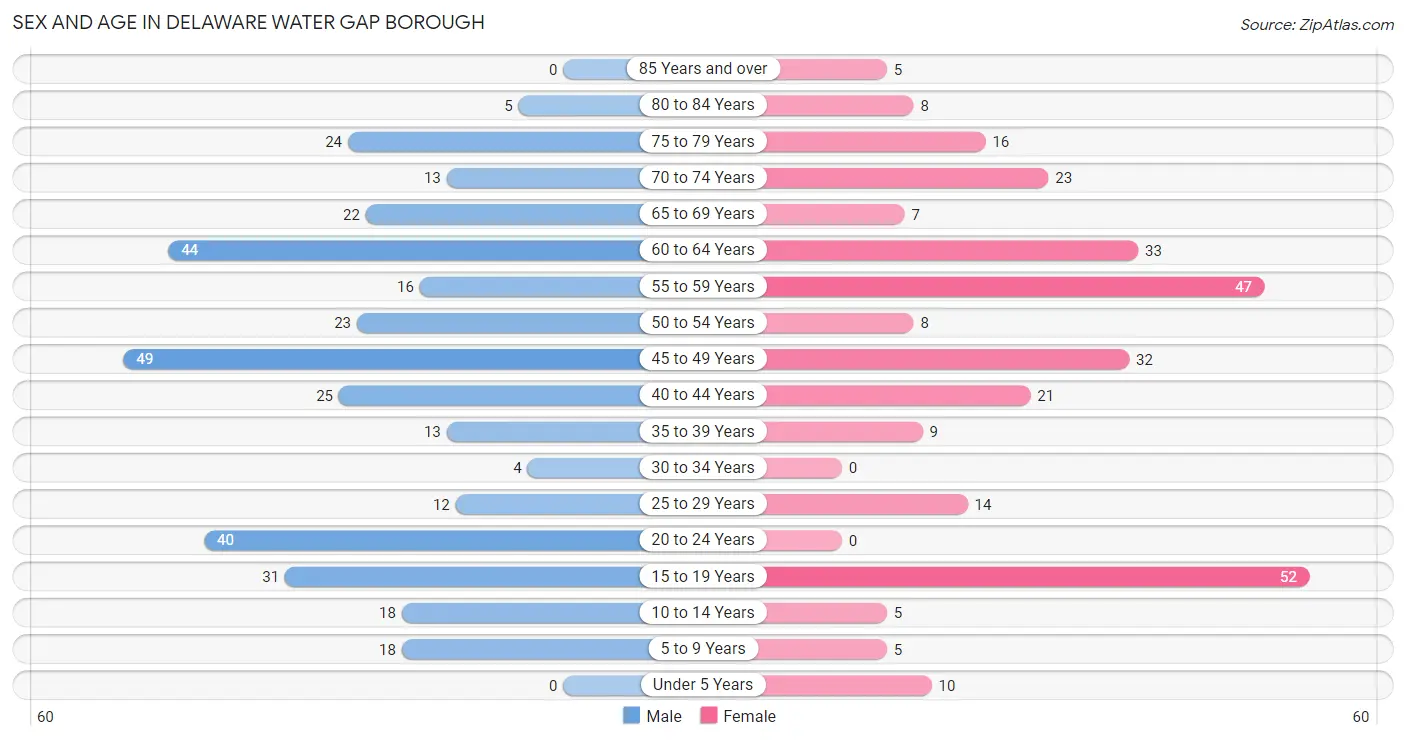
| Age Bracket | Male | Female |
| Under 5 Years | 0 (0.0%) | 10 (3.4%) |
| 5 to 9 Years | 18 (5.0%) | 5 (1.7%) |
| 10 to 14 Years | 18 (5.0%) | 5 (1.7%) |
| 15 to 19 Years | 31 (8.7%) | 52 (17.6%) |
| 20 to 24 Years | 40 (11.2%) | 0 (0.0%) |
| 25 to 29 Years | 12 (3.4%) | 14 (4.8%) |
| 30 to 34 Years | 4 (1.1%) | 0 (0.0%) |
| 35 to 39 Years | 13 (3.6%) | 9 (3.0%) |
| 40 to 44 Years | 25 (7.0%) | 21 (7.1%) |
| 45 to 49 Years | 49 (13.7%) | 32 (10.8%) |
| 50 to 54 Years | 23 (6.4%) | 8 (2.7%) |
| 55 to 59 Years | 16 (4.5%) | 47 (15.9%) |
| 60 to 64 Years | 44 (12.3%) | 33 (11.2%) |
| 65 to 69 Years | 22 (6.2%) | 7 (2.4%) |
| 70 to 74 Years | 13 (3.6%) | 23 (7.8%) |
| 75 to 79 Years | 24 (6.7%) | 16 (5.4%) |
| 80 to 84 Years | 5 (1.4%) | 8 (2.7%) |
| 85 Years and over | 0 (0.0%) | 5 (1.7%) |
| Total | 357 (100.0%) | 295 (100.0%) |
Families and Households in Delaware Water Gap borough
Median Family Size in Delaware Water Gap borough
The median family size in Delaware Water Gap borough is 3.21 persons per family, with married-couple families (109 | 80.7%) accounting for the largest median family size of 3.28 persons per family. On the other hand, single male/father families (12 | 8.9%) represent the smallest median family size with 2.75 persons per family.
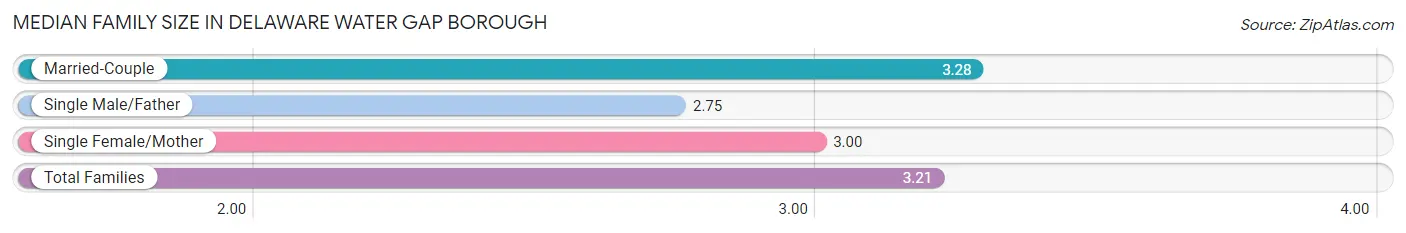
| Family Type | # Families | Family Size |
| Married-Couple | 109 (80.7%) | 3.28 |
| Single Male/Father | 12 (8.9%) | 2.75 |
| Single Female/Mother | 14 (10.4%) | 3.00 |
| Total Families | 135 (100.0%) | 3.21 |
Median Household Size in Delaware Water Gap borough
The median household size in Delaware Water Gap borough is 2.06 persons per household, with married-couple households (109 | 34.5%) accounting for the largest median household size of 3.35 persons per household. non-family households (181 | 57.3%) represent the smallest median household size with 1.17 persons per household.
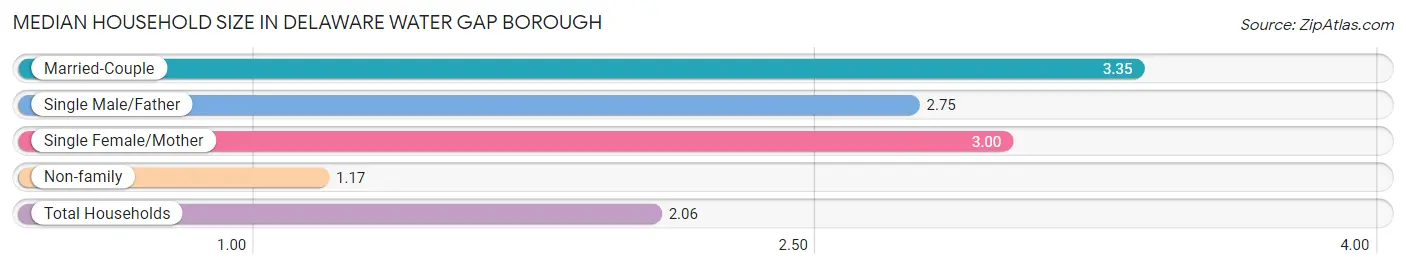
| Household Type | # Households | Household Size |
| Married-Couple | 109 (34.5%) | 3.35 |
| Single Male/Father | 12 (3.8%) | 2.75 |
| Single Female/Mother | 14 (4.4%) | 3.00 |
| Non-family | 181 (57.3%) | 1.17 |
| Total Households | 316 (100.0%) | 2.06 |
Household Size by Marriage Status in Delaware Water Gap borough
Out of a total of 316 households in Delaware Water Gap borough, 135 (42.7%) are family households, while 181 (57.3%) are nonfamily households. The most numerous type of family households are 2-person households, comprising 69, and the most common type of nonfamily households are 1-person households, comprising 144.
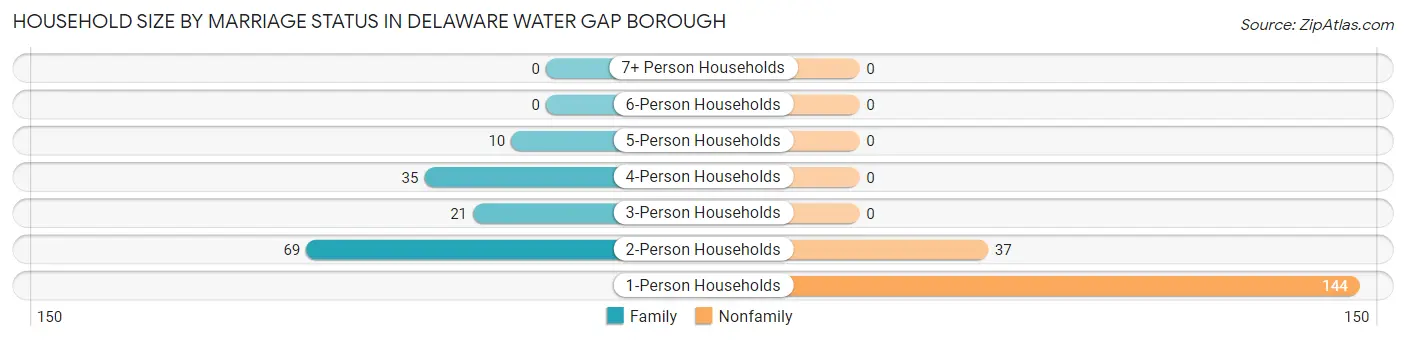
| Household Size | Family Households | Nonfamily Households |
| 1-Person Households | - | 144 (45.6%) |
| 2-Person Households | 69 (21.8%) | 37 (11.7%) |
| 3-Person Households | 21 (6.7%) | 0 (0.0%) |
| 4-Person Households | 35 (11.1%) | 0 (0.0%) |
| 5-Person Households | 10 (3.2%) | 0 (0.0%) |
| 6-Person Households | 0 (0.0%) | 0 (0.0%) |
| 7+ Person Households | 0 (0.0%) | 0 (0.0%) |
| Total | 135 (42.7%) | 181 (57.3%) |
Female Fertility in Delaware Water Gap borough
Fertility by Age in Delaware Water Gap borough
| Age Bracket | Women with Births | Births / 1,000 Women |
| 15 to 19 years | 0 (0.0%) | 0.0 |
| 20 to 34 years | 0 (0.0%) | 0.0 |
| 35 to 50 years | 0 (0.0%) | 0.0 |
| Total | 0 (0.0%) | 0.0 |
Fertility by Age by Marriage Status in Delaware Water Gap borough
| Age Bracket | Married | Unmarried |
| 15 to 19 years | 0 (0.0%) | 0 (0.0%) |
| 20 to 34 years | 0 (0.0%) | 0 (0.0%) |
| 35 to 50 years | 0 (0.0%) | 0 (0.0%) |
| Total | 0 (0.0%) | 0 (0.0%) |
Fertility by Education in Delaware Water Gap borough
| Educational Attainment | Women with Births | Births / 1,000 Women |
| Less than High School | 0 (0.0%) | 0.0 |
| High School Diploma | 0 (0.0%) | 0.0 |
| College or Associate's Degree | 0 (0.0%) | 0.0 |
| Bachelor's Degree | 0 (0.0%) | 0.0 |
| Graduate Degree | 0 (0.0%) | 0.0 |
| Total | 0 (0.0%) | 0.0 |
Fertility by Education by Marriage Status in Delaware Water Gap borough
| Educational Attainment | Married | Unmarried |
| Less than High School | 0 (0.0%) | 0 (0.0%) |
| High School Diploma | 0 (0.0%) | 0 (0.0%) |
| College or Associate's Degree | 0 (0.0%) | 0 (0.0%) |
| Bachelor's Degree | 0 (0.0%) | 0 (0.0%) |
| Graduate Degree | 0 (0.0%) | 0 (0.0%) |
| Total | 0 (0.0%) | 0 (0.0%) |
Employment Characteristics in Delaware Water Gap borough
Employment by Class of Employer in Delaware Water Gap borough
Among the 350 employed individuals in Delaware Water Gap borough, private company employees (270 | 77.1%), self-employed (not incorporated) (36 | 10.3%), and not-for-profit organizations (18 | 5.1%) make up the most common classes of employment.
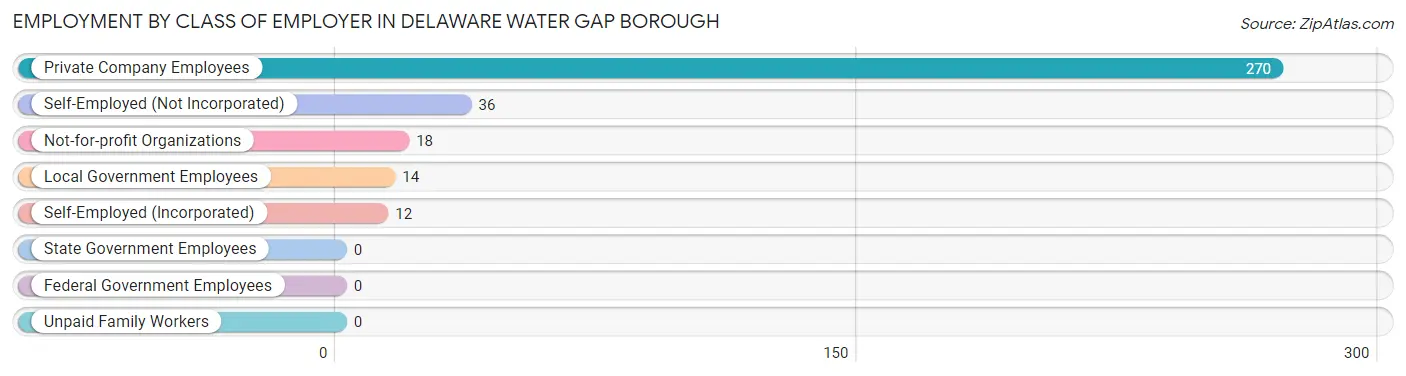
| Employer Class | # Employees | % Employees |
| Private Company Employees | 270 | 77.1% |
| Self-Employed (Incorporated) | 12 | 3.4% |
| Self-Employed (Not Incorporated) | 36 | 10.3% |
| Not-for-profit Organizations | 18 | 5.1% |
| Local Government Employees | 14 | 4.0% |
| State Government Employees | 0 | 0.0% |
| Federal Government Employees | 0 | 0.0% |
| Unpaid Family Workers | 0 | 0.0% |
| Total | 350 | 100.0% |
Employment Status by Age in Delaware Water Gap borough
According to the labor force statistics for Delaware Water Gap borough, out of the total population over 16 years of age (593), 62.9% or 373 individuals are in the labor force, with 6.2% or 23 of them unemployed. The age group with the highest labor force participation rate is 25 to 29 years, with 100.0% or 26 individuals in the labor force. Within the labor force, the 25 to 29 years age range has the highest percentage of unemployed individuals, with 26.9% or 7 of them being unemployed.
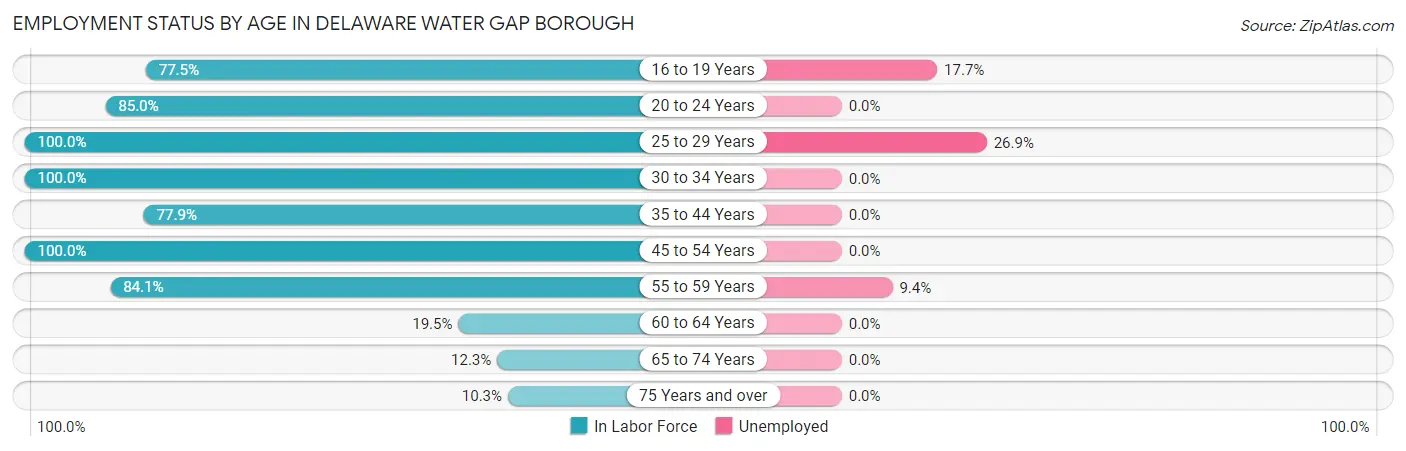
| Age Bracket | In Labor Force | Unemployed |
| 16 to 19 Years | 62 (77.5%) | 11 (17.7%) |
| 20 to 24 Years | 34 (85.0%) | 0 (0.0%) |
| 25 to 29 Years | 26 (100.0%) | 7 (26.9%) |
| 30 to 34 Years | 4 (100.0%) | 0 (0.0%) |
| 35 to 44 Years | 53 (77.9%) | 0 (0.0%) |
| 45 to 54 Years | 112 (100.0%) | 0 (0.0%) |
| 55 to 59 Years | 53 (84.1%) | 5 (9.4%) |
| 60 to 64 Years | 15 (19.5%) | 0 (0.0%) |
| 65 to 74 Years | 8 (12.3%) | 0 (0.0%) |
| 75 Years and over | 6 (10.3%) | 0 (0.0%) |
| Total | 373 (62.9%) | 23 (6.2%) |
Employment Status by Educational Attainment in Delaware Water Gap borough
According to labor force statistics for Delaware Water Gap borough, 75.1% of individuals (263) out of the total population between 25 and 64 years of age (350) are in the labor force, with 4.6% or 12 of them being unemployed. The group with the highest labor force participation rate are those with the educational attainment of less than high school, with 100.0% or 4 individuals in the labor force. Within the labor force, individuals with high school diploma education have the highest percentage of unemployment, with 11.7% or 7 of them being unemployed.
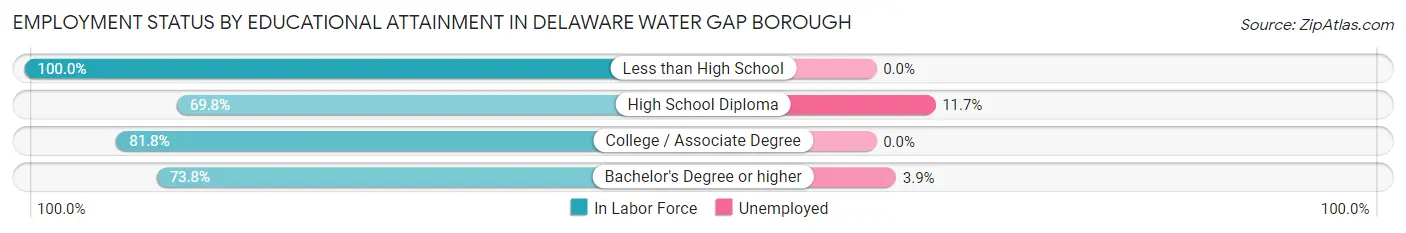
| Educational Attainment | In Labor Force | Unemployed |
| Less than High School | 4 (100.0%) | 0 (0.0%) |
| High School Diploma | 60 (69.8%) | 10 (11.7%) |
| College / Associate Degree | 72 (81.8%) | 0 (0.0%) |
| Bachelor's Degree or higher | 127 (73.8%) | 7 (3.9%) |
| Total | 263 (75.1%) | 16 (4.6%) |
Employment Occupations by Sex in Delaware Water Gap borough
Management, Business, Science and Arts Occupations
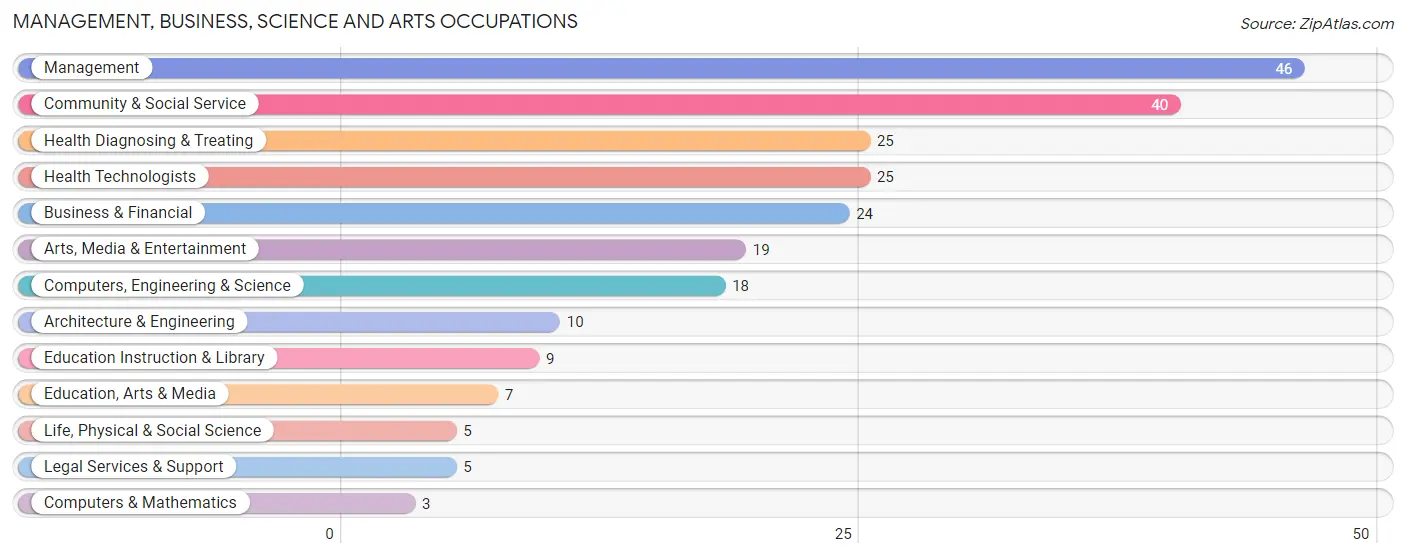
The most common Management, Business, Science and Arts occupations in Delaware Water Gap borough are Management (46 | 13.1%), Community & Social Service (40 | 11.4%), Health Diagnosing & Treating (25 | 7.1%), Health Technologists (25 | 7.1%), and Business & Financial (24 | 6.9%).
Management, Business, Science and Arts Occupations by Sex
Within the Management, Business, Science and Arts occupations in Delaware Water Gap borough, the most male-oriented occupations are Architecture & Engineering (100.0%), Legal Services & Support (100.0%), and Management (73.9%), while the most female-oriented occupations are Computers & Mathematics (100.0%), Life, Physical & Social Science (100.0%), and Education, Arts & Media (100.0%).
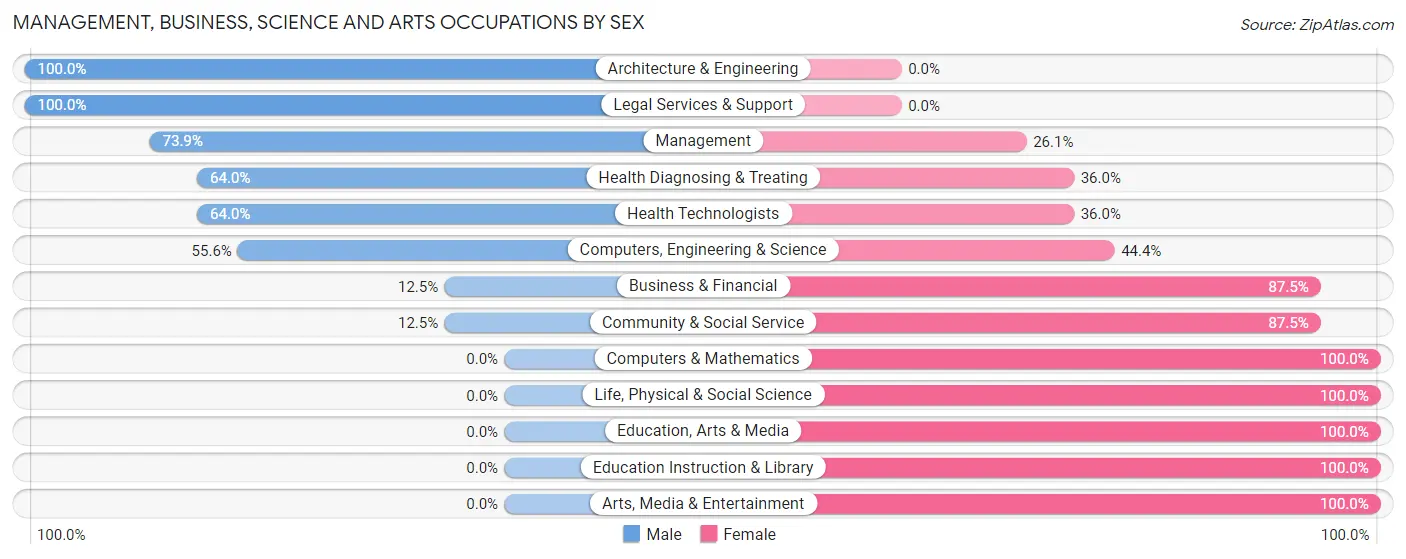
| Occupation | Male | Female |
| Management | 34 (73.9%) | 12 (26.1%) |
| Business & Financial | 3 (12.5%) | 21 (87.5%) |
| Computers, Engineering & Science | 10 (55.6%) | 8 (44.4%) |
| Computers & Mathematics | 0 (0.0%) | 3 (100.0%) |
| Architecture & Engineering | 10 (100.0%) | 0 (0.0%) |
| Life, Physical & Social Science | 0 (0.0%) | 5 (100.0%) |
| Community & Social Service | 5 (12.5%) | 35 (87.5%) |
| Education, Arts & Media | 0 (0.0%) | 7 (100.0%) |
| Legal Services & Support | 5 (100.0%) | 0 (0.0%) |
| Education Instruction & Library | 0 (0.0%) | 9 (100.0%) |
| Arts, Media & Entertainment | 0 (0.0%) | 19 (100.0%) |
| Health Diagnosing & Treating | 16 (64.0%) | 9 (36.0%) |
| Health Technologists | 16 (64.0%) | 9 (36.0%) |
| Total (Category) | 68 (44.4%) | 85 (55.6%) |
| Total (Overall) | 191 (54.6%) | 159 (45.4%) |
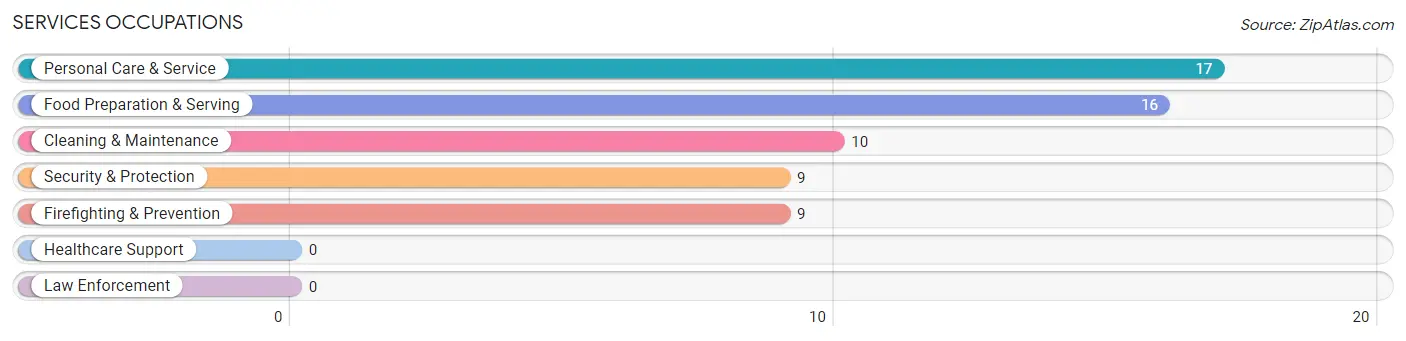
Services Occupations
The most common Services occupations in Delaware Water Gap borough are Personal Care & Service (17 | 4.9%), Food Preparation & Serving (16 | 4.6%), Cleaning & Maintenance (10 | 2.9%), Security & Protection (9 | 2.6%), and Firefighting & Prevention (9 | 2.6%).
Services Occupations by Sex
Within the Services occupations in Delaware Water Gap borough, the most male-oriented occupations are Security & Protection (100.0%), Firefighting & Prevention (100.0%), and Cleaning & Maintenance (100.0%), while the most female-oriented occupations are Personal Care & Service (64.7%), and Food Preparation & Serving (37.5%).
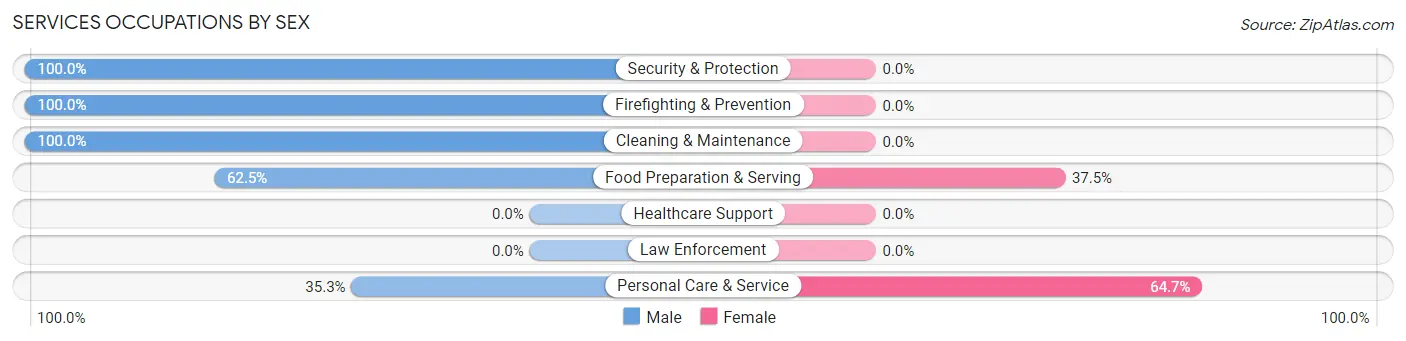
| Occupation | Male | Female |
| Healthcare Support | 0 (0.0%) | 0 (0.0%) |
| Security & Protection | 9 (100.0%) | 0 (0.0%) |
| Firefighting & Prevention | 9 (100.0%) | 0 (0.0%) |
| Law Enforcement | 0 (0.0%) | 0 (0.0%) |
| Food Preparation & Serving | 10 (62.5%) | 6 (37.5%) |
| Cleaning & Maintenance | 10 (100.0%) | 0 (0.0%) |
| Personal Care & Service | 6 (35.3%) | 11 (64.7%) |
| Total (Category) | 35 (67.3%) | 17 (32.7%) |
| Total (Overall) | 191 (54.6%) | 159 (45.4%) |
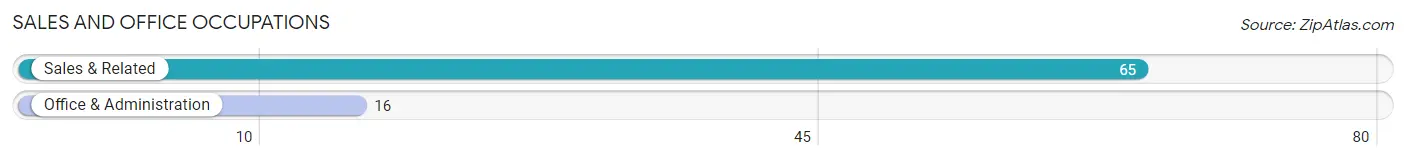
Sales and Office Occupations
The most common Sales and Office occupations in Delaware Water Gap borough are Sales & Related (65 | 18.6%), and Office & Administration (16 | 4.6%).
Sales and Office Occupations by Sex
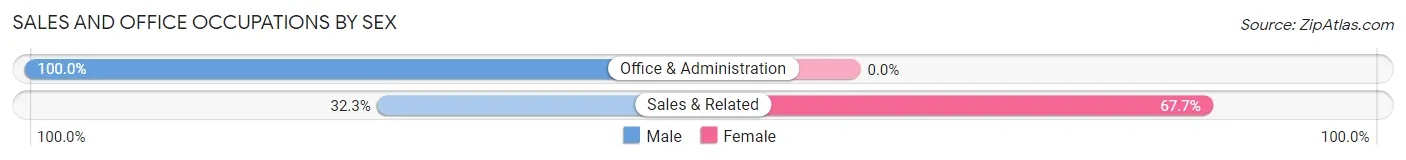
| Occupation | Male | Female |
| Sales & Related | 21 (32.3%) | 44 (67.7%) |
| Office & Administration | 16 (100.0%) | 0 (0.0%) |
| Total (Category) | 37 (45.7%) | 44 (54.3%) |
| Total (Overall) | 191 (54.6%) | 159 (45.4%) |
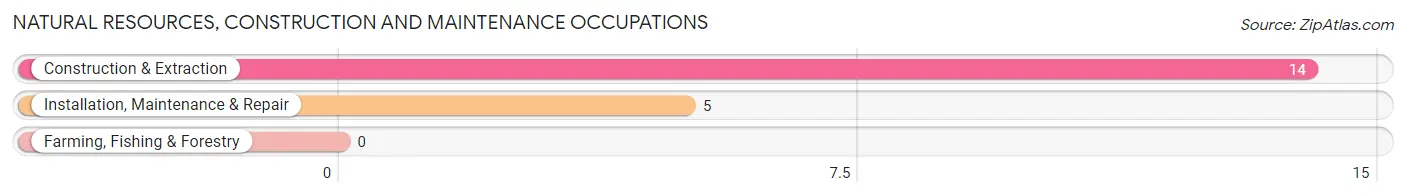
Natural Resources, Construction and Maintenance Occupations
The most common Natural Resources, Construction and Maintenance occupations in Delaware Water Gap borough are Construction & Extraction (14 | 4.0%), and Installation, Maintenance & Repair (5 | 1.4%).
Natural Resources, Construction and Maintenance Occupations by Sex
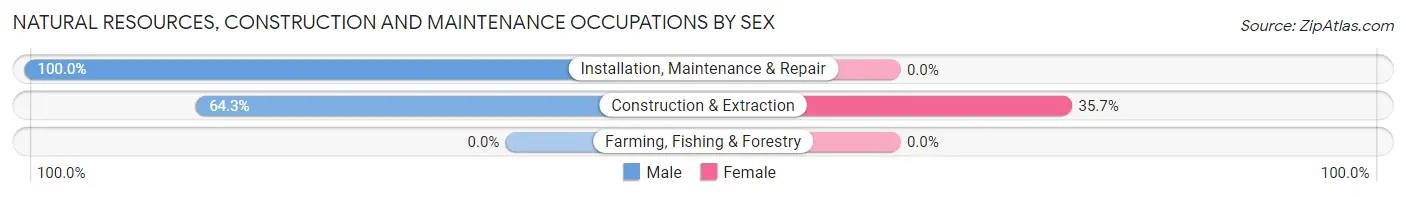
| Occupation | Male | Female |
| Farming, Fishing & Forestry | 0 (0.0%) | 0 (0.0%) |
| Construction & Extraction | 9 (64.3%) | 5 (35.7%) |
| Installation, Maintenance & Repair | 5 (100.0%) | 0 (0.0%) |
| Total (Category) | 14 (73.7%) | 5 (26.3%) |
| Total (Overall) | 191 (54.6%) | 159 (45.4%) |
Production, Transportation and Moving Occupations
The most common Production, Transportation and Moving occupations in Delaware Water Gap borough are Material Moving (29 | 8.3%), Production (10 | 2.9%), and Transportation (6 | 1.7%).
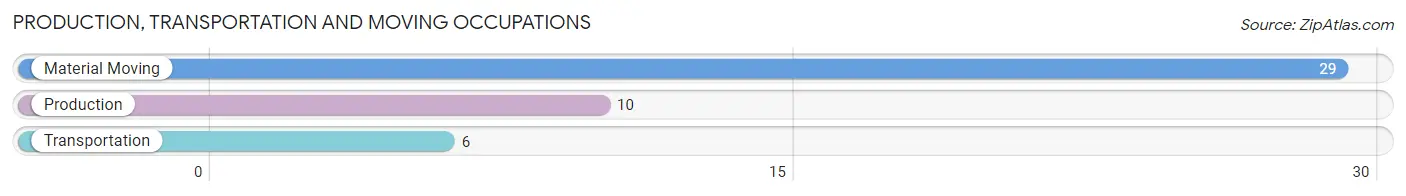
Production, Transportation and Moving Occupations by Sex
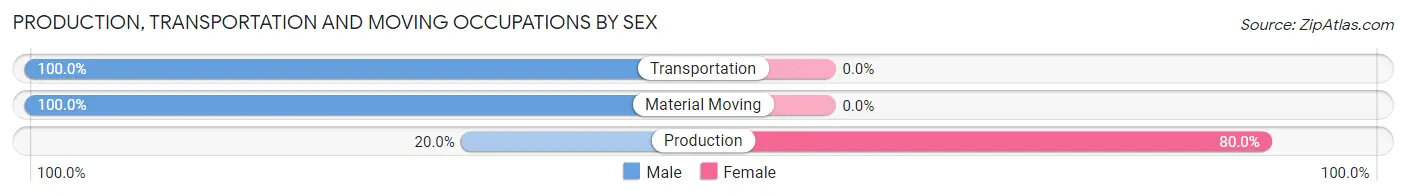
| Occupation | Male | Female |
| Production | 2 (20.0%) | 8 (80.0%) |
| Transportation | 6 (100.0%) | 0 (0.0%) |
| Material Moving | 29 (100.0%) | 0 (0.0%) |
| Total (Category) | 37 (82.2%) | 8 (17.8%) |
| Total (Overall) | 191 (54.6%) | 159 (45.4%) |
Employment Industries by Sex in Delaware Water Gap borough
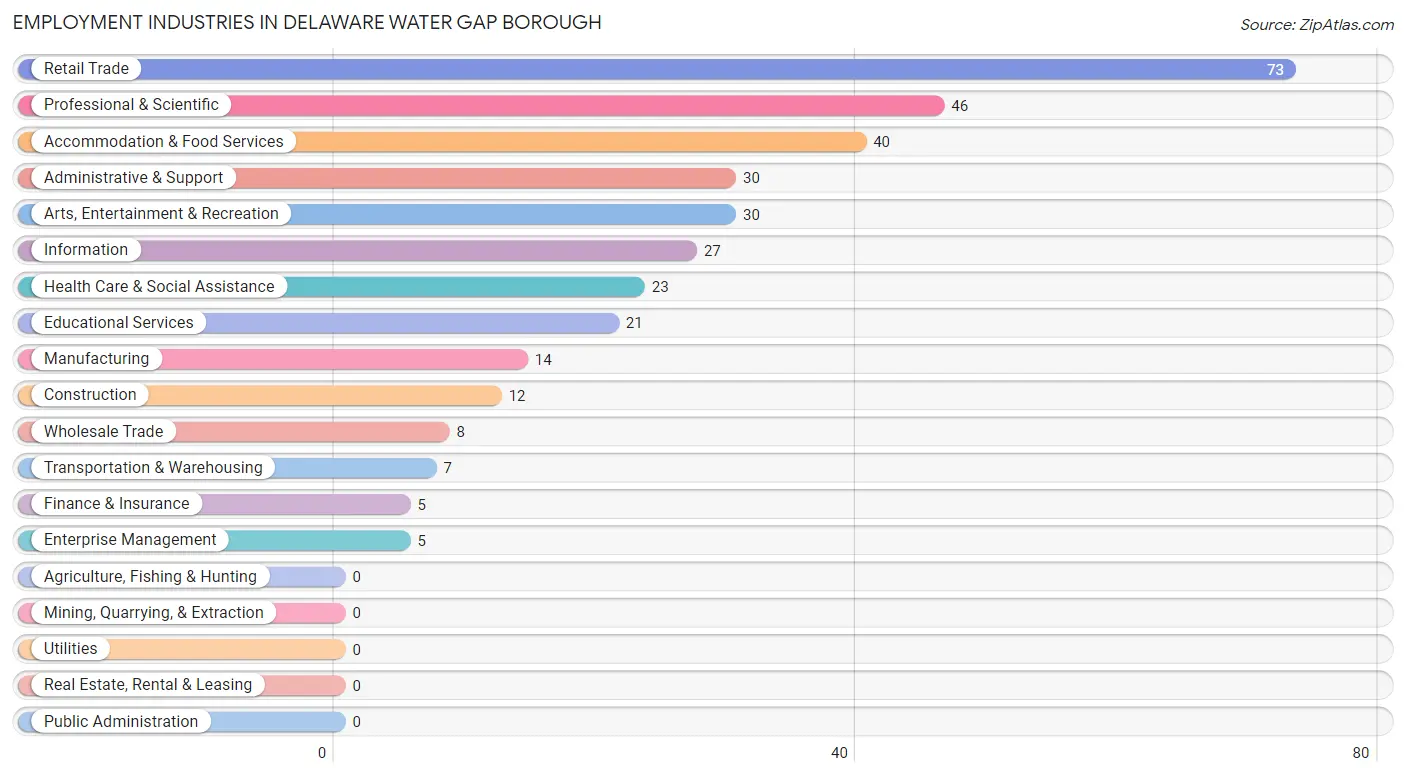
Employment Industries in Delaware Water Gap borough
The major employment industries in Delaware Water Gap borough include Retail Trade (73 | 20.9%), Professional & Scientific (46 | 13.1%), Accommodation & Food Services (40 | 11.4%), Administrative & Support (30 | 8.6%), and Arts, Entertainment & Recreation (30 | 8.6%).
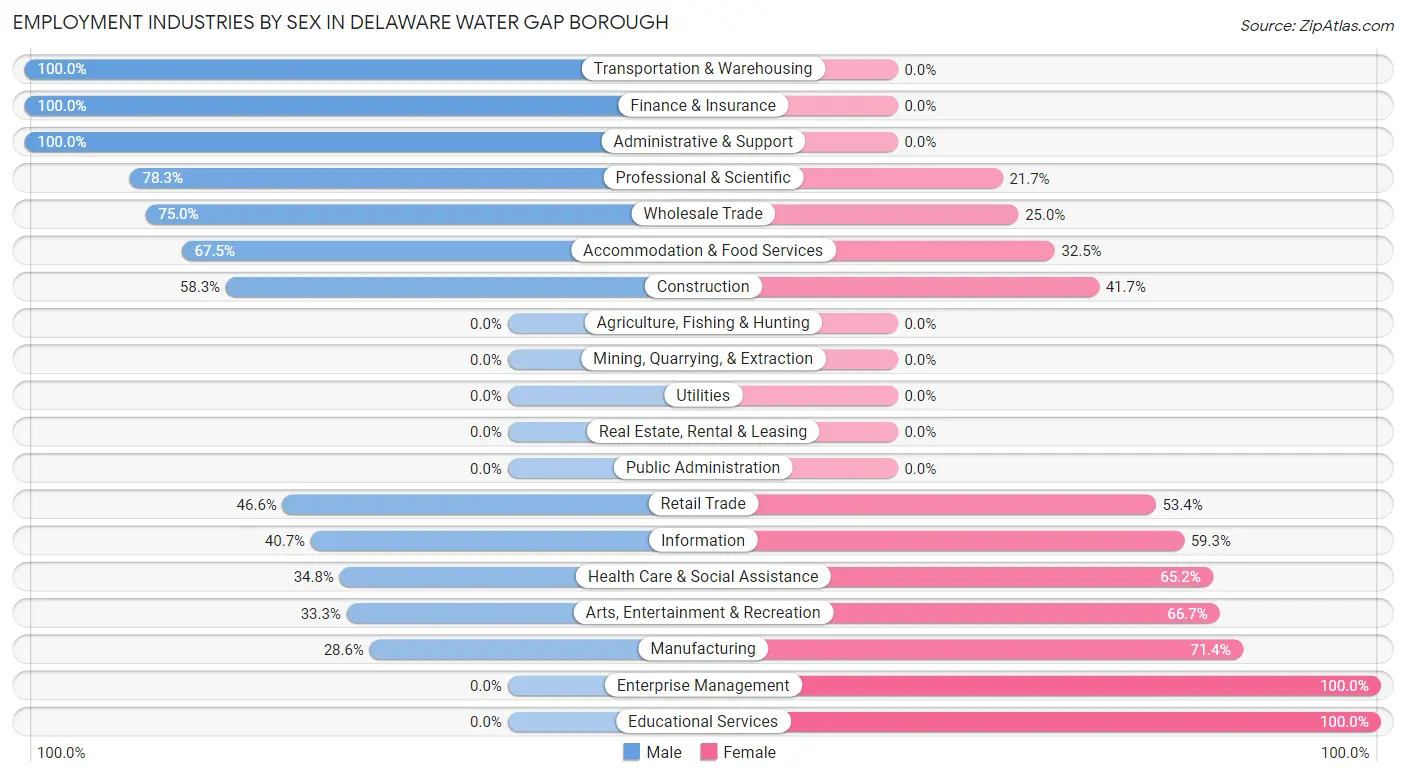
Employment Industries by Sex in Delaware Water Gap borough
The Delaware Water Gap borough industries that see more men than women are Transportation & Warehousing (100.0%), Finance & Insurance (100.0%), and Administrative & Support (100.0%), whereas the industries that tend to have a higher number of women are Enterprise Management (100.0%), Educational Services (100.0%), and Manufacturing (71.4%).
| Industry | Male | Female |
| Agriculture, Fishing & Hunting | 0 (0.0%) | 0 (0.0%) |
| Mining, Quarrying, & Extraction | 0 (0.0%) | 0 (0.0%) |
| Construction | 7 (58.3%) | 5 (41.7%) |
| Manufacturing | 4 (28.6%) | 10 (71.4%) |
| Wholesale Trade | 6 (75.0%) | 2 (25.0%) |
| Retail Trade | 34 (46.6%) | 39 (53.4%) |
| Transportation & Warehousing | 7 (100.0%) | 0 (0.0%) |
| Utilities | 0 (0.0%) | 0 (0.0%) |
| Information | 11 (40.7%) | 16 (59.3%) |
| Finance & Insurance | 5 (100.0%) | 0 (0.0%) |
| Real Estate, Rental & Leasing | 0 (0.0%) | 0 (0.0%) |
| Professional & Scientific | 36 (78.3%) | 10 (21.7%) |
| Enterprise Management | 0 (0.0%) | 5 (100.0%) |
| Administrative & Support | 30 (100.0%) | 0 (0.0%) |
| Educational Services | 0 (0.0%) | 21 (100.0%) |
| Health Care & Social Assistance | 8 (34.8%) | 15 (65.2%) |
| Arts, Entertainment & Recreation | 10 (33.3%) | 20 (66.7%) |
| Accommodation & Food Services | 27 (67.5%) | 13 (32.5%) |
| Public Administration | 0 (0.0%) | 0 (0.0%) |
| Total | 191 (54.6%) | 159 (45.4%) |
Education in Delaware Water Gap borough
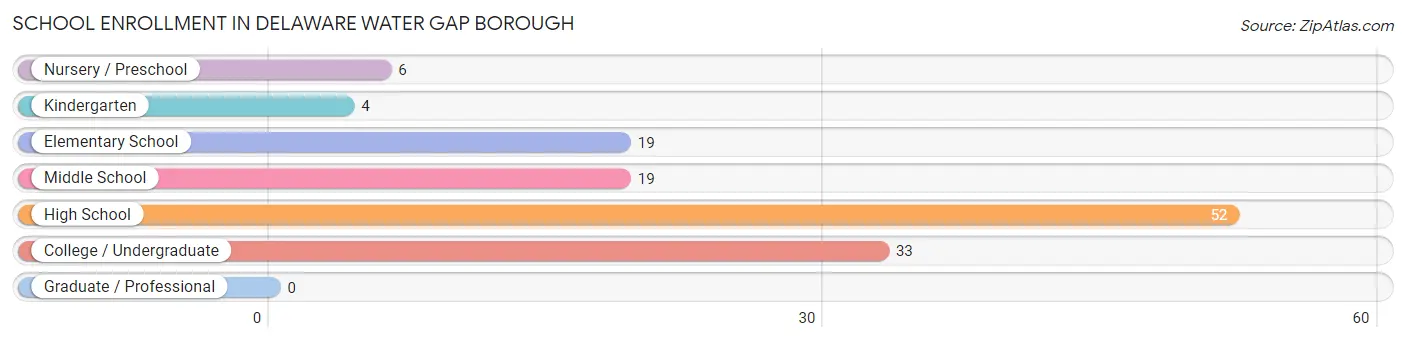
School Enrollment in Delaware Water Gap borough
The most common levels of schooling among the 133 students in Delaware Water Gap borough are high school (52 | 39.1%), college / undergraduate (33 | 24.8%), and elementary school (19 | 14.3%).
| School Level | # Students | % Students |
| Nursery / Preschool | 6 | 4.5% |
| Kindergarten | 4 | 3.0% |
| Elementary School | 19 | 14.3% |
| Middle School | 19 | 14.3% |
| High School | 52 | 39.1% |
| College / Undergraduate | 33 | 24.8% |
| Graduate / Professional | 0 | 0.0% |
| Total | 133 | 100.0% |
School Enrollment by Age by Funding Source in Delaware Water Gap borough
Out of a total of 133 students who are enrolled in schools in Delaware Water Gap borough, 5 (3.8%) attend a private institution, while the remaining 128 (96.2%) are enrolled in public schools. The age group of 5 to 9 year old has the highest likelihood of being enrolled in private schools, with 5 (21.7% in the age bracket) enrolled. Conversely, the age group of 3 to 4 year olds has the lowest likelihood of being enrolled in a private school, with 6 (100.0% in the age bracket) attending a public institution.
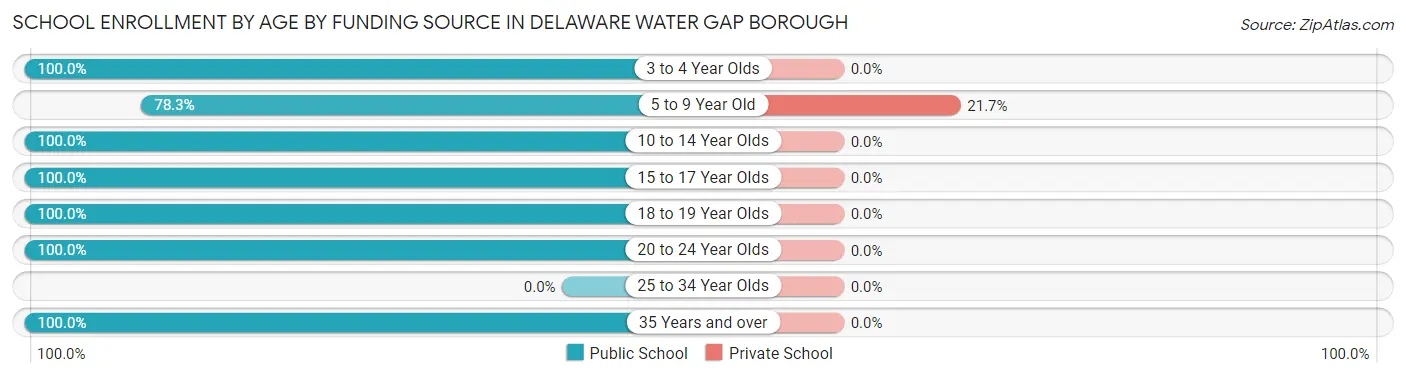
| Age Bracket | Public School | Private School |
| 3 to 4 Year Olds | 6 (100.0%) | 0 (0.0%) |
| 5 to 9 Year Old | 18 (78.3%) | 5 (21.7%) |
| 10 to 14 Year Olds | 23 (100.0%) | 0 (0.0%) |
| 15 to 17 Year Olds | 21 (100.0%) | 0 (0.0%) |
| 18 to 19 Year Olds | 46 (100.0%) | 0 (0.0%) |
| 20 to 24 Year Olds | 10 (100.0%) | 0 (0.0%) |
| 25 to 34 Year Olds | 0 (0.0%) | 0 (0.0%) |
| 35 Years and over | 4 (100.0%) | 0 (0.0%) |
| Total | 128 (96.2%) | 5 (3.8%) |
Educational Attainment by Field of Study in Delaware Water Gap borough
Business (41 | 16.9%), science & technology (34 | 14.1%), education (28 | 11.6%), liberal arts & history (24 | 9.9%), and visual & performing arts (24 | 9.9%) are the most common fields of study among 242 individuals in Delaware Water Gap borough who have obtained a bachelor's degree or higher.
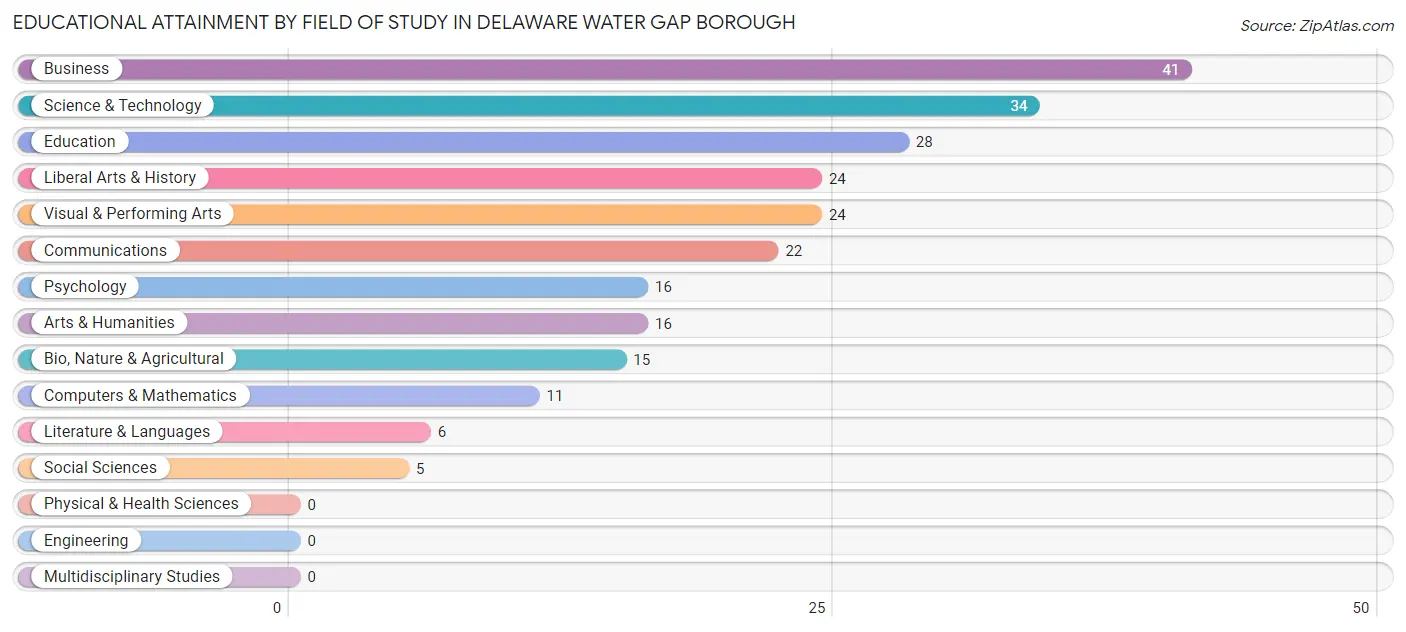
| Field of Study | # Graduates | % Graduates |
| Computers & Mathematics | 11 | 4.5% |
| Bio, Nature & Agricultural | 15 | 6.2% |
| Physical & Health Sciences | 0 | 0.0% |
| Psychology | 16 | 6.6% |
| Social Sciences | 5 | 2.1% |
| Engineering | 0 | 0.0% |
| Multidisciplinary Studies | 0 | 0.0% |
| Science & Technology | 34 | 14.1% |
| Business | 41 | 16.9% |
| Education | 28 | 11.6% |
| Literature & Languages | 6 | 2.5% |
| Liberal Arts & History | 24 | 9.9% |
| Visual & Performing Arts | 24 | 9.9% |
| Communications | 22 | 9.1% |
| Arts & Humanities | 16 | 6.6% |
| Total | 242 | 100.0% |
Transportation & Commute in Delaware Water Gap borough
Vehicle Availability by Sex in Delaware Water Gap borough
The most prevalent vehicle ownership categories in Delaware Water Gap borough are males with 2 vehicles (84, accounting for 44.0%) and females with 2 vehicles (42, making up 52.8%).
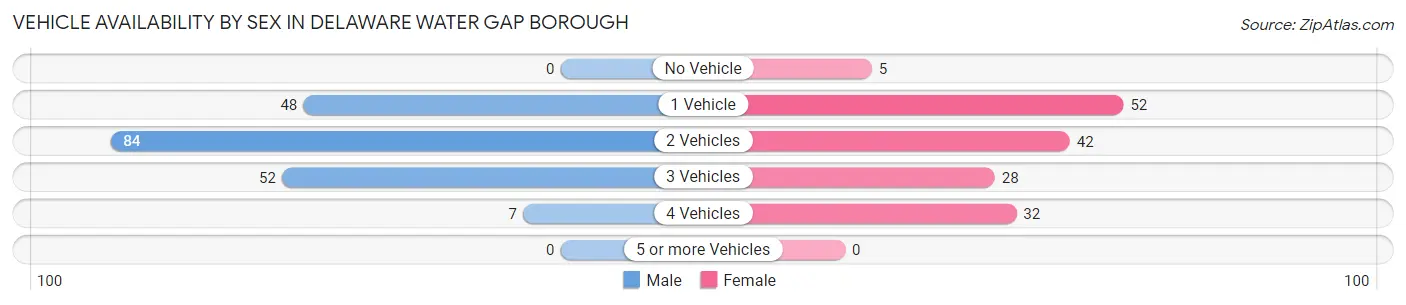
| Vehicles Available | Male | Female |
| No Vehicle | 0 (0.0%) | 5 (3.1%) |
| 1 Vehicle | 48 (25.1%) | 52 (32.7%) |
| 2 Vehicles | 84 (44.0%) | 42 (26.4%) |
| 3 Vehicles | 52 (27.2%) | 28 (17.6%) |
| 4 Vehicles | 7 (3.7%) | 32 (20.1%) |
| 5 or more Vehicles | 0 (0.0%) | 0 (0.0%) |
| Total | 191 (100.0%) | 159 (100.0%) |
Commute Time in Delaware Water Gap borough
The most frequently occuring commute durations in Delaware Water Gap borough are 10 to 14 minutes (84 commuters, 25.0%), 15 to 19 minutes (47 commuters, 14.0%), and 20 to 24 minutes (47 commuters, 14.0%).
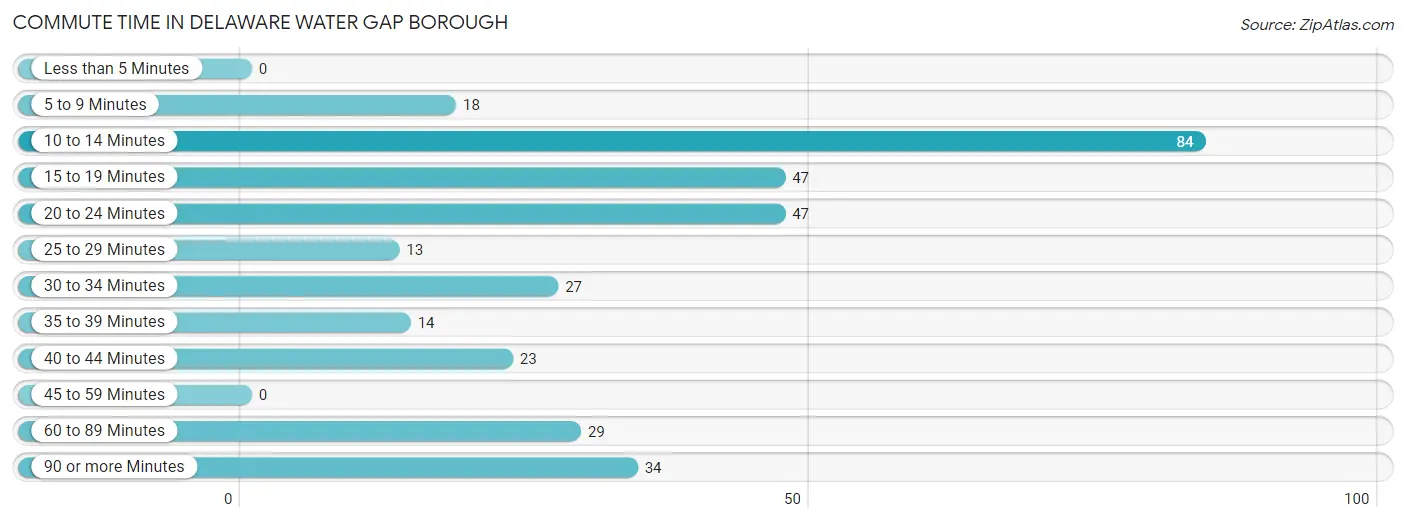
| Commute Time | # Commuters | % Commuters |
| Less than 5 Minutes | 0 | 0.0% |
| 5 to 9 Minutes | 18 | 5.4% |
| 10 to 14 Minutes | 84 | 25.0% |
| 15 to 19 Minutes | 47 | 14.0% |
| 20 to 24 Minutes | 47 | 14.0% |
| 25 to 29 Minutes | 13 | 3.9% |
| 30 to 34 Minutes | 27 | 8.0% |
| 35 to 39 Minutes | 14 | 4.2% |
| 40 to 44 Minutes | 23 | 6.9% |
| 45 to 59 Minutes | 0 | 0.0% |
| 60 to 89 Minutes | 29 | 8.6% |
| 90 or more Minutes | 34 | 10.1% |
Commute Time by Sex in Delaware Water Gap borough
The most common commute times in Delaware Water Gap borough are 10 to 14 minutes (44 commuters, 23.3%) for males and 10 to 14 minutes (40 commuters, 27.2%) for females.
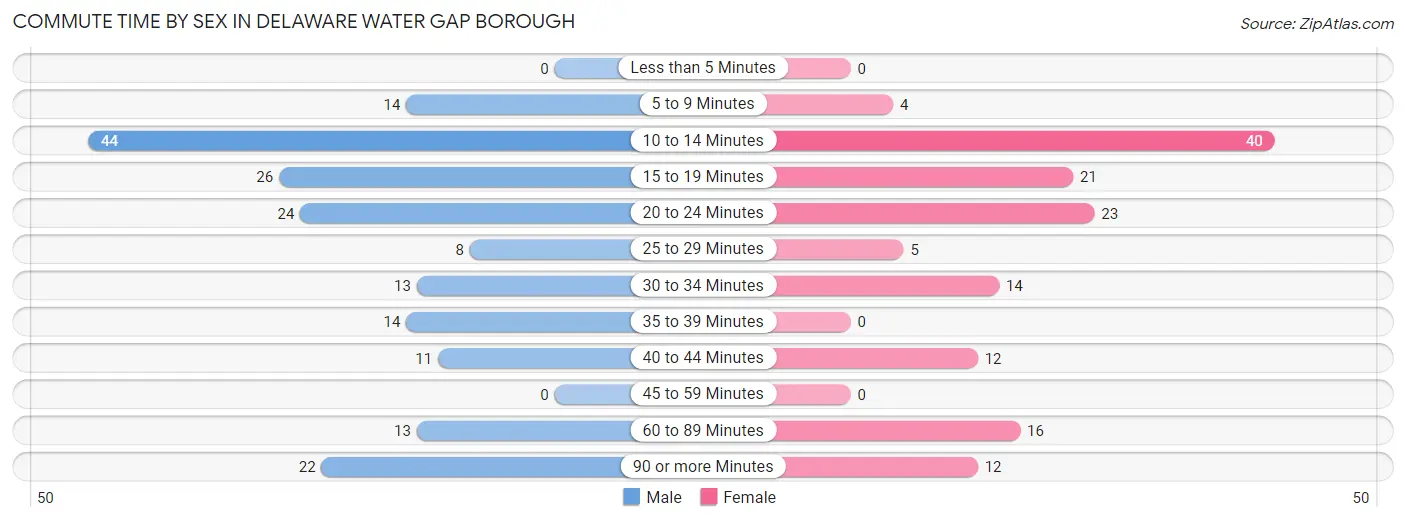
| Commute Time | Male | Female |
| Less than 5 Minutes | 0 (0.0%) | 0 (0.0%) |
| 5 to 9 Minutes | 14 (7.4%) | 4 (2.7%) |
| 10 to 14 Minutes | 44 (23.3%) | 40 (27.2%) |
| 15 to 19 Minutes | 26 (13.8%) | 21 (14.3%) |
| 20 to 24 Minutes | 24 (12.7%) | 23 (15.7%) |
| 25 to 29 Minutes | 8 (4.2%) | 5 (3.4%) |
| 30 to 34 Minutes | 13 (6.9%) | 14 (9.5%) |
| 35 to 39 Minutes | 14 (7.4%) | 0 (0.0%) |
| 40 to 44 Minutes | 11 (5.8%) | 12 (8.2%) |
| 45 to 59 Minutes | 0 (0.0%) | 0 (0.0%) |
| 60 to 89 Minutes | 13 (6.9%) | 16 (10.9%) |
| 90 or more Minutes | 22 (11.6%) | 12 (8.2%) |
Time of Departure to Work by Sex in Delaware Water Gap borough
The most frequent times of departure to work in Delaware Water Gap borough are 9:00 AM to 9:59 AM (48, 25.4%) for males and 7:30 AM to 7:59 AM (36, 24.5%) for females.
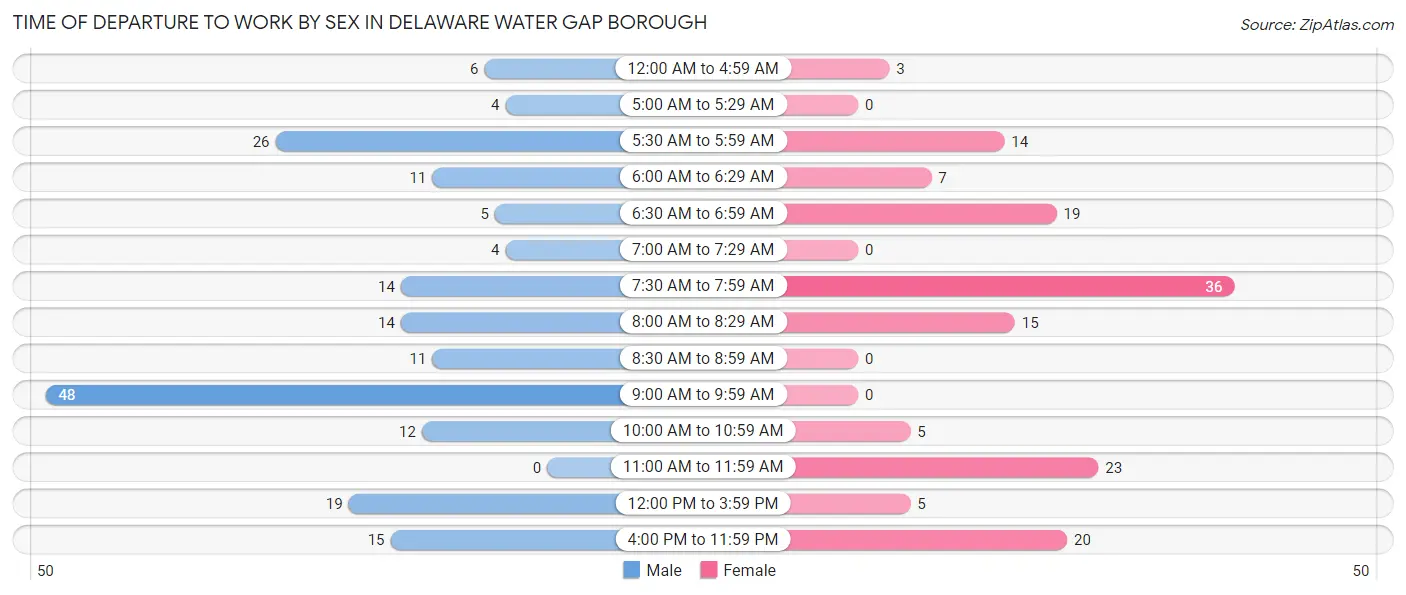
| Time of Departure | Male | Female |
| 12:00 AM to 4:59 AM | 6 (3.2%) | 3 (2.0%) |
| 5:00 AM to 5:29 AM | 4 (2.1%) | 0 (0.0%) |
| 5:30 AM to 5:59 AM | 26 (13.8%) | 14 (9.5%) |
| 6:00 AM to 6:29 AM | 11 (5.8%) | 7 (4.8%) |
| 6:30 AM to 6:59 AM | 5 (2.6%) | 19 (12.9%) |
| 7:00 AM to 7:29 AM | 4 (2.1%) | 0 (0.0%) |
| 7:30 AM to 7:59 AM | 14 (7.4%) | 36 (24.5%) |
| 8:00 AM to 8:29 AM | 14 (7.4%) | 15 (10.2%) |
| 8:30 AM to 8:59 AM | 11 (5.8%) | 0 (0.0%) |
| 9:00 AM to 9:59 AM | 48 (25.4%) | 0 (0.0%) |
| 10:00 AM to 10:59 AM | 12 (6.4%) | 5 (3.4%) |
| 11:00 AM to 11:59 AM | 0 (0.0%) | 23 (15.7%) |
| 12:00 PM to 3:59 PM | 19 (10.1%) | 5 (3.4%) |
| 4:00 PM to 11:59 PM | 15 (7.9%) | 20 (13.6%) |
| Total | 189 (100.0%) | 147 (100.0%) |
Housing Occupancy in Delaware Water Gap borough
Occupancy by Ownership in Delaware Water Gap borough
Of the total 316 dwellings in Delaware Water Gap borough, owner-occupied units account for 193 (61.1%), while renter-occupied units make up 123 (38.9%).
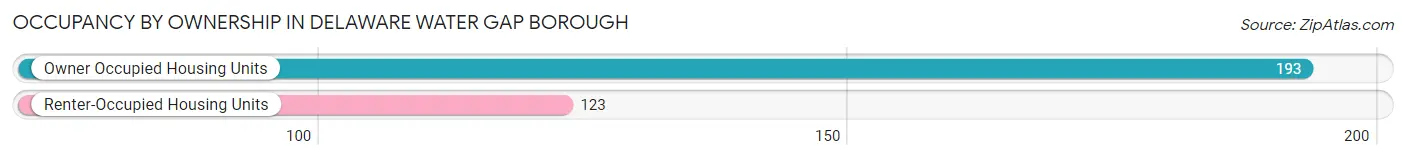
| Occupancy | # Housing Units | % Housing Units |
| Owner Occupied Housing Units | 193 | 61.1% |
| Renter-Occupied Housing Units | 123 | 38.9% |
| Total Occupied Housing Units | 316 | 100.0% |
Occupancy by Household Size in Delaware Water Gap borough
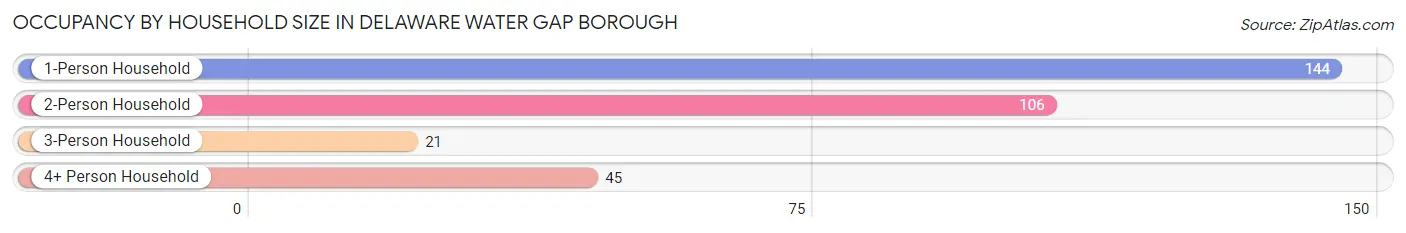
| Household Size | # Housing Units | % Housing Units |
| 1-Person Household | 144 | 45.6% |
| 2-Person Household | 106 | 33.5% |
| 3-Person Household | 21 | 6.7% |
| 4+ Person Household | 45 | 14.2% |
| Total Housing Units | 316 | 100.0% |
Occupancy by Ownership by Household Size in Delaware Water Gap borough
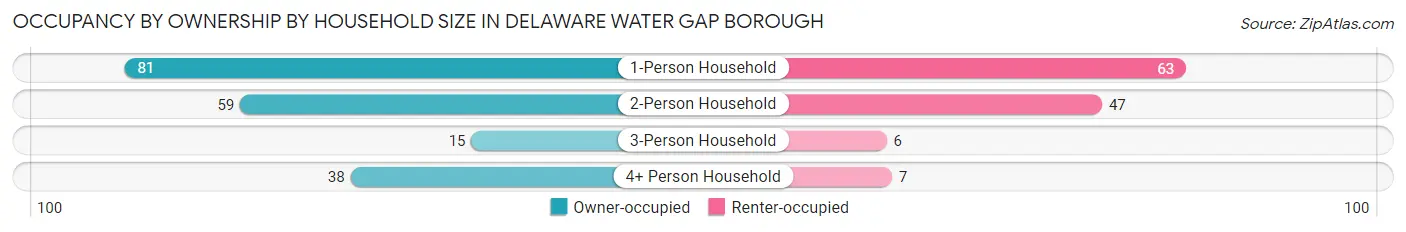
| Household Size | Owner-occupied | Renter-occupied |
| 1-Person Household | 81 (56.2%) | 63 (43.8%) |
| 2-Person Household | 59 (55.7%) | 47 (44.3%) |
| 3-Person Household | 15 (71.4%) | 6 (28.6%) |
| 4+ Person Household | 38 (84.4%) | 7 (15.6%) |
| Total Housing Units | 193 (61.1%) | 123 (38.9%) |
Occupancy by Educational Attainment in Delaware Water Gap borough
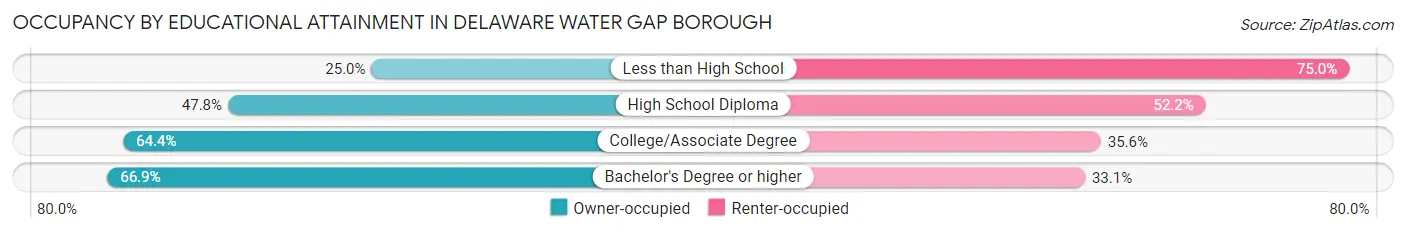
| Household Size | Owner-occupied | Renter-occupied |
| Less than High School | 2 (25.0%) | 6 (75.0%) |
| High School Diploma | 32 (47.8%) | 35 (52.2%) |
| College/Associate Degree | 56 (64.4%) | 31 (35.6%) |
| Bachelor's Degree or higher | 103 (66.9%) | 51 (33.1%) |
Occupancy by Age of Householder in Delaware Water Gap borough
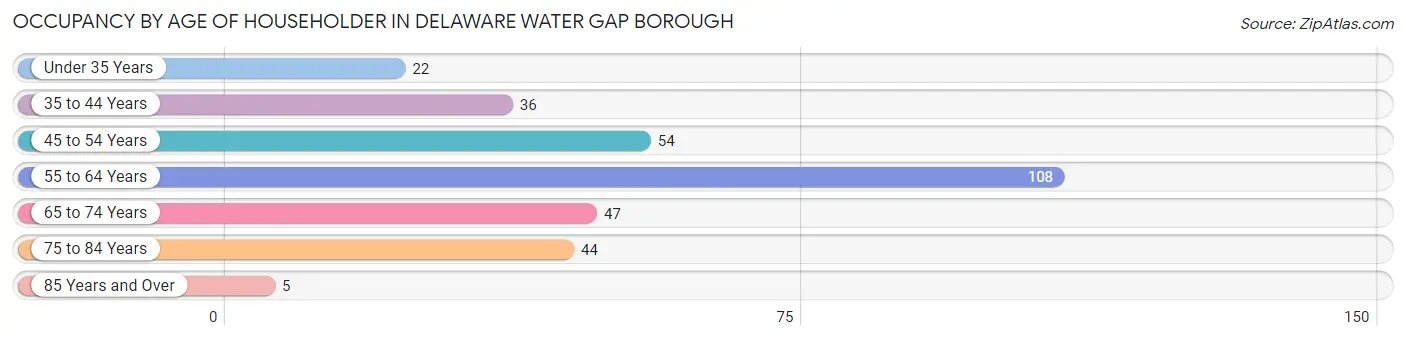
| Age Bracket | # Households | % Households |
| Under 35 Years | 22 | 7.0% |
| 35 to 44 Years | 36 | 11.4% |
| 45 to 54 Years | 54 | 17.1% |
| 55 to 64 Years | 108 | 34.2% |
| 65 to 74 Years | 47 | 14.9% |
| 75 to 84 Years | 44 | 13.9% |
| 85 Years and Over | 5 | 1.6% |
| Total | 316 | 100.0% |
Housing Finances in Delaware Water Gap borough
Median Income by Occupancy in Delaware Water Gap borough
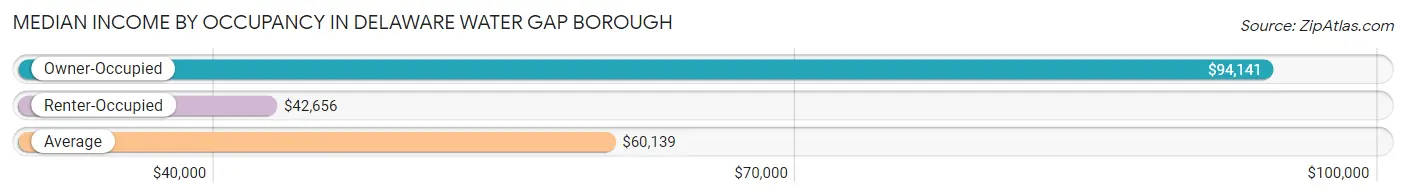
| Occupancy Type | # Households | Median Income |
| Owner-Occupied | 193 (61.1%) | $94,141 |
| Renter-Occupied | 123 (38.9%) | $42,656 |
| Average | 316 (100.0%) | $60,139 |
Occupancy by Householder Income Bracket in Delaware Water Gap borough
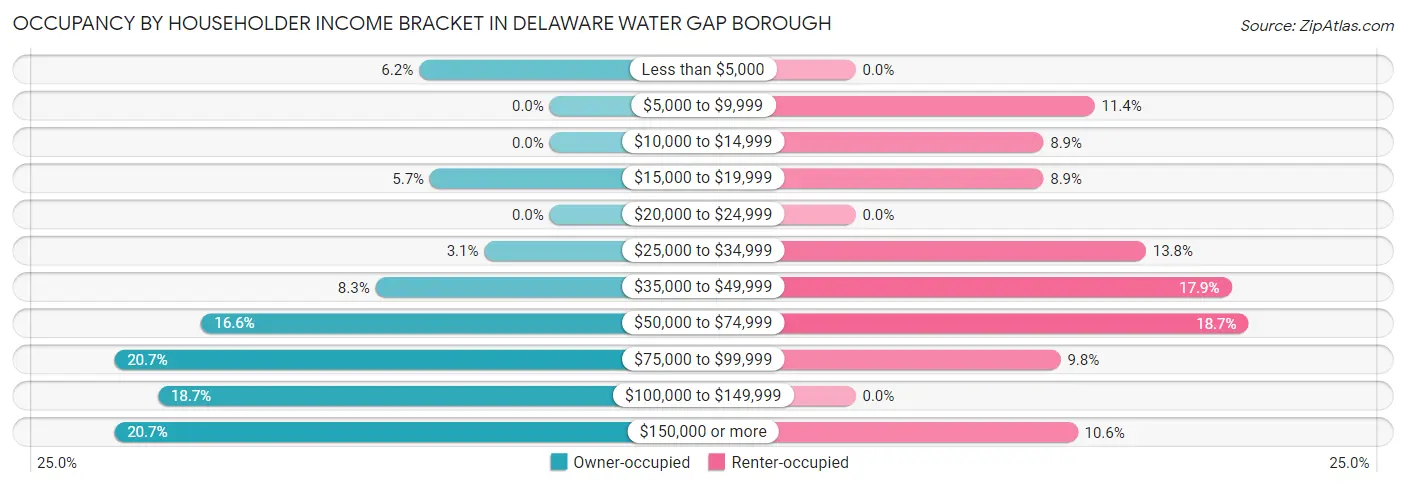
| Income Bracket | Owner-occupied | Renter-occupied |
| Less than $5,000 | 12 (6.2%) | 0 (0.0%) |
| $5,000 to $9,999 | 0 (0.0%) | 14 (11.4%) |
| $10,000 to $14,999 | 0 (0.0%) | 11 (8.9%) |
| $15,000 to $19,999 | 11 (5.7%) | 11 (8.9%) |
| $20,000 to $24,999 | 0 (0.0%) | 0 (0.0%) |
| $25,000 to $34,999 | 6 (3.1%) | 17 (13.8%) |
| $35,000 to $49,999 | 16 (8.3%) | 22 (17.9%) |
| $50,000 to $74,999 | 32 (16.6%) | 23 (18.7%) |
| $75,000 to $99,999 | 40 (20.7%) | 12 (9.8%) |
| $100,000 to $149,999 | 36 (18.6%) | 0 (0.0%) |
| $150,000 or more | 40 (20.7%) | 13 (10.6%) |
| Total | 193 (100.0%) | 123 (100.0%) |
Monthly Housing Cost Tiers in Delaware Water Gap borough
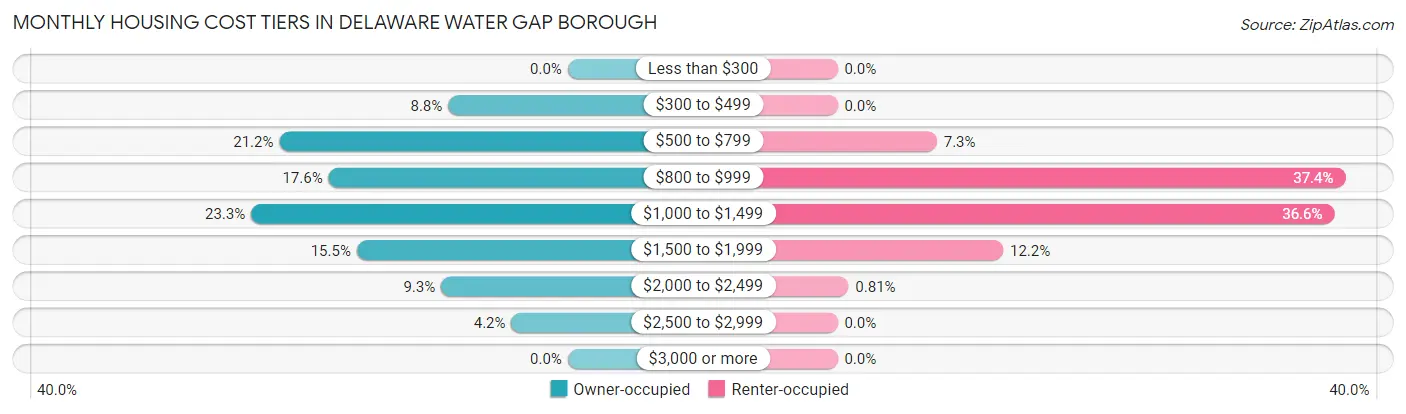
| Monthly Cost | Owner-occupied | Renter-occupied |
| Less than $300 | 0 (0.0%) | 0 (0.0%) |
| $300 to $499 | 17 (8.8%) | 0 (0.0%) |
| $500 to $799 | 41 (21.2%) | 9 (7.3%) |
| $800 to $999 | 34 (17.6%) | 46 (37.4%) |
| $1,000 to $1,499 | 45 (23.3%) | 45 (36.6%) |
| $1,500 to $1,999 | 30 (15.5%) | 15 (12.2%) |
| $2,000 to $2,499 | 18 (9.3%) | 1 (0.8%) |
| $2,500 to $2,999 | 8 (4.2%) | 0 (0.0%) |
| $3,000 or more | 0 (0.0%) | 0 (0.0%) |
| Total | 193 (100.0%) | 123 (100.0%) |
Physical Housing Characteristics in Delaware Water Gap borough
Housing Structures in Delaware Water Gap borough
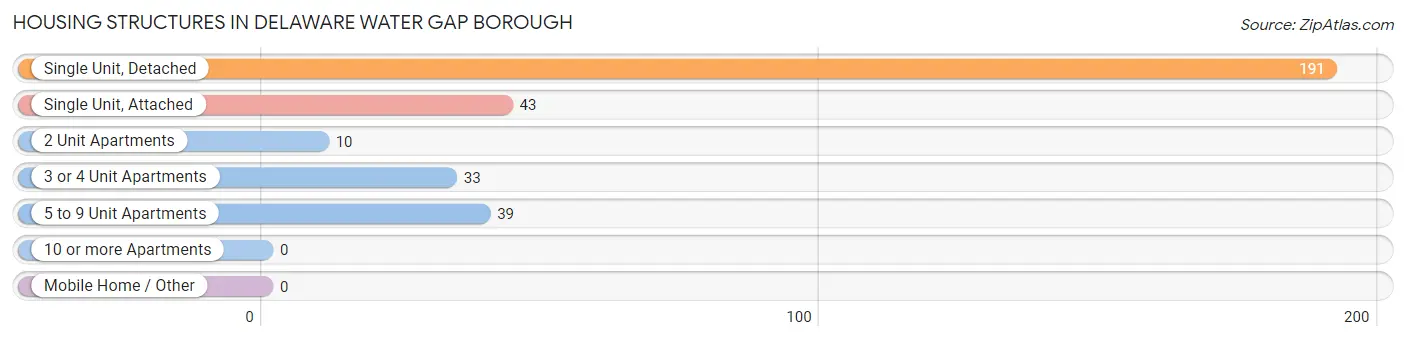
| Structure Type | # Housing Units | % Housing Units |
| Single Unit, Detached | 191 | 60.4% |
| Single Unit, Attached | 43 | 13.6% |
| 2 Unit Apartments | 10 | 3.2% |
| 3 or 4 Unit Apartments | 33 | 10.4% |
| 5 to 9 Unit Apartments | 39 | 12.3% |
| 10 or more Apartments | 0 | 0.0% |
| Mobile Home / Other | 0 | 0.0% |
| Total | 316 | 100.0% |
Housing Structures by Occupancy in Delaware Water Gap borough
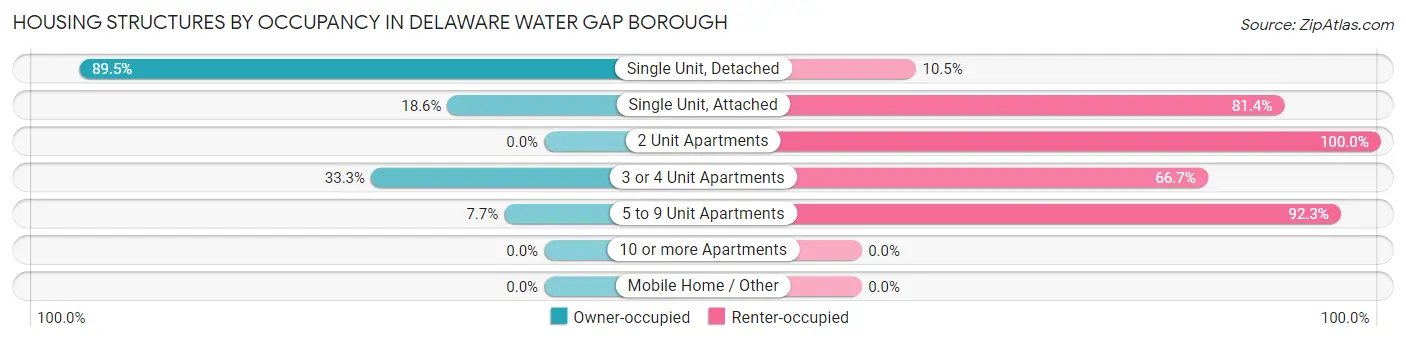
| Structure Type | Owner-occupied | Renter-occupied |
| Single Unit, Detached | 171 (89.5%) | 20 (10.5%) |
| Single Unit, Attached | 8 (18.6%) | 35 (81.4%) |
| 2 Unit Apartments | 0 (0.0%) | 10 (100.0%) |
| 3 or 4 Unit Apartments | 11 (33.3%) | 22 (66.7%) |
| 5 to 9 Unit Apartments | 3 (7.7%) | 36 (92.3%) |
| 10 or more Apartments | 0 (0.0%) | 0 (0.0%) |
| Mobile Home / Other | 0 (0.0%) | 0 (0.0%) |
| Total | 193 (61.1%) | 123 (38.9%) |
Housing Structures by Number of Rooms in Delaware Water Gap borough
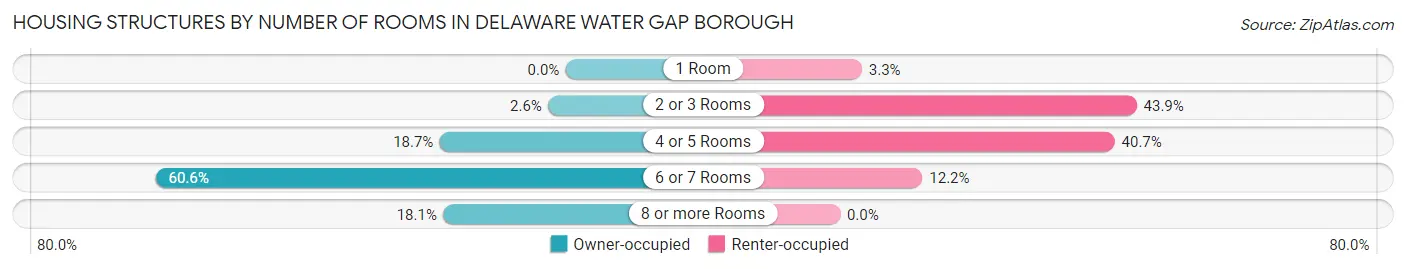
| Number of Rooms | Owner-occupied | Renter-occupied |
| 1 Room | 0 (0.0%) | 4 (3.3%) |
| 2 or 3 Rooms | 5 (2.6%) | 54 (43.9%) |
| 4 or 5 Rooms | 36 (18.6%) | 50 (40.6%) |
| 6 or 7 Rooms | 117 (60.6%) | 15 (12.2%) |
| 8 or more Rooms | 35 (18.1%) | 0 (0.0%) |
| Total | 193 (100.0%) | 123 (100.0%) |
Housing Structure by Heating Type in Delaware Water Gap borough
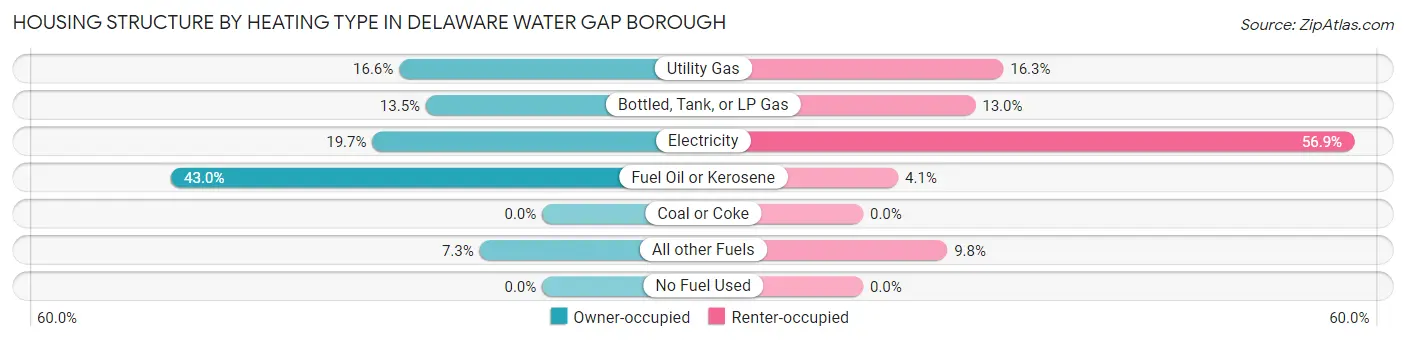
| Heating Type | Owner-occupied | Renter-occupied |
| Utility Gas | 32 (16.6%) | 20 (16.3%) |
| Bottled, Tank, or LP Gas | 26 (13.5%) | 16 (13.0%) |
| Electricity | 38 (19.7%) | 70 (56.9%) |
| Fuel Oil or Kerosene | 83 (43.0%) | 5 (4.1%) |
| Coal or Coke | 0 (0.0%) | 0 (0.0%) |
| All other Fuels | 14 (7.2%) | 12 (9.8%) |
| No Fuel Used | 0 (0.0%) | 0 (0.0%) |
| Total | 193 (100.0%) | 123 (100.0%) |
Household Vehicle Usage in Delaware Water Gap borough
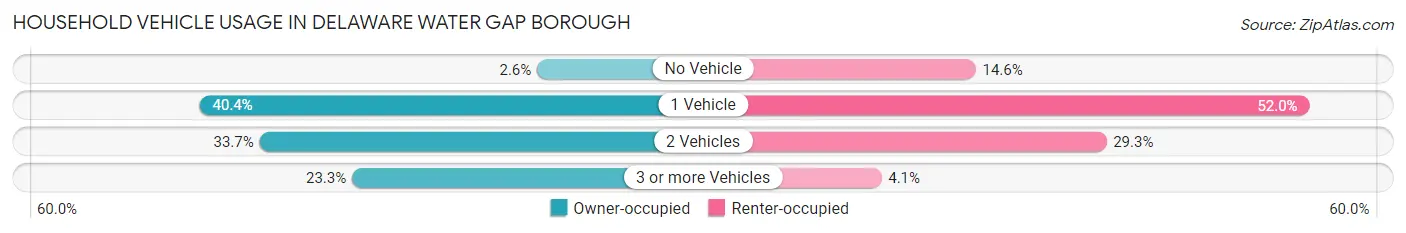
| Vehicles per Household | Owner-occupied | Renter-occupied |
| No Vehicle | 5 (2.6%) | 18 (14.6%) |
| 1 Vehicle | 78 (40.4%) | 64 (52.0%) |
| 2 Vehicles | 65 (33.7%) | 36 (29.3%) |
| 3 or more Vehicles | 45 (23.3%) | 5 (4.1%) |
| Total | 193 (100.0%) | 123 (100.0%) |
Real Estate & Mortgages in Delaware Water Gap borough
Real Estate and Mortgage Overview in Delaware Water Gap borough
| Characteristic | Without Mortgage | With Mortgage |
| Housing Units | 95 | 98 |
| Median Property Value | $256,800 | $252,300 |
| Median Household Income | - | - |
| Monthly Housing Costs | $748 | $0 |
| Real Estate Taxes | $5,294 | $11 |
Property Value by Mortgage Status in Delaware Water Gap borough
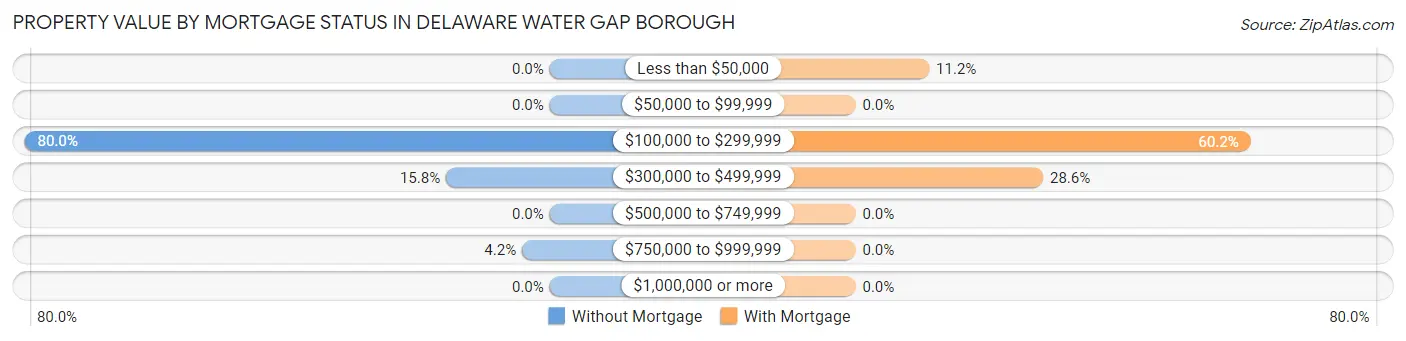
| Property Value | Without Mortgage | With Mortgage |
| Less than $50,000 | 0 (0.0%) | 11 (11.2%) |
| $50,000 to $99,999 | 0 (0.0%) | 0 (0.0%) |
| $100,000 to $299,999 | 76 (80.0%) | 59 (60.2%) |
| $300,000 to $499,999 | 15 (15.8%) | 28 (28.6%) |
| $500,000 to $749,999 | 0 (0.0%) | 0 (0.0%) |
| $750,000 to $999,999 | 4 (4.2%) | 0 (0.0%) |
| $1,000,000 or more | 0 (0.0%) | 0 (0.0%) |
| Total | 95 (100.0%) | 98 (100.0%) |
Household Income by Mortgage Status in Delaware Water Gap borough
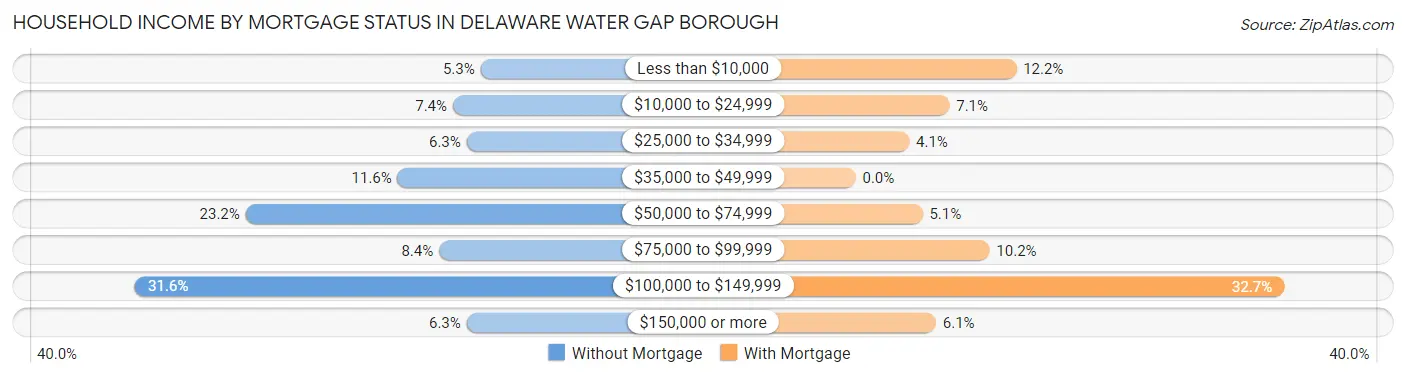
| Household Income | Without Mortgage | With Mortgage |
| Less than $10,000 | 5 (5.3%) | 12 (12.2%) |
| $10,000 to $24,999 | 7 (7.4%) | 7 (7.1%) |
| $25,000 to $34,999 | 6 (6.3%) | 4 (4.1%) |
| $35,000 to $49,999 | 11 (11.6%) | 0 (0.0%) |
| $50,000 to $74,999 | 22 (23.2%) | 5 (5.1%) |
| $75,000 to $99,999 | 8 (8.4%) | 10 (10.2%) |
| $100,000 to $149,999 | 30 (31.6%) | 32 (32.7%) |
| $150,000 or more | 6 (6.3%) | 6 (6.1%) |
| Total | 95 (100.0%) | 98 (100.0%) |
Property Value to Household Income Ratio in Delaware Water Gap borough
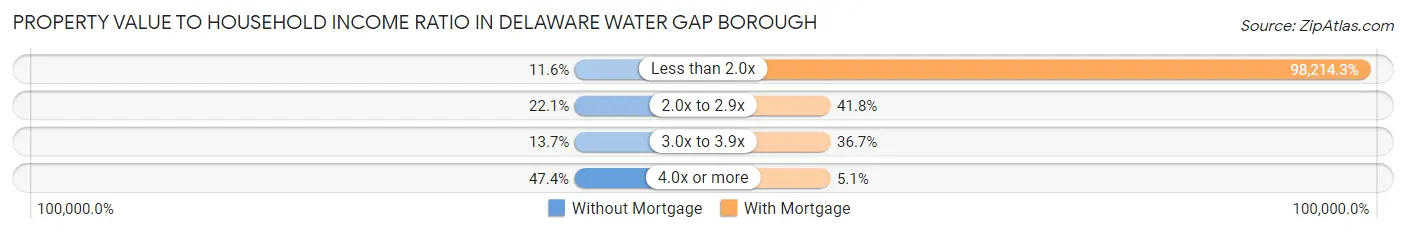
| Value-to-Income Ratio | Without Mortgage | With Mortgage |
| Less than 2.0x | 11 (11.6%) | 96,250 (98,214.3%) |
| 2.0x to 2.9x | 21 (22.1%) | 41 (41.8%) |
| 3.0x to 3.9x | 13 (13.7%) | 36 (36.7%) |
| 4.0x or more | 45 (47.4%) | 5 (5.1%) |
| Total | 95 (100.0%) | 98 (100.0%) |
Real Estate Taxes by Mortgage Status in Delaware Water Gap borough
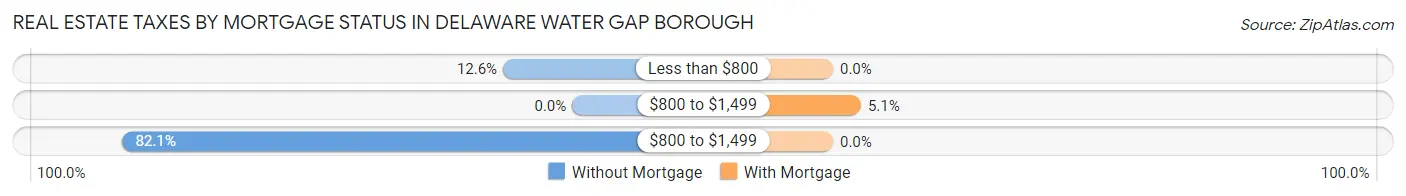
| Property Taxes | Without Mortgage | With Mortgage |
| Less than $800 | 12 (12.6%) | 0 (0.0%) |
| $800 to $1,499 | 0 (0.0%) | 5 (5.1%) |
| $800 to $1,499 | 78 (82.1%) | 0 (0.0%) |
| Total | 95 (100.0%) | 98 (100.0%) |
Health & Disability in Delaware Water Gap borough
Health Insurance Coverage by Age in Delaware Water Gap borough
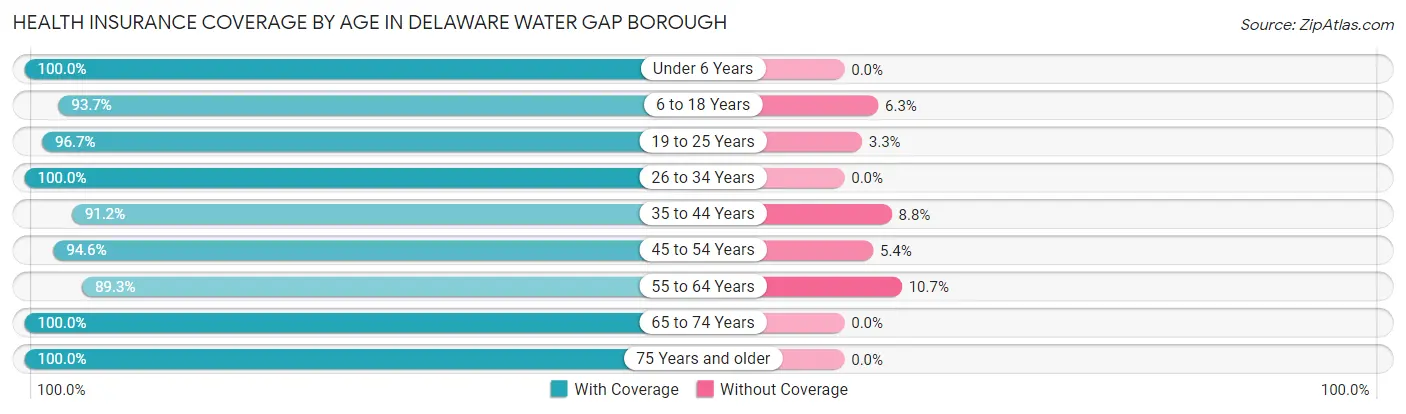
| Age Bracket | With Coverage | Without Coverage |
| Under 6 Years | 10 (100.0%) | 0 (0.0%) |
| 6 to 18 Years | 104 (93.7%) | 7 (6.3%) |
| 19 to 25 Years | 59 (96.7%) | 2 (3.3%) |
| 26 to 34 Years | 27 (100.0%) | 0 (0.0%) |
| 35 to 44 Years | 62 (91.2%) | 6 (8.8%) |
| 45 to 54 Years | 106 (94.6%) | 6 (5.4%) |
| 55 to 64 Years | 125 (89.3%) | 15 (10.7%) |
| 65 to 74 Years | 65 (100.0%) | 0 (0.0%) |
| 75 Years and older | 58 (100.0%) | 0 (0.0%) |
| Total | 616 (94.5%) | 36 (5.5%) |
Health Insurance Coverage by Citizenship Status in Delaware Water Gap borough

| Citizenship Status | With Coverage | Without Coverage |
| Native Born | 10 (100.0%) | 0 (0.0%) |
| Foreign Born, Citizen | 104 (93.7%) | 7 (6.3%) |
| Foreign Born, not a Citizen | 59 (96.7%) | 2 (3.3%) |
Health Insurance Coverage by Household Income in Delaware Water Gap borough
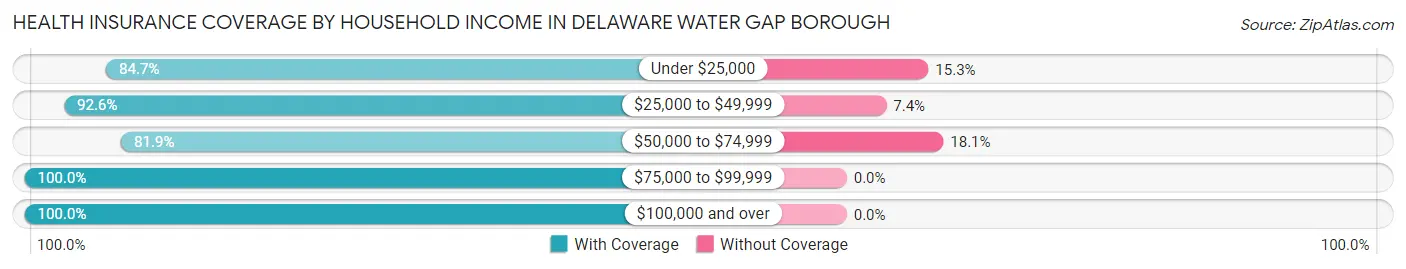
| Household Income | With Coverage | Without Coverage |
| Under $25,000 | 72 (84.7%) | 13 (15.3%) |
| $25,000 to $49,999 | 75 (92.6%) | 6 (7.4%) |
| $50,000 to $74,999 | 77 (81.9%) | 17 (18.1%) |
| $75,000 to $99,999 | 125 (100.0%) | 0 (0.0%) |
| $100,000 and over | 267 (100.0%) | 0 (0.0%) |
Public vs Private Health Insurance Coverage by Age in Delaware Water Gap borough
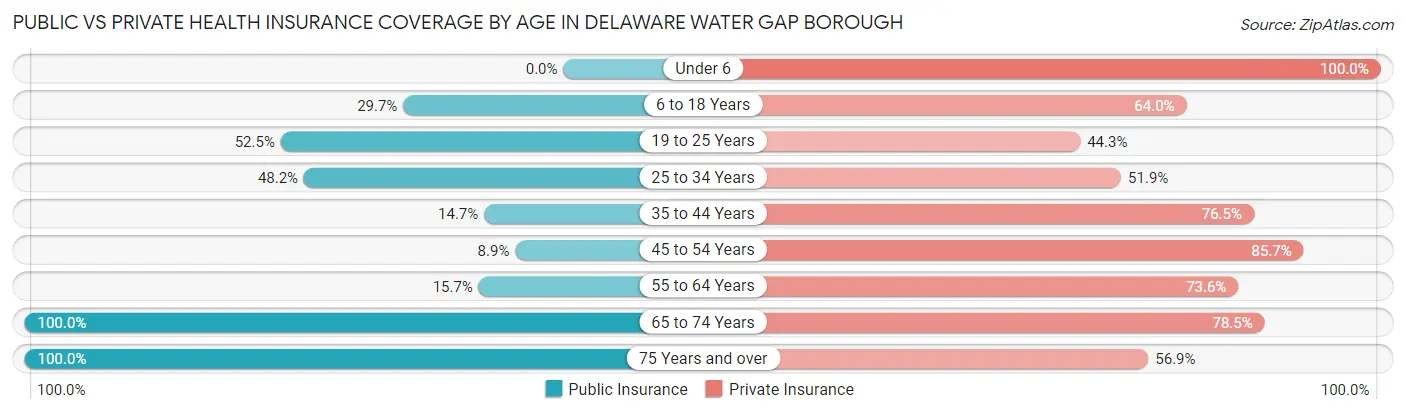
| Age Bracket | Public Insurance | Private Insurance |
| Under 6 | 0 (0.0%) | 10 (100.0%) |
| 6 to 18 Years | 33 (29.7%) | 71 (64.0%) |
| 19 to 25 Years | 32 (52.5%) | 27 (44.3%) |
| 25 to 34 Years | 13 (48.1%) | 14 (51.8%) |
| 35 to 44 Years | 10 (14.7%) | 52 (76.5%) |
| 45 to 54 Years | 10 (8.9%) | 96 (85.7%) |
| 55 to 64 Years | 22 (15.7%) | 103 (73.6%) |
| 65 to 74 Years | 65 (100.0%) | 51 (78.5%) |
| 75 Years and over | 58 (100.0%) | 33 (56.9%) |
| Total | 243 (37.3%) | 457 (70.1%) |
Disability Status by Sex by Age in Delaware Water Gap borough
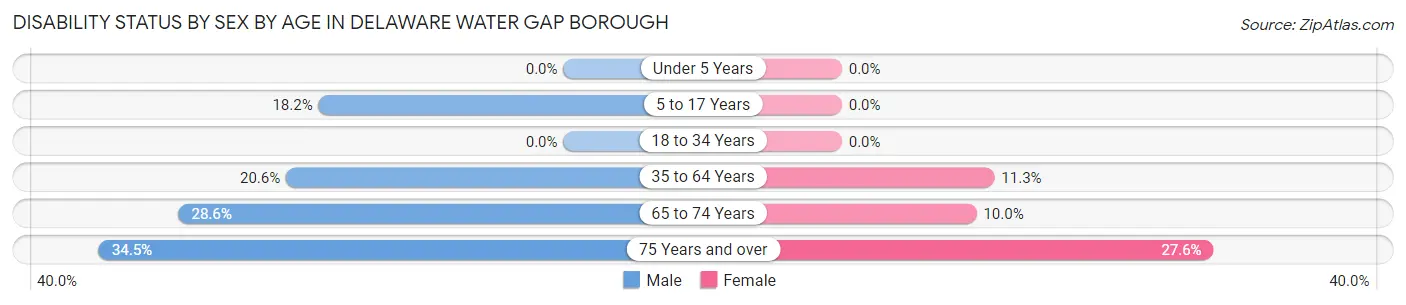
| Age Bracket | Male | Female |
| Under 5 Years | 0 (0.0%) | 0 (0.0%) |
| 5 to 17 Years | 8 (18.2%) | 0 (0.0%) |
| 18 to 34 Years | 0 (0.0%) | 0 (0.0%) |
| 35 to 64 Years | 35 (20.6%) | 17 (11.3%) |
| 65 to 74 Years | 10 (28.6%) | 3 (10.0%) |
| 75 Years and over | 10 (34.5%) | 8 (27.6%) |
Disability Class by Sex by Age in Delaware Water Gap borough
Disability Class: Hearing Difficulty
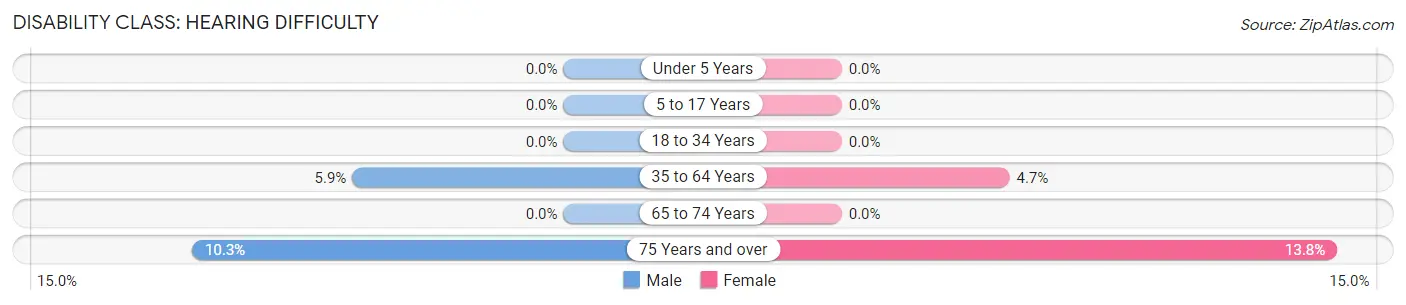
| Age Bracket | Male | Female |
| Under 5 Years | 0 (0.0%) | 0 (0.0%) |
| 5 to 17 Years | 0 (0.0%) | 0 (0.0%) |
| 18 to 34 Years | 0 (0.0%) | 0 (0.0%) |
| 35 to 64 Years | 10 (5.9%) | 7 (4.7%) |
| 65 to 74 Years | 0 (0.0%) | 0 (0.0%) |
| 75 Years and over | 3 (10.3%) | 4 (13.8%) |
Disability Class: Vision Difficulty
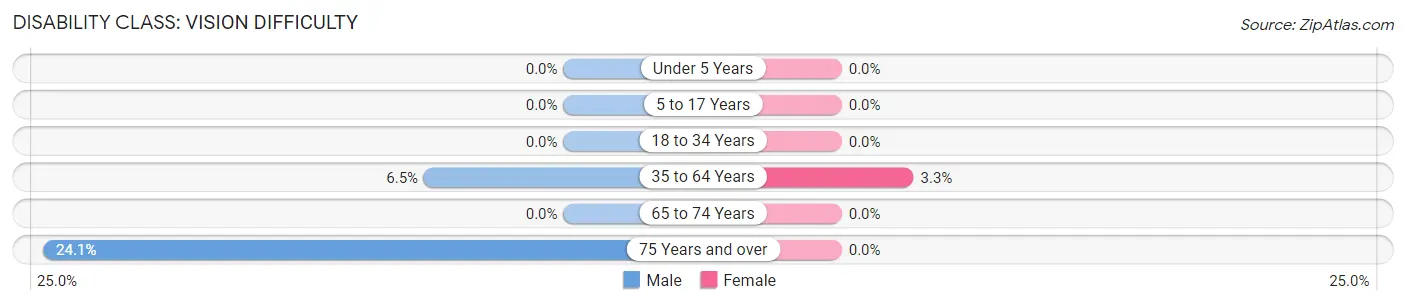
| Age Bracket | Male | Female |
| Under 5 Years | 0 (0.0%) | 0 (0.0%) |
| 5 to 17 Years | 0 (0.0%) | 0 (0.0%) |
| 18 to 34 Years | 0 (0.0%) | 0 (0.0%) |
| 35 to 64 Years | 11 (6.5%) | 5 (3.3%) |
| 65 to 74 Years | 0 (0.0%) | 0 (0.0%) |
| 75 Years and over | 7 (24.1%) | 0 (0.0%) |
Disability Class: Cognitive Difficulty
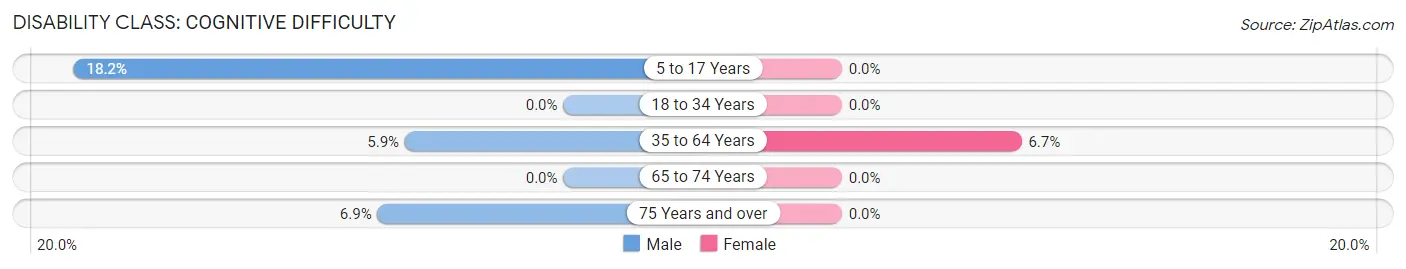
| Age Bracket | Male | Female |
| 5 to 17 Years | 8 (18.2%) | 0 (0.0%) |
| 18 to 34 Years | 0 (0.0%) | 0 (0.0%) |
| 35 to 64 Years | 10 (5.9%) | 10 (6.7%) |
| 65 to 74 Years | 0 (0.0%) | 0 (0.0%) |
| 75 Years and over | 2 (6.9%) | 0 (0.0%) |
Disability Class: Ambulatory Difficulty
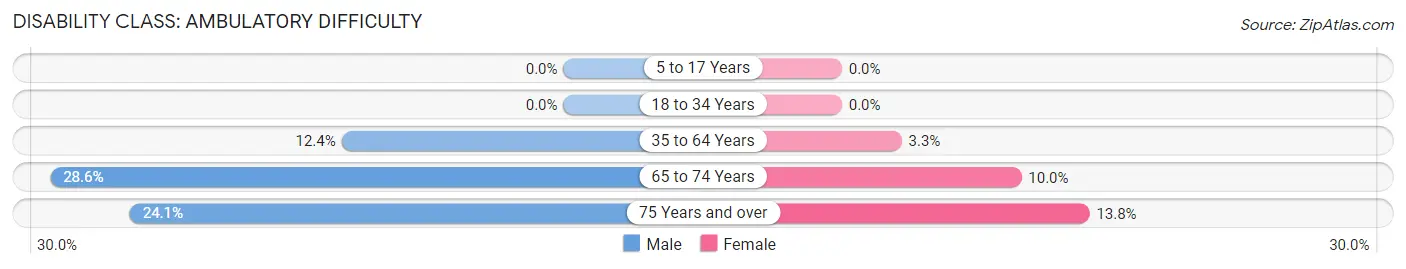
| Age Bracket | Male | Female |
| 5 to 17 Years | 0 (0.0%) | 0 (0.0%) |
| 18 to 34 Years | 0 (0.0%) | 0 (0.0%) |
| 35 to 64 Years | 21 (12.3%) | 5 (3.3%) |
| 65 to 74 Years | 10 (28.6%) | 3 (10.0%) |
| 75 Years and over | 7 (24.1%) | 4 (13.8%) |
Disability Class: Self-Care Difficulty
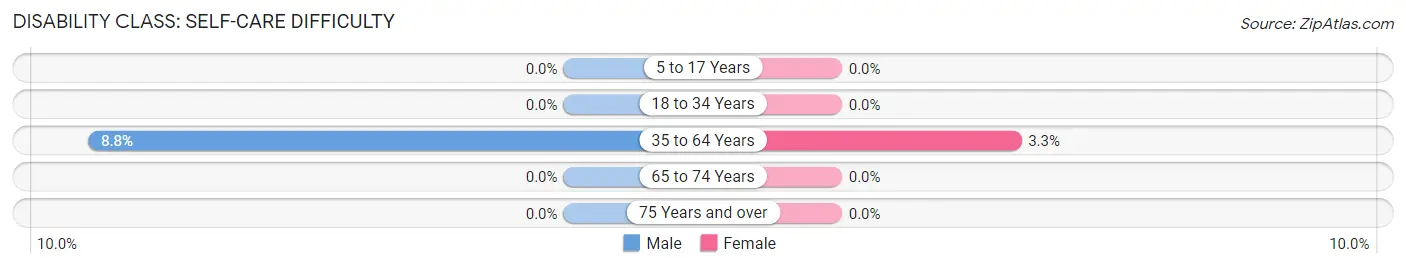
| Age Bracket | Male | Female |
| 5 to 17 Years | 0 (0.0%) | 0 (0.0%) |
| 18 to 34 Years | 0 (0.0%) | 0 (0.0%) |
| 35 to 64 Years | 15 (8.8%) | 5 (3.3%) |
| 65 to 74 Years | 0 (0.0%) | 0 (0.0%) |
| 75 Years and over | 0 (0.0%) | 0 (0.0%) |
Technology Access in Delaware Water Gap borough
Computing Device Access in Delaware Water Gap borough
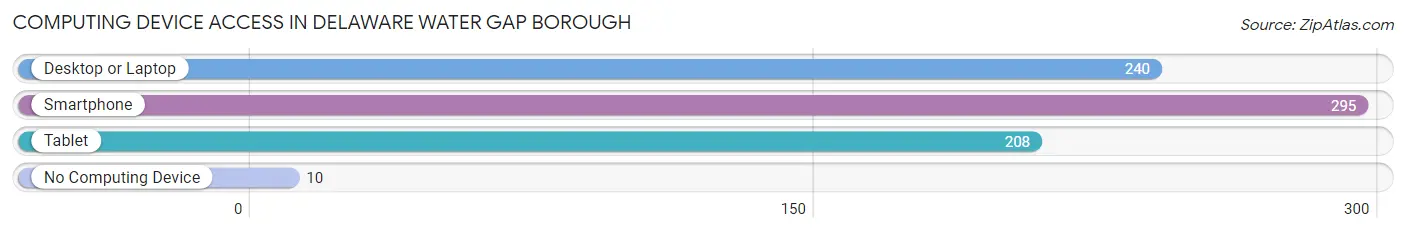
| Device Type | # Households | % Households |
| Desktop or Laptop | 240 | 75.9% |
| Smartphone | 295 | 93.3% |
| Tablet | 208 | 65.8% |
| No Computing Device | 10 | 3.2% |
| Total | 316 | 100.0% |
Internet Access in Delaware Water Gap borough
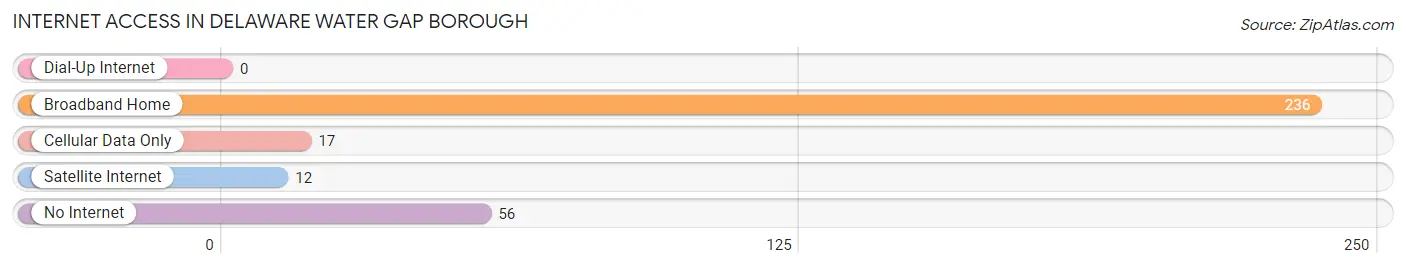
| Internet Type | # Households | % Households |
| Dial-Up Internet | 0 | 0.0% |
| Broadband Home | 236 | 74.7% |
| Cellular Data Only | 17 | 5.4% |
| Satellite Internet | 12 | 3.8% |
| No Internet | 56 | 17.7% |
| Total | 316 | 100.0% |
Delaware Water Gap borough Summary
Delaware Water Gap Borough is a borough located in Monroe County, Pennsylvania. It is situated along the Delaware River, and is part of the Pocono Mountains region. The borough is home to a population of approximately 1,500 people, and is a popular tourist destination due to its proximity to the Delaware Water Gap National Recreation Area.
Geography
Delaware Water Gap Borough is located in the Pocono Mountains region of Pennsylvania, and is situated along the Delaware River. The borough is bordered by Smithfield Township to the north, Middle Smithfield Township to the east, Stroud Township to the south, and the Delaware Water Gap National Recreation Area to the west. The borough covers an area of 1.2 square miles, and is located at an elevation of 590 feet above sea level.
The Delaware River forms the western border of the borough, and is a popular destination for fishing, boating, and other recreational activities. The borough is also home to several parks, including the Delaware Water Gap National Recreation Area, which offers a variety of outdoor activities such as hiking, camping, and fishing.
History
The area that is now Delaware Water Gap Borough was originally inhabited by the Lenape Native American tribe. The first European settlers arrived in the area in the late 1700s, and the borough was officially incorporated in 1851.
The borough was named after the Delaware Water Gap, a natural gorge that was formed by the Delaware River. The gap was a popular destination for travelers and settlers, and the area quickly became a popular tourist destination.
In the late 1800s, the borough began to develop as a resort town, and several hotels and resorts were built in the area. The borough also became a popular destination for outdoor activities such as fishing, boating, and hiking.
In the early 1900s, the borough was connected to the rest of the state by the Delaware Water Gap Toll Bridge, which was built in 1904. The bridge was the first bridge to span the Delaware River, and it allowed for easier access to the borough from the rest of the state.
Economy
The economy of Delaware Water Gap Borough is largely driven by tourism. The borough is home to several hotels and resorts, as well as a variety of restaurants and shops. The borough is also home to several outdoor recreation areas, including the Delaware Water Gap National Recreation Area, which attracts visitors from all over the country.
The borough is also home to several manufacturing companies, including a paper mill and a plastics factory. The borough is also home to several small businesses, including a variety of retail stores and restaurants.
Demographics
As of the 2010 census, the population of Delaware Water Gap Borough was 1,521. The racial makeup of the borough was 94.3% White, 2.2% African American, 0.3% Native American, 0.7% Asian, 0.1% Pacific Islander, 0.7% from other races, and 1.7% from two or more races. Hispanic or Latino of any race were 2.2% of the population.
The median household income in the borough was $45,938, and the median family income was $51,250. The per capita income in the borough was $22,945. About 8.3% of families and 10.3% of the population were below the poverty line, including 14.2% of those under age 18 and 5.2% of those age 65 or over.
Common Questions
What is Per Capita Income in Delaware Water Gap borough?
Per Capita income in Delaware Water Gap borough is $40,537.
What is the Median Family Income in Delaware Water Gap borough?
Median Family Income in Delaware Water Gap borough is $98,958.
What is the Median Household income in Delaware Water Gap borough?
Median Household Income in Delaware Water Gap borough is $60,139.
What is Income or Wage Gap in Delaware Water Gap borough?
Income or Wage Gap in Delaware Water Gap borough is 9.9%.
Women in Delaware Water Gap borough earn 90.1 cents for every dollar earned by a man.
What is Inequality or Gini Index in Delaware Water Gap borough?
Inequality or Gini Index in Delaware Water Gap borough is 0.43.
What is the Total Population of Delaware Water Gap borough?
Total Population of Delaware Water Gap borough is 652.
What is the Total Male Population of Delaware Water Gap borough?
Total Male Population of Delaware Water Gap borough is 357.
What is the Total Female Population of Delaware Water Gap borough?
Total Female Population of Delaware Water Gap borough is 295.
What is the Ratio of Males per 100 Females in Delaware Water Gap borough?
There are 121.02 Males per 100 Females in Delaware Water Gap borough.
What is the Ratio of Females per 100 Males in Delaware Water Gap borough?
There are 82.63 Females per 100 Males in Delaware Water Gap borough.
What is the Median Population Age in Delaware Water Gap borough?
Median Population Age in Delaware Water Gap borough is 48.1 Years.
What is the Average Family Size in Delaware Water Gap borough
Average Family Size in Delaware Water Gap borough is 3.2 People.
What is the Average Household Size in Delaware Water Gap borough
Average Household Size in Delaware Water Gap borough is 2.1 People.
How Large is the Labor Force in Delaware Water Gap borough?
There are 373 People in the Labor Forcein in Delaware Water Gap borough.
What is the Percentage of People in the Labor Force in Delaware Water Gap borough?
62.9% of People are in the Labor Force in Delaware Water Gap borough.
What is the Unemployment Rate in Delaware Water Gap borough?
Unemployment Rate in Delaware Water Gap borough is 6.2%.