Nesquehoning borough, PA Map & Demographics
Nesquehoning borough Overview
$22,532
PER CAPITA INCOME
$52,132
AVG FAMILY INCOME
$51,213
AVG HOUSEHOLD INCOME
20.4%
WAGE / INCOME GAP [ % ]
79.6¢/ $1
WAGE / INCOME GAP [ $ ]
0.37
INEQUALITY / GINI INDEX
3,341
TOTAL POPULATION
1,739
MALE POPULATION
1,602
FEMALE POPULATION
108.55
MALES / 100 FEMALES
92.12
FEMALES / 100 MALES
34.5
MEDIAN AGE
3.2
AVG FAMILY SIZE
2.6
AVG HOUSEHOLD SIZE
1,517
LABOR FORCE [ PEOPLE ]
57.1%
PERCENT IN LABOR FORCE
14.8%
UNEMPLOYMENT RATE
Income in Nesquehoning borough
Income Overview in Nesquehoning borough
Per Capita Income in Nesquehoning borough is $22,532, while median incomes of families and households are $52,132 and $51,213 respectively.
| Characteristic | Number | Measure |
| Per Capita Income | 3,341 | $22,532 |
| Median Family Income | 734 | $52,132 |
| Mean Family Income | 734 | $64,496 |
| Median Household Income | 1,183 | $51,213 |
| Mean Household Income | 1,183 | $60,209 |
| Income Deficit | 734 | $0 |
| Wage / Income Gap (%) | 3,341 | 20.37% |
| Wage / Income Gap ($) | 3,341 | 79.63¢ per $1 |
| Gini / Inequality Index | 3,341 | 0.37 |
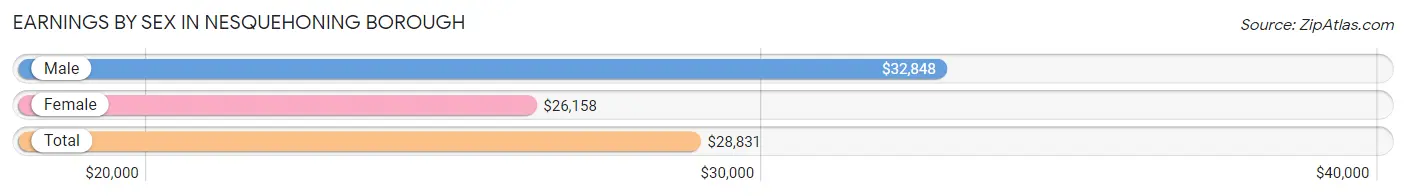
Earnings by Sex in Nesquehoning borough
Average Earnings in Nesquehoning borough are $28,831, $32,848 for men and $26,158 for women, a difference of 20.4%.
| Sex | Number | Average Earnings |
| Male | 902 (57.1%) | $32,848 |
| Female | 678 (42.9%) | $26,158 |
| Total | 1,580 (100.0%) | $28,831 |
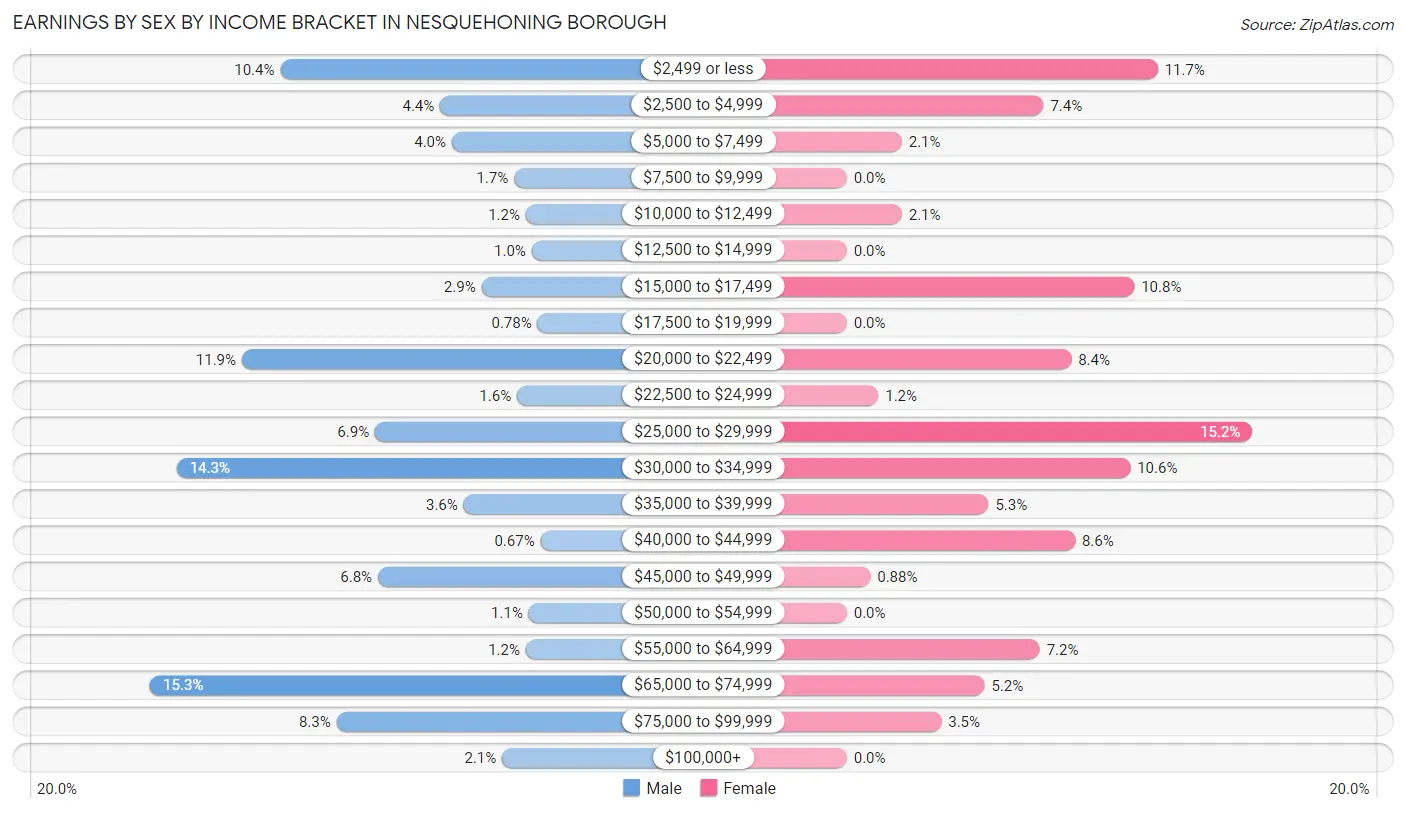
Earnings by Sex by Income Bracket in Nesquehoning borough
The most common earnings brackets in Nesquehoning borough are $65,000 to $74,999 for men (138 | 15.3%) and $25,000 to $29,999 for women (103 | 15.2%).
| Income | Male | Female |
| $2,499 or less | 94 (10.4%) | 79 (11.7%) |
| $2,500 to $4,999 | 40 (4.4%) | 50 (7.4%) |
| $5,000 to $7,499 | 36 (4.0%) | 14 (2.1%) |
| $7,500 to $9,999 | 15 (1.7%) | 0 (0.0%) |
| $10,000 to $12,499 | 11 (1.2%) | 14 (2.1%) |
| $12,500 to $14,999 | 9 (1.0%) | 0 (0.0%) |
| $15,000 to $17,499 | 26 (2.9%) | 73 (10.8%) |
| $17,500 to $19,999 | 7 (0.8%) | 0 (0.0%) |
| $20,000 to $22,499 | 107 (11.9%) | 57 (8.4%) |
| $22,500 to $24,999 | 14 (1.5%) | 8 (1.2%) |
| $25,000 to $29,999 | 62 (6.9%) | 103 (15.2%) |
| $30,000 to $34,999 | 129 (14.3%) | 72 (10.6%) |
| $35,000 to $39,999 | 32 (3.5%) | 36 (5.3%) |
| $40,000 to $44,999 | 6 (0.7%) | 58 (8.6%) |
| $45,000 to $49,999 | 61 (6.8%) | 6 (0.9%) |
| $50,000 to $54,999 | 10 (1.1%) | 0 (0.0%) |
| $55,000 to $64,999 | 11 (1.2%) | 49 (7.2%) |
| $65,000 to $74,999 | 138 (15.3%) | 35 (5.2%) |
| $75,000 to $99,999 | 75 (8.3%) | 24 (3.5%) |
| $100,000+ | 19 (2.1%) | 0 (0.0%) |
| Total | 902 (100.0%) | 678 (100.0%) |
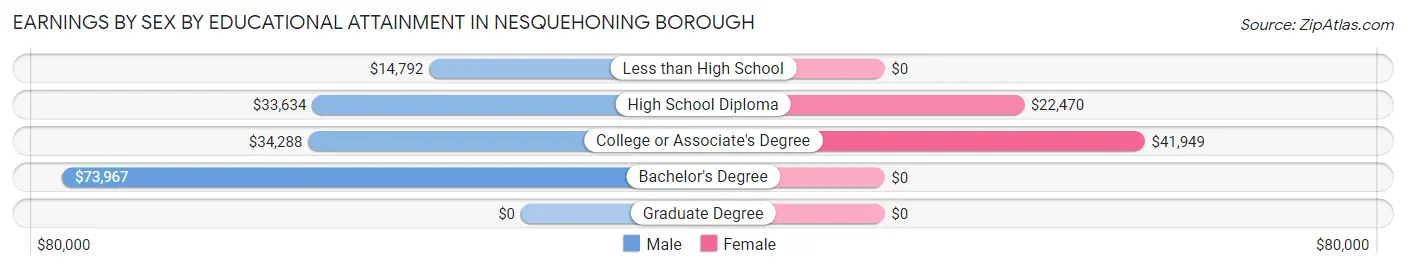
Earnings by Sex by Educational Attainment in Nesquehoning borough
Average earnings in Nesquehoning borough are $34,348 for men and $26,500 for women, a difference of 22.9%. Men with an educational attainment of bachelor's degree enjoy the highest average annual earnings of $73,967, while those with less than high school education earn the least with $14,792. Women with an educational attainment of college or associate's degree earn the most with the average annual earnings of $41,949, while those with high school diploma education have the smallest earnings of $22,470.
| Educational Attainment | Male Income | Female Income |
| Less than High School | $14,792 | $0 |
| High School Diploma | $33,634 | $22,470 |
| College or Associate's Degree | $34,288 | $41,949 |
| Bachelor's Degree | $73,967 | $0 |
| Graduate Degree | - | - |
| Total | $34,348 | $26,500 |
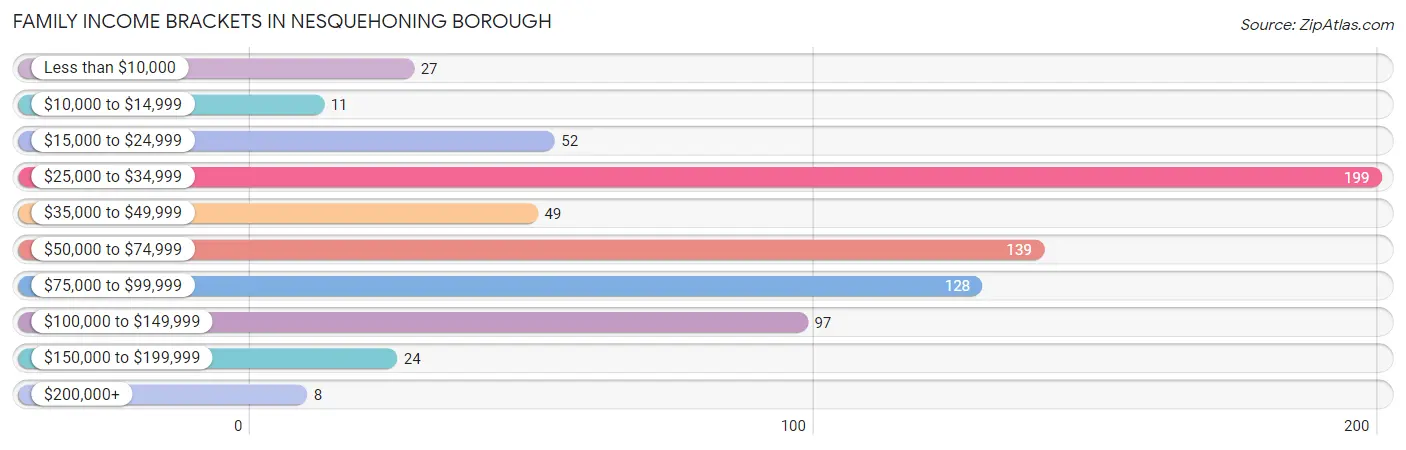
Family Income in Nesquehoning borough
Family Income Brackets in Nesquehoning borough
According to the Nesquehoning borough family income data, there are 199 families falling into the $25,000 to $34,999 income range, which is the most common income bracket and makes up 27.1% of all families. Conversely, the $200,000+ income bracket is the least frequent group with only 8 families (1.1%) belonging to this category.
| Income Bracket | # Families | % Families |
| Less than $10,000 | 27 | 3.7% |
| $10,000 to $14,999 | 11 | 1.5% |
| $15,000 to $24,999 | 52 | 7.1% |
| $25,000 to $34,999 | 199 | 27.1% |
| $35,000 to $49,999 | 49 | 6.7% |
| $50,000 to $74,999 | 139 | 18.9% |
| $75,000 to $99,999 | 128 | 17.4% |
| $100,000 to $149,999 | 97 | 13.2% |
| $150,000 to $199,999 | 24 | 3.3% |
| $200,000+ | 8 | 1.1% |
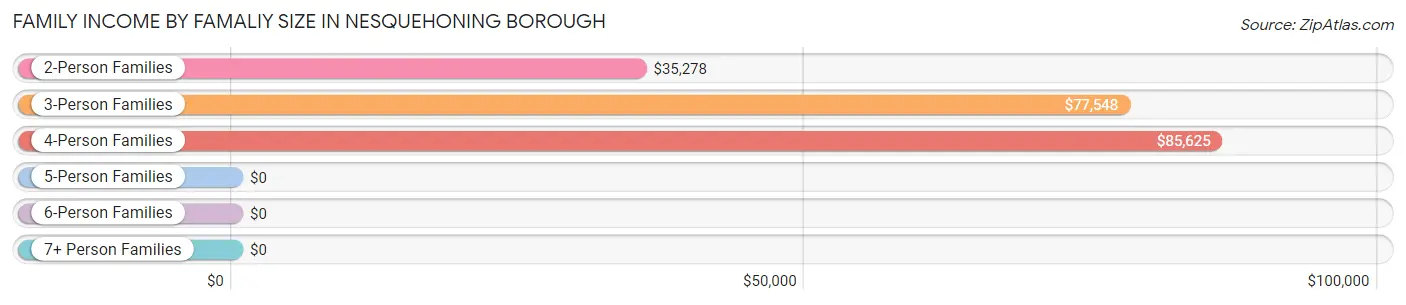
Family Income by Famaliy Size in Nesquehoning borough
4-person families (50 | 6.8%) account for the highest median family income in Nesquehoning borough with $85,625 per family, while 3-person families (115 | 15.7%) have the highest median income of $25,849 per family member.
| Income Bracket | # Families | Median Income |
| 2-Person Families | 402 (54.8%) | $35,278 |
| 3-Person Families | 115 (15.7%) | $77,548 |
| 4-Person Families | 50 (6.8%) | $85,625 |
| 5-Person Families | 149 (20.3%) | $0 |
| 6-Person Families | 0 (0.0%) | $0 |
| 7+ Person Families | 18 (2.5%) | $0 |
| Total | 734 (100.0%) | $52,132 |
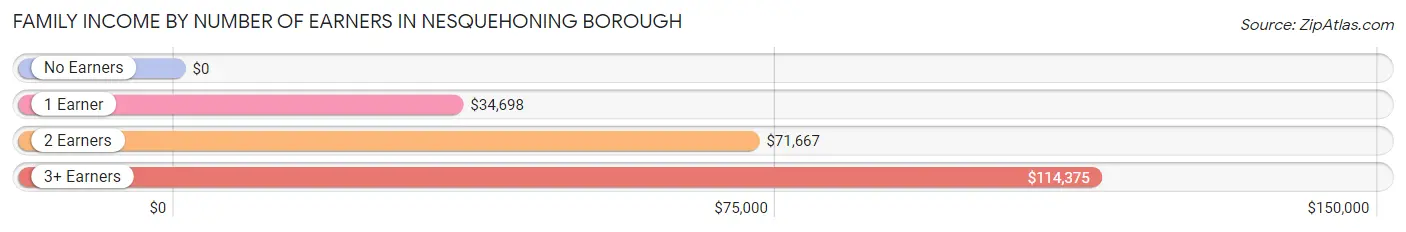
Family Income by Number of Earners in Nesquehoning borough
| Number of Earners | # Families | Median Income |
| No Earners | 99 (13.5%) | $0 |
| 1 Earner | 348 (47.4%) | $34,698 |
| 2 Earners | 210 (28.6%) | $71,667 |
| 3+ Earners | 77 (10.5%) | $114,375 |
| Total | 734 (100.0%) | $52,132 |
Household Income in Nesquehoning borough
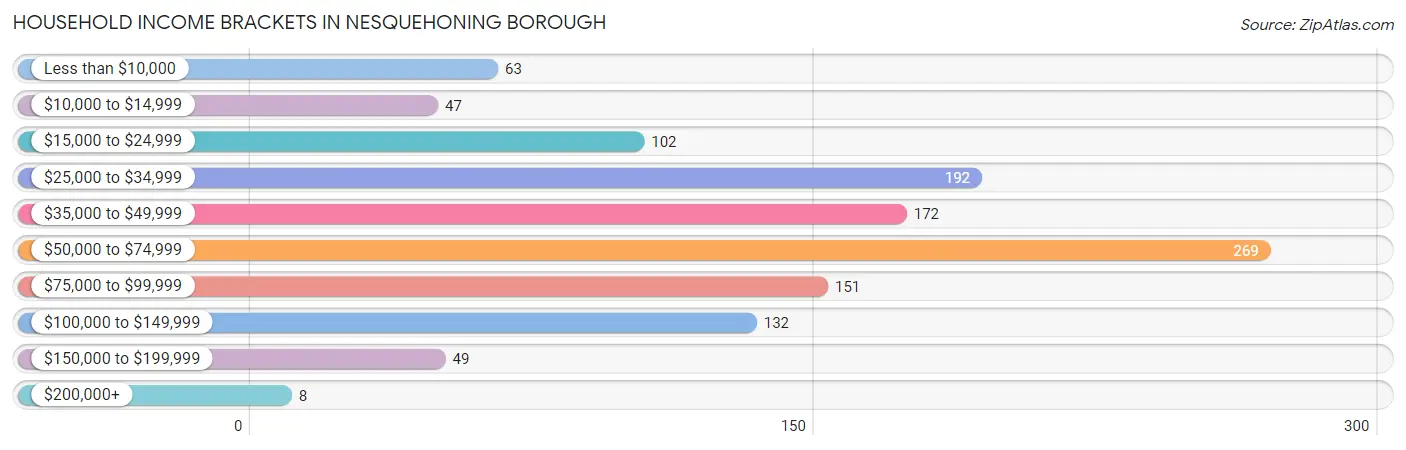
Household Income Brackets in Nesquehoning borough
With 269 households falling in the category, the $50,000 to $74,999 income range is the most frequent in Nesquehoning borough, accounting for 22.7% of all households. In contrast, only 8 households (0.7%) fall into the $200,000+ income bracket, making it the least populous group.
| Income Bracket | # Households | % Households |
| Less than $10,000 | 63 | 5.3% |
| $10,000 to $14,999 | 47 | 4.0% |
| $15,000 to $24,999 | 102 | 8.6% |
| $25,000 to $34,999 | 192 | 16.2% |
| $35,000 to $49,999 | 172 | 14.5% |
| $50,000 to $74,999 | 269 | 22.7% |
| $75,000 to $99,999 | 151 | 12.8% |
| $100,000 to $149,999 | 132 | 11.2% |
| $150,000 to $199,999 | 49 | 4.1% |
| $200,000+ | 8 | 0.7% |
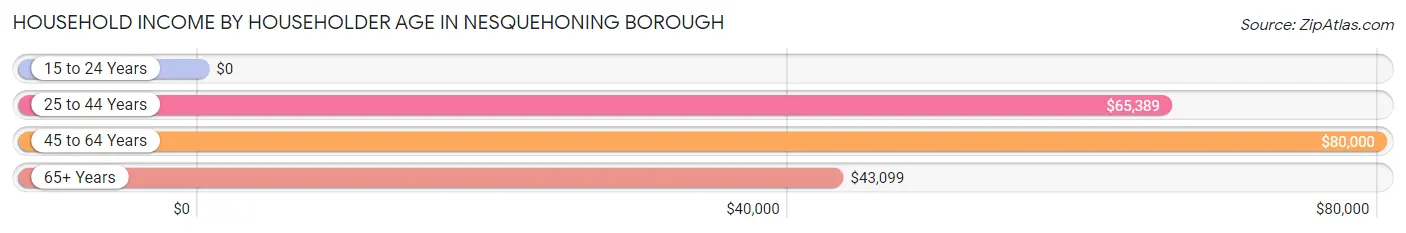
Household Income by Householder Age in Nesquehoning borough
The median household income in Nesquehoning borough is $51,213, with the highest median household income of $80,000 found in the 45 to 64 years age bracket for the primary householder. A total of 336 households (28.4%) fall into this category. Meanwhile, the 15 to 24 years age bracket for the primary householder has the lowest median household income of $0, with 23 households (1.9%) in this group.
| Income Bracket | # Households | Median Income |
| 15 to 24 Years | 23 (1.9%) | $0 |
| 25 to 44 Years | 397 (33.6%) | $65,389 |
| 45 to 64 Years | 336 (28.4%) | $80,000 |
| 65+ Years | 427 (36.1%) | $43,099 |
| Total | 1,183 (100.0%) | $51,213 |
Poverty in Nesquehoning borough
Income Below Poverty by Sex and Age in Nesquehoning borough
With 14.1% poverty level for males and 19.5% for females among the residents of Nesquehoning borough, 5 year old males and under 5 year old females are the most vulnerable to poverty, with 20 males (100.0%) and 60 females (92.3%) in their respective age groups living below the poverty level.
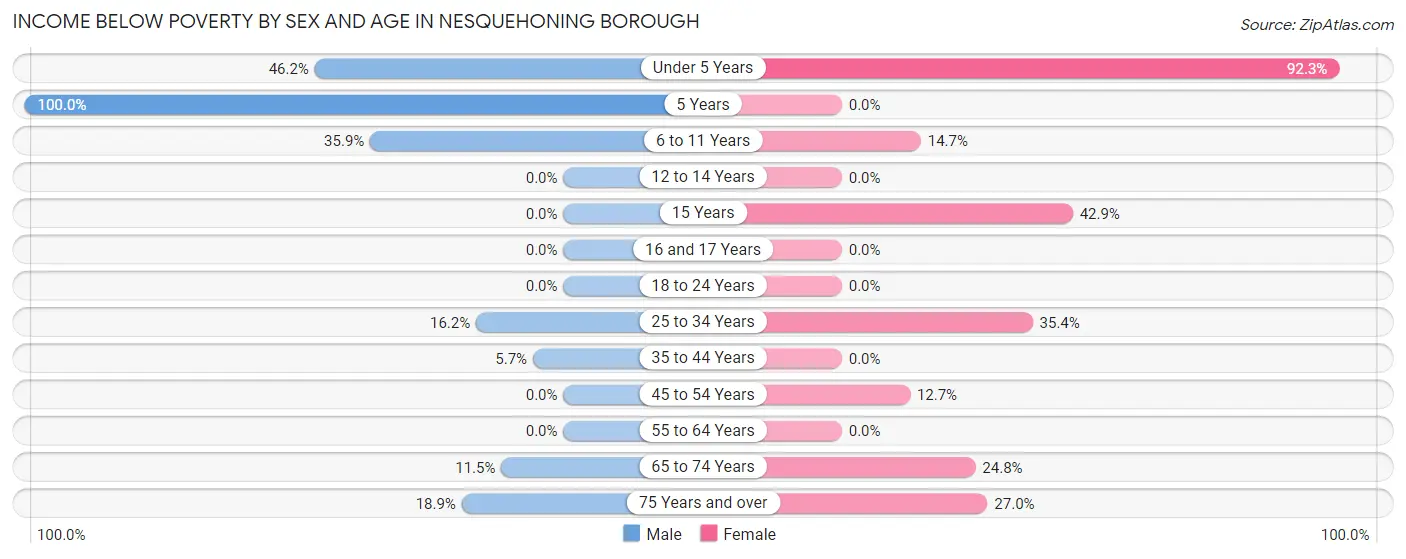
| Age Bracket | Male | Female |
| Under 5 Years | 42 (46.2%) | 60 (92.3%) |
| 5 Years | 20 (100.0%) | 0 (0.0%) |
| 6 to 11 Years | 52 (35.9%) | 17 (14.7%) |
| 12 to 14 Years | 0 (0.0%) | 0 (0.0%) |
| 15 Years | 0 (0.0%) | 18 (42.9%) |
| 16 and 17 Years | 0 (0.0%) | 0 (0.0%) |
| 18 to 24 Years | 0 (0.0%) | 0 (0.0%) |
| 25 to 34 Years | 58 (16.2%) | 102 (35.4%) |
| 35 to 44 Years | 7 (5.7%) | 0 (0.0%) |
| 45 to 54 Years | 0 (0.0%) | 21 (12.7%) |
| 55 to 64 Years | 0 (0.0%) | 0 (0.0%) |
| 65 to 74 Years | 25 (11.5%) | 31 (24.8%) |
| 75 Years and over | 10 (18.9%) | 50 (27.0%) |
| Total | 214 (14.1%) | 299 (19.5%) |
Income Above Poverty by Sex and Age in Nesquehoning borough
According to the poverty statistics in Nesquehoning borough, males aged 12 to 14 years and females aged 5 years are the age groups that are most secure financially, with 100.0% of males and 100.0% of females in these age groups living above the poverty line.
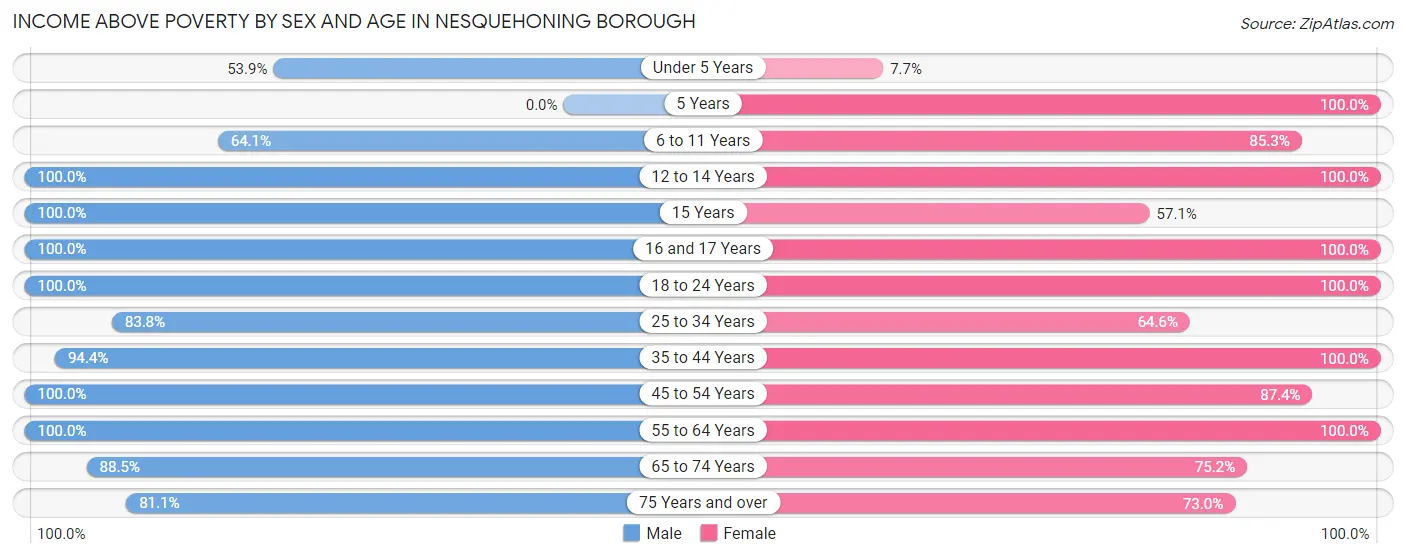
| Age Bracket | Male | Female |
| Under 5 Years | 49 (53.8%) | 5 (7.7%) |
| 5 Years | 0 (0.0%) | 23 (100.0%) |
| 6 to 11 Years | 93 (64.1%) | 99 (85.3%) |
| 12 to 14 Years | 20 (100.0%) | 74 (100.0%) |
| 15 Years | 16 (100.0%) | 24 (57.1%) |
| 16 and 17 Years | 43 (100.0%) | 54 (100.0%) |
| 18 to 24 Years | 127 (100.0%) | 82 (100.0%) |
| 25 to 34 Years | 300 (83.8%) | 186 (64.6%) |
| 35 to 44 Years | 117 (94.4%) | 60 (100.0%) |
| 45 to 54 Years | 84 (100.0%) | 145 (87.4%) |
| 55 to 64 Years | 216 (100.0%) | 257 (100.0%) |
| 65 to 74 Years | 192 (88.5%) | 94 (75.2%) |
| 75 Years and over | 43 (81.1%) | 135 (73.0%) |
| Total | 1,300 (85.9%) | 1,238 (80.5%) |
Income Below Poverty Among Married-Couple Families in Nesquehoning borough
The poverty statistics for married-couple families in Nesquehoning borough show that 18.0% or 84 of the total 467 families live below the poverty line. Families with 3 or 4 children have the highest poverty rate of 73.7%, comprising of 73 families. On the other hand, families with 1 or 2 children have the lowest poverty rate of 0.0%, which includes 0 families.

| Children | Above Poverty | Below Poverty |
| No Children | 211 (95.1%) | 11 (5.0%) |
| 1 or 2 Children | 146 (100.0%) | 0 (0.0%) |
| 3 or 4 Children | 26 (26.3%) | 73 (73.7%) |
| 5 or more Children | 0 (0.0%) | 0 (0.0%) |
| Total | 383 (82.0%) | 84 (18.0%) |
Income Below Poverty Among Single-Parent Households in Nesquehoning borough
According to the poverty data in Nesquehoning borough, 10.4% or 7 single-father households and 10.0% or 20 single-mother households are living below the poverty line. Among single-father households, those with 1 or 2 children have the highest poverty rate, with 7 households (100.0%) experiencing poverty. Likewise, among single-mother households, those with 1 or 2 children have the highest poverty rate, with 20 households (66.7%) falling below the poverty line.
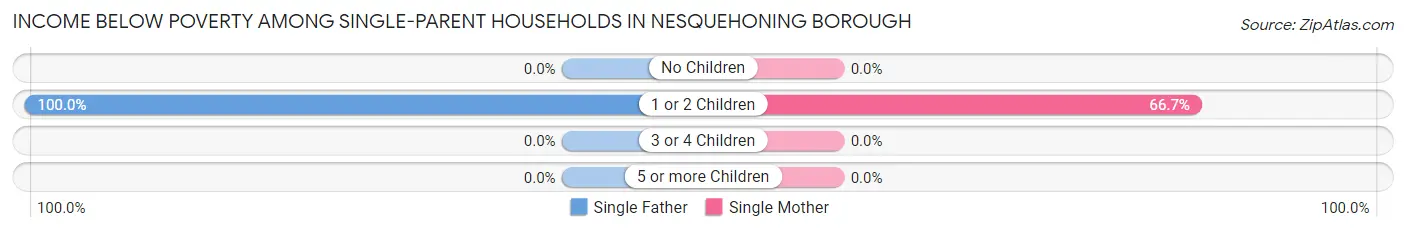
| Children | Single Father | Single Mother |
| No Children | 0 (0.0%) | 0 (0.0%) |
| 1 or 2 Children | 7 (100.0%) | 20 (66.7%) |
| 3 or 4 Children | 0 (0.0%) | 0 (0.0%) |
| 5 or more Children | 0 (0.0%) | 0 (0.0%) |
| Total | 7 (10.4%) | 20 (10.0%) |
Income Below Poverty Among Married-Couple vs Single-Parent Households in Nesquehoning borough
The poverty data for Nesquehoning borough shows that 84 of the married-couple family households (18.0%) and 27 of the single-parent households (10.1%) are living below the poverty level. Within the married-couple family households, those with 3 or 4 children have the highest poverty rate, with 73 households (73.7%) falling below the poverty line. Among the single-parent households, those with 1 or 2 children have the highest poverty rate, with 27 household (73.0%) living below poverty.
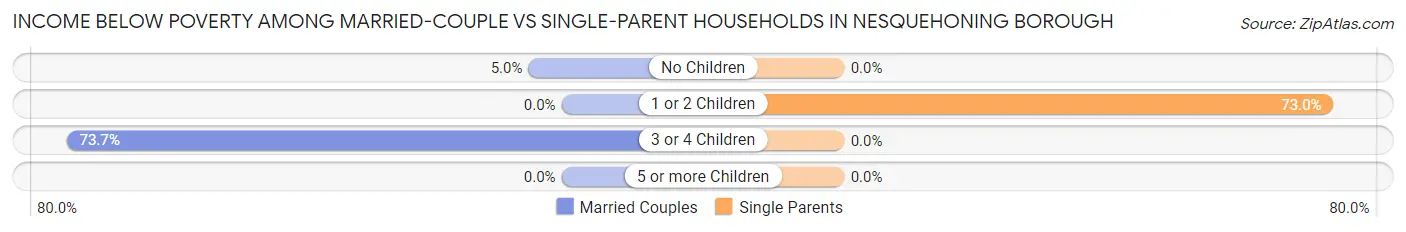
| Children | Married-Couple Families | Single-Parent Households |
| No Children | 11 (5.0%) | 0 (0.0%) |
| 1 or 2 Children | 0 (0.0%) | 27 (73.0%) |
| 3 or 4 Children | 73 (73.7%) | 0 (0.0%) |
| 5 or more Children | 0 (0.0%) | 0 (0.0%) |
| Total | 84 (18.0%) | 27 (10.1%) |
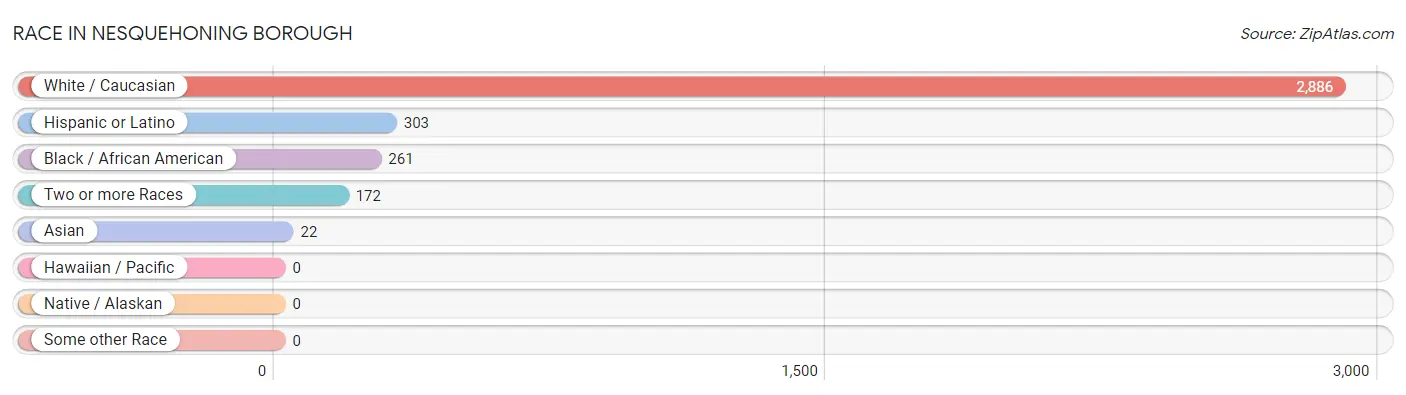
Race in Nesquehoning borough
The most populous races in Nesquehoning borough are White / Caucasian (2,886 | 86.4%), Hispanic or Latino (303 | 9.1%), and Black / African American (261 | 7.8%).
| Race | # Population | % Population |
| Asian | 22 | 0.7% |
| Black / African American | 261 | 7.8% |
| Hawaiian / Pacific | 0 | 0.0% |
| Hispanic or Latino | 303 | 9.1% |
| Native / Alaskan | 0 | 0.0% |
| White / Caucasian | 2,886 | 86.4% |
| Two or more Races | 172 | 5.1% |
| Some other Race | 0 | 0.0% |
| Total | 3,341 | 100.0% |
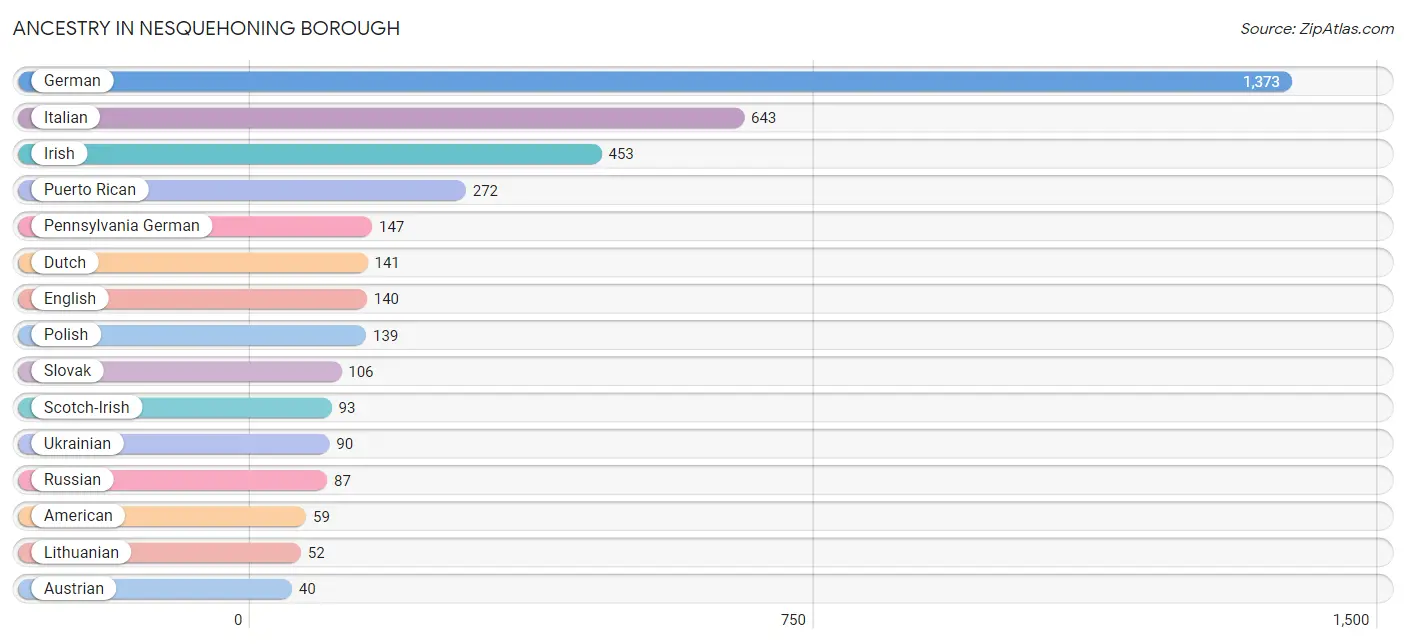
Ancestry in Nesquehoning borough
The most populous ancestries reported in Nesquehoning borough are German (1,373 | 41.1%), Italian (643 | 19.3%), Irish (453 | 13.6%), Puerto Rican (272 | 8.1%), and Pennsylvania German (147 | 4.4%), together accounting for 86.4% of all Nesquehoning borough residents.
| Ancestry | # Population | % Population |
| American | 59 | 1.8% |
| Austrian | 40 | 1.2% |
| Carpatho Rusyn | 11 | 0.3% |
| Cherokee | 4 | 0.1% |
| Colombian | 5 | 0.2% |
| Czech | 35 | 1.1% |
| Czechoslovakian | 10 | 0.3% |
| Dutch | 141 | 4.2% |
| Eastern European | 24 | 0.7% |
| English | 140 | 4.2% |
| French | 7 | 0.2% |
| German | 1,373 | 41.1% |
| Greek | 17 | 0.5% |
| Hungarian | 39 | 1.2% |
| Irish | 453 | 13.6% |
| Iroquois | 4 | 0.1% |
| Italian | 643 | 19.3% |
| Lithuanian | 52 | 1.6% |
| Mexican | 26 | 0.8% |
| Pennsylvania German | 147 | 4.4% |
| Polish | 139 | 4.2% |
| Puerto Rican | 272 | 8.1% |
| Russian | 87 | 2.6% |
| Scotch-Irish | 93 | 2.8% |
| Scottish | 4 | 0.1% |
| Slavic | 21 | 0.6% |
| Slovak | 106 | 3.2% |
| South American | 5 | 0.2% |
| Swedish | 18 | 0.5% |
| Ukrainian | 90 | 2.7% |
| Welsh | 31 | 0.9% | View All 31 Rows |
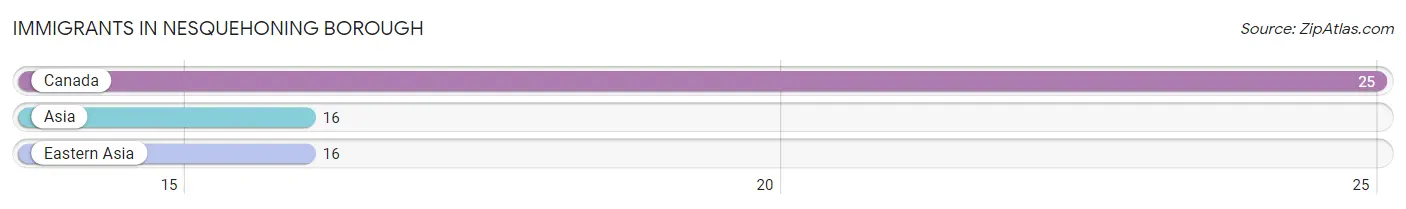
Immigrants in Nesquehoning borough
The most numerous immigrant groups reported in Nesquehoning borough came from Canada (25 | 0.7%), Asia (16 | 0.5%), and Eastern Asia (16 | 0.5%), together accounting for 1.7% of all Nesquehoning borough residents.
| Immigration Origin | # Population | % Population |
| Asia | 16 | 0.5% |
| Canada | 25 | 0.7% |
| Eastern Asia | 16 | 0.5% | View All 3 Rows |
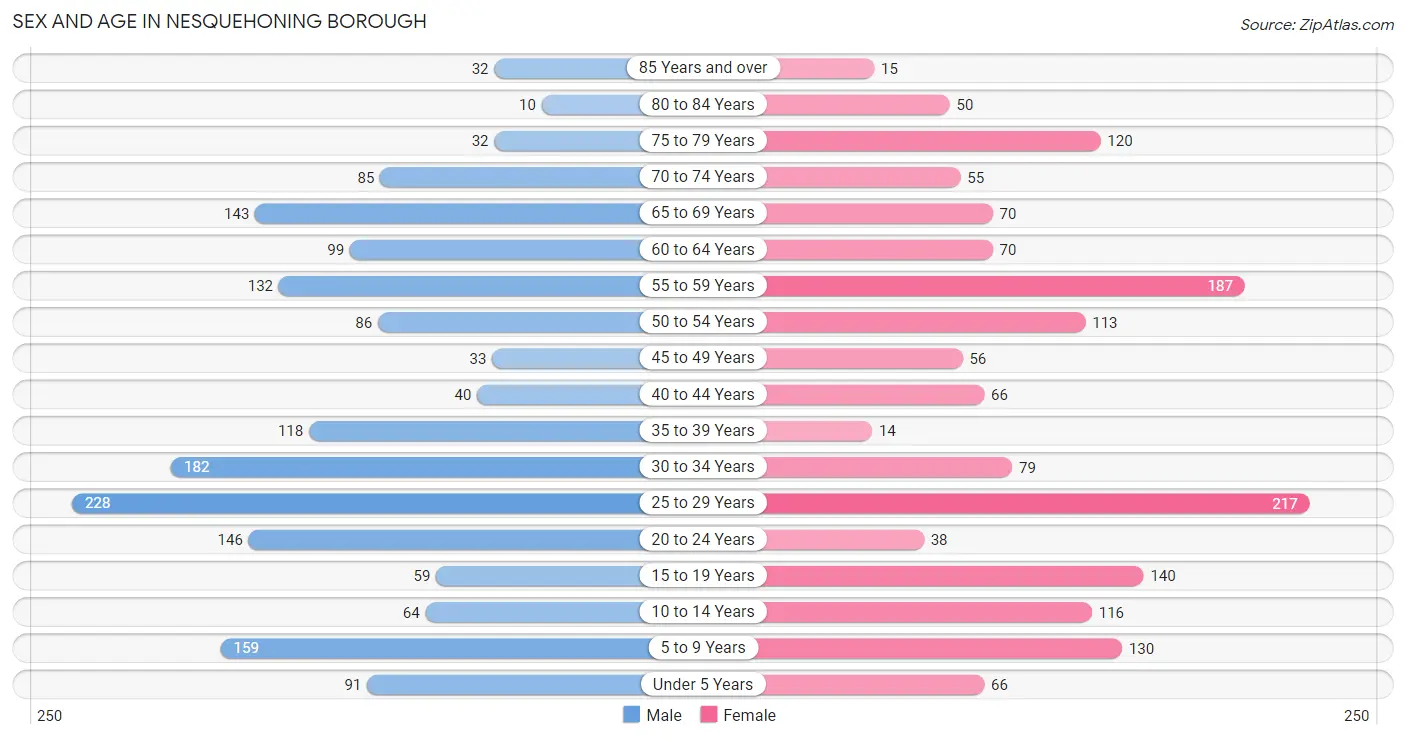
Sex and Age in Nesquehoning borough
Sex and Age in Nesquehoning borough
The most populous age groups in Nesquehoning borough are 25 to 29 Years (228 | 13.1%) for men and 25 to 29 Years (217 | 13.6%) for women.
| Age Bracket | Male | Female |
| Under 5 Years | 91 (5.2%) | 66 (4.1%) |
| 5 to 9 Years | 159 (9.1%) | 130 (8.1%) |
| 10 to 14 Years | 64 (3.7%) | 116 (7.2%) |
| 15 to 19 Years | 59 (3.4%) | 140 (8.7%) |
| 20 to 24 Years | 146 (8.4%) | 38 (2.4%) |
| 25 to 29 Years | 228 (13.1%) | 217 (13.6%) |
| 30 to 34 Years | 182 (10.5%) | 79 (4.9%) |
| 35 to 39 Years | 118 (6.8%) | 14 (0.9%) |
| 40 to 44 Years | 40 (2.3%) | 66 (4.1%) |
| 45 to 49 Years | 33 (1.9%) | 56 (3.5%) |
| 50 to 54 Years | 86 (5.0%) | 113 (7.0%) |
| 55 to 59 Years | 132 (7.6%) | 187 (11.7%) |
| 60 to 64 Years | 99 (5.7%) | 70 (4.4%) |
| 65 to 69 Years | 143 (8.2%) | 70 (4.4%) |
| 70 to 74 Years | 85 (4.9%) | 55 (3.4%) |
| 75 to 79 Years | 32 (1.8%) | 120 (7.5%) |
| 80 to 84 Years | 10 (0.6%) | 50 (3.1%) |
| 85 Years and over | 32 (1.8%) | 15 (0.9%) |
| Total | 1,739 (100.0%) | 1,602 (100.0%) |
Families and Households in Nesquehoning borough
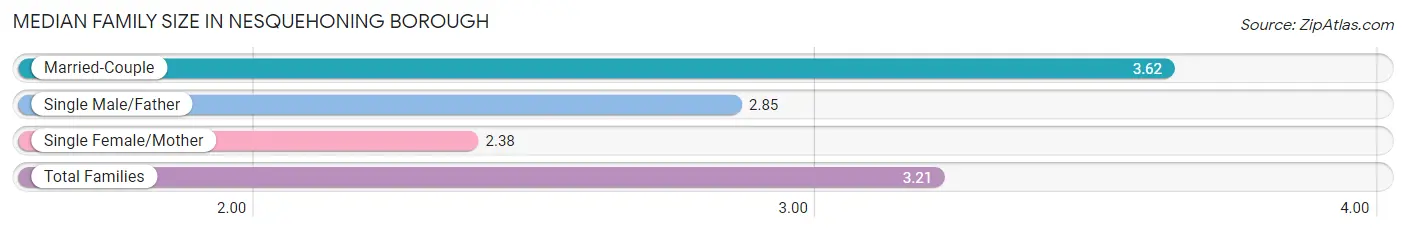
Median Family Size in Nesquehoning borough
The median family size in Nesquehoning borough is 3.21 persons per family, with married-couple families (467 | 63.6%) accounting for the largest median family size of 3.62 persons per family. On the other hand, single female/mother families (200 | 27.3%) represent the smallest median family size with 2.38 persons per family.
| Family Type | # Families | Family Size |
| Married-Couple | 467 (63.6%) | 3.62 |
| Single Male/Father | 67 (9.1%) | 2.85 |
| Single Female/Mother | 200 (27.3%) | 2.38 |
| Total Families | 734 (100.0%) | 3.21 |
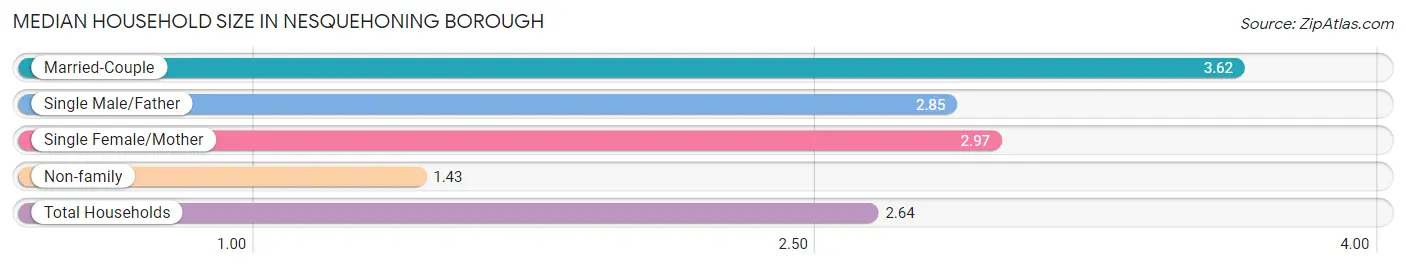
Median Household Size in Nesquehoning borough
The median household size in Nesquehoning borough is 2.64 persons per household, with married-couple households (467 | 39.5%) accounting for the largest median household size of 3.62 persons per household. non-family households (449 | 38.0%) represent the smallest median household size with 1.43 persons per household.
| Household Type | # Households | Household Size |
| Married-Couple | 467 (39.5%) | 3.62 |
| Single Male/Father | 67 (5.7%) | 2.85 |
| Single Female/Mother | 200 (16.9%) | 2.97 |
| Non-family | 449 (38.0%) | 1.43 |
| Total Households | 1,183 (100.0%) | 2.64 |
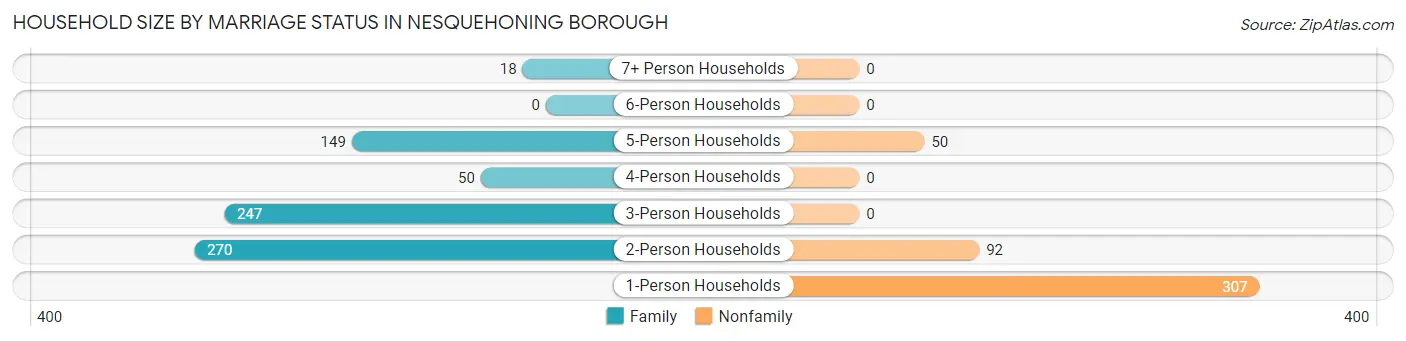
Household Size by Marriage Status in Nesquehoning borough
Out of a total of 1,183 households in Nesquehoning borough, 734 (62.1%) are family households, while 449 (38.0%) are nonfamily households. The most numerous type of family households are 2-person households, comprising 270, and the most common type of nonfamily households are 1-person households, comprising 307.
| Household Size | Family Households | Nonfamily Households |
| 1-Person Households | - | 307 (26.0%) |
| 2-Person Households | 270 (22.8%) | 92 (7.8%) |
| 3-Person Households | 247 (20.9%) | 0 (0.0%) |
| 4-Person Households | 50 (4.2%) | 0 (0.0%) |
| 5-Person Households | 149 (12.6%) | 50 (4.2%) |
| 6-Person Households | 0 (0.0%) | 0 (0.0%) |
| 7+ Person Households | 18 (1.5%) | 0 (0.0%) |
| Total | 734 (62.1%) | 449 (38.0%) |
Female Fertility in Nesquehoning borough
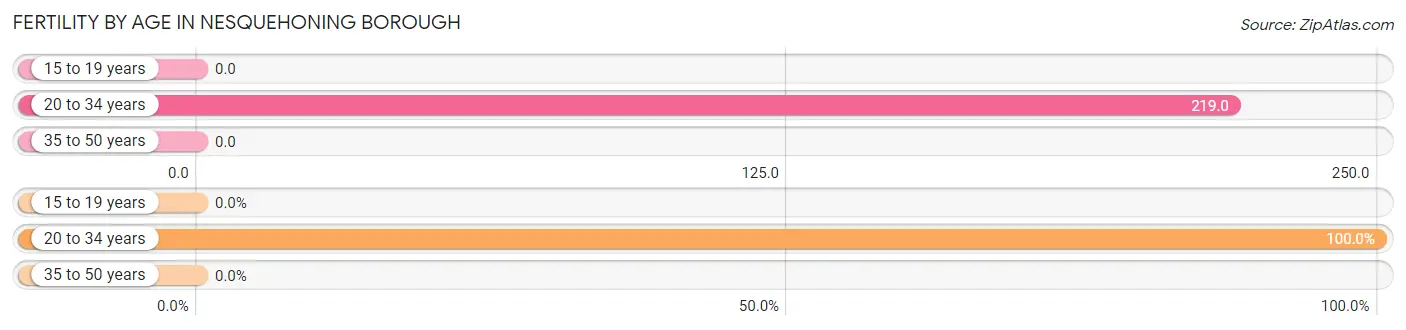
Fertility by Age in Nesquehoning borough
Average fertility rate in Nesquehoning borough is 116.0 births per 1,000 women. Women in the age bracket of 20 to 34 years have the highest fertility rate with 219.0 births per 1,000 women. Women in the age bracket of 20 to 34 years acount for 100.0% of all women with births.
| Age Bracket | Women with Births | Births / 1,000 Women |
| 15 to 19 years | 0 (0.0%) | 0.0 |
| 20 to 34 years | 73 (100.0%) | 219.0 |
| 35 to 50 years | 0 (0.0%) | 0.0 |
| Total | 73 (100.0%) | 116.0 |
Fertility by Age by Marriage Status in Nesquehoning borough
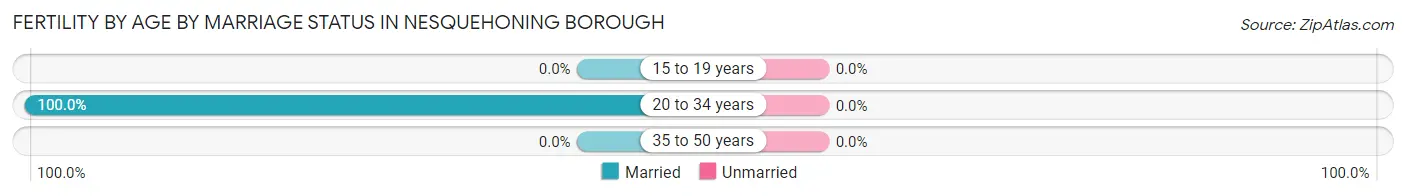
| Age Bracket | Married | Unmarried |
| 15 to 19 years | 0 (0.0%) | 0 (0.0%) |
| 20 to 34 years | 73 (100.0%) | 0 (0.0%) |
| 35 to 50 years | 0 (0.0%) | 0 (0.0%) |
| Total | 73 (100.0%) | 0 (0.0%) |
Fertility by Education in Nesquehoning borough
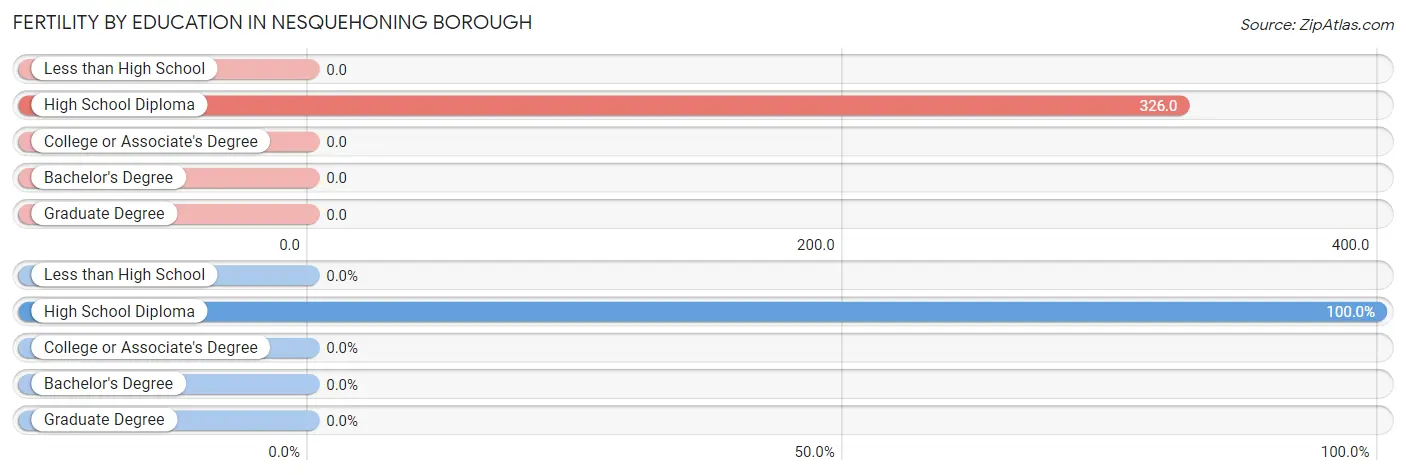
| Educational Attainment | Women with Births | Births / 1,000 Women |
| Less than High School | 0 (0.0%) | 0.0 |
| High School Diploma | 73 (100.0%) | 326.0 |
| College or Associate's Degree | 0 (0.0%) | 0.0 |
| Bachelor's Degree | 0 (0.0%) | 0.0 |
| Graduate Degree | 0 (0.0%) | 0.0 |
| Total | 73 (100.0%) | 116.0 |
Fertility by Education by Marriage Status in Nesquehoning borough
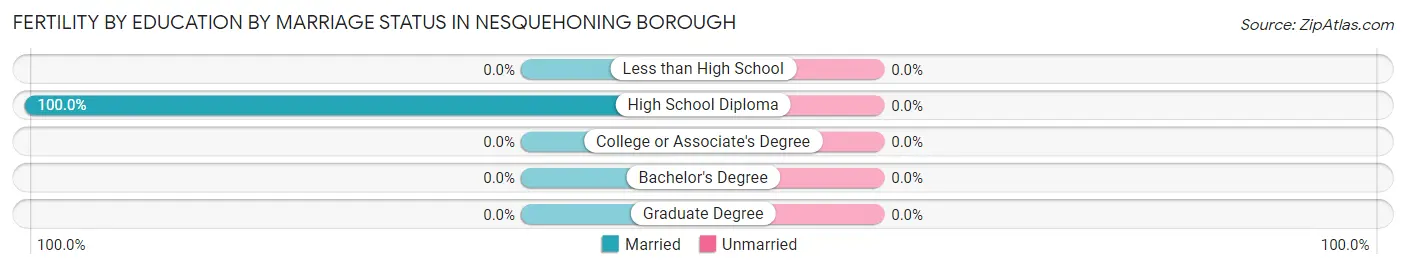
| Educational Attainment | Married | Unmarried |
| Less than High School | 0 (0.0%) | 0 (0.0%) |
| High School Diploma | 73 (100.0%) | 0 (0.0%) |
| College or Associate's Degree | 0 (0.0%) | 0 (0.0%) |
| Bachelor's Degree | 0 (0.0%) | 0 (0.0%) |
| Graduate Degree | 0 (0.0%) | 0 (0.0%) |
| Total | 73 (100.0%) | 0 (0.0%) |
Employment Characteristics in Nesquehoning borough
Employment by Class of Employer in Nesquehoning borough
Among the 1,129 employed individuals in Nesquehoning borough, private company employees (790 | 70.0%), not-for-profit organizations (206 | 18.2%), and self-employed (not incorporated) (53 | 4.7%) make up the most common classes of employment.
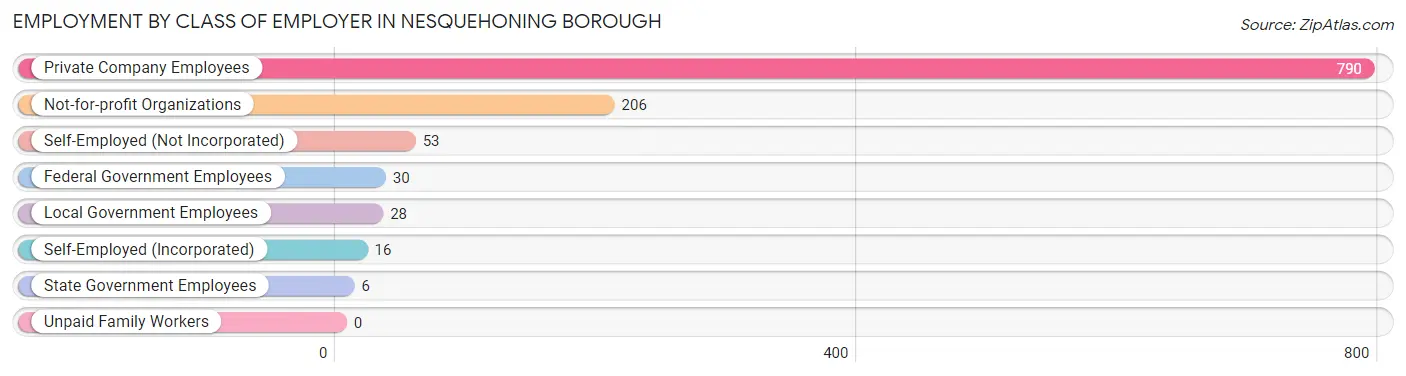
| Employer Class | # Employees | % Employees |
| Private Company Employees | 790 | 70.0% |
| Self-Employed (Incorporated) | 16 | 1.4% |
| Self-Employed (Not Incorporated) | 53 | 4.7% |
| Not-for-profit Organizations | 206 | 18.2% |
| Local Government Employees | 28 | 2.5% |
| State Government Employees | 6 | 0.5% |
| Federal Government Employees | 30 | 2.7% |
| Unpaid Family Workers | 0 | 0.0% |
| Total | 1,129 | 100.0% |
Employment Status by Age in Nesquehoning borough
According to the labor force statistics for Nesquehoning borough, out of the total population over 16 years of age (2,657), 57.1% or 1,517 individuals are in the labor force, with 14.8% or 225 of them unemployed. The age group with the highest labor force participation rate is 20 to 24 years, with 89.7% or 165 individuals in the labor force. Within the labor force, the 16 to 19 years age range has the highest percentage of unemployed individuals, with 65.1% or 28 of them being unemployed.
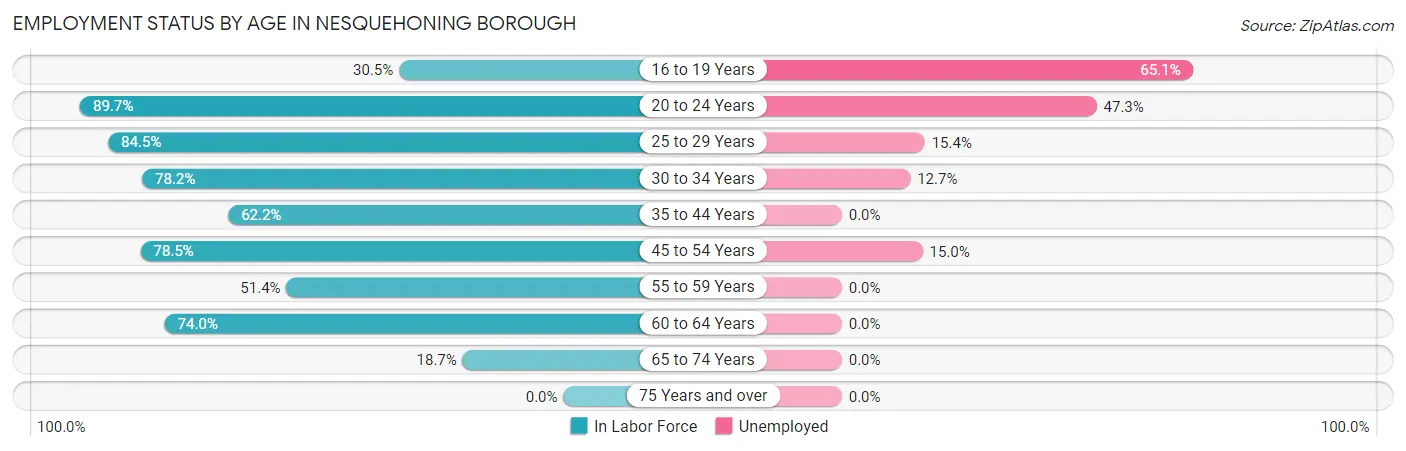
| Age Bracket | In Labor Force | Unemployed |
| 16 to 19 Years | 43 (30.5%) | 28 (65.1%) |
| 20 to 24 Years | 165 (89.7%) | 78 (47.3%) |
| 25 to 29 Years | 376 (84.5%) | 58 (15.4%) |
| 30 to 34 Years | 204 (78.2%) | 26 (12.7%) |
| 35 to 44 Years | 148 (62.2%) | 0 (0.0%) |
| 45 to 54 Years | 226 (78.5%) | 34 (15.0%) |
| 55 to 59 Years | 164 (51.4%) | 0 (0.0%) |
| 60 to 64 Years | 125 (74.0%) | 0 (0.0%) |
| 65 to 74 Years | 66 (18.7%) | 0 (0.0%) |
| 75 Years and over | 0 (0.0%) | 0 (0.0%) |
| Total | 1,517 (57.1%) | 225 (14.8%) |
Employment Status by Educational Attainment in Nesquehoning borough
According to labor force statistics for Nesquehoning borough, 72.3% of individuals (1,244) out of the total population between 25 and 64 years of age (1,720) are in the labor force, with 9.5% or 118 of them being unemployed. The group with the highest labor force participation rate are those with the educational attainment of bachelor's degree or higher, with 82.9% or 208 individuals in the labor force. Within the labor force, individuals with high school diploma education have the highest percentage of unemployment, with 11.1% or 72 of them being unemployed.
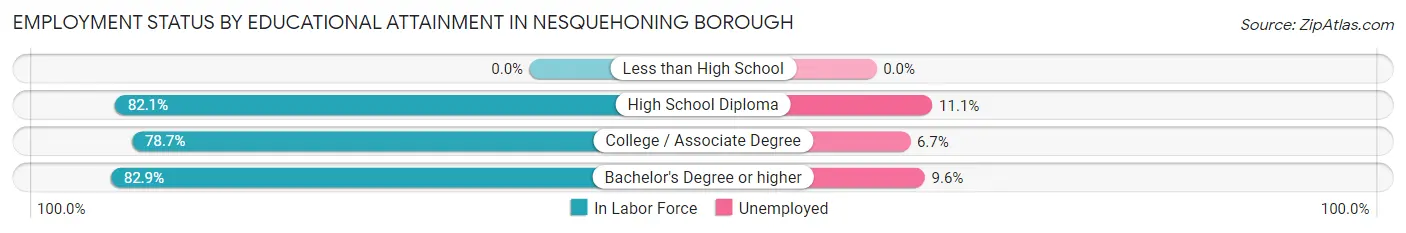
| Educational Attainment | In Labor Force | Unemployed |
| Less than High School | 0 (0.0%) | 0 (0.0%) |
| High School Diploma | 648 (82.1%) | 88 (11.1%) |
| College / Associate Degree | 387 (78.7%) | 33 (6.7%) |
| Bachelor's Degree or higher | 208 (82.9%) | 24 (9.6%) |
| Total | 1,244 (72.3%) | 163 (9.5%) |
Employment Occupations by Sex in Nesquehoning borough
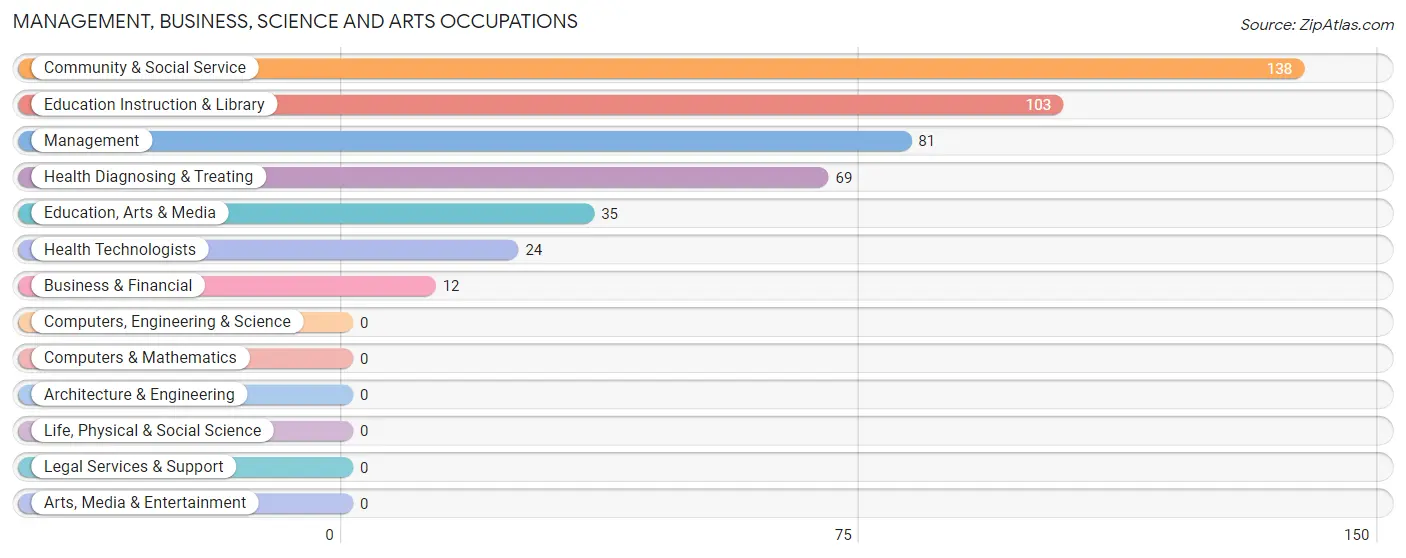
Management, Business, Science and Arts Occupations
The most common Management, Business, Science and Arts occupations in Nesquehoning borough are Community & Social Service (138 | 10.7%), Education Instruction & Library (103 | 8.0%), Management (81 | 6.3%), Health Diagnosing & Treating (69 | 5.3%), and Education, Arts & Media (35 | 2.7%).
Management, Business, Science and Arts Occupations by Sex
Within the Management, Business, Science and Arts occupations in Nesquehoning borough, the most male-oriented occupations are Business & Financial (100.0%), Education, Arts & Media (51.4%), and Management (39.5%), while the most female-oriented occupations are Health Technologists (100.0%), Health Diagnosing & Treating (85.5%), and Education Instruction & Library (77.7%).
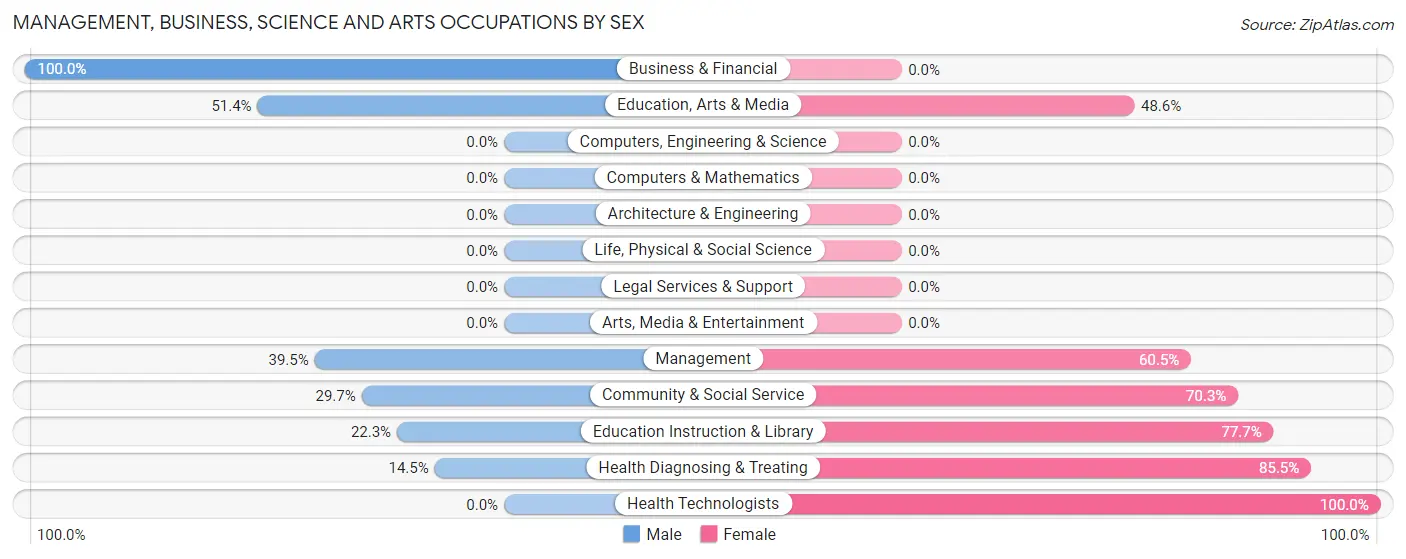
| Occupation | Male | Female |
| Management | 32 (39.5%) | 49 (60.5%) |
| Business & Financial | 12 (100.0%) | 0 (0.0%) |
| Computers, Engineering & Science | 0 (0.0%) | 0 (0.0%) |
| Computers & Mathematics | 0 (0.0%) | 0 (0.0%) |
| Architecture & Engineering | 0 (0.0%) | 0 (0.0%) |
| Life, Physical & Social Science | 0 (0.0%) | 0 (0.0%) |
| Community & Social Service | 41 (29.7%) | 97 (70.3%) |
| Education, Arts & Media | 18 (51.4%) | 17 (48.6%) |
| Legal Services & Support | 0 (0.0%) | 0 (0.0%) |
| Education Instruction & Library | 23 (22.3%) | 80 (77.7%) |
| Arts, Media & Entertainment | 0 (0.0%) | 0 (0.0%) |
| Health Diagnosing & Treating | 10 (14.5%) | 59 (85.5%) |
| Health Technologists | 0 (0.0%) | 24 (100.0%) |
| Total (Category) | 95 (31.7%) | 205 (68.3%) |
| Total (Overall) | 742 (57.4%) | 551 (42.6%) |
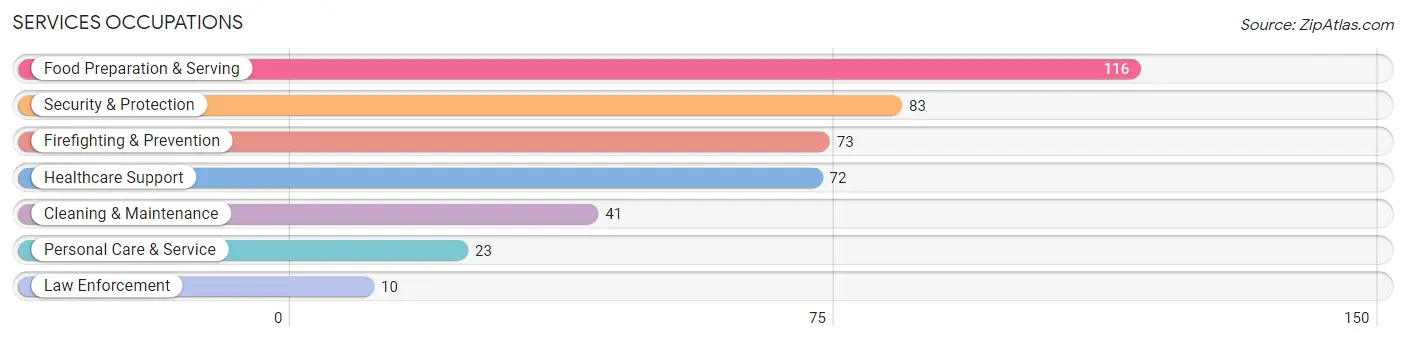
Services Occupations
The most common Services occupations in Nesquehoning borough are Food Preparation & Serving (116 | 9.0%), Security & Protection (83 | 6.4%), Firefighting & Prevention (73 | 5.7%), Healthcare Support (72 | 5.6%), and Cleaning & Maintenance (41 | 3.2%).
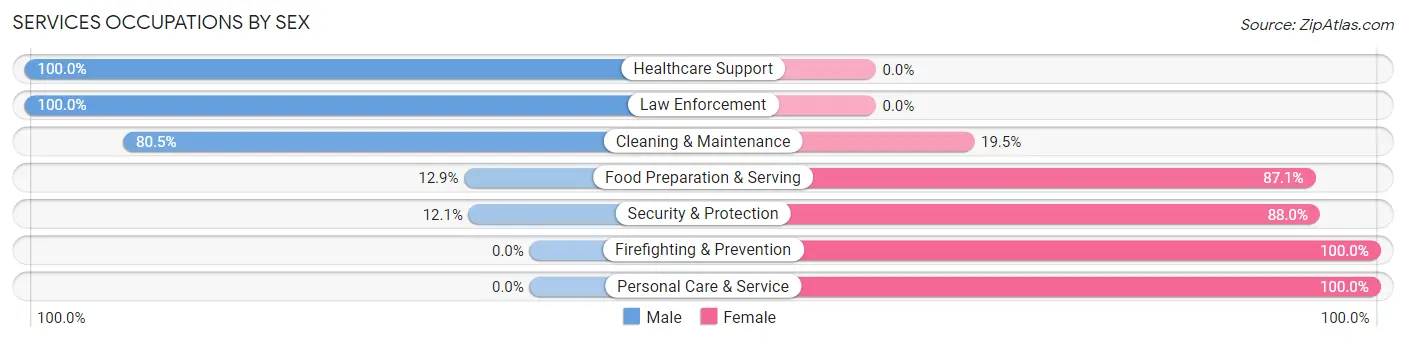
Services Occupations by Sex
Within the Services occupations in Nesquehoning borough, the most male-oriented occupations are Healthcare Support (100.0%), Law Enforcement (100.0%), and Cleaning & Maintenance (80.5%), while the most female-oriented occupations are Firefighting & Prevention (100.0%), Personal Care & Service (100.0%), and Security & Protection (87.9%).
| Occupation | Male | Female |
| Healthcare Support | 72 (100.0%) | 0 (0.0%) |
| Security & Protection | 10 (12.0%) | 73 (87.9%) |
| Firefighting & Prevention | 0 (0.0%) | 73 (100.0%) |
| Law Enforcement | 10 (100.0%) | 0 (0.0%) |
| Food Preparation & Serving | 15 (12.9%) | 101 (87.1%) |
| Cleaning & Maintenance | 33 (80.5%) | 8 (19.5%) |
| Personal Care & Service | 0 (0.0%) | 23 (100.0%) |
| Total (Category) | 130 (38.8%) | 205 (61.2%) |
| Total (Overall) | 742 (57.4%) | 551 (42.6%) |
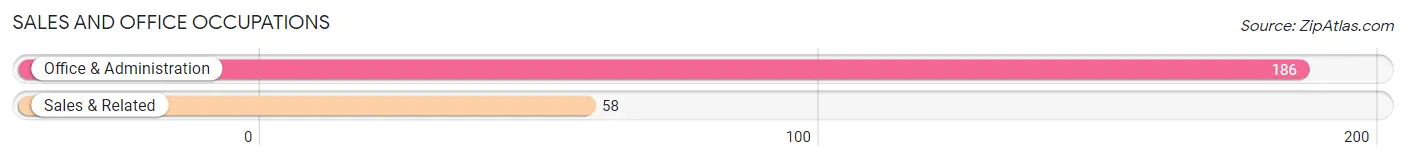
Sales and Office Occupations
The most common Sales and Office occupations in Nesquehoning borough are Office & Administration (186 | 14.4%), and Sales & Related (58 | 4.5%).
Sales and Office Occupations by Sex
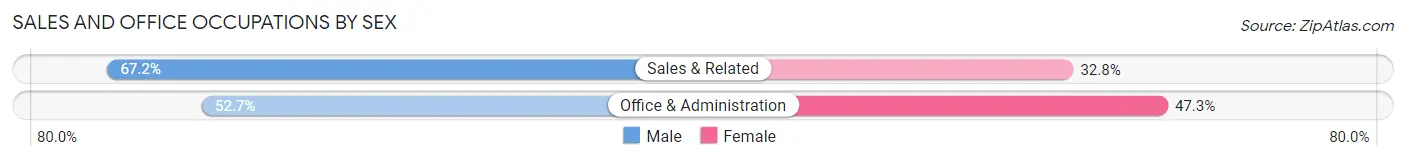
| Occupation | Male | Female |
| Sales & Related | 39 (67.2%) | 19 (32.8%) |
| Office & Administration | 98 (52.7%) | 88 (47.3%) |
| Total (Category) | 137 (56.1%) | 107 (43.9%) |
| Total (Overall) | 742 (57.4%) | 551 (42.6%) |
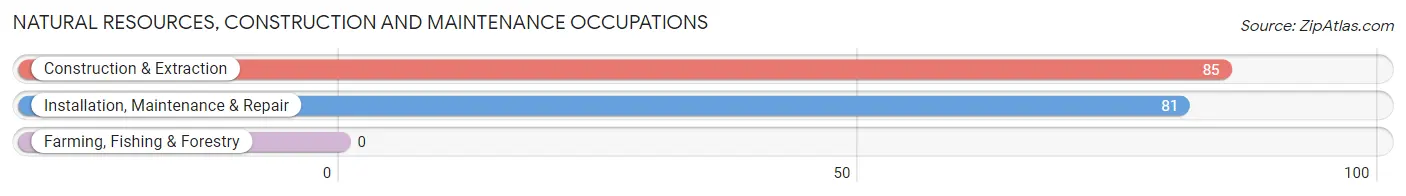
Natural Resources, Construction and Maintenance Occupations
The most common Natural Resources, Construction and Maintenance occupations in Nesquehoning borough are Construction & Extraction (85 | 6.6%), and Installation, Maintenance & Repair (81 | 6.3%).
Natural Resources, Construction and Maintenance Occupations by Sex
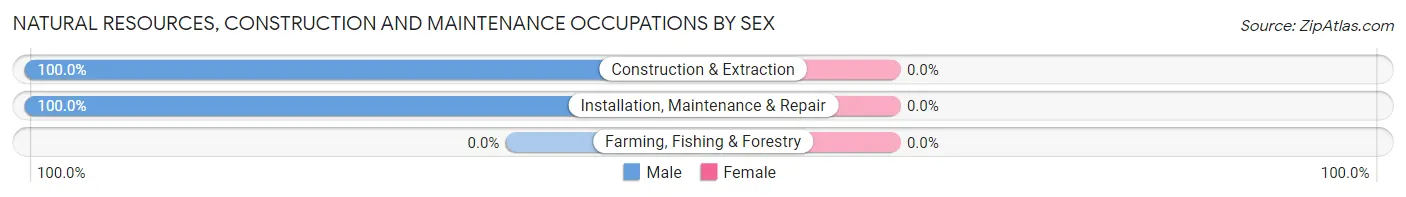
| Occupation | Male | Female |
| Farming, Fishing & Forestry | 0 (0.0%) | 0 (0.0%) |
| Construction & Extraction | 85 (100.0%) | 0 (0.0%) |
| Installation, Maintenance & Repair | 81 (100.0%) | 0 (0.0%) |
| Total (Category) | 166 (100.0%) | 0 (0.0%) |
| Total (Overall) | 742 (57.4%) | 551 (42.6%) |
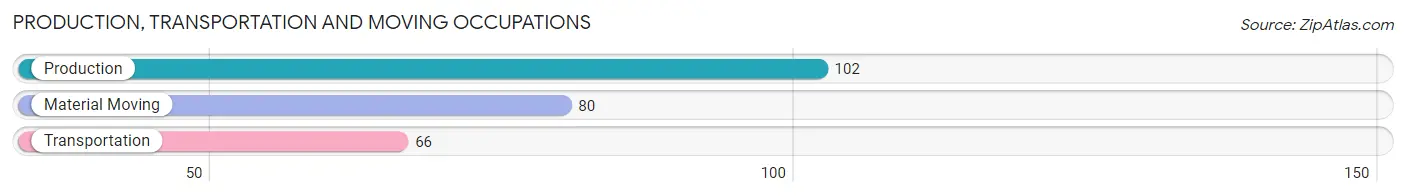
Production, Transportation and Moving Occupations
The most common Production, Transportation and Moving occupations in Nesquehoning borough are Production (102 | 7.9%), Material Moving (80 | 6.2%), and Transportation (66 | 5.1%).
Production, Transportation and Moving Occupations by Sex
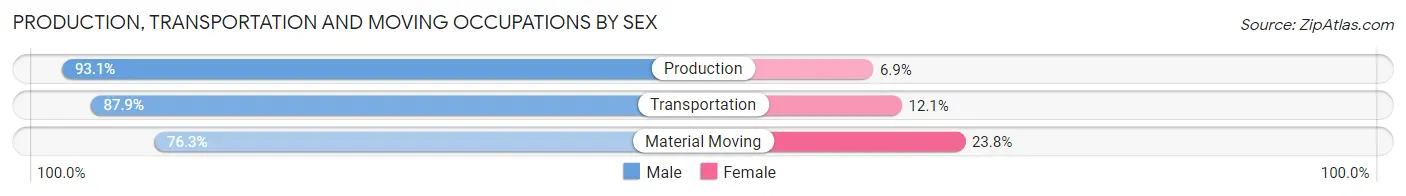
| Occupation | Male | Female |
| Production | 95 (93.1%) | 7 (6.9%) |
| Transportation | 58 (87.9%) | 8 (12.1%) |
| Material Moving | 61 (76.2%) | 19 (23.7%) |
| Total (Category) | 214 (86.3%) | 34 (13.7%) |
| Total (Overall) | 742 (57.4%) | 551 (42.6%) |
Employment Industries by Sex in Nesquehoning borough
Employment Industries in Nesquehoning borough
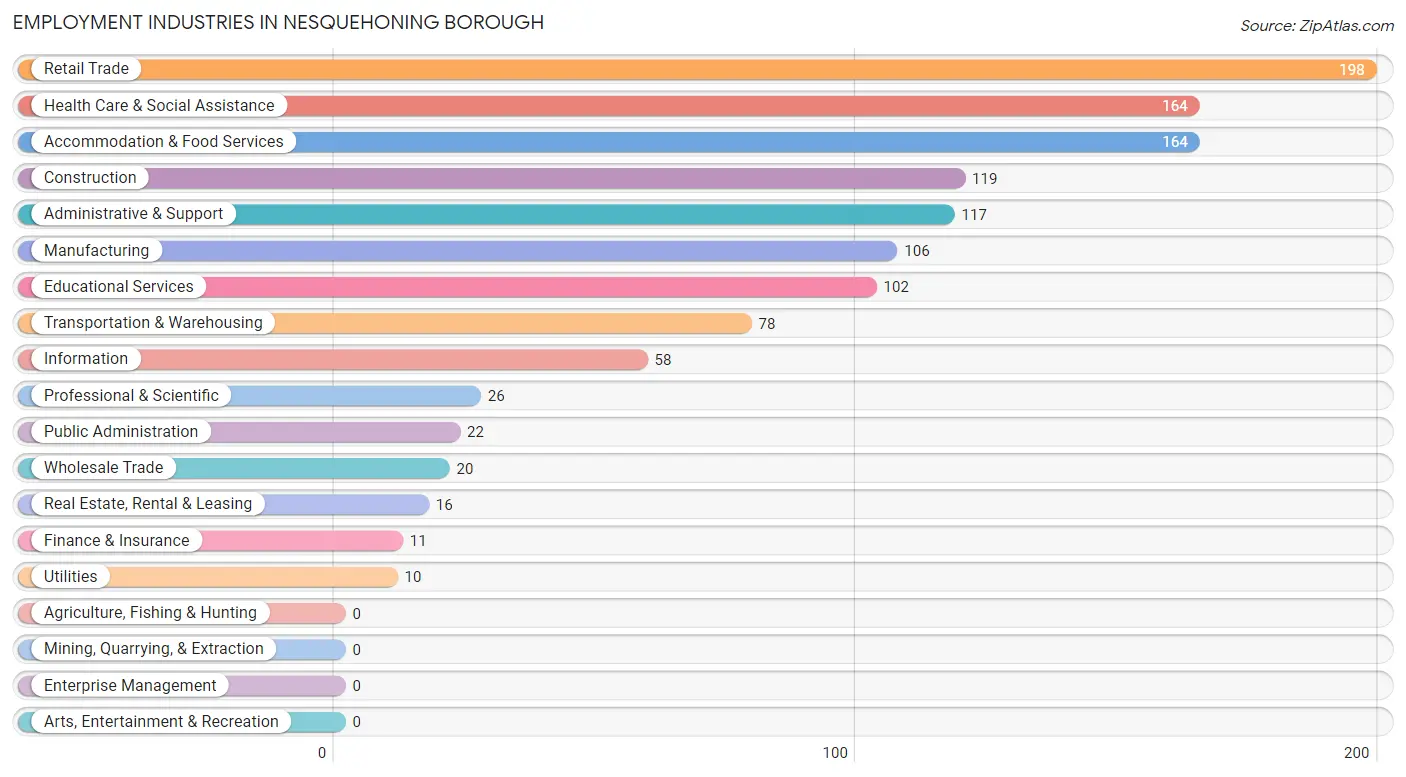
The major employment industries in Nesquehoning borough include Retail Trade (198 | 15.3%), Health Care & Social Assistance (164 | 12.7%), Accommodation & Food Services (164 | 12.7%), Construction (119 | 9.2%), and Administrative & Support (117 | 9.0%).
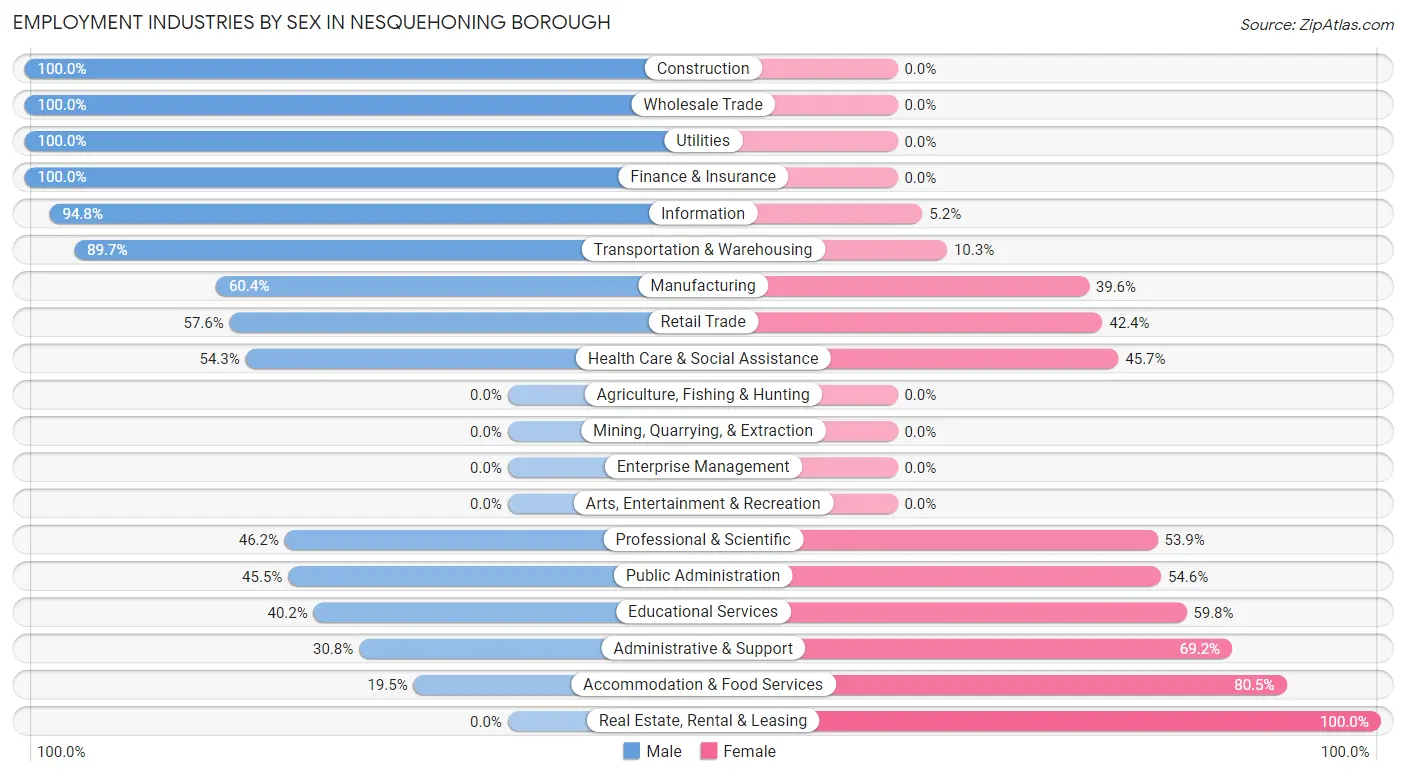
Employment Industries by Sex in Nesquehoning borough
The Nesquehoning borough industries that see more men than women are Construction (100.0%), Wholesale Trade (100.0%), and Utilities (100.0%), whereas the industries that tend to have a higher number of women are Real Estate, Rental & Leasing (100.0%), Accommodation & Food Services (80.5%), and Administrative & Support (69.2%).
| Industry | Male | Female |
| Agriculture, Fishing & Hunting | 0 (0.0%) | 0 (0.0%) |
| Mining, Quarrying, & Extraction | 0 (0.0%) | 0 (0.0%) |
| Construction | 119 (100.0%) | 0 (0.0%) |
| Manufacturing | 64 (60.4%) | 42 (39.6%) |
| Wholesale Trade | 20 (100.0%) | 0 (0.0%) |
| Retail Trade | 114 (57.6%) | 84 (42.4%) |
| Transportation & Warehousing | 70 (89.7%) | 8 (10.3%) |
| Utilities | 10 (100.0%) | 0 (0.0%) |
| Information | 55 (94.8%) | 3 (5.2%) |
| Finance & Insurance | 11 (100.0%) | 0 (0.0%) |
| Real Estate, Rental & Leasing | 0 (0.0%) | 16 (100.0%) |
| Professional & Scientific | 12 (46.2%) | 14 (53.8%) |
| Enterprise Management | 0 (0.0%) | 0 (0.0%) |
| Administrative & Support | 36 (30.8%) | 81 (69.2%) |
| Educational Services | 41 (40.2%) | 61 (59.8%) |
| Health Care & Social Assistance | 89 (54.3%) | 75 (45.7%) |
| Arts, Entertainment & Recreation | 0 (0.0%) | 0 (0.0%) |
| Accommodation & Food Services | 32 (19.5%) | 132 (80.5%) |
| Public Administration | 10 (45.5%) | 12 (54.5%) |
| Total | 742 (57.4%) | 551 (42.6%) |
Education in Nesquehoning borough
School Enrollment in Nesquehoning borough
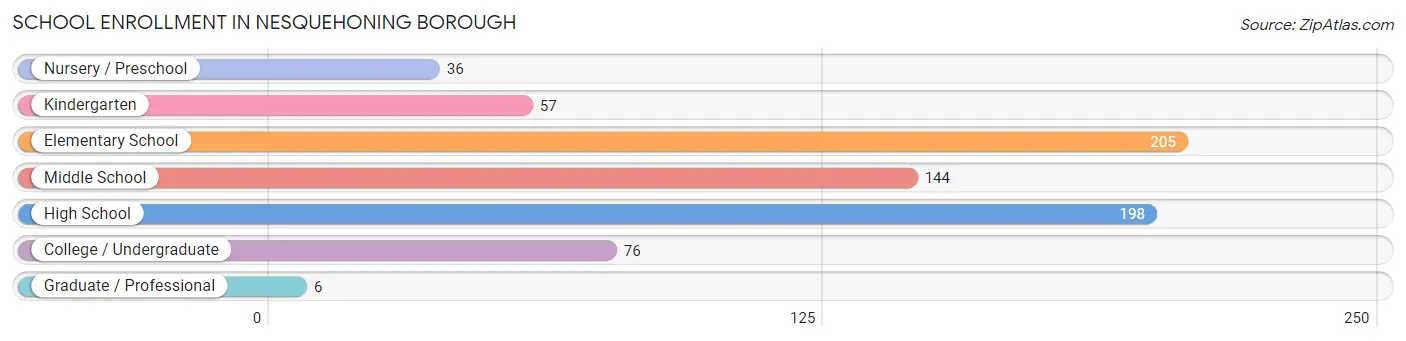
The most common levels of schooling among the 722 students in Nesquehoning borough are elementary school (205 | 28.4%), high school (198 | 27.4%), and middle school (144 | 19.9%).
| School Level | # Students | % Students |
| Nursery / Preschool | 36 | 5.0% |
| Kindergarten | 57 | 7.9% |
| Elementary School | 205 | 28.4% |
| Middle School | 144 | 19.9% |
| High School | 198 | 27.4% |
| College / Undergraduate | 76 | 10.5% |
| Graduate / Professional | 6 | 0.8% |
| Total | 722 | 100.0% |
School Enrollment by Age by Funding Source in Nesquehoning borough
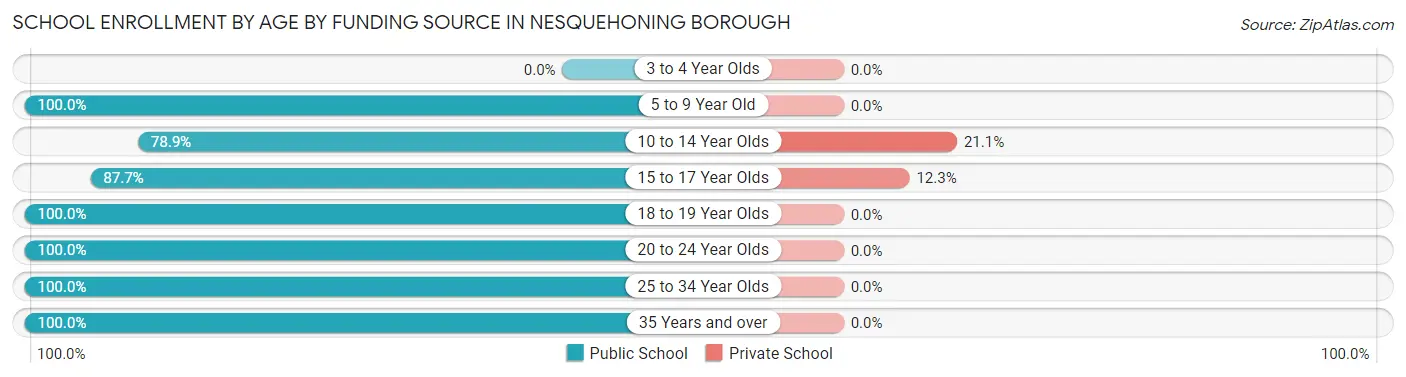
Out of a total of 722 students who are enrolled in schools in Nesquehoning borough, 57 (7.9%) attend a private institution, while the remaining 665 (92.1%) are enrolled in public schools. The age group of 10 to 14 year olds has the highest likelihood of being enrolled in private schools, with 38 (21.1% in the age bracket) enrolled. Conversely, the age group of 5 to 9 year old has the lowest likelihood of being enrolled in a private school, with 289 (100.0% in the age bracket) attending a public institution.
| Age Bracket | Public School | Private School |
| 3 to 4 Year Olds | 0 (0.0%) | 0 (0.0%) |
| 5 to 9 Year Old | 289 (100.0%) | 0 (0.0%) |
| 10 to 14 Year Olds | 142 (78.9%) | 38 (21.1%) |
| 15 to 17 Year Olds | 136 (87.7%) | 19 (12.3%) |
| 18 to 19 Year Olds | 16 (100.0%) | 0 (0.0%) |
| 20 to 24 Year Olds | 38 (100.0%) | 0 (0.0%) |
| 25 to 34 Year Olds | 16 (100.0%) | 0 (0.0%) |
| 35 Years and over | 28 (100.0%) | 0 (0.0%) |
| Total | 665 (92.1%) | 57 (7.9%) |
Educational Attainment by Field of Study in Nesquehoning borough
Education (83 | 22.1%), arts & humanities (69 | 18.3%), business (54 | 14.4%), multidisciplinary studies (37 | 9.8%), and literature & languages (32 | 8.5%) are the most common fields of study among 376 individuals in Nesquehoning borough who have obtained a bachelor's degree or higher.
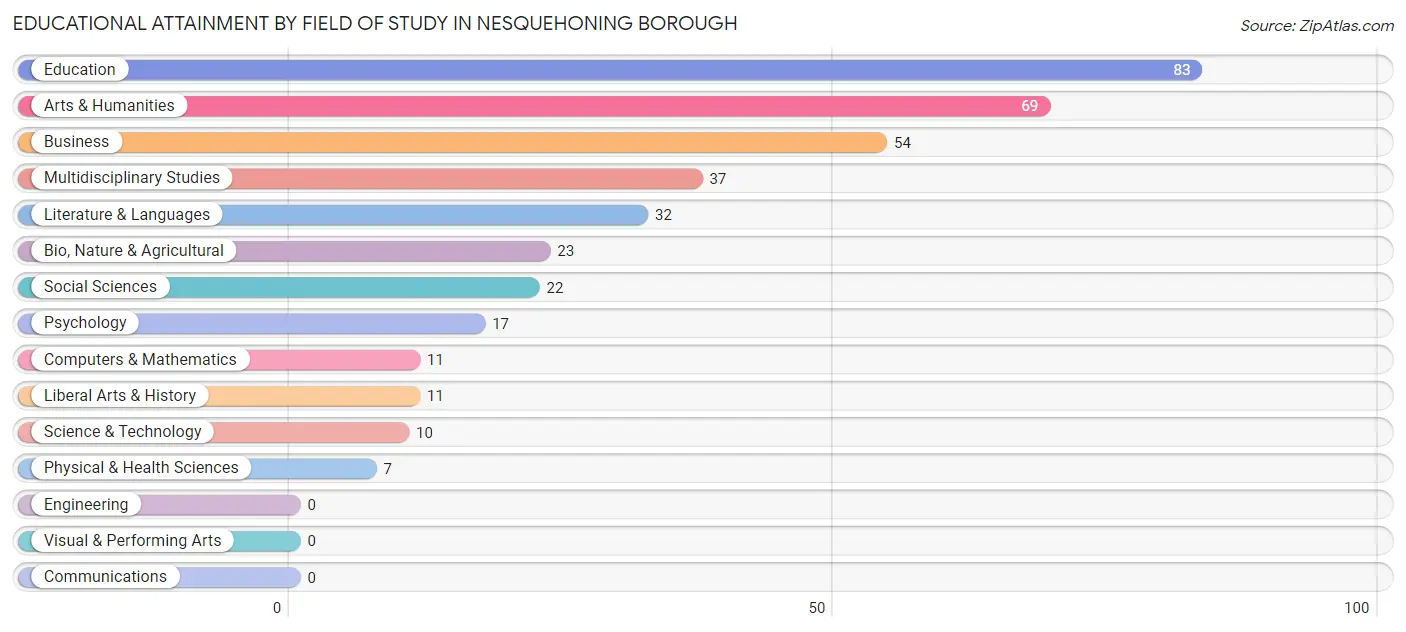
| Field of Study | # Graduates | % Graduates |
| Computers & Mathematics | 11 | 2.9% |
| Bio, Nature & Agricultural | 23 | 6.1% |
| Physical & Health Sciences | 7 | 1.9% |
| Psychology | 17 | 4.5% |
| Social Sciences | 22 | 5.9% |
| Engineering | 0 | 0.0% |
| Multidisciplinary Studies | 37 | 9.8% |
| Science & Technology | 10 | 2.7% |
| Business | 54 | 14.4% |
| Education | 83 | 22.1% |
| Literature & Languages | 32 | 8.5% |
| Liberal Arts & History | 11 | 2.9% |
| Visual & Performing Arts | 0 | 0.0% |
| Communications | 0 | 0.0% |
| Arts & Humanities | 69 | 18.3% |
| Total | 376 | 100.0% |
Transportation & Commute in Nesquehoning borough
Vehicle Availability by Sex in Nesquehoning borough
The most prevalent vehicle ownership categories in Nesquehoning borough are males with 1 vehicle (264, accounting for 38.1%) and females with 1 vehicle (127, making up 60.6%).
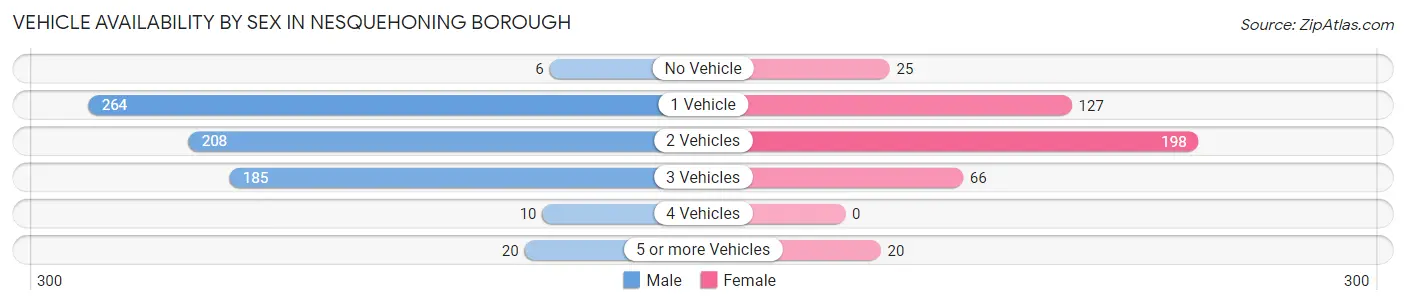
| Vehicles Available | Male | Female |
| No Vehicle | 6 (0.9%) | 25 (5.7%) |
| 1 Vehicle | 264 (38.1%) | 127 (29.1%) |
| 2 Vehicles | 208 (30.0%) | 198 (45.4%) |
| 3 Vehicles | 185 (26.7%) | 66 (15.1%) |
| 4 Vehicles | 10 (1.4%) | 0 (0.0%) |
| 5 or more Vehicles | 20 (2.9%) | 20 (4.6%) |
| Total | 693 (100.0%) | 436 (100.0%) |
Commute Time in Nesquehoning borough
The most frequently occuring commute durations in Nesquehoning borough are 20 to 24 minutes (274 commuters, 24.3%), 45 to 59 minutes (170 commuters, 15.1%), and 60 to 89 minutes (154 commuters, 13.6%).
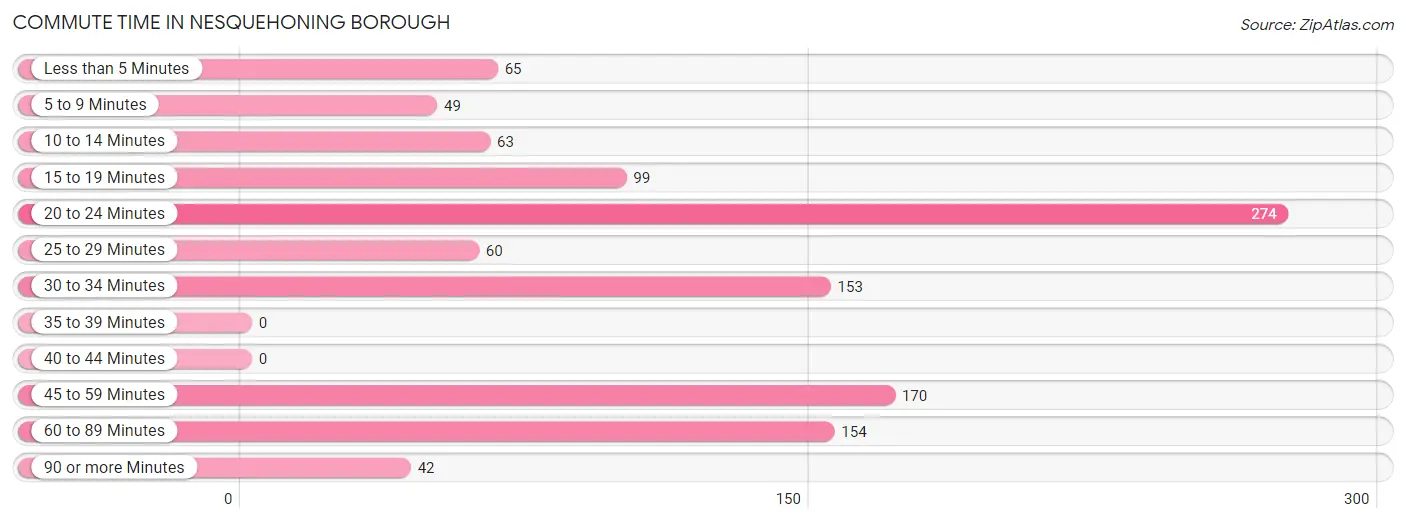
| Commute Time | # Commuters | % Commuters |
| Less than 5 Minutes | 65 | 5.8% |
| 5 to 9 Minutes | 49 | 4.3% |
| 10 to 14 Minutes | 63 | 5.6% |
| 15 to 19 Minutes | 99 | 8.8% |
| 20 to 24 Minutes | 274 | 24.3% |
| 25 to 29 Minutes | 60 | 5.3% |
| 30 to 34 Minutes | 153 | 13.6% |
| 35 to 39 Minutes | 0 | 0.0% |
| 40 to 44 Minutes | 0 | 0.0% |
| 45 to 59 Minutes | 170 | 15.1% |
| 60 to 89 Minutes | 154 | 13.6% |
| 90 or more Minutes | 42 | 3.7% |
Commute Time by Sex in Nesquehoning borough
The most common commute times in Nesquehoning borough are 20 to 24 minutes (147 commuters, 21.2%) for males and 20 to 24 minutes (127 commuters, 29.1%) for females.
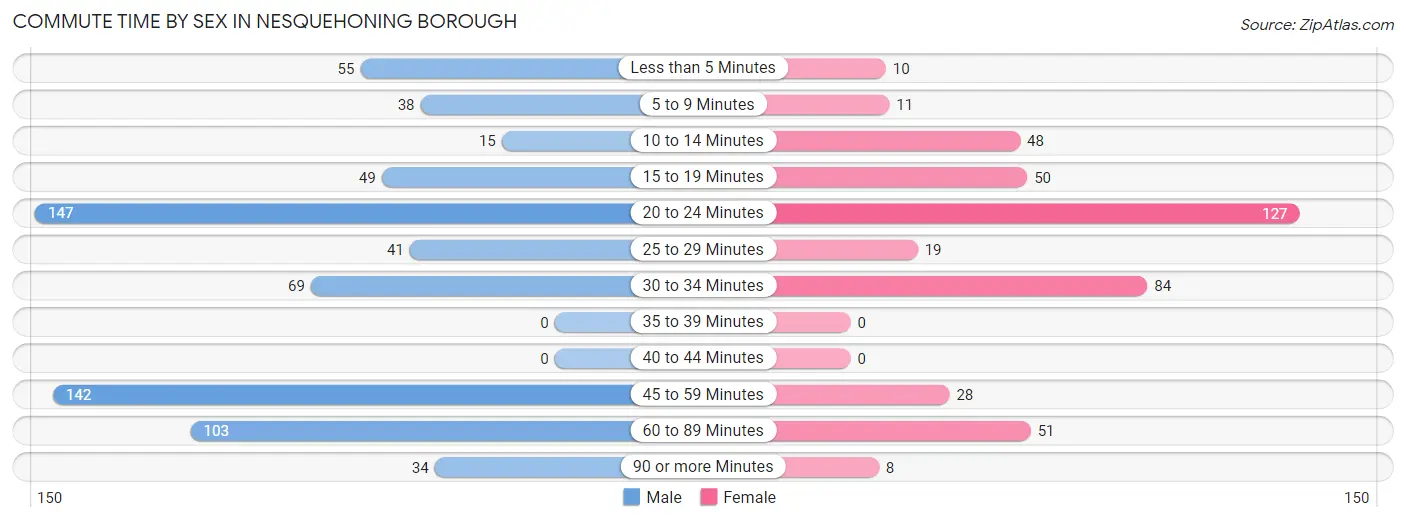
| Commute Time | Male | Female |
| Less than 5 Minutes | 55 (7.9%) | 10 (2.3%) |
| 5 to 9 Minutes | 38 (5.5%) | 11 (2.5%) |
| 10 to 14 Minutes | 15 (2.2%) | 48 (11.0%) |
| 15 to 19 Minutes | 49 (7.1%) | 50 (11.5%) |
| 20 to 24 Minutes | 147 (21.2%) | 127 (29.1%) |
| 25 to 29 Minutes | 41 (5.9%) | 19 (4.4%) |
| 30 to 34 Minutes | 69 (10.0%) | 84 (19.3%) |
| 35 to 39 Minutes | 0 (0.0%) | 0 (0.0%) |
| 40 to 44 Minutes | 0 (0.0%) | 0 (0.0%) |
| 45 to 59 Minutes | 142 (20.5%) | 28 (6.4%) |
| 60 to 89 Minutes | 103 (14.9%) | 51 (11.7%) |
| 90 or more Minutes | 34 (4.9%) | 8 (1.8%) |
Time of Departure to Work by Sex in Nesquehoning borough
The most frequent times of departure to work in Nesquehoning borough are 7:00 AM to 7:29 AM (312, 45.0%) for males and 8:00 AM to 8:29 AM (99, 22.7%) for females.
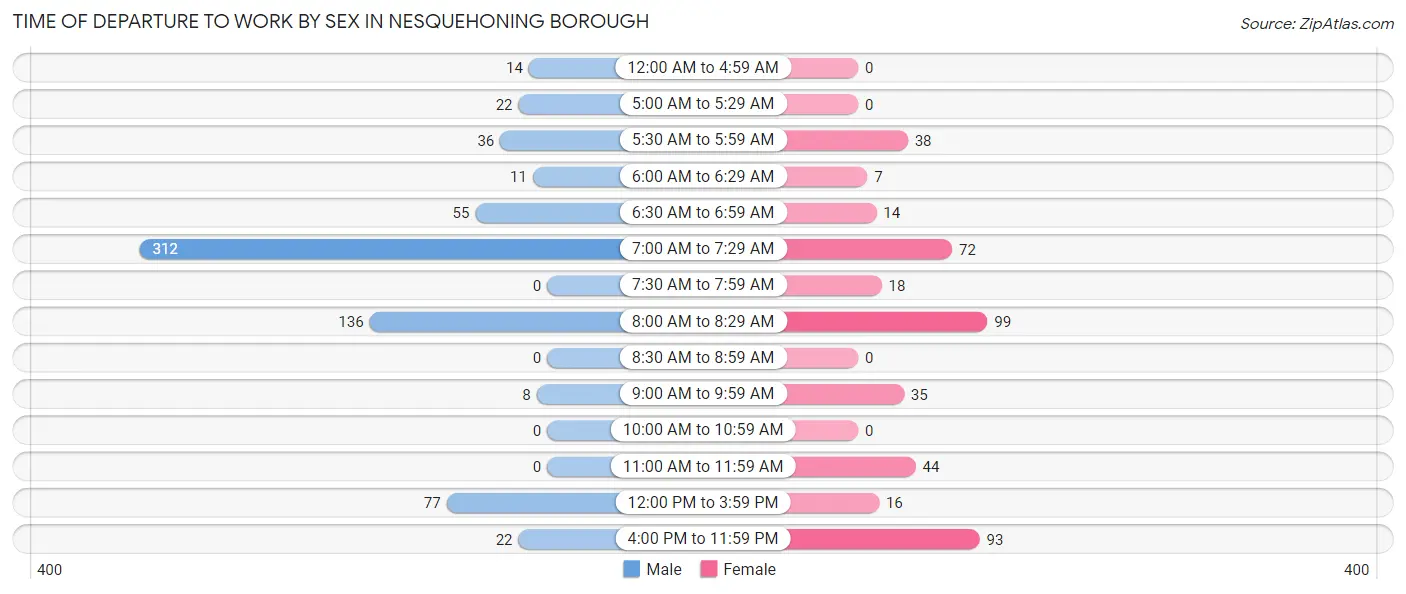
| Time of Departure | Male | Female |
| 12:00 AM to 4:59 AM | 14 (2.0%) | 0 (0.0%) |
| 5:00 AM to 5:29 AM | 22 (3.2%) | 0 (0.0%) |
| 5:30 AM to 5:59 AM | 36 (5.2%) | 38 (8.7%) |
| 6:00 AM to 6:29 AM | 11 (1.6%) | 7 (1.6%) |
| 6:30 AM to 6:59 AM | 55 (7.9%) | 14 (3.2%) |
| 7:00 AM to 7:29 AM | 312 (45.0%) | 72 (16.5%) |
| 7:30 AM to 7:59 AM | 0 (0.0%) | 18 (4.1%) |
| 8:00 AM to 8:29 AM | 136 (19.6%) | 99 (22.7%) |
| 8:30 AM to 8:59 AM | 0 (0.0%) | 0 (0.0%) |
| 9:00 AM to 9:59 AM | 8 (1.1%) | 35 (8.0%) |
| 10:00 AM to 10:59 AM | 0 (0.0%) | 0 (0.0%) |
| 11:00 AM to 11:59 AM | 0 (0.0%) | 44 (10.1%) |
| 12:00 PM to 3:59 PM | 77 (11.1%) | 16 (3.7%) |
| 4:00 PM to 11:59 PM | 22 (3.2%) | 93 (21.3%) |
| Total | 693 (100.0%) | 436 (100.0%) |
Housing Occupancy in Nesquehoning borough
Occupancy by Ownership in Nesquehoning borough
Of the total 1,183 dwellings in Nesquehoning borough, owner-occupied units account for 678 (57.3%), while renter-occupied units make up 505 (42.7%).
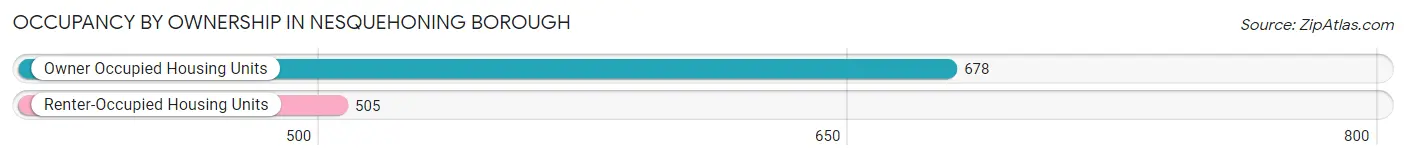
| Occupancy | # Housing Units | % Housing Units |
| Owner Occupied Housing Units | 678 | 57.3% |
| Renter-Occupied Housing Units | 505 | 42.7% |
| Total Occupied Housing Units | 1,183 | 100.0% |
Occupancy by Household Size in Nesquehoning borough
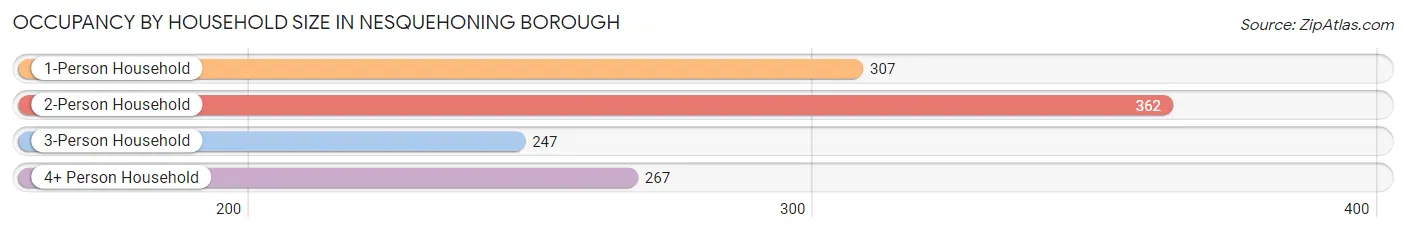
| Household Size | # Housing Units | % Housing Units |
| 1-Person Household | 307 | 26.0% |
| 2-Person Household | 362 | 30.6% |
| 3-Person Household | 247 | 20.9% |
| 4+ Person Household | 267 | 22.6% |
| Total Housing Units | 1,183 | 100.0% |
Occupancy by Ownership by Household Size in Nesquehoning borough
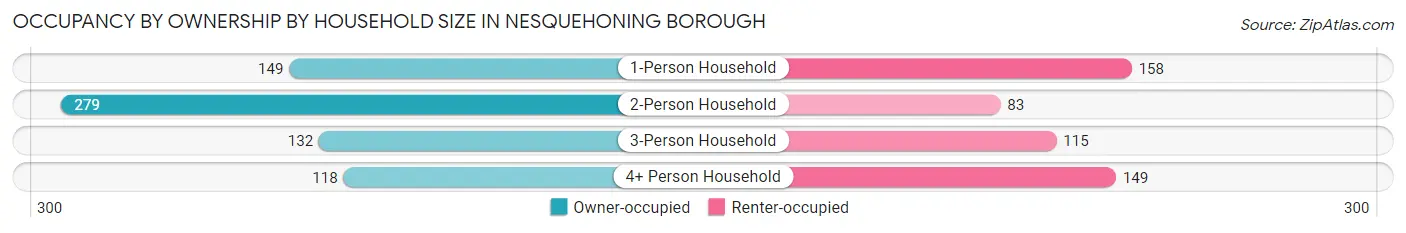
| Household Size | Owner-occupied | Renter-occupied |
| 1-Person Household | 149 (48.5%) | 158 (51.5%) |
| 2-Person Household | 279 (77.1%) | 83 (22.9%) |
| 3-Person Household | 132 (53.4%) | 115 (46.6%) |
| 4+ Person Household | 118 (44.2%) | 149 (55.8%) |
| Total Housing Units | 678 (57.3%) | 505 (42.7%) |
Occupancy by Educational Attainment in Nesquehoning borough
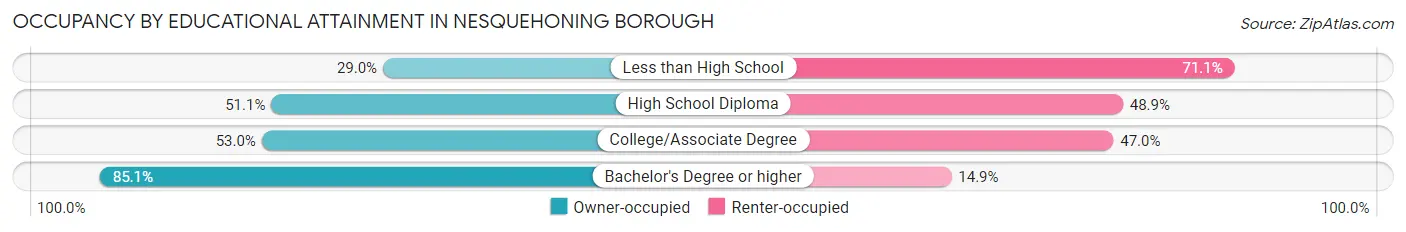
| Household Size | Owner-occupied | Renter-occupied |
| Less than High School | 11 (28.9%) | 27 (71.1%) |
| High School Diploma | 349 (51.1%) | 334 (48.9%) |
| College/Associate Degree | 124 (53.0%) | 110 (47.0%) |
| Bachelor's Degree or higher | 194 (85.1%) | 34 (14.9%) |
Occupancy by Age of Householder in Nesquehoning borough

| Age Bracket | # Households | % Households |
| Under 35 Years | 332 | 28.1% |
| 35 to 44 Years | 88 | 7.4% |
| 45 to 54 Years | 137 | 11.6% |
| 55 to 64 Years | 199 | 16.8% |
| 65 to 74 Years | 225 | 19.0% |
| 75 to 84 Years | 173 | 14.6% |
| 85 Years and Over | 29 | 2.5% |
| Total | 1,183 | 100.0% |
Housing Finances in Nesquehoning borough
Median Income by Occupancy in Nesquehoning borough
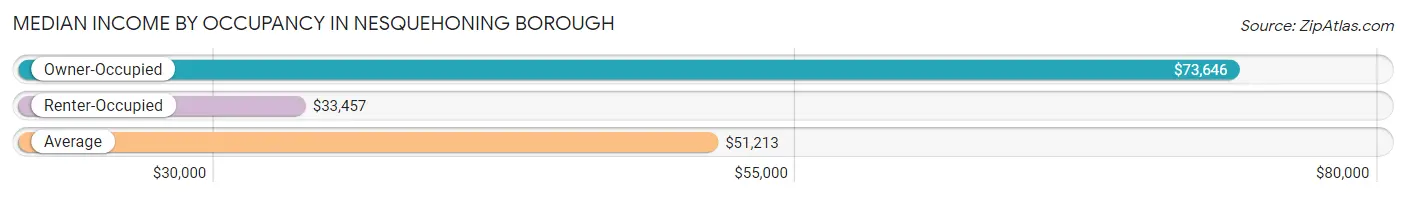
| Occupancy Type | # Households | Median Income |
| Owner-Occupied | 678 (57.3%) | $73,646 |
| Renter-Occupied | 505 (42.7%) | $33,457 |
| Average | 1,183 (100.0%) | $51,213 |
Occupancy by Householder Income Bracket in Nesquehoning borough
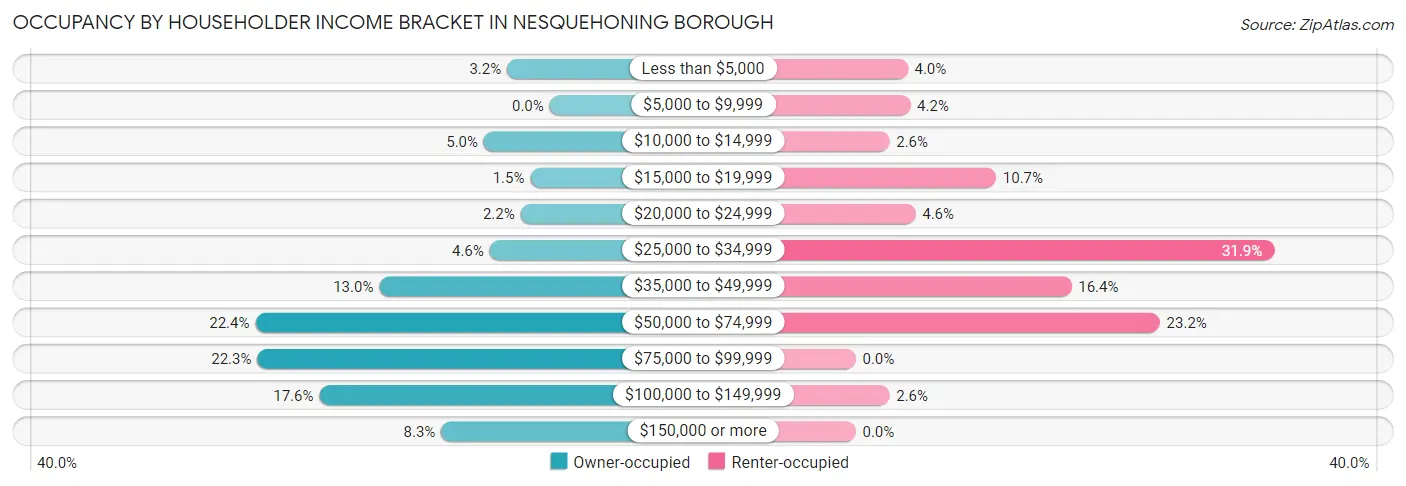
| Income Bracket | Owner-occupied | Renter-occupied |
| Less than $5,000 | 22 (3.2%) | 20 (4.0%) |
| $5,000 to $9,999 | 0 (0.0%) | 21 (4.2%) |
| $10,000 to $14,999 | 34 (5.0%) | 13 (2.6%) |
| $15,000 to $19,999 | 10 (1.5%) | 54 (10.7%) |
| $20,000 to $24,999 | 15 (2.2%) | 23 (4.5%) |
| $25,000 to $34,999 | 31 (4.6%) | 161 (31.9%) |
| $35,000 to $49,999 | 88 (13.0%) | 83 (16.4%) |
| $50,000 to $74,999 | 152 (22.4%) | 117 (23.2%) |
| $75,000 to $99,999 | 151 (22.3%) | 0 (0.0%) |
| $100,000 to $149,999 | 119 (17.5%) | 13 (2.6%) |
| $150,000 or more | 56 (8.3%) | 0 (0.0%) |
| Total | 678 (100.0%) | 505 (100.0%) |
Monthly Housing Cost Tiers in Nesquehoning borough
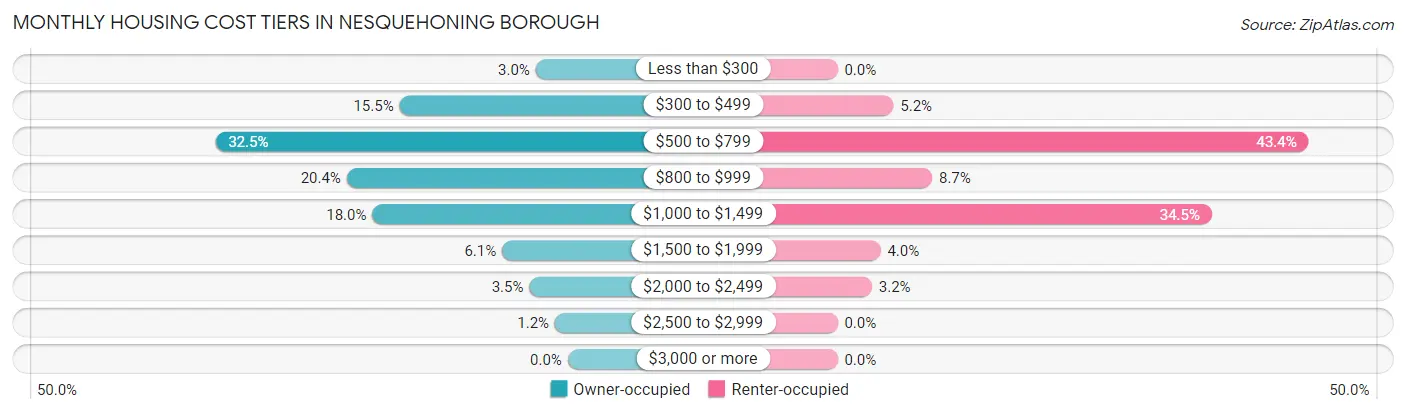
| Monthly Cost | Owner-occupied | Renter-occupied |
| Less than $300 | 20 (2.9%) | 0 (0.0%) |
| $300 to $499 | 105 (15.5%) | 26 (5.1%) |
| $500 to $799 | 220 (32.5%) | 219 (43.4%) |
| $800 to $999 | 138 (20.3%) | 44 (8.7%) |
| $1,000 to $1,499 | 122 (18.0%) | 174 (34.5%) |
| $1,500 to $1,999 | 41 (6.0%) | 20 (4.0%) |
| $2,000 to $2,499 | 24 (3.5%) | 16 (3.2%) |
| $2,500 to $2,999 | 8 (1.2%) | 0 (0.0%) |
| $3,000 or more | 0 (0.0%) | 0 (0.0%) |
| Total | 678 (100.0%) | 505 (100.0%) |
Physical Housing Characteristics in Nesquehoning borough
Housing Structures in Nesquehoning borough
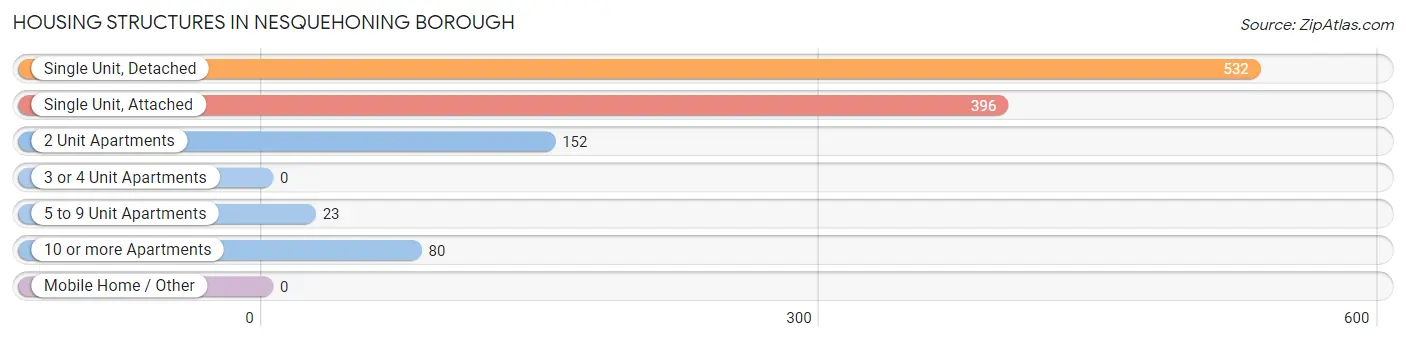
| Structure Type | # Housing Units | % Housing Units |
| Single Unit, Detached | 532 | 45.0% |
| Single Unit, Attached | 396 | 33.5% |
| 2 Unit Apartments | 152 | 12.9% |
| 3 or 4 Unit Apartments | 0 | 0.0% |
| 5 to 9 Unit Apartments | 23 | 1.9% |
| 10 or more Apartments | 80 | 6.8% |
| Mobile Home / Other | 0 | 0.0% |
| Total | 1,183 | 100.0% |
Housing Structures by Occupancy in Nesquehoning borough
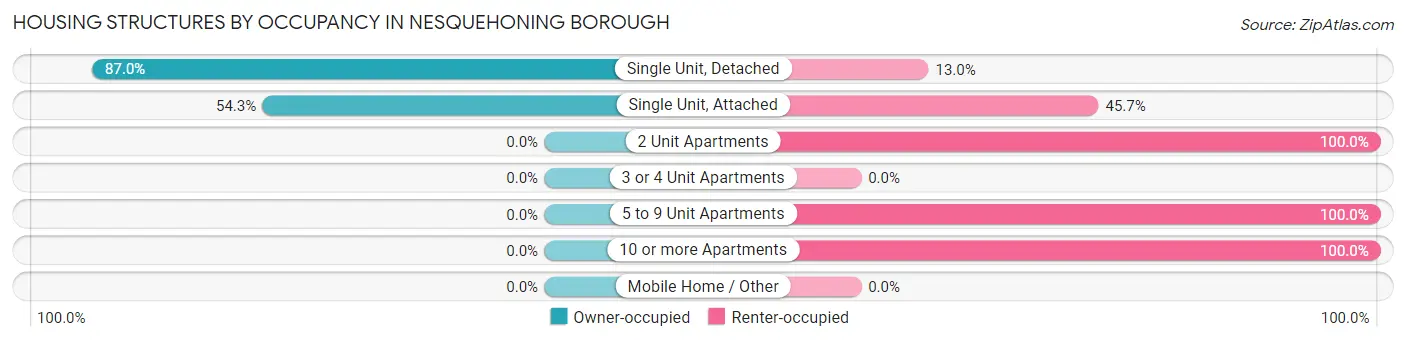
| Structure Type | Owner-occupied | Renter-occupied |
| Single Unit, Detached | 463 (87.0%) | 69 (13.0%) |
| Single Unit, Attached | 215 (54.3%) | 181 (45.7%) |
| 2 Unit Apartments | 0 (0.0%) | 152 (100.0%) |
| 3 or 4 Unit Apartments | 0 (0.0%) | 0 (0.0%) |
| 5 to 9 Unit Apartments | 0 (0.0%) | 23 (100.0%) |
| 10 or more Apartments | 0 (0.0%) | 80 (100.0%) |
| Mobile Home / Other | 0 (0.0%) | 0 (0.0%) |
| Total | 678 (57.3%) | 505 (42.7%) |
Housing Structures by Number of Rooms in Nesquehoning borough
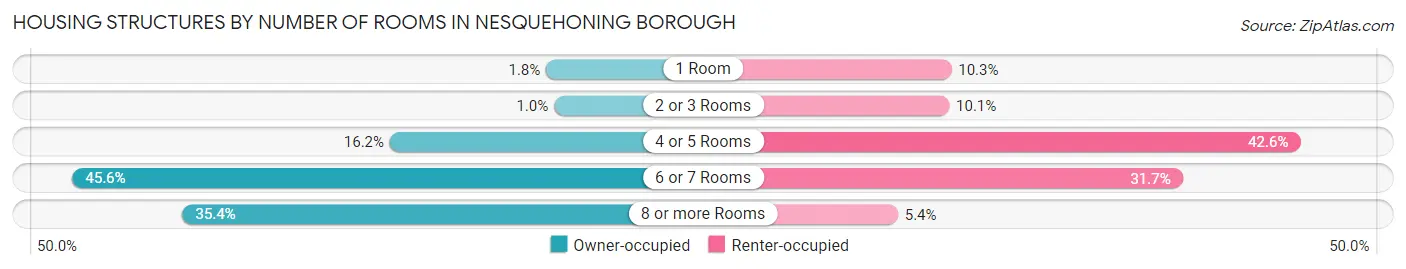
| Number of Rooms | Owner-occupied | Renter-occupied |
| 1 Room | 12 (1.8%) | 52 (10.3%) |
| 2 or 3 Rooms | 7 (1.0%) | 51 (10.1%) |
| 4 or 5 Rooms | 110 (16.2%) | 215 (42.6%) |
| 6 or 7 Rooms | 309 (45.6%) | 160 (31.7%) |
| 8 or more Rooms | 240 (35.4%) | 27 (5.3%) |
| Total | 678 (100.0%) | 505 (100.0%) |
Housing Structure by Heating Type in Nesquehoning borough
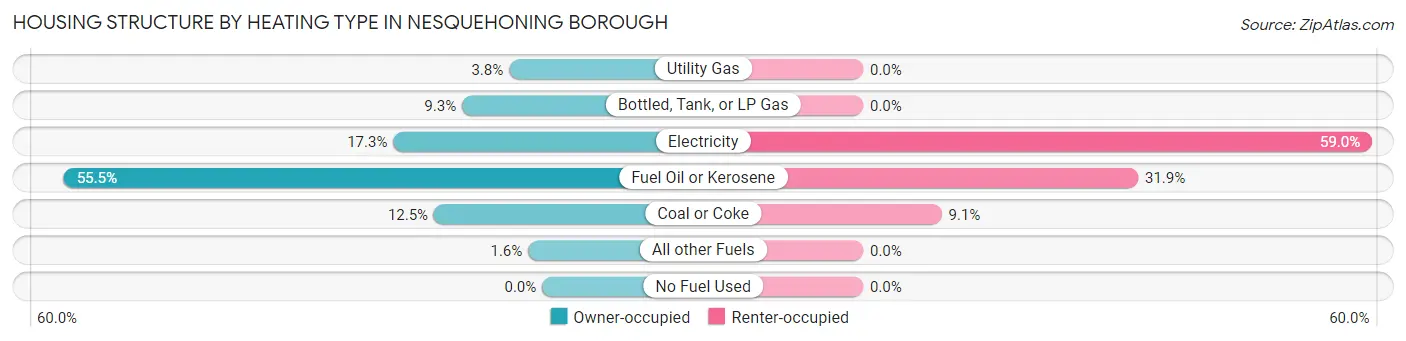
| Heating Type | Owner-occupied | Renter-occupied |
| Utility Gas | 26 (3.8%) | 0 (0.0%) |
| Bottled, Tank, or LP Gas | 63 (9.3%) | 0 (0.0%) |
| Electricity | 117 (17.3%) | 298 (59.0%) |
| Fuel Oil or Kerosene | 376 (55.5%) | 161 (31.9%) |
| Coal or Coke | 85 (12.5%) | 46 (9.1%) |
| All other Fuels | 11 (1.6%) | 0 (0.0%) |
| No Fuel Used | 0 (0.0%) | 0 (0.0%) |
| Total | 678 (100.0%) | 505 (100.0%) |
Household Vehicle Usage in Nesquehoning borough
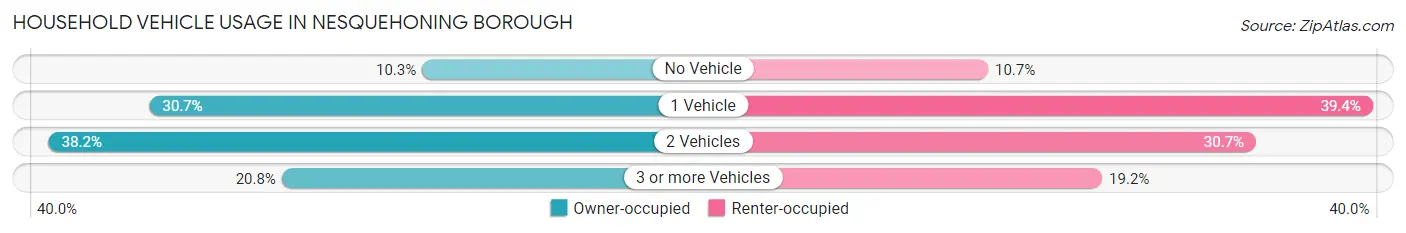
| Vehicles per Household | Owner-occupied | Renter-occupied |
| No Vehicle | 70 (10.3%) | 54 (10.7%) |
| 1 Vehicle | 208 (30.7%) | 199 (39.4%) |
| 2 Vehicles | 259 (38.2%) | 155 (30.7%) |
| 3 or more Vehicles | 141 (20.8%) | 97 (19.2%) |
| Total | 678 (100.0%) | 505 (100.0%) |
Real Estate & Mortgages in Nesquehoning borough
Real Estate and Mortgage Overview in Nesquehoning borough
| Characteristic | Without Mortgage | With Mortgage |
| Housing Units | 311 | 367 |
| Median Property Value | $114,600 | $81,700 |
| Median Household Income | $56,513 | $56 |
| Monthly Housing Costs | $552 | $0 |
| Real Estate Taxes | $2,939 | $0 |
Property Value by Mortgage Status in Nesquehoning borough
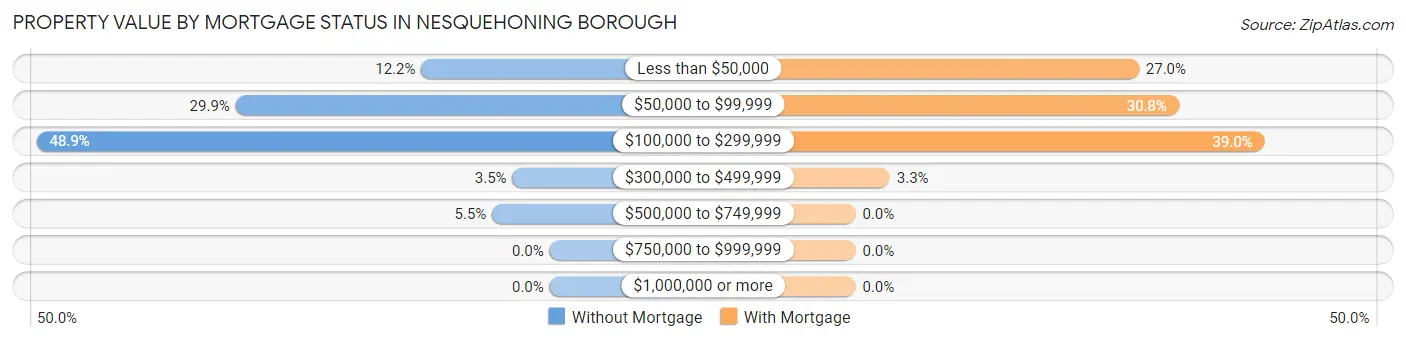
| Property Value | Without Mortgage | With Mortgage |
| Less than $50,000 | 38 (12.2%) | 99 (27.0%) |
| $50,000 to $99,999 | 93 (29.9%) | 113 (30.8%) |
| $100,000 to $299,999 | 152 (48.9%) | 143 (39.0%) |
| $300,000 to $499,999 | 11 (3.5%) | 12 (3.3%) |
| $500,000 to $749,999 | 17 (5.5%) | 0 (0.0%) |
| $750,000 to $999,999 | 0 (0.0%) | 0 (0.0%) |
| $1,000,000 or more | 0 (0.0%) | 0 (0.0%) |
| Total | 311 (100.0%) | 367 (100.0%) |
Household Income by Mortgage Status in Nesquehoning borough
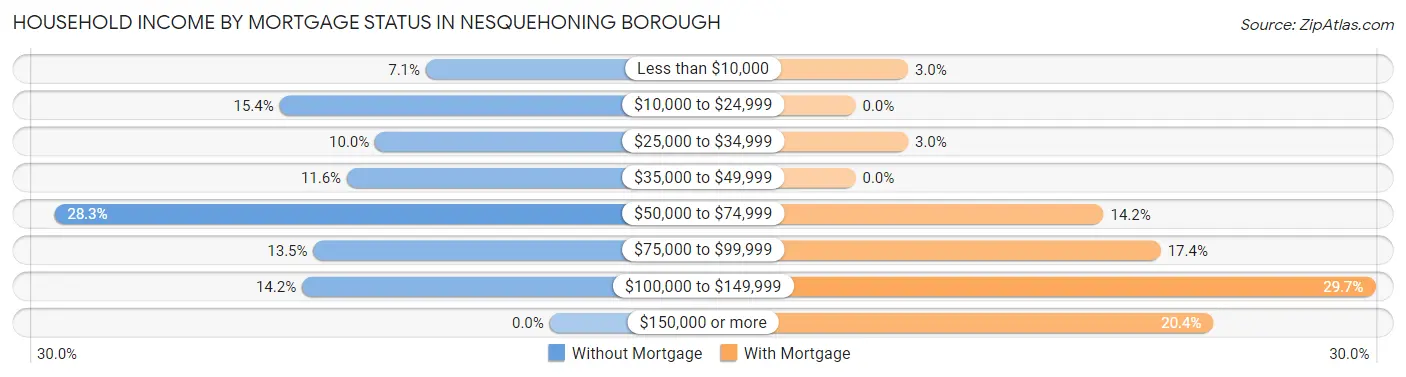
| Household Income | Without Mortgage | With Mortgage |
| Less than $10,000 | 22 (7.1%) | 11 (3.0%) |
| $10,000 to $24,999 | 48 (15.4%) | 0 (0.0%) |
| $25,000 to $34,999 | 31 (10.0%) | 11 (3.0%) |
| $35,000 to $49,999 | 36 (11.6%) | 0 (0.0%) |
| $50,000 to $74,999 | 88 (28.3%) | 52 (14.2%) |
| $75,000 to $99,999 | 42 (13.5%) | 64 (17.4%) |
| $100,000 to $149,999 | 44 (14.1%) | 109 (29.7%) |
| $150,000 or more | 0 (0.0%) | 75 (20.4%) |
| Total | 311 (100.0%) | 367 (100.0%) |
Property Value to Household Income Ratio in Nesquehoning borough
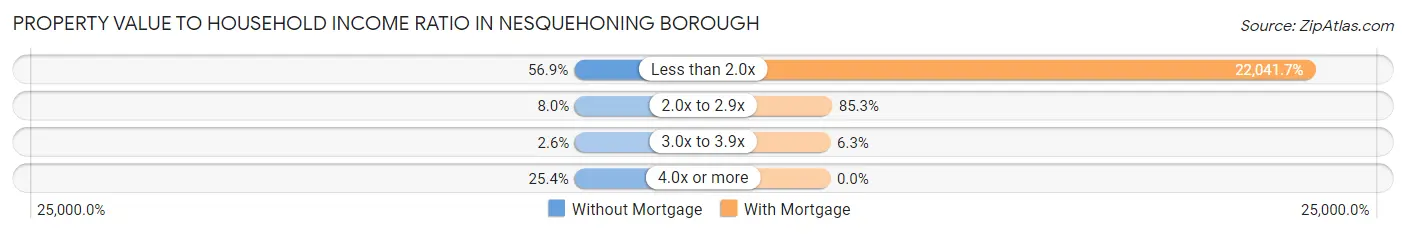
| Value-to-Income Ratio | Without Mortgage | With Mortgage |
| Less than 2.0x | 177 (56.9%) | 80,893 (22,041.7%) |
| 2.0x to 2.9x | 25 (8.0%) | 313 (85.3%) |
| 3.0x to 3.9x | 8 (2.6%) | 23 (6.3%) |
| 4.0x or more | 79 (25.4%) | 0 (0.0%) |
| Total | 311 (100.0%) | 367 (100.0%) |
Real Estate Taxes by Mortgage Status in Nesquehoning borough
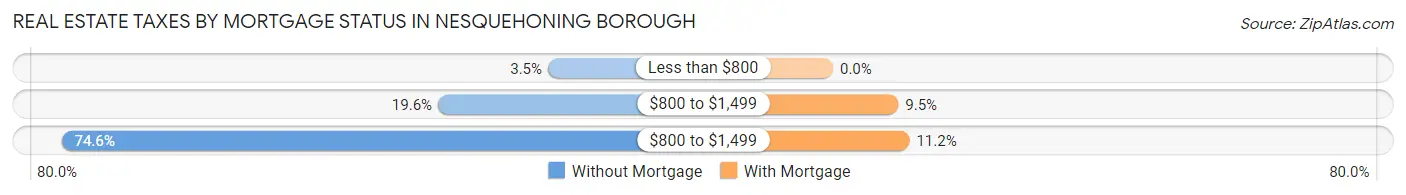
| Property Taxes | Without Mortgage | With Mortgage |
| Less than $800 | 11 (3.5%) | 0 (0.0%) |
| $800 to $1,499 | 61 (19.6%) | 35 (9.5%) |
| $800 to $1,499 | 232 (74.6%) | 41 (11.2%) |
| Total | 311 (100.0%) | 367 (100.0%) |
Health & Disability in Nesquehoning borough
Health Insurance Coverage by Age in Nesquehoning borough
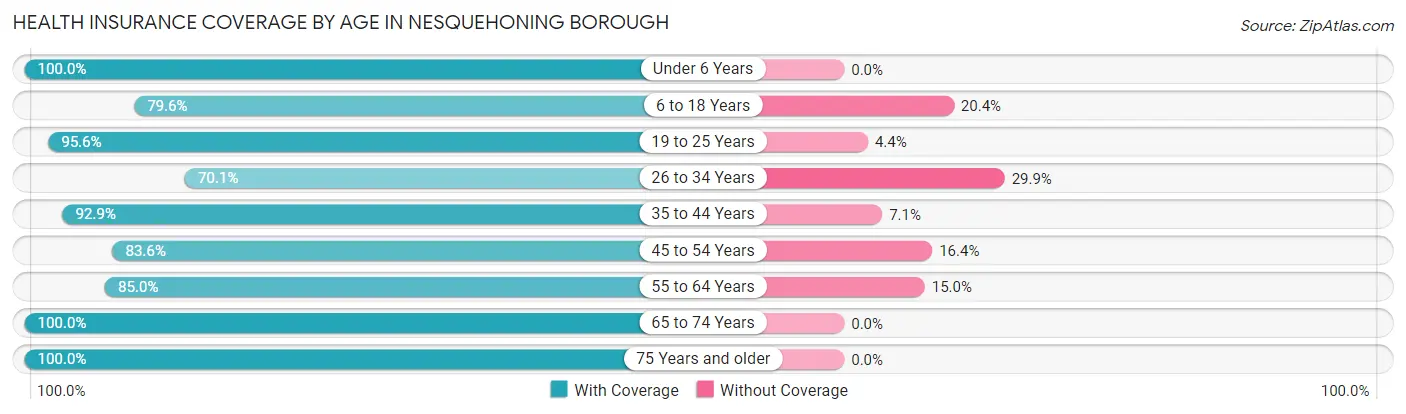
| Age Bracket | With Coverage | Without Coverage |
| Under 6 Years | 200 (100.0%) | 0 (0.0%) |
| 6 to 18 Years | 475 (79.6%) | 122 (20.4%) |
| 19 to 25 Years | 281 (95.6%) | 13 (4.4%) |
| 26 to 34 Years | 382 (70.1%) | 163 (29.9%) |
| 35 to 44 Years | 171 (92.9%) | 13 (7.1%) |
| 45 to 54 Years | 209 (83.6%) | 41 (16.4%) |
| 55 to 64 Years | 402 (85.0%) | 71 (15.0%) |
| 65 to 74 Years | 342 (100.0%) | 0 (0.0%) |
| 75 Years and older | 238 (100.0%) | 0 (0.0%) |
| Total | 2,700 (86.5%) | 423 (13.5%) |
Health Insurance Coverage by Citizenship Status in Nesquehoning borough
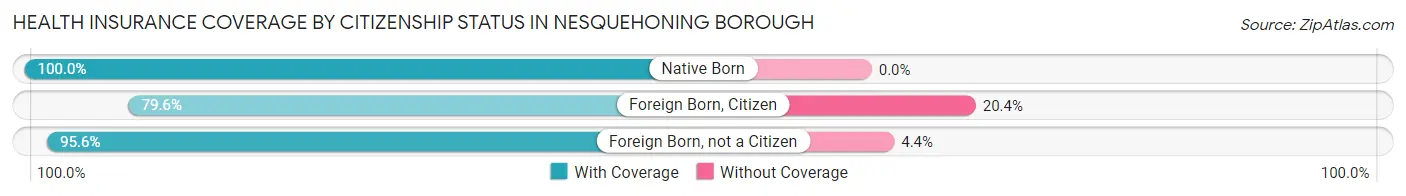
| Citizenship Status | With Coverage | Without Coverage |
| Native Born | 200 (100.0%) | 0 (0.0%) |
| Foreign Born, Citizen | 475 (79.6%) | 122 (20.4%) |
| Foreign Born, not a Citizen | 281 (95.6%) | 13 (4.4%) |
Health Insurance Coverage by Household Income in Nesquehoning borough
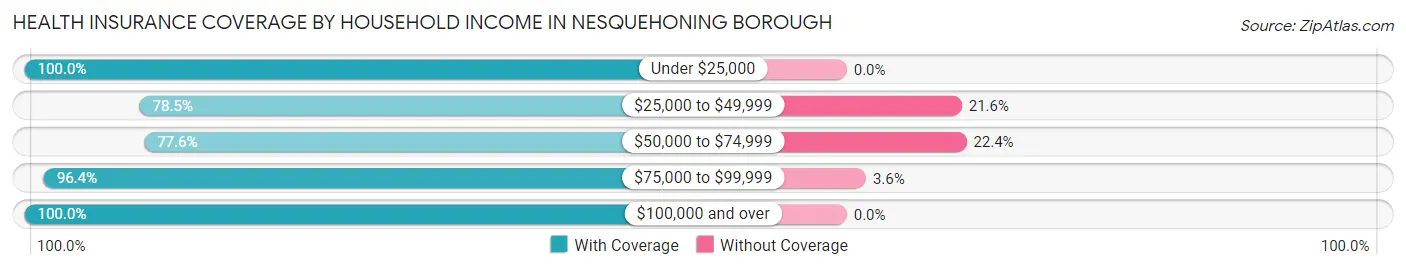
| Household Income | With Coverage | Without Coverage |
| Under $25,000 | 274 (100.0%) | 0 (0.0%) |
| $25,000 to $49,999 | 757 (78.4%) | 208 (21.5%) |
| $50,000 to $74,999 | 699 (77.6%) | 202 (22.4%) |
| $75,000 to $99,999 | 348 (96.4%) | 13 (3.6%) |
| $100,000 and over | 618 (100.0%) | 0 (0.0%) |
Public vs Private Health Insurance Coverage by Age in Nesquehoning borough
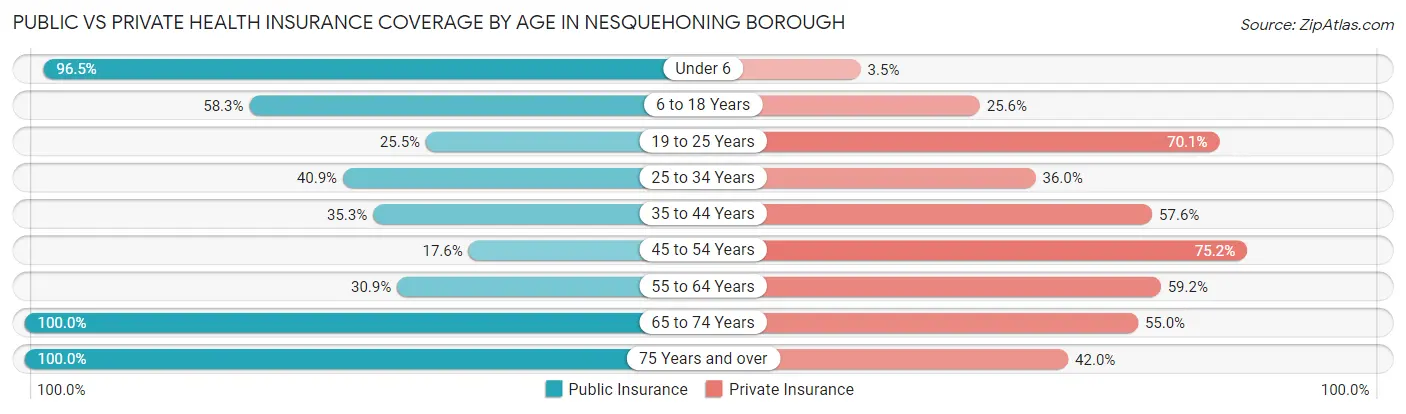
| Age Bracket | Public Insurance | Private Insurance |
| Under 6 | 193 (96.5%) | 7 (3.5%) |
| 6 to 18 Years | 348 (58.3%) | 153 (25.6%) |
| 19 to 25 Years | 75 (25.5%) | 206 (70.1%) |
| 25 to 34 Years | 223 (40.9%) | 196 (36.0%) |
| 35 to 44 Years | 65 (35.3%) | 106 (57.6%) |
| 45 to 54 Years | 44 (17.6%) | 188 (75.2%) |
| 55 to 64 Years | 146 (30.9%) | 280 (59.2%) |
| 65 to 74 Years | 342 (100.0%) | 188 (55.0%) |
| 75 Years and over | 238 (100.0%) | 100 (42.0%) |
| Total | 1,674 (53.6%) | 1,424 (45.6%) |
Disability Status by Sex by Age in Nesquehoning borough
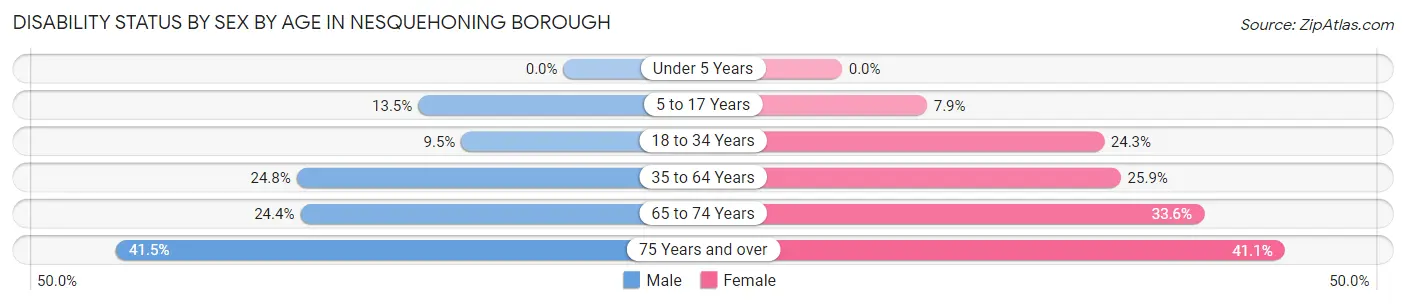
| Age Bracket | Male | Female |
| Under 5 Years | 0 (0.0%) | 0 (0.0%) |
| 5 to 17 Years | 38 (13.5%) | 27 (7.9%) |
| 18 to 34 Years | 46 (9.5%) | 90 (24.3%) |
| 35 to 64 Years | 105 (24.8%) | 125 (25.9%) |
| 65 to 74 Years | 53 (24.4%) | 42 (33.6%) |
| 75 Years and over | 22 (41.5%) | 76 (41.1%) |
Disability Class by Sex by Age in Nesquehoning borough
Disability Class: Hearing Difficulty
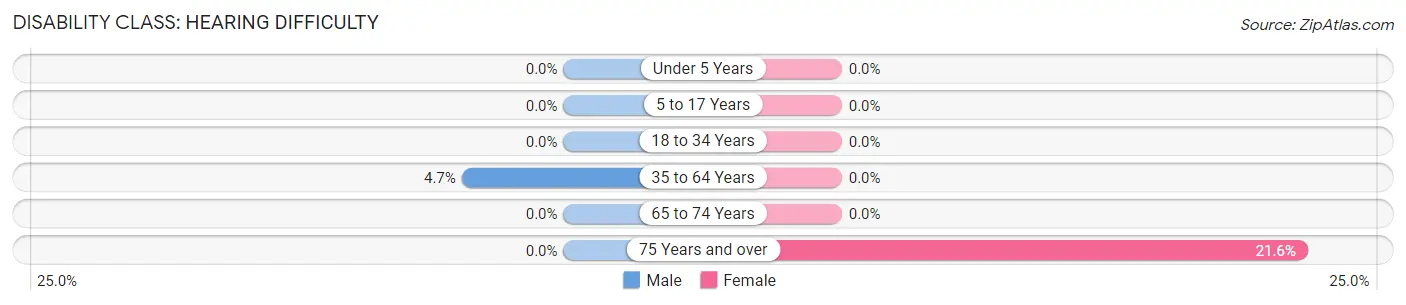
| Age Bracket | Male | Female |
| Under 5 Years | 0 (0.0%) | 0 (0.0%) |
| 5 to 17 Years | 0 (0.0%) | 0 (0.0%) |
| 18 to 34 Years | 0 (0.0%) | 0 (0.0%) |
| 35 to 64 Years | 20 (4.7%) | 0 (0.0%) |
| 65 to 74 Years | 0 (0.0%) | 0 (0.0%) |
| 75 Years and over | 0 (0.0%) | 40 (21.6%) |
Disability Class: Vision Difficulty
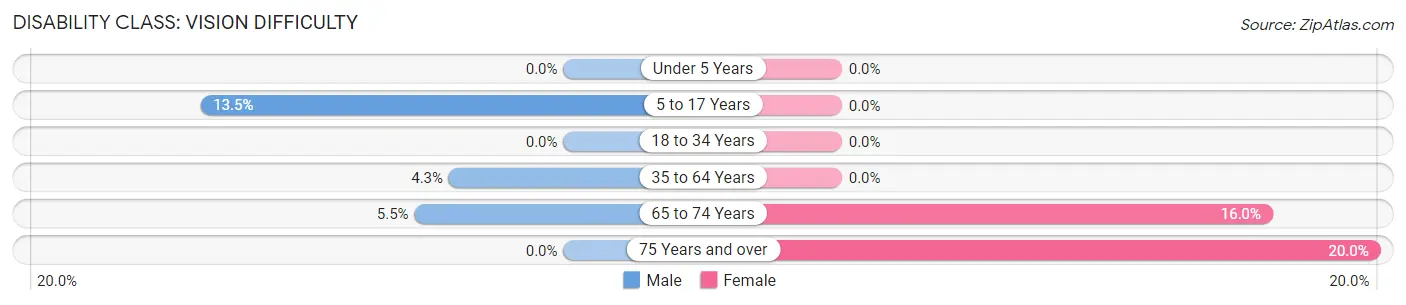
| Age Bracket | Male | Female |
| Under 5 Years | 0 (0.0%) | 0 (0.0%) |
| 5 to 17 Years | 38 (13.5%) | 0 (0.0%) |
| 18 to 34 Years | 0 (0.0%) | 0 (0.0%) |
| 35 to 64 Years | 18 (4.3%) | 0 (0.0%) |
| 65 to 74 Years | 12 (5.5%) | 20 (16.0%) |
| 75 Years and over | 0 (0.0%) | 37 (20.0%) |
Disability Class: Cognitive Difficulty
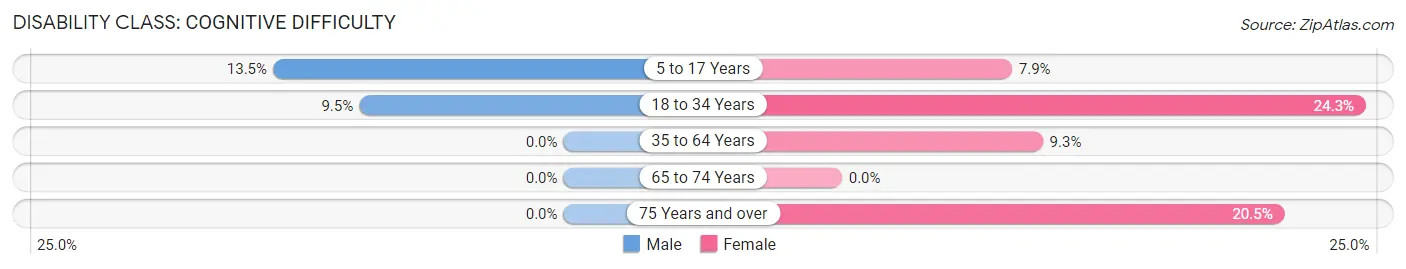
| Age Bracket | Male | Female |
| 5 to 17 Years | 38 (13.5%) | 27 (7.9%) |
| 18 to 34 Years | 46 (9.5%) | 90 (24.3%) |
| 35 to 64 Years | 0 (0.0%) | 45 (9.3%) |
| 65 to 74 Years | 0 (0.0%) | 0 (0.0%) |
| 75 Years and over | 0 (0.0%) | 38 (20.5%) |
Disability Class: Ambulatory Difficulty
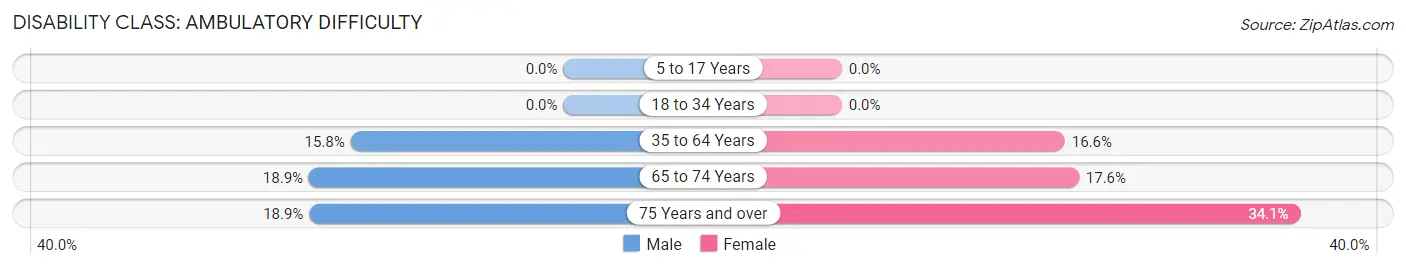
| Age Bracket | Male | Female |
| 5 to 17 Years | 0 (0.0%) | 0 (0.0%) |
| 18 to 34 Years | 0 (0.0%) | 0 (0.0%) |
| 35 to 64 Years | 67 (15.8%) | 80 (16.6%) |
| 65 to 74 Years | 41 (18.9%) | 22 (17.6%) |
| 75 Years and over | 10 (18.9%) | 63 (34.1%) |
Disability Class: Self-Care Difficulty
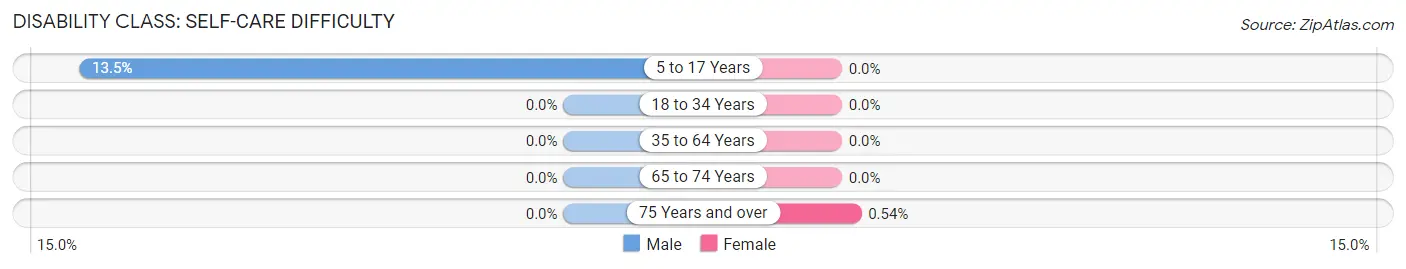
| Age Bracket | Male | Female |
| 5 to 17 Years | 38 (13.5%) | 0 (0.0%) |
| 18 to 34 Years | 0 (0.0%) | 0 (0.0%) |
| 35 to 64 Years | 0 (0.0%) | 0 (0.0%) |
| 65 to 74 Years | 0 (0.0%) | 0 (0.0%) |
| 75 Years and over | 0 (0.0%) | 1 (0.5%) |
Technology Access in Nesquehoning borough
Computing Device Access in Nesquehoning borough
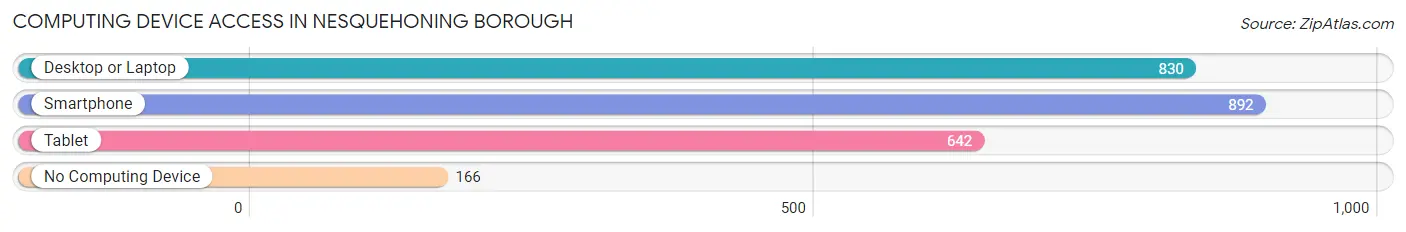
| Device Type | # Households | % Households |
| Desktop or Laptop | 830 | 70.2% |
| Smartphone | 892 | 75.4% |
| Tablet | 642 | 54.3% |
| No Computing Device | 166 | 14.0% |
| Total | 1,183 | 100.0% |
Internet Access in Nesquehoning borough
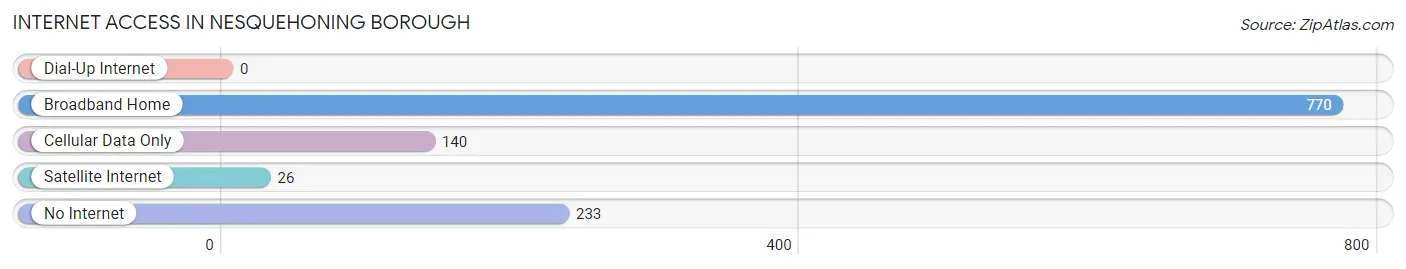
| Internet Type | # Households | % Households |
| Dial-Up Internet | 0 | 0.0% |
| Broadband Home | 770 | 65.1% |
| Cellular Data Only | 140 | 11.8% |
| Satellite Internet | 26 | 2.2% |
| No Internet | 233 | 19.7% |
| Total | 1,183 | 100.0% |
Nesquehoning borough Summary
Nesquehoning Borough is a small borough located in Carbon County, Pennsylvania. It is situated in the eastern part of the state, approximately two miles south of the Lehigh River and two miles east of the Poconos. The borough is bordered by the townships of Packer, Banks, and Lausanne. The population of Nesquehoning Borough was 2,845 as of the 2010 census.
History
Nesquehoning was first settled in the early 1800s by German immigrants. The name of the borough is derived from the Lenape Indian word “Nes-que-honing” which means “black bear stream”. The first post office in the area was established in 1845. The borough was officially incorporated in 1866.
In the late 1800s, the borough was a major coal mining center. The coal industry was the primary source of employment for the residents of Nesquehoning. The coal mines were owned by the Lehigh Coal and Navigation Company and the Lehigh Valley Railroad. The coal industry declined in the early 1900s and the borough’s economy shifted to other industries such as manufacturing and tourism.
Geography
Nesquehoning Borough is located at 40°54'N 75°41'W. It has a total area of 1.2 square miles, all of which is land. The borough is located in the eastern part of Carbon County and is bordered by the townships of Packer, Banks, and Lausanne. The borough is situated two miles south of the Lehigh River and two miles east of the Poconos.
The borough is located in the Appalachian Mountains and is part of the Pocono Mountains region. The terrain is mostly hilly and forested. The highest point in the borough is 1,890 feet above sea level.
Economy
The economy of Nesquehoning Borough is largely based on tourism. The borough is home to several tourist attractions, including the Nesquehoning Historical Society Museum, the Nesquehoning Railroad Museum, and the Nesquehoning Nature Center. The borough also has several restaurants, shops, and lodging establishments.
The borough is also home to several manufacturing companies, including a plastics manufacturer, a metal fabricator, and a printing company. The borough is also home to several small businesses, including a grocery store, a hardware store, and a pharmacy.
Demographics
As of the 2010 census, the population of Nesquehoning Borough was 2,845. The racial makeup of the borough was 97.3% White, 0.7% African American, 0.2% Native American, 0.3% Asian, 0.1% Pacific Islander, 0.3% from other races, and 1.2% from two or more races. Hispanic or Latino of any race were 1.2% of the population.
The median household income in the borough was $41,250 and the median family income was $50,000. The per capita income was $20,945. About 11.2% of the population was below the poverty line.
Common Questions
What is Per Capita Income in Nesquehoning borough?
Per Capita income in Nesquehoning borough is $22,532.
What is the Median Family Income in Nesquehoning borough?
Median Family Income in Nesquehoning borough is $52,132.
What is the Median Household income in Nesquehoning borough?
Median Household Income in Nesquehoning borough is $51,213.
What is Income or Wage Gap in Nesquehoning borough?
Income or Wage Gap in Nesquehoning borough is 20.4%.
Women in Nesquehoning borough earn 79.6 cents for every dollar earned by a man.
What is Inequality or Gini Index in Nesquehoning borough?
Inequality or Gini Index in Nesquehoning borough is 0.37.
What is the Total Population of Nesquehoning borough?
Total Population of Nesquehoning borough is 3,341.
What is the Total Male Population of Nesquehoning borough?
Total Male Population of Nesquehoning borough is 1,739.
What is the Total Female Population of Nesquehoning borough?
Total Female Population of Nesquehoning borough is 1,602.
What is the Ratio of Males per 100 Females in Nesquehoning borough?
There are 108.55 Males per 100 Females in Nesquehoning borough.
What is the Ratio of Females per 100 Males in Nesquehoning borough?
There are 92.12 Females per 100 Males in Nesquehoning borough.
What is the Median Population Age in Nesquehoning borough?
Median Population Age in Nesquehoning borough is 34.5 Years.
What is the Average Family Size in Nesquehoning borough
Average Family Size in Nesquehoning borough is 3.2 People.
What is the Average Household Size in Nesquehoning borough
Average Household Size in Nesquehoning borough is 2.6 People.
How Large is the Labor Force in Nesquehoning borough?
There are 1,517 People in the Labor Forcein in Nesquehoning borough.
What is the Percentage of People in the Labor Force in Nesquehoning borough?
57.1% of People are in the Labor Force in Nesquehoning borough.
What is the Unemployment Rate in Nesquehoning borough?
Unemployment Rate in Nesquehoning borough is 14.8%.