Unionville, PA Map & Demographics
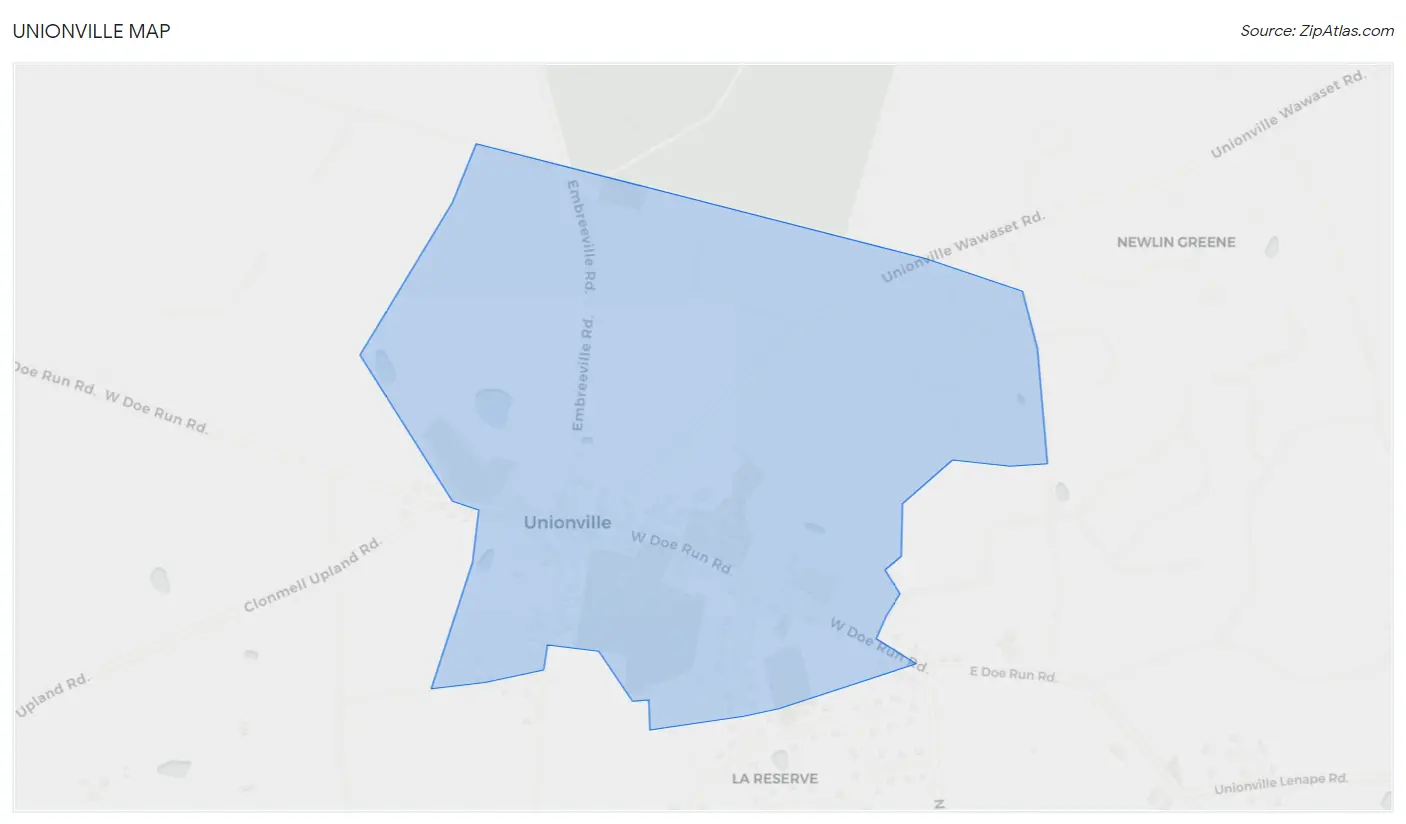
Unionville Map
Unionville Overview
$76,163
PER CAPITA INCOME
$134,583
AVG FAMILY INCOME
$121,964
AVG HOUSEHOLD INCOME
69.3%
WAGE / INCOME GAP [ % ]
30.7¢/ $1
WAGE / INCOME GAP [ $ ]
0.31
INEQUALITY / GINI INDEX
722
TOTAL POPULATION
351
MALE POPULATION
371
FEMALE POPULATION
94.61
MALES / 100 FEMALES
105.70
FEMALES / 100 MALES
66.8
MEDIAN AGE
2.2
AVG FAMILY SIZE
2.1
AVG HOUSEHOLD SIZE
315
LABOR FORCE [ PEOPLE ]
49.8%
PERCENT IN LABOR FORCE
Unionville Zip Codes
Unionville Area Codes
Income in Unionville
Income Overview in Unionville
Per Capita Income in Unionville is $76,163, while median incomes of families and households are $134,583 and $121,964 respectively.
| Characteristic | Number | Measure |
| Per Capita Income | 722 | $76,163 |
| Median Family Income | 296 | $134,583 |
| Mean Family Income | 296 | $163,898 |
| Median Household Income | 343 | $121,964 |
| Mean Household Income | 343 | $156,752 |
| Income Deficit | 296 | $0 |
| Wage / Income Gap (%) | 722 | 69.32% |
| Wage / Income Gap ($) | 722 | 30.68¢ per $1 |
| Gini / Inequality Index | 722 | 0.31 |
Earnings by Sex in Unionville
Average Earnings in Unionville are $46,146, $60,645 for men and $18,603 for women, a difference of 69.3%.
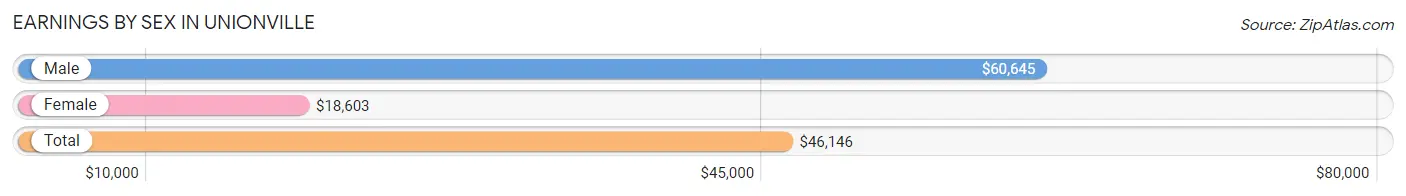
| Sex | Number | Average Earnings |
| Male | 157 (49.8%) | $60,645 |
| Female | 158 (50.2%) | $18,603 |
| Total | 315 (100.0%) | $46,146 |
Earnings by Sex by Income Bracket in Unionville
The most common earnings brackets in Unionville are $10,000 to $12,499 for men (72 | 45.9%) and $100,000+ for women (93 | 58.9%).
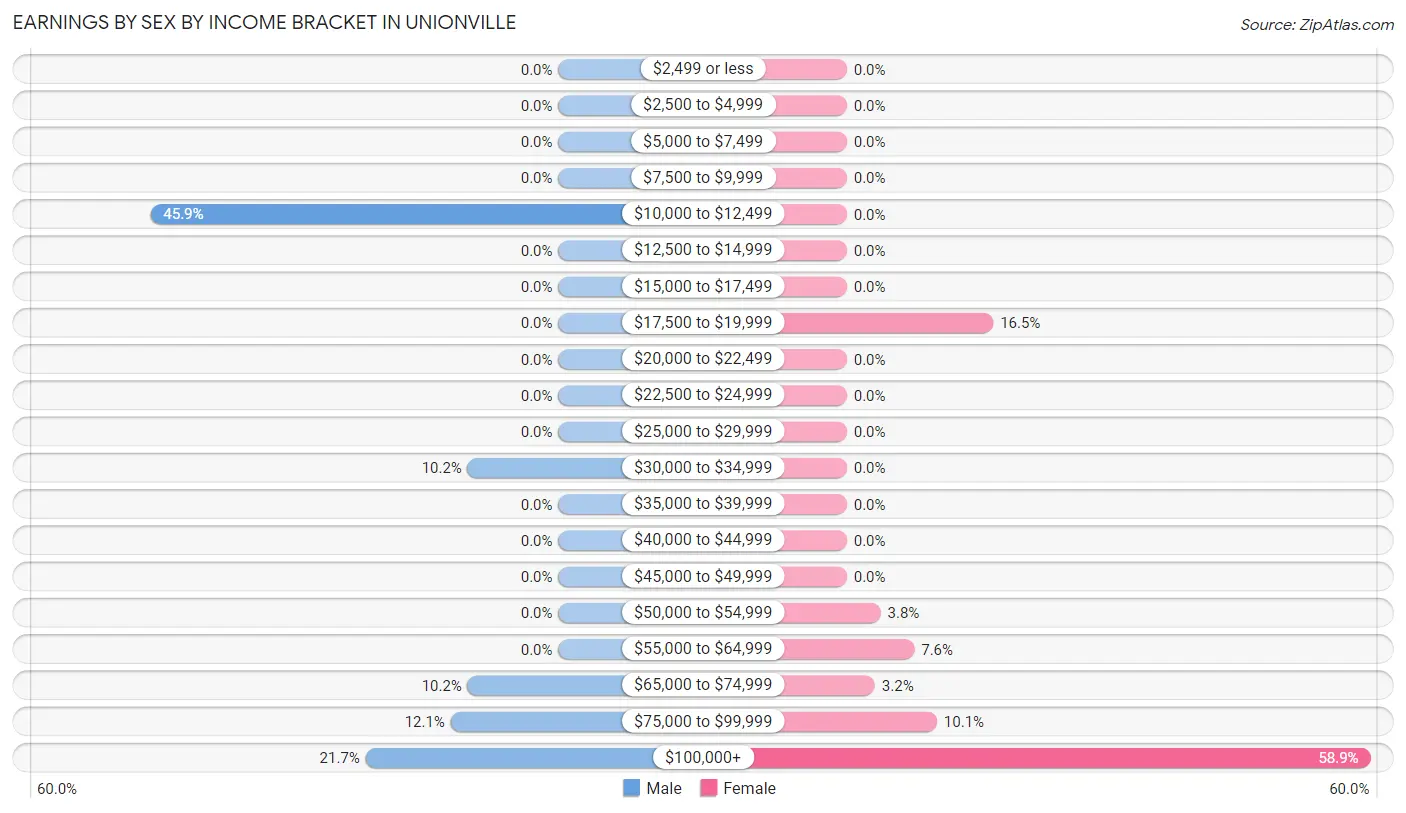
| Income | Male | Female |
| $2,499 or less | 0 (0.0%) | 0 (0.0%) |
| $2,500 to $4,999 | 0 (0.0%) | 0 (0.0%) |
| $5,000 to $7,499 | 0 (0.0%) | 0 (0.0%) |
| $7,500 to $9,999 | 0 (0.0%) | 0 (0.0%) |
| $10,000 to $12,499 | 72 (45.9%) | 0 (0.0%) |
| $12,500 to $14,999 | 0 (0.0%) | 0 (0.0%) |
| $15,000 to $17,499 | 0 (0.0%) | 0 (0.0%) |
| $17,500 to $19,999 | 0 (0.0%) | 26 (16.5%) |
| $20,000 to $22,499 | 0 (0.0%) | 0 (0.0%) |
| $22,500 to $24,999 | 0 (0.0%) | 0 (0.0%) |
| $25,000 to $29,999 | 0 (0.0%) | 0 (0.0%) |
| $30,000 to $34,999 | 16 (10.2%) | 0 (0.0%) |
| $35,000 to $39,999 | 0 (0.0%) | 0 (0.0%) |
| $40,000 to $44,999 | 0 (0.0%) | 0 (0.0%) |
| $45,000 to $49,999 | 0 (0.0%) | 0 (0.0%) |
| $50,000 to $54,999 | 0 (0.0%) | 6 (3.8%) |
| $55,000 to $64,999 | 0 (0.0%) | 12 (7.6%) |
| $65,000 to $74,999 | 16 (10.2%) | 5 (3.2%) |
| $75,000 to $99,999 | 19 (12.1%) | 16 (10.1%) |
| $100,000+ | 34 (21.7%) | 93 (58.9%) |
| Total | 157 (100.0%) | 158 (100.0%) |
Earnings by Sex by Educational Attainment in Unionville
| Educational Attainment | Male Income | Female Income |
| Less than High School | - | - |
| High School Diploma | - | - |
| College or Associate's Degree | - | - |
| Bachelor's Degree | - | - |
| Graduate Degree | - | - |
| Total | - | - |
Family Income in Unionville
Family Income Brackets in Unionville
According to the Unionville family income data, there are 108 families falling into the $75,000 to $99,999 income range, which is the most common income bracket and makes up 36.5% of all families.
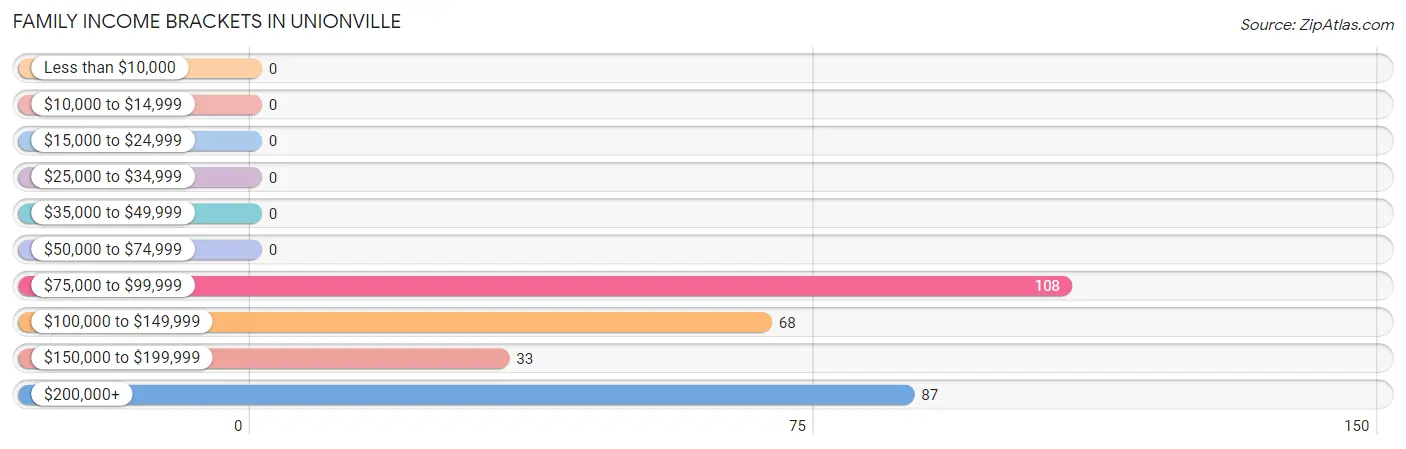
| Income Bracket | # Families | % Families |
| Less than $10,000 | 0 | 0.0% |
| $10,000 to $14,999 | 0 | 0.0% |
| $15,000 to $24,999 | 0 | 0.0% |
| $25,000 to $34,999 | 0 | 0.0% |
| $35,000 to $49,999 | 0 | 0.0% |
| $50,000 to $74,999 | 0 | 0.0% |
| $75,000 to $99,999 | 108 | 36.5% |
| $100,000 to $149,999 | 68 | 23.0% |
| $150,000 to $199,999 | 33 | 11.1% |
| $200,000+ | 87 | 29.4% |
Family Income by Famaliy Size in Unionville
2-person families (275 | 92.9%) account for the highest median family income in Unionville with $122,107 per family, while 2-person families (275 | 92.9%) have the highest median income of $61,054 per family member.
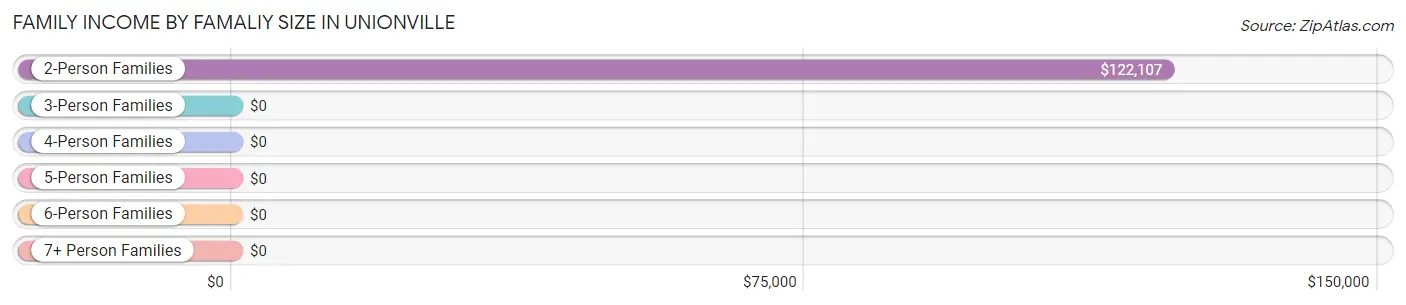
| Income Bracket | # Families | Median Income |
| 2-Person Families | 275 (92.9%) | $122,107 |
| 3-Person Families | 16 (5.4%) | $0 |
| 4-Person Families | 5 (1.7%) | $0 |
| 5-Person Families | 0 (0.0%) | $0 |
| 6-Person Families | 0 (0.0%) | $0 |
| 7+ Person Families | 0 (0.0%) | $0 |
| Total | 296 (100.0%) | $134,583 |
Family Income by Number of Earners in Unionville
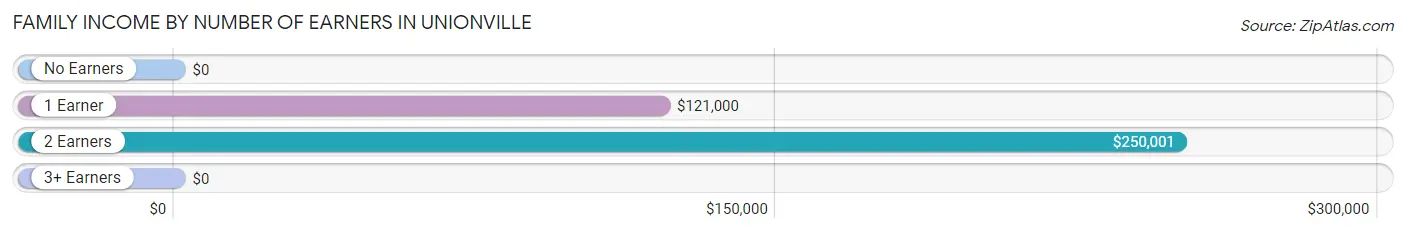
| Number of Earners | # Families | Median Income |
| No Earners | 119 (40.2%) | $0 |
| 1 Earner | 86 (29.0%) | $121,000 |
| 2 Earners | 91 (30.7%) | $250,001 |
| 3+ Earners | 0 (0.0%) | $0 |
| Total | 296 (100.0%) | $134,583 |
Household Income in Unionville
Household Income Brackets in Unionville
With 124 households falling in the category, the $75,000 to $99,999 income range is the most frequent in Unionville, accounting for 36.1% of all households.
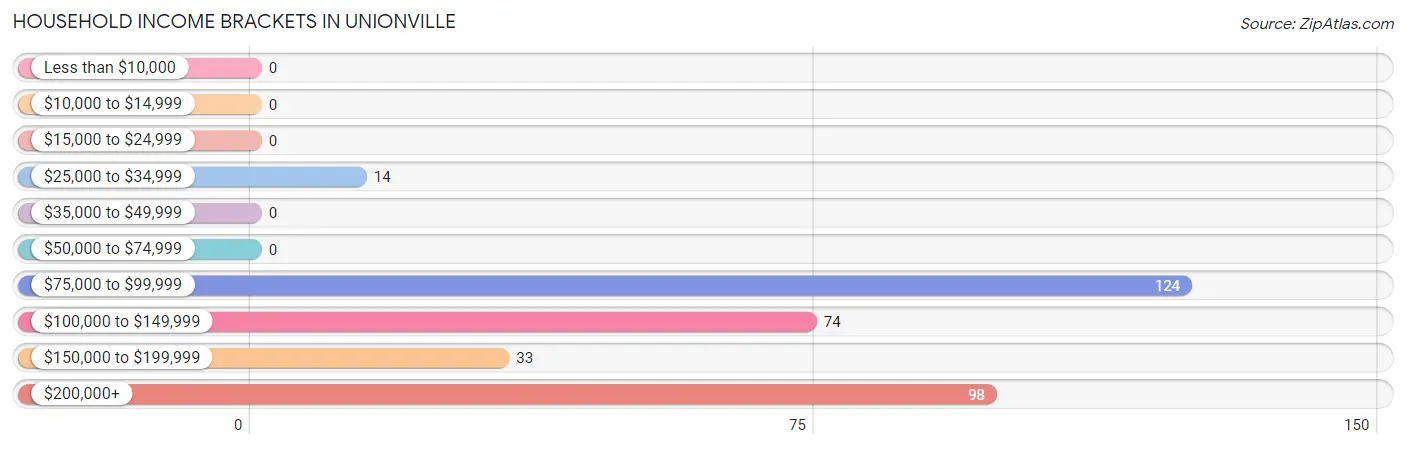
| Income Bracket | # Households | % Households |
| Less than $10,000 | 0 | 0.0% |
| $10,000 to $14,999 | 0 | 0.0% |
| $15,000 to $24,999 | 0 | 0.0% |
| $25,000 to $34,999 | 14 | 4.1% |
| $35,000 to $49,999 | 0 | 0.0% |
| $50,000 to $74,999 | 0 | 0.0% |
| $75,000 to $99,999 | 124 | 36.2% |
| $100,000 to $149,999 | 74 | 21.6% |
| $150,000 to $199,999 | 33 | 9.6% |
| $200,000+ | 98 | 28.6% |
Household Income by Householder Age in Unionville
The median household income in Unionville is $121,964, with the highest median household income of $178,828 found in the 25 to 44 years age bracket for the primary householder. A total of 39 households (11.4%) fall into this category.
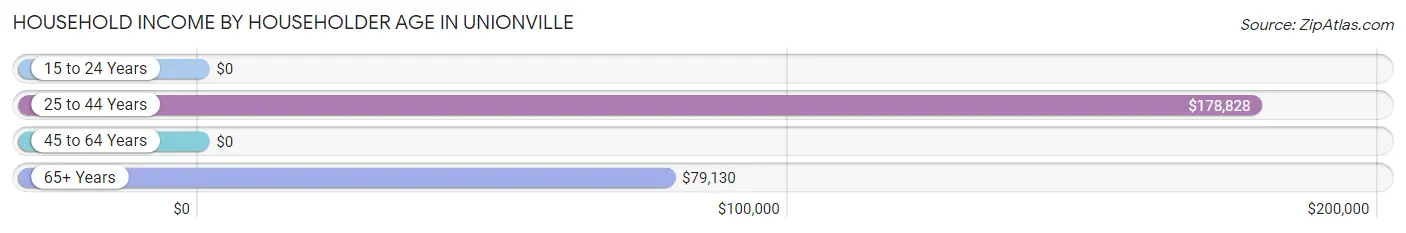
| Income Bracket | # Households | Median Income |
| 15 to 24 Years | 0 (0.0%) | $0 |
| 25 to 44 Years | 39 (11.4%) | $178,828 |
| 45 to 64 Years | 115 (33.5%) | $0 |
| 65+ Years | 189 (55.1%) | $79,130 |
| Total | 343 (100.0%) | $121,964 |
Poverty in Unionville
Income Below Poverty by Sex and Age in Unionville
| Age Bracket | Male | Female |
| Under 5 Years | 0 (0.0%) | 0 (0.0%) |
| 5 Years | 0 (0.0%) | 0 (0.0%) |
| 6 to 11 Years | 0 (0.0%) | 0 (0.0%) |
| 12 to 14 Years | 0 (0.0%) | 0 (0.0%) |
| 15 Years | 0 (0.0%) | 0 (0.0%) |
| 16 and 17 Years | 0 (0.0%) | 0 (0.0%) |
| 18 to 24 Years | 0 (0.0%) | 0 (0.0%) |
| 25 to 34 Years | 0 (0.0%) | 0 (0.0%) |
| 35 to 44 Years | 0 (0.0%) | 0 (0.0%) |
| 45 to 54 Years | 0 (0.0%) | 0 (0.0%) |
| 55 to 64 Years | 0 (0.0%) | 0 (0.0%) |
| 65 to 74 Years | 0 (0.0%) | 0 (0.0%) |
| 75 Years and over | 0 (0.0%) | 0 (0.0%) |
| Total | 0 (0.0%) | 0 (0.0%) |
Income Above Poverty by Sex and Age in Unionville
According to the poverty statistics in Unionville, males aged 6 to 11 years and females aged under 5 years are the age groups that are most secure financially, with 100.0% of males and 100.0% of females in these age groups living above the poverty line.
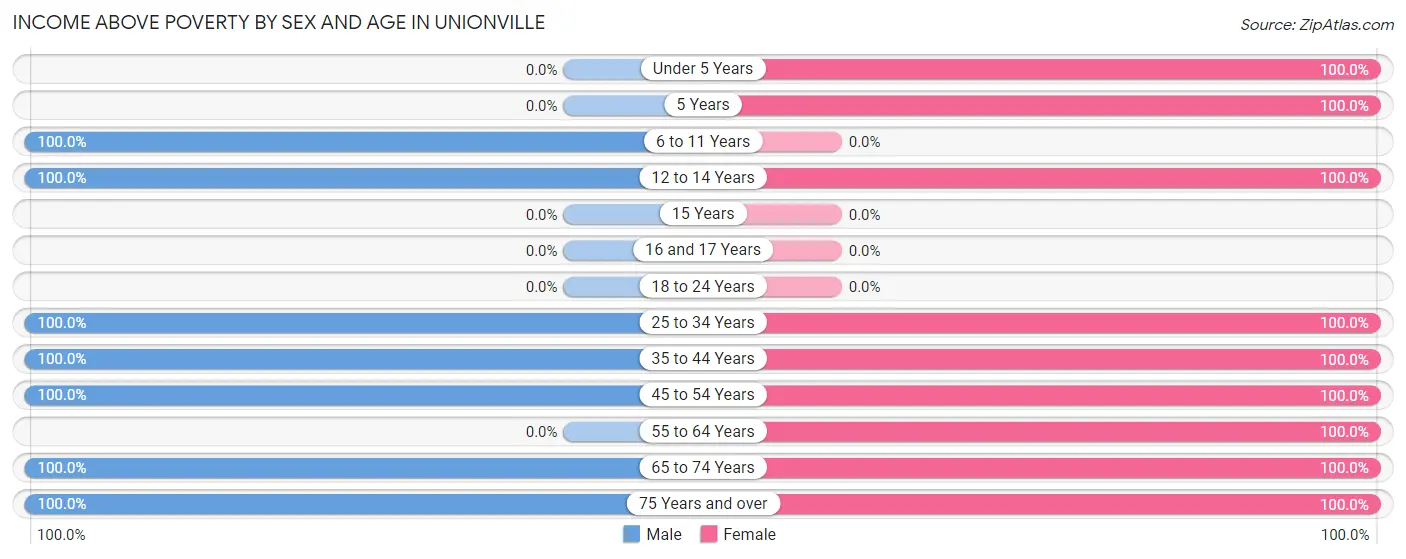
| Age Bracket | Male | Female |
| Under 5 Years | 0 (0.0%) | 15 (100.0%) |
| 5 Years | 0 (0.0%) | 7 (100.0%) |
| 6 to 11 Years | 14 (100.0%) | 0 (0.0%) |
| 12 to 14 Years | 19 (100.0%) | 34 (100.0%) |
| 15 Years | 0 (0.0%) | 0 (0.0%) |
| 16 and 17 Years | 0 (0.0%) | 0 (0.0%) |
| 18 to 24 Years | 0 (0.0%) | 0 (0.0%) |
| 25 to 34 Years | 16 (100.0%) | 34 (100.0%) |
| 35 to 44 Years | 25 (100.0%) | 5 (100.0%) |
| 45 to 54 Years | 22 (100.0%) | 35 (100.0%) |
| 55 to 64 Years | 0 (0.0%) | 69 (100.0%) |
| 65 to 74 Years | 137 (100.0%) | 43 (100.0%) |
| 75 Years and over | 118 (100.0%) | 129 (100.0%) |
| Total | 351 (100.0%) | 371 (100.0%) |
Income Below Poverty Among Married-Couple Families in Unionville
| Children | Above Poverty | Below Poverty |
| No Children | 218 (100.0%) | 0 (0.0%) |
| 1 or 2 Children | 21 (100.0%) | 0 (0.0%) |
| 3 or 4 Children | 0 (0.0%) | 0 (0.0%) |
| 5 or more Children | 0 (0.0%) | 0 (0.0%) |
| Total | 239 (100.0%) | 0 (0.0%) |
Income Below Poverty Among Single-Parent Households in Unionville
| Children | Single Father | Single Mother |
| No Children | 0 (0.0%) | 0 (0.0%) |
| 1 or 2 Children | 0 (0.0%) | 0 (0.0%) |
| 3 or 4 Children | 0 (0.0%) | 0 (0.0%) |
| 5 or more Children | 0 (0.0%) | 0 (0.0%) |
| Total | 0 (0.0%) | 0 (0.0%) |
Income Below Poverty Among Married-Couple vs Single-Parent Households in Unionville
| Children | Married-Couple Families | Single-Parent Households |
| No Children | 0 (0.0%) | 0 (0.0%) |
| 1 or 2 Children | 0 (0.0%) | 0 (0.0%) |
| 3 or 4 Children | 0 (0.0%) | 0 (0.0%) |
| 5 or more Children | 0 (0.0%) | 0 (0.0%) |
| Total | 0 (0.0%) | 0 (0.0%) |
Race in Unionville
The most populous races in Unionville are White / Caucasian (683 | 94.6%), Hispanic or Latino (39 | 5.4%), and Some other Race (39 | 5.4%).
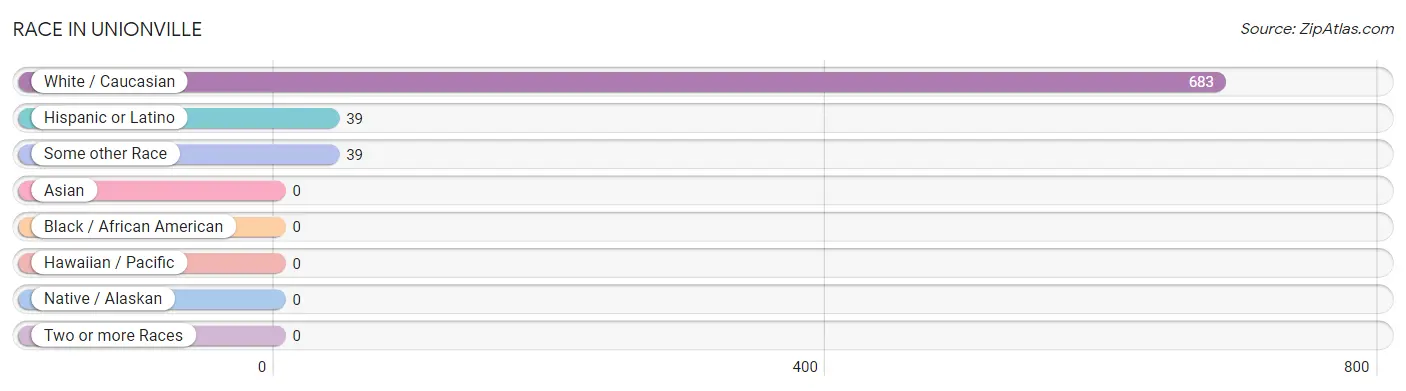
| Race | # Population | % Population |
| Asian | 0 | 0.0% |
| Black / African American | 0 | 0.0% |
| Hawaiian / Pacific | 0 | 0.0% |
| Hispanic or Latino | 39 | 5.4% |
| Native / Alaskan | 0 | 0.0% |
| White / Caucasian | 683 | 94.6% |
| Two or more Races | 0 | 0.0% |
| Some other Race | 39 | 5.4% |
| Total | 722 | 100.0% |
Ancestry in Unionville
The most populous ancestries reported in Unionville are English (359 | 49.7%), Irish (234 | 32.4%), German (142 | 19.7%), French (72 | 10.0%), and Hungarian (72 | 10.0%), together accounting for 121.7% of all Unionville residents.
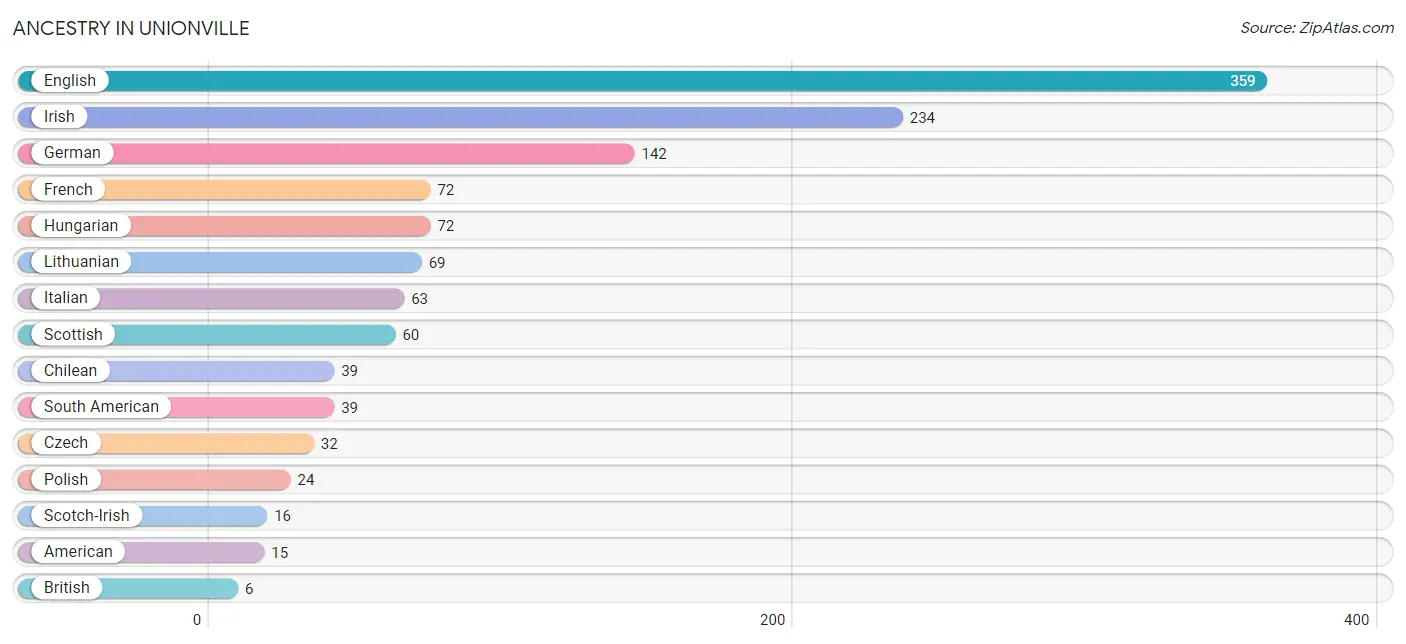
| Ancestry | # Population | % Population |
| American | 15 | 2.1% |
| British | 6 | 0.8% |
| Chilean | 39 | 5.4% |
| Czech | 32 | 4.4% |
| English | 359 | 49.7% |
| French | 72 | 10.0% |
| German | 142 | 19.7% |
| Hungarian | 72 | 10.0% |
| Irish | 234 | 32.4% |
| Italian | 63 | 8.7% |
| Lithuanian | 69 | 9.6% |
| Polish | 24 | 3.3% |
| Scotch-Irish | 16 | 2.2% |
| Scottish | 60 | 8.3% |
| South American | 39 | 5.4% | View All 15 Rows |
Immigrants in Unionville
The most numerous immigrant groups reported in Unionville came from Chile (18 | 2.5%), Latin America (18 | 2.5%), South America (18 | 2.5%), Europe (6 | 0.8%), and Northern Europe (6 | 0.8%), together accounting for 9.1% of all Unionville residents.
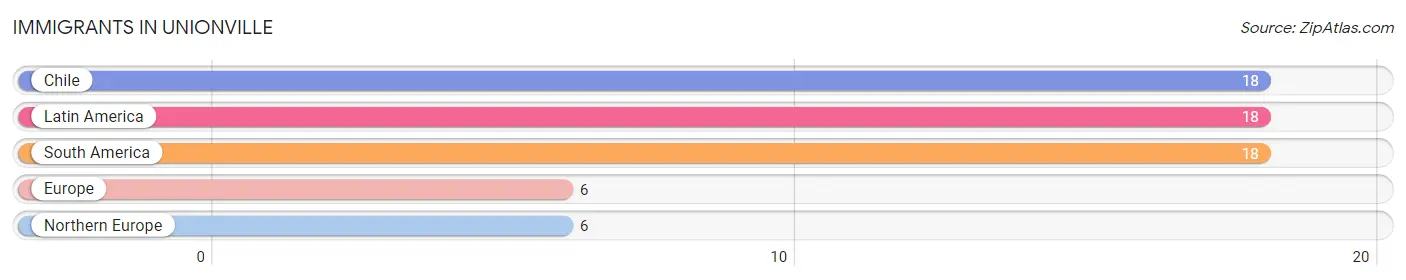
| Immigration Origin | # Population | % Population |
| Chile | 18 | 2.5% |
| Europe | 6 | 0.8% |
| Latin America | 18 | 2.5% |
| Northern Europe | 6 | 0.8% |
| South America | 18 | 2.5% | View All 5 Rows |
Sex and Age in Unionville
Sex and Age in Unionville
The most populous age groups in Unionville are 65 to 69 Years (108 | 30.8%) for men and 75 to 79 Years (90 | 24.3%) for women.
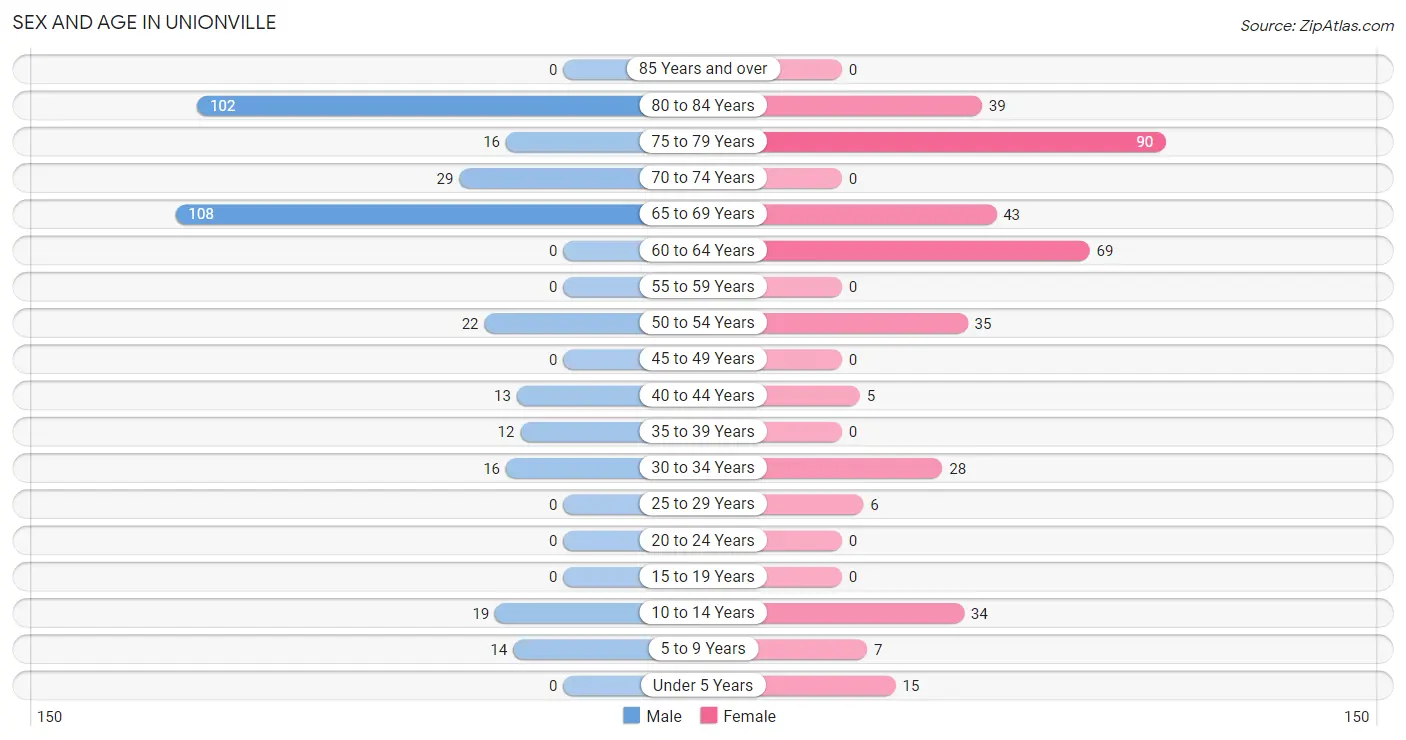
| Age Bracket | Male | Female |
| Under 5 Years | 0 (0.0%) | 15 (4.0%) |
| 5 to 9 Years | 14 (4.0%) | 7 (1.9%) |
| 10 to 14 Years | 19 (5.4%) | 34 (9.2%) |
| 15 to 19 Years | 0 (0.0%) | 0 (0.0%) |
| 20 to 24 Years | 0 (0.0%) | 0 (0.0%) |
| 25 to 29 Years | 0 (0.0%) | 6 (1.6%) |
| 30 to 34 Years | 16 (4.6%) | 28 (7.5%) |
| 35 to 39 Years | 12 (3.4%) | 0 (0.0%) |
| 40 to 44 Years | 13 (3.7%) | 5 (1.3%) |
| 45 to 49 Years | 0 (0.0%) | 0 (0.0%) |
| 50 to 54 Years | 22 (6.3%) | 35 (9.4%) |
| 55 to 59 Years | 0 (0.0%) | 0 (0.0%) |
| 60 to 64 Years | 0 (0.0%) | 69 (18.6%) |
| 65 to 69 Years | 108 (30.8%) | 43 (11.6%) |
| 70 to 74 Years | 29 (8.3%) | 0 (0.0%) |
| 75 to 79 Years | 16 (4.6%) | 90 (24.3%) |
| 80 to 84 Years | 102 (29.1%) | 39 (10.5%) |
| 85 Years and over | 0 (0.0%) | 0 (0.0%) |
| Total | 351 (100.0%) | 371 (100.0%) |
Families and Households in Unionville
Median Family Size in Unionville
The median family size in Unionville is 2.24 persons per family, with married-couple families (239 | 80.7%) accounting for the largest median family size of 2.32 persons per family. On the other hand, single male/father families (22 | 7.4%) represent the smallest median family size with 1.86 persons per family.
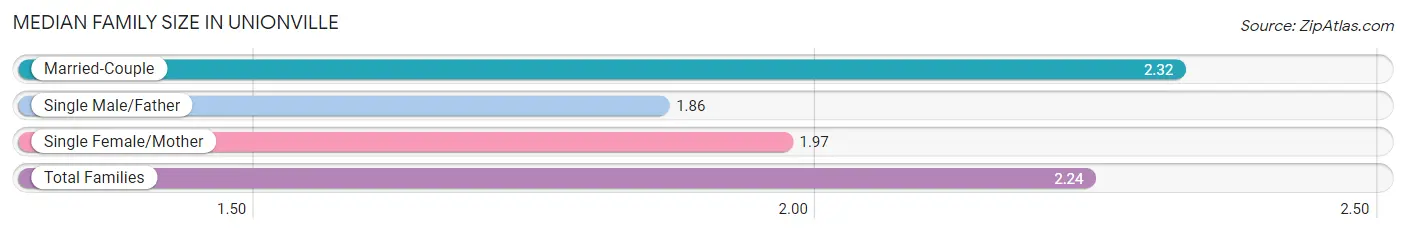
| Family Type | # Families | Family Size |
| Married-Couple | 239 (80.7%) | 2.32 |
| Single Male/Father | 22 (7.4%) | 1.86 |
| Single Female/Mother | 35 (11.8%) | 1.97 |
| Total Families | 296 (100.0%) | 2.24 |
Median Household Size in Unionville
The median household size in Unionville is 2.10 persons per household, with married-couple households (239 | 69.7%) accounting for the largest median household size of 2.32 persons per household. non-family households (47 | 13.7%) represent the smallest median household size with 1.23 persons per household.
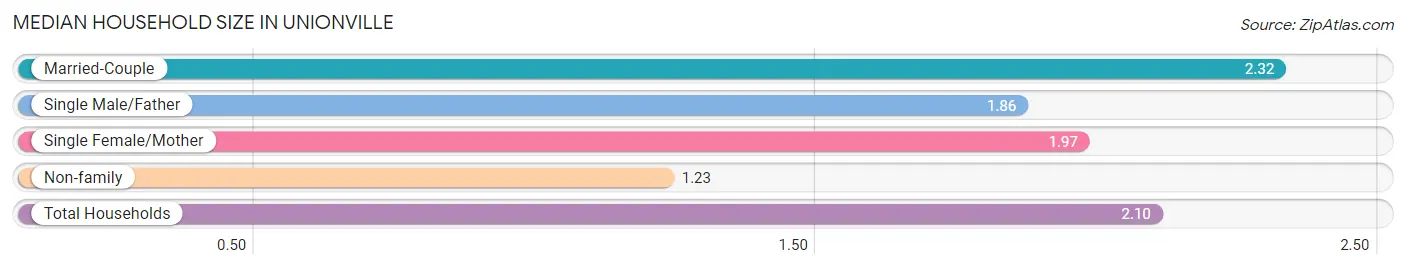
| Household Type | # Households | Household Size |
| Married-Couple | 239 (69.7%) | 2.32 |
| Single Male/Father | 22 (6.4%) | 1.86 |
| Single Female/Mother | 35 (10.2%) | 1.97 |
| Non-family | 47 (13.7%) | 1.23 |
| Total Households | 343 (100.0%) | 2.10 |
Household Size by Marriage Status in Unionville
Out of a total of 343 households in Unionville, 296 (86.3%) are family households, while 47 (13.7%) are nonfamily households. The most numerous type of family households are 2-person households, comprising 275, and the most common type of nonfamily households are 1-person households, comprising 36.
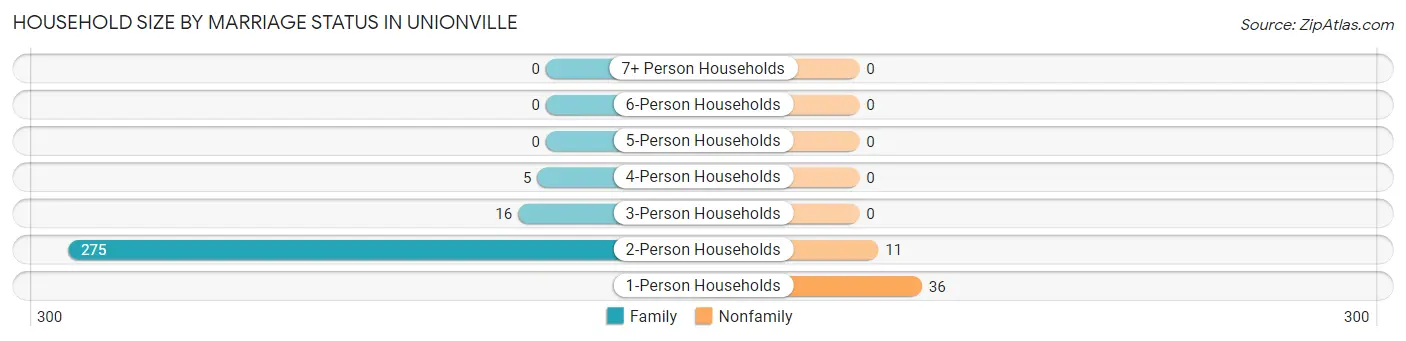
| Household Size | Family Households | Nonfamily Households |
| 1-Person Households | - | 36 (10.5%) |
| 2-Person Households | 275 (80.2%) | 11 (3.2%) |
| 3-Person Households | 16 (4.7%) | 0 (0.0%) |
| 4-Person Households | 5 (1.5%) | 0 (0.0%) |
| 5-Person Households | 0 (0.0%) | 0 (0.0%) |
| 6-Person Households | 0 (0.0%) | 0 (0.0%) |
| 7+ Person Households | 0 (0.0%) | 0 (0.0%) |
| Total | 296 (86.3%) | 47 (13.7%) |
Female Fertility in Unionville
Fertility by Age in Unionville
| Age Bracket | Women with Births | Births / 1,000 Women |
| 15 to 19 years | 0 (0.0%) | 0.0 |
| 20 to 34 years | 0 (0.0%) | 0.0 |
| 35 to 50 years | 0 (0.0%) | 0.0 |
| Total | 0 (0.0%) | 0.0 |
Fertility by Age by Marriage Status in Unionville
| Age Bracket | Married | Unmarried |
| 15 to 19 years | 0 (0.0%) | 0 (0.0%) |
| 20 to 34 years | 0 (0.0%) | 0 (0.0%) |
| 35 to 50 years | 0 (0.0%) | 0 (0.0%) |
| Total | 0 (0.0%) | 0 (0.0%) |
Fertility by Education in Unionville
| Educational Attainment | Women with Births | Births / 1,000 Women |
| Less than High School | 0 (0.0%) | 0.0 |
| High School Diploma | 0 (0.0%) | 0.0 |
| College or Associate's Degree | 0 (0.0%) | 0.0 |
| Bachelor's Degree | 0 (0.0%) | 0.0 |
| Graduate Degree | 0 (0.0%) | 0.0 |
| Total | 0 (0.0%) | 0.0 |
Fertility by Education by Marriage Status in Unionville
| Educational Attainment | Married | Unmarried |
| Less than High School | 0 (0.0%) | 0 (0.0%) |
| High School Diploma | 0 (0.0%) | 0 (0.0%) |
| College or Associate's Degree | 0 (0.0%) | 0 (0.0%) |
| Bachelor's Degree | 0 (0.0%) | 0 (0.0%) |
| Graduate Degree | 0 (0.0%) | 0 (0.0%) |
| Total | 0 (0.0%) | 0 (0.0%) |
Employment Characteristics in Unionville
Employment by Class of Employer in Unionville
Among the 315 employed individuals in Unionville, private company employees (155 | 49.2%), state government employees (72 | 22.9%), and local government employees (51 | 16.2%) make up the most common classes of employment.
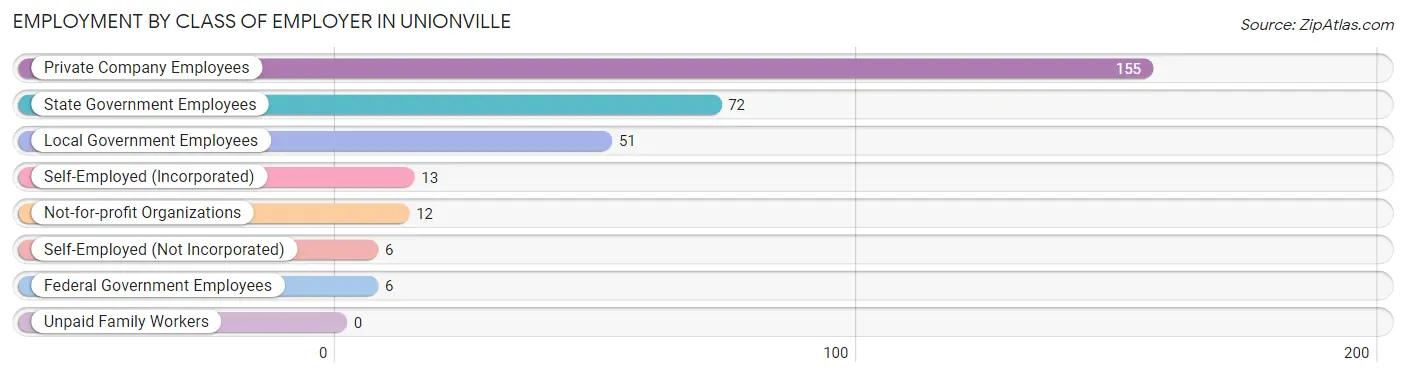
| Employer Class | # Employees | % Employees |
| Private Company Employees | 155 | 49.2% |
| Self-Employed (Incorporated) | 13 | 4.1% |
| Self-Employed (Not Incorporated) | 6 | 1.9% |
| Not-for-profit Organizations | 12 | 3.8% |
| Local Government Employees | 51 | 16.2% |
| State Government Employees | 72 | 22.9% |
| Federal Government Employees | 6 | 1.9% |
| Unpaid Family Workers | 0 | 0.0% |
| Total | 315 | 100.0% |
Employment Status by Age in Unionville
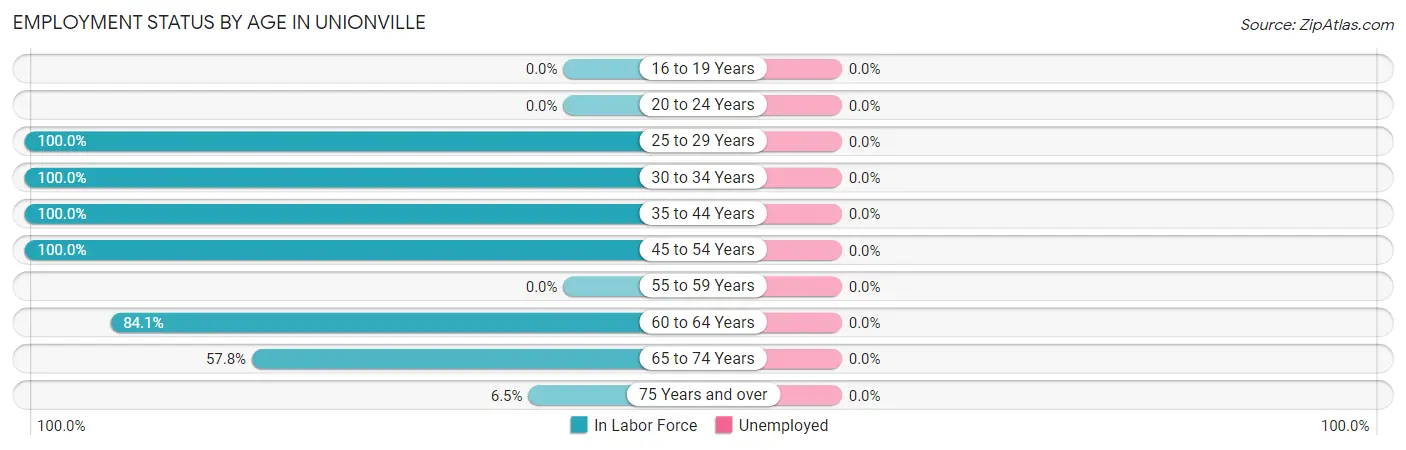
| Age Bracket | In Labor Force | Unemployed |
| 16 to 19 Years | 0 (0.0%) | 0 (0.0%) |
| 20 to 24 Years | 0 (0.0%) | 0 (0.0%) |
| 25 to 29 Years | 6 (100.0%) | 0 (0.0%) |
| 30 to 34 Years | 44 (100.0%) | 0 (0.0%) |
| 35 to 44 Years | 30 (100.0%) | 0 (0.0%) |
| 45 to 54 Years | 57 (100.0%) | 0 (0.0%) |
| 55 to 59 Years | 0 (0.0%) | 0 (0.0%) |
| 60 to 64 Years | 58 (84.1%) | 0 (0.0%) |
| 65 to 74 Years | 104 (57.8%) | 0 (0.0%) |
| 75 Years and over | 16 (6.5%) | 0 (0.0%) |
| Total | 315 (49.8%) | 0 (0.0%) |
Employment Status by Educational Attainment in Unionville
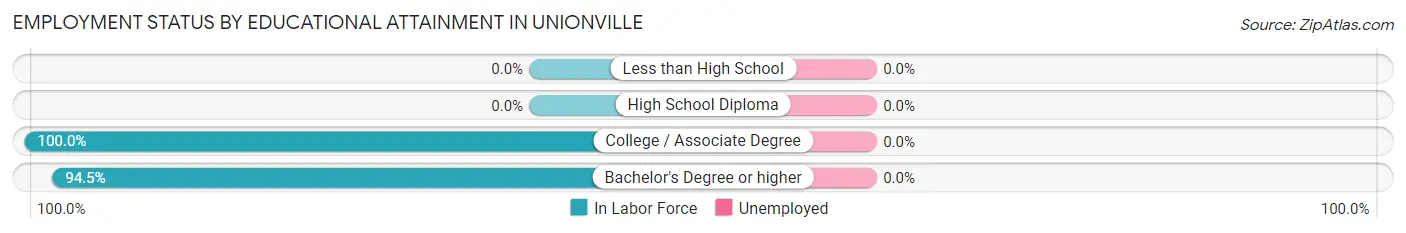
| Educational Attainment | In Labor Force | Unemployed |
| Less than High School | 0 (0.0%) | 0 (0.0%) |
| High School Diploma | 0 (0.0%) | 0 (0.0%) |
| College / Associate Degree | 6 (100.0%) | 0 (0.0%) |
| Bachelor's Degree or higher | 189 (94.5%) | 0 (0.0%) |
| Total | 195 (94.7%) | 0 (0.0%) |
Employment Occupations by Sex in Unionville
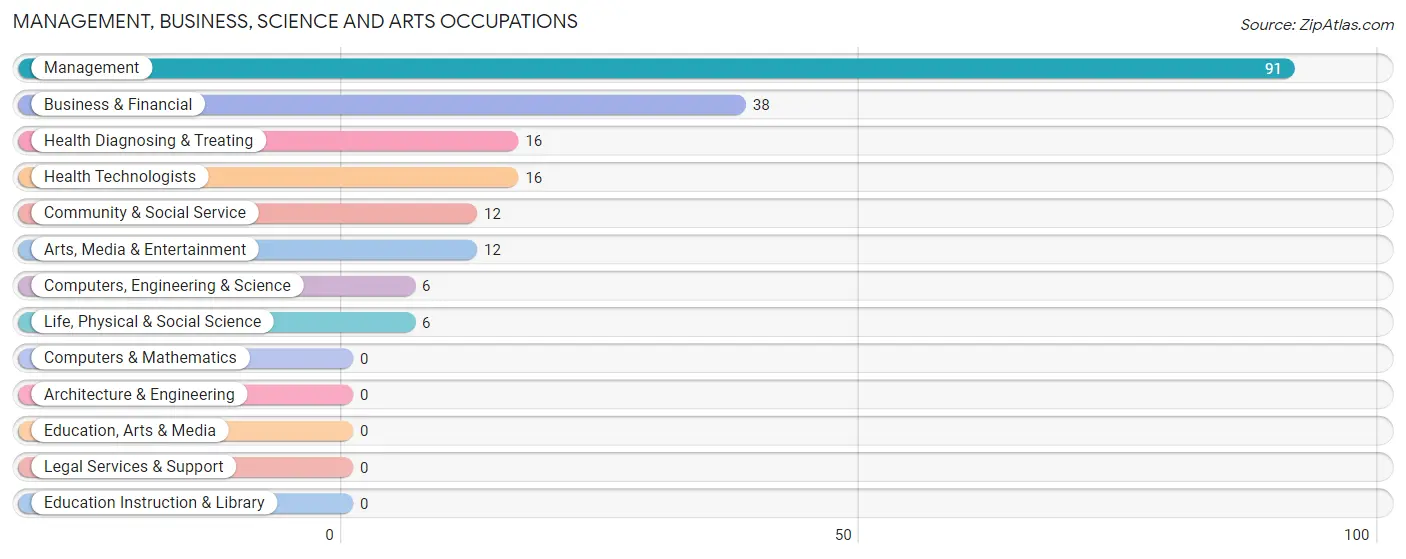
Management, Business, Science and Arts Occupations
The most common Management, Business, Science and Arts occupations in Unionville are Management (91 | 28.9%), Business & Financial (38 | 12.1%), Health Diagnosing & Treating (16 | 5.1%), Health Technologists (16 | 5.1%), and Community & Social Service (12 | 3.8%).
Management, Business, Science and Arts Occupations by Sex
Within the Management, Business, Science and Arts occupations in Unionville, the most male-oriented occupations are Business & Financial (100.0%), Community & Social Service (100.0%), and Arts, Media & Entertainment (100.0%), while the most female-oriented occupations are Computers, Engineering & Science (100.0%), Life, Physical & Social Science (100.0%), and Health Diagnosing & Treating (100.0%).
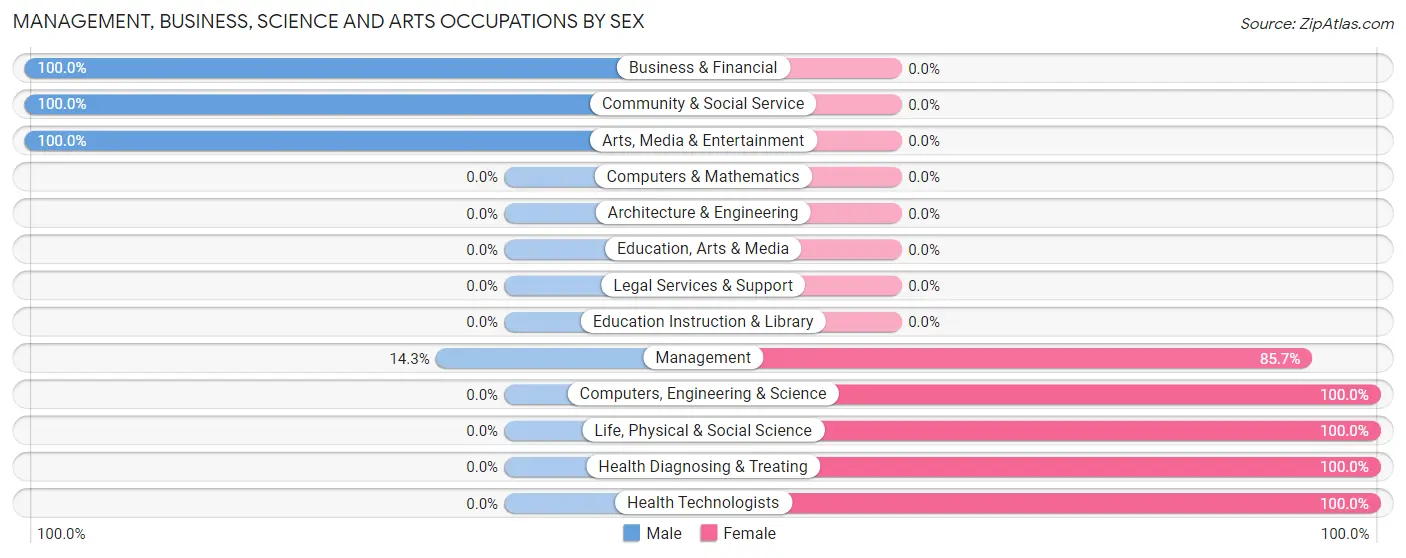
| Occupation | Male | Female |
| Management | 13 (14.3%) | 78 (85.7%) |
| Business & Financial | 38 (100.0%) | 0 (0.0%) |
| Computers, Engineering & Science | 0 (0.0%) | 6 (100.0%) |
| Computers & Mathematics | 0 (0.0%) | 0 (0.0%) |
| Architecture & Engineering | 0 (0.0%) | 0 (0.0%) |
| Life, Physical & Social Science | 0 (0.0%) | 6 (100.0%) |
| Community & Social Service | 12 (100.0%) | 0 (0.0%) |
| Education, Arts & Media | 0 (0.0%) | 0 (0.0%) |
| Legal Services & Support | 0 (0.0%) | 0 (0.0%) |
| Education Instruction & Library | 0 (0.0%) | 0 (0.0%) |
| Arts, Media & Entertainment | 12 (100.0%) | 0 (0.0%) |
| Health Diagnosing & Treating | 0 (0.0%) | 16 (100.0%) |
| Health Technologists | 0 (0.0%) | 16 (100.0%) |
| Total (Category) | 63 (38.7%) | 100 (61.4%) |
| Total (Overall) | 157 (49.8%) | 158 (50.2%) |
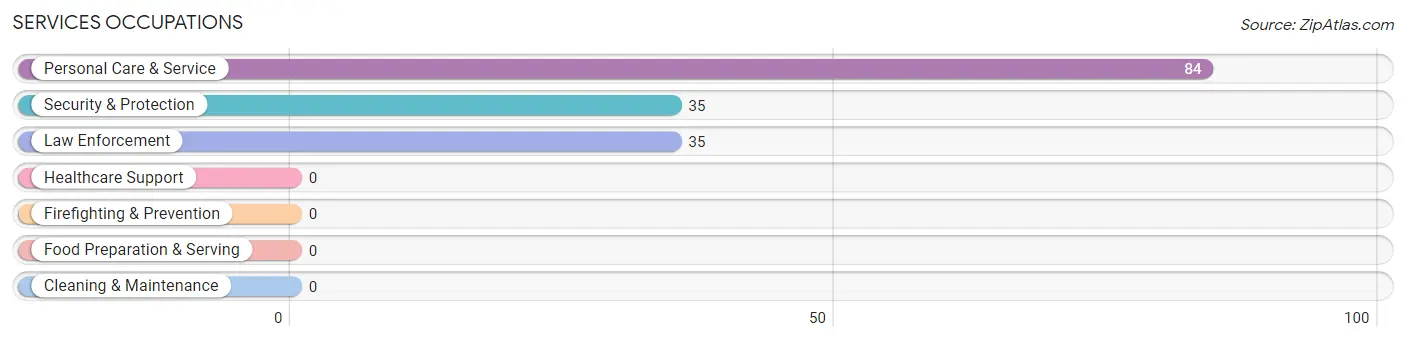
Services Occupations
The most common Services occupations in Unionville are Personal Care & Service (84 | 26.7%), Security & Protection (35 | 11.1%), and Law Enforcement (35 | 11.1%).
Services Occupations by Sex
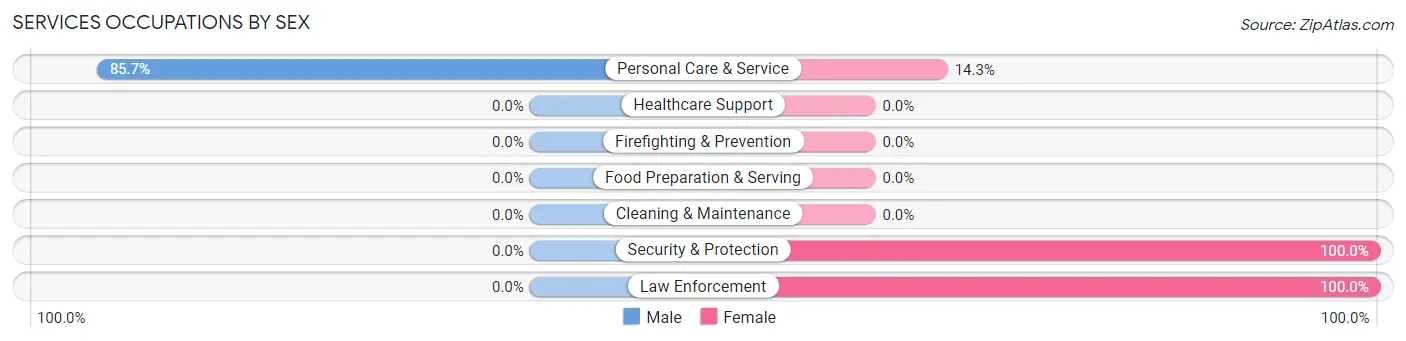
| Occupation | Male | Female |
| Healthcare Support | 0 (0.0%) | 0 (0.0%) |
| Security & Protection | 0 (0.0%) | 35 (100.0%) |
| Firefighting & Prevention | 0 (0.0%) | 0 (0.0%) |
| Law Enforcement | 0 (0.0%) | 35 (100.0%) |
| Food Preparation & Serving | 0 (0.0%) | 0 (0.0%) |
| Cleaning & Maintenance | 0 (0.0%) | 0 (0.0%) |
| Personal Care & Service | 72 (85.7%) | 12 (14.3%) |
| Total (Category) | 72 (60.5%) | 47 (39.5%) |
| Total (Overall) | 157 (49.8%) | 158 (50.2%) |
Sales and Office Occupations
The most common Sales and Office occupations in Unionville are Sales & Related (16 | 5.1%), and Office & Administration (6 | 1.9%).
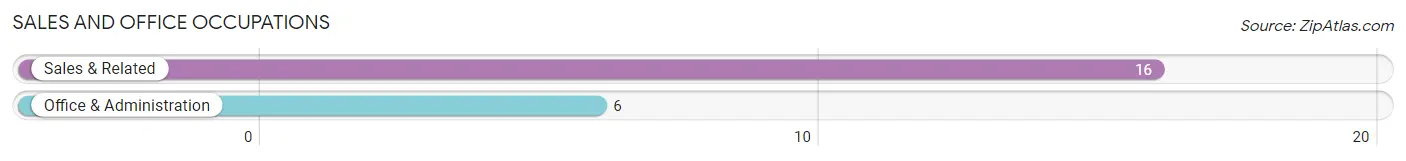
Sales and Office Occupations by Sex

| Occupation | Male | Female |
| Sales & Related | 16 (100.0%) | 0 (0.0%) |
| Office & Administration | 0 (0.0%) | 6 (100.0%) |
| Total (Category) | 16 (72.7%) | 6 (27.3%) |
| Total (Overall) | 157 (49.8%) | 158 (50.2%) |
Natural Resources, Construction and Maintenance Occupations
The most common Natural Resources, Construction and Maintenance occupations in Unionville are , and Construction & Extraction (6 | 1.9%).
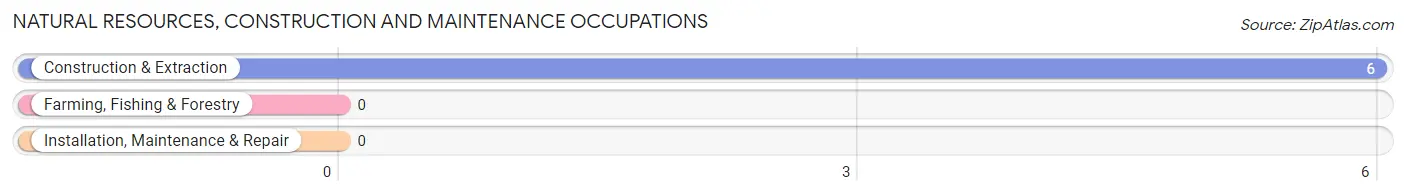
Natural Resources, Construction and Maintenance Occupations by Sex
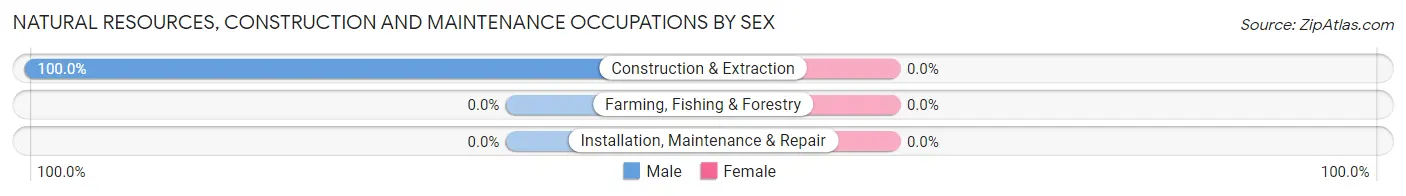
| Occupation | Male | Female |
| Farming, Fishing & Forestry | 0 (0.0%) | 0 (0.0%) |
| Construction & Extraction | 6 (100.0%) | 0 (0.0%) |
| Installation, Maintenance & Repair | 0 (0.0%) | 0 (0.0%) |
| Total (Category) | 6 (100.0%) | 0 (0.0%) |
| Total (Overall) | 157 (49.8%) | 158 (50.2%) |
Production, Transportation and Moving Occupations
The most common Production, Transportation and Moving occupations in Unionville are , and Production (5 | 1.6%).
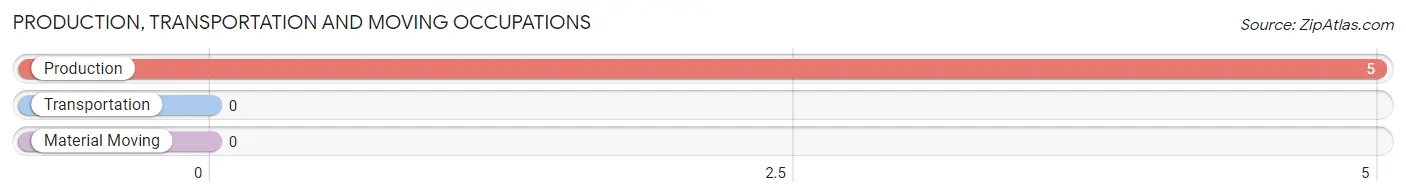
Production, Transportation and Moving Occupations by Sex
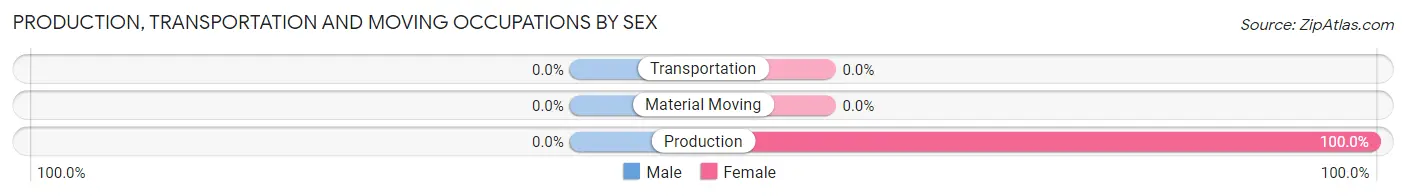
| Occupation | Male | Female |
| Production | 0 (0.0%) | 5 (100.0%) |
| Transportation | 0 (0.0%) | 0 (0.0%) |
| Material Moving | 0 (0.0%) | 0 (0.0%) |
| Total (Category) | 0 (0.0%) | 5 (100.0%) |
| Total (Overall) | 157 (49.8%) | 158 (50.2%) |
Employment Industries by Sex in Unionville
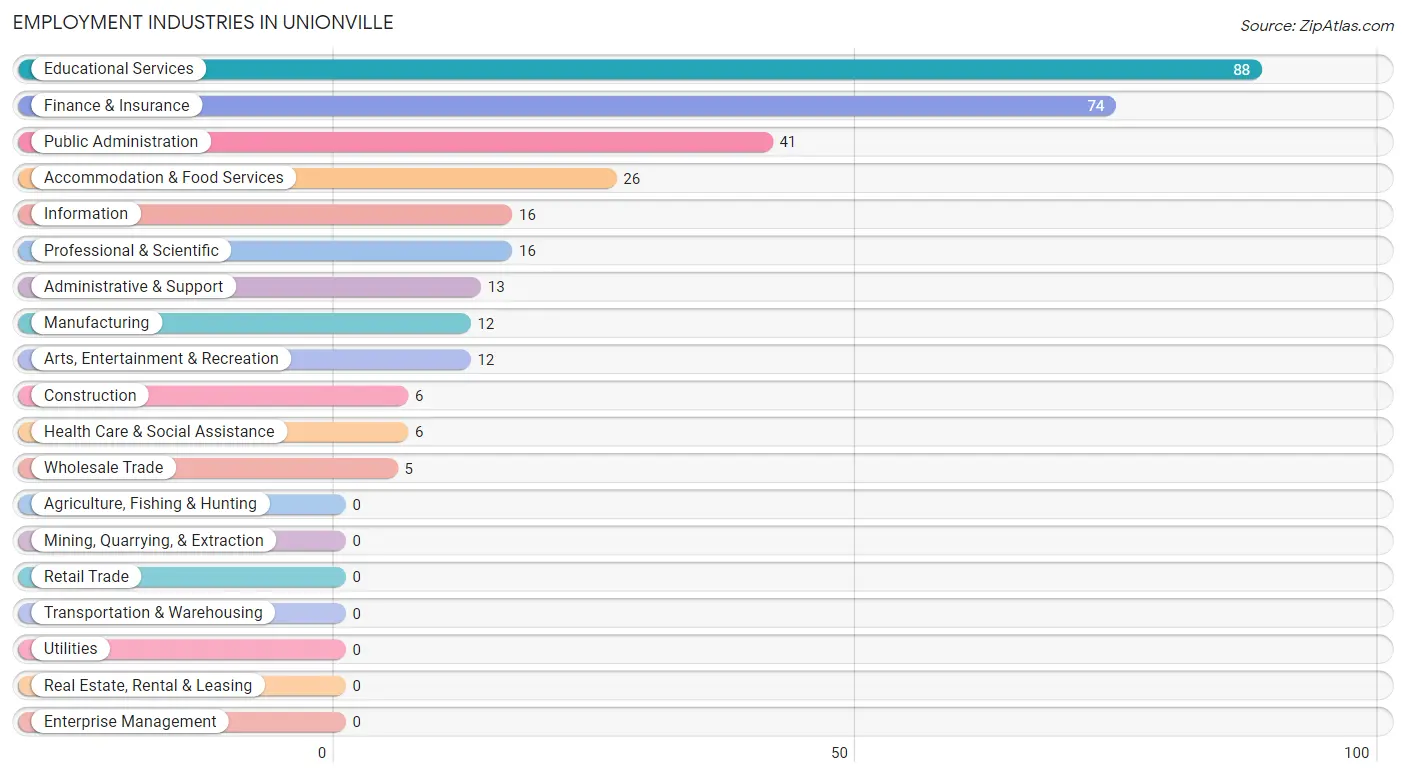
Employment Industries in Unionville
The major employment industries in Unionville include Educational Services (88 | 27.9%), Finance & Insurance (74 | 23.5%), Public Administration (41 | 13.0%), Accommodation & Food Services (26 | 8.3%), and Information (16 | 5.1%).
Employment Industries by Sex in Unionville
The Unionville industries that see more men than women are Construction (100.0%), Manufacturing (100.0%), and Information (100.0%), whereas the industries that tend to have a higher number of women are Wholesale Trade (100.0%), Health Care & Social Assistance (100.0%), and Arts, Entertainment & Recreation (100.0%).
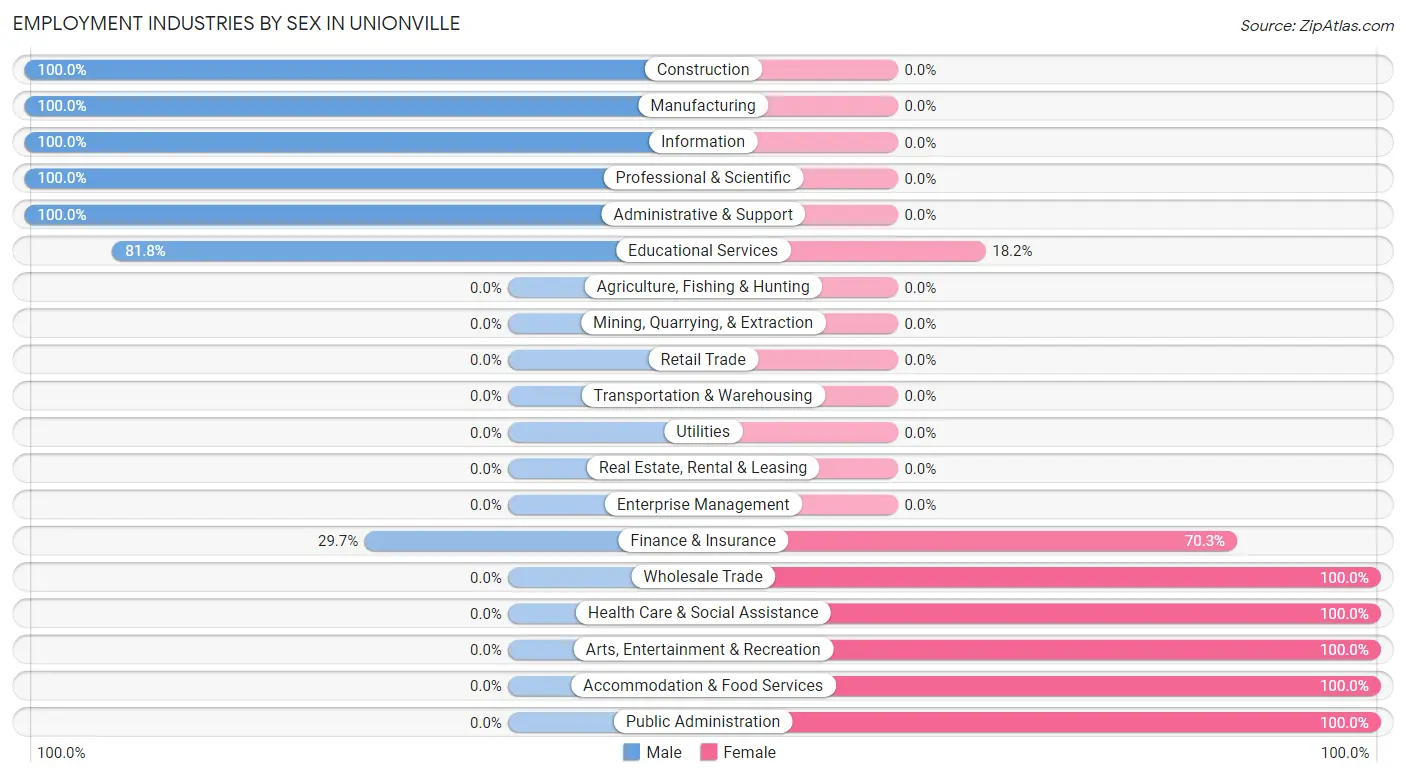
| Industry | Male | Female |
| Agriculture, Fishing & Hunting | 0 (0.0%) | 0 (0.0%) |
| Mining, Quarrying, & Extraction | 0 (0.0%) | 0 (0.0%) |
| Construction | 6 (100.0%) | 0 (0.0%) |
| Manufacturing | 12 (100.0%) | 0 (0.0%) |
| Wholesale Trade | 0 (0.0%) | 5 (100.0%) |
| Retail Trade | 0 (0.0%) | 0 (0.0%) |
| Transportation & Warehousing | 0 (0.0%) | 0 (0.0%) |
| Utilities | 0 (0.0%) | 0 (0.0%) |
| Information | 16 (100.0%) | 0 (0.0%) |
| Finance & Insurance | 22 (29.7%) | 52 (70.3%) |
| Real Estate, Rental & Leasing | 0 (0.0%) | 0 (0.0%) |
| Professional & Scientific | 16 (100.0%) | 0 (0.0%) |
| Enterprise Management | 0 (0.0%) | 0 (0.0%) |
| Administrative & Support | 13 (100.0%) | 0 (0.0%) |
| Educational Services | 72 (81.8%) | 16 (18.2%) |
| Health Care & Social Assistance | 0 (0.0%) | 6 (100.0%) |
| Arts, Entertainment & Recreation | 0 (0.0%) | 12 (100.0%) |
| Accommodation & Food Services | 0 (0.0%) | 26 (100.0%) |
| Public Administration | 0 (0.0%) | 41 (100.0%) |
| Total | 157 (49.8%) | 158 (50.2%) |
Education in Unionville
School Enrollment in Unionville
The most common levels of schooling among the 67 students in Unionville are middle school (53 | 79.1%), and elementary school (14 | 20.9%).
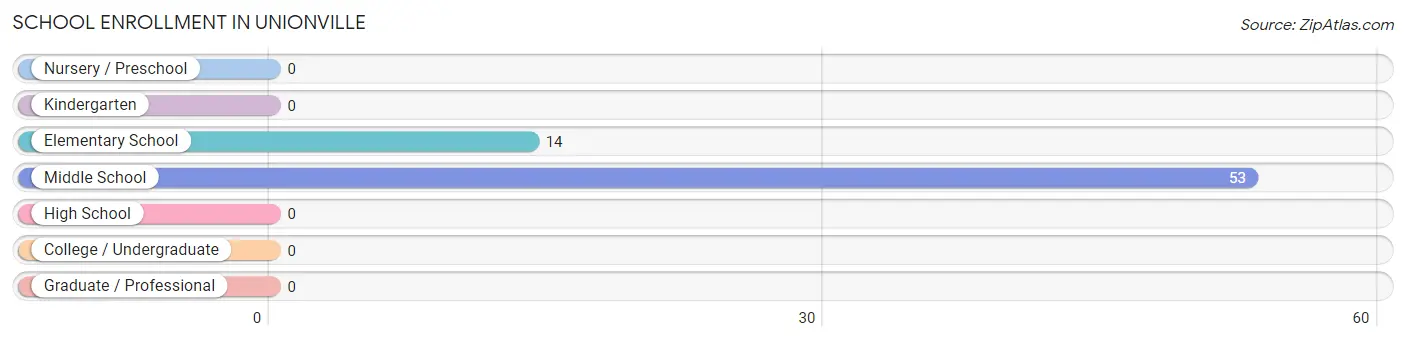
| School Level | # Students | % Students |
| Nursery / Preschool | 0 | 0.0% |
| Kindergarten | 0 | 0.0% |
| Elementary School | 14 | 20.9% |
| Middle School | 53 | 79.1% |
| High School | 0 | 0.0% |
| College / Undergraduate | 0 | 0.0% |
| Graduate / Professional | 0 | 0.0% |
| Total | 67 | 100.0% |
School Enrollment by Age by Funding Source in Unionville
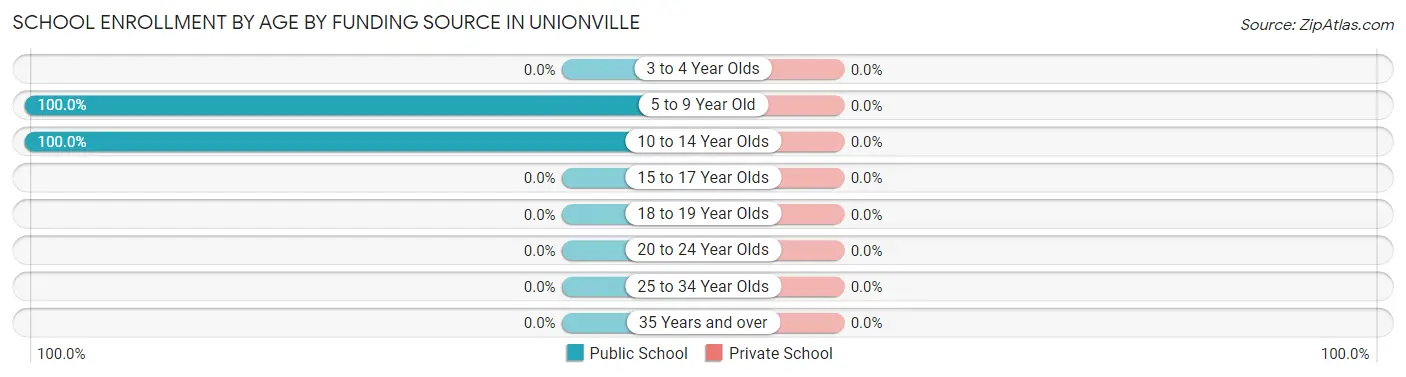
| Age Bracket | Public School | Private School |
| 3 to 4 Year Olds | 0 (0.0%) | 0 (0.0%) |
| 5 to 9 Year Old | 14 (100.0%) | 0 (0.0%) |
| 10 to 14 Year Olds | 53 (100.0%) | 0 (0.0%) |
| 15 to 17 Year Olds | 0 (0.0%) | 0 (0.0%) |
| 18 to 19 Year Olds | 0 (0.0%) | 0 (0.0%) |
| 20 to 24 Year Olds | 0 (0.0%) | 0 (0.0%) |
| 25 to 34 Year Olds | 0 (0.0%) | 0 (0.0%) |
| 35 Years and over | 0 (0.0%) | 0 (0.0%) |
| Total | 67 (100.0%) | 0 (0.0%) |
Educational Attainment by Field of Study in Unionville
Bio, nature & agricultural (55 | 17.6%), social sciences (52 | 16.7%), arts & humanities (51 | 16.4%), liberal arts & history (35 | 11.2%), and business (33 | 10.6%) are the most common fields of study among 312 individuals in Unionville who have obtained a bachelor's degree or higher.
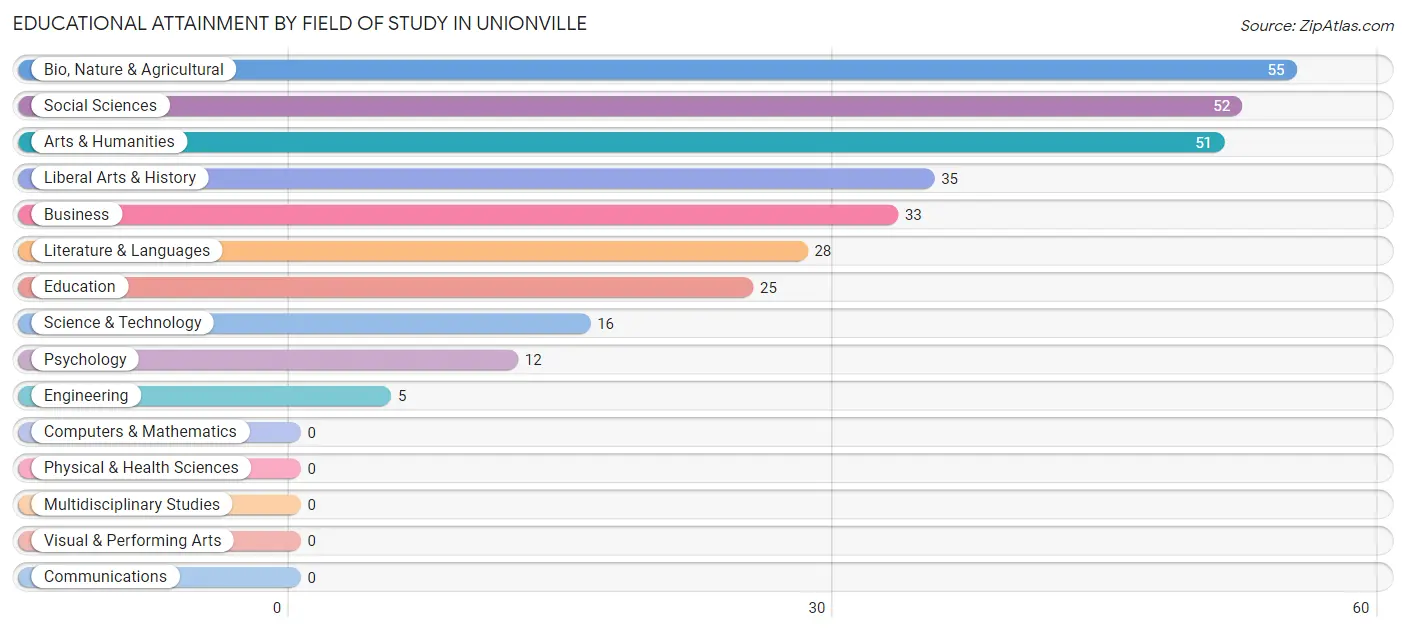
| Field of Study | # Graduates | % Graduates |
| Computers & Mathematics | 0 | 0.0% |
| Bio, Nature & Agricultural | 55 | 17.6% |
| Physical & Health Sciences | 0 | 0.0% |
| Psychology | 12 | 3.8% |
| Social Sciences | 52 | 16.7% |
| Engineering | 5 | 1.6% |
| Multidisciplinary Studies | 0 | 0.0% |
| Science & Technology | 16 | 5.1% |
| Business | 33 | 10.6% |
| Education | 25 | 8.0% |
| Literature & Languages | 28 | 9.0% |
| Liberal Arts & History | 35 | 11.2% |
| Visual & Performing Arts | 0 | 0.0% |
| Communications | 0 | 0.0% |
| Arts & Humanities | 51 | 16.4% |
| Total | 312 | 100.0% |
Transportation & Commute in Unionville
Vehicle Availability by Sex in Unionville
The most prevalent vehicle ownership categories in Unionville are males with 3 vehicles (78, accounting for 49.7%) and females with 3 vehicles (93, making up 49.4%).
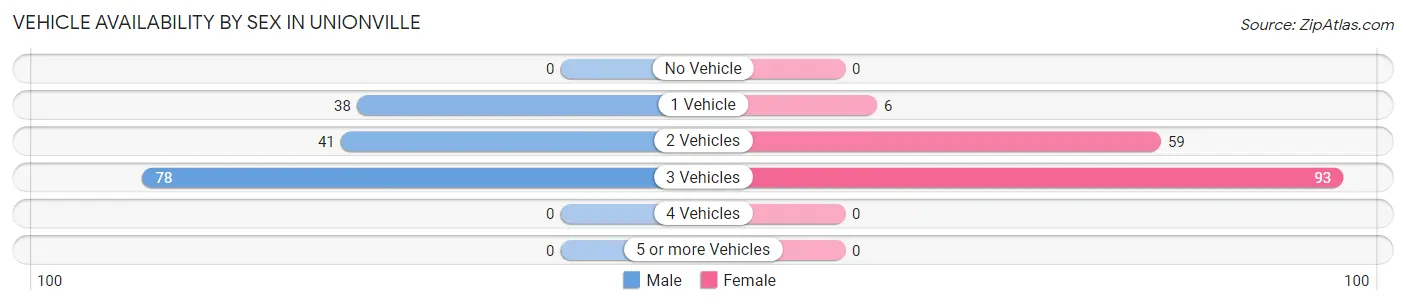
| Vehicles Available | Male | Female |
| No Vehicle | 0 (0.0%) | 0 (0.0%) |
| 1 Vehicle | 38 (24.2%) | 6 (3.8%) |
| 2 Vehicles | 41 (26.1%) | 59 (37.3%) |
| 3 Vehicles | 78 (49.7%) | 93 (58.9%) |
| 4 Vehicles | 0 (0.0%) | 0 (0.0%) |
| 5 or more Vehicles | 0 (0.0%) | 0 (0.0%) |
| Total | 157 (100.0%) | 158 (100.0%) |
Commute Time in Unionville
The most frequently occuring commute durations in Unionville are 10 to 14 minutes (103 commuters, 41.9%), 20 to 24 minutes (58 commuters, 23.6%), and 25 to 29 minutes (28 commuters, 11.4%).
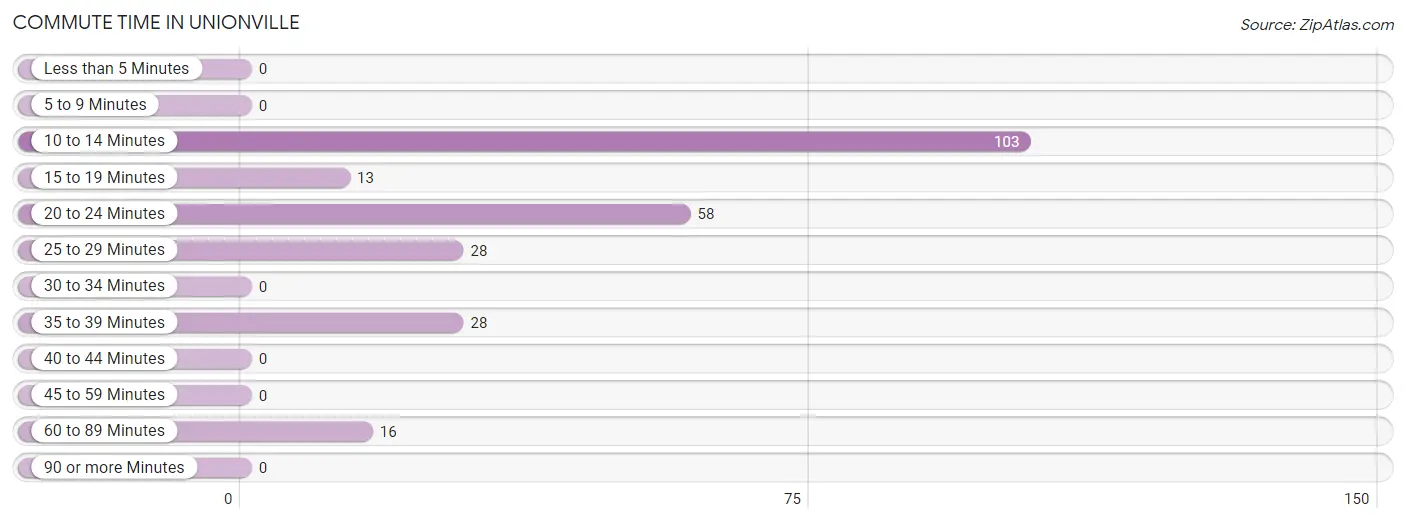
| Commute Time | # Commuters | % Commuters |
| Less than 5 Minutes | 0 | 0.0% |
| 5 to 9 Minutes | 0 | 0.0% |
| 10 to 14 Minutes | 103 | 41.9% |
| 15 to 19 Minutes | 13 | 5.3% |
| 20 to 24 Minutes | 58 | 23.6% |
| 25 to 29 Minutes | 28 | 11.4% |
| 30 to 34 Minutes | 0 | 0.0% |
| 35 to 39 Minutes | 28 | 11.4% |
| 40 to 44 Minutes | 0 | 0.0% |
| 45 to 59 Minutes | 0 | 0.0% |
| 60 to 89 Minutes | 16 | 6.5% |
| 90 or more Minutes | 0 | 0.0% |
Commute Time by Sex in Unionville
The most common commute times in Unionville are 10 to 14 minutes (72 commuters, 55.8%) for males and 20 to 24 minutes (58 commuters, 49.6%) for females.
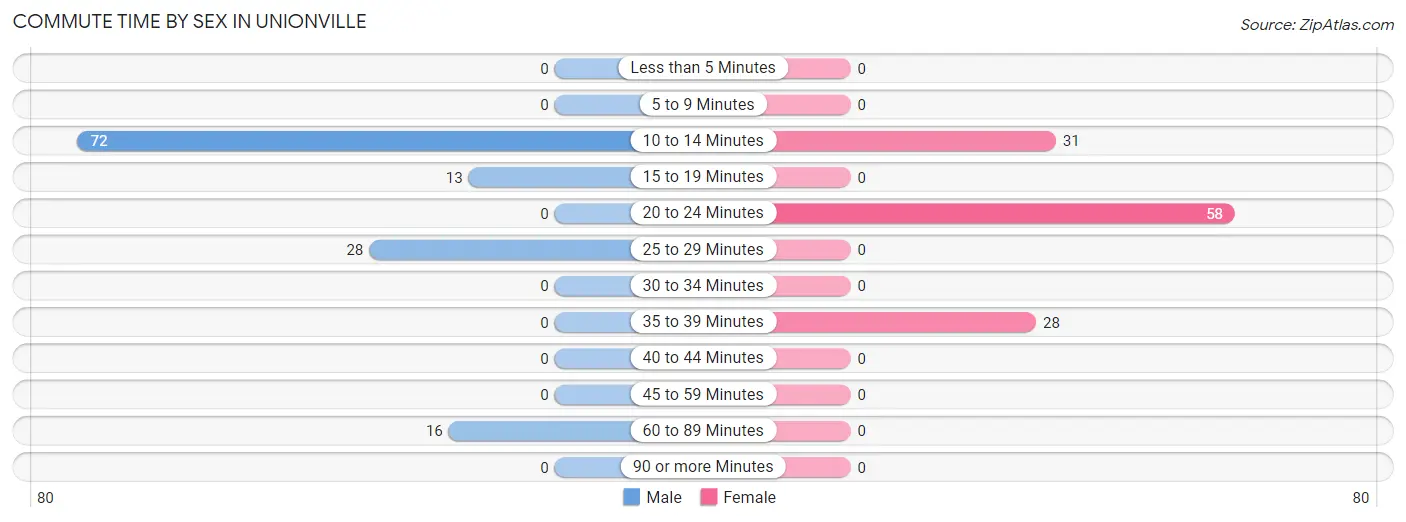
| Commute Time | Male | Female |
| Less than 5 Minutes | 0 (0.0%) | 0 (0.0%) |
| 5 to 9 Minutes | 0 (0.0%) | 0 (0.0%) |
| 10 to 14 Minutes | 72 (55.8%) | 31 (26.5%) |
| 15 to 19 Minutes | 13 (10.1%) | 0 (0.0%) |
| 20 to 24 Minutes | 0 (0.0%) | 58 (49.6%) |
| 25 to 29 Minutes | 28 (21.7%) | 0 (0.0%) |
| 30 to 34 Minutes | 0 (0.0%) | 0 (0.0%) |
| 35 to 39 Minutes | 0 (0.0%) | 28 (23.9%) |
| 40 to 44 Minutes | 0 (0.0%) | 0 (0.0%) |
| 45 to 59 Minutes | 0 (0.0%) | 0 (0.0%) |
| 60 to 89 Minutes | 16 (12.4%) | 0 (0.0%) |
| 90 or more Minutes | 0 (0.0%) | 0 (0.0%) |
Time of Departure to Work by Sex in Unionville
The most frequent times of departure to work in Unionville are 8:00 AM to 8:29 AM (113, 87.6%) for males and 8:30 AM to 8:59 AM (52, 44.4%) for females.
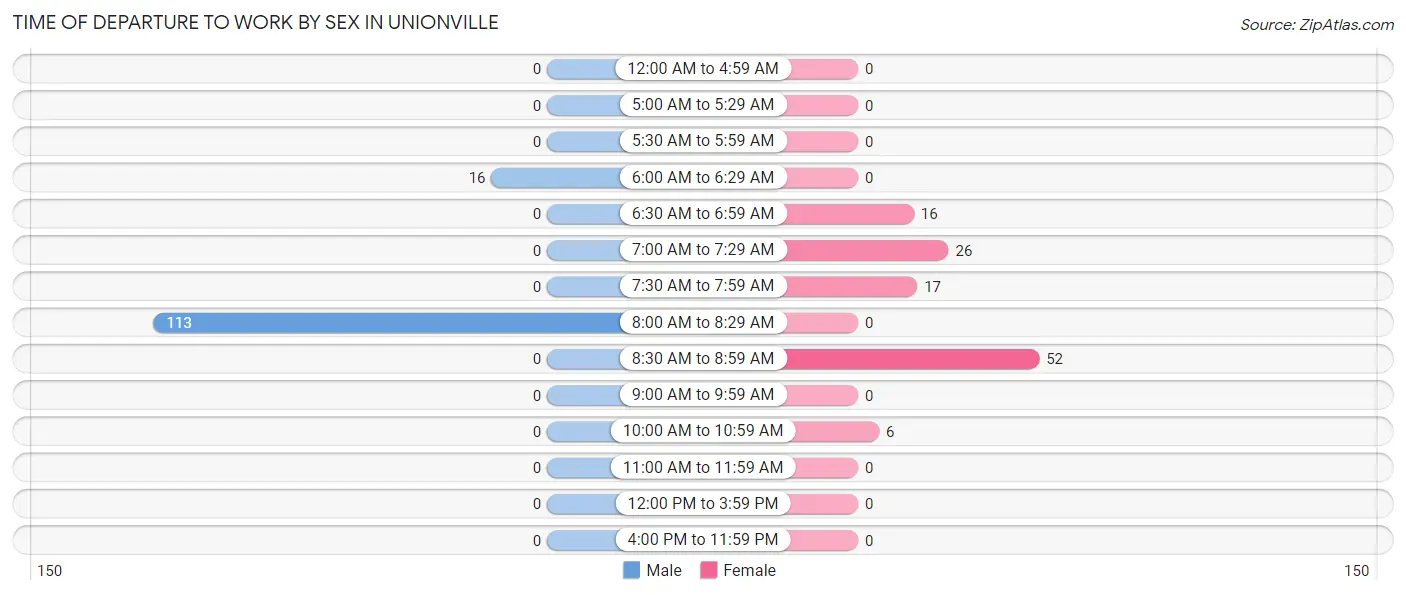
| Time of Departure | Male | Female |
| 12:00 AM to 4:59 AM | 0 (0.0%) | 0 (0.0%) |
| 5:00 AM to 5:29 AM | 0 (0.0%) | 0 (0.0%) |
| 5:30 AM to 5:59 AM | 0 (0.0%) | 0 (0.0%) |
| 6:00 AM to 6:29 AM | 16 (12.4%) | 0 (0.0%) |
| 6:30 AM to 6:59 AM | 0 (0.0%) | 16 (13.7%) |
| 7:00 AM to 7:29 AM | 0 (0.0%) | 26 (22.2%) |
| 7:30 AM to 7:59 AM | 0 (0.0%) | 17 (14.5%) |
| 8:00 AM to 8:29 AM | 113 (87.6%) | 0 (0.0%) |
| 8:30 AM to 8:59 AM | 0 (0.0%) | 52 (44.4%) |
| 9:00 AM to 9:59 AM | 0 (0.0%) | 0 (0.0%) |
| 10:00 AM to 10:59 AM | 0 (0.0%) | 6 (5.1%) |
| 11:00 AM to 11:59 AM | 0 (0.0%) | 0 (0.0%) |
| 12:00 PM to 3:59 PM | 0 (0.0%) | 0 (0.0%) |
| 4:00 PM to 11:59 PM | 0 (0.0%) | 0 (0.0%) |
| Total | 129 (100.0%) | 117 (100.0%) |
Housing Occupancy in Unionville
Occupancy by Ownership in Unionville
Of the total 382 dwellings in Unionville, owner-occupied units account for 329 (86.1%), while renter-occupied units make up 53 (13.9%).
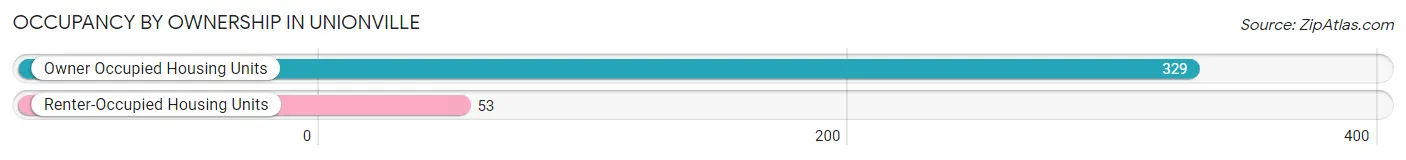
| Occupancy | # Housing Units | % Housing Units |
| Owner Occupied Housing Units | 329 | 86.1% |
| Renter-Occupied Housing Units | 53 | 13.9% |
| Total Occupied Housing Units | 382 | 100.0% |
Occupancy by Household Size in Unionville
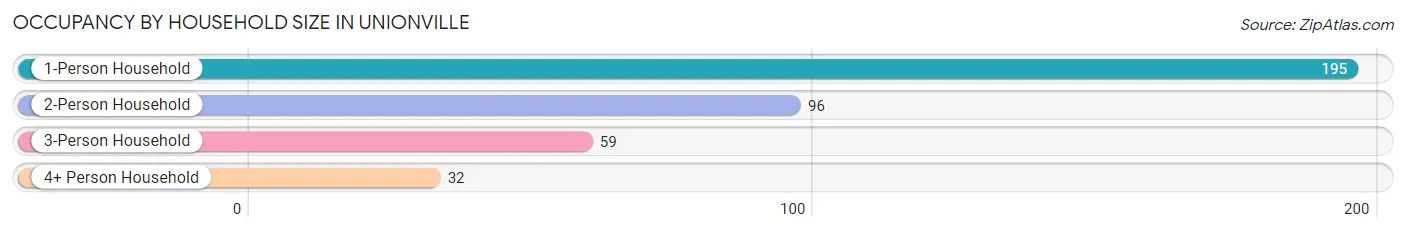
| Household Size | # Housing Units | % Housing Units |
| 1-Person Household | 195 | 51.0% |
| 2-Person Household | 96 | 25.1% |
| 3-Person Household | 59 | 15.4% |
| 4+ Person Household | 32 | 8.4% |
| Total Housing Units | 382 | 100.0% |
Occupancy by Ownership by Household Size in Unionville
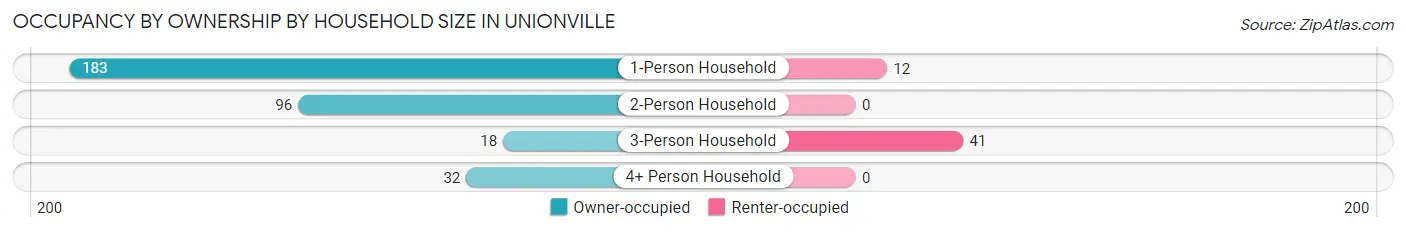
| Household Size | Owner-occupied | Renter-occupied |
| 1-Person Household | 183 (93.9%) | 12 (6.1%) |
| 2-Person Household | 96 (100.0%) | 0 (0.0%) |
| 3-Person Household | 18 (30.5%) | 41 (69.5%) |
| 4+ Person Household | 32 (100.0%) | 0 (0.0%) |
| Total Housing Units | 329 (86.1%) | 53 (13.9%) |
Occupancy by Educational Attainment in Unionville
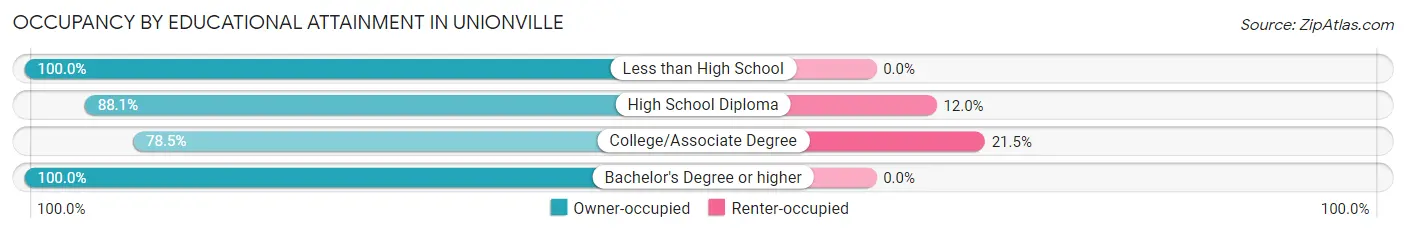
| Household Size | Owner-occupied | Renter-occupied |
| Less than High School | 7 (100.0%) | 0 (0.0%) |
| High School Diploma | 140 (88.0%) | 19 (11.9%) |
| College/Associate Degree | 124 (78.5%) | 34 (21.5%) |
| Bachelor's Degree or higher | 58 (100.0%) | 0 (0.0%) |
Occupancy by Age of Householder in Unionville
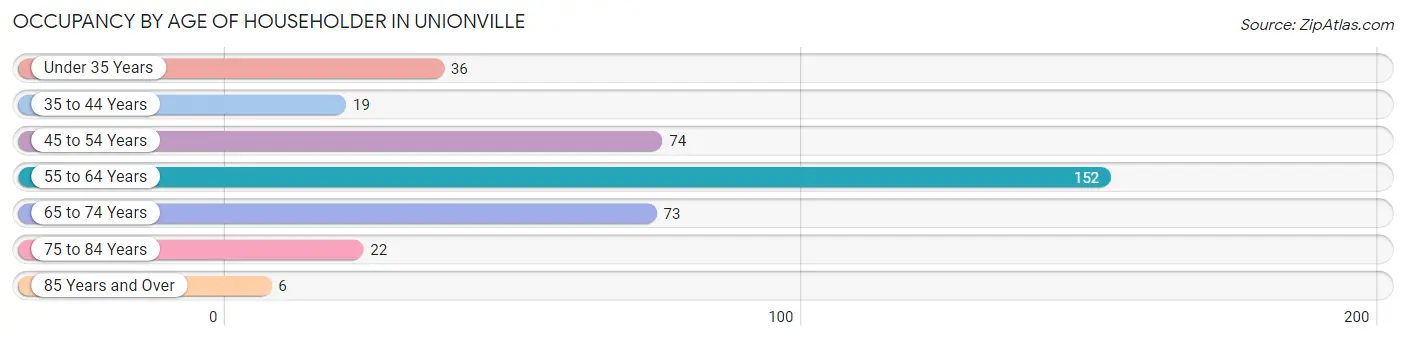
| Age Bracket | # Households | % Households |
| Under 35 Years | 36 | 9.4% |
| 35 to 44 Years | 19 | 5.0% |
| 45 to 54 Years | 74 | 19.4% |
| 55 to 64 Years | 152 | 39.8% |
| 65 to 74 Years | 73 | 19.1% |
| 75 to 84 Years | 22 | 5.8% |
| 85 Years and Over | 6 | 1.6% |
| Total | 382 | 100.0% |
Housing Finances in Unionville
Median Income by Occupancy in Unionville
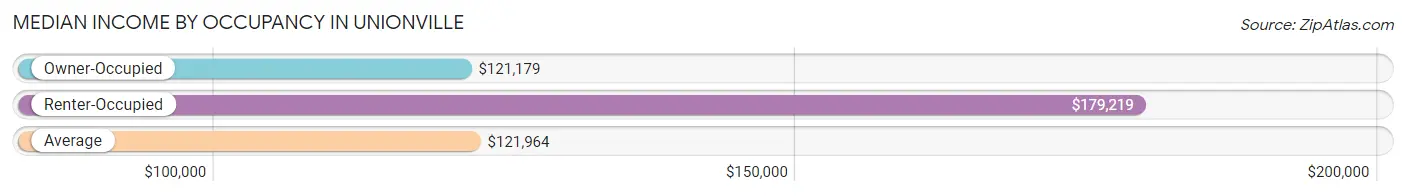
| Occupancy Type | # Households | Median Income |
| Owner-Occupied | 309 (90.1%) | $121,179 |
| Renter-Occupied | 34 (9.9%) | $179,219 |
| Average | 343 (100.0%) | $121,964 |
Occupancy by Householder Income Bracket in Unionville
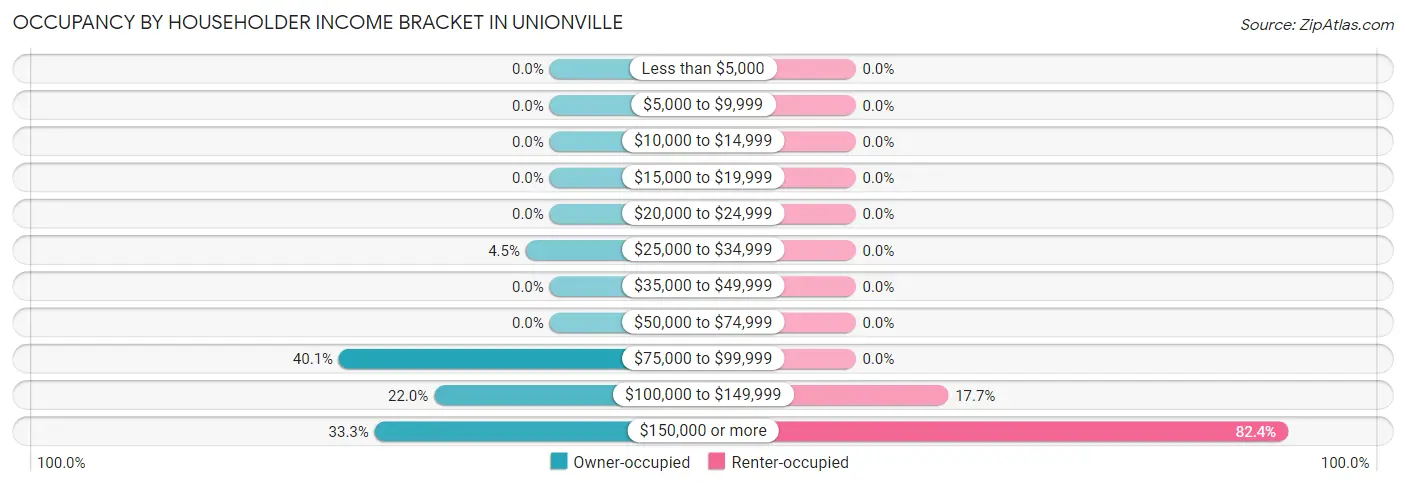
| Income Bracket | Owner-occupied | Renter-occupied |
| Less than $5,000 | 0 (0.0%) | 0 (0.0%) |
| $5,000 to $9,999 | 0 (0.0%) | 0 (0.0%) |
| $10,000 to $14,999 | 0 (0.0%) | 0 (0.0%) |
| $15,000 to $19,999 | 0 (0.0%) | 0 (0.0%) |
| $20,000 to $24,999 | 0 (0.0%) | 0 (0.0%) |
| $25,000 to $34,999 | 14 (4.5%) | 0 (0.0%) |
| $35,000 to $49,999 | 0 (0.0%) | 0 (0.0%) |
| $50,000 to $74,999 | 0 (0.0%) | 0 (0.0%) |
| $75,000 to $99,999 | 124 (40.1%) | 0 (0.0%) |
| $100,000 to $149,999 | 68 (22.0%) | 6 (17.6%) |
| $150,000 or more | 103 (33.3%) | 28 (82.4%) |
| Total | 309 (100.0%) | 34 (100.0%) |
Monthly Housing Cost Tiers in Unionville
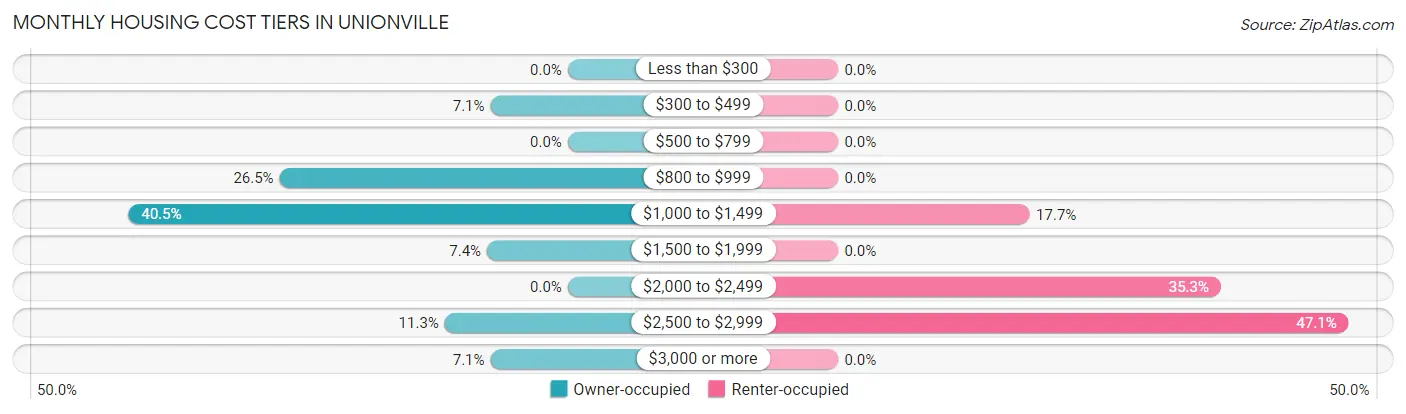
| Monthly Cost | Owner-occupied | Renter-occupied |
| Less than $300 | 0 (0.0%) | 0 (0.0%) |
| $300 to $499 | 22 (7.1%) | 0 (0.0%) |
| $500 to $799 | 0 (0.0%) | 0 (0.0%) |
| $800 to $999 | 82 (26.5%) | 0 (0.0%) |
| $1,000 to $1,499 | 125 (40.5%) | 6 (17.6%) |
| $1,500 to $1,999 | 23 (7.4%) | 0 (0.0%) |
| $2,000 to $2,499 | 0 (0.0%) | 12 (35.3%) |
| $2,500 to $2,999 | 35 (11.3%) | 16 (47.1%) |
| $3,000 or more | 22 (7.1%) | 0 (0.0%) |
| Total | 309 (100.0%) | 34 (100.0%) |
Physical Housing Characteristics in Unionville
Housing Structures in Unionville
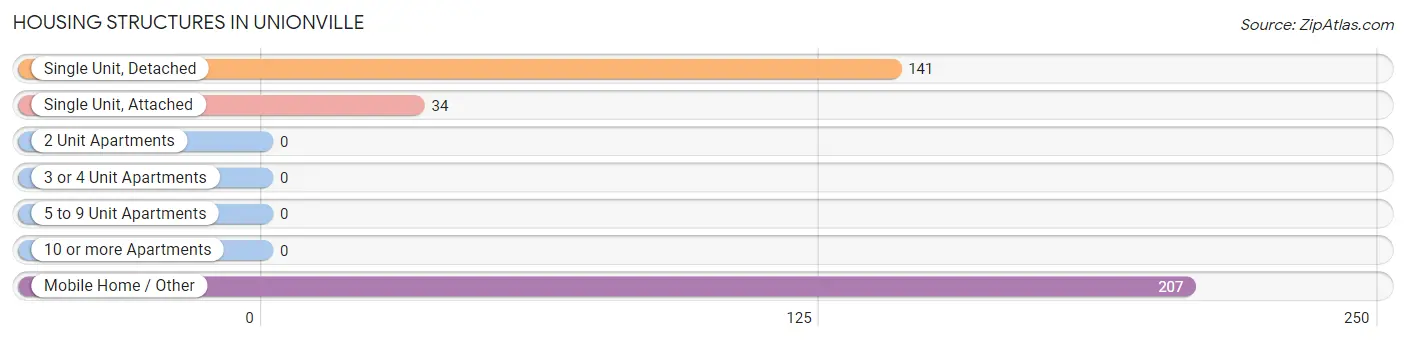
| Structure Type | # Housing Units | % Housing Units |
| Single Unit, Detached | 141 | 36.9% |
| Single Unit, Attached | 34 | 8.9% |
| 2 Unit Apartments | 0 | 0.0% |
| 3 or 4 Unit Apartments | 0 | 0.0% |
| 5 to 9 Unit Apartments | 0 | 0.0% |
| 10 or more Apartments | 0 | 0.0% |
| Mobile Home / Other | 207 | 54.2% |
| Total | 382 | 100.0% |
Housing Structures by Occupancy in Unionville
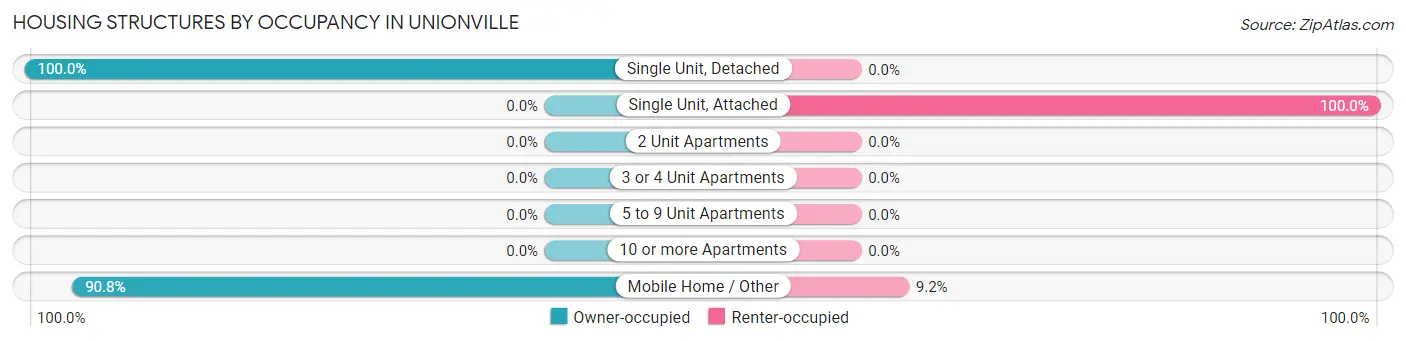
| Structure Type | Owner-occupied | Renter-occupied |
| Single Unit, Detached | 141 (100.0%) | 0 (0.0%) |
| Single Unit, Attached | 0 (0.0%) | 34 (100.0%) |
| 2 Unit Apartments | 0 (0.0%) | 0 (0.0%) |
| 3 or 4 Unit Apartments | 0 (0.0%) | 0 (0.0%) |
| 5 to 9 Unit Apartments | 0 (0.0%) | 0 (0.0%) |
| 10 or more Apartments | 0 (0.0%) | 0 (0.0%) |
| Mobile Home / Other | 188 (90.8%) | 19 (9.2%) |
| Total | 329 (86.1%) | 53 (13.9%) |
Housing Structures by Number of Rooms in Unionville
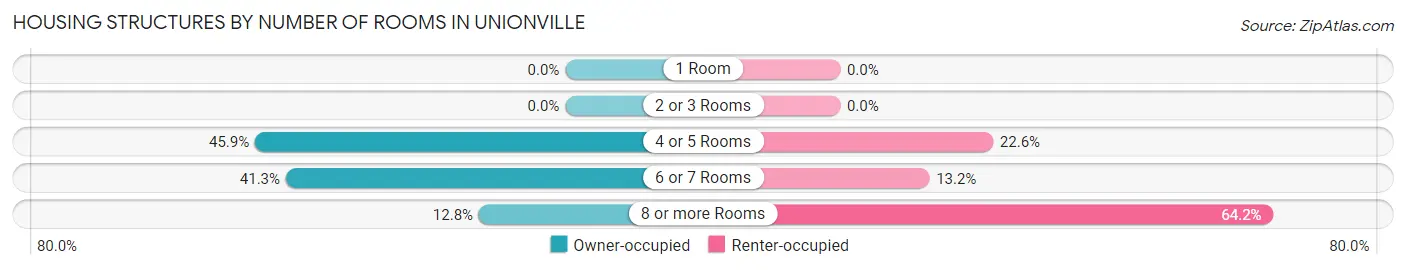
| Number of Rooms | Owner-occupied | Renter-occupied |
| 1 Room | 0 (0.0%) | 0 (0.0%) |
| 2 or 3 Rooms | 0 (0.0%) | 0 (0.0%) |
| 4 or 5 Rooms | 151 (45.9%) | 12 (22.6%) |
| 6 or 7 Rooms | 136 (41.3%) | 7 (13.2%) |
| 8 or more Rooms | 42 (12.8%) | 34 (64.1%) |
| Total | 329 (100.0%) | 53 (100.0%) |
Housing Structure by Heating Type in Unionville
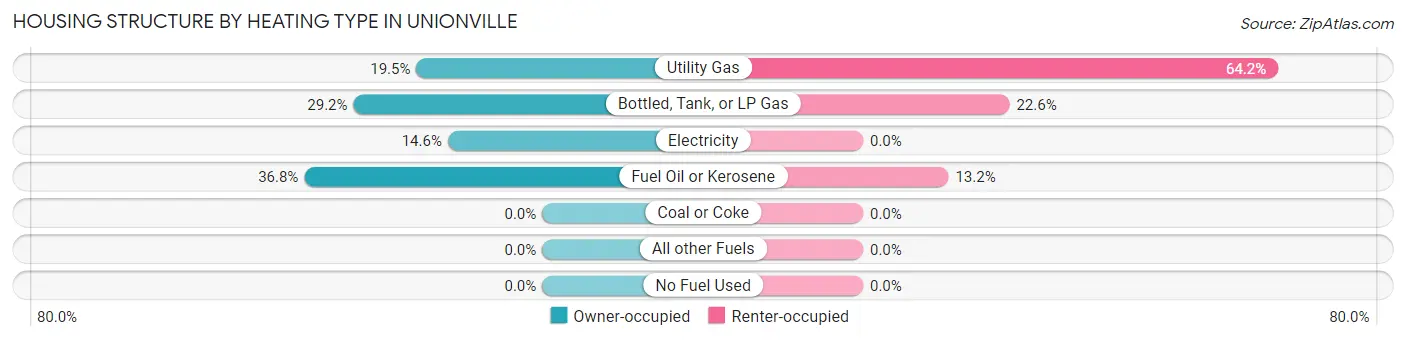
| Heating Type | Owner-occupied | Renter-occupied |
| Utility Gas | 64 (19.5%) | 34 (64.1%) |
| Bottled, Tank, or LP Gas | 96 (29.2%) | 12 (22.6%) |
| Electricity | 48 (14.6%) | 0 (0.0%) |
| Fuel Oil or Kerosene | 121 (36.8%) | 7 (13.2%) |
| Coal or Coke | 0 (0.0%) | 0 (0.0%) |
| All other Fuels | 0 (0.0%) | 0 (0.0%) |
| No Fuel Used | 0 (0.0%) | 0 (0.0%) |
| Total | 329 (100.0%) | 53 (100.0%) |
Household Vehicle Usage in Unionville
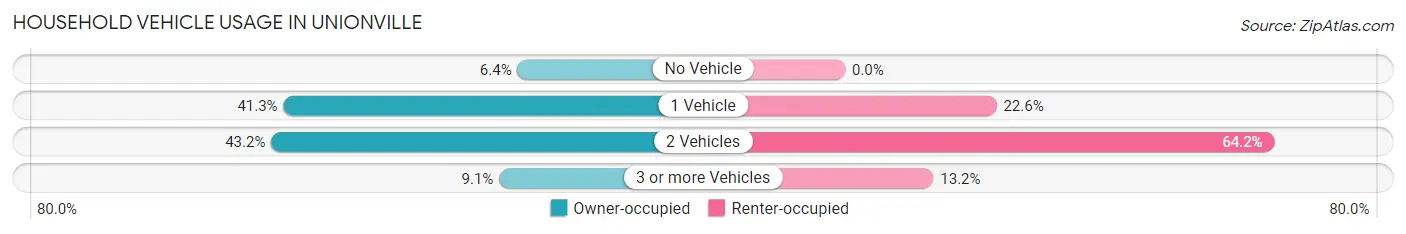
| Vehicles per Household | Owner-occupied | Renter-occupied |
| No Vehicle | 21 (6.4%) | 0 (0.0%) |
| 1 Vehicle | 136 (41.3%) | 12 (22.6%) |
| 2 Vehicles | 142 (43.2%) | 34 (64.1%) |
| 3 or more Vehicles | 30 (9.1%) | 7 (13.2%) |
| Total | 329 (100.0%) | 53 (100.0%) |
Real Estate & Mortgages in Unionville
Real Estate and Mortgage Overview in Unionville
| Characteristic | Without Mortgage | With Mortgage |
| Housing Units | 173 | 136 |
| Median Property Value | $595,900 | $0 |
| Median Household Income | $192,426 | $0 |
| Monthly Housing Costs | $974 | $22 |
| Real Estate Taxes | $6,633 | $0 |
Property Value by Mortgage Status in Unionville
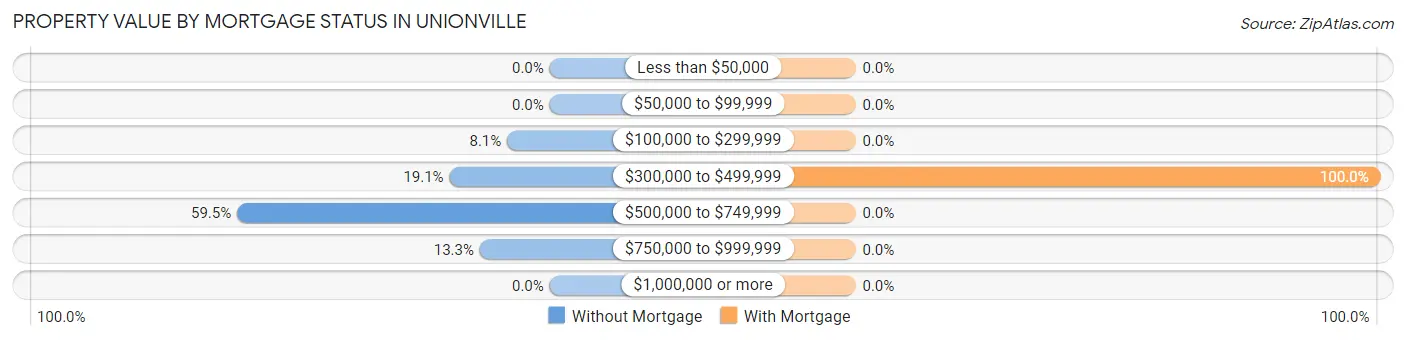
| Property Value | Without Mortgage | With Mortgage |
| Less than $50,000 | 0 (0.0%) | 0 (0.0%) |
| $50,000 to $99,999 | 0 (0.0%) | 0 (0.0%) |
| $100,000 to $299,999 | 14 (8.1%) | 0 (0.0%) |
| $300,000 to $499,999 | 33 (19.1%) | 136 (100.0%) |
| $500,000 to $749,999 | 103 (59.5%) | 0 (0.0%) |
| $750,000 to $999,999 | 23 (13.3%) | 0 (0.0%) |
| $1,000,000 or more | 0 (0.0%) | 0 (0.0%) |
| Total | 173 (100.0%) | 136 (100.0%) |
Household Income by Mortgage Status in Unionville
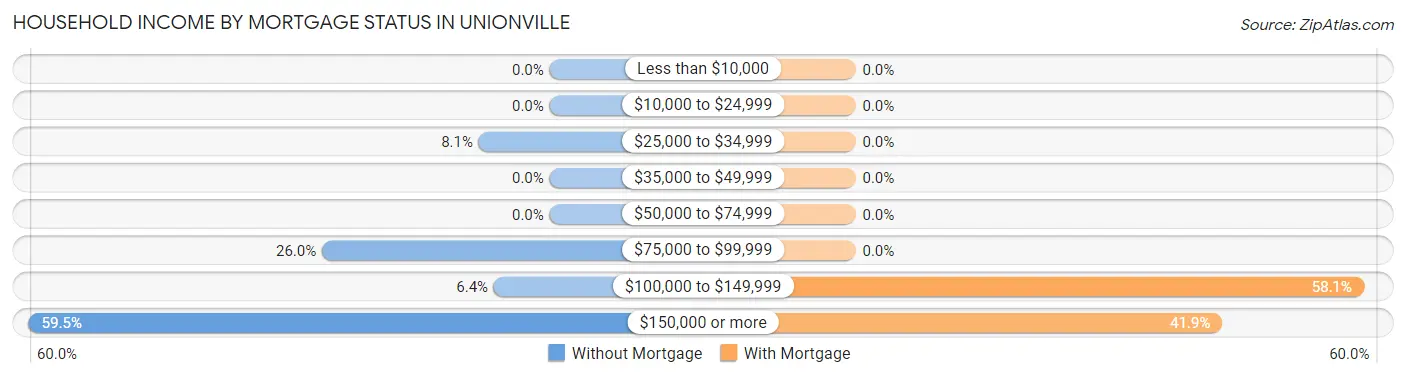
| Household Income | Without Mortgage | With Mortgage |
| Less than $10,000 | 0 (0.0%) | 0 (0.0%) |
| $10,000 to $24,999 | 0 (0.0%) | 0 (0.0%) |
| $25,000 to $34,999 | 14 (8.1%) | 0 (0.0%) |
| $35,000 to $49,999 | 0 (0.0%) | 0 (0.0%) |
| $50,000 to $74,999 | 0 (0.0%) | 0 (0.0%) |
| $75,000 to $99,999 | 45 (26.0%) | 0 (0.0%) |
| $100,000 to $149,999 | 11 (6.4%) | 79 (58.1%) |
| $150,000 or more | 103 (59.5%) | 57 (41.9%) |
| Total | 173 (100.0%) | 136 (100.0%) |
Property Value to Household Income Ratio in Unionville
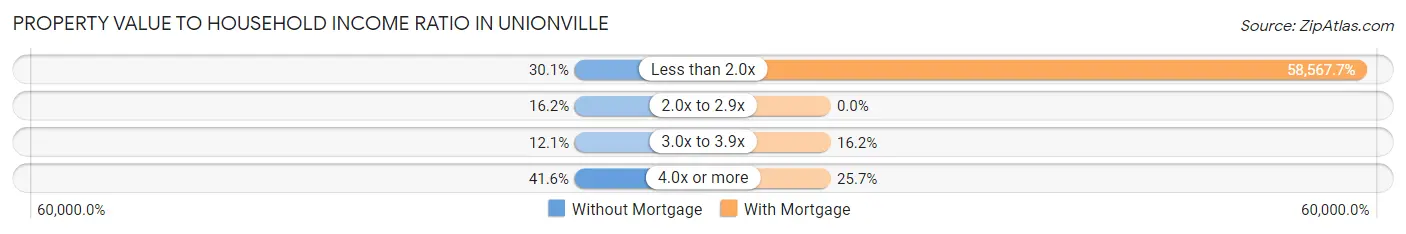
| Value-to-Income Ratio | Without Mortgage | With Mortgage |
| Less than 2.0x | 52 (30.1%) | 79,652 (58,567.7%) |
| 2.0x to 2.9x | 28 (16.2%) | 0 (0.0%) |
| 3.0x to 3.9x | 21 (12.1%) | 22 (16.2%) |
| 4.0x or more | 72 (41.6%) | 35 (25.7%) |
| Total | 173 (100.0%) | 136 (100.0%) |
Real Estate Taxes by Mortgage Status in Unionville
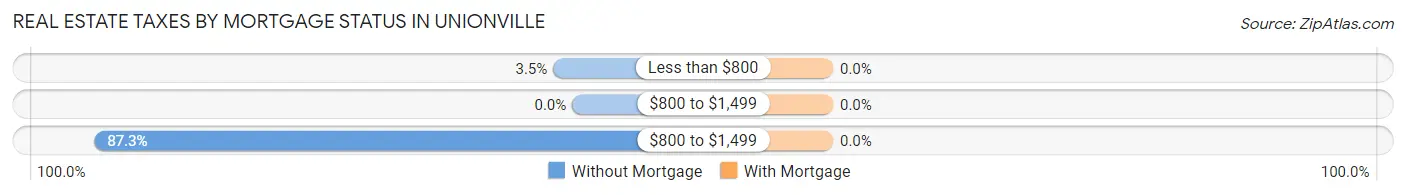
| Property Taxes | Without Mortgage | With Mortgage |
| Less than $800 | 6 (3.5%) | 0 (0.0%) |
| $800 to $1,499 | 0 (0.0%) | 0 (0.0%) |
| $800 to $1,499 | 151 (87.3%) | 0 (0.0%) |
| Total | 173 (100.0%) | 136 (100.0%) |
Health & Disability in Unionville
Health Insurance Coverage by Age in Unionville
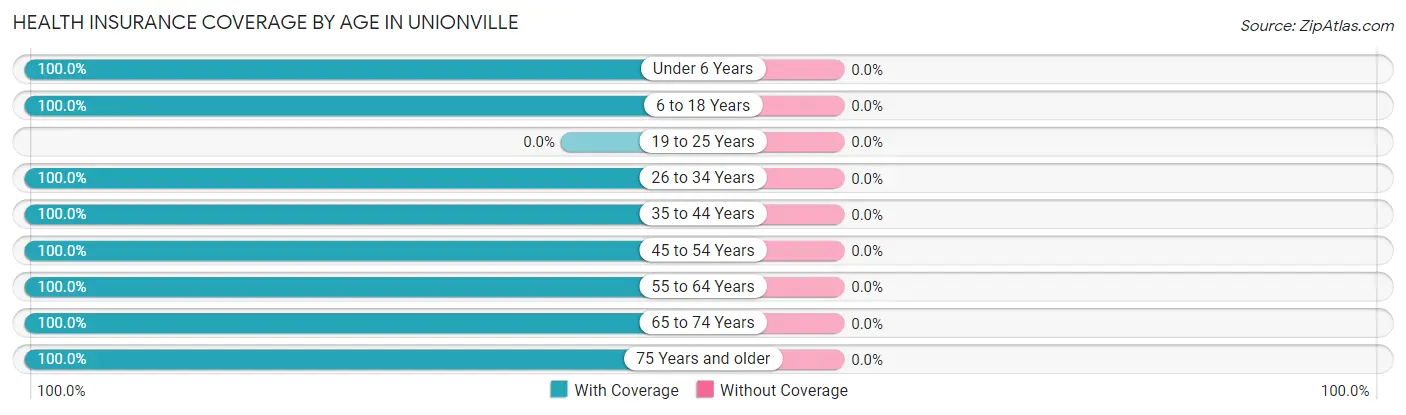
| Age Bracket | With Coverage | Without Coverage |
| Under 6 Years | 22 (100.0%) | 0 (0.0%) |
| 6 to 18 Years | 67 (100.0%) | 0 (0.0%) |
| 19 to 25 Years | 0 (0.0%) | 0 (0.0%) |
| 26 to 34 Years | 50 (100.0%) | 0 (0.0%) |
| 35 to 44 Years | 30 (100.0%) | 0 (0.0%) |
| 45 to 54 Years | 57 (100.0%) | 0 (0.0%) |
| 55 to 64 Years | 69 (100.0%) | 0 (0.0%) |
| 65 to 74 Years | 180 (100.0%) | 0 (0.0%) |
| 75 Years and older | 247 (100.0%) | 0 (0.0%) |
| Total | 722 (100.0%) | 0 (0.0%) |
Health Insurance Coverage by Citizenship Status in Unionville
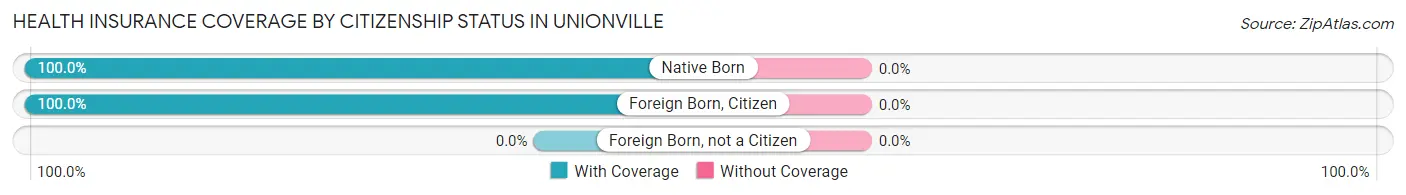
| Citizenship Status | With Coverage | Without Coverage |
| Native Born | 22 (100.0%) | 0 (0.0%) |
| Foreign Born, Citizen | 67 (100.0%) | 0 (0.0%) |
| Foreign Born, not a Citizen | 0 (0.0%) | 0 (0.0%) |
Health Insurance Coverage by Household Income in Unionville
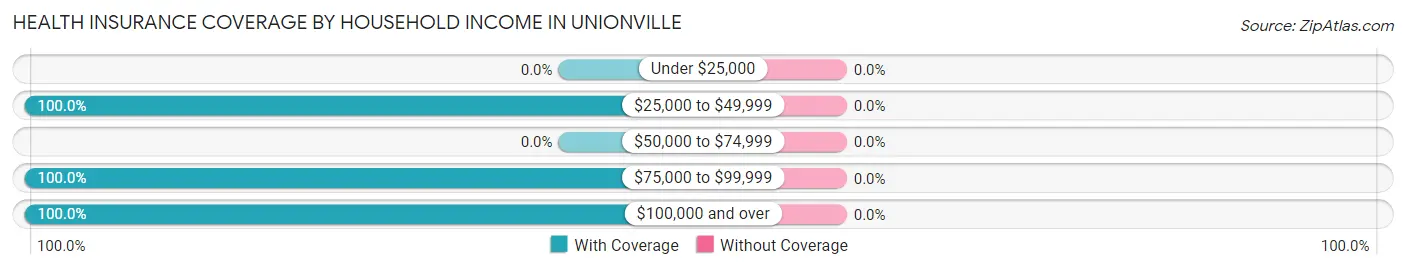
| Household Income | With Coverage | Without Coverage |
| Under $25,000 | 0 (0.0%) | 0 (0.0%) |
| $25,000 to $49,999 | 14 (100.0%) | 0 (0.0%) |
| $50,000 to $74,999 | 0 (0.0%) | 0 (0.0%) |
| $75,000 to $99,999 | 240 (100.0%) | 0 (0.0%) |
| $100,000 and over | 468 (100.0%) | 0 (0.0%) |
Public vs Private Health Insurance Coverage by Age in Unionville
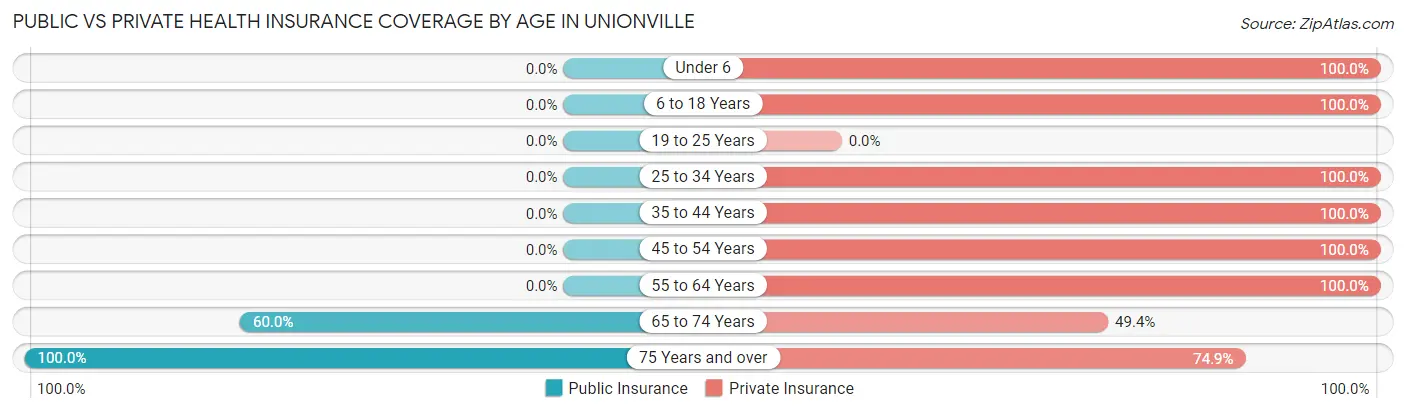
| Age Bracket | Public Insurance | Private Insurance |
| Under 6 | 0 (0.0%) | 22 (100.0%) |
| 6 to 18 Years | 0 (0.0%) | 67 (100.0%) |
| 19 to 25 Years | 0 (0.0%) | 0 (0.0%) |
| 25 to 34 Years | 0 (0.0%) | 50 (100.0%) |
| 35 to 44 Years | 0 (0.0%) | 30 (100.0%) |
| 45 to 54 Years | 0 (0.0%) | 57 (100.0%) |
| 55 to 64 Years | 0 (0.0%) | 69 (100.0%) |
| 65 to 74 Years | 108 (60.0%) | 89 (49.4%) |
| 75 Years and over | 247 (100.0%) | 185 (74.9%) |
| Total | 355 (49.2%) | 569 (78.8%) |
Disability Status by Sex by Age in Unionville
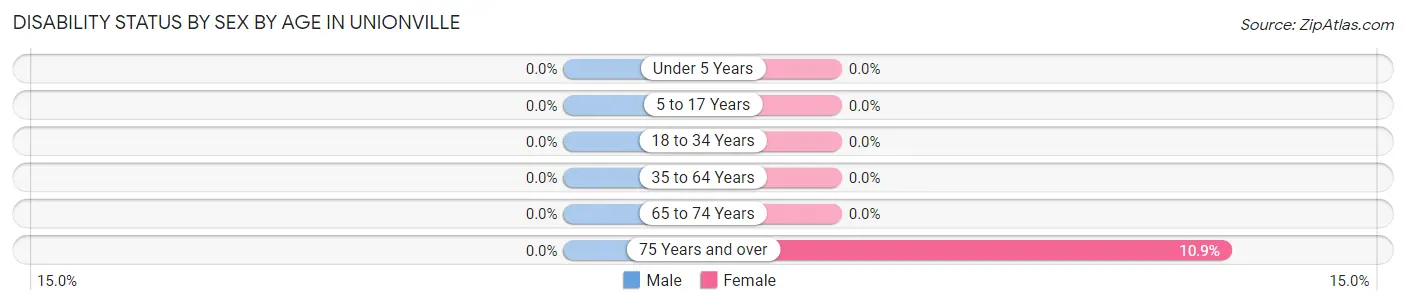
| Age Bracket | Male | Female |
| Under 5 Years | 0 (0.0%) | 0 (0.0%) |
| 5 to 17 Years | 0 (0.0%) | 0 (0.0%) |
| 18 to 34 Years | 0 (0.0%) | 0 (0.0%) |
| 35 to 64 Years | 0 (0.0%) | 0 (0.0%) |
| 65 to 74 Years | 0 (0.0%) | 0 (0.0%) |
| 75 Years and over | 0 (0.0%) | 14 (10.8%) |
Disability Class by Sex by Age in Unionville
Disability Class: Hearing Difficulty
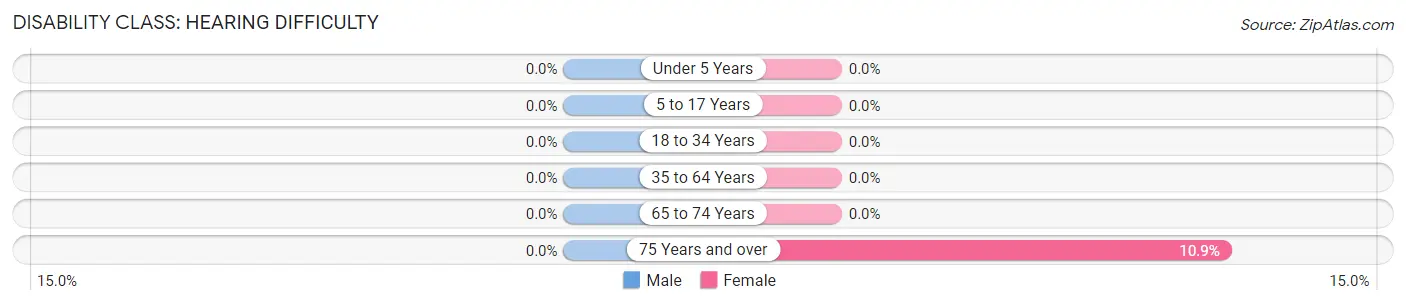
| Age Bracket | Male | Female |
| Under 5 Years | 0 (0.0%) | 0 (0.0%) |
| 5 to 17 Years | 0 (0.0%) | 0 (0.0%) |
| 18 to 34 Years | 0 (0.0%) | 0 (0.0%) |
| 35 to 64 Years | 0 (0.0%) | 0 (0.0%) |
| 65 to 74 Years | 0 (0.0%) | 0 (0.0%) |
| 75 Years and over | 0 (0.0%) | 14 (10.8%) |
Disability Class: Vision Difficulty
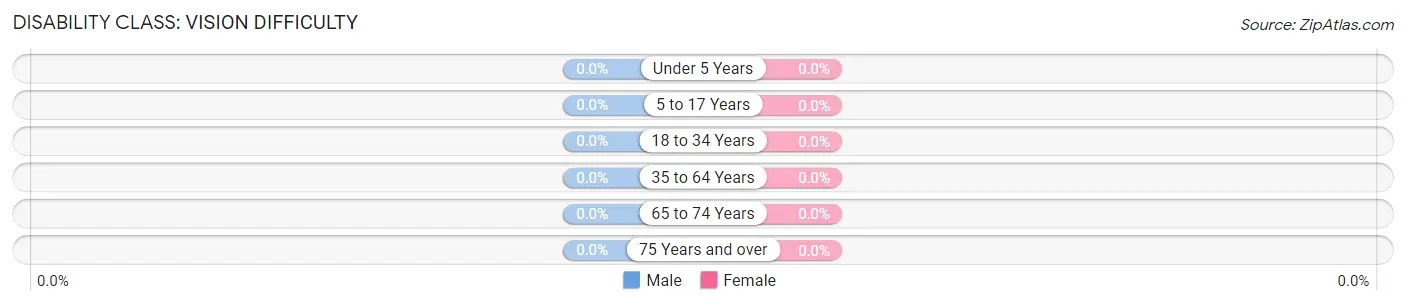
| Age Bracket | Male | Female |
| Under 5 Years | 0 (0.0%) | 0 (0.0%) |
| 5 to 17 Years | 0 (0.0%) | 0 (0.0%) |
| 18 to 34 Years | 0 (0.0%) | 0 (0.0%) |
| 35 to 64 Years | 0 (0.0%) | 0 (0.0%) |
| 65 to 74 Years | 0 (0.0%) | 0 (0.0%) |
| 75 Years and over | 0 (0.0%) | 0 (0.0%) |
Disability Class: Cognitive Difficulty
| Age Bracket | Male | Female |
| 5 to 17 Years | 0 (0.0%) | 0 (0.0%) |
| 18 to 34 Years | 0 (0.0%) | 0 (0.0%) |
| 35 to 64 Years | 0 (0.0%) | 0 (0.0%) |
| 65 to 74 Years | 0 (0.0%) | 0 (0.0%) |
| 75 Years and over | 0 (0.0%) | 0 (0.0%) |
Disability Class: Ambulatory Difficulty
| Age Bracket | Male | Female |
| 5 to 17 Years | 0 (0.0%) | 0 (0.0%) |
| 18 to 34 Years | 0 (0.0%) | 0 (0.0%) |
| 35 to 64 Years | 0 (0.0%) | 0 (0.0%) |
| 65 to 74 Years | 0 (0.0%) | 0 (0.0%) |
| 75 Years and over | 0 (0.0%) | 0 (0.0%) |
Disability Class: Self-Care Difficulty
| Age Bracket | Male | Female |
| 5 to 17 Years | 0 (0.0%) | 0 (0.0%) |
| 18 to 34 Years | 0 (0.0%) | 0 (0.0%) |
| 35 to 64 Years | 0 (0.0%) | 0 (0.0%) |
| 65 to 74 Years | 0 (0.0%) | 0 (0.0%) |
| 75 Years and over | 0 (0.0%) | 0 (0.0%) |
Technology Access in Unionville
Computing Device Access in Unionville
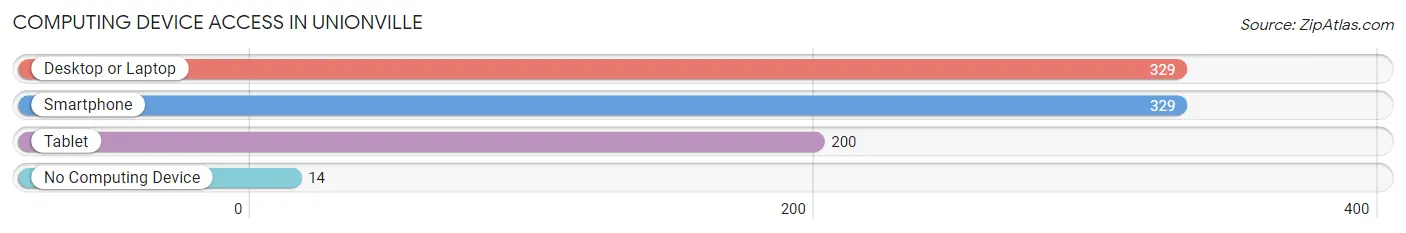
| Device Type | # Households | % Households |
| Desktop or Laptop | 329 | 95.9% |
| Smartphone | 329 | 95.9% |
| Tablet | 200 | 58.3% |
| No Computing Device | 14 | 4.1% |
| Total | 343 | 100.0% |
Internet Access in Unionville
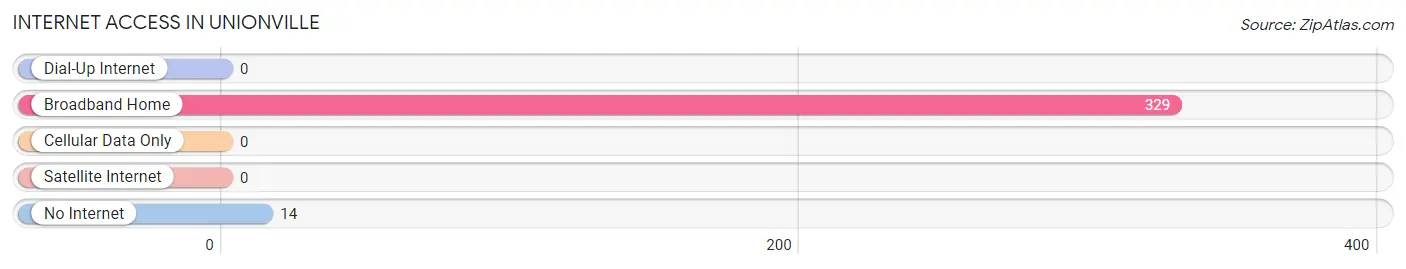
| Internet Type | # Households | % Households |
| Dial-Up Internet | 0 | 0.0% |
| Broadband Home | 329 | 95.9% |
| Cellular Data Only | 0 | 0.0% |
| Satellite Internet | 0 | 0.0% |
| No Internet | 14 | 4.1% |
| Total | 343 | 100.0% |
Unionville Summary
Introduction
Unionville, Pennsylvania is a small borough located in Chester County, Pennsylvania. It is situated in the southeastern corner of the county, approximately 25 miles west of Philadelphia. The borough is home to a population of approximately 1,500 people, and is known for its historic buildings, quaint downtown, and rural atmosphere.
History
Unionville was founded in 1750 by a group of Quakers from the nearby town of West Chester. The town was originally known as Union Meeting House, and was named after the Union Meeting House, a Quaker meeting house that was built in the area in 1750. The town was officially incorporated in 1845, and was renamed Unionville in 1851.
The town was an important stop on the Underground Railroad, and was home to several prominent abolitionists, including William Still and Thomas Garrett. During the Civil War, Unionville was the site of a major battle between Union and Confederate forces.
Geography
Unionville is located in southeastern Chester County, approximately 25 miles west of Philadelphia. The borough is situated in the Brandywine Valley, and is surrounded by rolling hills and farmland. The borough is bordered by West Chester to the north, Kennett Square to the east, and Chadds Ford to the south.
The borough is home to several parks and recreational areas, including the Unionville Community Park, the Unionville Nature Preserve, and the Unionville Reservoir. The Unionville Reservoir is a popular spot for fishing, boating, and swimming.
Economy
Unionville’s economy is largely based on agriculture and tourism. The borough is home to several farms, including the Unionville Vineyards, which produces award-winning wines. The borough is also home to several small businesses, including restaurants, shops, and galleries.
The borough is also home to several historic sites, including the Unionville Historic District, which is listed on the National Register of Historic Places. The district includes several historic buildings, including the Union Meeting House, the Unionville Inn, and the Unionville Bank.
Demographics
As of the 2010 census, the population of Unionville was 1,521. The racial makeup of the borough was 94.3% White, 2.2% African American, 0.3% Native American, 0.7% Asian, 0.1% Pacific Islander, 0.7% from other races, and 1.7% from two or more races. Hispanic or Latino of any race were 2.2% of the population.
The median household income in Unionville was $68,750, and the median family income was $76,250. The per capita income for the borough was $30,945. About 4.3% of families and 5.3% of the population were below the poverty line, including 6.3% of those under age 18 and 4.2% of those age 65 or over.
Conclusion
Unionville, Pennsylvania is a small borough located in Chester County, Pennsylvania. It is home to a population of approximately 1,500 people, and is known for its historic buildings, quaint downtown, and rural atmosphere. The borough’s economy is largely based on agriculture and tourism, and it is home to several historic sites, including the Unionville Historic District. The borough’s population is largely white, with a small percentage of African Americans, Native Americans, Asians, and Pacific Islanders. The median household income in Unionville is $68,750, and the per capita income is $30,945.
Common Questions
What is Per Capita Income in Unionville?
Per Capita income in Unionville is $76,163.
What is the Median Family Income in Unionville?
Median Family Income in Unionville is $134,583.
What is the Median Household income in Unionville?
Median Household Income in Unionville is $121,964.
What is Income or Wage Gap in Unionville?
Income or Wage Gap in Unionville is 69.3%.
Women in Unionville earn 30.7 cents for every dollar earned by a man.
What is Inequality or Gini Index in Unionville?
Inequality or Gini Index in Unionville is 0.31.
What is the Total Population of Unionville?
Total Population of Unionville is 722.
What is the Total Male Population of Unionville?
Total Male Population of Unionville is 351.
What is the Total Female Population of Unionville?
Total Female Population of Unionville is 371.
What is the Ratio of Males per 100 Females in Unionville?
There are 94.61 Males per 100 Females in Unionville.
What is the Ratio of Females per 100 Males in Unionville?
There are 105.70 Females per 100 Males in Unionville.
What is the Median Population Age in Unionville?
Median Population Age in Unionville is 66.8 Years.
What is the Average Family Size in Unionville
Average Family Size in Unionville is 2.2 People.
What is the Average Household Size in Unionville
Average Household Size in Unionville is 2.1 People.
How Large is the Labor Force in Unionville?
There are 315 People in the Labor Forcein in Unionville.
What is the Percentage of People in the Labor Force in Unionville?
49.8% of People are in the Labor Force in Unionville.