Canal Lewisville, OH Map & Demographics
Canal Lewisville Map
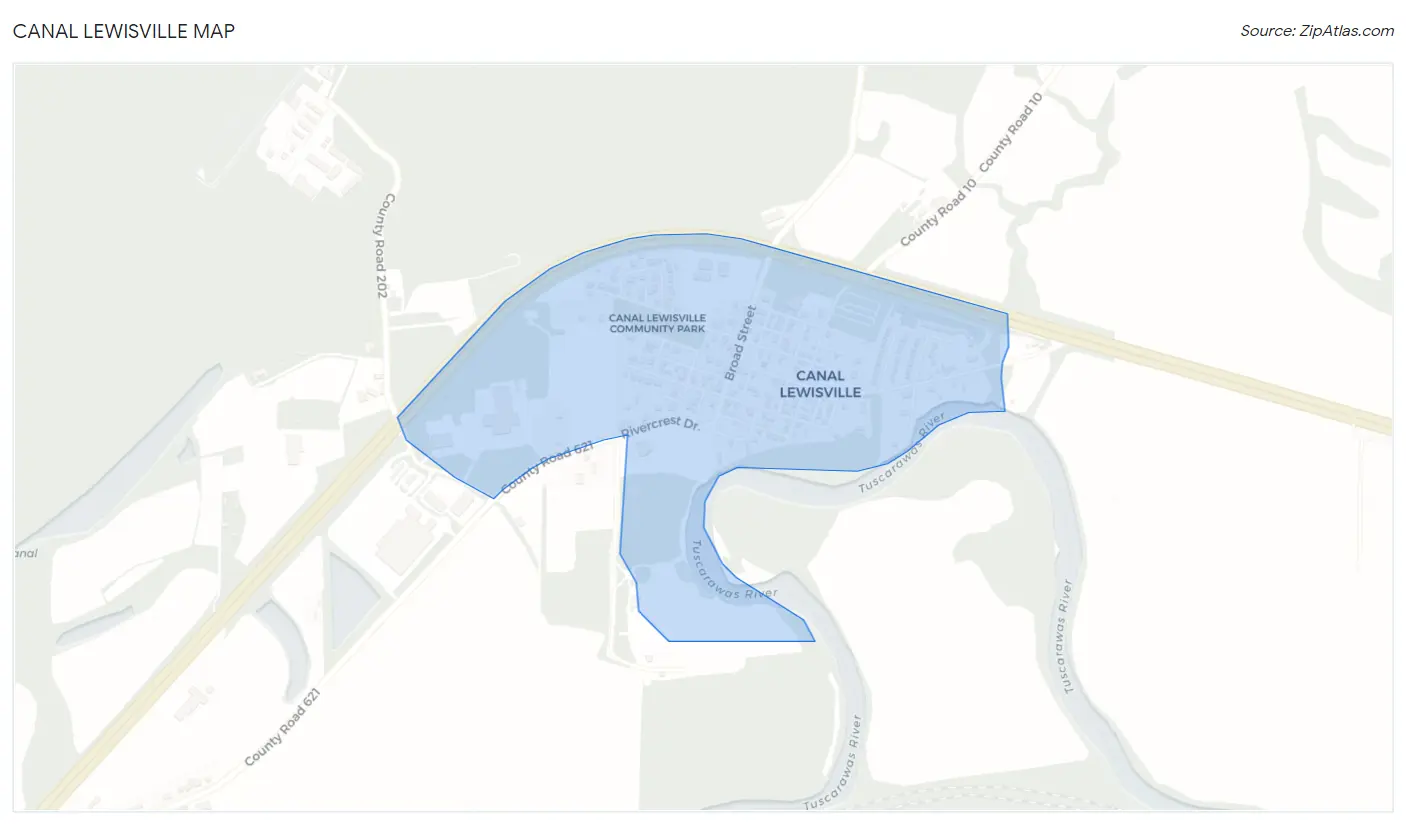
Canal Lewisville Overview
$16,835
PER CAPITA INCOME
$78,031
AVG FAMILY INCOME
$72,361
AVG HOUSEHOLD INCOME
0.33
INEQUALITY / GINI INDEX
761
TOTAL POPULATION
269
MALE POPULATION
492
FEMALE POPULATION
54.67
MALES / 100 FEMALES
182.90
FEMALES / 100 MALES
33.8
MEDIAN AGE
3.7
AVG FAMILY SIZE
3.3
AVG HOUSEHOLD SIZE
308
LABOR FORCE [ PEOPLE ]
64.2%
PERCENT IN LABOR FORCE
26.0%
UNEMPLOYMENT RATE
Income in Canal Lewisville
Income Overview in Canal Lewisville
Per Capita Income in Canal Lewisville is $16,835, while median incomes of families and households are $78,031 and $72,361 respectively.
| Characteristic | Number | Measure |
| Per Capita Income | 761 | $16,835 |
| Median Family Income | 198 | $78,031 |
| Mean Family Income | 198 | $69,989 |
| Median Household Income | 233 | $72,361 |
| Mean Household Income | 233 | $63,543 |
| Income Deficit | 198 | $0 |
| Wage / Income Gap (%) | 761 | 0.00% |
| Wage / Income Gap ($) | 761 | 100.00¢ per $1 |
| Gini / Inequality Index | 761 | 0.33 |
Earnings by Sex in Canal Lewisville
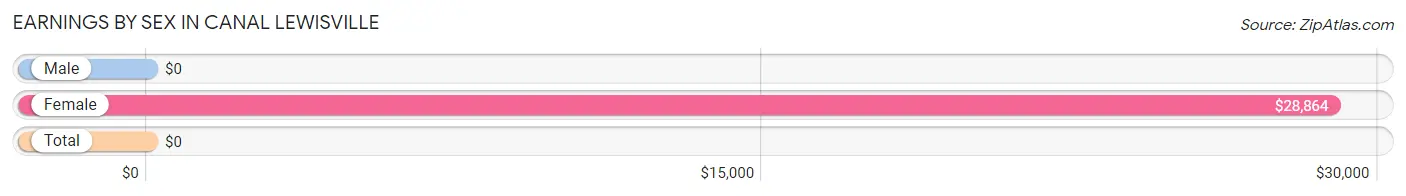
| Sex | Number | Average Earnings |
| Male | 117 (32.4%) | $0 |
| Female | 244 (67.6%) | $28,864 |
| Total | 361 (100.0%) | $0 |
Earnings by Sex by Income Bracket in Canal Lewisville
The most common earnings brackets in Canal Lewisville are $5,000 to $7,499 for men (48 | 41.0%) and $35,000 to $39,999 for women (88 | 36.1%).
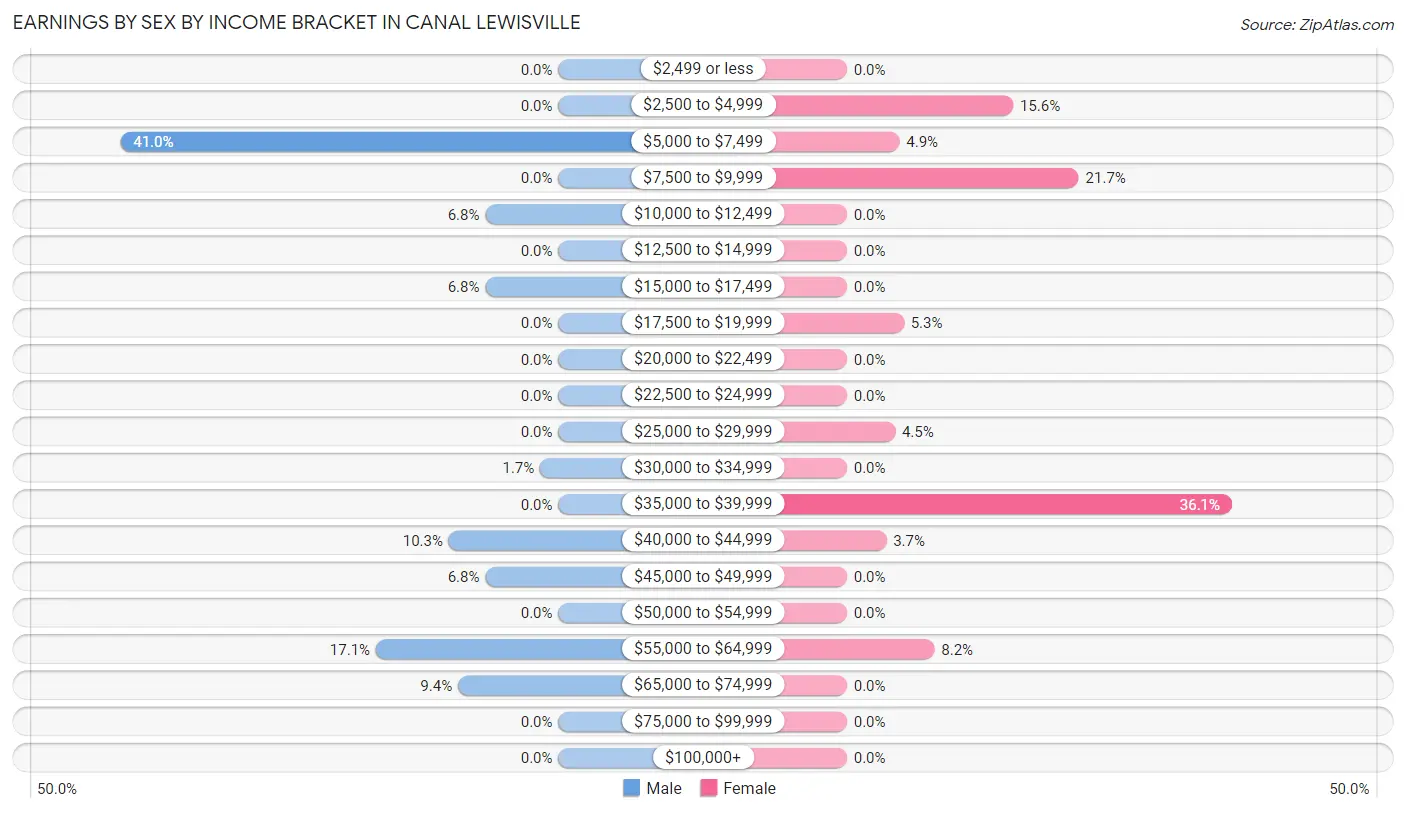
| Income | Male | Female |
| $2,499 or less | 0 (0.0%) | 0 (0.0%) |
| $2,500 to $4,999 | 0 (0.0%) | 38 (15.6%) |
| $5,000 to $7,499 | 48 (41.0%) | 12 (4.9%) |
| $7,500 to $9,999 | 0 (0.0%) | 53 (21.7%) |
| $10,000 to $12,499 | 8 (6.8%) | 0 (0.0%) |
| $12,500 to $14,999 | 0 (0.0%) | 0 (0.0%) |
| $15,000 to $17,499 | 8 (6.8%) | 0 (0.0%) |
| $17,500 to $19,999 | 0 (0.0%) | 13 (5.3%) |
| $20,000 to $22,499 | 0 (0.0%) | 0 (0.0%) |
| $22,500 to $24,999 | 0 (0.0%) | 0 (0.0%) |
| $25,000 to $29,999 | 0 (0.0%) | 11 (4.5%) |
| $30,000 to $34,999 | 2 (1.7%) | 0 (0.0%) |
| $35,000 to $39,999 | 0 (0.0%) | 88 (36.1%) |
| $40,000 to $44,999 | 12 (10.3%) | 9 (3.7%) |
| $45,000 to $49,999 | 8 (6.8%) | 0 (0.0%) |
| $50,000 to $54,999 | 0 (0.0%) | 0 (0.0%) |
| $55,000 to $64,999 | 20 (17.1%) | 20 (8.2%) |
| $65,000 to $74,999 | 11 (9.4%) | 0 (0.0%) |
| $75,000 to $99,999 | 0 (0.0%) | 0 (0.0%) |
| $100,000+ | 0 (0.0%) | 0 (0.0%) |
| Total | 117 (100.0%) | 244 (100.0%) |
Earnings by Sex by Educational Attainment in Canal Lewisville
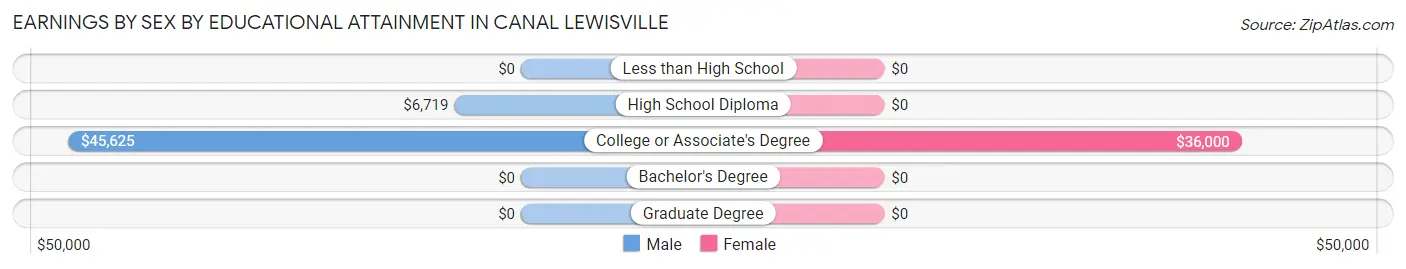
| Educational Attainment | Male Income | Female Income |
| Less than High School | - | - |
| High School Diploma | $6,719 | $0 |
| College or Associate's Degree | $45,625 | $36,000 |
| Bachelor's Degree | - | - |
| Graduate Degree | - | - |
| Total | - | - |
Family Income in Canal Lewisville
Family Income Brackets in Canal Lewisville
According to the Canal Lewisville family income data, there are 80 families falling into the $75,000 to $99,999 income range, which is the most common income bracket and makes up 40.4% of all families.
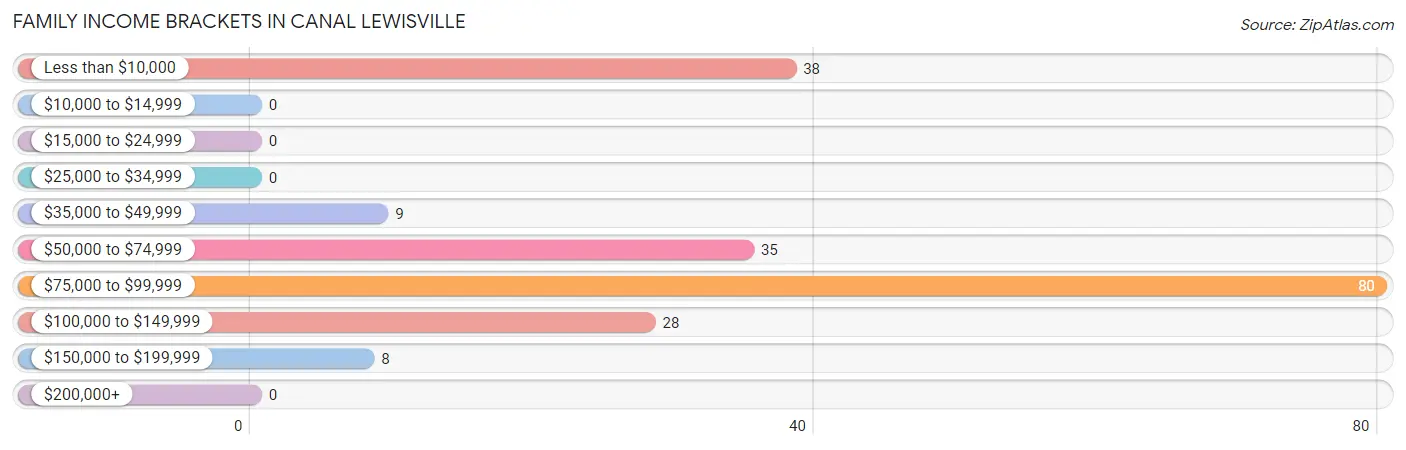
| Income Bracket | # Families | % Families |
| Less than $10,000 | 38 | 19.2% |
| $10,000 to $14,999 | 0 | 0.0% |
| $15,000 to $24,999 | 0 | 0.0% |
| $25,000 to $34,999 | 0 | 0.0% |
| $35,000 to $49,999 | 9 | 4.5% |
| $50,000 to $74,999 | 35 | 17.7% |
| $75,000 to $99,999 | 80 | 40.4% |
| $100,000 to $149,999 | 28 | 14.1% |
| $150,000 to $199,999 | 8 | 4.0% |
| $200,000+ | 0 | 0.0% |
Family Income by Famaliy Size in Canal Lewisville
2-person families (48 | 24.2%) account for the highest median family income in Canal Lewisville with $70,278 per family, while 2-person families (48 | 24.2%) have the highest median income of $35,139 per family member.
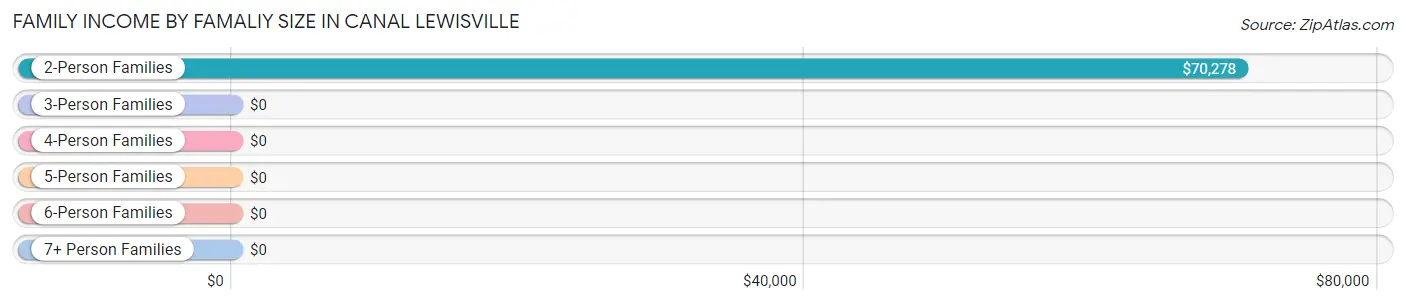
| Income Bracket | # Families | Median Income |
| 2-Person Families | 48 (24.2%) | $70,278 |
| 3-Person Families | 20 (10.1%) | $0 |
| 4-Person Families | 50 (25.3%) | $0 |
| 5-Person Families | 80 (40.4%) | $0 |
| 6-Person Families | 0 (0.0%) | $0 |
| 7+ Person Families | 0 (0.0%) | $0 |
| Total | 198 (100.0%) | $78,031 |
Family Income by Number of Earners in Canal Lewisville
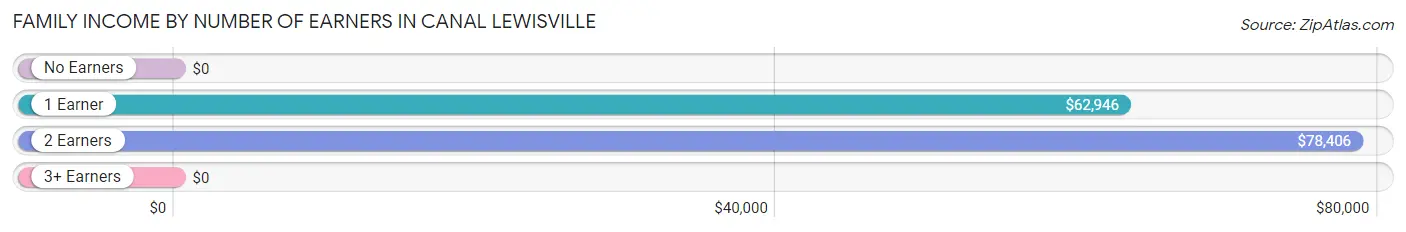
| Number of Earners | # Families | Median Income |
| No Earners | 9 (4.5%) | $0 |
| 1 Earner | 23 (11.6%) | $62,946 |
| 2 Earners | 158 (79.8%) | $78,406 |
| 3+ Earners | 8 (4.0%) | $0 |
| Total | 198 (100.0%) | $78,031 |
Household Income in Canal Lewisville
Household Income Brackets in Canal Lewisville
With 80 households falling in the category, the $75,000 to $99,999 income range is the most frequent in Canal Lewisville, accounting for 34.3% of all households.
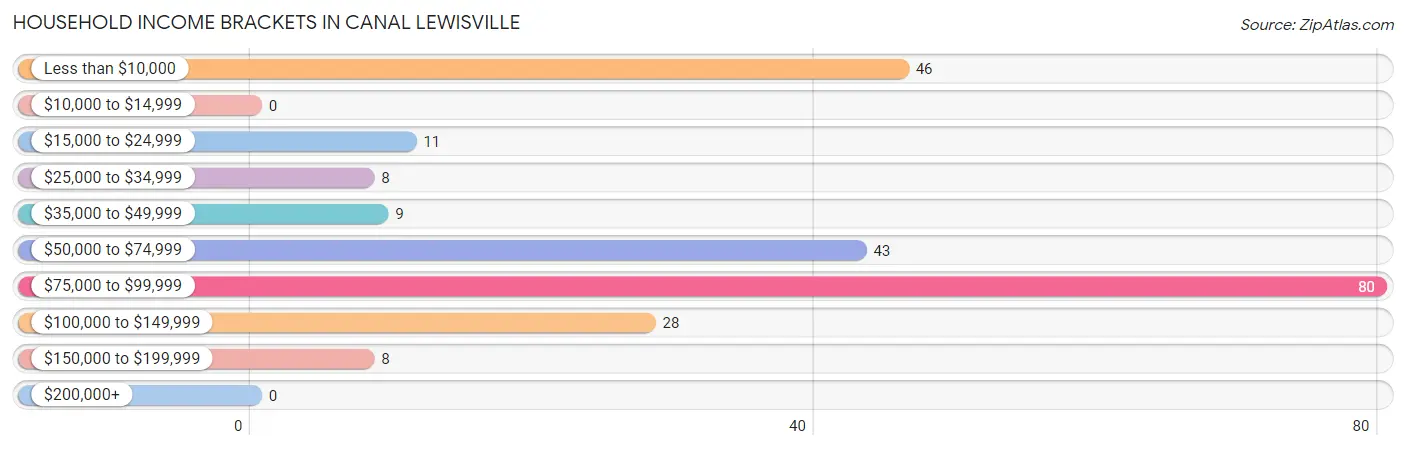
| Income Bracket | # Households | % Households |
| Less than $10,000 | 46 | 19.7% |
| $10,000 to $14,999 | 0 | 0.0% |
| $15,000 to $24,999 | 11 | 4.7% |
| $25,000 to $34,999 | 8 | 3.4% |
| $35,000 to $49,999 | 9 | 3.9% |
| $50,000 to $74,999 | 43 | 18.5% |
| $75,000 to $99,999 | 80 | 34.3% |
| $100,000 to $149,999 | 28 | 12.0% |
| $150,000 to $199,999 | 8 | 3.4% |
| $200,000+ | 0 | 0.0% |
Household Income by Householder Age in Canal Lewisville
The median household income in Canal Lewisville is $72,361, with the highest median household income of $78,609 found in the 25 to 44 years age bracket for the primary householder. A total of 113 households (48.5%) fall into this category.
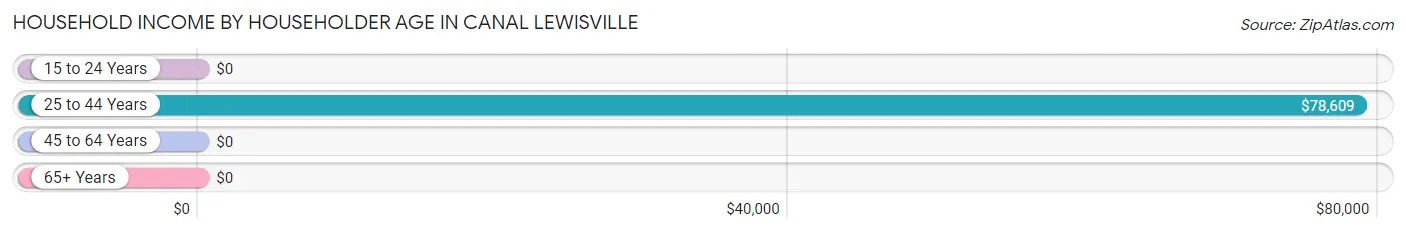
| Income Bracket | # Households | Median Income |
| 15 to 24 Years | 0 (0.0%) | $0 |
| 25 to 44 Years | 113 (48.5%) | $78,609 |
| 45 to 64 Years | 72 (30.9%) | $0 |
| 65+ Years | 48 (20.6%) | $0 |
| Total | 233 (100.0%) | $72,361 |
Poverty in Canal Lewisville
Income Below Poverty by Sex and Age in Canal Lewisville
With 17.8% poverty level for males and 29.1% for females among the residents of Canal Lewisville, 45 to 54 year old males and 45 to 54 year old females are the most vulnerable to poverty, with 48 males (85.7%) and 49 females (81.7%) in their respective age groups living below the poverty level.
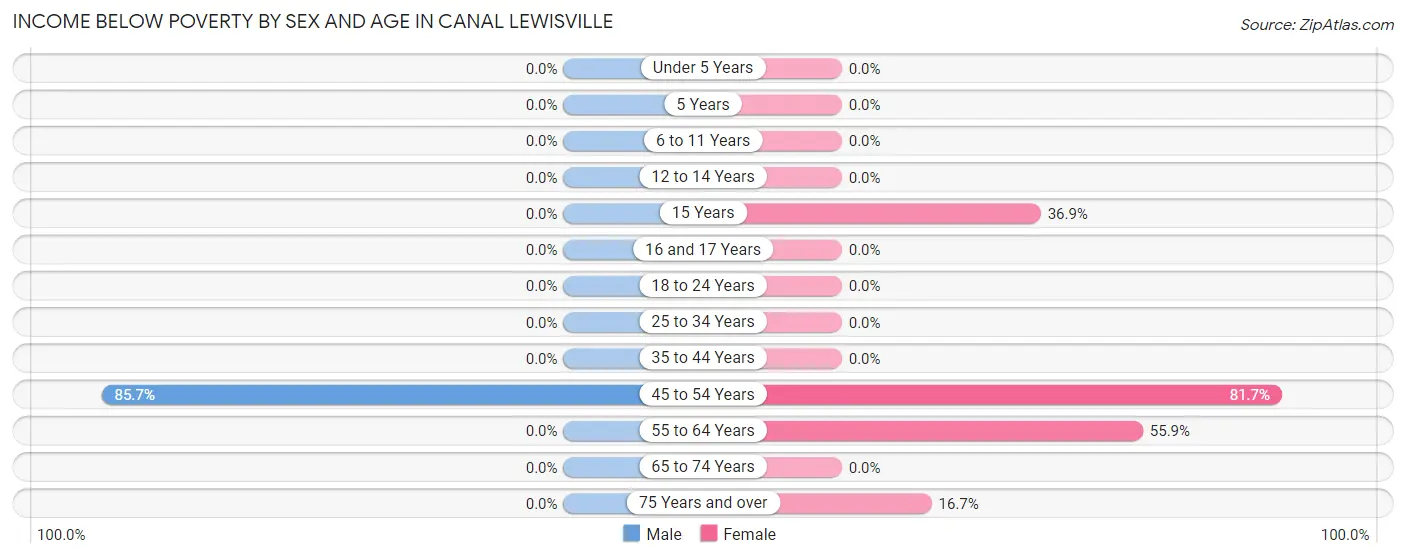
| Age Bracket | Male | Female |
| Under 5 Years | 0 (0.0%) | 0 (0.0%) |
| 5 Years | 0 (0.0%) | 0 (0.0%) |
| 6 to 11 Years | 0 (0.0%) | 0 (0.0%) |
| 12 to 14 Years | 0 (0.0%) | 0 (0.0%) |
| 15 Years | 0 (0.0%) | 48 (36.9%) |
| 16 and 17 Years | 0 (0.0%) | 0 (0.0%) |
| 18 to 24 Years | 0 (0.0%) | 0 (0.0%) |
| 25 to 34 Years | 0 (0.0%) | 0 (0.0%) |
| 35 to 44 Years | 0 (0.0%) | 0 (0.0%) |
| 45 to 54 Years | 48 (85.7%) | 49 (81.7%) |
| 55 to 64 Years | 0 (0.0%) | 38 (55.9%) |
| 65 to 74 Years | 0 (0.0%) | 0 (0.0%) |
| 75 Years and over | 0 (0.0%) | 8 (16.7%) |
| Total | 48 (17.8%) | 143 (29.1%) |
Income Above Poverty by Sex and Age in Canal Lewisville
According to the poverty statistics in Canal Lewisville, males aged under 5 years and females aged under 5 years are the age groups that are most secure financially, with 100.0% of males and 100.0% of females in these age groups living above the poverty line.
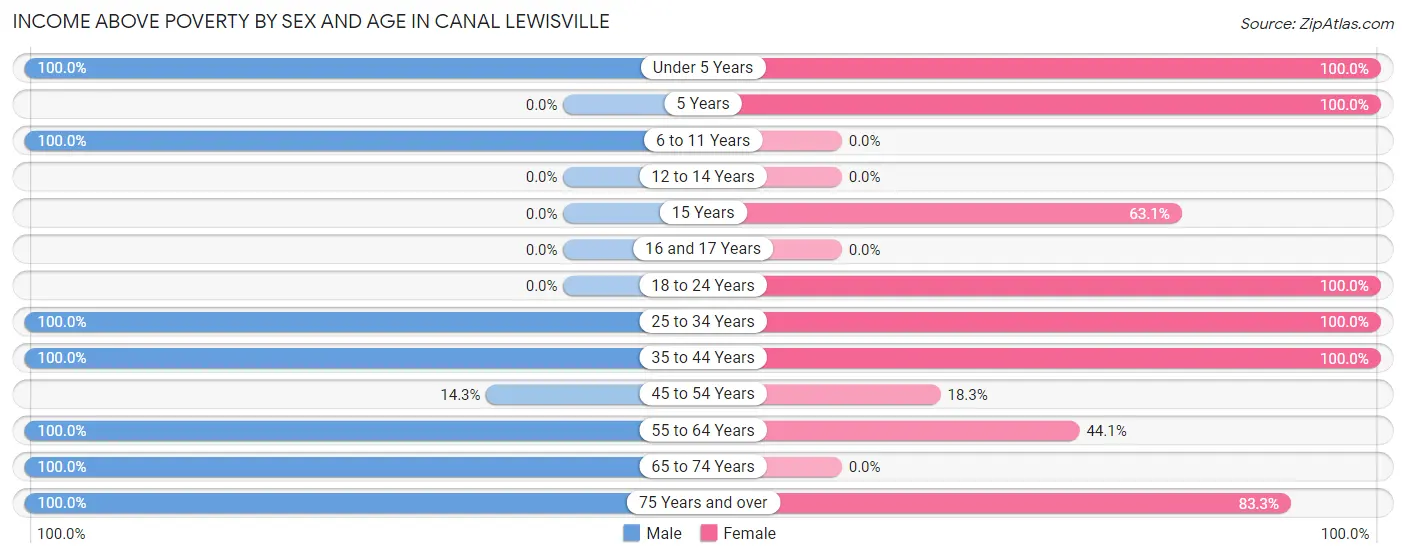
| Age Bracket | Male | Female |
| Under 5 Years | 123 (100.0%) | 8 (100.0%) |
| 5 Years | 0 (0.0%) | 11 (100.0%) |
| 6 to 11 Years | 9 (100.0%) | 0 (0.0%) |
| 12 to 14 Years | 0 (0.0%) | 0 (0.0%) |
| 15 Years | 0 (0.0%) | 82 (63.1%) |
| 16 and 17 Years | 0 (0.0%) | 0 (0.0%) |
| 18 to 24 Years | 0 (0.0%) | 53 (100.0%) |
| 25 to 34 Years | 24 (100.0%) | 25 (100.0%) |
| 35 to 44 Years | 11 (100.0%) | 89 (100.0%) |
| 45 to 54 Years | 8 (14.3%) | 11 (18.3%) |
| 55 to 64 Years | 26 (100.0%) | 30 (44.1%) |
| 65 to 74 Years | 11 (100.0%) | 0 (0.0%) |
| 75 Years and over | 9 (100.0%) | 40 (83.3%) |
| Total | 221 (82.2%) | 349 (70.9%) |
Income Below Poverty Among Married-Couple Families in Canal Lewisville
The poverty statistics for married-couple families in Canal Lewisville show that 39.2% or 38 of the total 97 families live below the poverty line. Families with 1 or 2 children have the highest poverty rate of 61.3%, comprising of 38 families. On the other hand, families with no children have the lowest poverty rate of 0.0%, which includes 0 families.
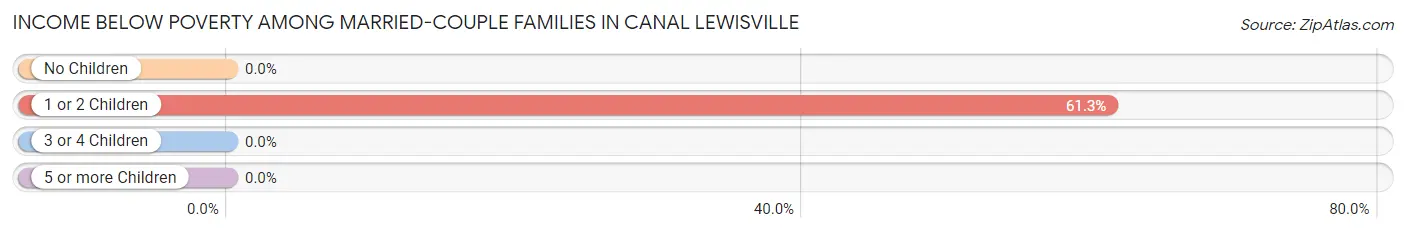
| Children | Above Poverty | Below Poverty |
| No Children | 35 (100.0%) | 0 (0.0%) |
| 1 or 2 Children | 24 (38.7%) | 38 (61.3%) |
| 3 or 4 Children | 0 (0.0%) | 0 (0.0%) |
| 5 or more Children | 0 (0.0%) | 0 (0.0%) |
| Total | 59 (60.8%) | 38 (39.2%) |
Income Below Poverty Among Single-Parent Households in Canal Lewisville
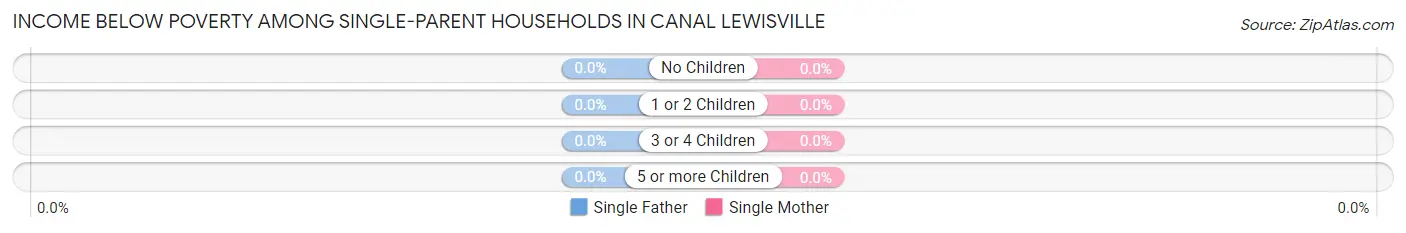
| Children | Single Father | Single Mother |
| No Children | 0 (0.0%) | 0 (0.0%) |
| 1 or 2 Children | 0 (0.0%) | 0 (0.0%) |
| 3 or 4 Children | 0 (0.0%) | 0 (0.0%) |
| 5 or more Children | 0 (0.0%) | 0 (0.0%) |
| Total | 0 (0.0%) | 0 (0.0%) |
Income Below Poverty Among Married-Couple vs Single-Parent Households in Canal Lewisville
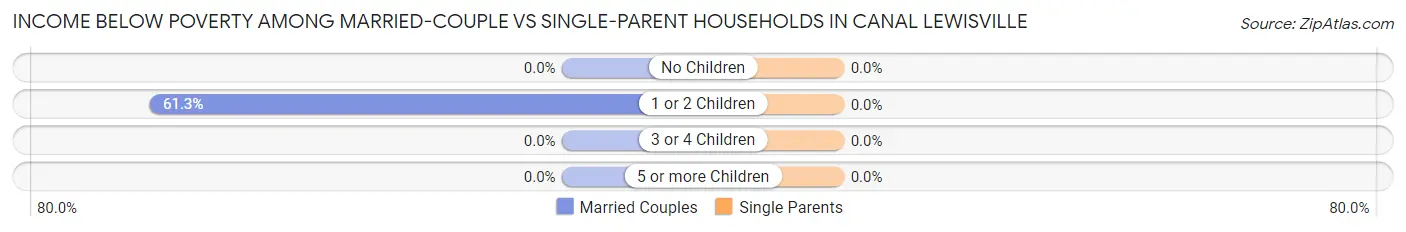
| Children | Married-Couple Families | Single-Parent Households |
| No Children | 0 (0.0%) | 0 (0.0%) |
| 1 or 2 Children | 38 (61.3%) | 0 (0.0%) |
| 3 or 4 Children | 0 (0.0%) | 0 (0.0%) |
| 5 or more Children | 0 (0.0%) | 0 (0.0%) |
| Total | 38 (39.2%) | 0 (0.0%) |
Race in Canal Lewisville
The most populous races in Canal Lewisville are White / Caucasian (688 | 90.4%), Some other Race (49 | 6.4%), and Black / African American (24 | 3.2%).
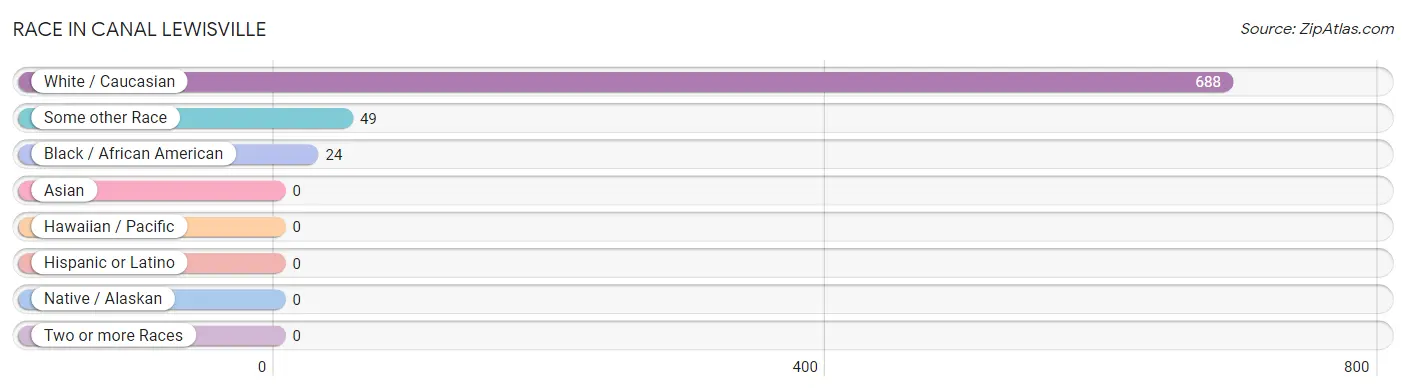
| Race | # Population | % Population |
| Asian | 0 | 0.0% |
| Black / African American | 24 | 3.2% |
| Hawaiian / Pacific | 0 | 0.0% |
| Hispanic or Latino | 0 | 0.0% |
| Native / Alaskan | 0 | 0.0% |
| White / Caucasian | 688 | 90.4% |
| Two or more Races | 0 | 0.0% |
| Some other Race | 49 | 6.4% |
| Total | 761 | 100.0% |
Ancestry in Canal Lewisville
The most populous ancestries reported in Canal Lewisville are German (145 | 19.1%), Irish (86 | 11.3%), American (53 | 7.0%), Swiss (38 | 5.0%), and English (16 | 2.1%), together accounting for 44.4% of all Canal Lewisville residents.
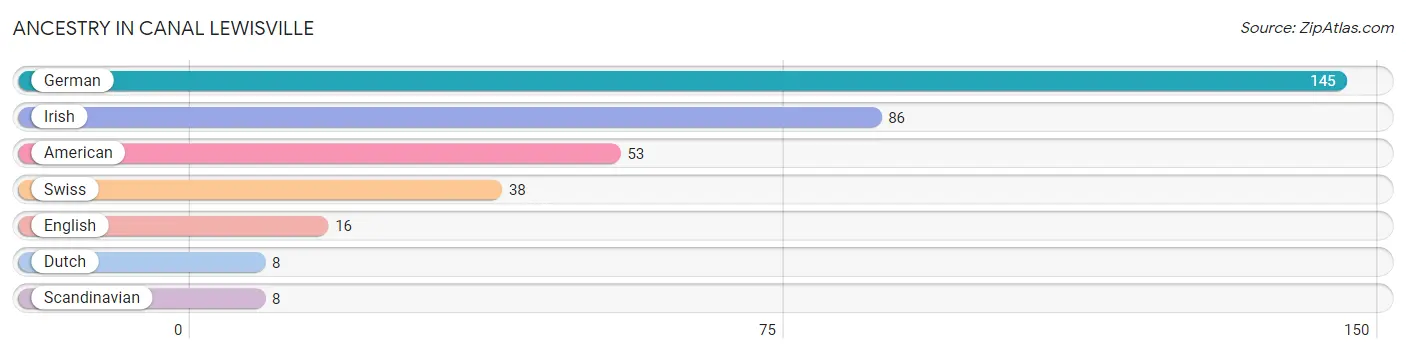
| Ancestry | # Population | % Population |
| American | 53 | 7.0% |
| Dutch | 8 | 1.1% |
| English | 16 | 2.1% |
| German | 145 | 19.1% |
| Irish | 86 | 11.3% |
| Scandinavian | 8 | 1.1% |
| Swiss | 38 | 5.0% | View All 7 Rows |
Immigrants in Canal Lewisville

| Immigration Origin | # Population | % Population | View All 0 Rows |
Sex and Age in Canal Lewisville
Sex and Age in Canal Lewisville
The most populous age groups in Canal Lewisville are Under 5 Years (123 | 45.7%) for men and 15 to 19 Years (130 | 26.4%) for women.
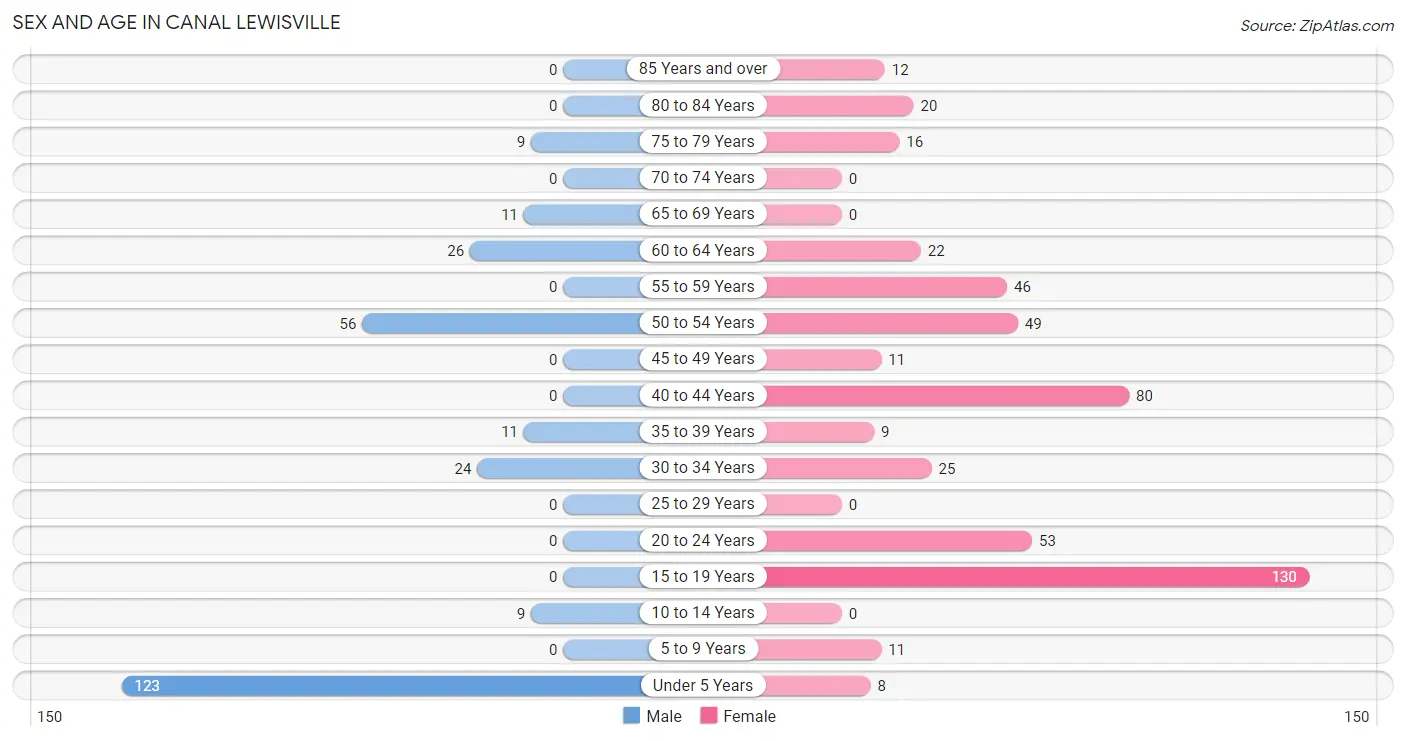
| Age Bracket | Male | Female |
| Under 5 Years | 123 (45.7%) | 8 (1.6%) |
| 5 to 9 Years | 0 (0.0%) | 11 (2.2%) |
| 10 to 14 Years | 9 (3.4%) | 0 (0.0%) |
| 15 to 19 Years | 0 (0.0%) | 130 (26.4%) |
| 20 to 24 Years | 0 (0.0%) | 53 (10.8%) |
| 25 to 29 Years | 0 (0.0%) | 0 (0.0%) |
| 30 to 34 Years | 24 (8.9%) | 25 (5.1%) |
| 35 to 39 Years | 11 (4.1%) | 9 (1.8%) |
| 40 to 44 Years | 0 (0.0%) | 80 (16.3%) |
| 45 to 49 Years | 0 (0.0%) | 11 (2.2%) |
| 50 to 54 Years | 56 (20.8%) | 49 (10.0%) |
| 55 to 59 Years | 0 (0.0%) | 46 (9.3%) |
| 60 to 64 Years | 26 (9.7%) | 22 (4.5%) |
| 65 to 69 Years | 11 (4.1%) | 0 (0.0%) |
| 70 to 74 Years | 0 (0.0%) | 0 (0.0%) |
| 75 to 79 Years | 9 (3.4%) | 16 (3.3%) |
| 80 to 84 Years | 0 (0.0%) | 20 (4.1%) |
| 85 Years and over | 0 (0.0%) | 12 (2.4%) |
| Total | 269 (100.0%) | 492 (100.0%) |
Families and Households in Canal Lewisville
Median Family Size in Canal Lewisville
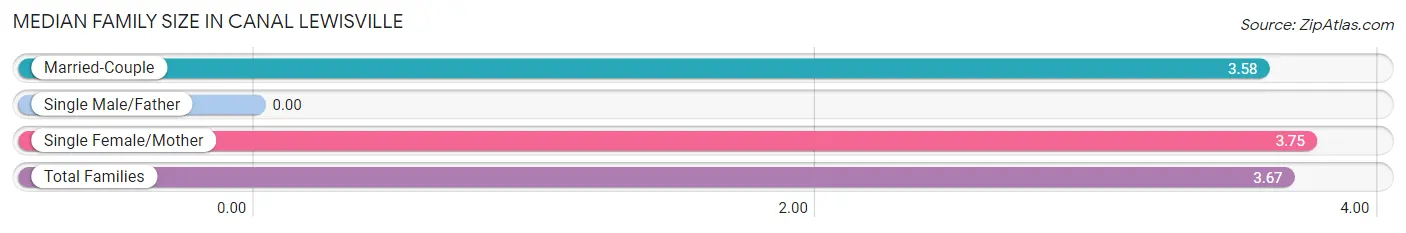
| Family Type | # Families | Family Size |
| Married-Couple | 97 (49.0%) | 3.58 |
| Single Male/Father | 0 (0.0%) | - |
| Single Female/Mother | 101 (51.0%) | 3.75 |
| Total Families | 198 (100.0%) | 3.67 |
Median Household Size in Canal Lewisville
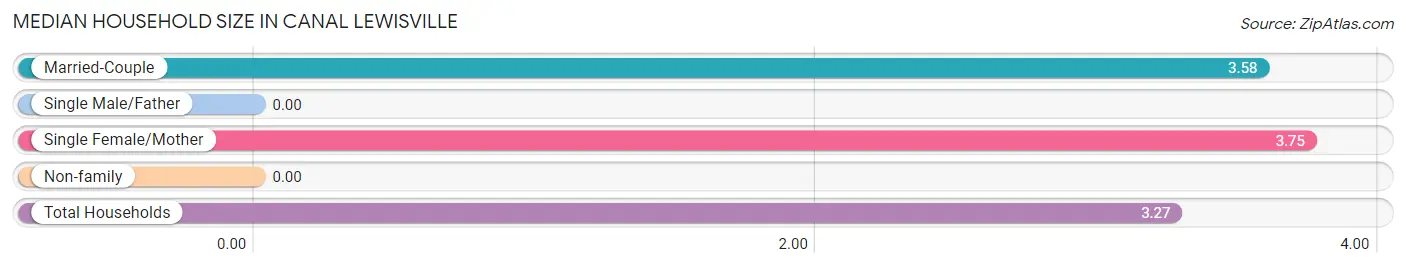
| Household Type | # Households | Household Size |
| Married-Couple | 97 (41.6%) | 3.58 |
| Single Male/Father | 0 (0.0%) | - |
| Single Female/Mother | 101 (43.3%) | 3.75 |
| Non-family | 35 (15.0%) | - |
| Total Households | 233 (100.0%) | 3.27 |
Household Size by Marriage Status in Canal Lewisville
Out of a total of 233 households in Canal Lewisville, 198 (85.0%) are family households, while 35 (15.0%) are nonfamily households. The most numerous type of family households are 5-person households, comprising 80, and the most common type of nonfamily households are 1-person households, comprising 35.
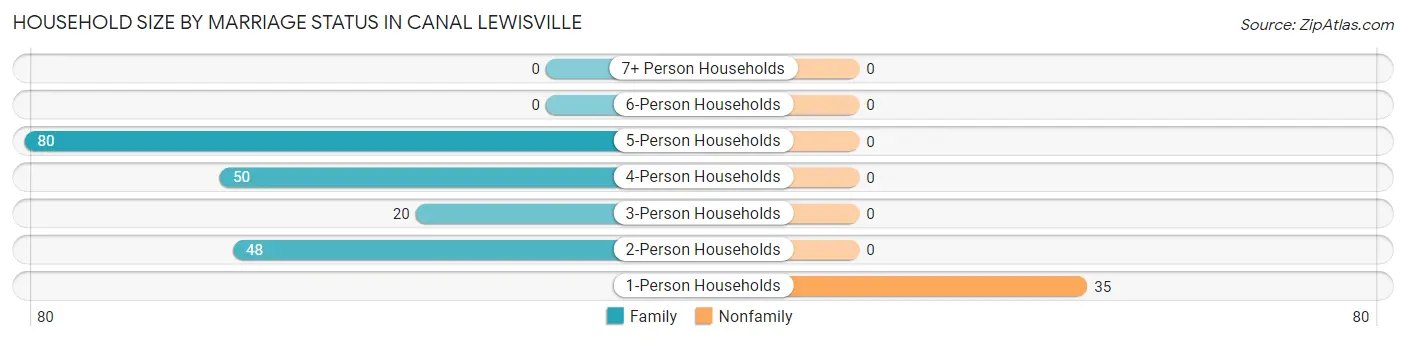
| Household Size | Family Households | Nonfamily Households |
| 1-Person Households | - | 35 (15.0%) |
| 2-Person Households | 48 (20.6%) | 0 (0.0%) |
| 3-Person Households | 20 (8.6%) | 0 (0.0%) |
| 4-Person Households | 50 (21.5%) | 0 (0.0%) |
| 5-Person Households | 80 (34.3%) | 0 (0.0%) |
| 6-Person Households | 0 (0.0%) | 0 (0.0%) |
| 7+ Person Households | 0 (0.0%) | 0 (0.0%) |
| Total | 198 (85.0%) | 35 (15.0%) |
Female Fertility in Canal Lewisville
Fertility by Age in Canal Lewisville
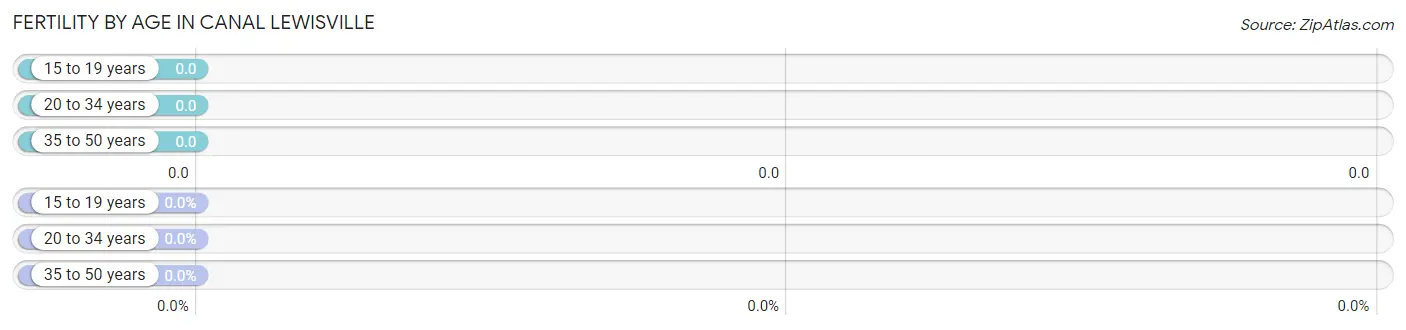
| Age Bracket | Women with Births | Births / 1,000 Women |
| 15 to 19 years | 0 (0.0%) | 0.0 |
| 20 to 34 years | 0 (0.0%) | 0.0 |
| 35 to 50 years | 0 (0.0%) | 0.0 |
| Total | 0 (0.0%) | 0.0 |
Fertility by Age by Marriage Status in Canal Lewisville
| Age Bracket | Married | Unmarried |
| 15 to 19 years | 0 (0.0%) | 0 (0.0%) |
| 20 to 34 years | 0 (0.0%) | 0 (0.0%) |
| 35 to 50 years | 0 (0.0%) | 0 (0.0%) |
| Total | 0 (0.0%) | 0 (0.0%) |
Fertility by Education in Canal Lewisville
| Educational Attainment | Women with Births | Births / 1,000 Women |
| Less than High School | 0 (0.0%) | 0.0 |
| High School Diploma | 0 (0.0%) | 0.0 |
| College or Associate's Degree | 0 (0.0%) | 0.0 |
| Bachelor's Degree | 0 (0.0%) | 0.0 |
| Graduate Degree | 0 (0.0%) | 0.0 |
| Total | 0 (0.0%) | 0.0 |
Fertility by Education by Marriage Status in Canal Lewisville
| Educational Attainment | Married | Unmarried |
| Less than High School | 0 (0.0%) | 0 (0.0%) |
| High School Diploma | 0 (0.0%) | 0 (0.0%) |
| College or Associate's Degree | 0 (0.0%) | 0 (0.0%) |
| Bachelor's Degree | 0 (0.0%) | 0 (0.0%) |
| Graduate Degree | 0 (0.0%) | 0 (0.0%) |
| Total | 0 (0.0%) | 0 (0.0%) |
Employment Characteristics in Canal Lewisville
Employment by Class of Employer in Canal Lewisville
Among the 228 employed individuals in Canal Lewisville, private company employees (176 | 77.2%), local government employees (24 | 10.5%), and not-for-profit organizations (20 | 8.8%) make up the most common classes of employment.
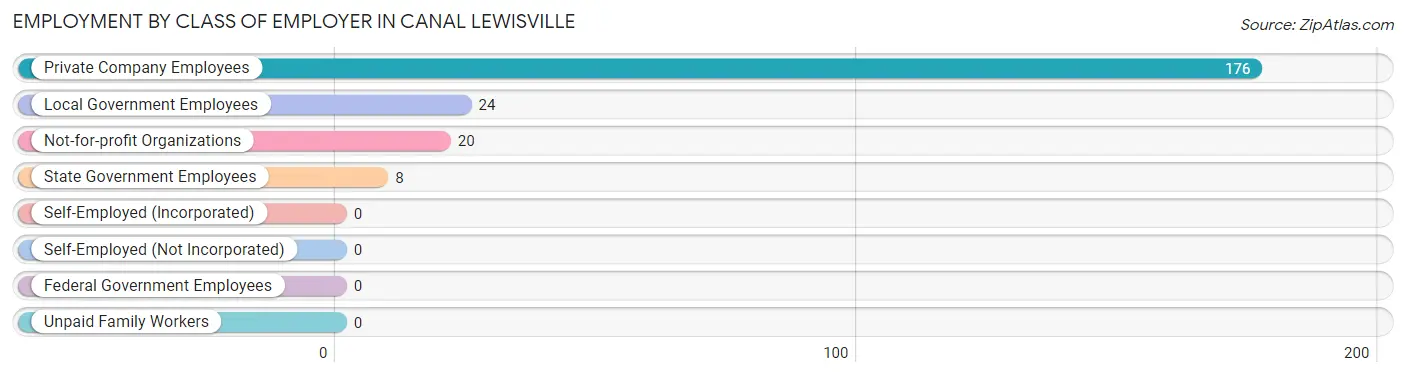
| Employer Class | # Employees | % Employees |
| Private Company Employees | 176 | 77.2% |
| Self-Employed (Incorporated) | 0 | 0.0% |
| Self-Employed (Not Incorporated) | 0 | 0.0% |
| Not-for-profit Organizations | 20 | 8.8% |
| Local Government Employees | 24 | 10.5% |
| State Government Employees | 8 | 3.5% |
| Federal Government Employees | 0 | 0.0% |
| Unpaid Family Workers | 0 | 0.0% |
| Total | 228 | 100.0% |
Employment Status by Age in Canal Lewisville
According to the labor force statistics for Canal Lewisville, out of the total population over 16 years of age (480), 64.2% or 308 individuals are in the labor force, with 26.0% or 80 of them unemployed. The age group with the highest labor force participation rate is 30 to 34 years, with 100.0% or 49 individuals in the labor force. Within the labor force, the 35 to 44 years age range has the highest percentage of unemployed individuals, with 80.0% or 80 of them being unemployed.
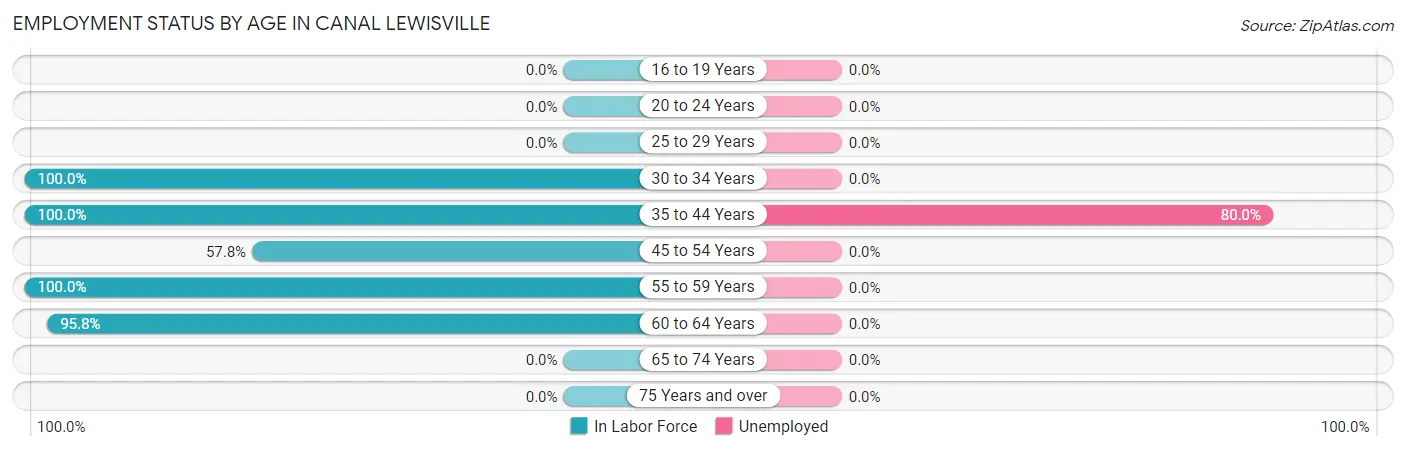
| Age Bracket | In Labor Force | Unemployed |
| 16 to 19 Years | 0 (0.0%) | 0 (0.0%) |
| 20 to 24 Years | 0 (0.0%) | 0 (0.0%) |
| 25 to 29 Years | 0 (0.0%) | 0 (0.0%) |
| 30 to 34 Years | 49 (100.0%) | 0 (0.0%) |
| 35 to 44 Years | 100 (100.0%) | 80 (80.0%) |
| 45 to 54 Years | 67 (57.8%) | 0 (0.0%) |
| 55 to 59 Years | 46 (100.0%) | 0 (0.0%) |
| 60 to 64 Years | 46 (95.8%) | 0 (0.0%) |
| 65 to 74 Years | 0 (0.0%) | 0 (0.0%) |
| 75 Years and over | 0 (0.0%) | 0 (0.0%) |
| Total | 308 (64.2%) | 80 (26.0%) |
Employment Status by Educational Attainment in Canal Lewisville
According to labor force statistics for Canal Lewisville, 85.8% of individuals (308) out of the total population between 25 and 64 years of age (359) are in the labor force, with 26.0% or 80 of them being unemployed. The group with the highest labor force participation rate are those with the educational attainment of college / associate degree, with 100.0% or 142 individuals in the labor force. Within the labor force, individuals with college / associate degree education have the highest percentage of unemployment, with 56.3% or 80 of them being unemployed.
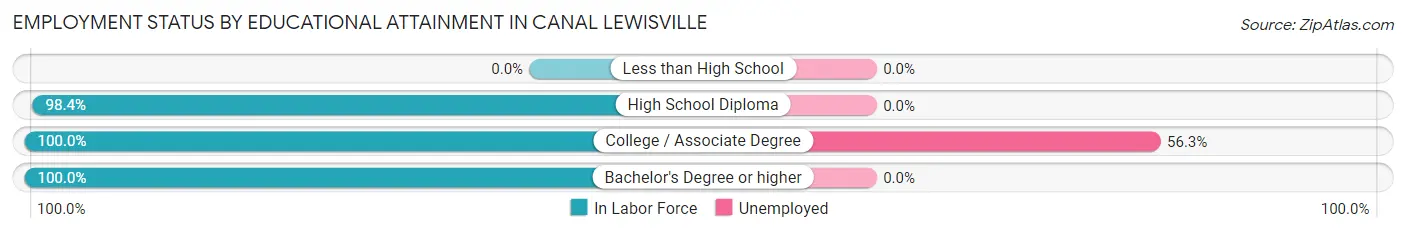
| Educational Attainment | In Labor Force | Unemployed |
| Less than High School | 0 (0.0%) | 0 (0.0%) |
| High School Diploma | 123 (98.4%) | 0 (0.0%) |
| College / Associate Degree | 142 (100.0%) | 80 (56.3%) |
| Bachelor's Degree or higher | 43 (100.0%) | 0 (0.0%) |
| Total | 308 (85.8%) | 93 (26.0%) |
Employment Occupations by Sex in Canal Lewisville
Management, Business, Science and Arts Occupations
The most common Management, Business, Science and Arts occupations in Canal Lewisville are Community & Social Service (32 | 14.0%), Education Instruction & Library (24 | 10.5%), Computers, Engineering & Science (11 | 4.8%), Life, Physical & Social Science (11 | 4.8%), and Business & Financial (8 | 3.5%).
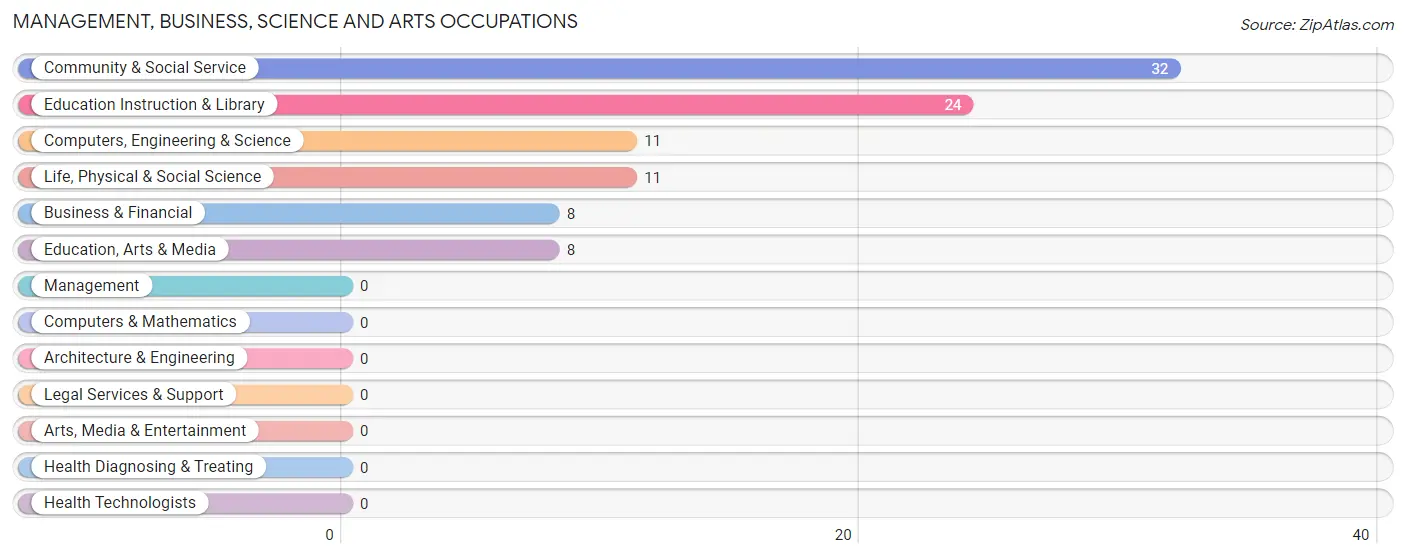
Management, Business, Science and Arts Occupations by Sex
Within the Management, Business, Science and Arts occupations in Canal Lewisville, the most male-oriented occupations are Business & Financial (100.0%), Computers, Engineering & Science (100.0%), and Life, Physical & Social Science (100.0%), while the most female-oriented occupations are Education, Arts & Media (100.0%), Community & Social Service (62.5%), and Education Instruction & Library (50.0%).
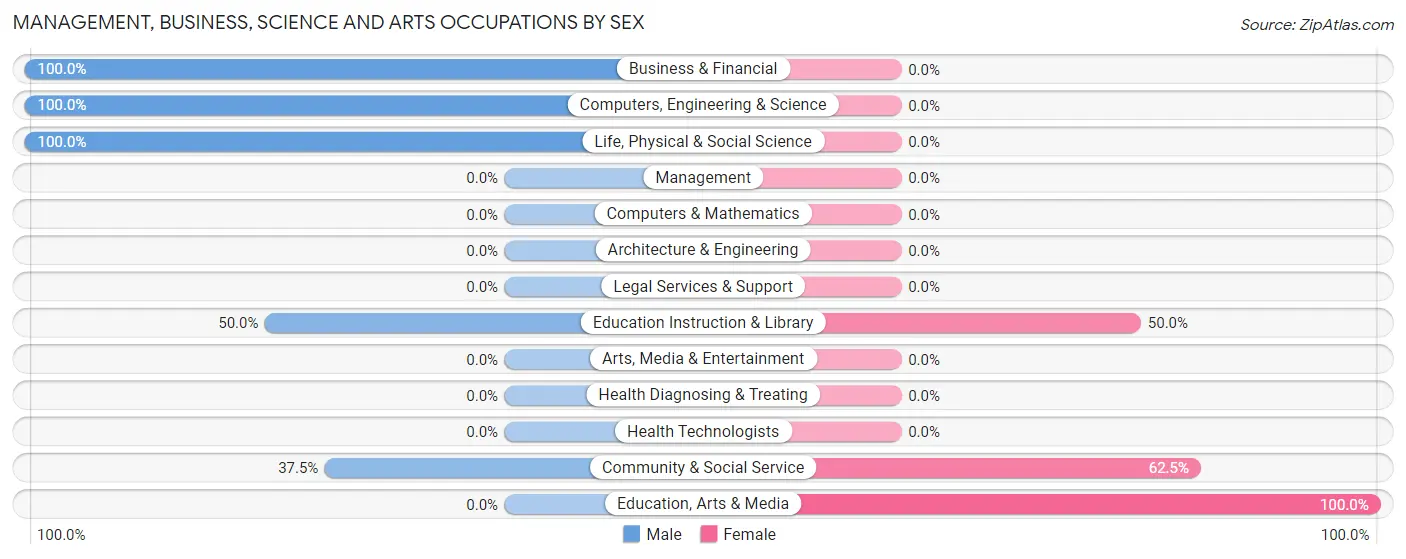
| Occupation | Male | Female |
| Management | 0 (0.0%) | 0 (0.0%) |
| Business & Financial | 8 (100.0%) | 0 (0.0%) |
| Computers, Engineering & Science | 11 (100.0%) | 0 (0.0%) |
| Computers & Mathematics | 0 (0.0%) | 0 (0.0%) |
| Architecture & Engineering | 0 (0.0%) | 0 (0.0%) |
| Life, Physical & Social Science | 11 (100.0%) | 0 (0.0%) |
| Community & Social Service | 12 (37.5%) | 20 (62.5%) |
| Education, Arts & Media | 0 (0.0%) | 8 (100.0%) |
| Legal Services & Support | 0 (0.0%) | 0 (0.0%) |
| Education Instruction & Library | 12 (50.0%) | 12 (50.0%) |
| Arts, Media & Entertainment | 0 (0.0%) | 0 (0.0%) |
| Health Diagnosing & Treating | 0 (0.0%) | 0 (0.0%) |
| Health Technologists | 0 (0.0%) | 0 (0.0%) |
| Total (Category) | 31 (60.8%) | 20 (39.2%) |
| Total (Overall) | 117 (51.3%) | 111 (48.7%) |
Services Occupations
The most common Services occupations in Canal Lewisville are Food Preparation & Serving (38 | 16.7%), Cleaning & Maintenance (32 | 14.0%), and Healthcare Support (13 | 5.7%).
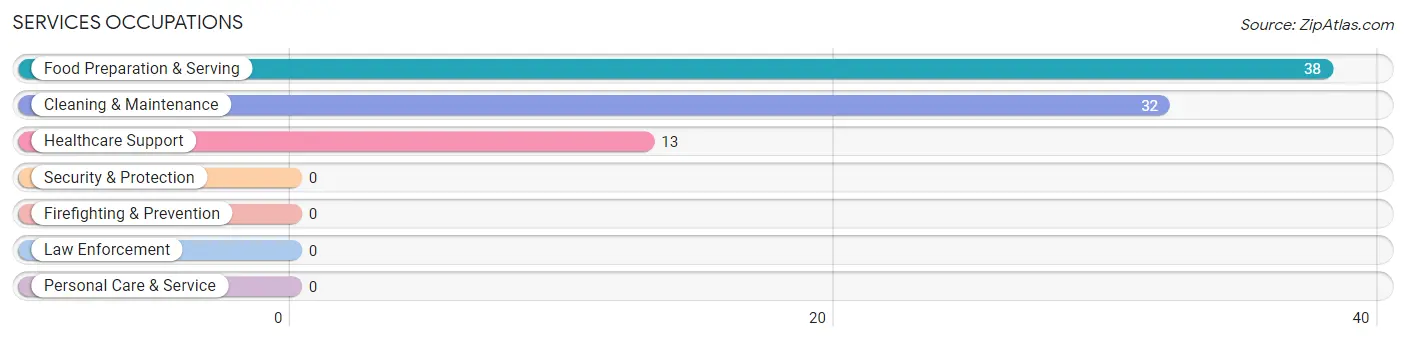
Services Occupations by Sex
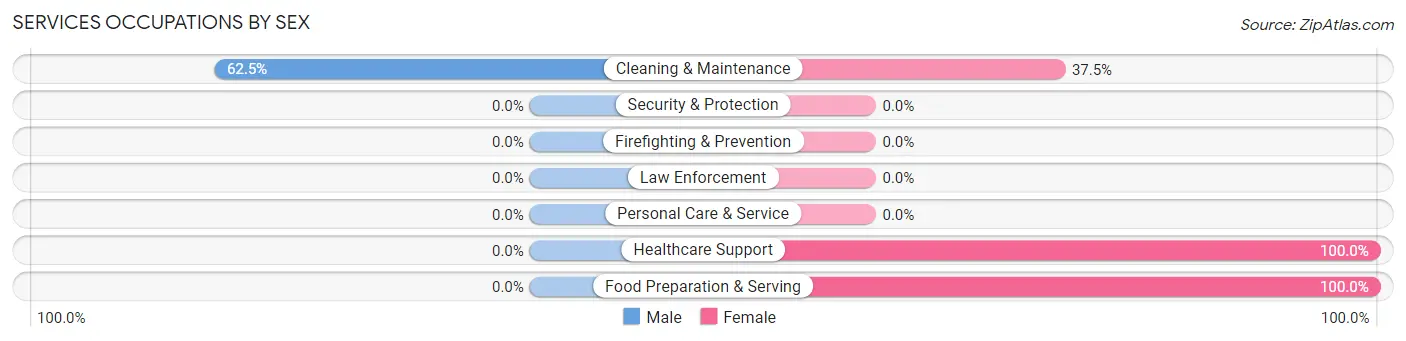
| Occupation | Male | Female |
| Healthcare Support | 0 (0.0%) | 13 (100.0%) |
| Security & Protection | 0 (0.0%) | 0 (0.0%) |
| Firefighting & Prevention | 0 (0.0%) | 0 (0.0%) |
| Law Enforcement | 0 (0.0%) | 0 (0.0%) |
| Food Preparation & Serving | 0 (0.0%) | 38 (100.0%) |
| Cleaning & Maintenance | 20 (62.5%) | 12 (37.5%) |
| Personal Care & Service | 0 (0.0%) | 0 (0.0%) |
| Total (Category) | 20 (24.1%) | 63 (75.9%) |
| Total (Overall) | 117 (51.3%) | 111 (48.7%) |
Sales and Office Occupations
The most common Sales and Office occupations in Canal Lewisville are , and Office & Administration (28 | 12.3%).
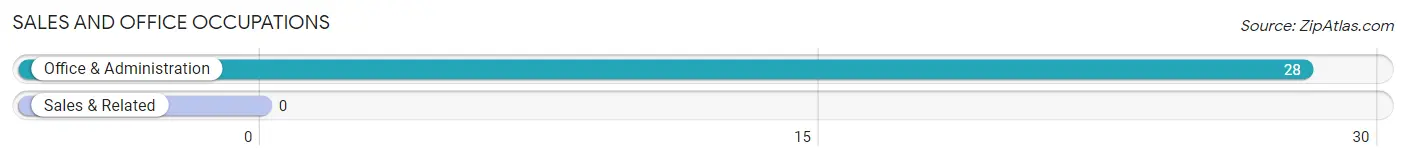
Sales and Office Occupations by Sex
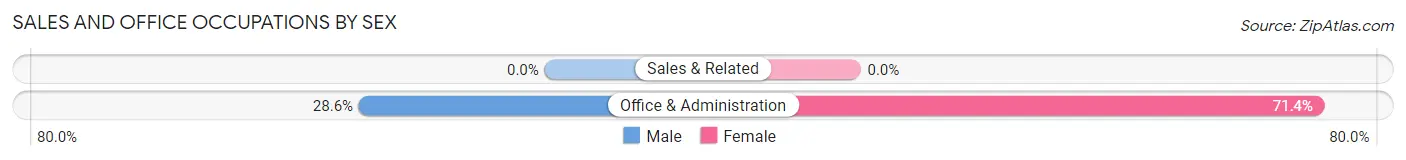
| Occupation | Male | Female |
| Sales & Related | 0 (0.0%) | 0 (0.0%) |
| Office & Administration | 8 (28.6%) | 20 (71.4%) |
| Total (Category) | 8 (28.6%) | 20 (71.4%) |
| Total (Overall) | 117 (51.3%) | 111 (48.7%) |
Natural Resources, Construction and Maintenance Occupations
The most common Natural Resources, Construction and Maintenance occupations in Canal Lewisville are , and Installation, Maintenance & Repair (56 | 24.6%).
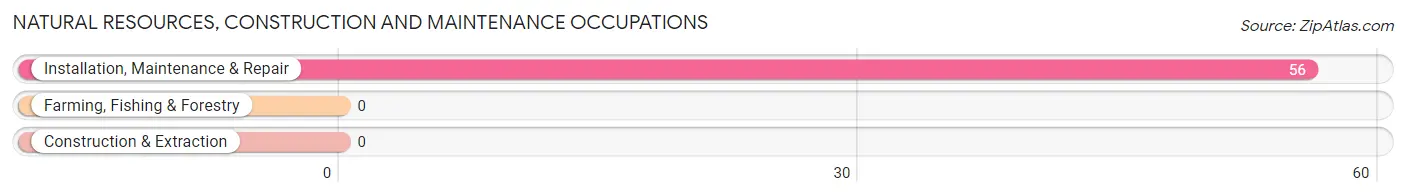
Natural Resources, Construction and Maintenance Occupations by Sex

| Occupation | Male | Female |
| Farming, Fishing & Forestry | 0 (0.0%) | 0 (0.0%) |
| Construction & Extraction | 0 (0.0%) | 0 (0.0%) |
| Installation, Maintenance & Repair | 56 (100.0%) | 0 (0.0%) |
| Total (Category) | 56 (100.0%) | 0 (0.0%) |
| Total (Overall) | 117 (51.3%) | 111 (48.7%) |
Production, Transportation and Moving Occupations
The most common Production, Transportation and Moving occupations in Canal Lewisville are Production (8 | 3.5%), and Material Moving (2 | 0.9%).
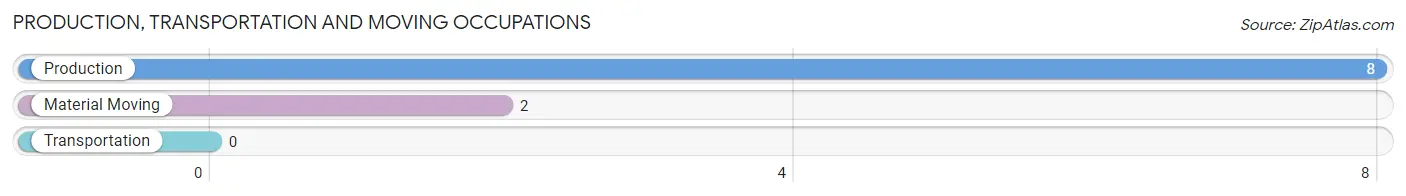
Production, Transportation and Moving Occupations by Sex
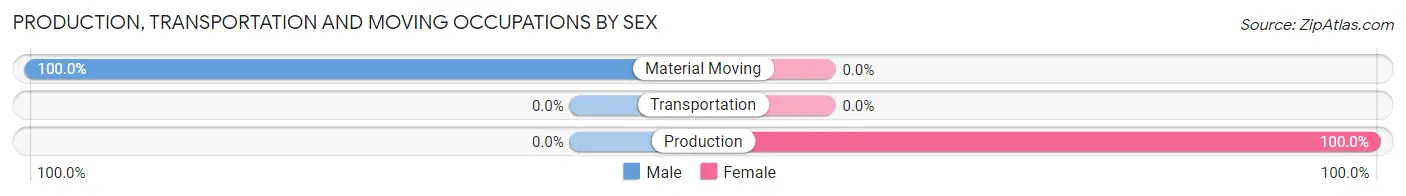
| Occupation | Male | Female |
| Production | 0 (0.0%) | 8 (100.0%) |
| Transportation | 0 (0.0%) | 0 (0.0%) |
| Material Moving | 2 (100.0%) | 0 (0.0%) |
| Total (Category) | 2 (20.0%) | 8 (80.0%) |
| Total (Overall) | 117 (51.3%) | 111 (48.7%) |
Employment Industries by Sex in Canal Lewisville
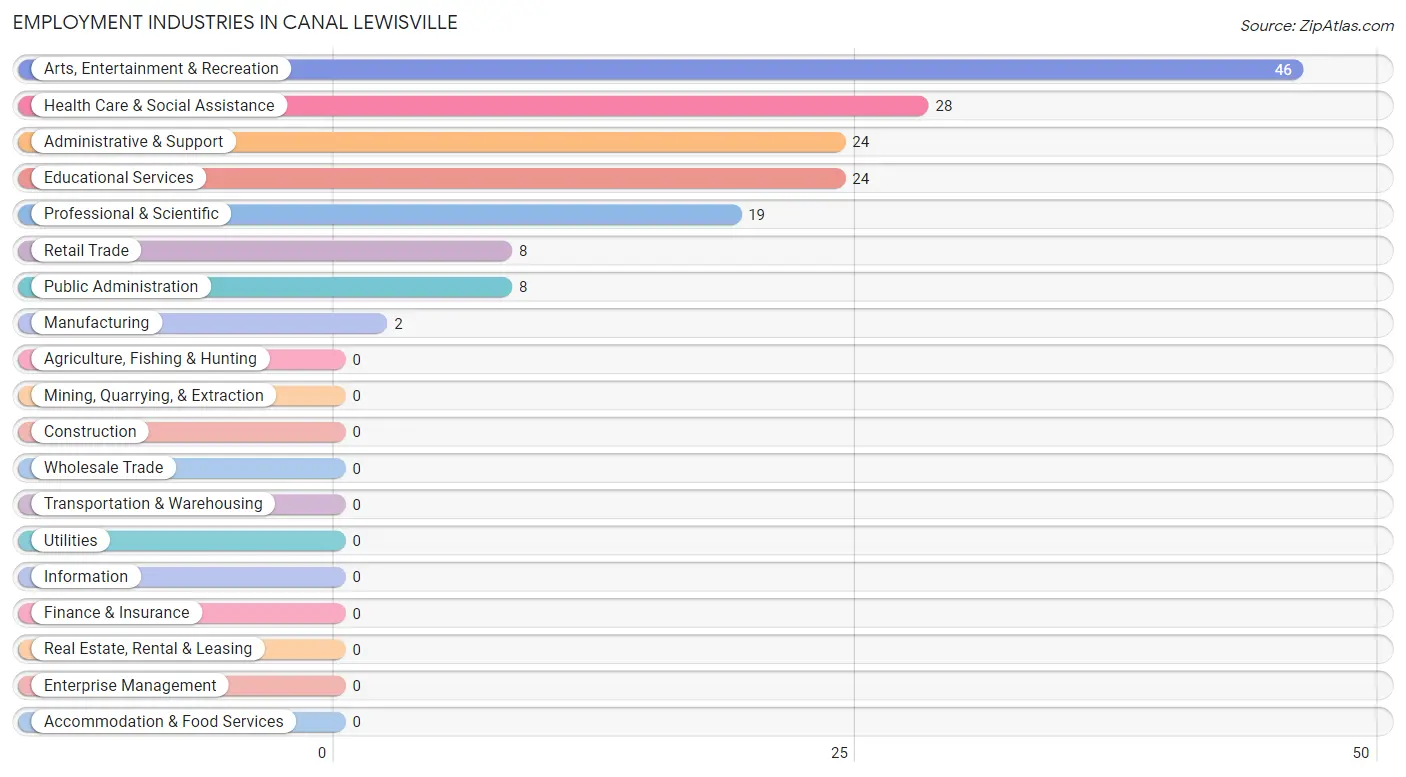
Employment Industries in Canal Lewisville
The major employment industries in Canal Lewisville include Arts, Entertainment & Recreation (46 | 20.2%), Health Care & Social Assistance (28 | 12.3%), Administrative & Support (24 | 10.5%), Educational Services (24 | 10.5%), and Professional & Scientific (19 | 8.3%).
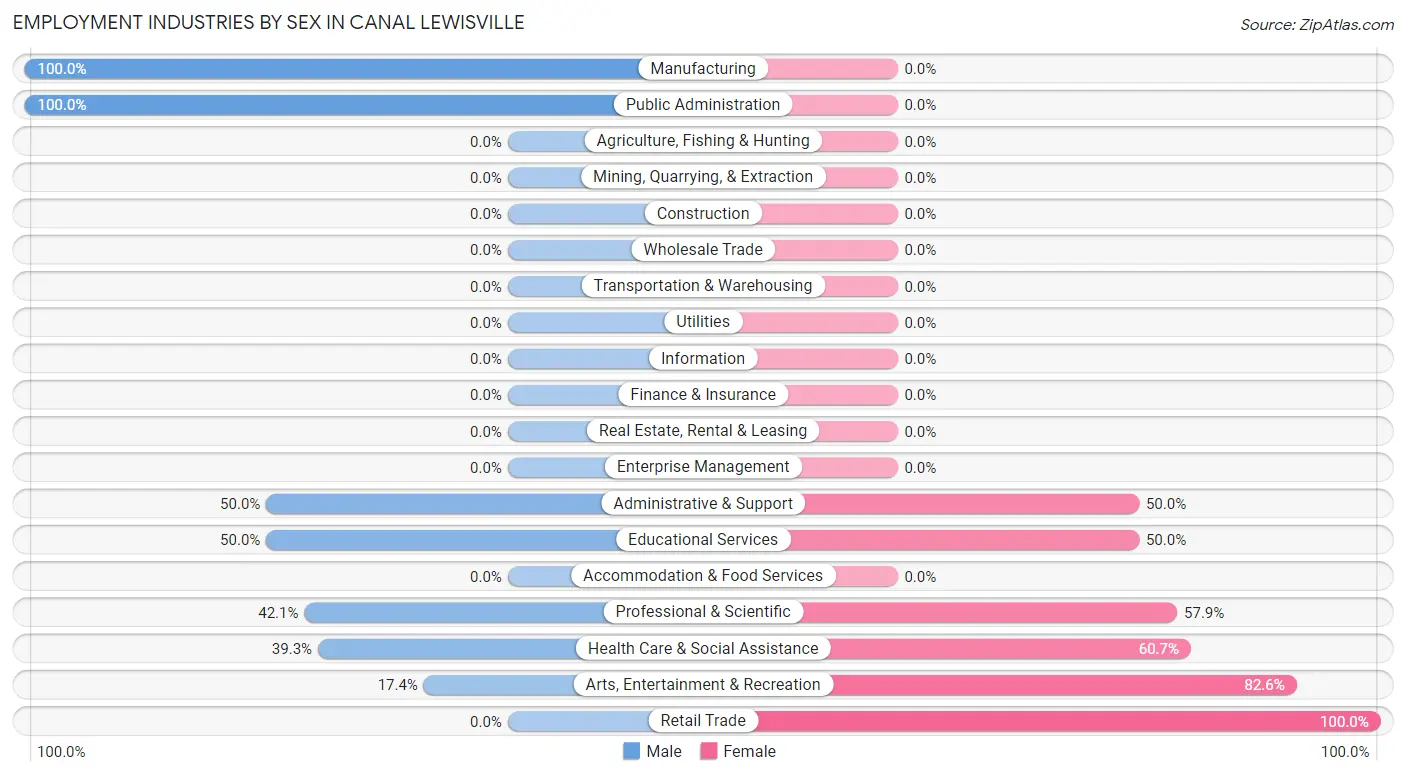
Employment Industries by Sex in Canal Lewisville
The Canal Lewisville industries that see more men than women are Manufacturing (100.0%), Public Administration (100.0%), and Administrative & Support (50.0%), whereas the industries that tend to have a higher number of women are Retail Trade (100.0%), Arts, Entertainment & Recreation (82.6%), and Health Care & Social Assistance (60.7%).
| Industry | Male | Female |
| Agriculture, Fishing & Hunting | 0 (0.0%) | 0 (0.0%) |
| Mining, Quarrying, & Extraction | 0 (0.0%) | 0 (0.0%) |
| Construction | 0 (0.0%) | 0 (0.0%) |
| Manufacturing | 2 (100.0%) | 0 (0.0%) |
| Wholesale Trade | 0 (0.0%) | 0 (0.0%) |
| Retail Trade | 0 (0.0%) | 8 (100.0%) |
| Transportation & Warehousing | 0 (0.0%) | 0 (0.0%) |
| Utilities | 0 (0.0%) | 0 (0.0%) |
| Information | 0 (0.0%) | 0 (0.0%) |
| Finance & Insurance | 0 (0.0%) | 0 (0.0%) |
| Real Estate, Rental & Leasing | 0 (0.0%) | 0 (0.0%) |
| Professional & Scientific | 8 (42.1%) | 11 (57.9%) |
| Enterprise Management | 0 (0.0%) | 0 (0.0%) |
| Administrative & Support | 12 (50.0%) | 12 (50.0%) |
| Educational Services | 12 (50.0%) | 12 (50.0%) |
| Health Care & Social Assistance | 11 (39.3%) | 17 (60.7%) |
| Arts, Entertainment & Recreation | 8 (17.4%) | 38 (82.6%) |
| Accommodation & Food Services | 0 (0.0%) | 0 (0.0%) |
| Public Administration | 8 (100.0%) | 0 (0.0%) |
| Total | 117 (51.3%) | 111 (48.7%) |
Education in Canal Lewisville
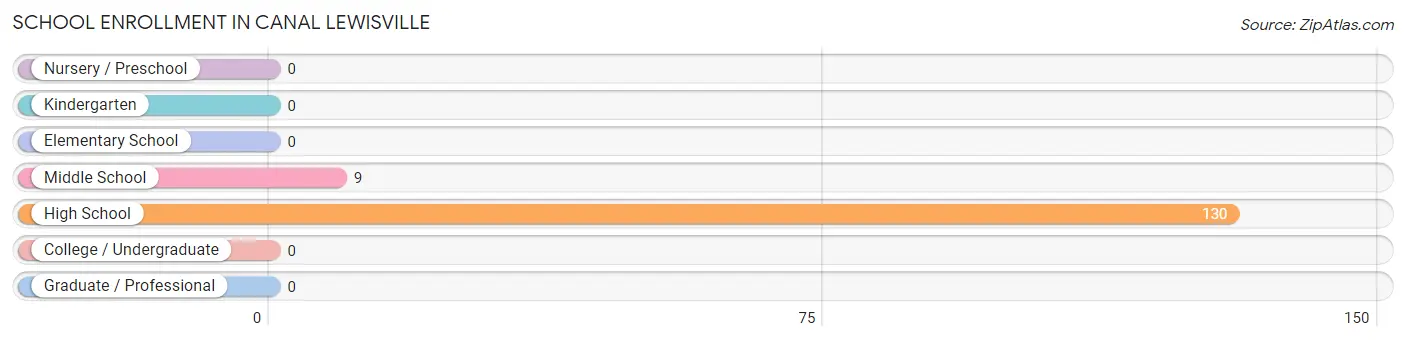
School Enrollment in Canal Lewisville
The most common levels of schooling among the 139 students in Canal Lewisville are high school (130 | 93.5%), and middle school (9 | 6.5%).
| School Level | # Students | % Students |
| Nursery / Preschool | 0 | 0.0% |
| Kindergarten | 0 | 0.0% |
| Elementary School | 0 | 0.0% |
| Middle School | 9 | 6.5% |
| High School | 130 | 93.5% |
| College / Undergraduate | 0 | 0.0% |
| Graduate / Professional | 0 | 0.0% |
| Total | 139 | 100.0% |
School Enrollment by Age by Funding Source in Canal Lewisville
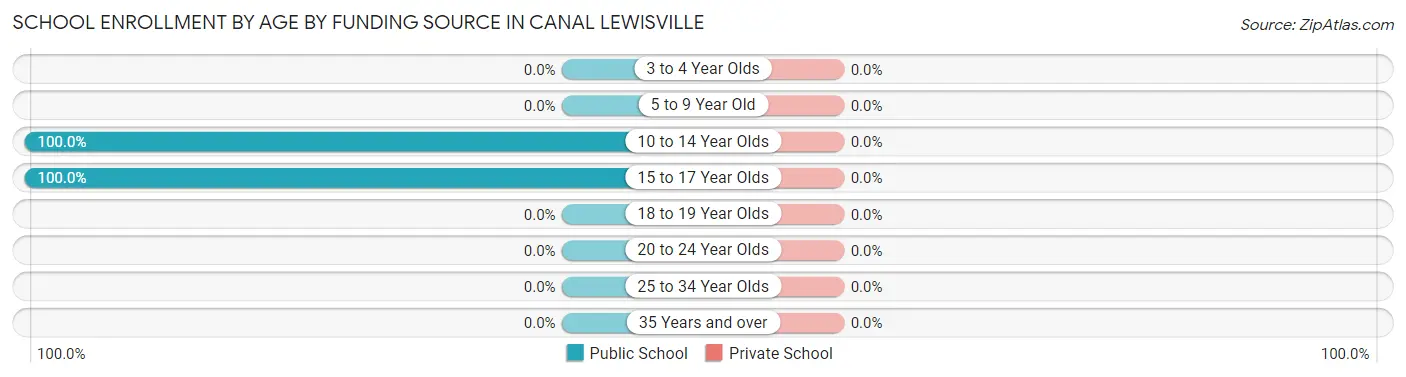
| Age Bracket | Public School | Private School |
| 3 to 4 Year Olds | 0 (0.0%) | 0 (0.0%) |
| 5 to 9 Year Old | 0 (0.0%) | 0 (0.0%) |
| 10 to 14 Year Olds | 9 (100.0%) | 0 (0.0%) |
| 15 to 17 Year Olds | 130 (100.0%) | 0 (0.0%) |
| 18 to 19 Year Olds | 0 (0.0%) | 0 (0.0%) |
| 20 to 24 Year Olds | 0 (0.0%) | 0 (0.0%) |
| 25 to 34 Year Olds | 0 (0.0%) | 0 (0.0%) |
| 35 Years and over | 0 (0.0%) | 0 (0.0%) |
| Total | 139 (100.0%) | 0 (0.0%) |
Educational Attainment by Field of Study in Canal Lewisville
Education (24 | 55.8%), bio, nature & agricultural (11 | 25.6%), and arts & humanities (8 | 18.6%) are the most common fields of study among 43 individuals in Canal Lewisville who have obtained a bachelor's degree or higher.
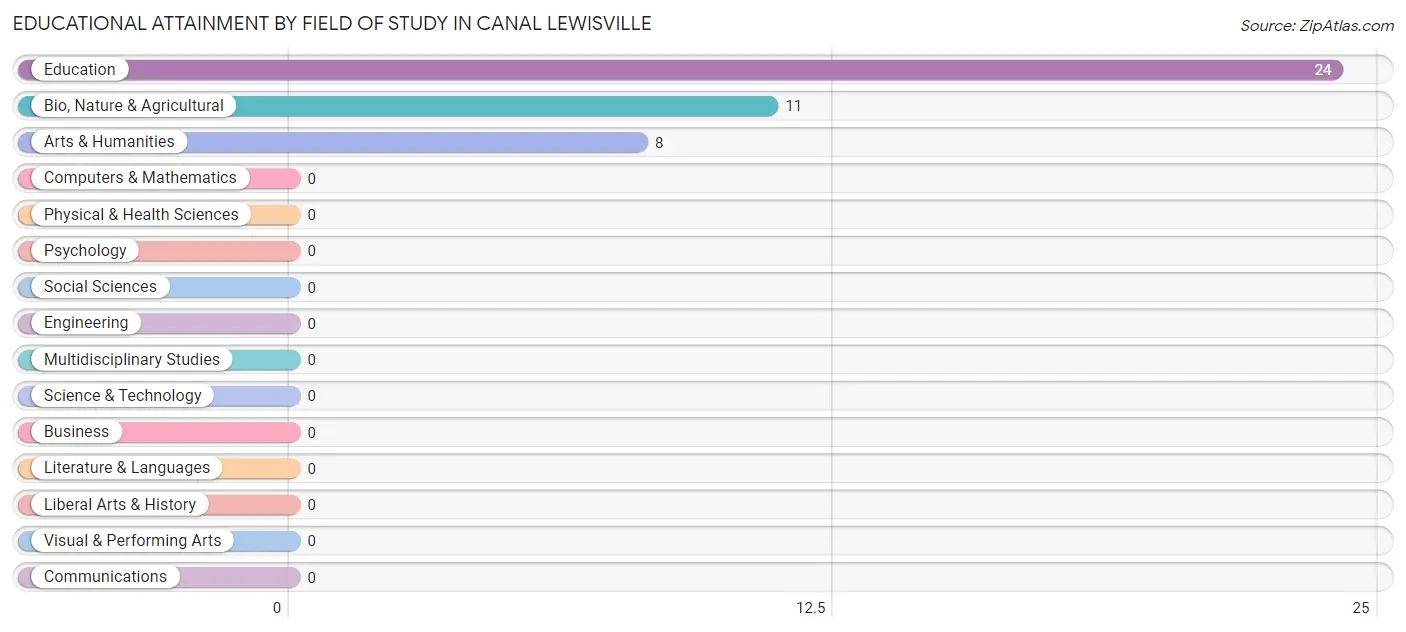
| Field of Study | # Graduates | % Graduates |
| Computers & Mathematics | 0 | 0.0% |
| Bio, Nature & Agricultural | 11 | 25.6% |
| Physical & Health Sciences | 0 | 0.0% |
| Psychology | 0 | 0.0% |
| Social Sciences | 0 | 0.0% |
| Engineering | 0 | 0.0% |
| Multidisciplinary Studies | 0 | 0.0% |
| Science & Technology | 0 | 0.0% |
| Business | 0 | 0.0% |
| Education | 24 | 55.8% |
| Literature & Languages | 0 | 0.0% |
| Liberal Arts & History | 0 | 0.0% |
| Visual & Performing Arts | 0 | 0.0% |
| Communications | 0 | 0.0% |
| Arts & Humanities | 8 | 18.6% |
| Total | 43 | 100.0% |
Transportation & Commute in Canal Lewisville
Vehicle Availability by Sex in Canal Lewisville
The most prevalent vehicle ownership categories in Canal Lewisville are males with 2 vehicles (56, accounting for 47.9%) and females with 2 vehicles (58, making up 50.4%).
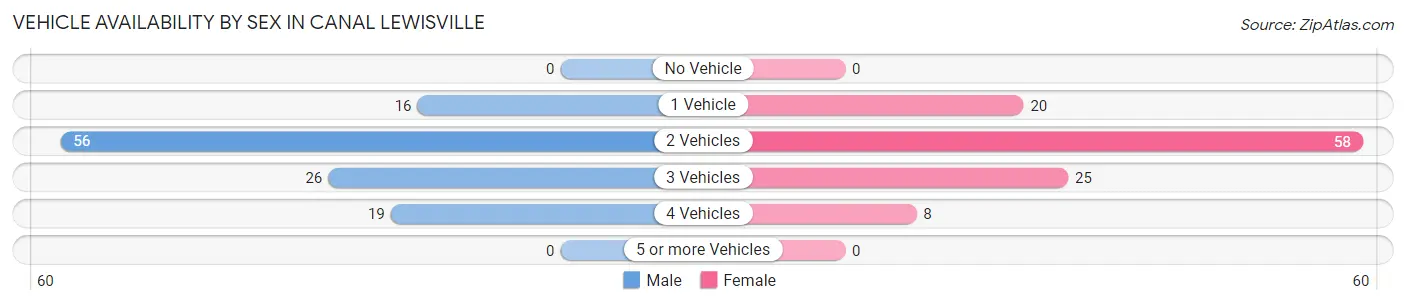
| Vehicles Available | Male | Female |
| No Vehicle | 0 (0.0%) | 0 (0.0%) |
| 1 Vehicle | 16 (13.7%) | 20 (18.0%) |
| 2 Vehicles | 56 (47.9%) | 58 (52.2%) |
| 3 Vehicles | 26 (22.2%) | 25 (22.5%) |
| 4 Vehicles | 19 (16.2%) | 8 (7.2%) |
| 5 or more Vehicles | 0 (0.0%) | 0 (0.0%) |
| Total | 117 (100.0%) | 111 (100.0%) |
Commute Time in Canal Lewisville
The most frequently occuring commute durations in Canal Lewisville are 10 to 14 minutes (130 commuters, 57.0%), 15 to 19 minutes (47 commuters, 20.6%), and 60 to 89 minutes (29 commuters, 12.7%).
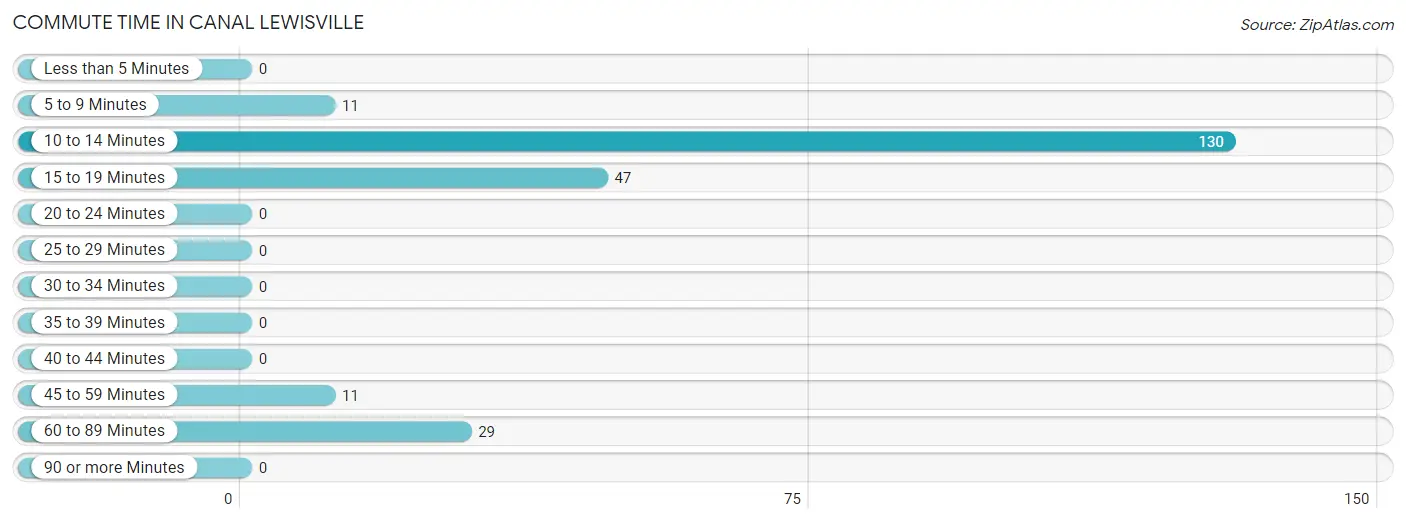
| Commute Time | # Commuters | % Commuters |
| Less than 5 Minutes | 0 | 0.0% |
| 5 to 9 Minutes | 11 | 4.8% |
| 10 to 14 Minutes | 130 | 57.0% |
| 15 to 19 Minutes | 47 | 20.6% |
| 20 to 24 Minutes | 0 | 0.0% |
| 25 to 29 Minutes | 0 | 0.0% |
| 30 to 34 Minutes | 0 | 0.0% |
| 35 to 39 Minutes | 0 | 0.0% |
| 40 to 44 Minutes | 0 | 0.0% |
| 45 to 59 Minutes | 11 | 4.8% |
| 60 to 89 Minutes | 29 | 12.7% |
| 90 or more Minutes | 0 | 0.0% |
Commute Time by Sex in Canal Lewisville
The most common commute times in Canal Lewisville are 10 to 14 minutes (72 commuters, 61.5%) for males and 10 to 14 minutes (58 commuters, 52.2%) for females.
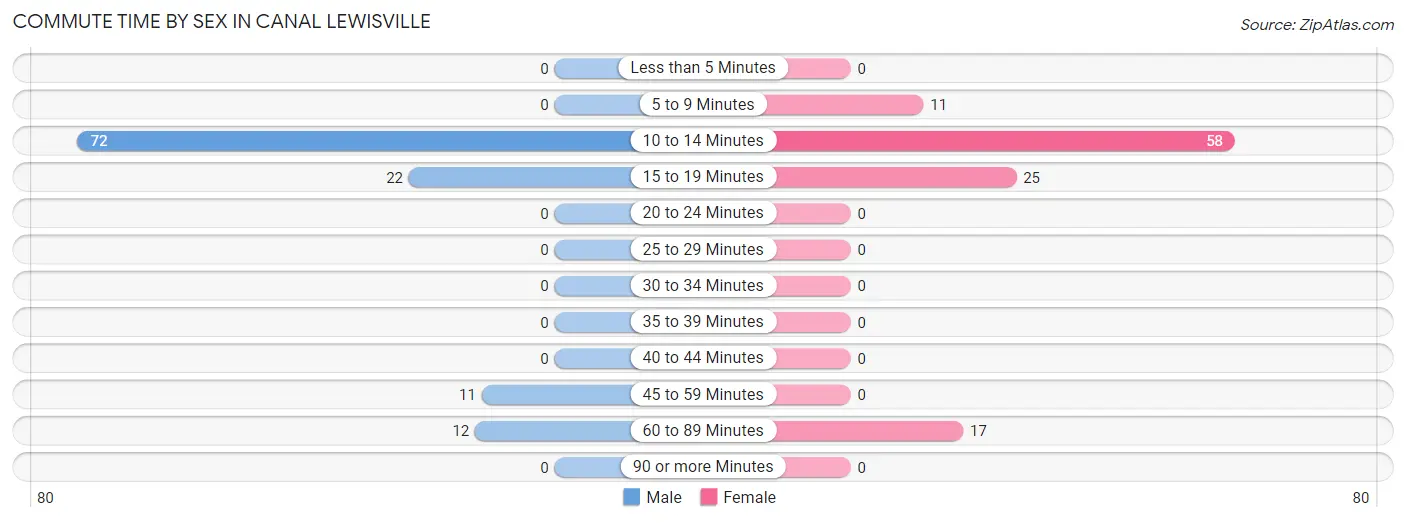
| Commute Time | Male | Female |
| Less than 5 Minutes | 0 (0.0%) | 0 (0.0%) |
| 5 to 9 Minutes | 0 (0.0%) | 11 (9.9%) |
| 10 to 14 Minutes | 72 (61.5%) | 58 (52.2%) |
| 15 to 19 Minutes | 22 (18.8%) | 25 (22.5%) |
| 20 to 24 Minutes | 0 (0.0%) | 0 (0.0%) |
| 25 to 29 Minutes | 0 (0.0%) | 0 (0.0%) |
| 30 to 34 Minutes | 0 (0.0%) | 0 (0.0%) |
| 35 to 39 Minutes | 0 (0.0%) | 0 (0.0%) |
| 40 to 44 Minutes | 0 (0.0%) | 0 (0.0%) |
| 45 to 59 Minutes | 11 (9.4%) | 0 (0.0%) |
| 60 to 89 Minutes | 12 (10.3%) | 17 (15.3%) |
| 90 or more Minutes | 0 (0.0%) | 0 (0.0%) |
Time of Departure to Work by Sex in Canal Lewisville
The most frequent times of departure to work in Canal Lewisville are 7:30 AM to 7:59 AM (68, 58.1%) for males and 4:00 PM to 11:59 PM (38, 34.2%) for females.
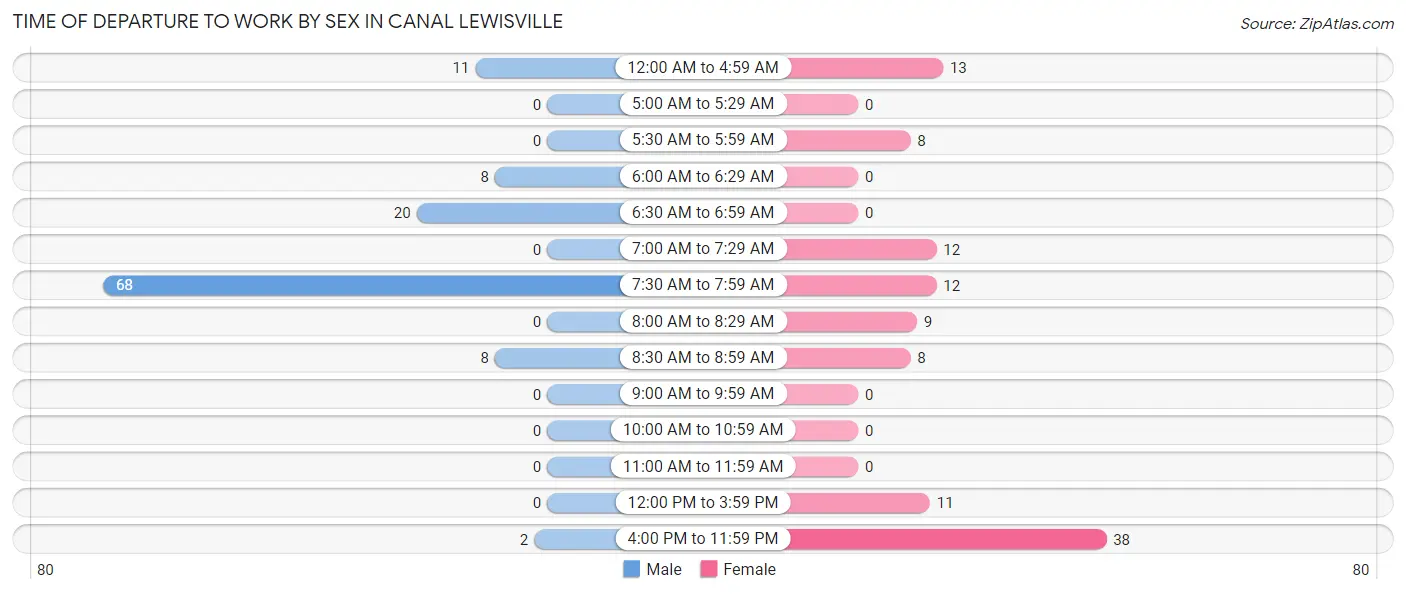
| Time of Departure | Male | Female |
| 12:00 AM to 4:59 AM | 11 (9.4%) | 13 (11.7%) |
| 5:00 AM to 5:29 AM | 0 (0.0%) | 0 (0.0%) |
| 5:30 AM to 5:59 AM | 0 (0.0%) | 8 (7.2%) |
| 6:00 AM to 6:29 AM | 8 (6.8%) | 0 (0.0%) |
| 6:30 AM to 6:59 AM | 20 (17.1%) | 0 (0.0%) |
| 7:00 AM to 7:29 AM | 0 (0.0%) | 12 (10.8%) |
| 7:30 AM to 7:59 AM | 68 (58.1%) | 12 (10.8%) |
| 8:00 AM to 8:29 AM | 0 (0.0%) | 9 (8.1%) |
| 8:30 AM to 8:59 AM | 8 (6.8%) | 8 (7.2%) |
| 9:00 AM to 9:59 AM | 0 (0.0%) | 0 (0.0%) |
| 10:00 AM to 10:59 AM | 0 (0.0%) | 0 (0.0%) |
| 11:00 AM to 11:59 AM | 0 (0.0%) | 0 (0.0%) |
| 12:00 PM to 3:59 PM | 0 (0.0%) | 11 (9.9%) |
| 4:00 PM to 11:59 PM | 2 (1.7%) | 38 (34.2%) |
| Total | 117 (100.0%) | 111 (100.0%) |
Housing Occupancy in Canal Lewisville
Occupancy by Ownership in Canal Lewisville
Of the total 233 dwellings in Canal Lewisville, owner-occupied units account for 78 (33.5%), while renter-occupied units make up 155 (66.5%).
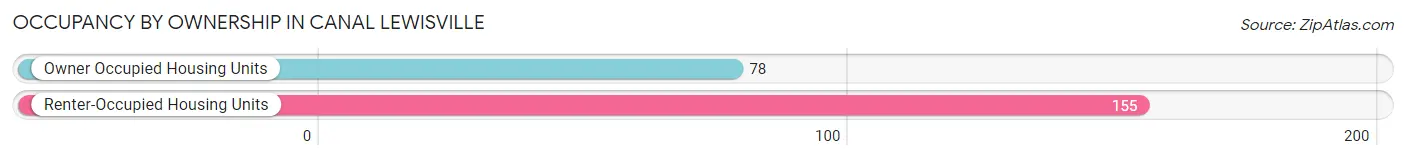
| Occupancy | # Housing Units | % Housing Units |
| Owner Occupied Housing Units | 78 | 33.5% |
| Renter-Occupied Housing Units | 155 | 66.5% |
| Total Occupied Housing Units | 233 | 100.0% |
Occupancy by Household Size in Canal Lewisville
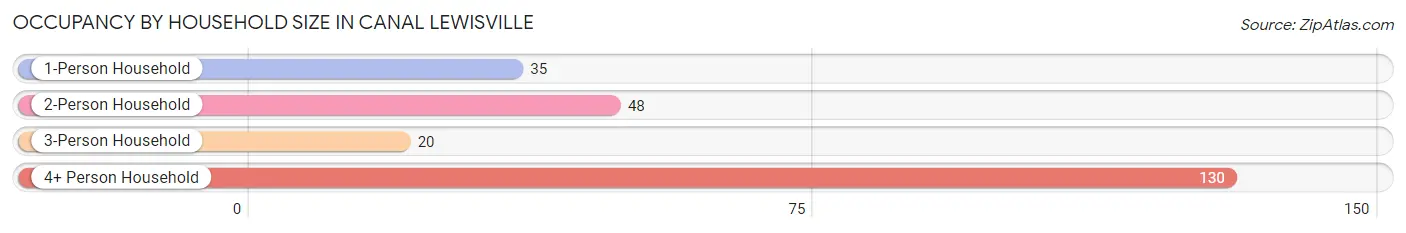
| Household Size | # Housing Units | % Housing Units |
| 1-Person Household | 35 | 15.0% |
| 2-Person Household | 48 | 20.6% |
| 3-Person Household | 20 | 8.6% |
| 4+ Person Household | 130 | 55.8% |
| Total Housing Units | 233 | 100.0% |
Occupancy by Ownership by Household Size in Canal Lewisville
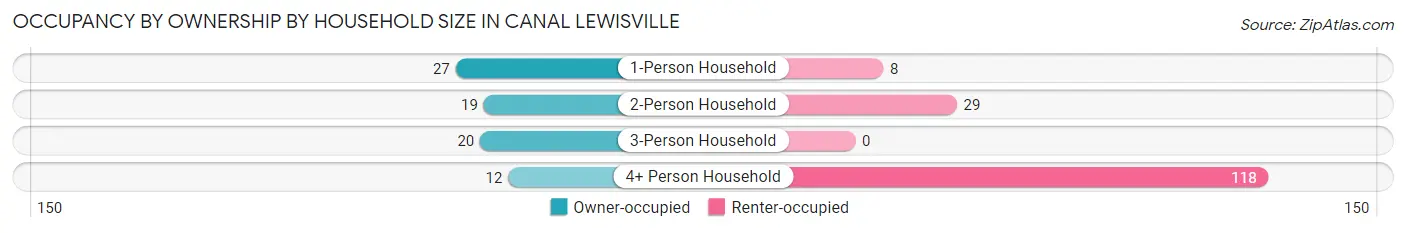
| Household Size | Owner-occupied | Renter-occupied |
| 1-Person Household | 27 (77.1%) | 8 (22.9%) |
| 2-Person Household | 19 (39.6%) | 29 (60.4%) |
| 3-Person Household | 20 (100.0%) | 0 (0.0%) |
| 4+ Person Household | 12 (9.2%) | 118 (90.8%) |
| Total Housing Units | 78 (33.5%) | 155 (66.5%) |
Occupancy by Educational Attainment in Canal Lewisville
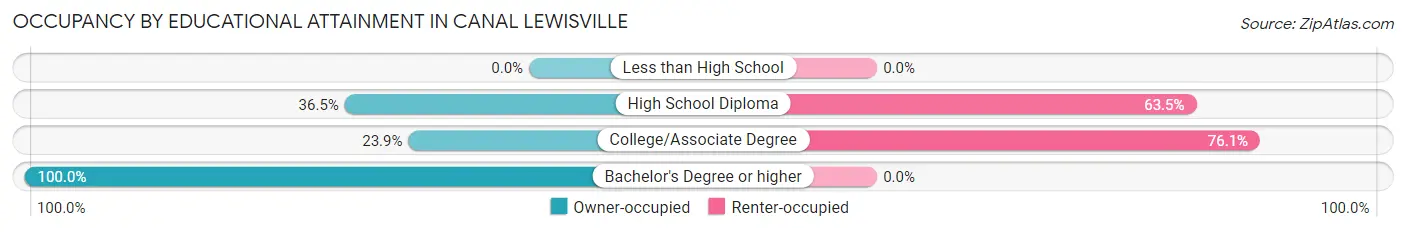
| Household Size | Owner-occupied | Renter-occupied |
| Less than High School | 0 (0.0%) | 0 (0.0%) |
| High School Diploma | 38 (36.5%) | 66 (63.5%) |
| College/Associate Degree | 28 (23.9%) | 89 (76.1%) |
| Bachelor's Degree or higher | 12 (100.0%) | 0 (0.0%) |
Occupancy by Age of Householder in Canal Lewisville
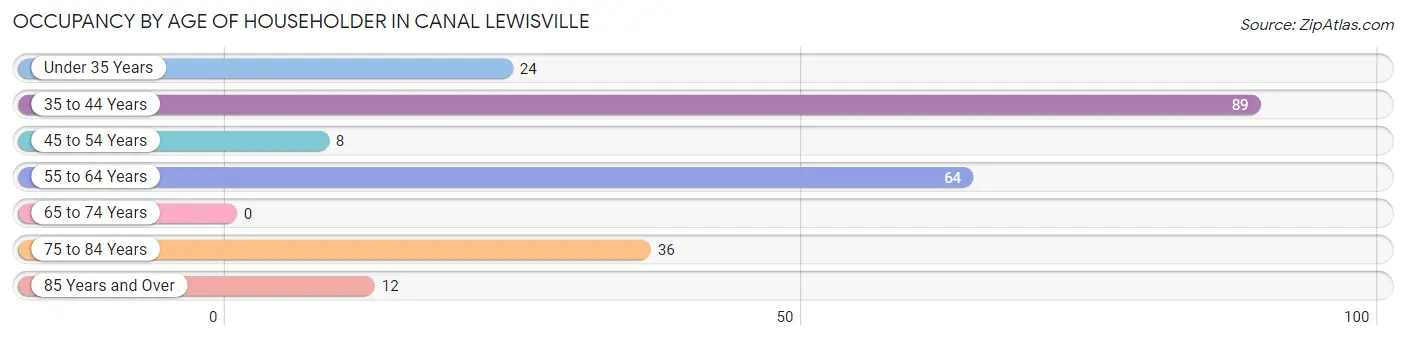
| Age Bracket | # Households | % Households |
| Under 35 Years | 24 | 10.3% |
| 35 to 44 Years | 89 | 38.2% |
| 45 to 54 Years | 8 | 3.4% |
| 55 to 64 Years | 64 | 27.5% |
| 65 to 74 Years | 0 | 0.0% |
| 75 to 84 Years | 36 | 15.4% |
| 85 Years and Over | 12 | 5.1% |
| Total | 233 | 100.0% |
Housing Finances in Canal Lewisville
Median Income by Occupancy in Canal Lewisville
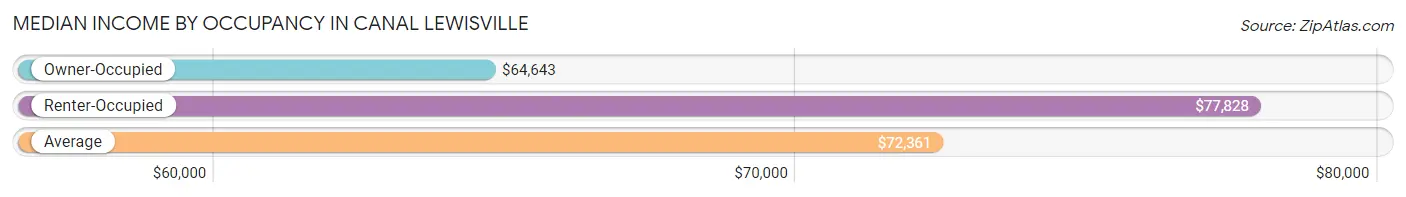
| Occupancy Type | # Households | Median Income |
| Owner-Occupied | 78 (33.5%) | $64,643 |
| Renter-Occupied | 155 (66.5%) | $77,828 |
| Average | 233 (100.0%) | $72,361 |
Occupancy by Householder Income Bracket in Canal Lewisville
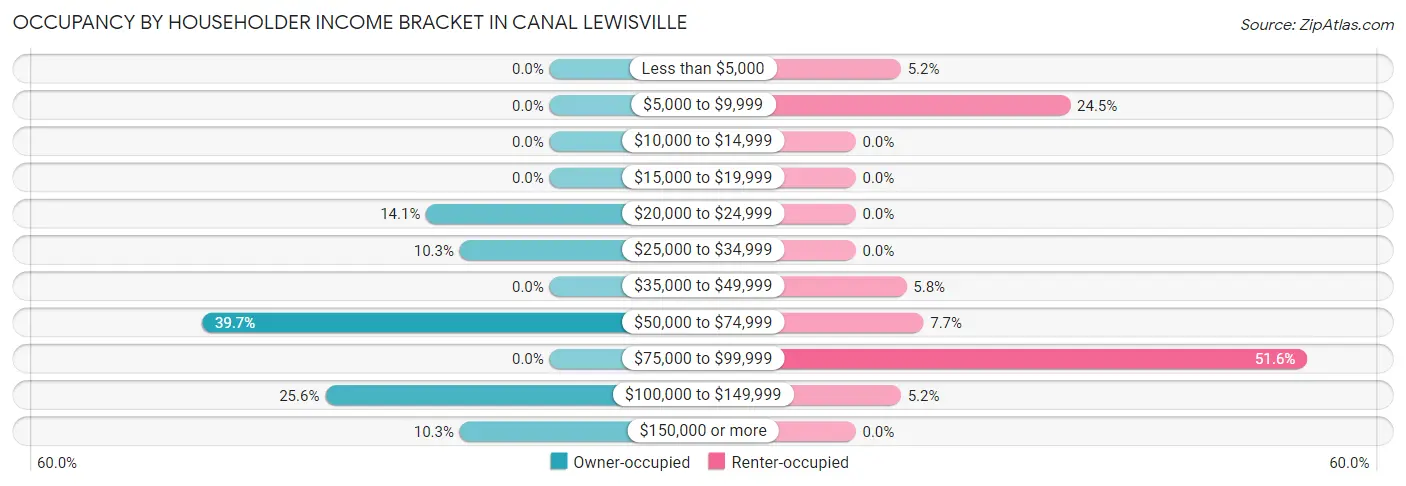
| Income Bracket | Owner-occupied | Renter-occupied |
| Less than $5,000 | 0 (0.0%) | 8 (5.2%) |
| $5,000 to $9,999 | 0 (0.0%) | 38 (24.5%) |
| $10,000 to $14,999 | 0 (0.0%) | 0 (0.0%) |
| $15,000 to $19,999 | 0 (0.0%) | 0 (0.0%) |
| $20,000 to $24,999 | 11 (14.1%) | 0 (0.0%) |
| $25,000 to $34,999 | 8 (10.3%) | 0 (0.0%) |
| $35,000 to $49,999 | 0 (0.0%) | 9 (5.8%) |
| $50,000 to $74,999 | 31 (39.7%) | 12 (7.7%) |
| $75,000 to $99,999 | 0 (0.0%) | 80 (51.6%) |
| $100,000 to $149,999 | 20 (25.6%) | 8 (5.2%) |
| $150,000 or more | 8 (10.3%) | 0 (0.0%) |
| Total | 78 (100.0%) | 155 (100.0%) |
Monthly Housing Cost Tiers in Canal Lewisville
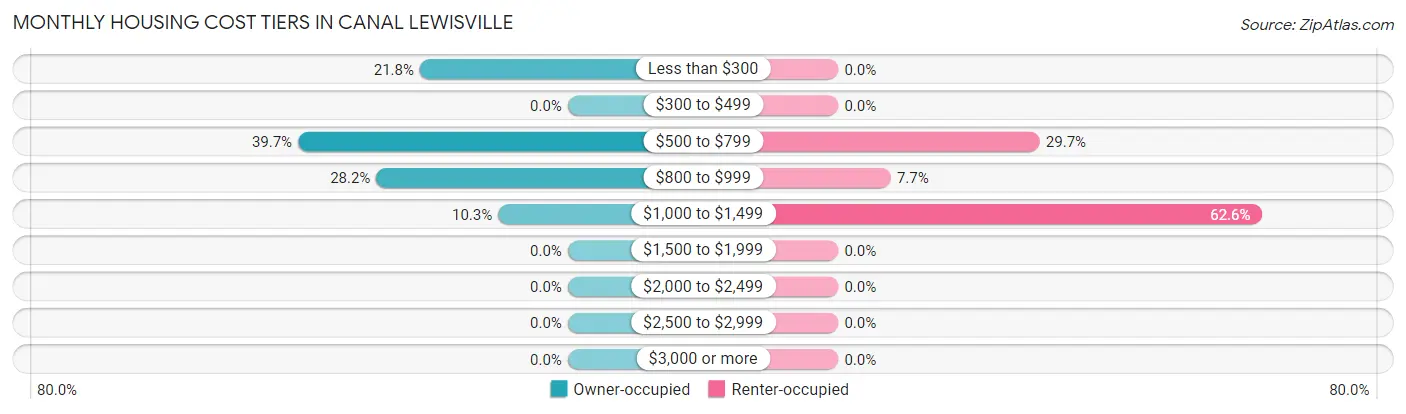
| Monthly Cost | Owner-occupied | Renter-occupied |
| Less than $300 | 17 (21.8%) | 0 (0.0%) |
| $300 to $499 | 0 (0.0%) | 0 (0.0%) |
| $500 to $799 | 31 (39.7%) | 46 (29.7%) |
| $800 to $999 | 22 (28.2%) | 12 (7.7%) |
| $1,000 to $1,499 | 8 (10.3%) | 97 (62.6%) |
| $1,500 to $1,999 | 0 (0.0%) | 0 (0.0%) |
| $2,000 to $2,499 | 0 (0.0%) | 0 (0.0%) |
| $2,500 to $2,999 | 0 (0.0%) | 0 (0.0%) |
| $3,000 or more | 0 (0.0%) | 0 (0.0%) |
| Total | 78 (100.0%) | 155 (100.0%) |
Physical Housing Characteristics in Canal Lewisville
Housing Structures in Canal Lewisville
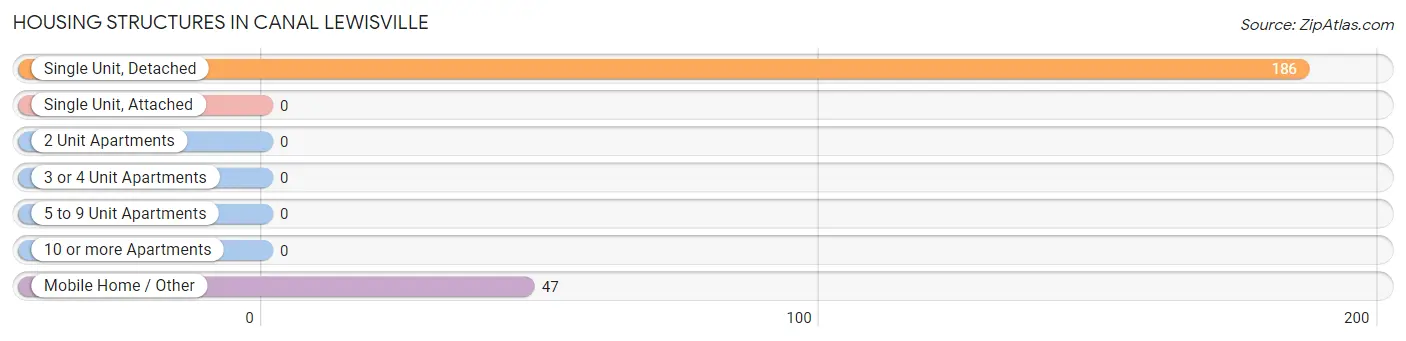
| Structure Type | # Housing Units | % Housing Units |
| Single Unit, Detached | 186 | 79.8% |
| Single Unit, Attached | 0 | 0.0% |
| 2 Unit Apartments | 0 | 0.0% |
| 3 or 4 Unit Apartments | 0 | 0.0% |
| 5 to 9 Unit Apartments | 0 | 0.0% |
| 10 or more Apartments | 0 | 0.0% |
| Mobile Home / Other | 47 | 20.2% |
| Total | 233 | 100.0% |
Housing Structures by Occupancy in Canal Lewisville
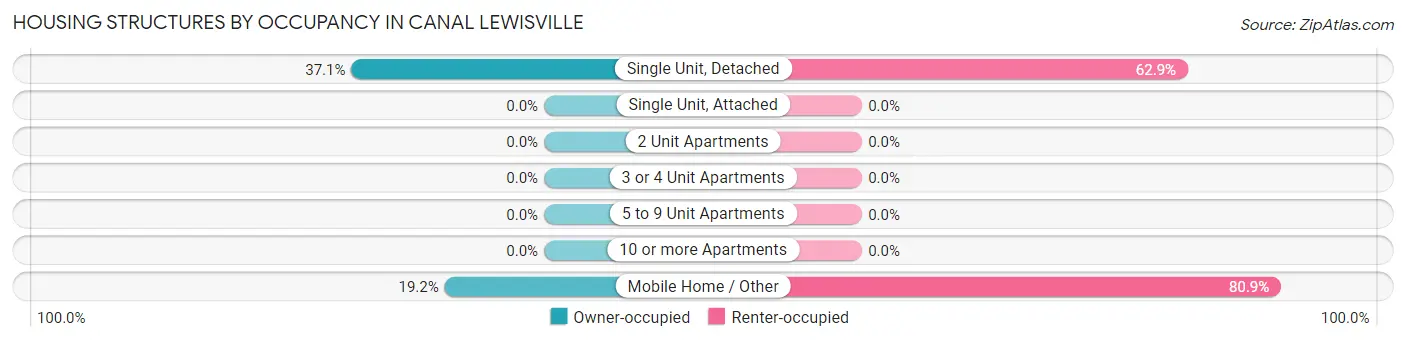
| Structure Type | Owner-occupied | Renter-occupied |
| Single Unit, Detached | 69 (37.1%) | 117 (62.9%) |
| Single Unit, Attached | 0 (0.0%) | 0 (0.0%) |
| 2 Unit Apartments | 0 (0.0%) | 0 (0.0%) |
| 3 or 4 Unit Apartments | 0 (0.0%) | 0 (0.0%) |
| 5 to 9 Unit Apartments | 0 (0.0%) | 0 (0.0%) |
| 10 or more Apartments | 0 (0.0%) | 0 (0.0%) |
| Mobile Home / Other | 9 (19.2%) | 38 (80.8%) |
| Total | 78 (33.5%) | 155 (66.5%) |
Housing Structures by Number of Rooms in Canal Lewisville
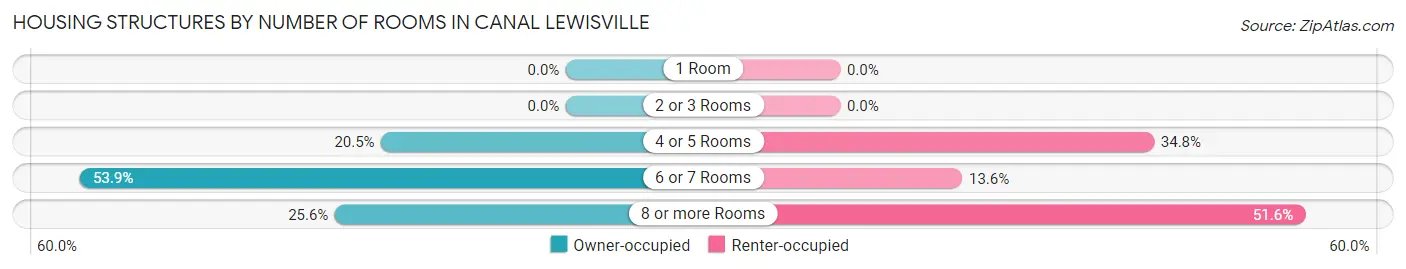
| Number of Rooms | Owner-occupied | Renter-occupied |
| 1 Room | 0 (0.0%) | 0 (0.0%) |
| 2 or 3 Rooms | 0 (0.0%) | 0 (0.0%) |
| 4 or 5 Rooms | 16 (20.5%) | 54 (34.8%) |
| 6 or 7 Rooms | 42 (53.8%) | 21 (13.6%) |
| 8 or more Rooms | 20 (25.6%) | 80 (51.6%) |
| Total | 78 (100.0%) | 155 (100.0%) |
Housing Structure by Heating Type in Canal Lewisville
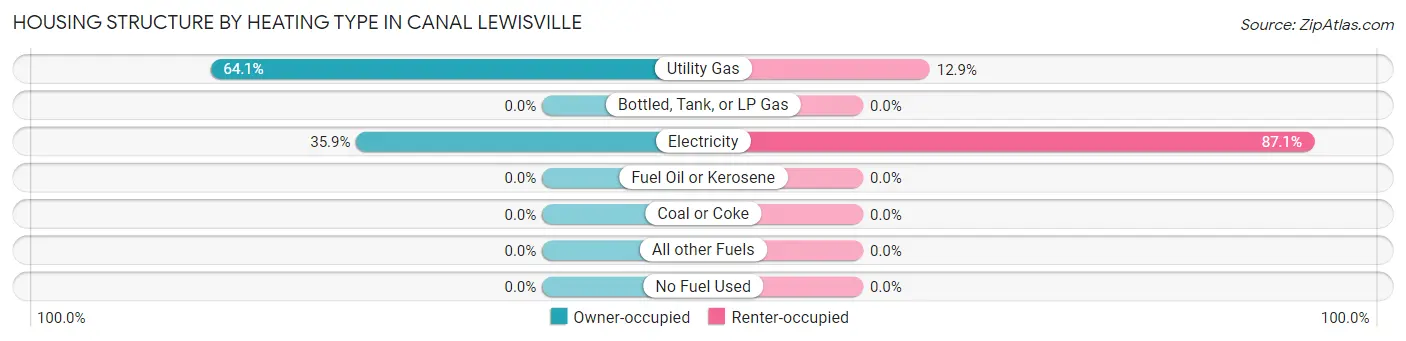
| Heating Type | Owner-occupied | Renter-occupied |
| Utility Gas | 50 (64.1%) | 20 (12.9%) |
| Bottled, Tank, or LP Gas | 0 (0.0%) | 0 (0.0%) |
| Electricity | 28 (35.9%) | 135 (87.1%) |
| Fuel Oil or Kerosene | 0 (0.0%) | 0 (0.0%) |
| Coal or Coke | 0 (0.0%) | 0 (0.0%) |
| All other Fuels | 0 (0.0%) | 0 (0.0%) |
| No Fuel Used | 0 (0.0%) | 0 (0.0%) |
| Total | 78 (100.0%) | 155 (100.0%) |
Household Vehicle Usage in Canal Lewisville
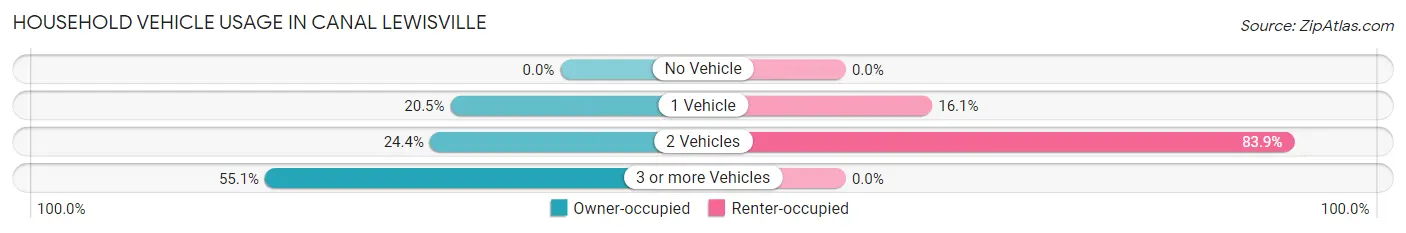
| Vehicles per Household | Owner-occupied | Renter-occupied |
| No Vehicle | 0 (0.0%) | 0 (0.0%) |
| 1 Vehicle | 16 (20.5%) | 25 (16.1%) |
| 2 Vehicles | 19 (24.4%) | 130 (83.9%) |
| 3 or more Vehicles | 43 (55.1%) | 0 (0.0%) |
| Total | 78 (100.0%) | 155 (100.0%) |
Real Estate & Mortgages in Canal Lewisville
Real Estate and Mortgage Overview in Canal Lewisville
| Characteristic | Without Mortgage | With Mortgage |
| Housing Units | 36 | 42 |
| Median Property Value | $54,700 | $90,500 |
| Median Household Income | - | - |
| Monthly Housing Costs | - | - |
| Real Estate Taxes | - | - |
Property Value by Mortgage Status in Canal Lewisville
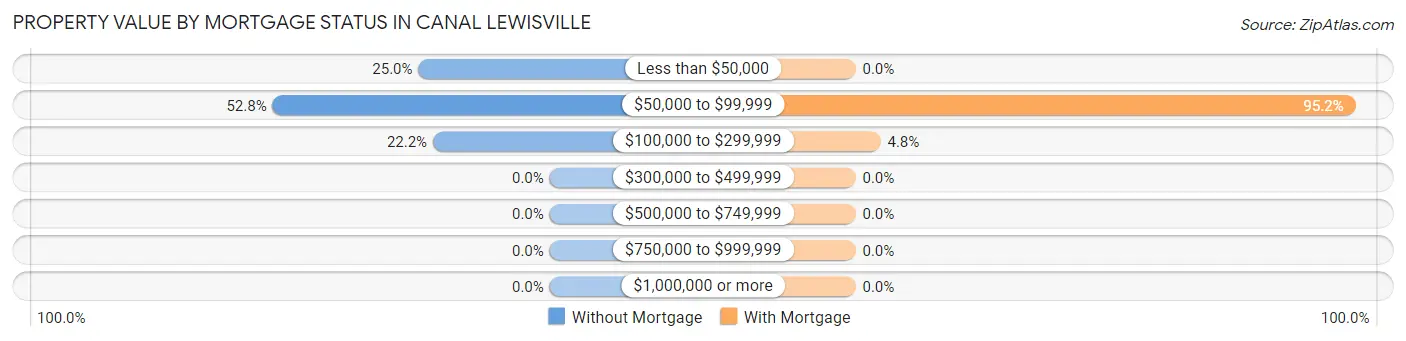
| Property Value | Without Mortgage | With Mortgage |
| Less than $50,000 | 9 (25.0%) | 0 (0.0%) |
| $50,000 to $99,999 | 19 (52.8%) | 40 (95.2%) |
| $100,000 to $299,999 | 8 (22.2%) | 2 (4.8%) |
| $300,000 to $499,999 | 0 (0.0%) | 0 (0.0%) |
| $500,000 to $749,999 | 0 (0.0%) | 0 (0.0%) |
| $750,000 to $999,999 | 0 (0.0%) | 0 (0.0%) |
| $1,000,000 or more | 0 (0.0%) | 0 (0.0%) |
| Total | 36 (100.0%) | 42 (100.0%) |
Household Income by Mortgage Status in Canal Lewisville
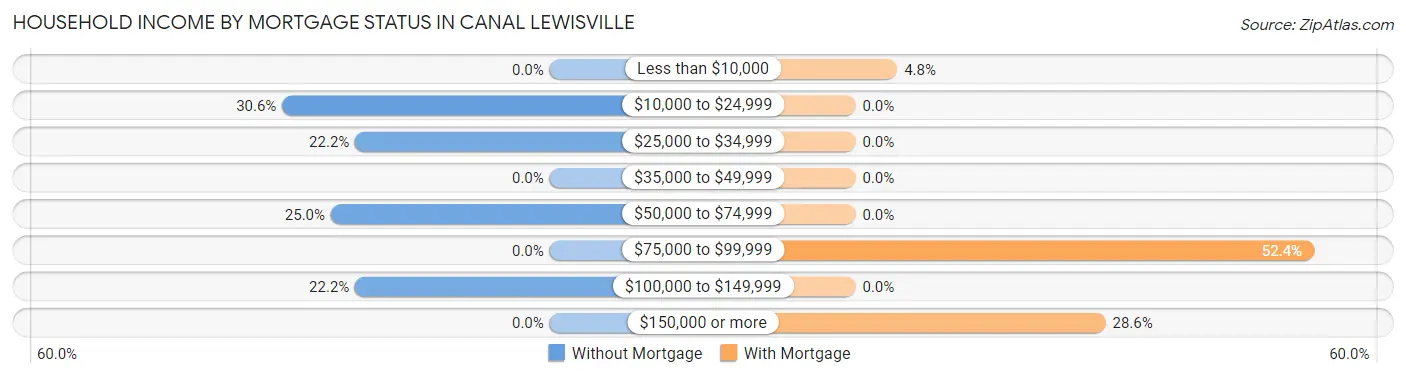
| Household Income | Without Mortgage | With Mortgage |
| Less than $10,000 | 0 (0.0%) | 2 (4.8%) |
| $10,000 to $24,999 | 11 (30.6%) | 0 (0.0%) |
| $25,000 to $34,999 | 8 (22.2%) | 0 (0.0%) |
| $35,000 to $49,999 | 0 (0.0%) | 0 (0.0%) |
| $50,000 to $74,999 | 9 (25.0%) | 0 (0.0%) |
| $75,000 to $99,999 | 0 (0.0%) | 22 (52.4%) |
| $100,000 to $149,999 | 8 (22.2%) | 0 (0.0%) |
| $150,000 or more | 0 (0.0%) | 12 (28.6%) |
| Total | 36 (100.0%) | 42 (100.0%) |
Property Value to Household Income Ratio in Canal Lewisville
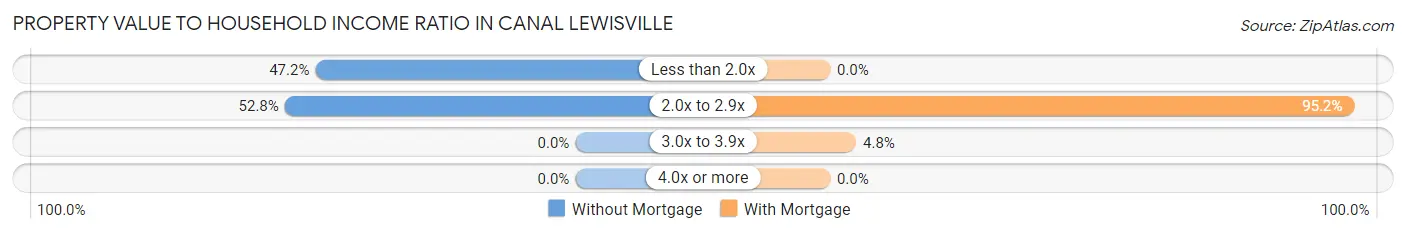
| Value-to-Income Ratio | Without Mortgage | With Mortgage |
| Less than 2.0x | 17 (47.2%) | 0 (0.0%) |
| 2.0x to 2.9x | 19 (52.8%) | 40 (95.2%) |
| 3.0x to 3.9x | 0 (0.0%) | 2 (4.8%) |
| 4.0x or more | 0 (0.0%) | 0 (0.0%) |
| Total | 36 (100.0%) | 42 (100.0%) |
Real Estate Taxes by Mortgage Status in Canal Lewisville
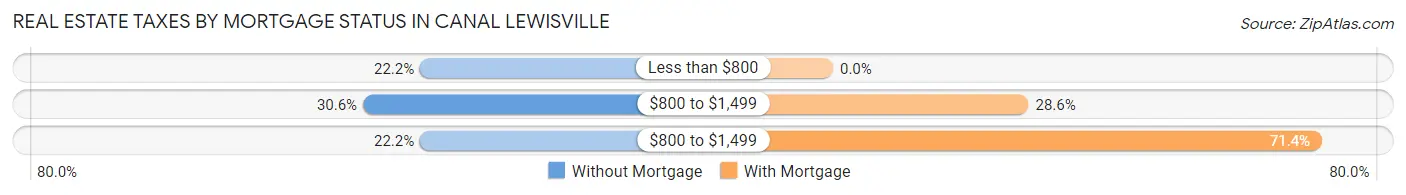
| Property Taxes | Without Mortgage | With Mortgage |
| Less than $800 | 8 (22.2%) | 0 (0.0%) |
| $800 to $1,499 | 11 (30.6%) | 12 (28.6%) |
| $800 to $1,499 | 8 (22.2%) | 30 (71.4%) |
| Total | 36 (100.0%) | 42 (100.0%) |
Health & Disability in Canal Lewisville
Health Insurance Coverage by Age in Canal Lewisville
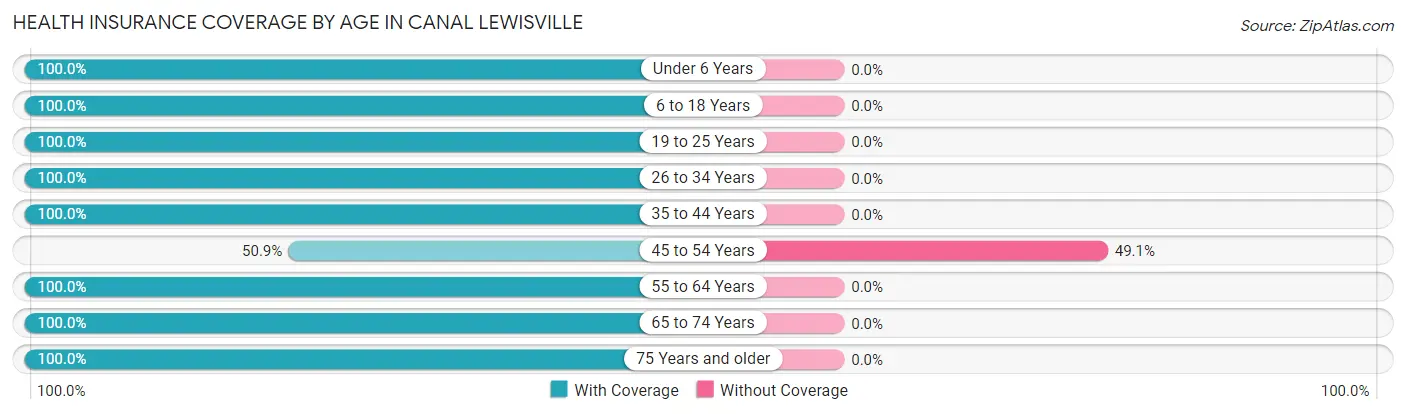
| Age Bracket | With Coverage | Without Coverage |
| Under 6 Years | 142 (100.0%) | 0 (0.0%) |
| 6 to 18 Years | 139 (100.0%) | 0 (0.0%) |
| 19 to 25 Years | 53 (100.0%) | 0 (0.0%) |
| 26 to 34 Years | 49 (100.0%) | 0 (0.0%) |
| 35 to 44 Years | 100 (100.0%) | 0 (0.0%) |
| 45 to 54 Years | 59 (50.9%) | 57 (49.1%) |
| 55 to 64 Years | 94 (100.0%) | 0 (0.0%) |
| 65 to 74 Years | 11 (100.0%) | 0 (0.0%) |
| 75 Years and older | 57 (100.0%) | 0 (0.0%) |
| Total | 704 (92.5%) | 57 (7.5%) |
Health Insurance Coverage by Citizenship Status in Canal Lewisville
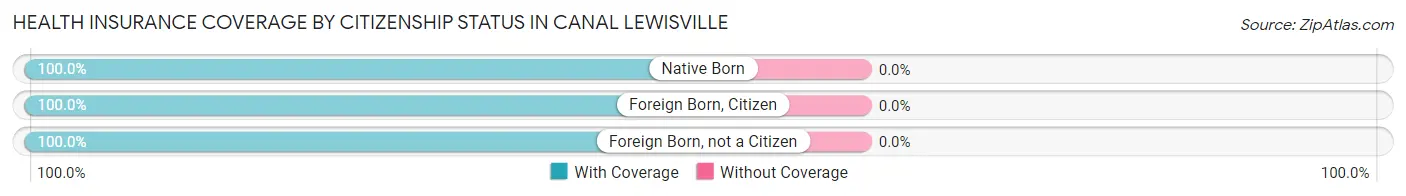
| Citizenship Status | With Coverage | Without Coverage |
| Native Born | 142 (100.0%) | 0 (0.0%) |
| Foreign Born, Citizen | 139 (100.0%) | 0 (0.0%) |
| Foreign Born, not a Citizen | 53 (100.0%) | 0 (0.0%) |
Health Insurance Coverage by Household Income in Canal Lewisville
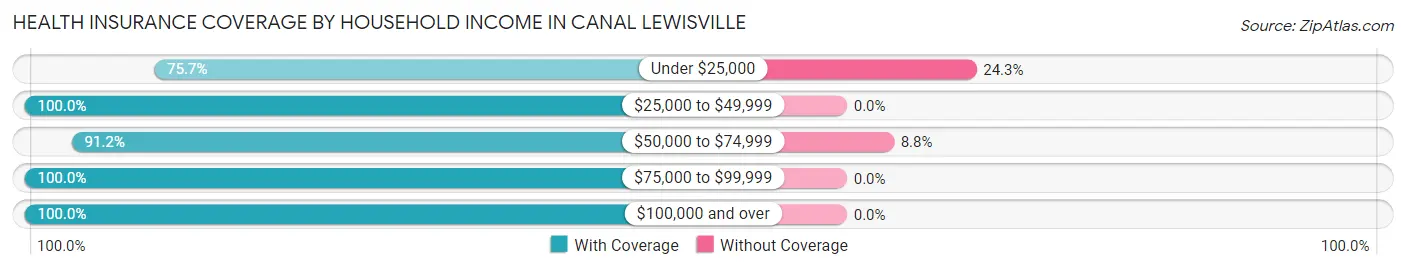
| Household Income | With Coverage | Without Coverage |
| Under $25,000 | 153 (75.7%) | 49 (24.3%) |
| $25,000 to $49,999 | 26 (100.0%) | 0 (0.0%) |
| $50,000 to $74,999 | 83 (91.2%) | 8 (8.8%) |
| $75,000 to $99,999 | 337 (100.0%) | 0 (0.0%) |
| $100,000 and over | 105 (100.0%) | 0 (0.0%) |
Public vs Private Health Insurance Coverage by Age in Canal Lewisville
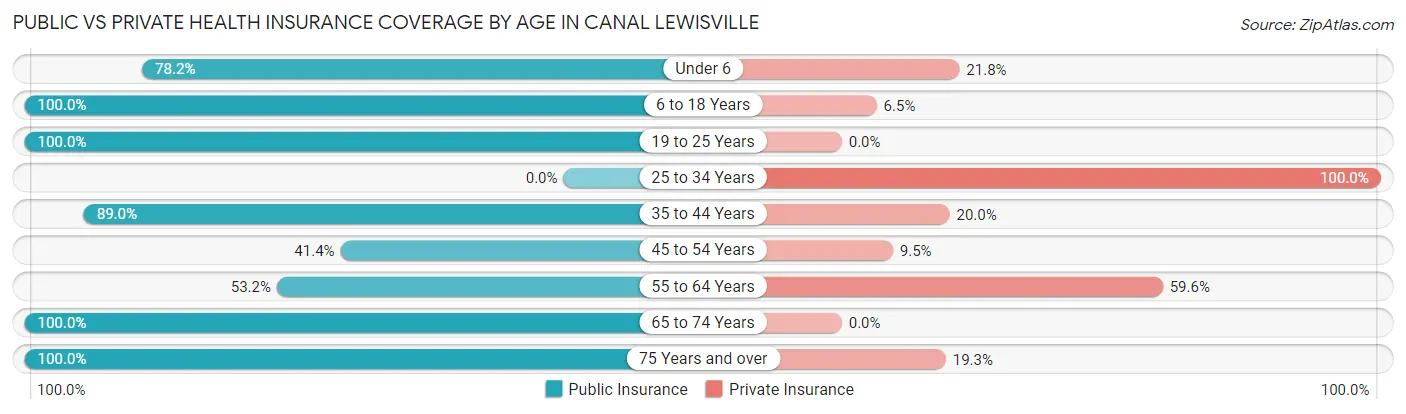
| Age Bracket | Public Insurance | Private Insurance |
| Under 6 | 111 (78.2%) | 31 (21.8%) |
| 6 to 18 Years | 139 (100.0%) | 9 (6.5%) |
| 19 to 25 Years | 53 (100.0%) | 0 (0.0%) |
| 25 to 34 Years | 0 (0.0%) | 49 (100.0%) |
| 35 to 44 Years | 89 (89.0%) | 20 (20.0%) |
| 45 to 54 Years | 48 (41.4%) | 11 (9.5%) |
| 55 to 64 Years | 50 (53.2%) | 56 (59.6%) |
| 65 to 74 Years | 11 (100.0%) | 0 (0.0%) |
| 75 Years and over | 57 (100.0%) | 11 (19.3%) |
| Total | 558 (73.3%) | 187 (24.6%) |
Disability Status by Sex by Age in Canal Lewisville
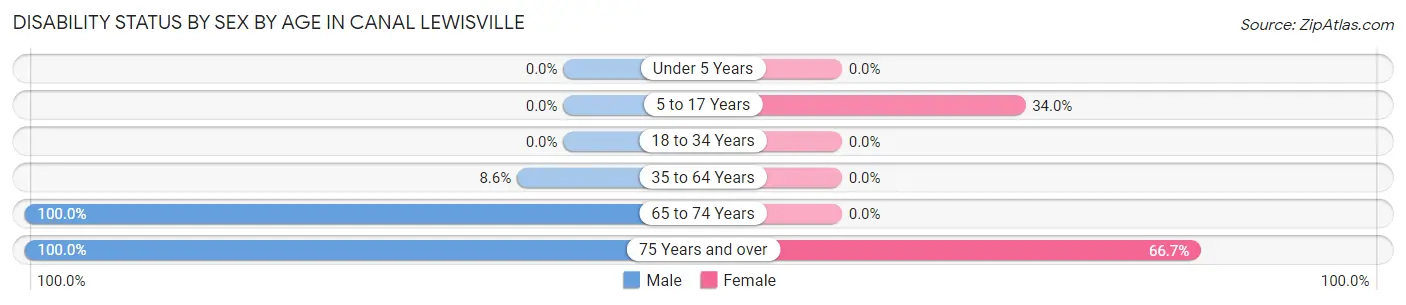
| Age Bracket | Male | Female |
| Under 5 Years | 0 (0.0%) | 0 (0.0%) |
| 5 to 17 Years | 0 (0.0%) | 48 (34.0%) |
| 18 to 34 Years | 0 (0.0%) | 0 (0.0%) |
| 35 to 64 Years | 8 (8.6%) | 0 (0.0%) |
| 65 to 74 Years | 11 (100.0%) | 0 (0.0%) |
| 75 Years and over | 9 (100.0%) | 32 (66.7%) |
Disability Class by Sex by Age in Canal Lewisville
Disability Class: Hearing Difficulty
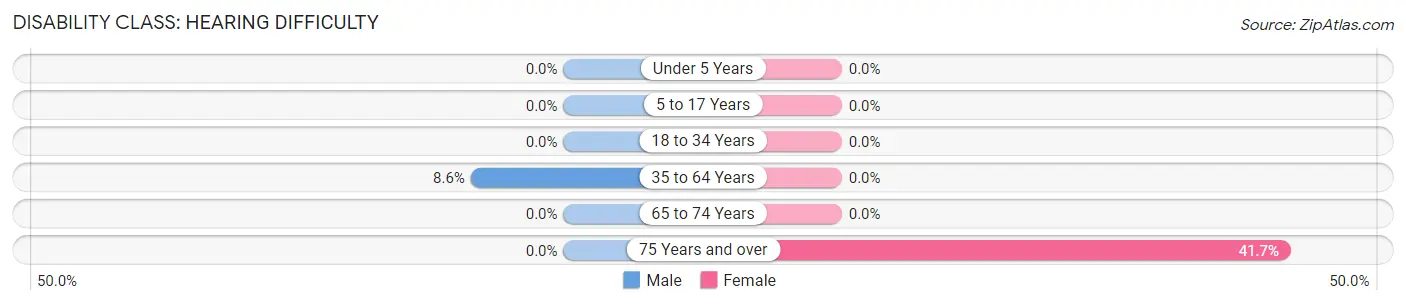
| Age Bracket | Male | Female |
| Under 5 Years | 0 (0.0%) | 0 (0.0%) |
| 5 to 17 Years | 0 (0.0%) | 0 (0.0%) |
| 18 to 34 Years | 0 (0.0%) | 0 (0.0%) |
| 35 to 64 Years | 8 (8.6%) | 0 (0.0%) |
| 65 to 74 Years | 0 (0.0%) | 0 (0.0%) |
| 75 Years and over | 0 (0.0%) | 20 (41.7%) |
Disability Class: Vision Difficulty
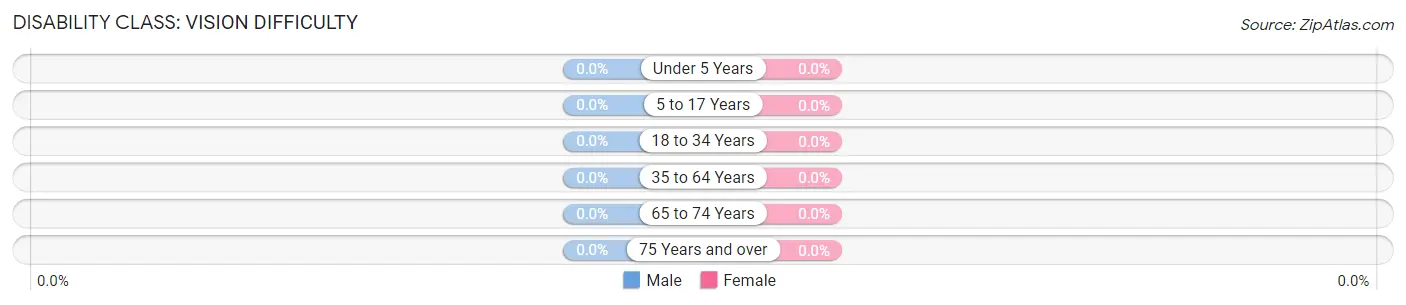
| Age Bracket | Male | Female |
| Under 5 Years | 0 (0.0%) | 0 (0.0%) |
| 5 to 17 Years | 0 (0.0%) | 0 (0.0%) |
| 18 to 34 Years | 0 (0.0%) | 0 (0.0%) |
| 35 to 64 Years | 0 (0.0%) | 0 (0.0%) |
| 65 to 74 Years | 0 (0.0%) | 0 (0.0%) |
| 75 Years and over | 0 (0.0%) | 0 (0.0%) |
Disability Class: Cognitive Difficulty
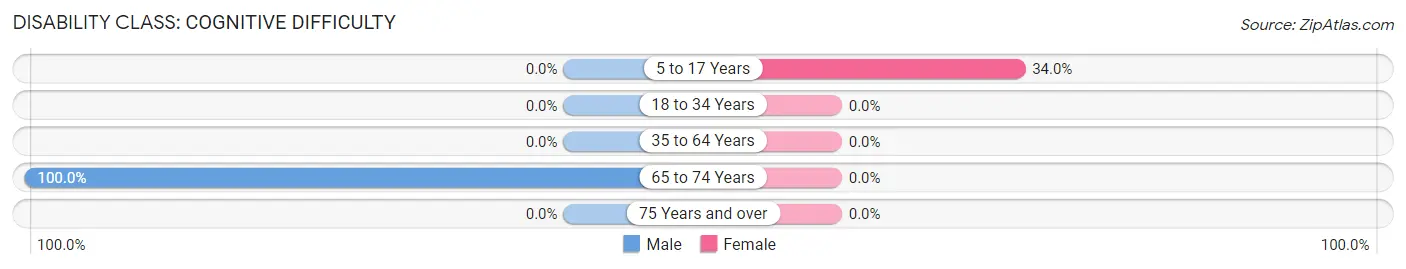
| Age Bracket | Male | Female |
| 5 to 17 Years | 0 (0.0%) | 48 (34.0%) |
| 18 to 34 Years | 0 (0.0%) | 0 (0.0%) |
| 35 to 64 Years | 0 (0.0%) | 0 (0.0%) |
| 65 to 74 Years | 11 (100.0%) | 0 (0.0%) |
| 75 Years and over | 0 (0.0%) | 0 (0.0%) |
Disability Class: Ambulatory Difficulty
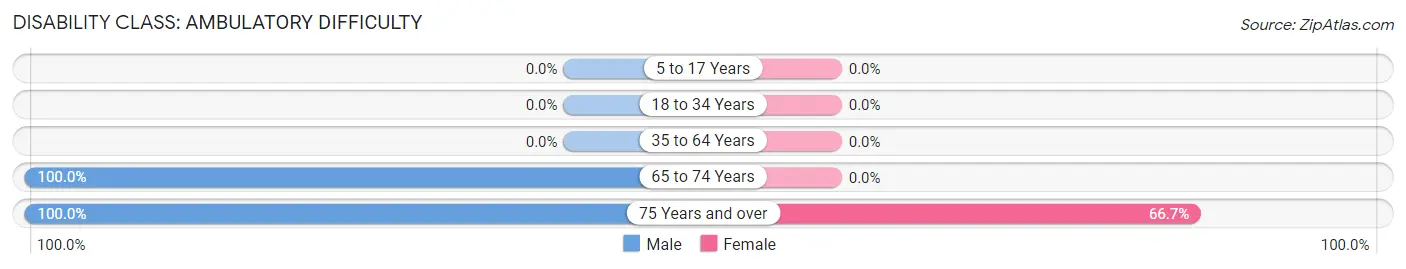
| Age Bracket | Male | Female |
| 5 to 17 Years | 0 (0.0%) | 0 (0.0%) |
| 18 to 34 Years | 0 (0.0%) | 0 (0.0%) |
| 35 to 64 Years | 0 (0.0%) | 0 (0.0%) |
| 65 to 74 Years | 11 (100.0%) | 0 (0.0%) |
| 75 Years and over | 9 (100.0%) | 32 (66.7%) |
Disability Class: Self-Care Difficulty
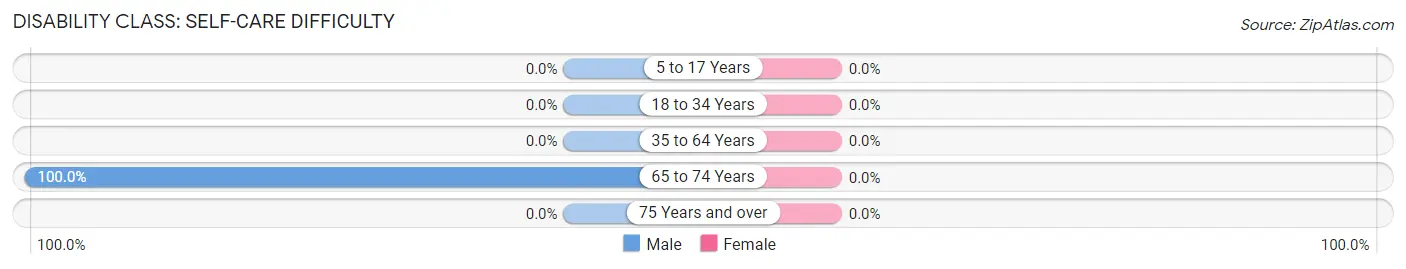
| Age Bracket | Male | Female |
| 5 to 17 Years | 0 (0.0%) | 0 (0.0%) |
| 18 to 34 Years | 0 (0.0%) | 0 (0.0%) |
| 35 to 64 Years | 0 (0.0%) | 0 (0.0%) |
| 65 to 74 Years | 11 (100.0%) | 0 (0.0%) |
| 75 Years and over | 0 (0.0%) | 0 (0.0%) |
Technology Access in Canal Lewisville
Computing Device Access in Canal Lewisville
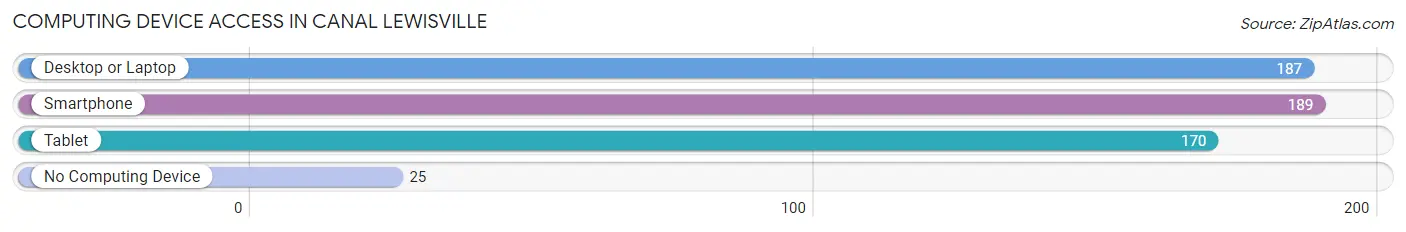
| Device Type | # Households | % Households |
| Desktop or Laptop | 187 | 80.3% |
| Smartphone | 189 | 81.1% |
| Tablet | 170 | 73.0% |
| No Computing Device | 25 | 10.7% |
| Total | 233 | 100.0% |
Internet Access in Canal Lewisville
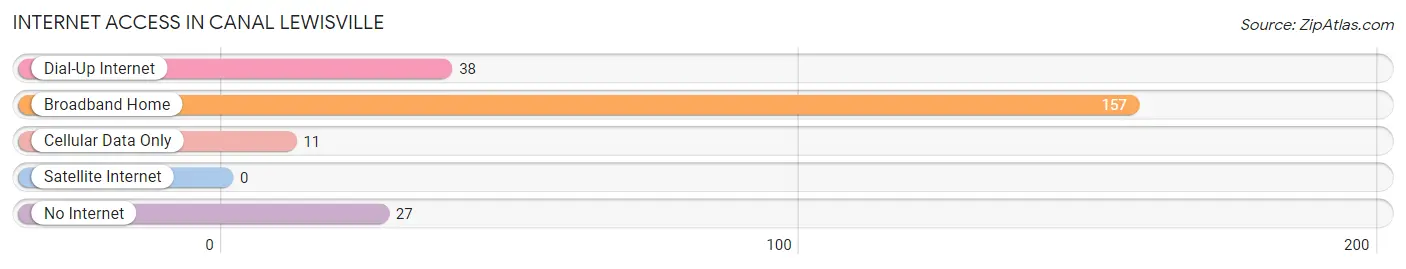
| Internet Type | # Households | % Households |
| Dial-Up Internet | 38 | 16.3% |
| Broadband Home | 157 | 67.4% |
| Cellular Data Only | 11 | 4.7% |
| Satellite Internet | 0 | 0.0% |
| No Internet | 27 | 11.6% |
| Total | 233 | 100.0% |
Canal Lewisville Summary
Lewisville, Ohio is a small village located in Harrison County, Ohio. It is situated on the banks of the Ohio River, just south of Cadiz. The village has a population of just over 500 people, and is part of the Steubenville-Weirton Metropolitan Statistical Area.
History
Lewisville was founded in 1817 by William Lewis, a Revolutionary War veteran. He named the village after himself, and it was incorporated in 1837. The village was originally a farming community, and the main crops were corn, wheat, and oats. In the late 19th century, the village began to grow as a result of the coal mining industry. The coal mines provided jobs for many of the residents, and the village grew to its current size.
Geography
Lewisville is located in the southeastern corner of Harrison County, Ohio. It is situated on the banks of the Ohio River, just south of Cadiz. The village is surrounded by rolling hills and farmland, and is located in the Appalachian Plateau region. The climate is humid continental, with hot summers and cold winters.
Economy
The economy of Lewisville is largely based on agriculture and coal mining. The village is home to several small farms, which produce corn, wheat, and oats. The coal mines in the area provide jobs for many of the residents, and the village also has a few small businesses.
Demographics
As of the 2010 census, the population of Lewisville was 514. The racial makeup of the village was 97.3% White, 0.6% African American, 0.2% Native American, 0.2% Asian, 0.2% from other races, and 1.6% from two or more races. The median household income was $37,500, and the median family income was $45,000. The per capita income was $18,000.
Conclusion
Lewisville, Ohio is a small village located in Harrison County, Ohio. It is situated on the banks of the Ohio River, just south of Cadiz. The village has a population of just over 500 people, and is part of the Steubenville-Weirton Metropolitan Statistical Area. The economy of Lewisville is largely based on agriculture and coal mining, and the village is home to several small farms. The racial makeup of the village is predominantly White, and the median household income is $37,500. Lewisville is a small, rural village with a rich history and a bright future.
Common Questions
What is Per Capita Income in Canal Lewisville?
Per Capita income in Canal Lewisville is $16,835.
What is the Median Family Income in Canal Lewisville?
Median Family Income in Canal Lewisville is $78,031.
What is the Median Household income in Canal Lewisville?
Median Household Income in Canal Lewisville is $72,361.
What is Inequality or Gini Index in Canal Lewisville?
Inequality or Gini Index in Canal Lewisville is 0.33.
What is the Total Population of Canal Lewisville?
Total Population of Canal Lewisville is 761.
What is the Total Male Population of Canal Lewisville?
Total Male Population of Canal Lewisville is 269.
What is the Total Female Population of Canal Lewisville?
Total Female Population of Canal Lewisville is 492.
What is the Ratio of Males per 100 Females in Canal Lewisville?
There are 54.67 Males per 100 Females in Canal Lewisville.
What is the Ratio of Females per 100 Males in Canal Lewisville?
There are 182.90 Females per 100 Males in Canal Lewisville.
What is the Median Population Age in Canal Lewisville?
Median Population Age in Canal Lewisville is 33.8 Years.
What is the Average Family Size in Canal Lewisville
Average Family Size in Canal Lewisville is 3.7 People.
What is the Average Household Size in Canal Lewisville
Average Household Size in Canal Lewisville is 3.3 People.
How Large is the Labor Force in Canal Lewisville?
There are 308 People in the Labor Forcein in Canal Lewisville.
What is the Percentage of People in the Labor Force in Canal Lewisville?
64.2% of People are in the Labor Force in Canal Lewisville.
What is the Unemployment Rate in Canal Lewisville?
Unemployment Rate in Canal Lewisville is 26.0%.