Zip Codes with the Highest Percentage of Population Employed in Administrative & Support Services in Springfield, OH
RELATED REPORTS & OPTIONS
Administrative & Support Services
Springfield
Compare Zip Codes
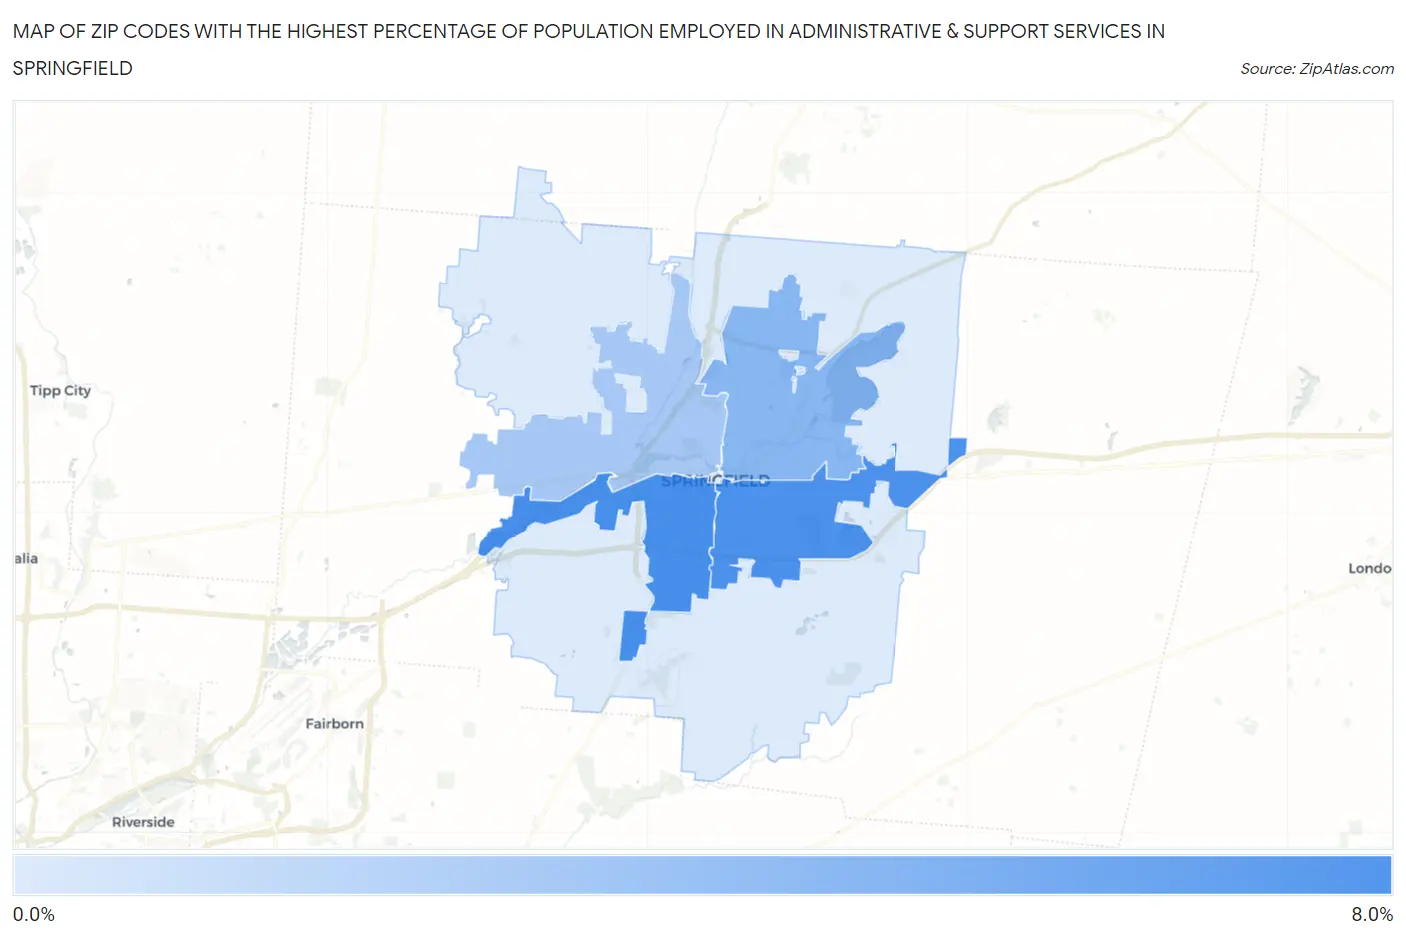
Map of Zip Codes with the Highest Percentage of Population Employed in Administrative & Support Services in Springfield
0.88%
6.2%
Zip Codes with the Highest Percentage of Population Employed in Administrative & Support Services in Springfield, OH
| Zip Code | % Employed | vs State | vs National | |
| 1. | 45506 | 6.2% | 3.7%(+2.49)#164 | 4.1%(+2.07)#4,376 |
| 2. | 45505 | 6.1% | 3.7%(+2.34)#174 | 4.1%(+1.92)#4,651 |
| 3. | 45503 | 3.9% | 3.7%(+0.149)#434 | 4.1%(-0.277)#11,239 |
| 4. | 45504 | 2.8% | 3.7%(-0.893)#646 | 4.1%(-1.32)#16,356 |
| 5. | 45502 | 0.88% | 3.7%(-2.84)#995 | 4.1%(-3.27)#24,875 |
1
Common Questions
What are the Top 3 Zip Codes with the Highest Percentage of Population Employed in Administrative & Support Services in Springfield, OH?
Top 3 Zip Codes with the Highest Percentage of Population Employed in Administrative & Support Services in Springfield, OH are:
What zip code has the Highest Percentage of Population Employed in Administrative & Support Services in Springfield, OH?
45506 has the Highest Percentage of Population Employed in Administrative & Support Services in Springfield, OH with 6.2%.
What is the Percentage of Population Employed in Administrative & Support Services in Springfield, OH?
Percentage of Population Employed in Administrative & Support Services in Springfield is 5.4%.
What is the Percentage of Population Employed in Administrative & Support Services in Ohio?
Percentage of Population Employed in Administrative & Support Services in Ohio is 3.7%.
What is the Percentage of Population Employed in Administrative & Support Services in the United States?
Percentage of Population Employed in Administrative & Support Services in the United States is 4.1%.