Union, OH Map & Demographics
Union Map
Union Overview
$32,459
PER CAPITA INCOME
$76,661
AVG FAMILY INCOME
$68,586
AVG HOUSEHOLD INCOME
27.3%
WAGE / INCOME GAP [ % ]
72.7¢/ $1
WAGE / INCOME GAP [ $ ]
0.34
INEQUALITY / GINI INDEX
6,894
TOTAL POPULATION
3,295
MALE POPULATION
3,599
FEMALE POPULATION
91.55
MALES / 100 FEMALES
109.23
FEMALES / 100 MALES
37.2
MEDIAN AGE
3.3
AVG FAMILY SIZE
2.5
AVG HOUSEHOLD SIZE
3,549
LABOR FORCE [ PEOPLE ]
67.5%
PERCENT IN LABOR FORCE
2.9%
UNEMPLOYMENT RATE
Union Area Codes
Income in Union
Income Overview in Union
Per Capita Income in Union is $32,459, while median incomes of families and households are $76,661 and $68,586 respectively.
| Characteristic | Number | Measure |
| Per Capita Income | 6,894 | $32,459 |
| Median Family Income | 1,657 | $76,661 |
| Mean Family Income | 1,657 | $88,432 |
| Median Household Income | 2,725 | $68,586 |
| Mean Household Income | 2,725 | $80,480 |
| Income Deficit | 1,657 | $0 |
| Wage / Income Gap (%) | 6,894 | 27.27% |
| Wage / Income Gap ($) | 6,894 | 72.73¢ per $1 |
| Gini / Inequality Index | 6,894 | 0.34 |
Earnings by Sex in Union
Average Earnings in Union are $38,131, $44,535 for men and $32,391 for women, a difference of 27.3%.
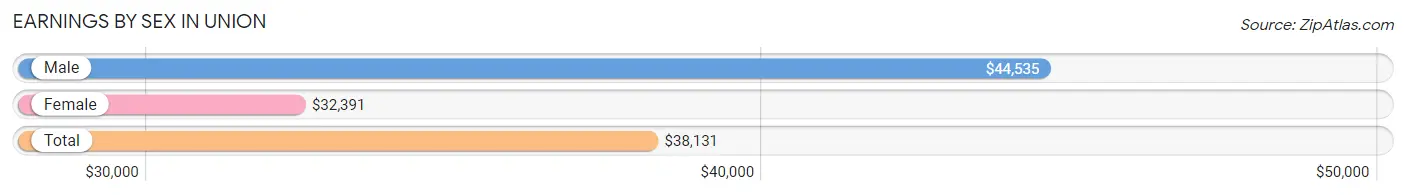
| Sex | Number | Average Earnings |
| Male | 1,747 (47.8%) | $44,535 |
| Female | 1,906 (52.2%) | $32,391 |
| Total | 3,653 (100.0%) | $38,131 |
Earnings by Sex by Income Bracket in Union
The most common earnings brackets in Union are $65,000 to $74,999 for men (288 | 16.5%) and $2,499 or less for women (337 | 17.7%).
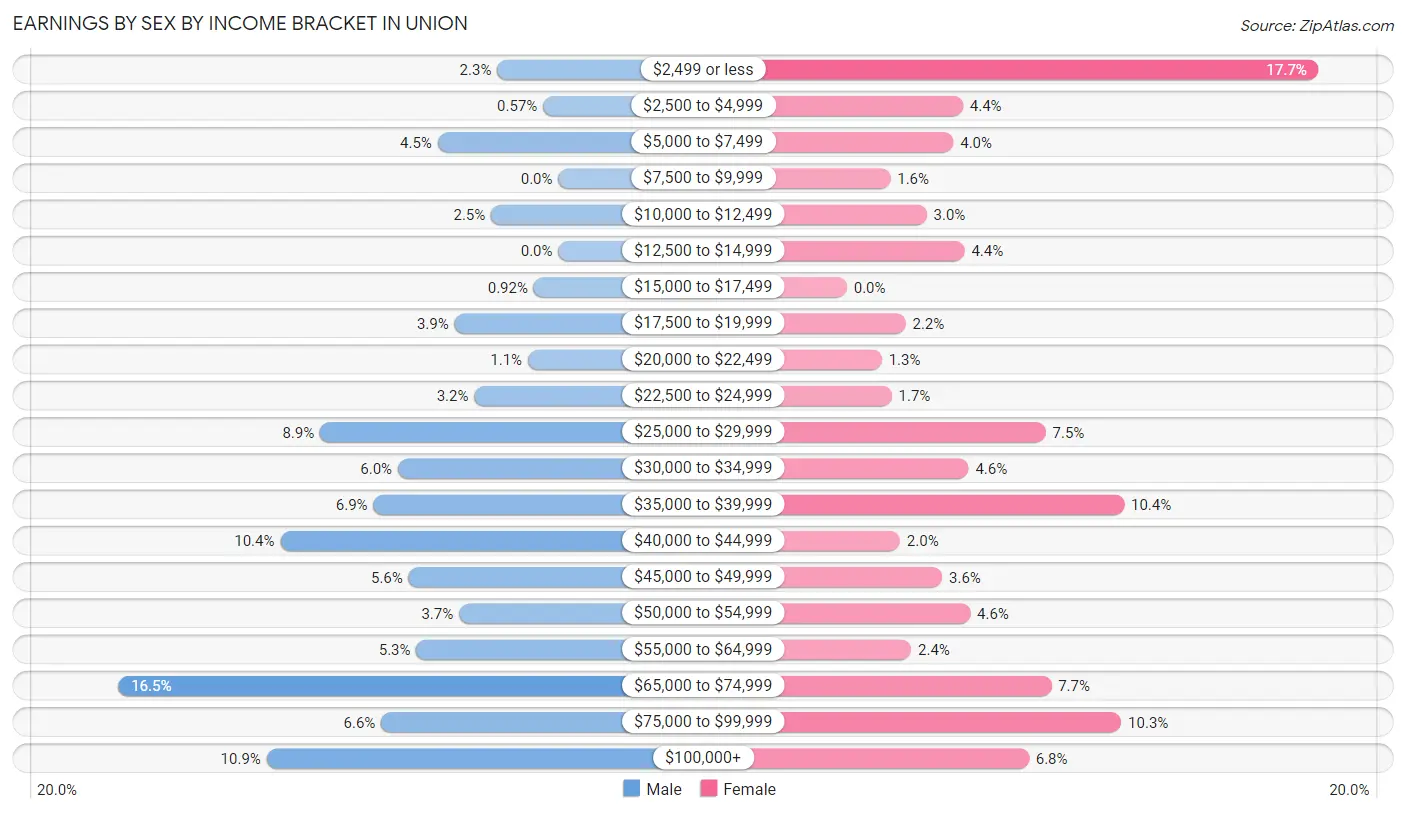
| Income | Male | Female |
| $2,499 or less | 40 (2.3%) | 337 (17.7%) |
| $2,500 to $4,999 | 10 (0.6%) | 83 (4.3%) |
| $5,000 to $7,499 | 79 (4.5%) | 76 (4.0%) |
| $7,500 to $9,999 | 0 (0.0%) | 31 (1.6%) |
| $10,000 to $12,499 | 44 (2.5%) | 57 (3.0%) |
| $12,500 to $14,999 | 0 (0.0%) | 84 (4.4%) |
| $15,000 to $17,499 | 16 (0.9%) | 0 (0.0%) |
| $17,500 to $19,999 | 68 (3.9%) | 42 (2.2%) |
| $20,000 to $22,499 | 20 (1.1%) | 25 (1.3%) |
| $22,500 to $24,999 | 55 (3.2%) | 32 (1.7%) |
| $25,000 to $29,999 | 156 (8.9%) | 142 (7.4%) |
| $30,000 to $34,999 | 105 (6.0%) | 87 (4.6%) |
| $35,000 to $39,999 | 121 (6.9%) | 198 (10.4%) |
| $40,000 to $44,999 | 182 (10.4%) | 38 (2.0%) |
| $45,000 to $49,999 | 98 (5.6%) | 68 (3.6%) |
| $50,000 to $54,999 | 65 (3.7%) | 88 (4.6%) |
| $55,000 to $64,999 | 93 (5.3%) | 46 (2.4%) |
| $65,000 to $74,999 | 288 (16.5%) | 146 (7.7%) |
| $75,000 to $99,999 | 116 (6.6%) | 196 (10.3%) |
| $100,000+ | 191 (10.9%) | 130 (6.8%) |
| Total | 1,747 (100.0%) | 1,906 (100.0%) |
Earnings by Sex by Educational Attainment in Union
Average earnings in Union are $46,016 for men and $35,483 for women, a difference of 22.9%. Men with an educational attainment of graduate degree enjoy the highest average annual earnings of $94,922, while those with less than high school education earn the least with $33,688. Women with an educational attainment of graduate degree earn the most with the average annual earnings of $81,250, while those with college or associate's degree education have the smallest earnings of $35,176.
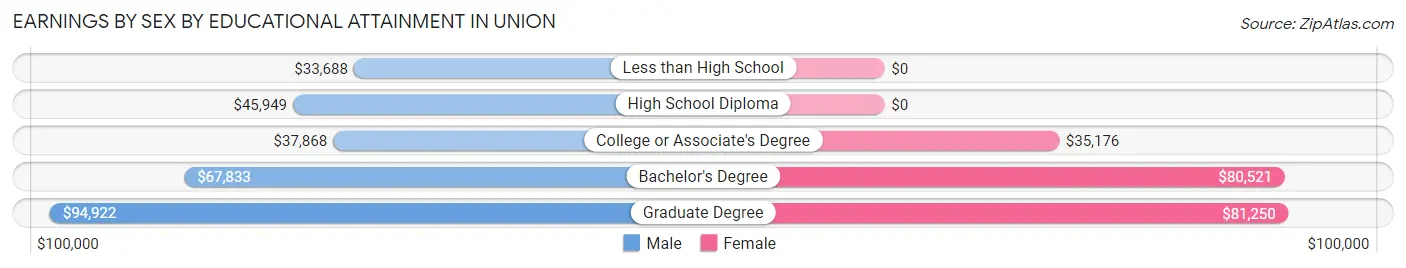
| Educational Attainment | Male Income | Female Income |
| Less than High School | $33,688 | $0 |
| High School Diploma | $45,949 | $0 |
| College or Associate's Degree | $37,868 | $35,176 |
| Bachelor's Degree | $67,833 | $80,521 |
| Graduate Degree | $94,922 | $81,250 |
| Total | $46,016 | $35,483 |
Family Income in Union
Family Income Brackets in Union
According to the Union family income data, there are 374 families falling into the $100,000 to $149,999 income range, which is the most common income bracket and makes up 22.6% of all families. Conversely, the $10,000 to $14,999 income bracket is the least frequent group with only 8 families (0.5%) belonging to this category.
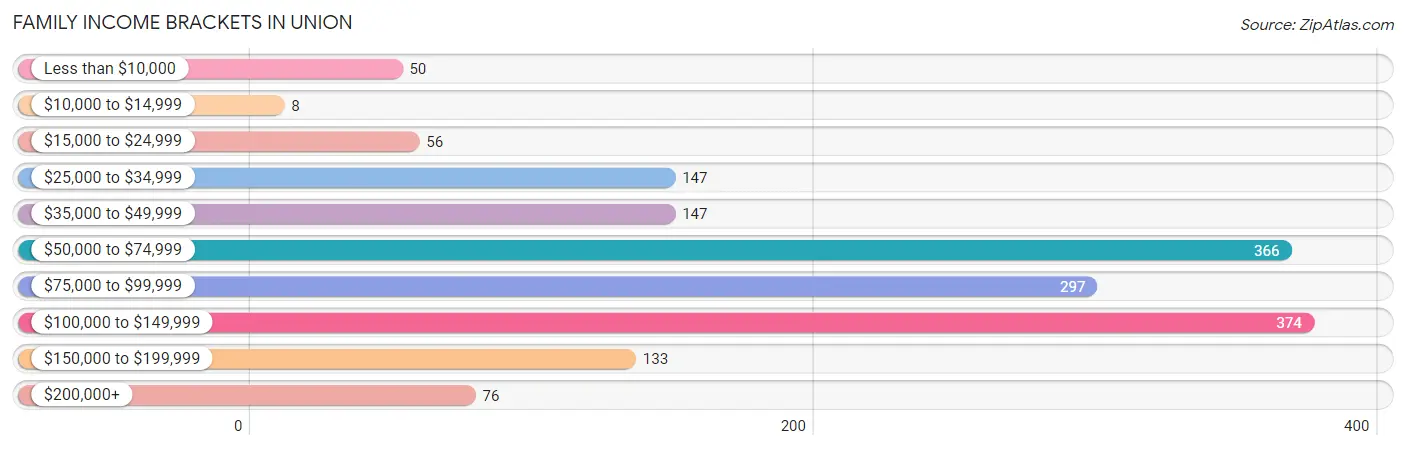
| Income Bracket | # Families | % Families |
| Less than $10,000 | 50 | 3.0% |
| $10,000 to $14,999 | 8 | 0.5% |
| $15,000 to $24,999 | 56 | 3.4% |
| $25,000 to $34,999 | 147 | 8.9% |
| $35,000 to $49,999 | 147 | 8.9% |
| $50,000 to $74,999 | 366 | 22.1% |
| $75,000 to $99,999 | 297 | 17.9% |
| $100,000 to $149,999 | 374 | 22.6% |
| $150,000 to $199,999 | 133 | 8.0% |
| $200,000+ | 76 | 4.6% |
Family Income by Famaliy Size in Union
4-person families (370 | 22.3%) account for the highest median family income in Union with $115,469 per family, while 2-person families (715 | 43.1%) have the highest median income of $34,720 per family member.
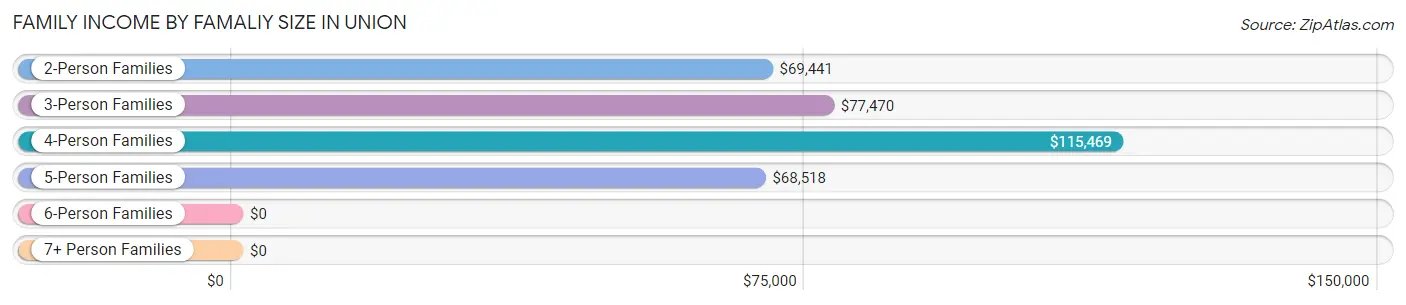
| Income Bracket | # Families | Median Income |
| 2-Person Families | 715 (43.1%) | $69,441 |
| 3-Person Families | 279 (16.8%) | $77,470 |
| 4-Person Families | 370 (22.3%) | $115,469 |
| 5-Person Families | 250 (15.1%) | $68,518 |
| 6-Person Families | 16 (1.0%) | $0 |
| 7+ Person Families | 27 (1.6%) | $0 |
| Total | 1,657 (100.0%) | $76,661 |
Family Income by Number of Earners in Union
The median family income in Union is $76,661, with families comprising 3+ earners (245) having the highest median family income of $137,813, while families with 1 earner (494) have the lowest median family income of $54,688, accounting for 14.8% and 29.8% of families, respectively.
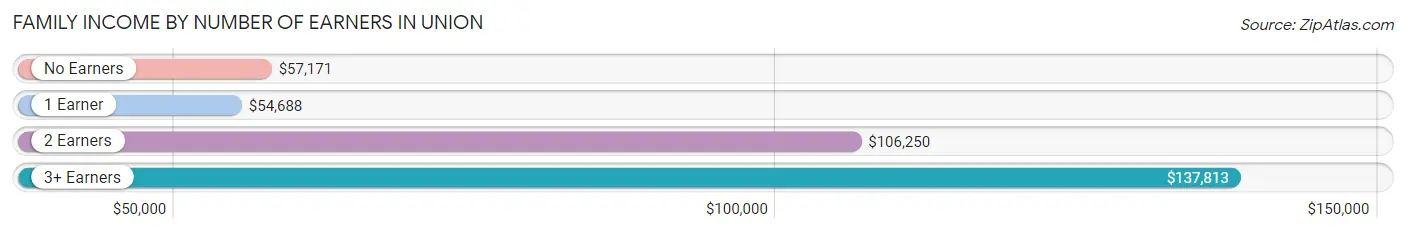
| Number of Earners | # Families | Median Income |
| No Earners | 248 (15.0%) | $57,171 |
| 1 Earner | 494 (29.8%) | $54,688 |
| 2 Earners | 670 (40.4%) | $106,250 |
| 3+ Earners | 245 (14.8%) | $137,813 |
| Total | 1,657 (100.0%) | $76,661 |
Household Income in Union
Household Income Brackets in Union
With 711 households falling in the category, the $50,000 to $74,999 income range is the most frequent in Union, accounting for 26.1% of all households. In contrast, only 33 households (1.2%) fall into the less than $10,000 income bracket, making it the least populous group.
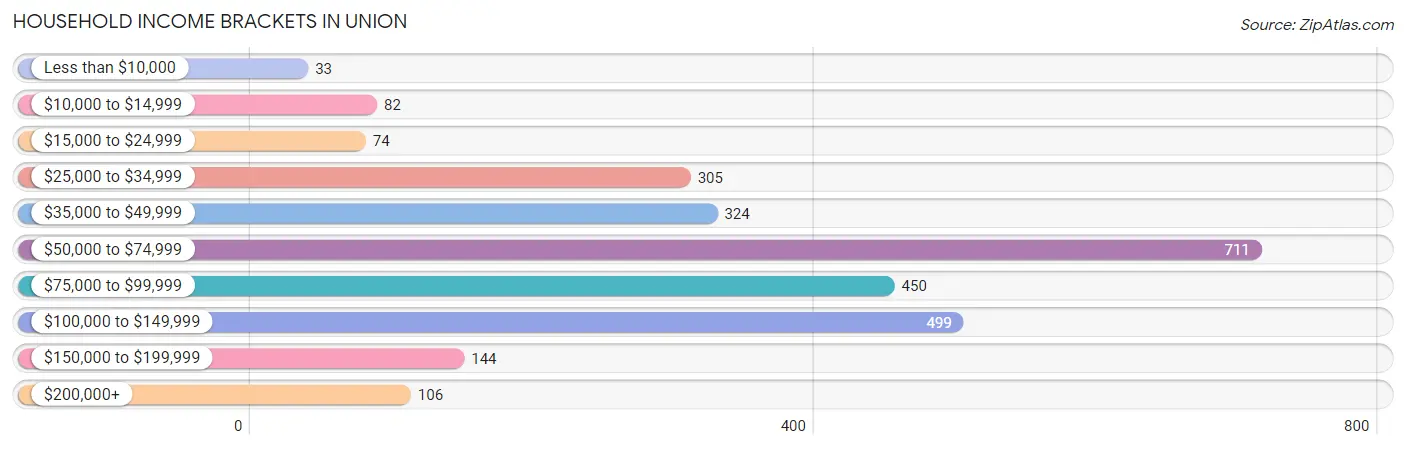
| Income Bracket | # Households | % Households |
| Less than $10,000 | 33 | 1.2% |
| $10,000 to $14,999 | 82 | 3.0% |
| $15,000 to $24,999 | 74 | 2.7% |
| $25,000 to $34,999 | 305 | 11.2% |
| $35,000 to $49,999 | 324 | 11.9% |
| $50,000 to $74,999 | 711 | 26.1% |
| $75,000 to $99,999 | 450 | 16.5% |
| $100,000 to $149,999 | 499 | 18.3% |
| $150,000 to $199,999 | 144 | 5.3% |
| $200,000+ | 106 | 3.9% |
Household Income by Householder Age in Union
The median household income in Union is $68,586, with the highest median household income of $85,559 found in the 45 to 64 years age bracket for the primary householder. A total of 851 households (31.2%) fall into this category. Meanwhile, the 15 to 24 years age bracket for the primary householder has the lowest median household income of $0, with 37 households (1.4%) in this group.
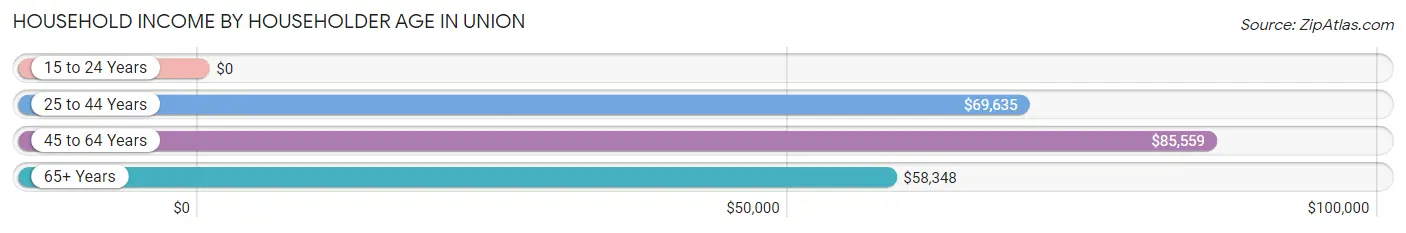
| Income Bracket | # Households | Median Income |
| 15 to 24 Years | 37 (1.4%) | $0 |
| 25 to 44 Years | 860 (31.6%) | $69,635 |
| 45 to 64 Years | 851 (31.2%) | $85,559 |
| 65+ Years | 977 (35.8%) | $58,348 |
| Total | 2,725 (100.0%) | $68,586 |
Poverty in Union
Income Below Poverty by Sex and Age in Union
With 8.9% poverty level for males and 6.6% for females among the residents of Union, 15 year old males and 16 and 17 year old females are the most vulnerable to poverty, with 74 males (84.1%) and 22 females (37.3%) in their respective age groups living below the poverty level.
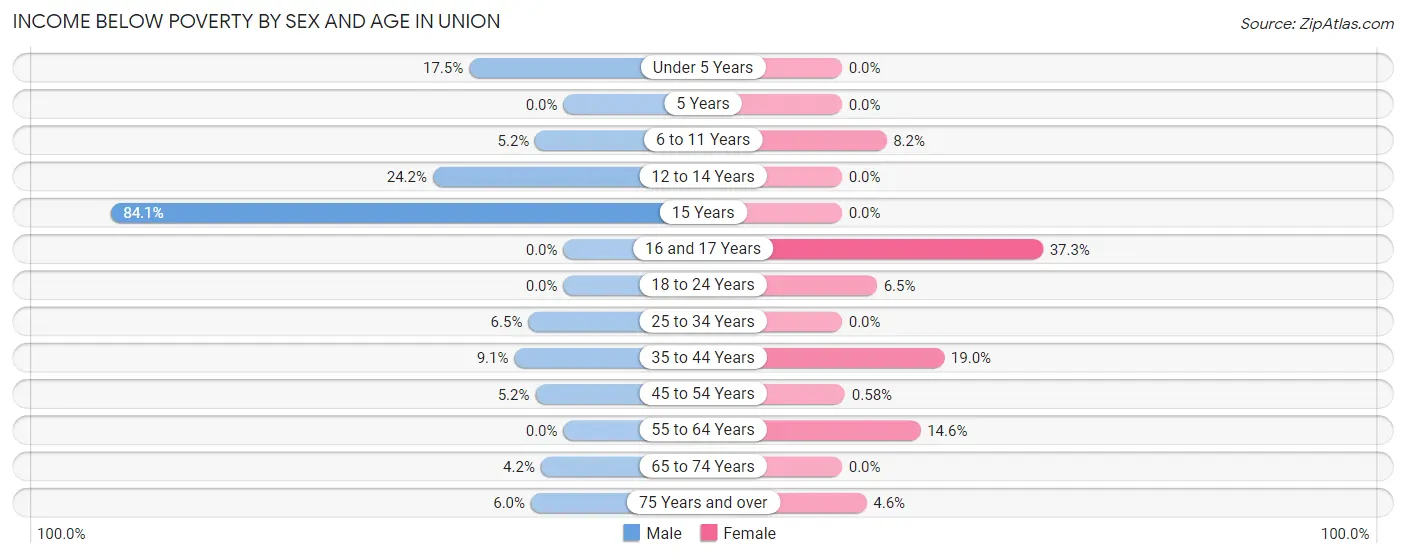
| Age Bracket | Male | Female |
| Under 5 Years | 21 (17.5%) | 0 (0.0%) |
| 5 Years | 0 (0.0%) | 0 (0.0%) |
| 6 to 11 Years | 19 (5.2%) | 22 (8.2%) |
| 12 to 14 Years | 55 (24.2%) | 0 (0.0%) |
| 15 Years | 74 (84.1%) | 0 (0.0%) |
| 16 and 17 Years | 0 (0.0%) | 22 (37.3%) |
| 18 to 24 Years | 0 (0.0%) | 16 (6.5%) |
| 25 to 34 Years | 29 (6.5%) | 0 (0.0%) |
| 35 to 44 Years | 43 (9.1%) | 97 (19.0%) |
| 45 to 54 Years | 22 (5.2%) | 2 (0.6%) |
| 55 to 64 Years | 0 (0.0%) | 60 (14.6%) |
| 65 to 74 Years | 14 (4.2%) | 0 (0.0%) |
| 75 Years and over | 17 (6.0%) | 17 (4.6%) |
| Total | 294 (8.9%) | 236 (6.6%) |
Income Above Poverty by Sex and Age in Union
According to the poverty statistics in Union, males aged 5 years and females aged under 5 years are the age groups that are most secure financially, with 100.0% of males and 100.0% of females in these age groups living above the poverty line.
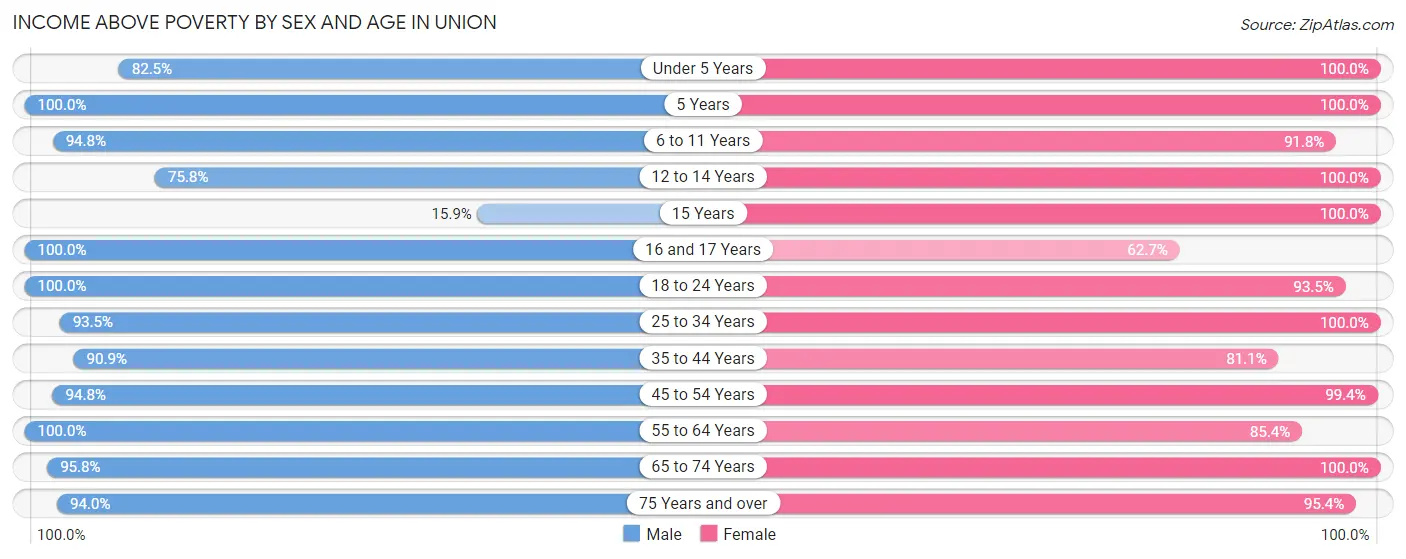
| Age Bracket | Male | Female |
| Under 5 Years | 99 (82.5%) | 172 (100.0%) |
| 5 Years | 76 (100.0%) | 69 (100.0%) |
| 6 to 11 Years | 344 (94.8%) | 245 (91.8%) |
| 12 to 14 Years | 172 (75.8%) | 178 (100.0%) |
| 15 Years | 14 (15.9%) | 76 (100.0%) |
| 16 and 17 Years | 91 (100.0%) | 37 (62.7%) |
| 18 to 24 Years | 90 (100.0%) | 231 (93.5%) |
| 25 to 34 Years | 416 (93.5%) | 401 (100.0%) |
| 35 to 44 Years | 429 (90.9%) | 415 (81.0%) |
| 45 to 54 Years | 400 (94.8%) | 345 (99.4%) |
| 55 to 64 Years | 286 (100.0%) | 352 (85.4%) |
| 65 to 74 Years | 319 (95.8%) | 486 (100.0%) |
| 75 Years and over | 265 (94.0%) | 356 (95.4%) |
| Total | 3,001 (91.1%) | 3,363 (93.4%) |
Income Below Poverty Among Married-Couple Families in Union
The poverty statistics for married-couple families in Union show that 3.4% or 47 of the total 1,369 families live below the poverty line. Families with 5 or more children have the highest poverty rate of 100.0%, comprising of 19 families. On the other hand, families with no children have the lowest poverty rate of 0.0%, which includes 0 families.
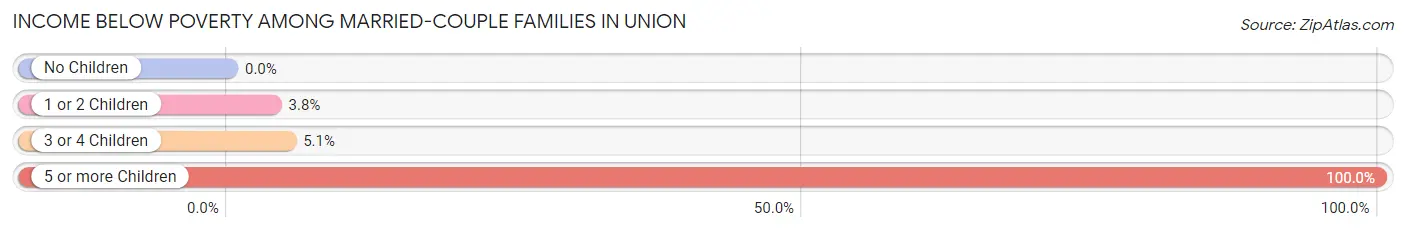
| Children | Above Poverty | Below Poverty |
| No Children | 671 (100.0%) | 0 (0.0%) |
| 1 or 2 Children | 482 (96.2%) | 19 (3.8%) |
| 3 or 4 Children | 169 (94.9%) | 9 (5.1%) |
| 5 or more Children | 0 (0.0%) | 19 (100.0%) |
| Total | 1,322 (96.6%) | 47 (3.4%) |
Income Below Poverty Among Single-Parent Households in Union
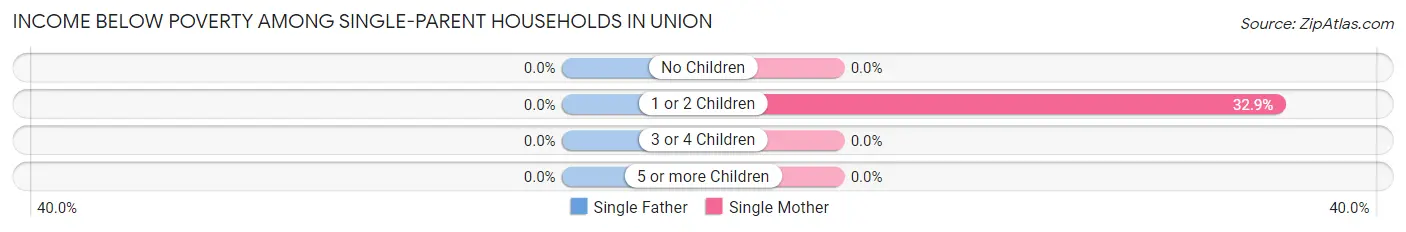
| Children | Single Father | Single Mother |
| No Children | 0 (0.0%) | 0 (0.0%) |
| 1 or 2 Children | 0 (0.0%) | 50 (32.9%) |
| 3 or 4 Children | 0 (0.0%) | 0 (0.0%) |
| 5 or more Children | 0 (0.0%) | 0 (0.0%) |
| Total | 0 (0.0%) | 50 (25.4%) |
Income Below Poverty Among Married-Couple vs Single-Parent Households in Union
The poverty data for Union shows that 47 of the married-couple family households (3.4%) and 50 of the single-parent households (17.4%) are living below the poverty level. Within the married-couple family households, those with 5 or more children have the highest poverty rate, with 19 households (100.0%) falling below the poverty line. Among the single-parent households, those with 1 or 2 children have the highest poverty rate, with 50 household (24.3%) living below poverty.
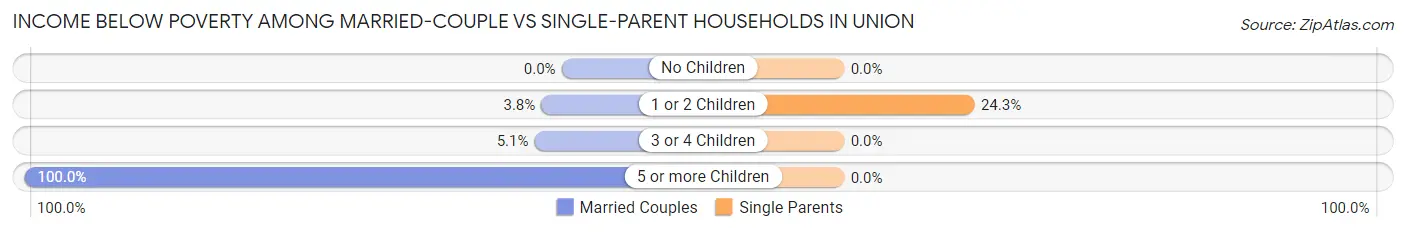
| Children | Married-Couple Families | Single-Parent Households |
| No Children | 0 (0.0%) | 0 (0.0%) |
| 1 or 2 Children | 19 (3.8%) | 50 (24.3%) |
| 3 or 4 Children | 9 (5.1%) | 0 (0.0%) |
| 5 or more Children | 19 (100.0%) | 0 (0.0%) |
| Total | 47 (3.4%) | 50 (17.4%) |
Race in Union
The most populous races in Union are White / Caucasian (6,288 | 91.2%), Two or more Races (350 | 5.1%), and Black / African American (223 | 3.2%).
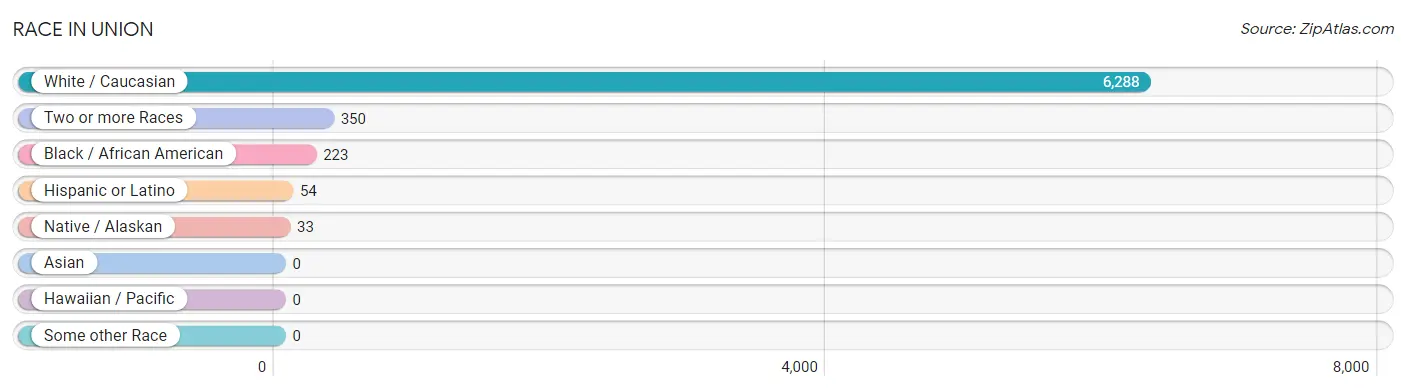
| Race | # Population | % Population |
| Asian | 0 | 0.0% |
| Black / African American | 223 | 3.2% |
| Hawaiian / Pacific | 0 | 0.0% |
| Hispanic or Latino | 54 | 0.8% |
| Native / Alaskan | 33 | 0.5% |
| White / Caucasian | 6,288 | 91.2% |
| Two or more Races | 350 | 5.1% |
| Some other Race | 0 | 0.0% |
| Total | 6,894 | 100.0% |
Ancestry in Union
The most populous ancestries reported in Union are German (1,912 | 27.7%), Irish (795 | 11.5%), American (691 | 10.0%), English (538 | 7.8%), and Italian (377 | 5.5%), together accounting for 62.5% of all Union residents.
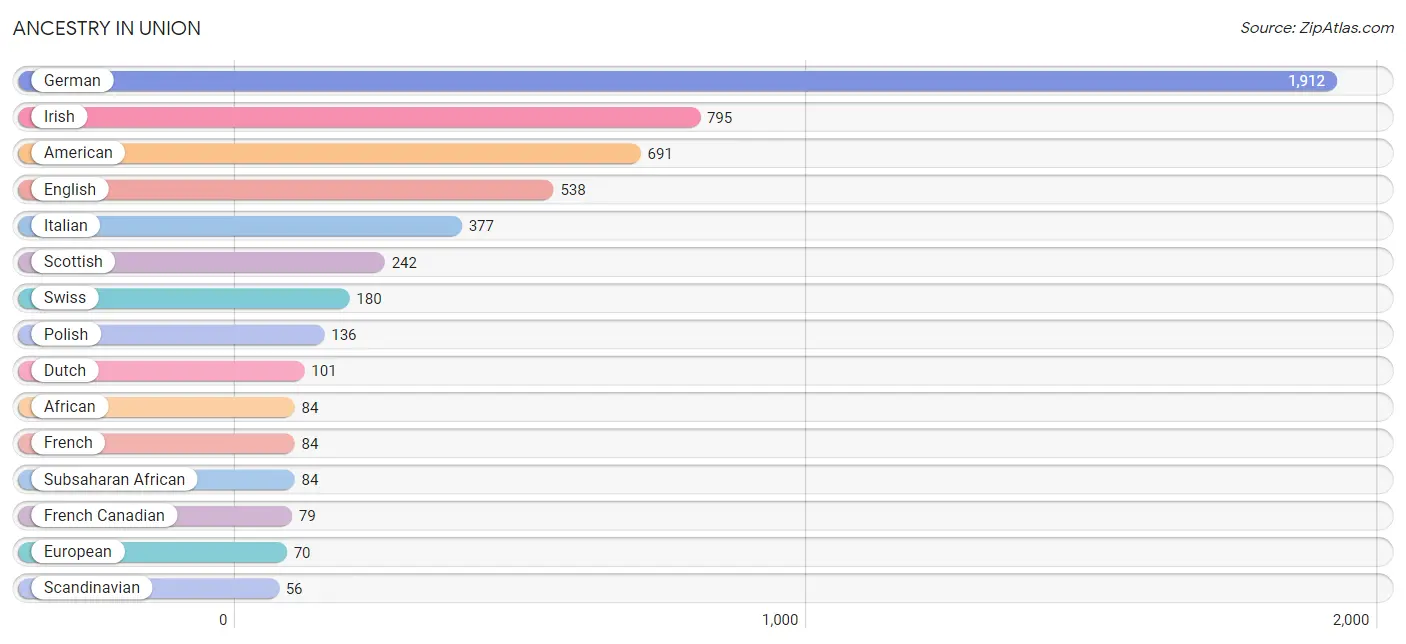
| Ancestry | # Population | % Population |
| African | 84 | 1.2% |
| American | 691 | 10.0% |
| British | 30 | 0.4% |
| Cherokee | 29 | 0.4% |
| Crow | 5 | 0.1% |
| Dutch | 101 | 1.5% |
| Eastern European | 9 | 0.1% |
| English | 538 | 7.8% |
| European | 70 | 1.0% |
| French | 84 | 1.2% |
| French Canadian | 79 | 1.1% |
| German | 1,912 | 27.7% |
| Greek | 15 | 0.2% |
| Hopi | 33 | 0.5% |
| Hungarian | 21 | 0.3% |
| Irish | 795 | 11.5% |
| Italian | 377 | 5.5% |
| Mexican | 33 | 0.5% |
| Northern European | 13 | 0.2% |
| Norwegian | 18 | 0.3% |
| Ottawa | 26 | 0.4% |
| Polish | 136 | 2.0% |
| Puerto Rican | 21 | 0.3% |
| Russian | 51 | 0.7% |
| Scandinavian | 56 | 0.8% |
| Scotch-Irish | 25 | 0.4% |
| Scottish | 242 | 3.5% |
| Subsaharan African | 84 | 1.2% |
| Swedish | 26 | 0.4% |
| Swiss | 180 | 2.6% |
| Thai | 15 | 0.2% |
| Welsh | 20 | 0.3% | View All 32 Rows |
Immigrants in Union
The most numerous immigrant groups reported in Union came from Africa (63 | 0.9%), Cameroon (63 | 0.9%), and Middle Africa (63 | 0.9%), together accounting for 2.7% of all Union residents.
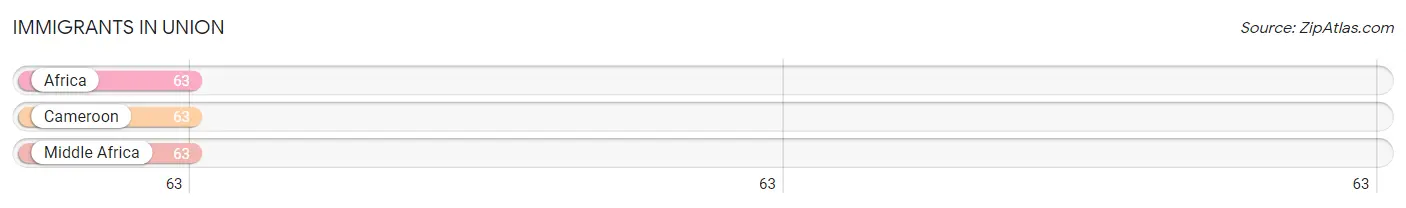
| Immigration Origin | # Population | % Population |
| Africa | 63 | 0.9% |
| Cameroon | 63 | 0.9% |
| Middle Africa | 63 | 0.9% | View All 3 Rows |
Sex and Age in Union
Sex and Age in Union
The most populous age groups in Union are 5 to 9 Years (397 | 12.0%) for men and 35 to 39 Years (327 | 9.1%) for women.
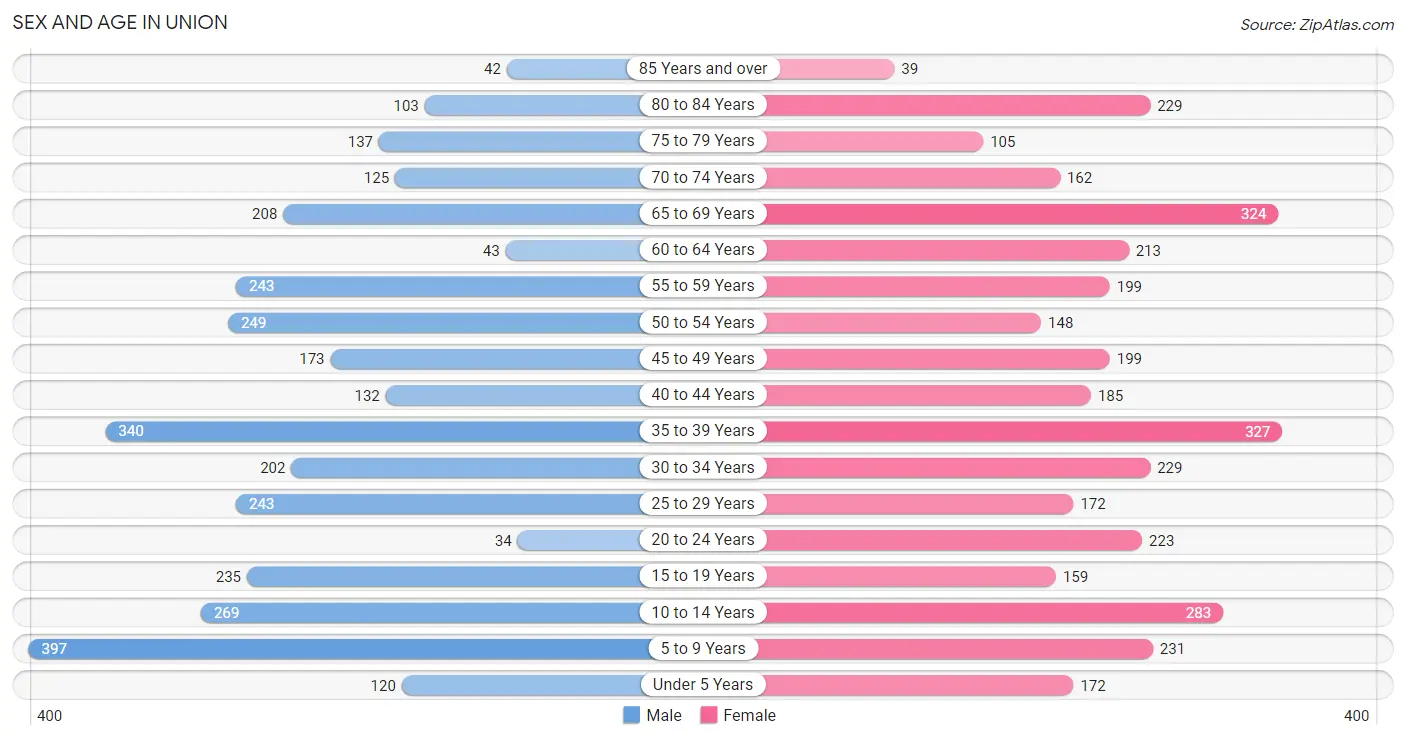
| Age Bracket | Male | Female |
| Under 5 Years | 120 (3.6%) | 172 (4.8%) |
| 5 to 9 Years | 397 (12.0%) | 231 (6.4%) |
| 10 to 14 Years | 269 (8.2%) | 283 (7.9%) |
| 15 to 19 Years | 235 (7.1%) | 159 (4.4%) |
| 20 to 24 Years | 34 (1.0%) | 223 (6.2%) |
| 25 to 29 Years | 243 (7.4%) | 172 (4.8%) |
| 30 to 34 Years | 202 (6.1%) | 229 (6.4%) |
| 35 to 39 Years | 340 (10.3%) | 327 (9.1%) |
| 40 to 44 Years | 132 (4.0%) | 185 (5.1%) |
| 45 to 49 Years | 173 (5.2%) | 199 (5.5%) |
| 50 to 54 Years | 249 (7.6%) | 148 (4.1%) |
| 55 to 59 Years | 243 (7.4%) | 199 (5.5%) |
| 60 to 64 Years | 43 (1.3%) | 213 (5.9%) |
| 65 to 69 Years | 208 (6.3%) | 324 (9.0%) |
| 70 to 74 Years | 125 (3.8%) | 162 (4.5%) |
| 75 to 79 Years | 137 (4.2%) | 105 (2.9%) |
| 80 to 84 Years | 103 (3.1%) | 229 (6.4%) |
| 85 Years and over | 42 (1.3%) | 39 (1.1%) |
| Total | 3,295 (100.0%) | 3,599 (100.0%) |
Families and Households in Union
Median Family Size in Union
The median family size in Union is 3.27 persons per family, with married-couple families (1,369 | 82.6%) accounting for the largest median family size of 3.42 persons per family. On the other hand, single male/father families (91 | 5.5%) represent the smallest median family size with 2.27 persons per family.
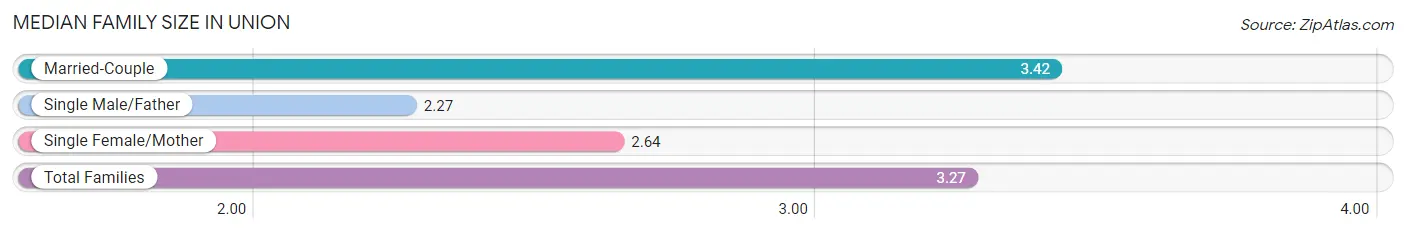
| Family Type | # Families | Family Size |
| Married-Couple | 1,369 (82.6%) | 3.42 |
| Single Male/Father | 91 (5.5%) | 2.27 |
| Single Female/Mother | 197 (11.9%) | 2.64 |
| Total Families | 1,657 (100.0%) | 3.27 |
Median Household Size in Union
The median household size in Union is 2.53 persons per household, with married-couple households (1,369 | 50.2%) accounting for the largest median household size of 3.42 persons per household. non-family households (1,068 | 39.2%) represent the smallest median household size with 1.28 persons per household.
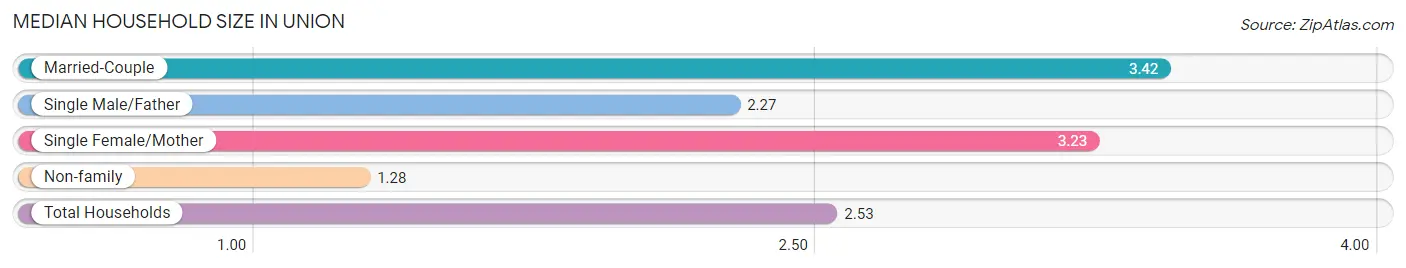
| Household Type | # Households | Household Size |
| Married-Couple | 1,369 (50.2%) | 3.42 |
| Single Male/Father | 91 (3.3%) | 2.27 |
| Single Female/Mother | 197 (7.2%) | 3.23 |
| Non-family | 1,068 (39.2%) | 1.28 |
| Total Households | 2,725 (100.0%) | 2.53 |
Household Size by Marriage Status in Union
Out of a total of 2,725 households in Union, 1,657 (60.8%) are family households, while 1,068 (39.2%) are nonfamily households. The most numerous type of family households are 2-person households, comprising 639, and the most common type of nonfamily households are 1-person households, comprising 797.
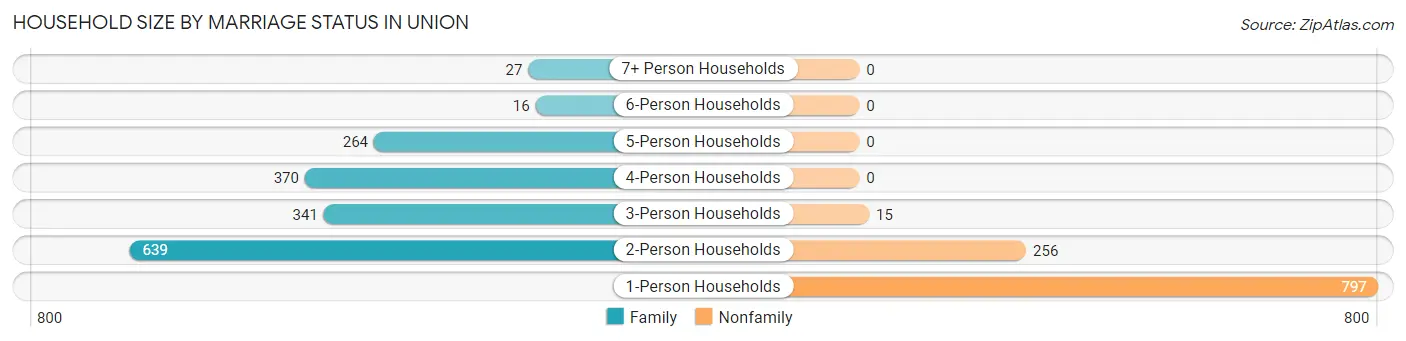
| Household Size | Family Households | Nonfamily Households |
| 1-Person Households | - | 797 (29.2%) |
| 2-Person Households | 639 (23.4%) | 256 (9.4%) |
| 3-Person Households | 341 (12.5%) | 15 (0.5%) |
| 4-Person Households | 370 (13.6%) | 0 (0.0%) |
| 5-Person Households | 264 (9.7%) | 0 (0.0%) |
| 6-Person Households | 16 (0.6%) | 0 (0.0%) |
| 7+ Person Households | 27 (1.0%) | 0 (0.0%) |
| Total | 1,657 (60.8%) | 1,068 (39.2%) |
Female Fertility in Union
Fertility by Age in Union
Average fertility rate in Union is 49.0 births per 1,000 women. Women in the age bracket of 20 to 34 years have the highest fertility rate with 63.0 births per 1,000 women. Women in the age bracket of 20 to 34 years acount for 52.7% of all women with births.
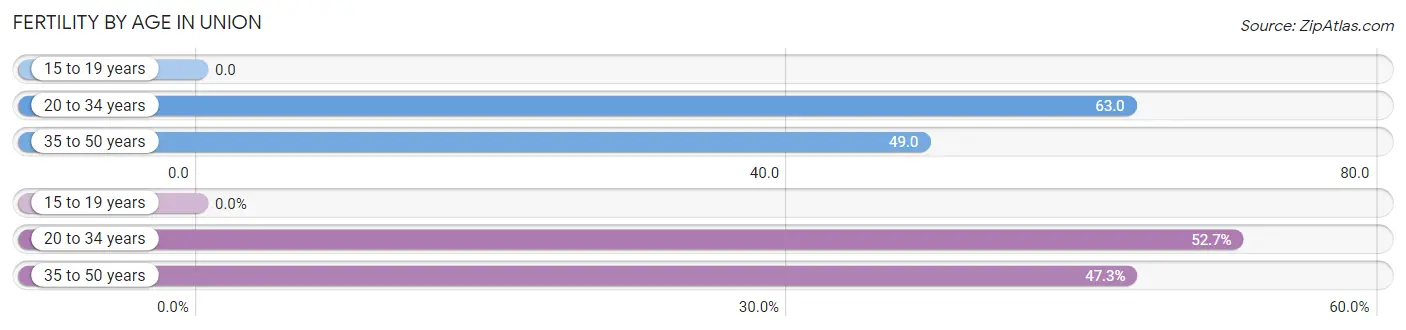
| Age Bracket | Women with Births | Births / 1,000 Women |
| 15 to 19 years | 0 (0.0%) | 0.0 |
| 20 to 34 years | 39 (52.7%) | 63.0 |
| 35 to 50 years | 35 (47.3%) | 49.0 |
| Total | 74 (100.0%) | 49.0 |
Fertility by Age by Marriage Status in Union
75.7% of women with births (74) in Union are married. The highest percentage of unmarried women with births falls into 20 to 34 years age bracket with 46.2% of them unmarried at the time of birth, while the lowest percentage of unmarried women with births belong to 35 to 50 years age bracket with 0.0% of them unmarried.
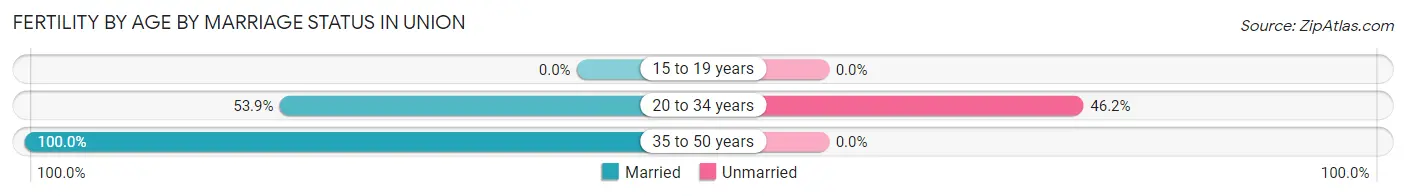
| Age Bracket | Married | Unmarried |
| 15 to 19 years | 0 (0.0%) | 0 (0.0%) |
| 20 to 34 years | 21 (53.8%) | 18 (46.2%) |
| 35 to 50 years | 35 (100.0%) | 0 (0.0%) |
| Total | 56 (75.7%) | 18 (24.3%) |
Fertility by Education in Union
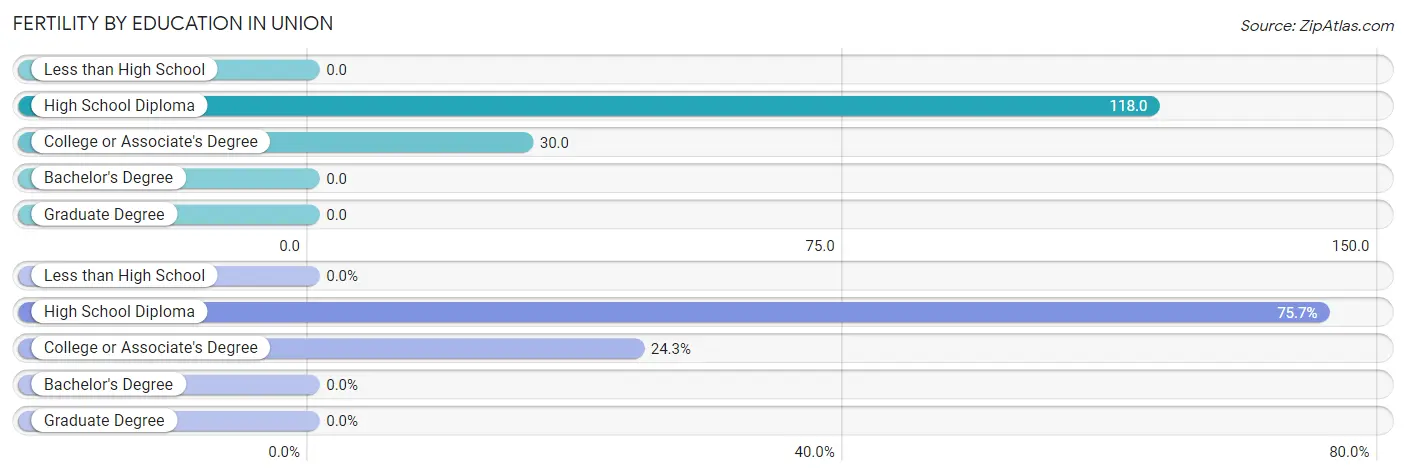
| Educational Attainment | Women with Births | Births / 1,000 Women |
| Less than High School | 0 (0.0%) | 0.0 |
| High School Diploma | 56 (75.7%) | 118.0 |
| College or Associate's Degree | 18 (24.3%) | 30.0 |
| Bachelor's Degree | 0 (0.0%) | 0.0 |
| Graduate Degree | 0 (0.0%) | 0.0 |
| Total | 74 (100.0%) | 49.0 |
Fertility by Education by Marriage Status in Union
24.3% of women with births in Union are unmarried. Women with the educational attainment of high school diploma are most likely to be married with 100.0% of them married at childbirth, while women with the educational attainment of college or associate's degree are least likely to be married with 100.0% of them unmarried at childbirth.
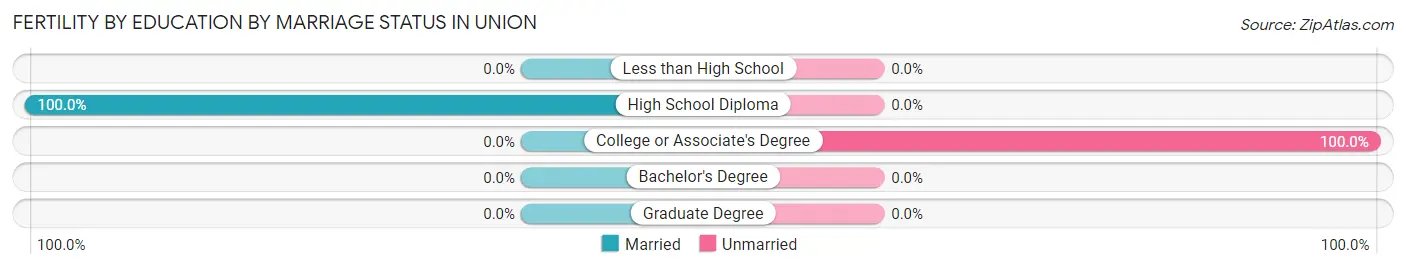
| Educational Attainment | Married | Unmarried |
| Less than High School | 0 (0.0%) | 0 (0.0%) |
| High School Diploma | 56 (100.0%) | 0 (0.0%) |
| College or Associate's Degree | 0 (0.0%) | 18 (100.0%) |
| Bachelor's Degree | 0 (0.0%) | 0 (0.0%) |
| Graduate Degree | 0 (0.0%) | 0 (0.0%) |
| Total | 56 (75.7%) | 18 (24.3%) |
Employment Characteristics in Union
Employment by Class of Employer in Union
Among the 3,406 employed individuals in Union, private company employees (2,458 | 72.2%), self-employed (not incorporated) (339 | 10.0%), and local government employees (239 | 7.0%) make up the most common classes of employment.
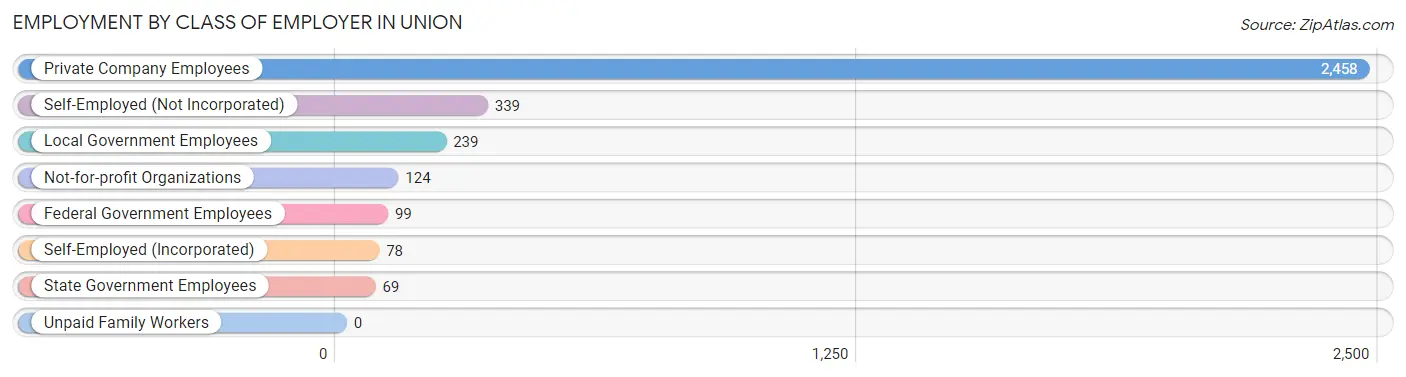
| Employer Class | # Employees | % Employees |
| Private Company Employees | 2,458 | 72.2% |
| Self-Employed (Incorporated) | 78 | 2.3% |
| Self-Employed (Not Incorporated) | 339 | 10.0% |
| Not-for-profit Organizations | 124 | 3.6% |
| Local Government Employees | 239 | 7.0% |
| State Government Employees | 69 | 2.0% |
| Federal Government Employees | 99 | 2.9% |
| Unpaid Family Workers | 0 | 0.0% |
| Total | 3,406 | 100.0% |
Employment Status by Age in Union
According to the labor force statistics for Union, out of the total population over 16 years of age (5,258), 67.5% or 3,549 individuals are in the labor force, with 2.9% or 103 of them unemployed. The age group with the highest labor force participation rate is 45 to 54 years, with 99.7% or 767 individuals in the labor force. Within the labor force, the 65 to 74 years age range has the highest percentage of unemployed individuals, with 19.5% or 32 of them being unemployed.
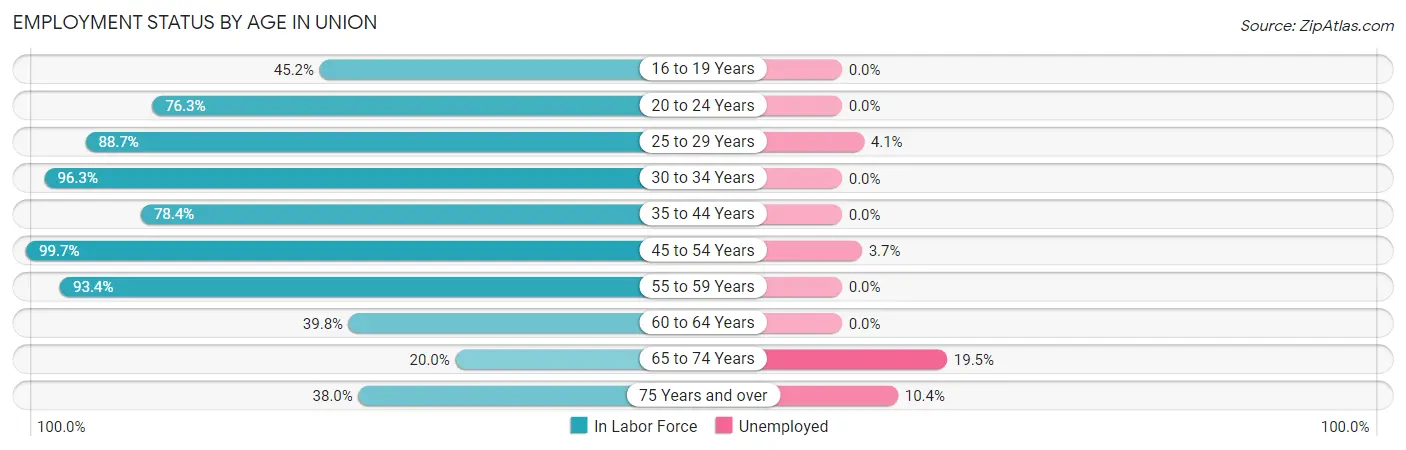
| Age Bracket | In Labor Force | Unemployed |
| 16 to 19 Years | 104 (45.2%) | 0 (0.0%) |
| 20 to 24 Years | 196 (76.3%) | 0 (0.0%) |
| 25 to 29 Years | 368 (88.7%) | 15 (4.1%) |
| 30 to 34 Years | 415 (96.3%) | 0 (0.0%) |
| 35 to 44 Years | 771 (78.4%) | 0 (0.0%) |
| 45 to 54 Years | 767 (99.7%) | 28 (3.7%) |
| 55 to 59 Years | 413 (93.4%) | 0 (0.0%) |
| 60 to 64 Years | 102 (39.8%) | 0 (0.0%) |
| 65 to 74 Years | 164 (20.0%) | 32 (19.5%) |
| 75 Years and over | 249 (38.0%) | 26 (10.4%) |
| Total | 3,549 (67.5%) | 103 (2.9%) |
Employment Status by Educational Attainment in Union
According to labor force statistics for Union, 86.0% of individuals (2,835) out of the total population between 25 and 64 years of age (3,297) are in the labor force, with 1.5% or 43 of them being unemployed. The group with the highest labor force participation rate are those with the educational attainment of bachelor's degree or higher, with 92.4% or 671 individuals in the labor force. Within the labor force, individuals with less than high school education have the highest percentage of unemployment, with 23.4% or 15 of them being unemployed.
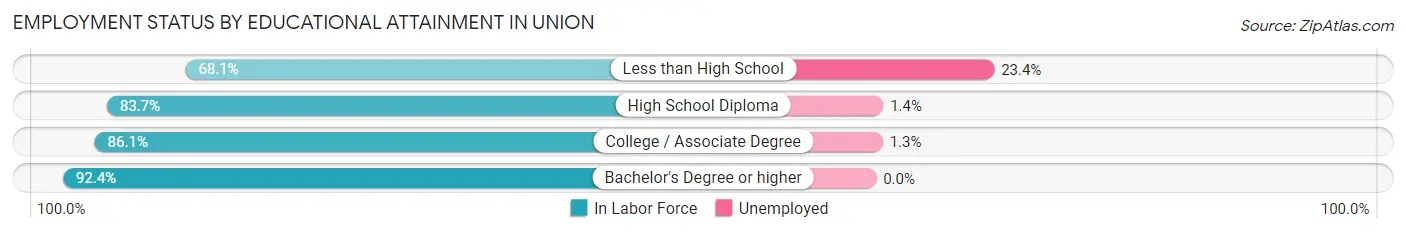
| Educational Attainment | In Labor Force | Unemployed |
| Less than High School | 64 (68.1%) | 22 (23.4%) |
| High School Diploma | 1,096 (83.7%) | 18 (1.4%) |
| College / Associate Degree | 1,005 (86.1%) | 15 (1.3%) |
| Bachelor's Degree or higher | 671 (92.4%) | 0 (0.0%) |
| Total | 2,835 (86.0%) | 49 (1.5%) |
Employment Occupations by Sex in Union
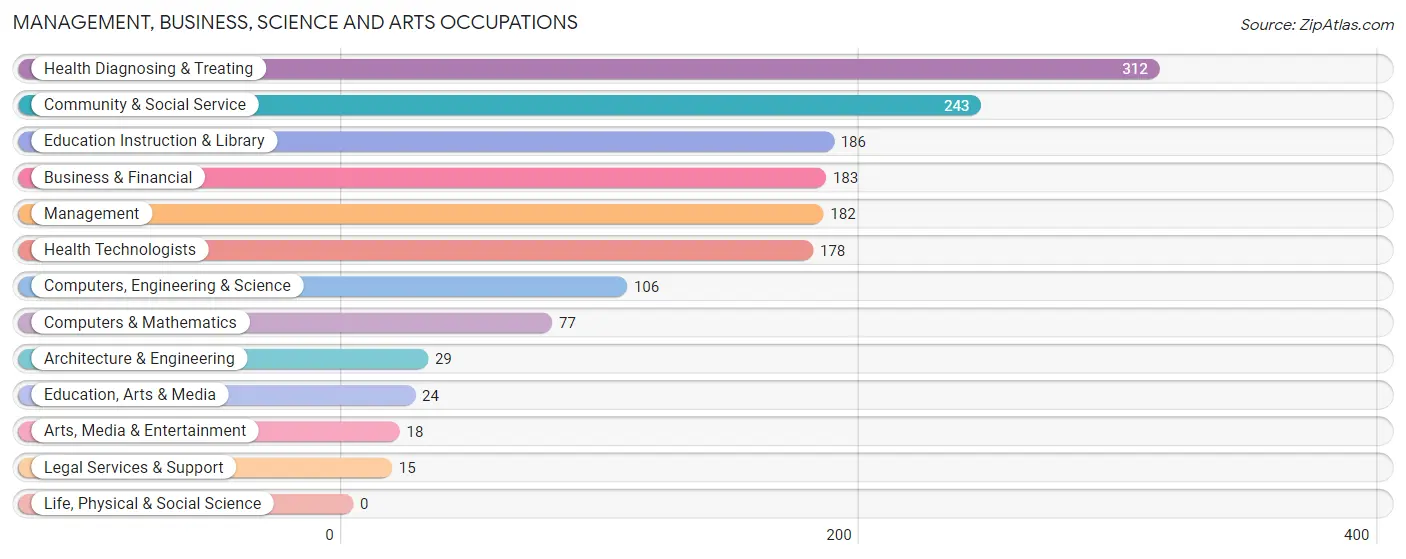
Management, Business, Science and Arts Occupations
The most common Management, Business, Science and Arts occupations in Union are Health Diagnosing & Treating (312 | 9.1%), Community & Social Service (243 | 7.1%), Education Instruction & Library (186 | 5.4%), Business & Financial (183 | 5.3%), and Management (182 | 5.3%).
Management, Business, Science and Arts Occupations by Sex
Within the Management, Business, Science and Arts occupations in Union, the most male-oriented occupations are Architecture & Engineering (100.0%), Arts, Media & Entertainment (100.0%), and Business & Financial (85.8%), while the most female-oriented occupations are Education, Arts & Media (100.0%), Legal Services & Support (100.0%), and Health Diagnosing & Treating (65.1%).
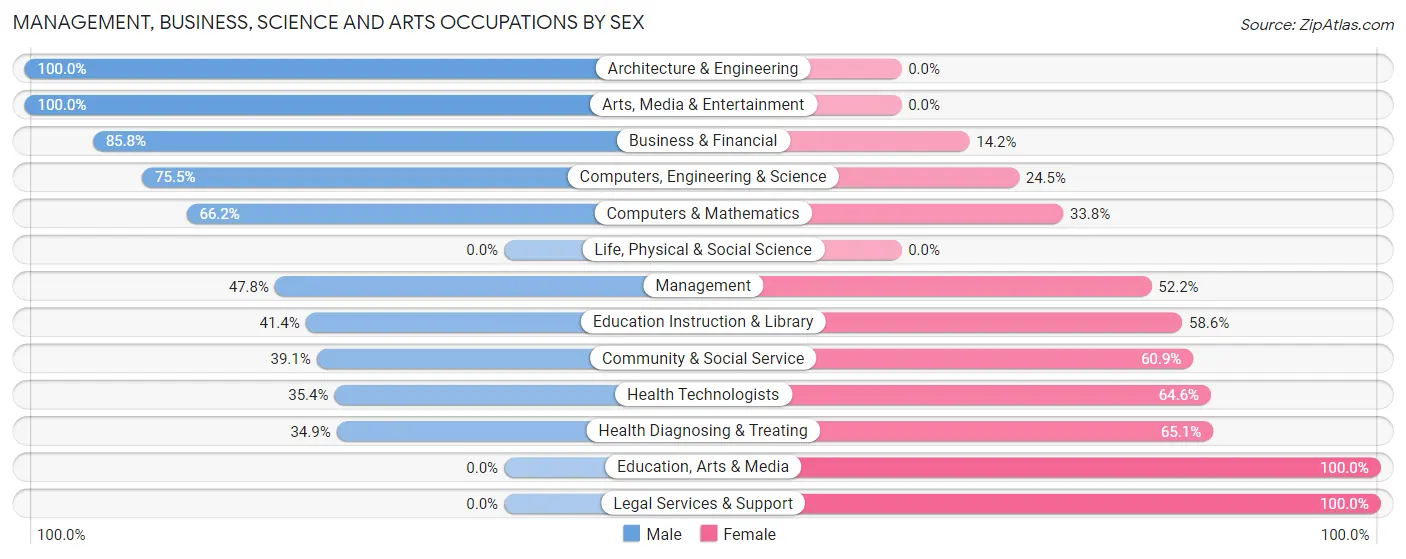
| Occupation | Male | Female |
| Management | 87 (47.8%) | 95 (52.2%) |
| Business & Financial | 157 (85.8%) | 26 (14.2%) |
| Computers, Engineering & Science | 80 (75.5%) | 26 (24.5%) |
| Computers & Mathematics | 51 (66.2%) | 26 (33.8%) |
| Architecture & Engineering | 29 (100.0%) | 0 (0.0%) |
| Life, Physical & Social Science | 0 (0.0%) | 0 (0.0%) |
| Community & Social Service | 95 (39.1%) | 148 (60.9%) |
| Education, Arts & Media | 0 (0.0%) | 24 (100.0%) |
| Legal Services & Support | 0 (0.0%) | 15 (100.0%) |
| Education Instruction & Library | 77 (41.4%) | 109 (58.6%) |
| Arts, Media & Entertainment | 18 (100.0%) | 0 (0.0%) |
| Health Diagnosing & Treating | 109 (34.9%) | 203 (65.1%) |
| Health Technologists | 63 (35.4%) | 115 (64.6%) |
| Total (Category) | 528 (51.5%) | 498 (48.5%) |
| Total (Overall) | 1,664 (48.6%) | 1,762 (51.4%) |
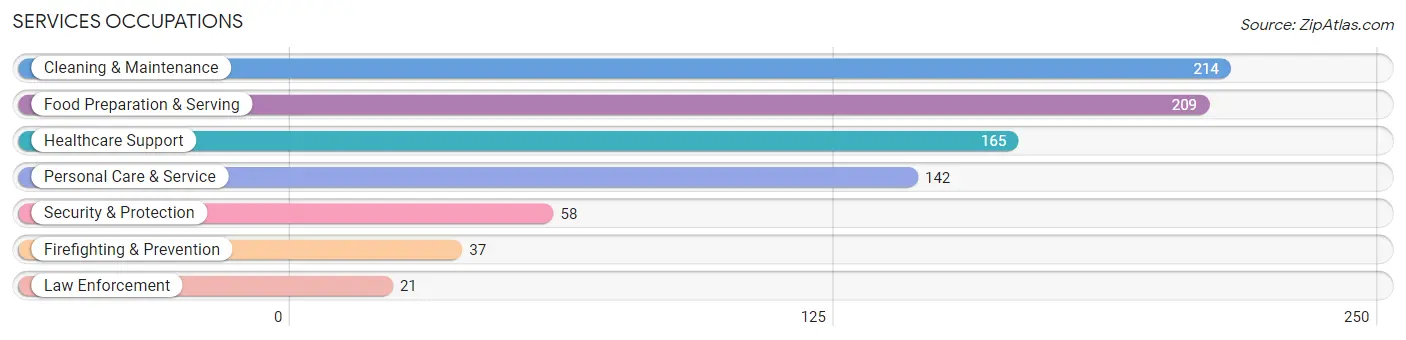
Services Occupations
The most common Services occupations in Union are Cleaning & Maintenance (214 | 6.2%), Food Preparation & Serving (209 | 6.1%), Healthcare Support (165 | 4.8%), Personal Care & Service (142 | 4.1%), and Security & Protection (58 | 1.7%).
Services Occupations by Sex
Within the Services occupations in Union, the most male-oriented occupations are Law Enforcement (100.0%), Security & Protection (70.7%), and Firefighting & Prevention (54.0%), while the most female-oriented occupations are Healthcare Support (100.0%), Cleaning & Maintenance (84.1%), and Personal Care & Service (71.8%).
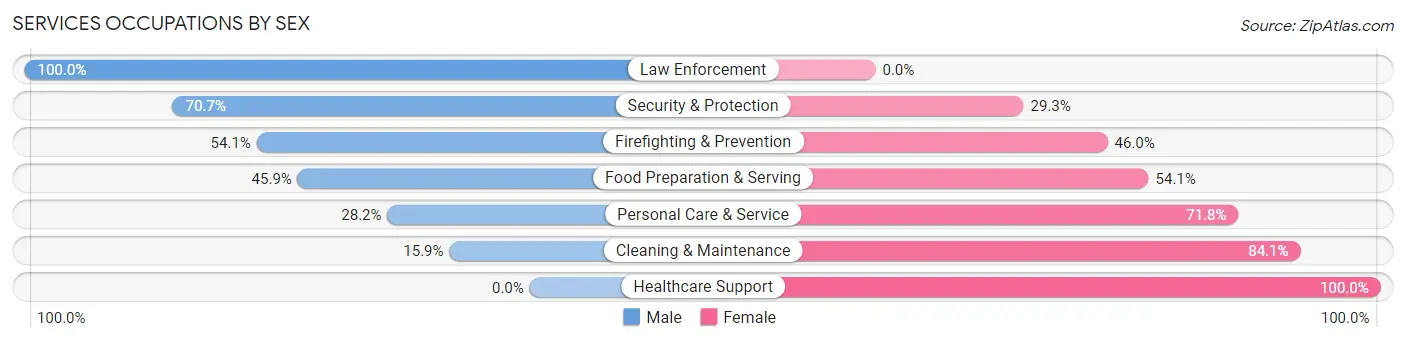
| Occupation | Male | Female |
| Healthcare Support | 0 (0.0%) | 165 (100.0%) |
| Security & Protection | 41 (70.7%) | 17 (29.3%) |
| Firefighting & Prevention | 20 (54.0%) | 17 (46.0%) |
| Law Enforcement | 21 (100.0%) | 0 (0.0%) |
| Food Preparation & Serving | 96 (45.9%) | 113 (54.1%) |
| Cleaning & Maintenance | 34 (15.9%) | 180 (84.1%) |
| Personal Care & Service | 40 (28.2%) | 102 (71.8%) |
| Total (Category) | 211 (26.8%) | 577 (73.2%) |
| Total (Overall) | 1,664 (48.6%) | 1,762 (51.4%) |
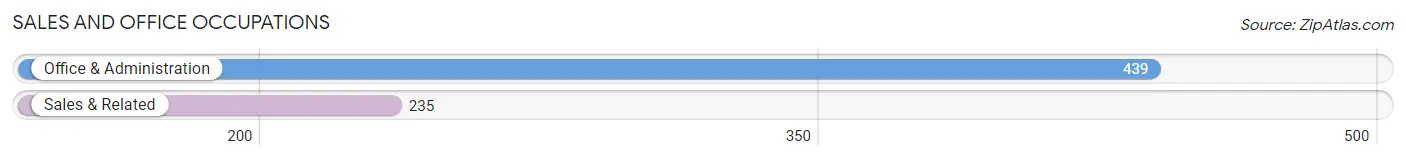
Sales and Office Occupations
The most common Sales and Office occupations in Union are Office & Administration (439 | 12.8%), and Sales & Related (235 | 6.9%).
Sales and Office Occupations by Sex
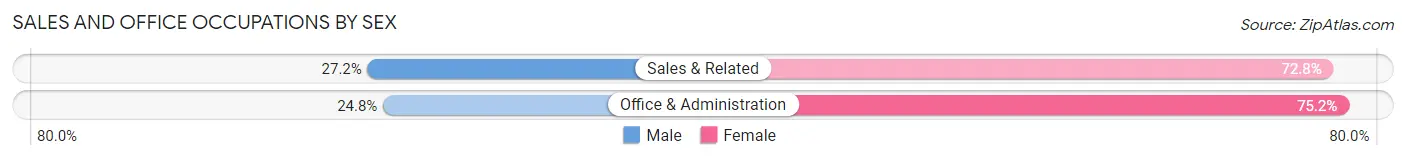
| Occupation | Male | Female |
| Sales & Related | 64 (27.2%) | 171 (72.8%) |
| Office & Administration | 109 (24.8%) | 330 (75.2%) |
| Total (Category) | 173 (25.7%) | 501 (74.3%) |
| Total (Overall) | 1,664 (48.6%) | 1,762 (51.4%) |
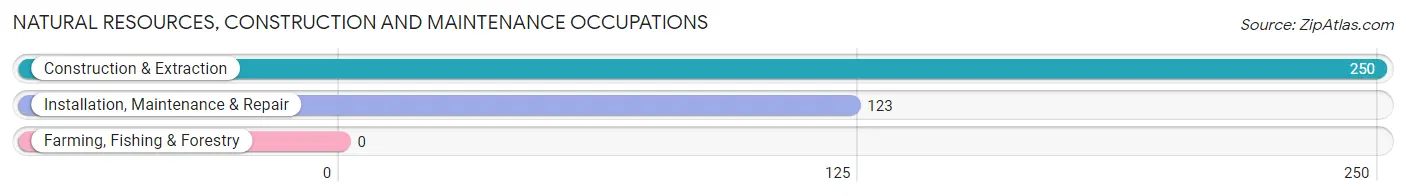
Natural Resources, Construction and Maintenance Occupations
The most common Natural Resources, Construction and Maintenance occupations in Union are Construction & Extraction (250 | 7.3%), and Installation, Maintenance & Repair (123 | 3.6%).
Natural Resources, Construction and Maintenance Occupations by Sex
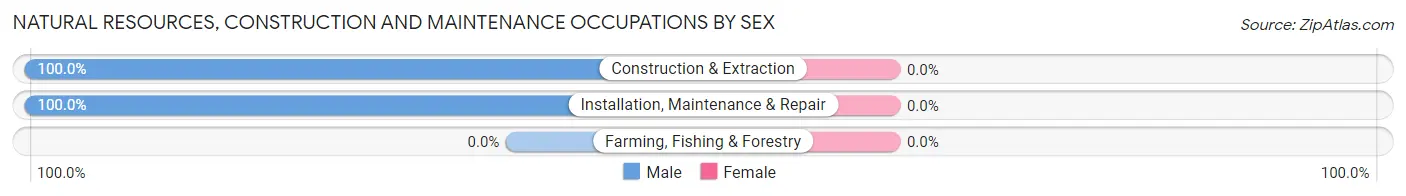
| Occupation | Male | Female |
| Farming, Fishing & Forestry | 0 (0.0%) | 0 (0.0%) |
| Construction & Extraction | 250 (100.0%) | 0 (0.0%) |
| Installation, Maintenance & Repair | 123 (100.0%) | 0 (0.0%) |
| Total (Category) | 373 (100.0%) | 0 (0.0%) |
| Total (Overall) | 1,664 (48.6%) | 1,762 (51.4%) |
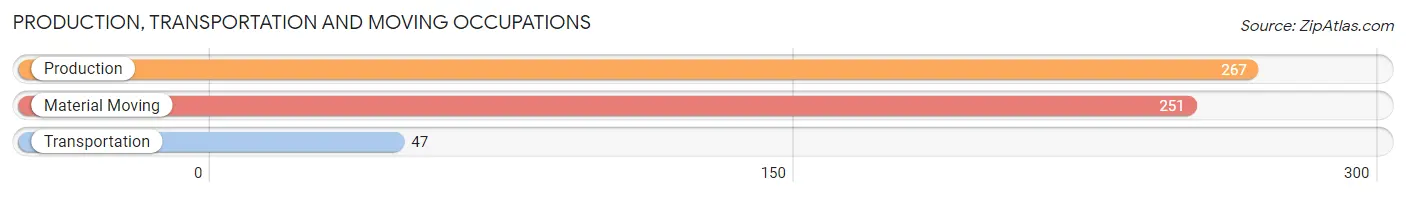
Production, Transportation and Moving Occupations
The most common Production, Transportation and Moving occupations in Union are Production (267 | 7.8%), Material Moving (251 | 7.3%), and Transportation (47 | 1.4%).
Production, Transportation and Moving Occupations by Sex
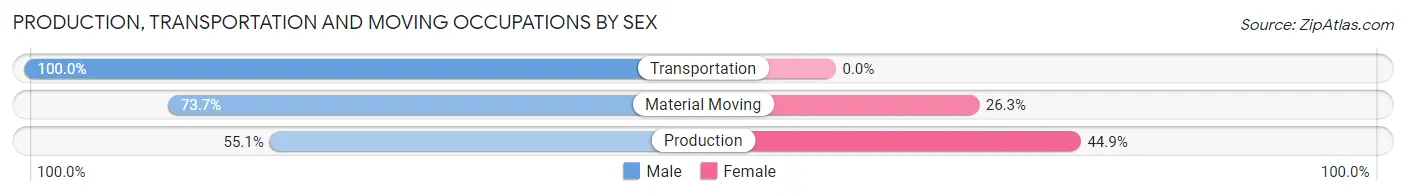
| Occupation | Male | Female |
| Production | 147 (55.1%) | 120 (44.9%) |
| Transportation | 47 (100.0%) | 0 (0.0%) |
| Material Moving | 185 (73.7%) | 66 (26.3%) |
| Total (Category) | 379 (67.1%) | 186 (32.9%) |
| Total (Overall) | 1,664 (48.6%) | 1,762 (51.4%) |
Employment Industries by Sex in Union
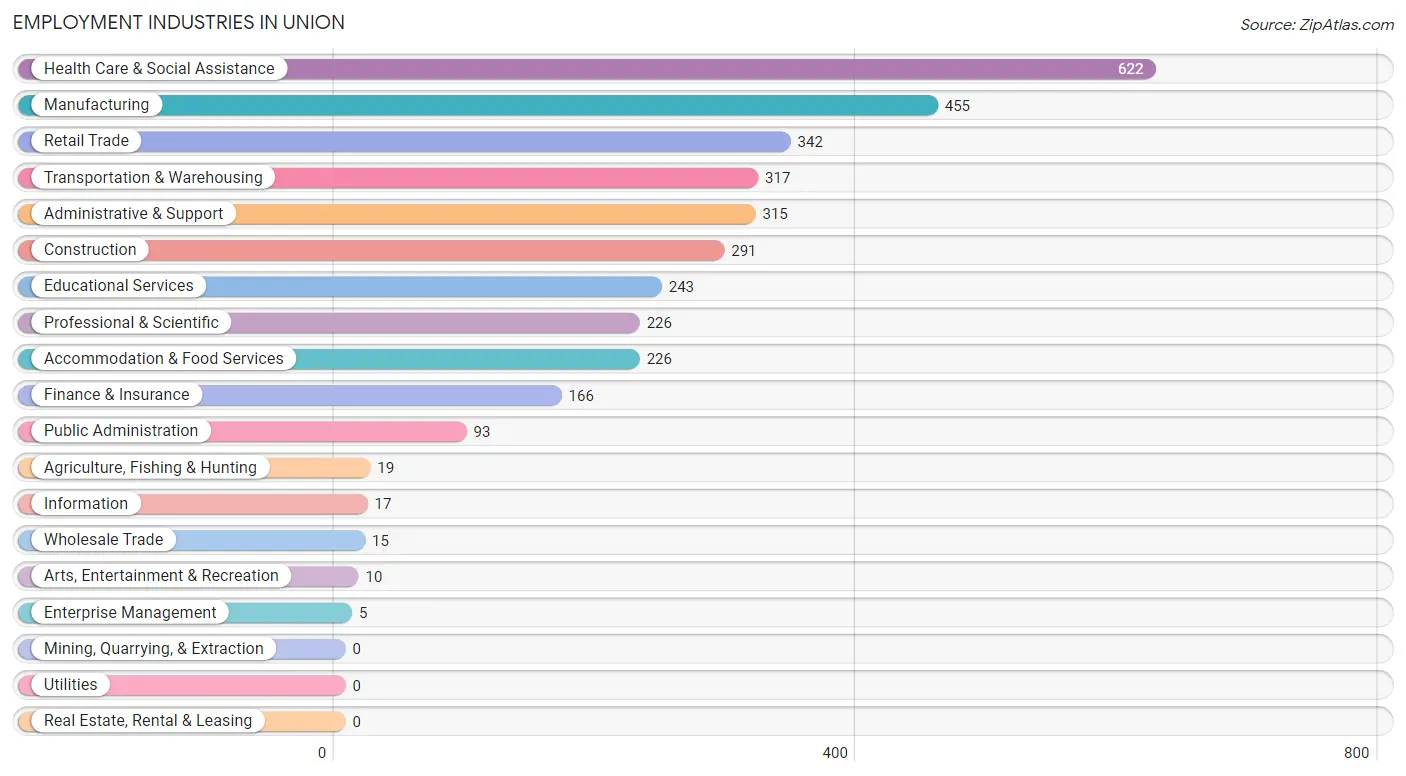
Employment Industries in Union
The major employment industries in Union include Health Care & Social Assistance (622 | 18.2%), Manufacturing (455 | 13.3%), Retail Trade (342 | 10.0%), Transportation & Warehousing (317 | 9.2%), and Administrative & Support (315 | 9.2%).
Employment Industries by Sex in Union
The Union industries that see more men than women are Agriculture, Fishing & Hunting (100.0%), Construction (100.0%), and Wholesale Trade (100.0%), whereas the industries that tend to have a higher number of women are Enterprise Management (100.0%), Health Care & Social Assistance (83.1%), and Administrative & Support (76.5%).
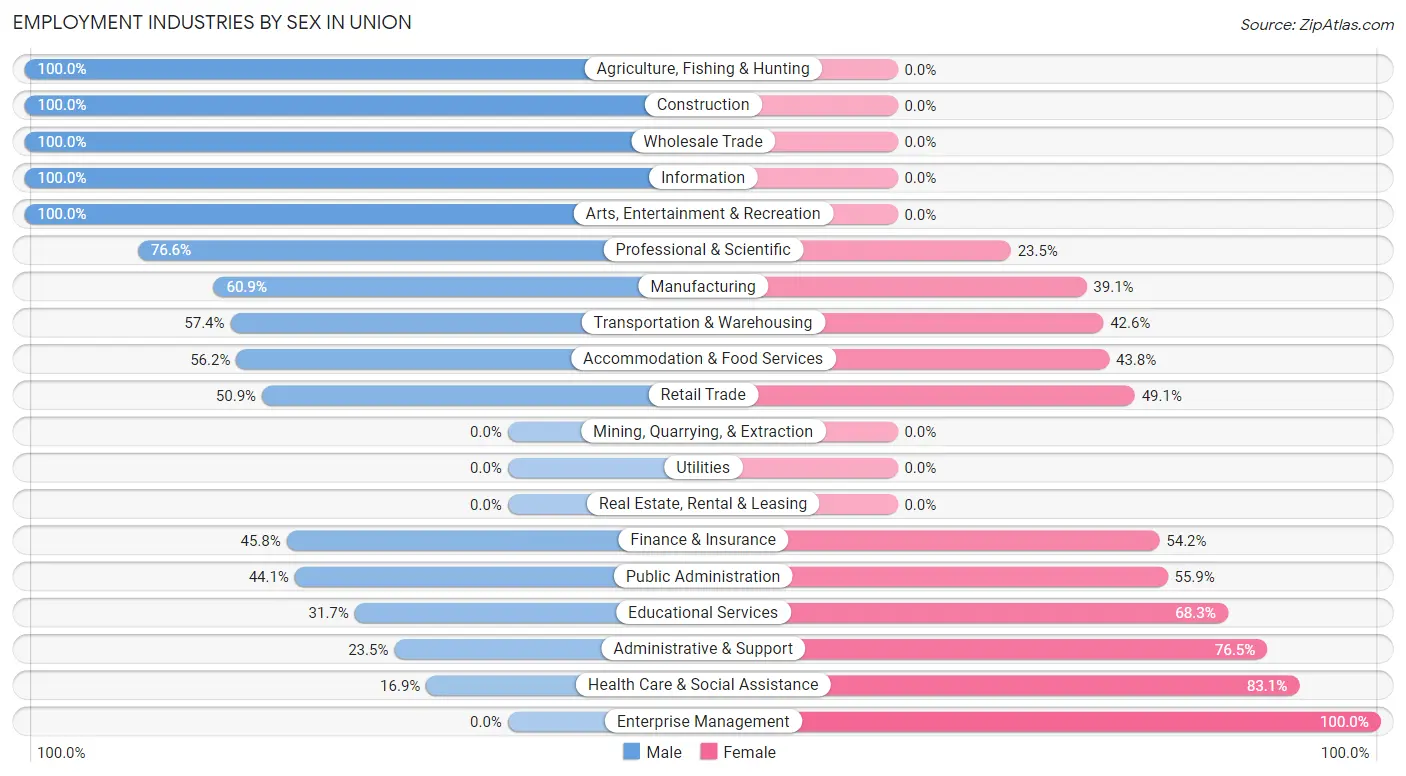
| Industry | Male | Female |
| Agriculture, Fishing & Hunting | 19 (100.0%) | 0 (0.0%) |
| Mining, Quarrying, & Extraction | 0 (0.0%) | 0 (0.0%) |
| Construction | 291 (100.0%) | 0 (0.0%) |
| Manufacturing | 277 (60.9%) | 178 (39.1%) |
| Wholesale Trade | 15 (100.0%) | 0 (0.0%) |
| Retail Trade | 174 (50.9%) | 168 (49.1%) |
| Transportation & Warehousing | 182 (57.4%) | 135 (42.6%) |
| Utilities | 0 (0.0%) | 0 (0.0%) |
| Information | 17 (100.0%) | 0 (0.0%) |
| Finance & Insurance | 76 (45.8%) | 90 (54.2%) |
| Real Estate, Rental & Leasing | 0 (0.0%) | 0 (0.0%) |
| Professional & Scientific | 173 (76.5%) | 53 (23.4%) |
| Enterprise Management | 0 (0.0%) | 5 (100.0%) |
| Administrative & Support | 74 (23.5%) | 241 (76.5%) |
| Educational Services | 77 (31.7%) | 166 (68.3%) |
| Health Care & Social Assistance | 105 (16.9%) | 517 (83.1%) |
| Arts, Entertainment & Recreation | 10 (100.0%) | 0 (0.0%) |
| Accommodation & Food Services | 127 (56.2%) | 99 (43.8%) |
| Public Administration | 41 (44.1%) | 52 (55.9%) |
| Total | 1,664 (48.6%) | 1,762 (51.4%) |
Education in Union
School Enrollment in Union
The most common levels of schooling among the 1,792 students in Union are middle school (497 | 27.7%), elementary school (453 | 25.3%), and high school (350 | 19.5%).
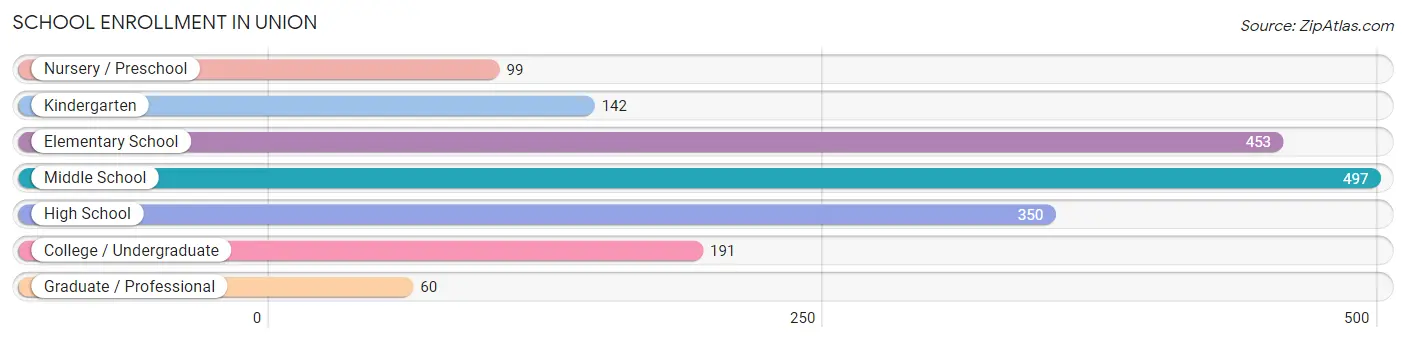
| School Level | # Students | % Students |
| Nursery / Preschool | 99 | 5.5% |
| Kindergarten | 142 | 7.9% |
| Elementary School | 453 | 25.3% |
| Middle School | 497 | 27.7% |
| High School | 350 | 19.5% |
| College / Undergraduate | 191 | 10.7% |
| Graduate / Professional | 60 | 3.4% |
| Total | 1,792 | 100.0% |
School Enrollment by Age by Funding Source in Union
Out of a total of 1,792 students who are enrolled in schools in Union, 168 (9.4%) attend a private institution, while the remaining 1,624 (90.6%) are enrolled in public schools. The age group of 18 to 19 year olds has the highest likelihood of being enrolled in private schools, with 10 (29.4% in the age bracket) enrolled. Conversely, the age group of 3 to 4 year olds has the lowest likelihood of being enrolled in a private school, with 47 (100.0% in the age bracket) attending a public institution.
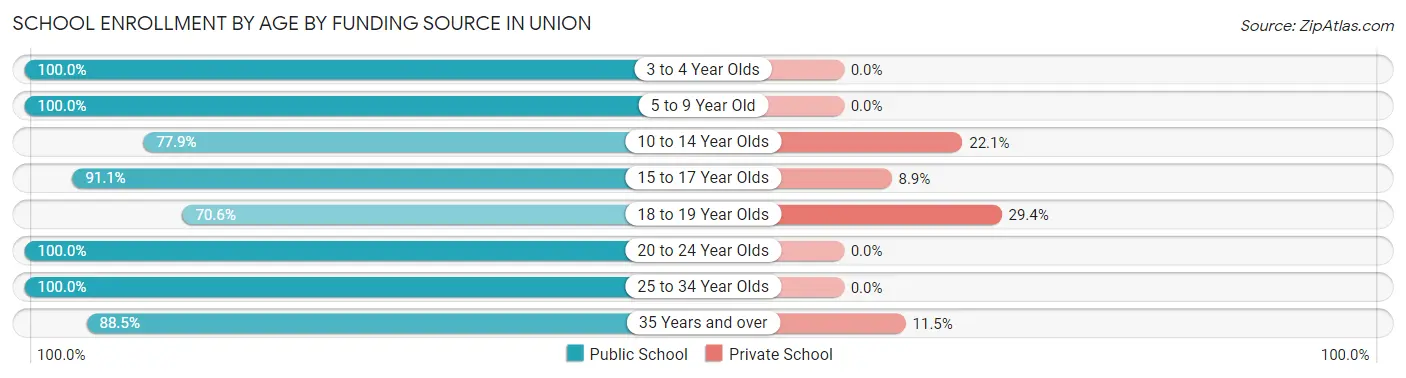
| Age Bracket | Public School | Private School |
| 3 to 4 Year Olds | 47 (100.0%) | 0 (0.0%) |
| 5 to 9 Year Old | 628 (100.0%) | 0 (0.0%) |
| 10 to 14 Year Olds | 430 (77.9%) | 122 (22.1%) |
| 15 to 17 Year Olds | 286 (91.1%) | 28 (8.9%) |
| 18 to 19 Year Olds | 24 (70.6%) | 10 (29.4%) |
| 20 to 24 Year Olds | 72 (100.0%) | 0 (0.0%) |
| 25 to 34 Year Olds | 67 (100.0%) | 0 (0.0%) |
| 35 Years and over | 69 (88.5%) | 9 (11.5%) |
| Total | 1,624 (90.6%) | 168 (9.4%) |
Educational Attainment by Field of Study in Union
Business (169 | 15.4%), education (165 | 15.1%), science & technology (160 | 14.6%), social sciences (128 | 11.7%), and communications (119 | 10.9%) are the most common fields of study among 1,094 individuals in Union who have obtained a bachelor's degree or higher.
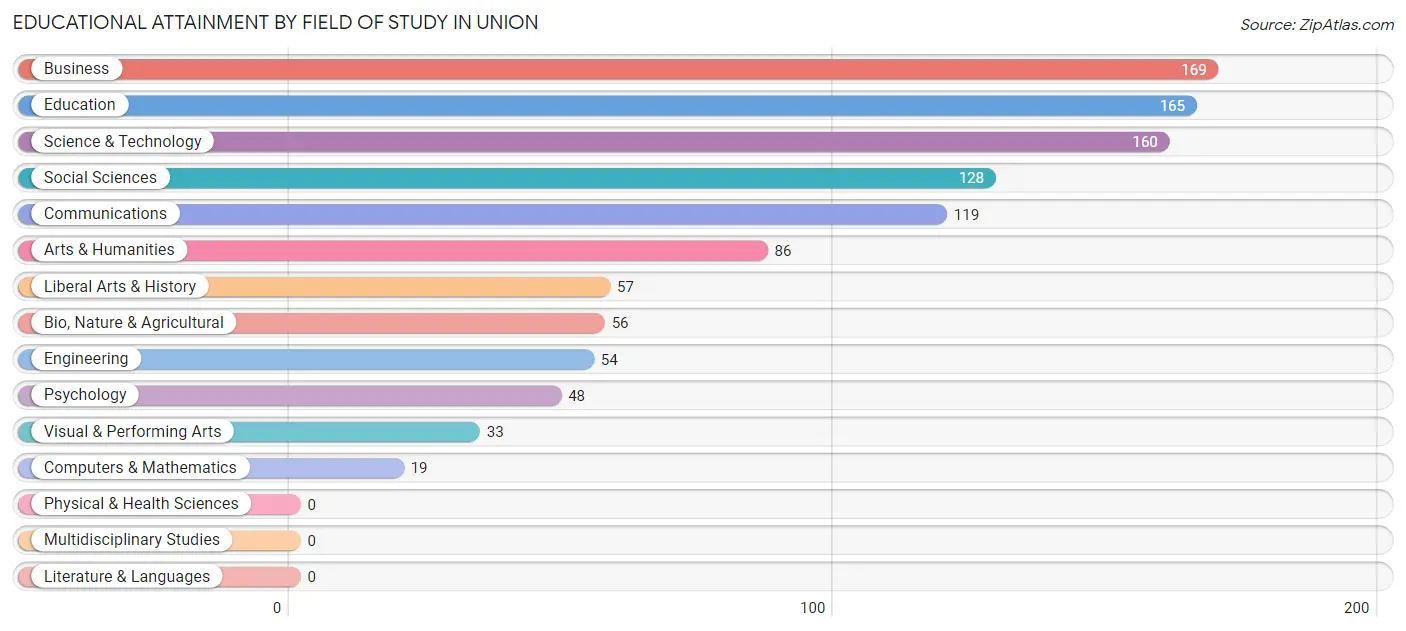
| Field of Study | # Graduates | % Graduates |
| Computers & Mathematics | 19 | 1.7% |
| Bio, Nature & Agricultural | 56 | 5.1% |
| Physical & Health Sciences | 0 | 0.0% |
| Psychology | 48 | 4.4% |
| Social Sciences | 128 | 11.7% |
| Engineering | 54 | 4.9% |
| Multidisciplinary Studies | 0 | 0.0% |
| Science & Technology | 160 | 14.6% |
| Business | 169 | 15.4% |
| Education | 165 | 15.1% |
| Literature & Languages | 0 | 0.0% |
| Liberal Arts & History | 57 | 5.2% |
| Visual & Performing Arts | 33 | 3.0% |
| Communications | 119 | 10.9% |
| Arts & Humanities | 86 | 7.9% |
| Total | 1,094 | 100.0% |
Transportation & Commute in Union
Vehicle Availability by Sex in Union
The most prevalent vehicle ownership categories in Union are males with 2 vehicles (802, accounting for 47.6%) and females with 2 vehicles (684, making up 46.6%).
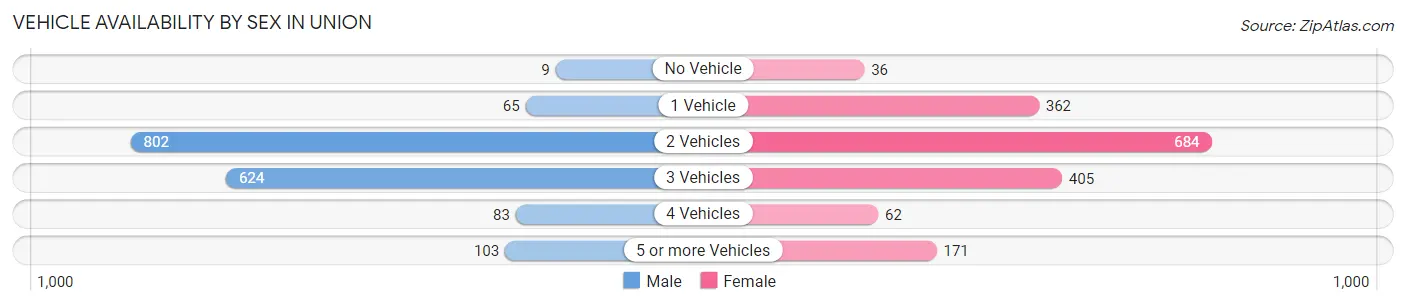
| Vehicles Available | Male | Female |
| No Vehicle | 9 (0.5%) | 36 (2.1%) |
| 1 Vehicle | 65 (3.9%) | 362 (21.0%) |
| 2 Vehicles | 802 (47.6%) | 684 (39.8%) |
| 3 Vehicles | 624 (37.0%) | 405 (23.5%) |
| 4 Vehicles | 83 (4.9%) | 62 (3.6%) |
| 5 or more Vehicles | 103 (6.1%) | 171 (9.9%) |
| Total | 1,686 (100.0%) | 1,720 (100.0%) |
Commute Time in Union
The most frequently occuring commute durations in Union are 30 to 34 minutes (747 commuters, 22.7%), 20 to 24 minutes (579 commuters, 17.6%), and 15 to 19 minutes (559 commuters, 17.0%).
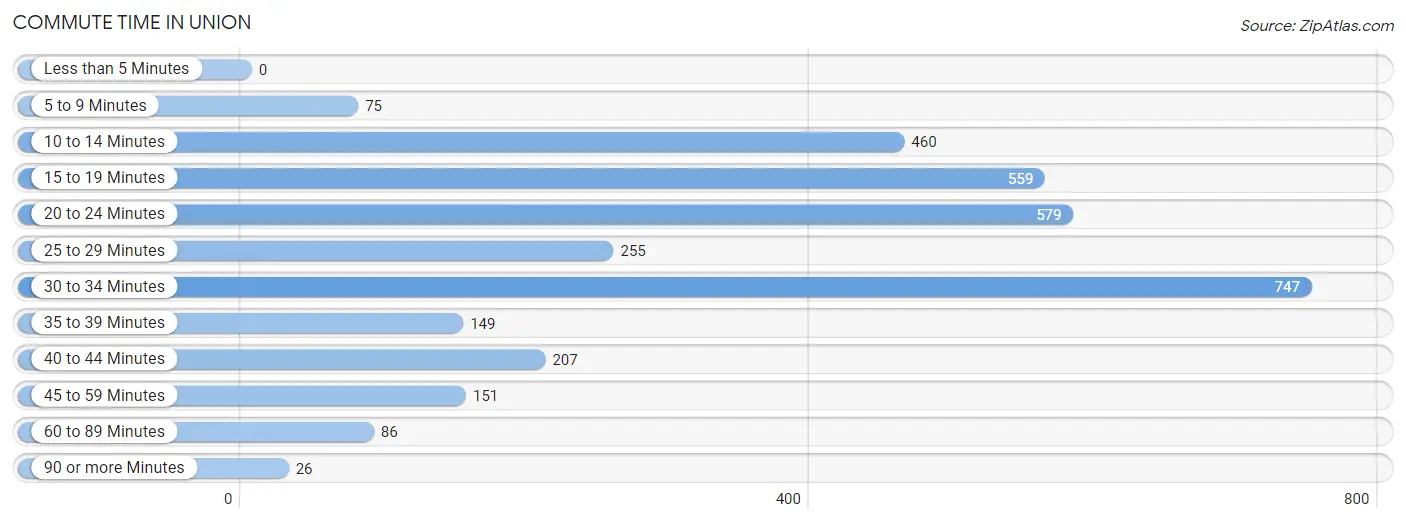
| Commute Time | # Commuters | % Commuters |
| Less than 5 Minutes | 0 | 0.0% |
| 5 to 9 Minutes | 75 | 2.3% |
| 10 to 14 Minutes | 460 | 14.0% |
| 15 to 19 Minutes | 559 | 17.0% |
| 20 to 24 Minutes | 579 | 17.6% |
| 25 to 29 Minutes | 255 | 7.7% |
| 30 to 34 Minutes | 747 | 22.7% |
| 35 to 39 Minutes | 149 | 4.5% |
| 40 to 44 Minutes | 207 | 6.3% |
| 45 to 59 Minutes | 151 | 4.6% |
| 60 to 89 Minutes | 86 | 2.6% |
| 90 or more Minutes | 26 | 0.8% |
Commute Time by Sex in Union
The most common commute times in Union are 30 to 34 minutes (395 commuters, 24.5%) for males and 30 to 34 minutes (352 commuters, 20.9%) for females.
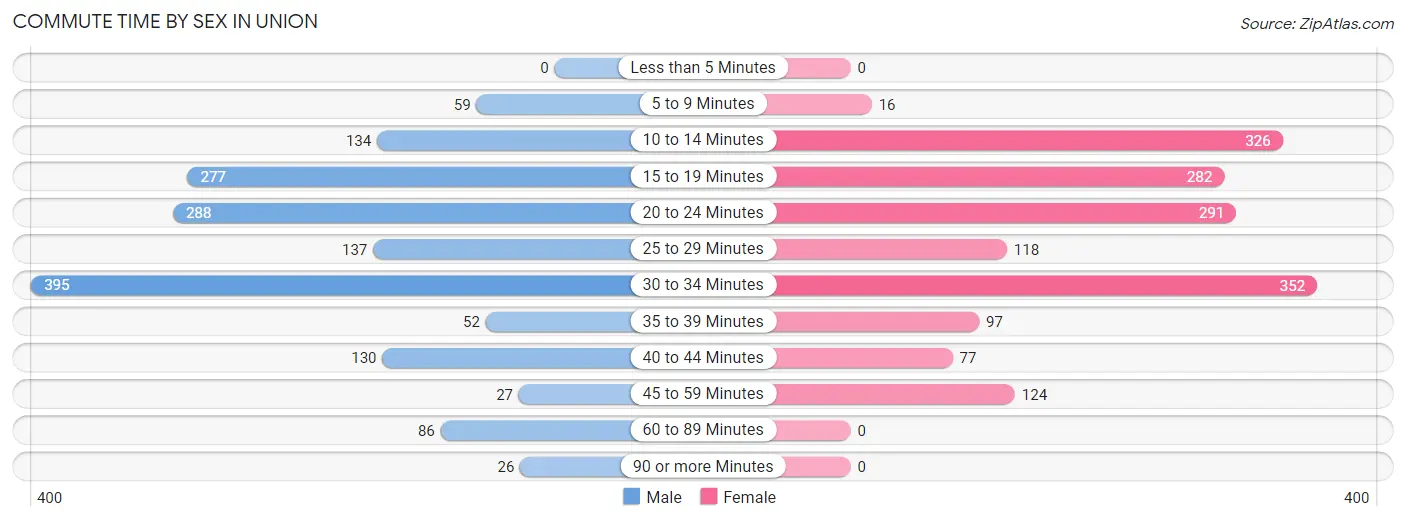
| Commute Time | Male | Female |
| Less than 5 Minutes | 0 (0.0%) | 0 (0.0%) |
| 5 to 9 Minutes | 59 (3.7%) | 16 (0.9%) |
| 10 to 14 Minutes | 134 (8.3%) | 326 (19.4%) |
| 15 to 19 Minutes | 277 (17.2%) | 282 (16.8%) |
| 20 to 24 Minutes | 288 (17.9%) | 291 (17.3%) |
| 25 to 29 Minutes | 137 (8.5%) | 118 (7.0%) |
| 30 to 34 Minutes | 395 (24.5%) | 352 (20.9%) |
| 35 to 39 Minutes | 52 (3.2%) | 97 (5.8%) |
| 40 to 44 Minutes | 130 (8.1%) | 77 (4.6%) |
| 45 to 59 Minutes | 27 (1.7%) | 124 (7.4%) |
| 60 to 89 Minutes | 86 (5.3%) | 0 (0.0%) |
| 90 or more Minutes | 26 (1.6%) | 0 (0.0%) |
Time of Departure to Work by Sex in Union
The most frequent times of departure to work in Union are 5:30 AM to 5:59 AM (288, 17.9%) for males and 7:00 AM to 7:29 AM (307, 18.2%) for females.
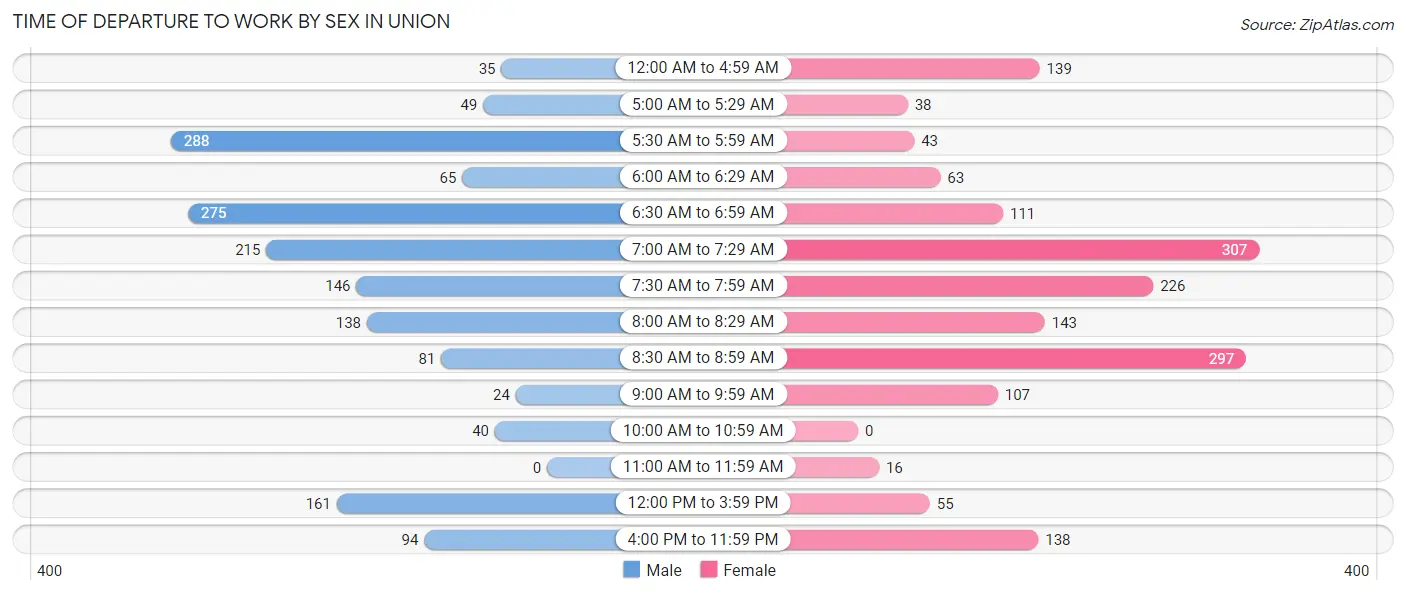
| Time of Departure | Male | Female |
| 12:00 AM to 4:59 AM | 35 (2.2%) | 139 (8.3%) |
| 5:00 AM to 5:29 AM | 49 (3.0%) | 38 (2.3%) |
| 5:30 AM to 5:59 AM | 288 (17.9%) | 43 (2.5%) |
| 6:00 AM to 6:29 AM | 65 (4.0%) | 63 (3.7%) |
| 6:30 AM to 6:59 AM | 275 (17.1%) | 111 (6.6%) |
| 7:00 AM to 7:29 AM | 215 (13.4%) | 307 (18.2%) |
| 7:30 AM to 7:59 AM | 146 (9.1%) | 226 (13.4%) |
| 8:00 AM to 8:29 AM | 138 (8.6%) | 143 (8.5%) |
| 8:30 AM to 8:59 AM | 81 (5.0%) | 297 (17.6%) |
| 9:00 AM to 9:59 AM | 24 (1.5%) | 107 (6.4%) |
| 10:00 AM to 10:59 AM | 40 (2.5%) | 0 (0.0%) |
| 11:00 AM to 11:59 AM | 0 (0.0%) | 16 (0.9%) |
| 12:00 PM to 3:59 PM | 161 (10.0%) | 55 (3.3%) |
| 4:00 PM to 11:59 PM | 94 (5.8%) | 138 (8.2%) |
| Total | 1,611 (100.0%) | 1,683 (100.0%) |
Housing Occupancy in Union
Occupancy by Ownership in Union
Of the total 2,725 dwellings in Union, owner-occupied units account for 2,061 (75.6%), while renter-occupied units make up 664 (24.4%).
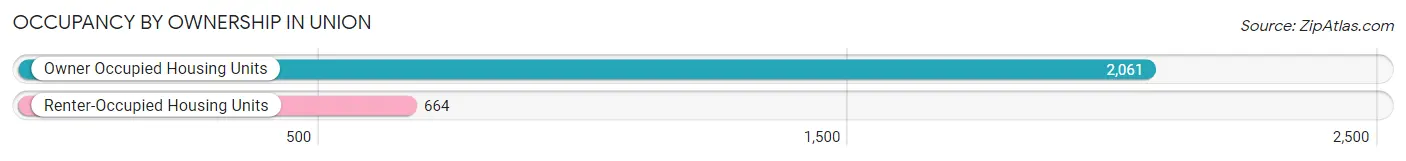
| Occupancy | # Housing Units | % Housing Units |
| Owner Occupied Housing Units | 2,061 | 75.6% |
| Renter-Occupied Housing Units | 664 | 24.4% |
| Total Occupied Housing Units | 2,725 | 100.0% |
Occupancy by Household Size in Union
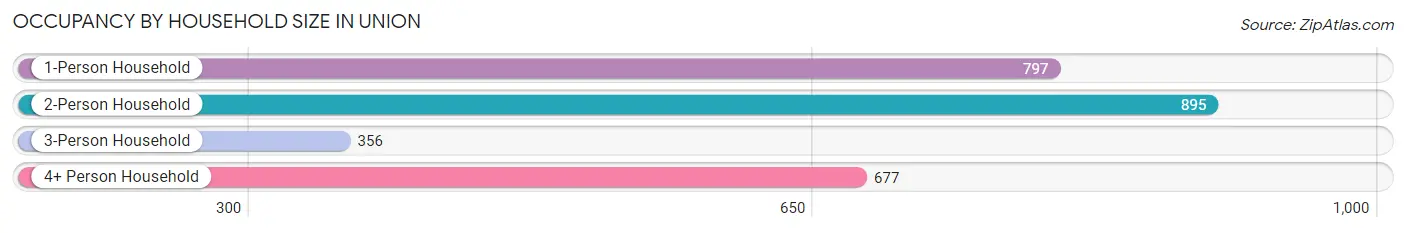
| Household Size | # Housing Units | % Housing Units |
| 1-Person Household | 797 | 29.2% |
| 2-Person Household | 895 | 32.8% |
| 3-Person Household | 356 | 13.1% |
| 4+ Person Household | 677 | 24.8% |
| Total Housing Units | 2,725 | 100.0% |
Occupancy by Ownership by Household Size in Union
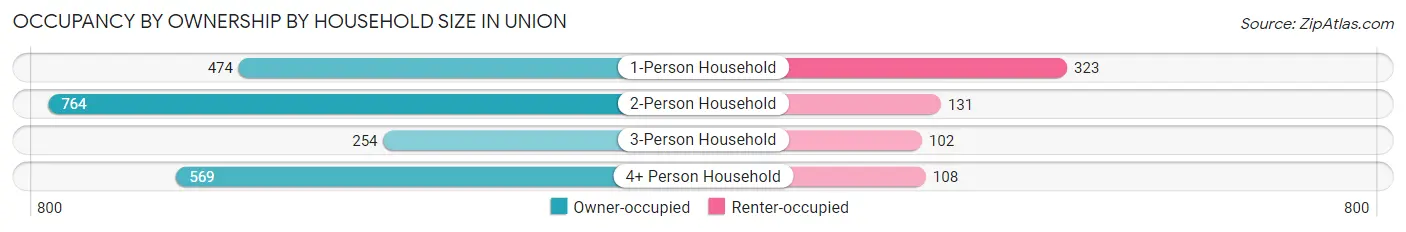
| Household Size | Owner-occupied | Renter-occupied |
| 1-Person Household | 474 (59.5%) | 323 (40.5%) |
| 2-Person Household | 764 (85.4%) | 131 (14.6%) |
| 3-Person Household | 254 (71.4%) | 102 (28.6%) |
| 4+ Person Household | 569 (84.1%) | 108 (16.0%) |
| Total Housing Units | 2,061 (75.6%) | 664 (24.4%) |
Occupancy by Educational Attainment in Union
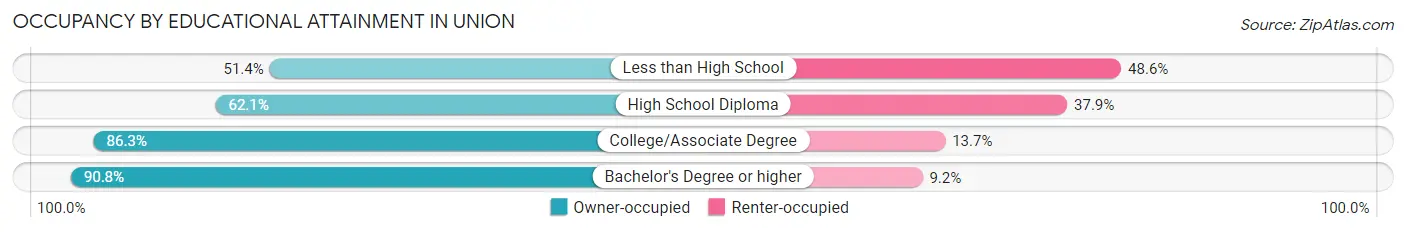
| Household Size | Owner-occupied | Renter-occupied |
| Less than High School | 36 (51.4%) | 34 (48.6%) |
| High School Diploma | 760 (62.1%) | 463 (37.9%) |
| College/Associate Degree | 681 (86.3%) | 108 (13.7%) |
| Bachelor's Degree or higher | 584 (90.8%) | 59 (9.2%) |
Occupancy by Age of Householder in Union
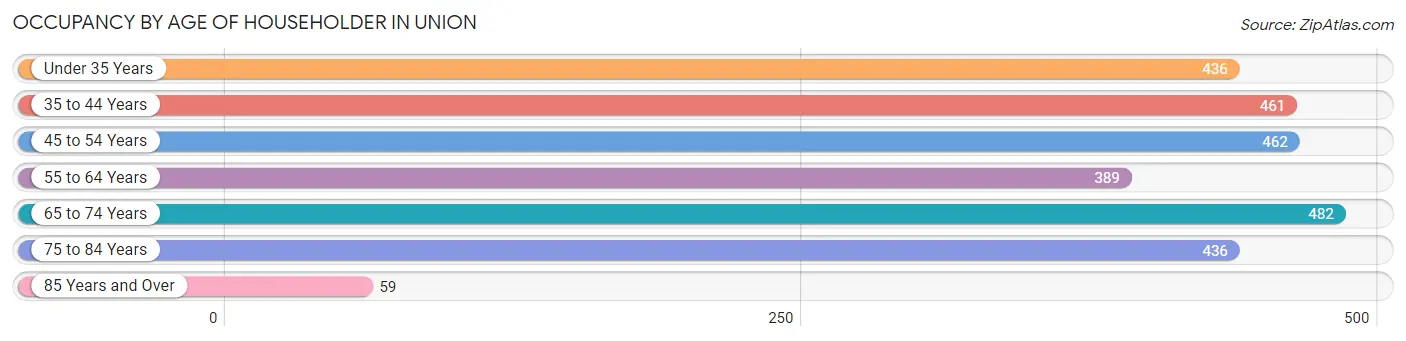
| Age Bracket | # Households | % Households |
| Under 35 Years | 436 | 16.0% |
| 35 to 44 Years | 461 | 16.9% |
| 45 to 54 Years | 462 | 17.0% |
| 55 to 64 Years | 389 | 14.3% |
| 65 to 74 Years | 482 | 17.7% |
| 75 to 84 Years | 436 | 16.0% |
| 85 Years and Over | 59 | 2.2% |
| Total | 2,725 | 100.0% |
Housing Finances in Union
Median Income by Occupancy in Union
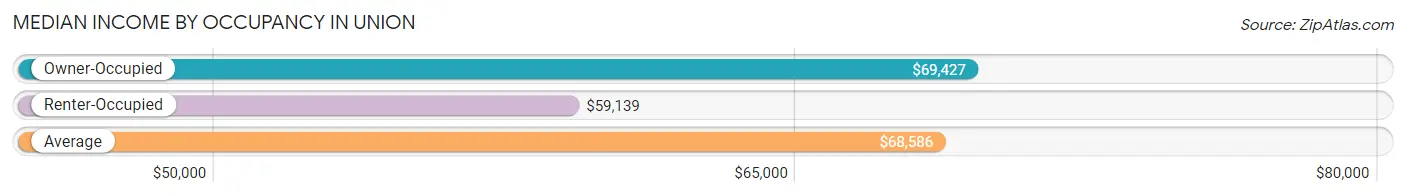
| Occupancy Type | # Households | Median Income |
| Owner-Occupied | 2,061 (75.6%) | $69,427 |
| Renter-Occupied | 664 (24.4%) | $59,139 |
| Average | 2,725 (100.0%) | $68,586 |
Occupancy by Householder Income Bracket in Union
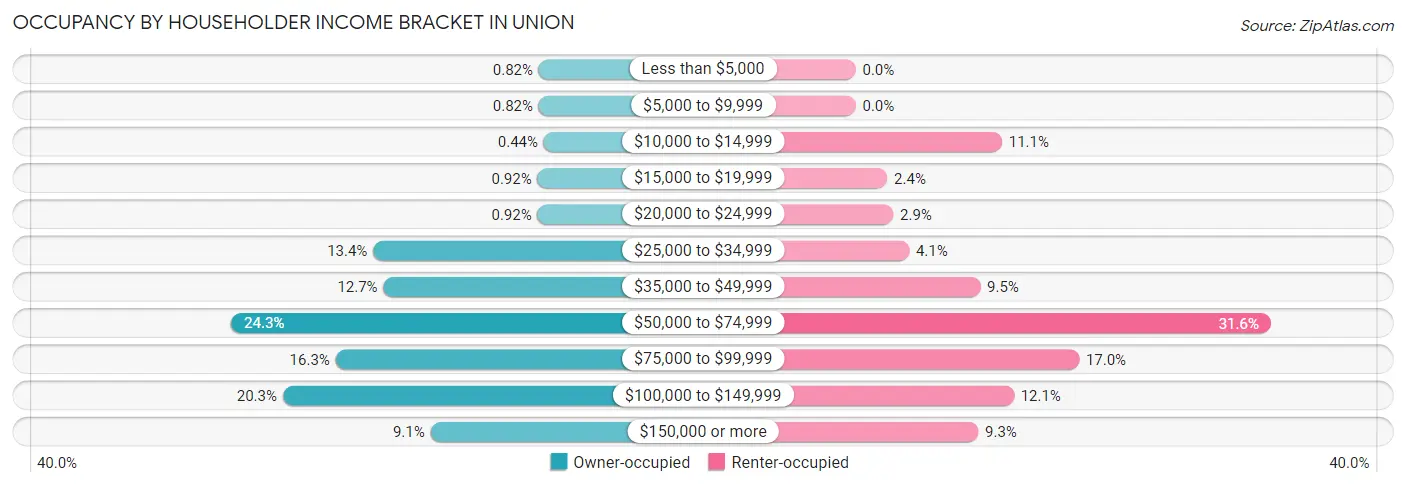
| Income Bracket | Owner-occupied | Renter-occupied |
| Less than $5,000 | 17 (0.8%) | 0 (0.0%) |
| $5,000 to $9,999 | 17 (0.8%) | 0 (0.0%) |
| $10,000 to $14,999 | 9 (0.4%) | 74 (11.1%) |
| $15,000 to $19,999 | 19 (0.9%) | 16 (2.4%) |
| $20,000 to $24,999 | 19 (0.9%) | 19 (2.9%) |
| $25,000 to $34,999 | 277 (13.4%) | 27 (4.1%) |
| $35,000 to $49,999 | 261 (12.7%) | 63 (9.5%) |
| $50,000 to $74,999 | 500 (24.3%) | 210 (31.6%) |
| $75,000 to $99,999 | 336 (16.3%) | 113 (17.0%) |
| $100,000 to $149,999 | 419 (20.3%) | 80 (12.0%) |
| $150,000 or more | 187 (9.1%) | 62 (9.3%) |
| Total | 2,061 (100.0%) | 664 (100.0%) |
Monthly Housing Cost Tiers in Union
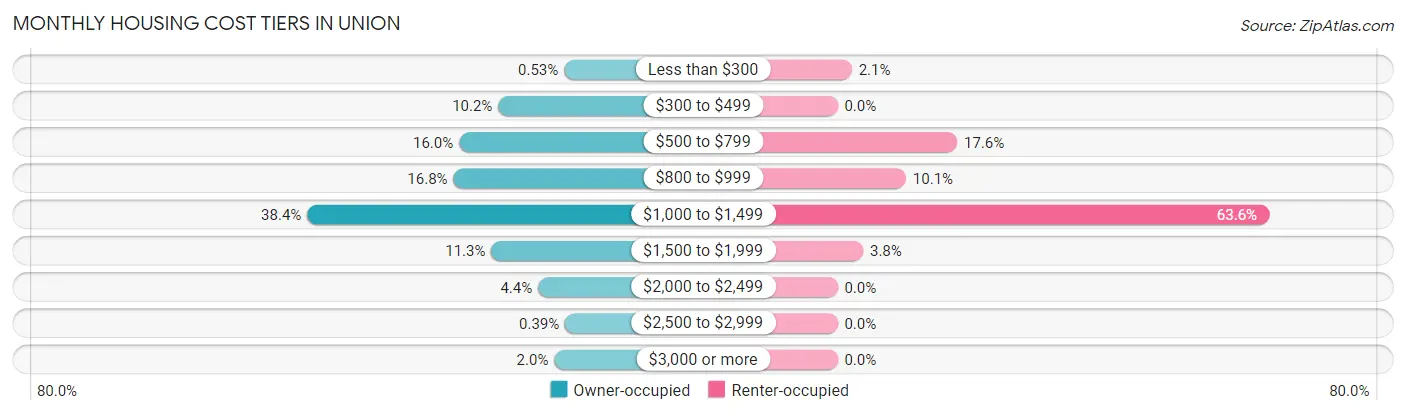
| Monthly Cost | Owner-occupied | Renter-occupied |
| Less than $300 | 11 (0.5%) | 14 (2.1%) |
| $300 to $499 | 211 (10.2%) | 0 (0.0%) |
| $500 to $799 | 330 (16.0%) | 117 (17.6%) |
| $800 to $999 | 347 (16.8%) | 67 (10.1%) |
| $1,000 to $1,499 | 791 (38.4%) | 422 (63.5%) |
| $1,500 to $1,999 | 232 (11.3%) | 25 (3.8%) |
| $2,000 to $2,499 | 90 (4.4%) | 0 (0.0%) |
| $2,500 to $2,999 | 8 (0.4%) | 0 (0.0%) |
| $3,000 or more | 41 (2.0%) | 0 (0.0%) |
| Total | 2,061 (100.0%) | 664 (100.0%) |
Physical Housing Characteristics in Union
Housing Structures in Union
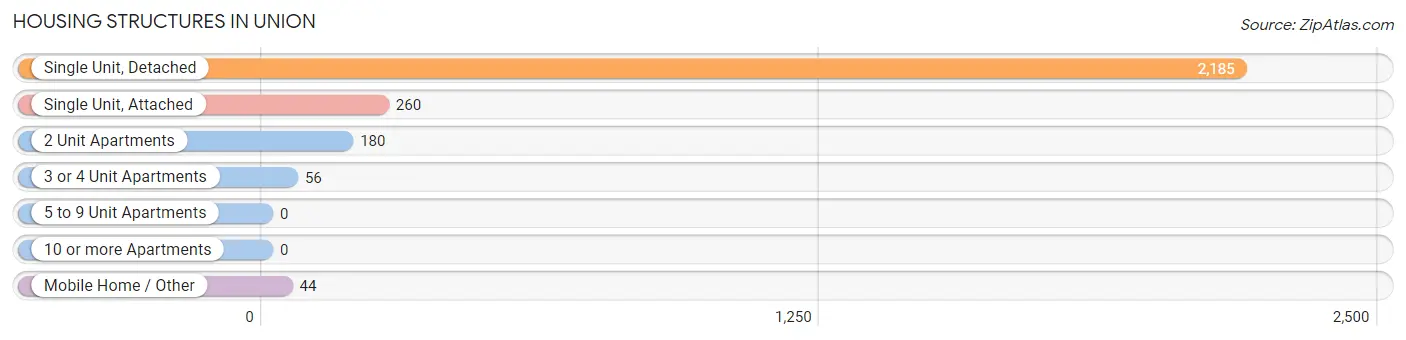
| Structure Type | # Housing Units | % Housing Units |
| Single Unit, Detached | 2,185 | 80.2% |
| Single Unit, Attached | 260 | 9.5% |
| 2 Unit Apartments | 180 | 6.6% |
| 3 or 4 Unit Apartments | 56 | 2.1% |
| 5 to 9 Unit Apartments | 0 | 0.0% |
| 10 or more Apartments | 0 | 0.0% |
| Mobile Home / Other | 44 | 1.6% |
| Total | 2,725 | 100.0% |
Housing Structures by Occupancy in Union
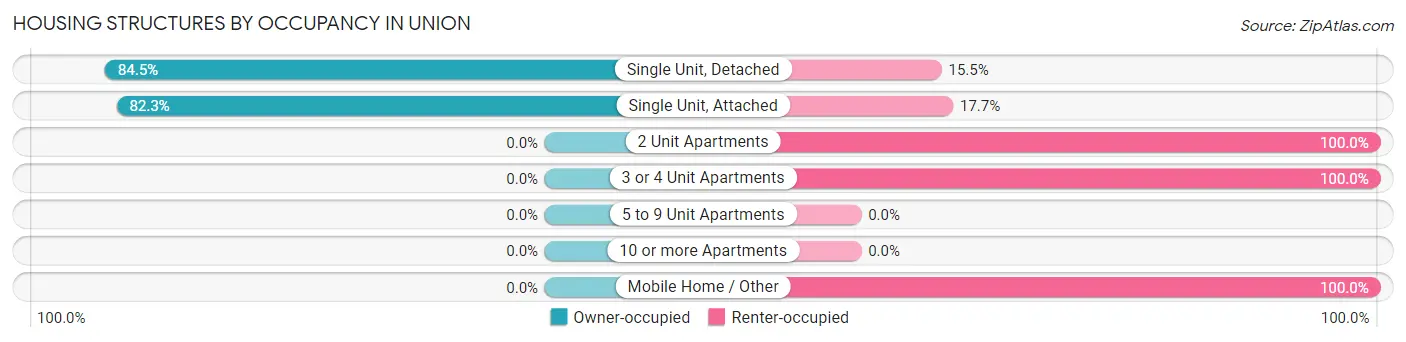
| Structure Type | Owner-occupied | Renter-occupied |
| Single Unit, Detached | 1,847 (84.5%) | 338 (15.5%) |
| Single Unit, Attached | 214 (82.3%) | 46 (17.7%) |
| 2 Unit Apartments | 0 (0.0%) | 180 (100.0%) |
| 3 or 4 Unit Apartments | 0 (0.0%) | 56 (100.0%) |
| 5 to 9 Unit Apartments | 0 (0.0%) | 0 (0.0%) |
| 10 or more Apartments | 0 (0.0%) | 0 (0.0%) |
| Mobile Home / Other | 0 (0.0%) | 44 (100.0%) |
| Total | 2,061 (75.6%) | 664 (24.4%) |
Housing Structures by Number of Rooms in Union
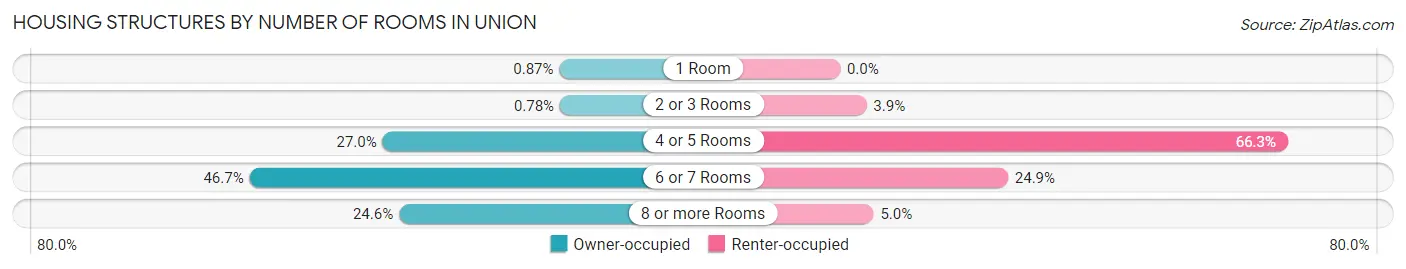
| Number of Rooms | Owner-occupied | Renter-occupied |
| 1 Room | 18 (0.9%) | 0 (0.0%) |
| 2 or 3 Rooms | 16 (0.8%) | 26 (3.9%) |
| 4 or 5 Rooms | 557 (27.0%) | 440 (66.3%) |
| 6 or 7 Rooms | 963 (46.7%) | 165 (24.8%) |
| 8 or more Rooms | 507 (24.6%) | 33 (5.0%) |
| Total | 2,061 (100.0%) | 664 (100.0%) |
Housing Structure by Heating Type in Union
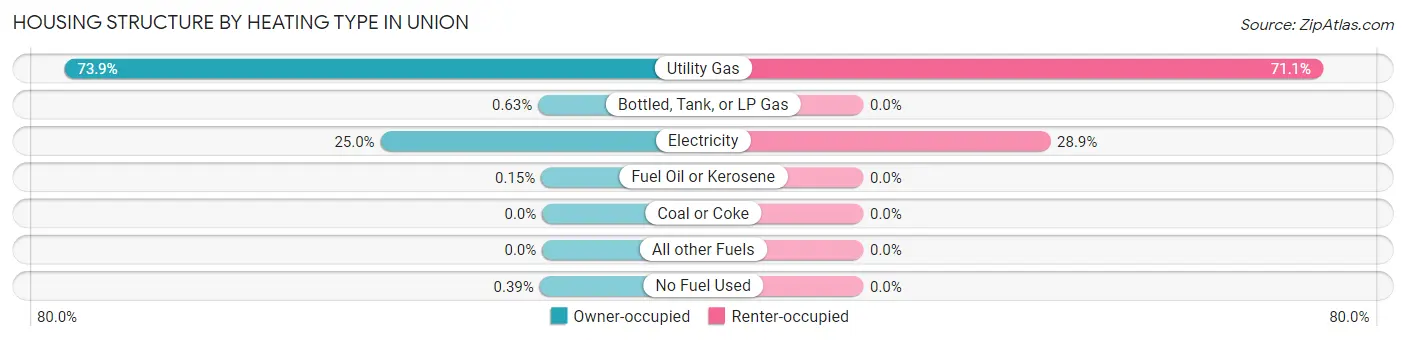
| Heating Type | Owner-occupied | Renter-occupied |
| Utility Gas | 1,522 (73.9%) | 472 (71.1%) |
| Bottled, Tank, or LP Gas | 13 (0.6%) | 0 (0.0%) |
| Electricity | 515 (25.0%) | 192 (28.9%) |
| Fuel Oil or Kerosene | 3 (0.2%) | 0 (0.0%) |
| Coal or Coke | 0 (0.0%) | 0 (0.0%) |
| All other Fuels | 0 (0.0%) | 0 (0.0%) |
| No Fuel Used | 8 (0.4%) | 0 (0.0%) |
| Total | 2,061 (100.0%) | 664 (100.0%) |
Household Vehicle Usage in Union
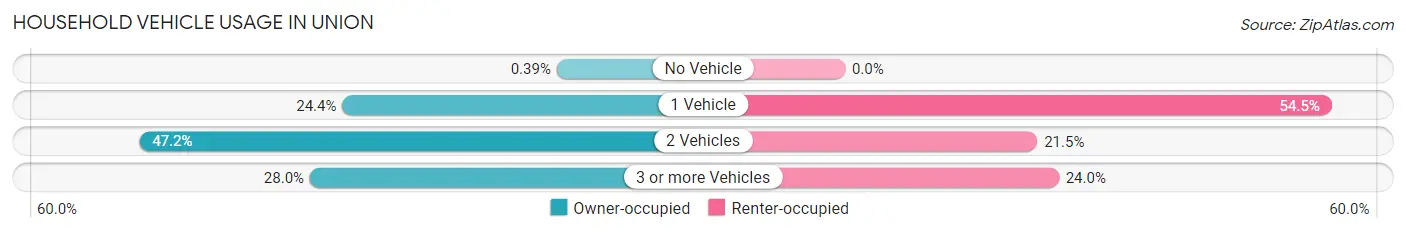
| Vehicles per Household | Owner-occupied | Renter-occupied |
| No Vehicle | 8 (0.4%) | 0 (0.0%) |
| 1 Vehicle | 503 (24.4%) | 362 (54.5%) |
| 2 Vehicles | 972 (47.2%) | 143 (21.5%) |
| 3 or more Vehicles | 578 (28.0%) | 159 (23.9%) |
| Total | 2,061 (100.0%) | 664 (100.0%) |
Real Estate & Mortgages in Union
Real Estate and Mortgage Overview in Union
| Characteristic | Without Mortgage | With Mortgage |
| Housing Units | 712 | 1,349 |
| Median Property Value | $148,800 | $120,200 |
| Median Household Income | $55,132 | $142 |
| Monthly Housing Costs | $597 | $41 |
| Real Estate Taxes | $3,500 | $64 |
Property Value by Mortgage Status in Union
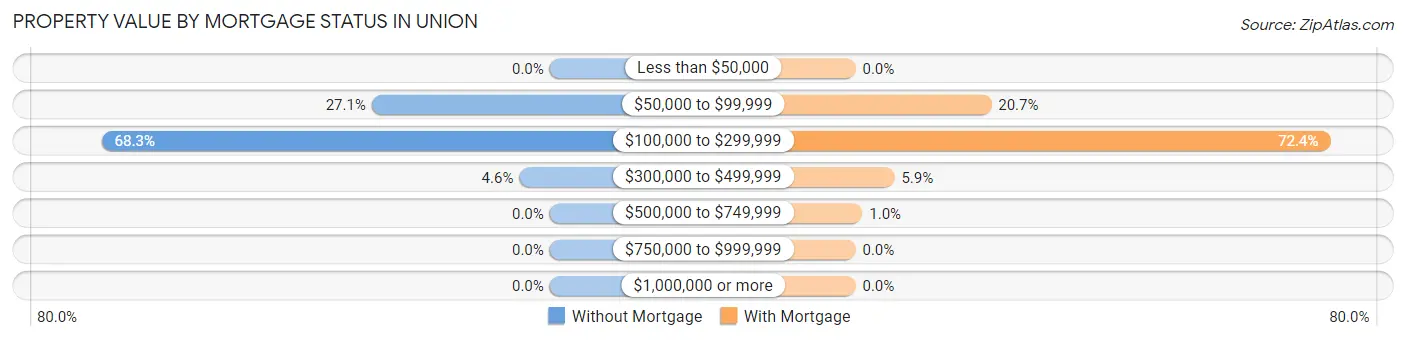
| Property Value | Without Mortgage | With Mortgage |
| Less than $50,000 | 0 (0.0%) | 0 (0.0%) |
| $50,000 to $99,999 | 193 (27.1%) | 279 (20.7%) |
| $100,000 to $299,999 | 486 (68.3%) | 976 (72.4%) |
| $300,000 to $499,999 | 33 (4.6%) | 80 (5.9%) |
| $500,000 to $749,999 | 0 (0.0%) | 14 (1.0%) |
| $750,000 to $999,999 | 0 (0.0%) | 0 (0.0%) |
| $1,000,000 or more | 0 (0.0%) | 0 (0.0%) |
| Total | 712 (100.0%) | 1,349 (100.0%) |
Household Income by Mortgage Status in Union
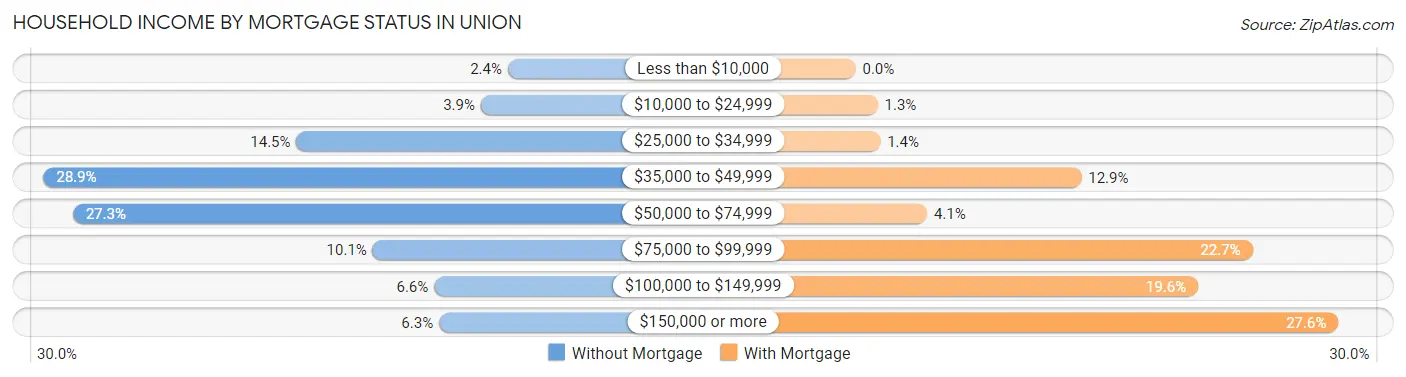
| Household Income | Without Mortgage | With Mortgage |
| Less than $10,000 | 17 (2.4%) | 0 (0.0%) |
| $10,000 to $24,999 | 28 (3.9%) | 17 (1.3%) |
| $25,000 to $34,999 | 103 (14.5%) | 19 (1.4%) |
| $35,000 to $49,999 | 206 (28.9%) | 174 (12.9%) |
| $50,000 to $74,999 | 194 (27.3%) | 55 (4.1%) |
| $75,000 to $99,999 | 72 (10.1%) | 306 (22.7%) |
| $100,000 to $149,999 | 47 (6.6%) | 264 (19.6%) |
| $150,000 or more | 45 (6.3%) | 372 (27.6%) |
| Total | 712 (100.0%) | 1,349 (100.0%) |
Property Value to Household Income Ratio in Union
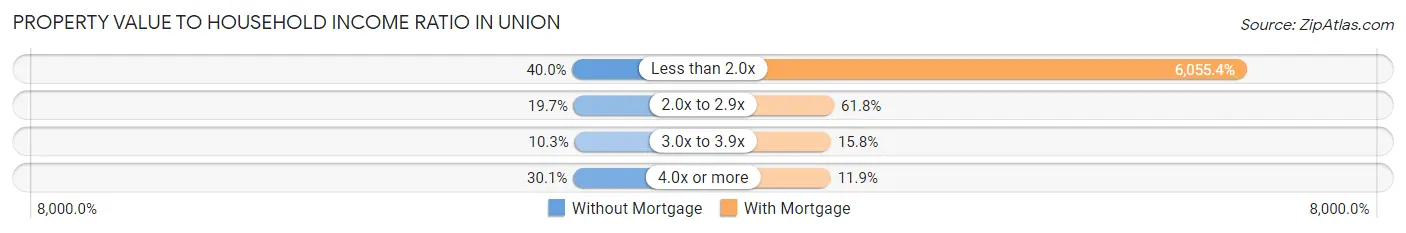
| Value-to-Income Ratio | Without Mortgage | With Mortgage |
| Less than 2.0x | 285 (40.0%) | 81,687 (6,055.4%) |
| 2.0x to 2.9x | 140 (19.7%) | 834 (61.8%) |
| 3.0x to 3.9x | 73 (10.2%) | 213 (15.8%) |
| 4.0x or more | 214 (30.1%) | 160 (11.9%) |
| Total | 712 (100.0%) | 1,349 (100.0%) |
Real Estate Taxes by Mortgage Status in Union
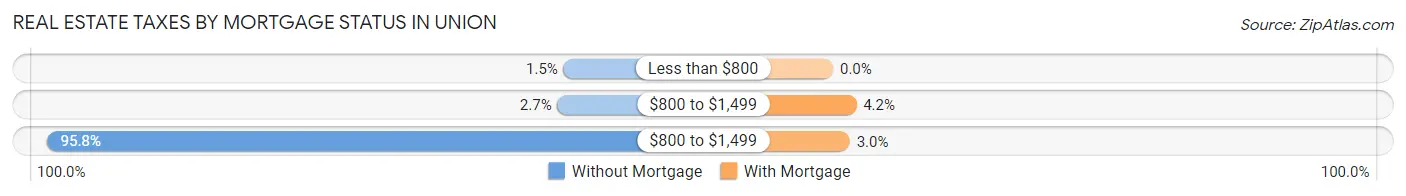
| Property Taxes | Without Mortgage | With Mortgage |
| Less than $800 | 11 (1.5%) | 0 (0.0%) |
| $800 to $1,499 | 19 (2.7%) | 57 (4.2%) |
| $800 to $1,499 | 682 (95.8%) | 41 (3.0%) |
| Total | 712 (100.0%) | 1,349 (100.0%) |
Health & Disability in Union
Health Insurance Coverage by Age in Union
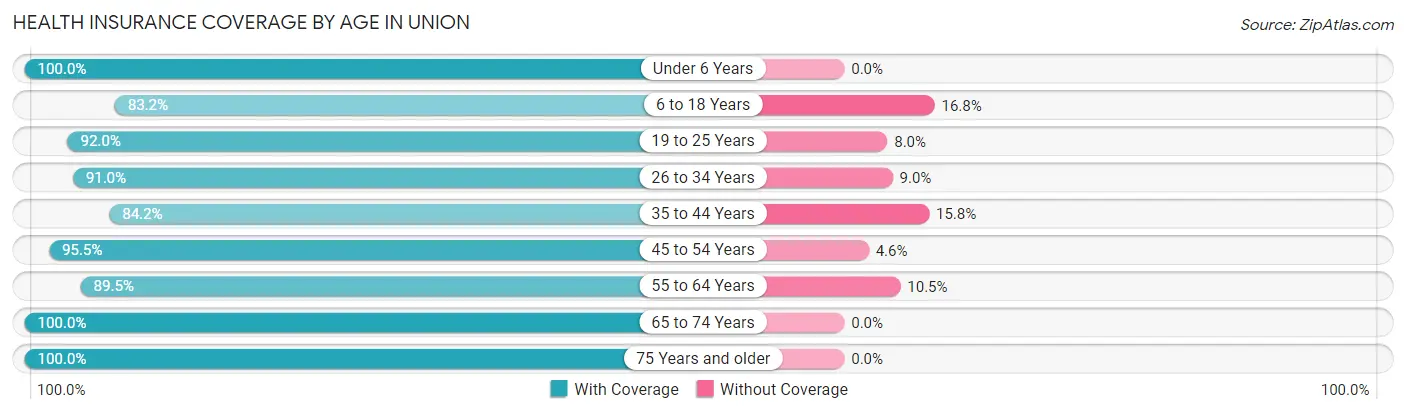
| Age Bracket | With Coverage | Without Coverage |
| Under 6 Years | 437 (100.0%) | 0 (0.0%) |
| 6 to 18 Years | 1,122 (83.2%) | 227 (16.8%) |
| 19 to 25 Years | 516 (92.0%) | 45 (8.0%) |
| 26 to 34 Years | 566 (91.0%) | 56 (9.0%) |
| 35 to 44 Years | 810 (84.2%) | 152 (15.8%) |
| 45 to 54 Years | 734 (95.5%) | 35 (4.5%) |
| 55 to 64 Years | 625 (89.5%) | 73 (10.5%) |
| 65 to 74 Years | 819 (100.0%) | 0 (0.0%) |
| 75 Years and older | 655 (100.0%) | 0 (0.0%) |
| Total | 6,284 (91.4%) | 588 (8.6%) |
Health Insurance Coverage by Citizenship Status in Union
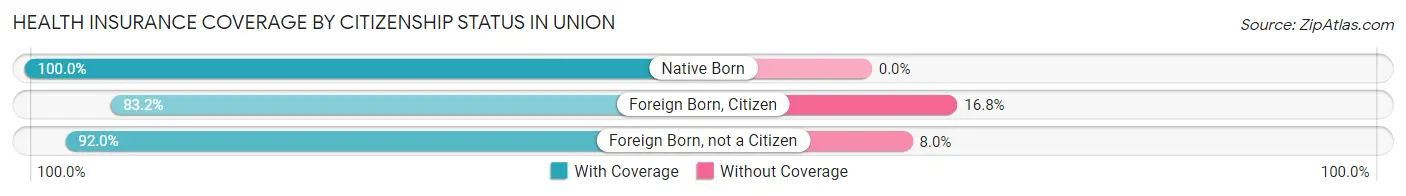
| Citizenship Status | With Coverage | Without Coverage |
| Native Born | 437 (100.0%) | 0 (0.0%) |
| Foreign Born, Citizen | 1,122 (83.2%) | 227 (16.8%) |
| Foreign Born, not a Citizen | 516 (92.0%) | 45 (8.0%) |
Health Insurance Coverage by Household Income in Union
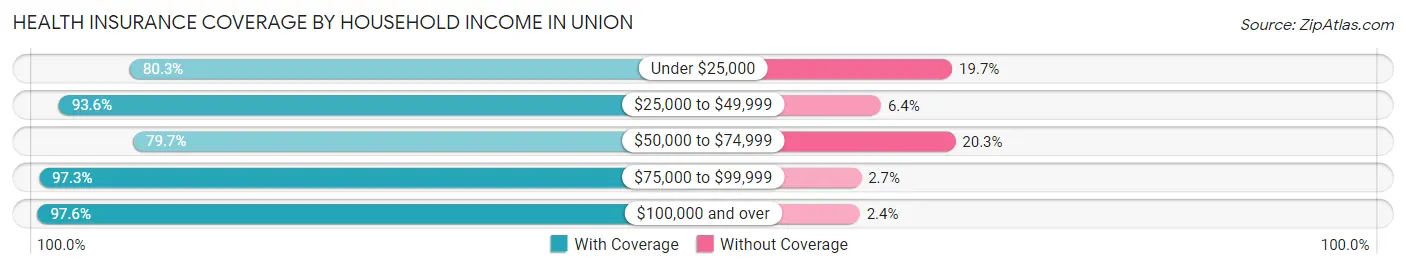
| Household Income | With Coverage | Without Coverage |
| Under $25,000 | 244 (80.3%) | 60 (19.7%) |
| $25,000 to $49,999 | 1,460 (93.6%) | 100 (6.4%) |
| $50,000 to $74,999 | 1,351 (79.7%) | 345 (20.3%) |
| $75,000 to $99,999 | 1,008 (97.3%) | 28 (2.7%) |
| $100,000 and over | 2,219 (97.6%) | 55 (2.4%) |
Public vs Private Health Insurance Coverage by Age in Union
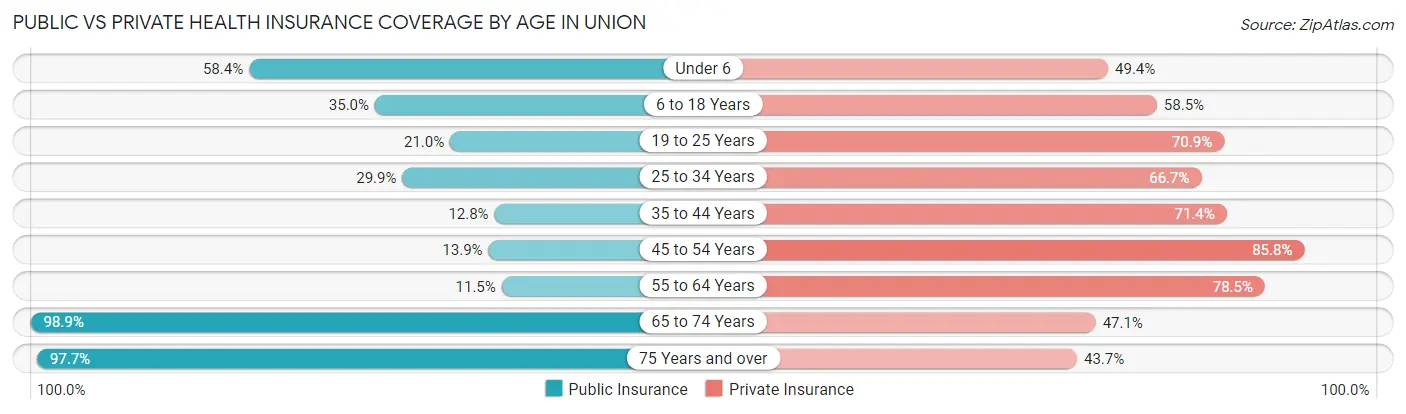
| Age Bracket | Public Insurance | Private Insurance |
| Under 6 | 255 (58.4%) | 216 (49.4%) |
| 6 to 18 Years | 472 (35.0%) | 789 (58.5%) |
| 19 to 25 Years | 118 (21.0%) | 398 (70.9%) |
| 25 to 34 Years | 186 (29.9%) | 415 (66.7%) |
| 35 to 44 Years | 123 (12.8%) | 687 (71.4%) |
| 45 to 54 Years | 107 (13.9%) | 660 (85.8%) |
| 55 to 64 Years | 80 (11.5%) | 548 (78.5%) |
| 65 to 74 Years | 810 (98.9%) | 386 (47.1%) |
| 75 Years and over | 640 (97.7%) | 286 (43.7%) |
| Total | 2,791 (40.6%) | 4,385 (63.8%) |
Disability Status by Sex by Age in Union
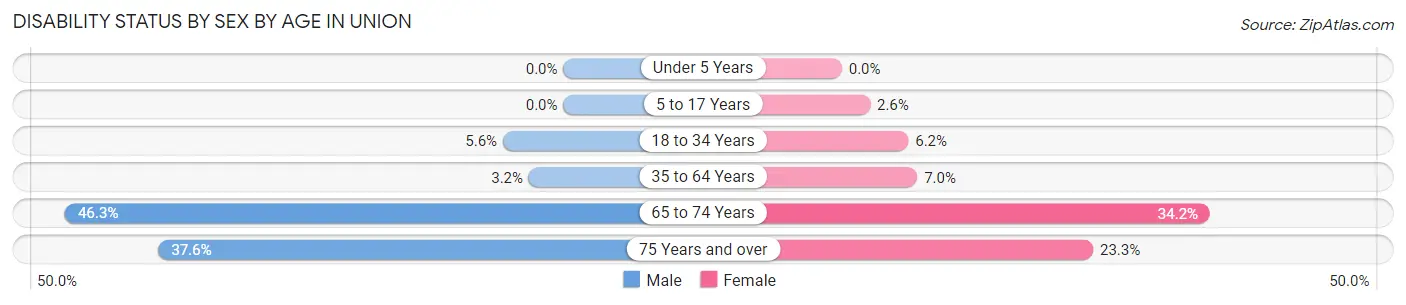
| Age Bracket | Male | Female |
| Under 5 Years | 0 (0.0%) | 0 (0.0%) |
| 5 to 17 Years | 0 (0.0%) | 17 (2.6%) |
| 18 to 34 Years | 30 (5.6%) | 40 (6.2%) |
| 35 to 64 Years | 37 (3.2%) | 89 (7.0%) |
| 65 to 74 Years | 154 (46.3%) | 166 (34.2%) |
| 75 Years and over | 106 (37.6%) | 87 (23.3%) |
Disability Class by Sex by Age in Union
Disability Class: Hearing Difficulty
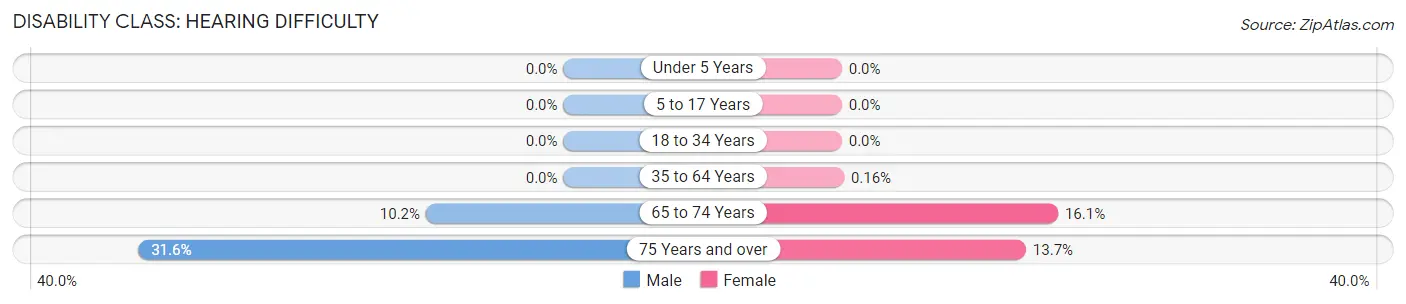
| Age Bracket | Male | Female |
| Under 5 Years | 0 (0.0%) | 0 (0.0%) |
| 5 to 17 Years | 0 (0.0%) | 0 (0.0%) |
| 18 to 34 Years | 0 (0.0%) | 0 (0.0%) |
| 35 to 64 Years | 0 (0.0%) | 2 (0.2%) |
| 65 to 74 Years | 34 (10.2%) | 78 (16.1%) |
| 75 Years and over | 89 (31.6%) | 51 (13.7%) |
Disability Class: Vision Difficulty
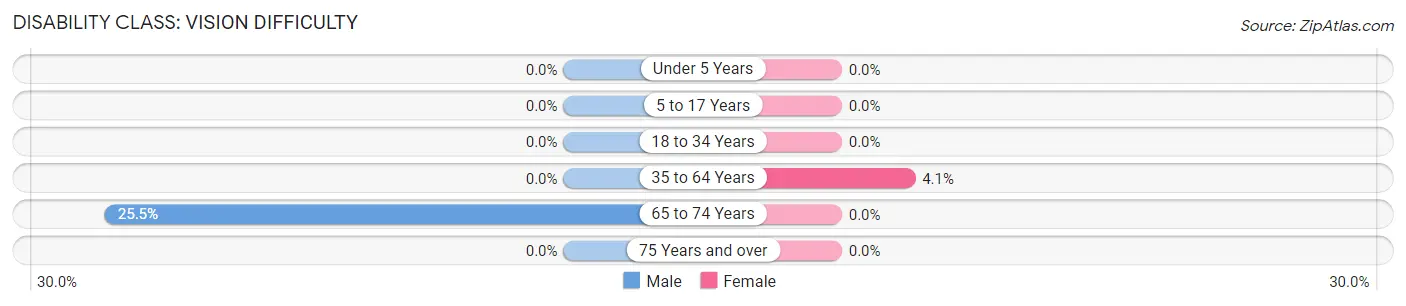
| Age Bracket | Male | Female |
| Under 5 Years | 0 (0.0%) | 0 (0.0%) |
| 5 to 17 Years | 0 (0.0%) | 0 (0.0%) |
| 18 to 34 Years | 0 (0.0%) | 0 (0.0%) |
| 35 to 64 Years | 0 (0.0%) | 52 (4.1%) |
| 65 to 74 Years | 85 (25.5%) | 0 (0.0%) |
| 75 Years and over | 0 (0.0%) | 0 (0.0%) |
Disability Class: Cognitive Difficulty
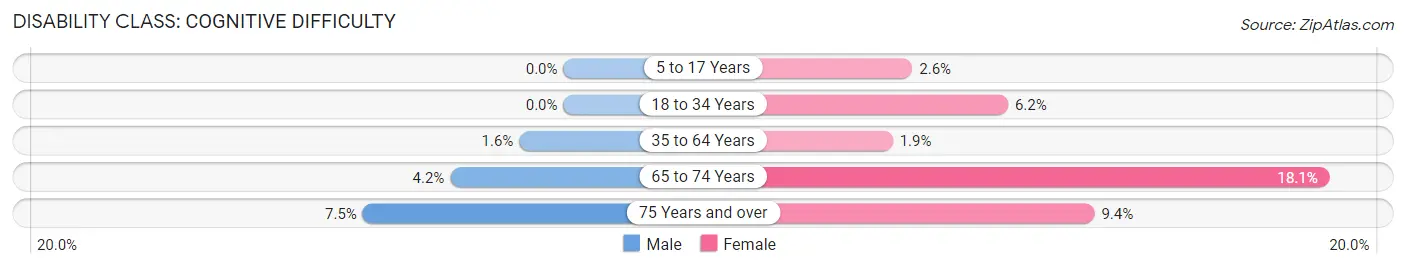
| Age Bracket | Male | Female |
| 5 to 17 Years | 0 (0.0%) | 17 (2.6%) |
| 18 to 34 Years | 0 (0.0%) | 40 (6.2%) |
| 35 to 64 Years | 19 (1.6%) | 24 (1.9%) |
| 65 to 74 Years | 14 (4.2%) | 88 (18.1%) |
| 75 Years and over | 21 (7.4%) | 35 (9.4%) |
Disability Class: Ambulatory Difficulty
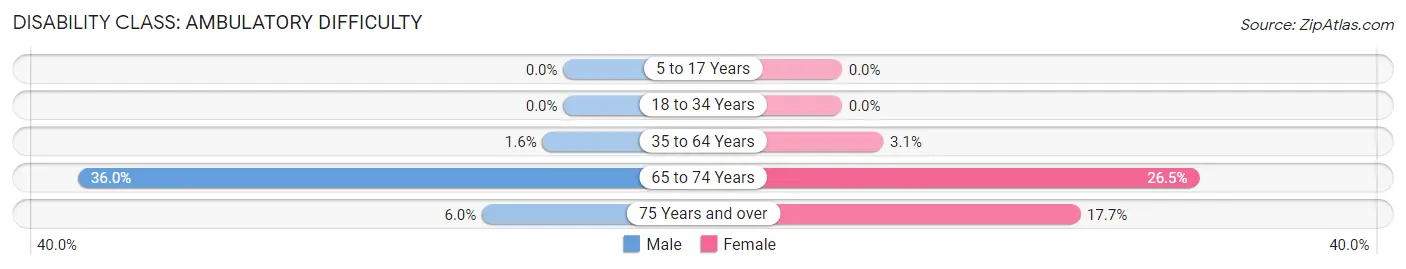
| Age Bracket | Male | Female |
| 5 to 17 Years | 0 (0.0%) | 0 (0.0%) |
| 18 to 34 Years | 0 (0.0%) | 0 (0.0%) |
| 35 to 64 Years | 18 (1.5%) | 39 (3.1%) |
| 65 to 74 Years | 120 (36.0%) | 129 (26.5%) |
| 75 Years and over | 17 (6.0%) | 66 (17.7%) |
Disability Class: Self-Care Difficulty
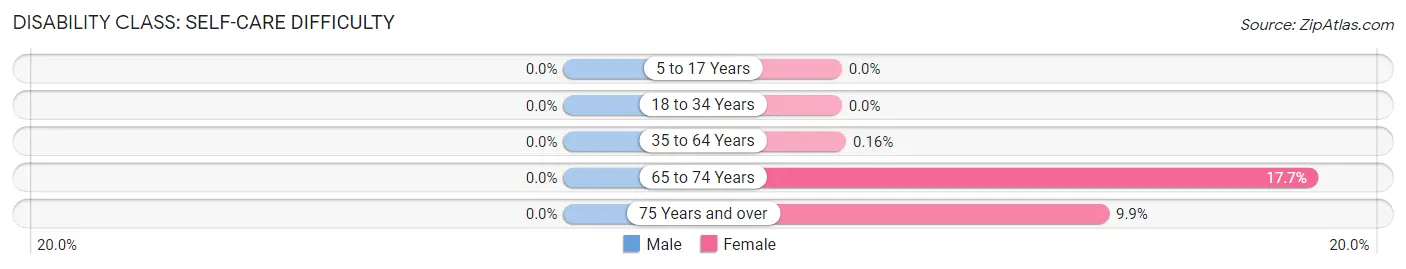
| Age Bracket | Male | Female |
| 5 to 17 Years | 0 (0.0%) | 0 (0.0%) |
| 18 to 34 Years | 0 (0.0%) | 0 (0.0%) |
| 35 to 64 Years | 0 (0.0%) | 2 (0.2%) |
| 65 to 74 Years | 0 (0.0%) | 86 (17.7%) |
| 75 Years and over | 0 (0.0%) | 37 (9.9%) |
Technology Access in Union
Computing Device Access in Union
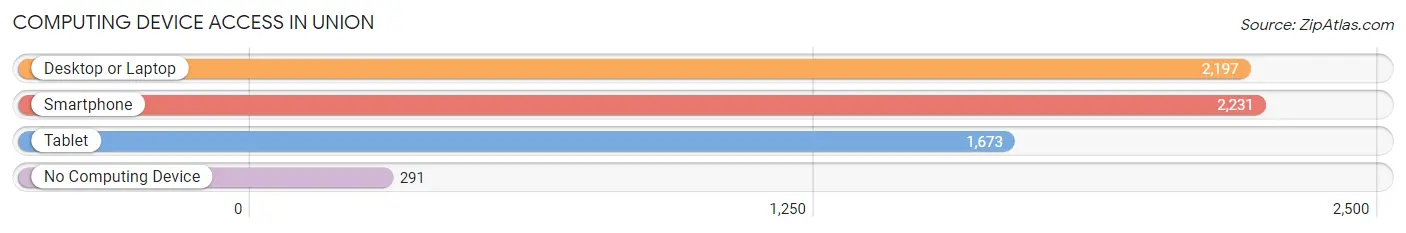
| Device Type | # Households | % Households |
| Desktop or Laptop | 2,197 | 80.6% |
| Smartphone | 2,231 | 81.9% |
| Tablet | 1,673 | 61.4% |
| No Computing Device | 291 | 10.7% |
| Total | 2,725 | 100.0% |
Internet Access in Union
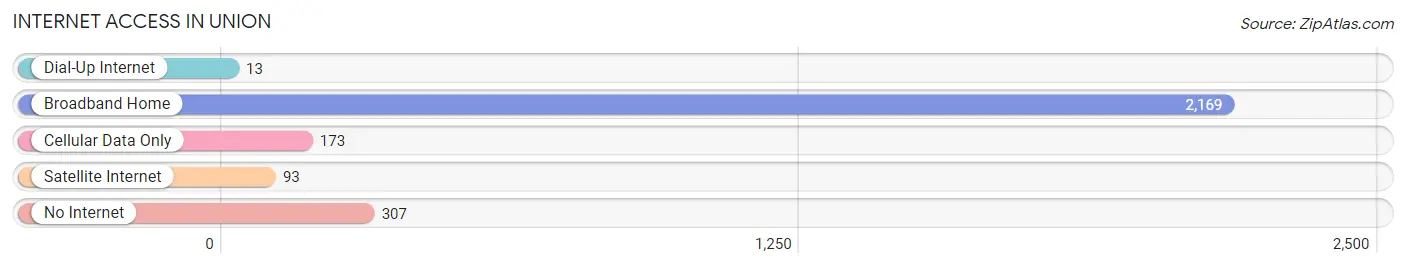
| Internet Type | # Households | % Households |
| Dial-Up Internet | 13 | 0.5% |
| Broadband Home | 2,169 | 79.6% |
| Cellular Data Only | 173 | 6.4% |
| Satellite Internet | 93 | 3.4% |
| No Internet | 307 | 11.3% |
| Total | 2,725 | 100.0% |
Union Summary
Union, Ohio is a small city located in the southwestern corner of the state, in the county of Montgomery. It is situated along the Great Miami River, and is part of the Dayton metropolitan area. The city has a population of approximately 8,000 people, and is known for its small-town charm and friendly atmosphere.
History
Union was founded in 1805 by a group of settlers from Union County, New Jersey. The town was named after the county in New Jersey, and was originally part of the Miami Purchase. The town was incorporated in 1845, and was the first town in Montgomery County to be incorporated.
In the late 19th century, Union was a thriving agricultural community, with a variety of crops being grown in the area. The town was also home to several mills, including a flour mill, a saw mill, and a grist mill.
In the early 20th century, Union began to experience a period of growth and development. The town was connected to the rest of the state by the Dayton and Union Railway, and the town's population began to grow. The town was also home to several factories, including a paper mill, a shoe factory, and a furniture factory.
Geography
Union is located in the southwestern corner of Ohio, in the county of Montgomery. The city is situated along the Great Miami River, and is part of the Dayton metropolitan area. The city has a total area of 4.2 square miles, all of which is land.
The city is located in a humid continental climate zone, with hot summers and cold winters. The average temperature in the summer is around 75 degrees Fahrenheit, and the average temperature in the winter is around 30 degrees Fahrenheit.
Economy
Union's economy is largely based on manufacturing and retail. The city is home to several factories, including a paper mill, a shoe factory, and a furniture factory. The city is also home to several retail stores, including a grocery store, a hardware store, and a variety of other shops.
The city is also home to several small businesses, including restaurants, bars, and other service-oriented businesses. The city is also home to several medical facilities, including a hospital and several clinics.
Demographics
As of the 2010 census, the population of Union was 8,000 people. The racial makeup of the city was 87.3% White, 8.2% African American, 0.3% Native American, 0.7% Asian, 0.1% Pacific Islander, and 2.4% from other races. The median household income was $41,000, and the median family income was $50,000.
The city is home to a variety of religious denominations, including Catholic, Protestant, and Jewish. The city is also home to a variety of ethnicities, including German, Irish, and Italian.
Conclusion
Union, Ohio is a small city located in the southwestern corner of the state, in the county of Montgomery. It is situated along the Great Miami River, and is part of the Dayton metropolitan area. The city has a population of approximately 8,000 people, and is known for its small-town charm and friendly atmosphere. The city's economy is largely based on manufacturing and retail, and the city is home to a variety of religious denominations and ethnicities.
Common Questions
What is Per Capita Income in Union?
Per Capita income in Union is $32,459.
What is the Median Family Income in Union?
Median Family Income in Union is $76,661.
What is the Median Household income in Union?
Median Household Income in Union is $68,586.
What is Income or Wage Gap in Union?
Income or Wage Gap in Union is 27.3%.
Women in Union earn 72.7 cents for every dollar earned by a man.
What is Inequality or Gini Index in Union?
Inequality or Gini Index in Union is 0.34.
What is the Total Population of Union?
Total Population of Union is 6,894.
What is the Total Male Population of Union?
Total Male Population of Union is 3,295.
What is the Total Female Population of Union?
Total Female Population of Union is 3,599.
What is the Ratio of Males per 100 Females in Union?
There are 91.55 Males per 100 Females in Union.
What is the Ratio of Females per 100 Males in Union?
There are 109.23 Females per 100 Males in Union.
What is the Median Population Age in Union?
Median Population Age in Union is 37.2 Years.
What is the Average Family Size in Union
Average Family Size in Union is 3.3 People.
What is the Average Household Size in Union
Average Household Size in Union is 2.5 People.
How Large is the Labor Force in Union?
There are 3,549 People in the Labor Forcein in Union.
What is the Percentage of People in the Labor Force in Union?
67.5% of People are in the Labor Force in Union.
What is the Unemployment Rate in Union?
Unemployment Rate in Union is 2.9%.