Rose Farm, OH Map & Demographics
Rose Farm Map
Rose Farm Overview
$19,809
PER CAPITA INCOME
0.36
INEQUALITY / GINI INDEX
93
TOTAL POPULATION
48
MALE POPULATION
45
FEMALE POPULATION
106.67
MALES / 100 FEMALES
93.75
FEMALES / 100 MALES
31.8
MEDIAN AGE
2.4
AVG FAMILY SIZE
1.4
AVG HOUSEHOLD SIZE
52
LABOR FORCE [ PEOPLE ]
62.7%
PERCENT IN LABOR FORCE
Income in Rose Farm
Income Overview in Rose Farm
| Characteristic | Number | Measure |
| Per Capita Income | 93 | $19,809 |
| Median Family Income | 7 | $0 |
| Mean Family Income | 7 | $0 |
| Median Household Income | 64 | $0 |
| Mean Household Income | 64 | $29,078 |
| Income Deficit | 7 | $0 |
| Wage / Income Gap (%) | 93 | 0.00% |
| Wage / Income Gap ($) | 93 | 100.00¢ per $1 |
| Gini / Inequality Index | 93 | 0.36 |
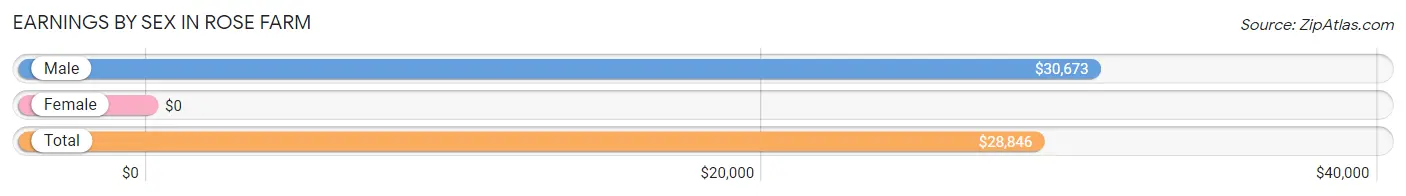
Earnings by Sex in Rose Farm
| Sex | Number | Average Earnings |
| Male | 33 (63.5%) | $30,673 |
| Female | 19 (36.5%) | $0 |
| Total | 52 (100.0%) | $28,846 |
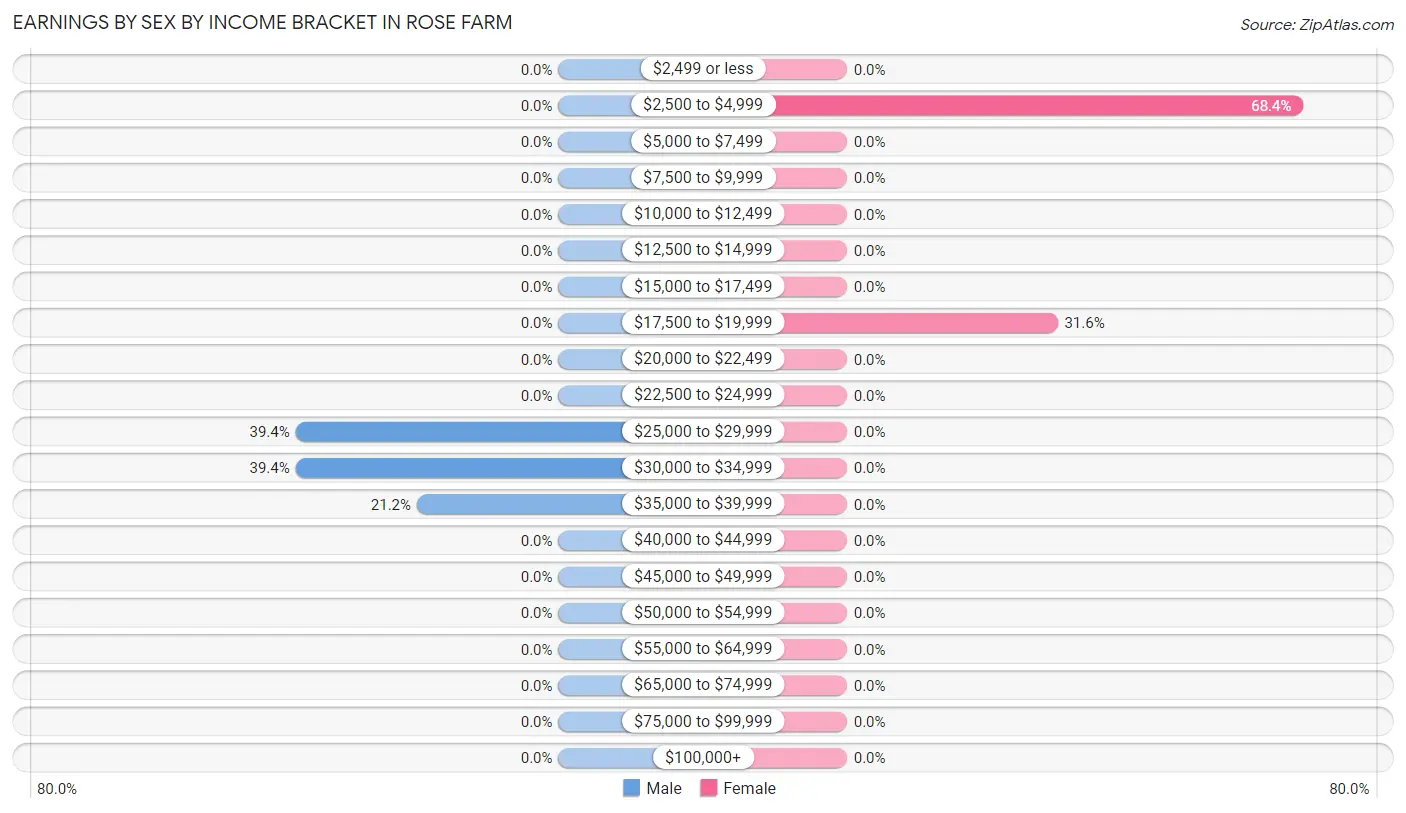
Earnings by Sex by Income Bracket in Rose Farm
The most common earnings brackets in Rose Farm are $25,000 to $29,999 for men (13 | 39.4%) and $2,500 to $4,999 for women (13 | 68.4%).
| Income | Male | Female |
| $2,499 or less | 0 (0.0%) | 0 (0.0%) |
| $2,500 to $4,999 | 0 (0.0%) | 13 (68.4%) |
| $5,000 to $7,499 | 0 (0.0%) | 0 (0.0%) |
| $7,500 to $9,999 | 0 (0.0%) | 0 (0.0%) |
| $10,000 to $12,499 | 0 (0.0%) | 0 (0.0%) |
| $12,500 to $14,999 | 0 (0.0%) | 0 (0.0%) |
| $15,000 to $17,499 | 0 (0.0%) | 0 (0.0%) |
| $17,500 to $19,999 | 0 (0.0%) | 6 (31.6%) |
| $20,000 to $22,499 | 0 (0.0%) | 0 (0.0%) |
| $22,500 to $24,999 | 0 (0.0%) | 0 (0.0%) |
| $25,000 to $29,999 | 13 (39.4%) | 0 (0.0%) |
| $30,000 to $34,999 | 13 (39.4%) | 0 (0.0%) |
| $35,000 to $39,999 | 7 (21.2%) | 0 (0.0%) |
| $40,000 to $44,999 | 0 (0.0%) | 0 (0.0%) |
| $45,000 to $49,999 | 0 (0.0%) | 0 (0.0%) |
| $50,000 to $54,999 | 0 (0.0%) | 0 (0.0%) |
| $55,000 to $64,999 | 0 (0.0%) | 0 (0.0%) |
| $65,000 to $74,999 | 0 (0.0%) | 0 (0.0%) |
| $75,000 to $99,999 | 0 (0.0%) | 0 (0.0%) |
| $100,000+ | 0 (0.0%) | 0 (0.0%) |
| Total | 33 (100.0%) | 19 (100.0%) |
Earnings by Sex by Educational Attainment in Rose Farm
| Educational Attainment | Male Income | Female Income |
| Less than High School | - | - |
| High School Diploma | - | - |
| College or Associate's Degree | - | - |
| Bachelor's Degree | - | - |
| Graduate Degree | - | - |
| Total | $30,673 | $0 |
Family Income in Rose Farm
Family Income Brackets in Rose Farm
According to the Rose Farm family income data, there are 7 families falling into the $35,000 to $49,999 income range, which is the most common income bracket and makes up 100.0% of all families.
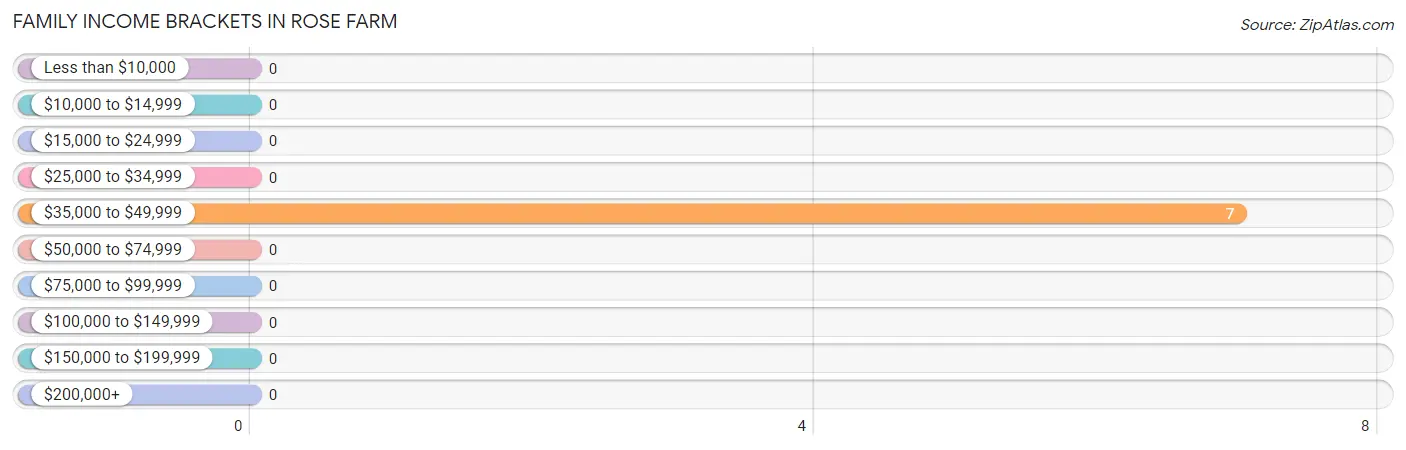
| Income Bracket | # Families | % Families |
| Less than $10,000 | 0 | 0.0% |
| $10,000 to $14,999 | 0 | 0.0% |
| $15,000 to $24,999 | 0 | 0.0% |
| $25,000 to $34,999 | 0 | 0.0% |
| $35,000 to $49,999 | 7 | 100.0% |
| $50,000 to $74,999 | 0 | 0.0% |
| $75,000 to $99,999 | 0 | 0.0% |
| $100,000 to $149,999 | 0 | 0.0% |
| $150,000 to $199,999 | 0 | 0.0% |
| $200,000+ | 0 | 0.0% |
Family Income by Famaliy Size in Rose Farm
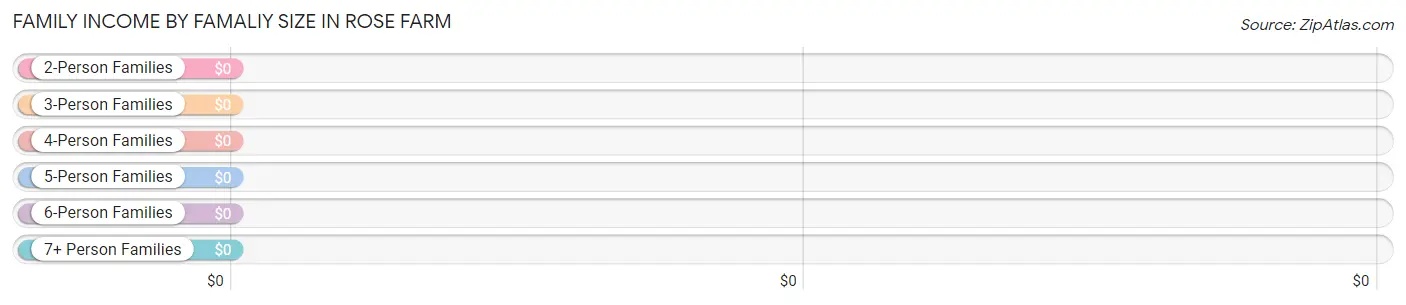
| Income Bracket | # Families | Median Income |
| 2-Person Families | 0 (0.0%) | $0 |
| 3-Person Families | 7 (100.0%) | $0 |
| 4-Person Families | 0 (0.0%) | $0 |
| 5-Person Families | 0 (0.0%) | $0 |
| 6-Person Families | 0 (0.0%) | $0 |
| 7+ Person Families | 0 (0.0%) | $0 |
| Total | 7 (100.0%) | $0 |
Family Income by Number of Earners in Rose Farm
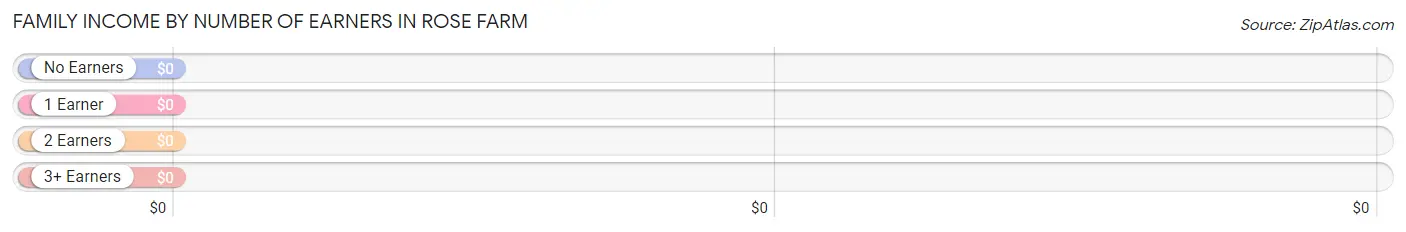
| Number of Earners | # Families | Median Income |
| No Earners | 0 (0.0%) | $0 |
| 1 Earner | 7 (100.0%) | $0 |
| 2 Earners | 0 (0.0%) | $0 |
| 3+ Earners | 0 (0.0%) | $0 |
| Total | 7 (100.0%) | $0 |
Household Income in Rose Farm
Household Income Brackets in Rose Farm
With 20 households falling in the category, the $50,000 to $74,999 income range is the most frequent in Rose Farm, accounting for 31.2% of all households.
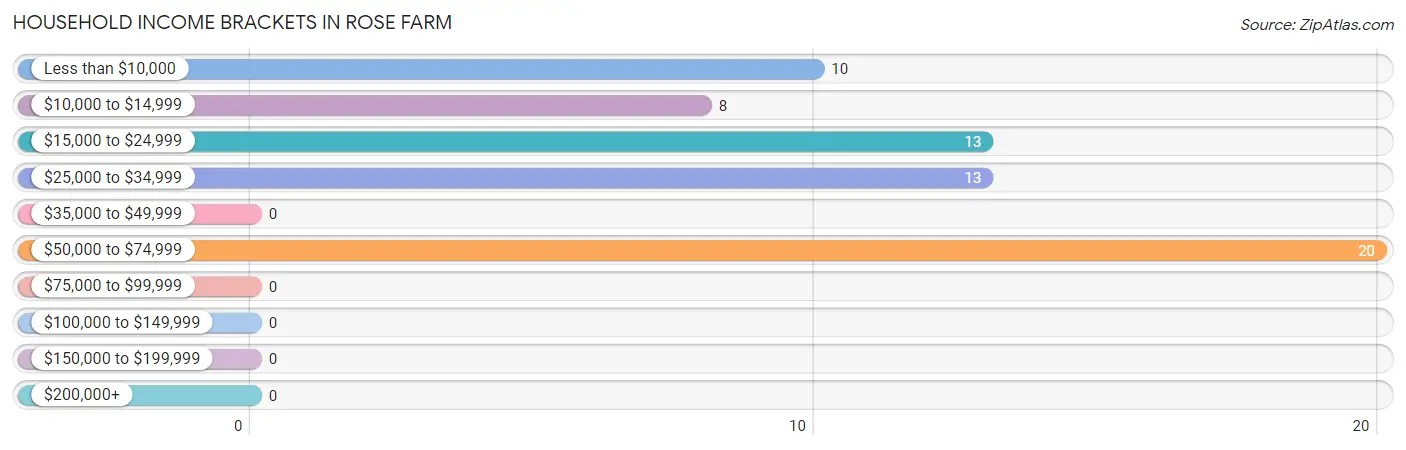
| Income Bracket | # Households | % Households |
| Less than $10,000 | 10 | 15.6% |
| $10,000 to $14,999 | 8 | 12.5% |
| $15,000 to $24,999 | 13 | 20.3% |
| $25,000 to $34,999 | 13 | 20.3% |
| $35,000 to $49,999 | 0 | 0.0% |
| $50,000 to $74,999 | 20 | 31.3% |
| $75,000 to $99,999 | 0 | 0.0% |
| $100,000 to $149,999 | 0 | 0.0% |
| $150,000 to $199,999 | 0 | 0.0% |
| $200,000+ | 0 | 0.0% |
Household Income by Householder Age in Rose Farm
The median household income in Rose Farm is $0, with the highest median household income of $53,173 found in the 25 to 44 years age bracket for the primary householder. A total of 33 households (51.6%) fall into this category.
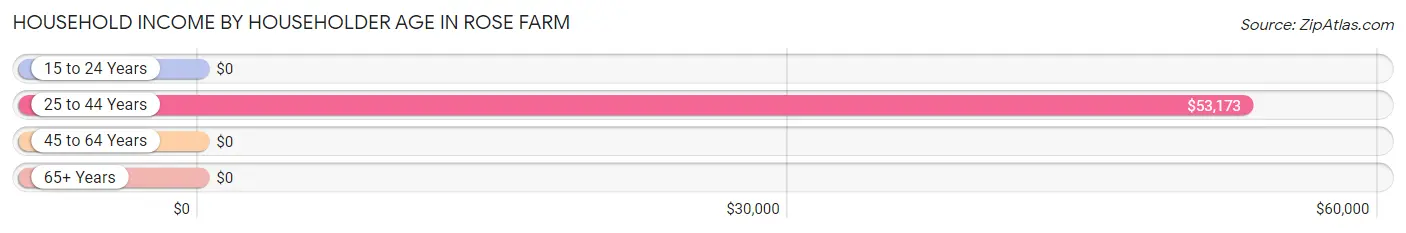
| Income Bracket | # Households | Median Income |
| 15 to 24 Years | 0 (0.0%) | $0 |
| 25 to 44 Years | 33 (51.6%) | $53,173 |
| 45 to 64 Years | 8 (12.5%) | $0 |
| 65+ Years | 23 (35.9%) | $0 |
| Total | 64 (100.0%) | $0 |
Poverty in Rose Farm
Income Below Poverty by Sex and Age in Rose Farm
With 16.7% poverty level for males and 22.2% for females among the residents of Rose Farm, 45 to 54 year old males and 75 year old and over females are the most vulnerable to poverty, with 8 males (100.0%) and 10 females (50.0%) in their respective age groups living below the poverty level.
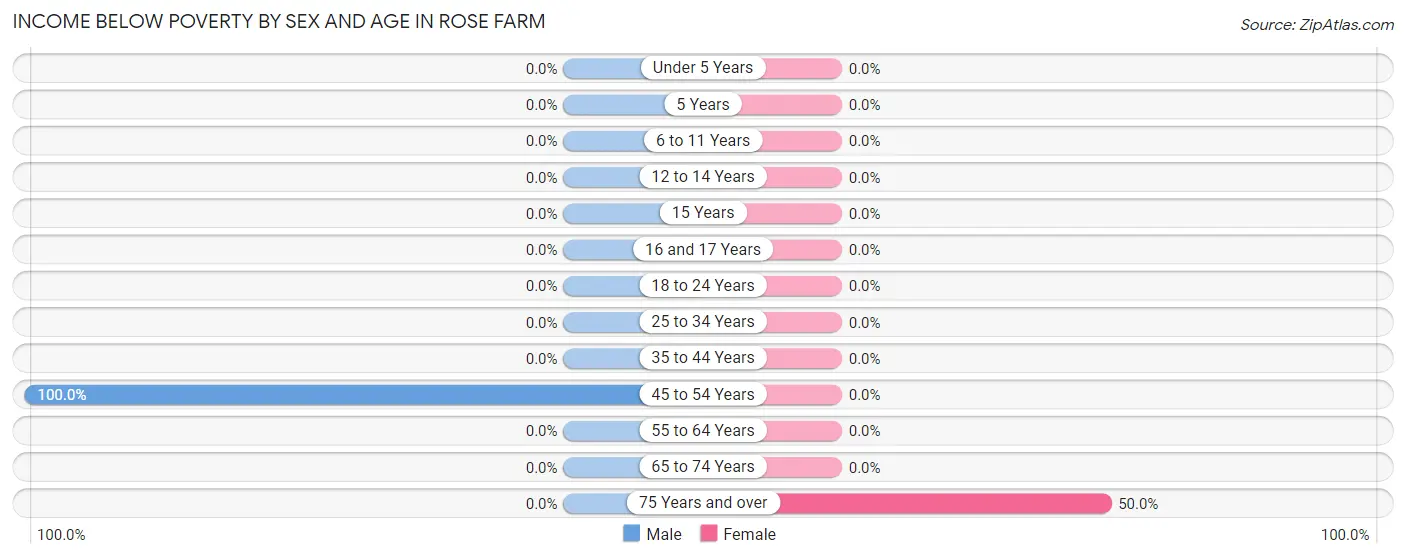
| Age Bracket | Male | Female |
| Under 5 Years | 0 (0.0%) | 0 (0.0%) |
| 5 Years | 0 (0.0%) | 0 (0.0%) |
| 6 to 11 Years | 0 (0.0%) | 0 (0.0%) |
| 12 to 14 Years | 0 (0.0%) | 0 (0.0%) |
| 15 Years | 0 (0.0%) | 0 (0.0%) |
| 16 and 17 Years | 0 (0.0%) | 0 (0.0%) |
| 18 to 24 Years | 0 (0.0%) | 0 (0.0%) |
| 25 to 34 Years | 0 (0.0%) | 0 (0.0%) |
| 35 to 44 Years | 0 (0.0%) | 0 (0.0%) |
| 45 to 54 Years | 8 (100.0%) | 0 (0.0%) |
| 55 to 64 Years | 0 (0.0%) | 0 (0.0%) |
| 65 to 74 Years | 0 (0.0%) | 0 (0.0%) |
| 75 Years and over | 0 (0.0%) | 10 (50.0%) |
| Total | 8 (16.7%) | 10 (22.2%) |
Income Above Poverty by Sex and Age in Rose Farm
According to the poverty statistics in Rose Farm, males aged under 5 years and females aged under 5 years are the age groups that are most secure financially, with 100.0% of males and 100.0% of females in these age groups living above the poverty line.
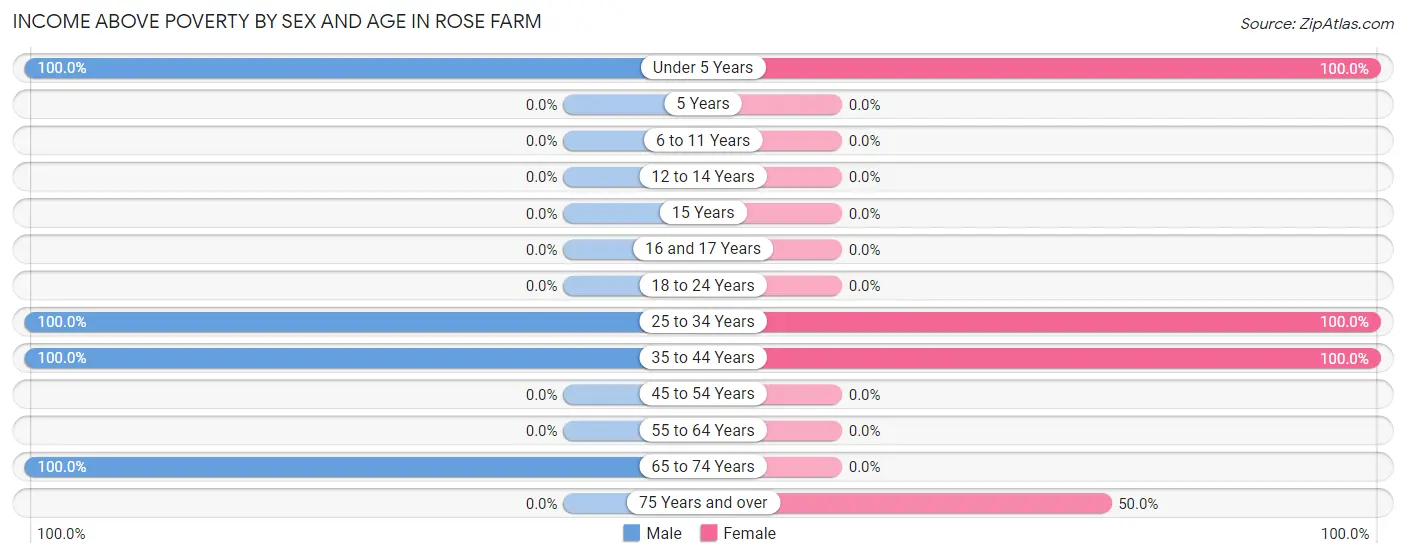
| Age Bracket | Male | Female |
| Under 5 Years | 4 (100.0%) | 6 (100.0%) |
| 5 Years | 0 (0.0%) | 0 (0.0%) |
| 6 to 11 Years | 0 (0.0%) | 0 (0.0%) |
| 12 to 14 Years | 0 (0.0%) | 0 (0.0%) |
| 15 Years | 0 (0.0%) | 0 (0.0%) |
| 16 and 17 Years | 0 (0.0%) | 0 (0.0%) |
| 18 to 24 Years | 0 (0.0%) | 0 (0.0%) |
| 25 to 34 Years | 26 (100.0%) | 13 (100.0%) |
| 35 to 44 Years | 7 (100.0%) | 6 (100.0%) |
| 45 to 54 Years | 0 (0.0%) | 0 (0.0%) |
| 55 to 64 Years | 0 (0.0%) | 0 (0.0%) |
| 65 to 74 Years | 3 (100.0%) | 0 (0.0%) |
| 75 Years and over | 0 (0.0%) | 10 (50.0%) |
| Total | 40 (83.3%) | 35 (77.8%) |
Income Below Poverty Among Married-Couple Families in Rose Farm
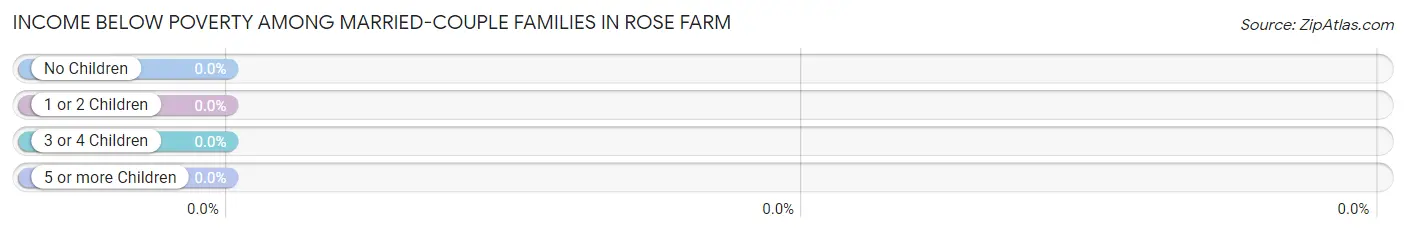
| Children | Above Poverty | Below Poverty |
| No Children | 0 (0.0%) | 0 (0.0%) |
| 1 or 2 Children | 0 (0.0%) | 0 (0.0%) |
| 3 or 4 Children | 0 (0.0%) | 0 (0.0%) |
| 5 or more Children | 0 (0.0%) | 0 (0.0%) |
| Total | 0 (0.0%) | 0 (0.0%) |
Income Below Poverty Among Single-Parent Households in Rose Farm
| Children | Single Father | Single Mother |
| No Children | 0 (0.0%) | 0 (0.0%) |
| 1 or 2 Children | 0 (0.0%) | 0 (0.0%) |
| 3 or 4 Children | 0 (0.0%) | 0 (0.0%) |
| 5 or more Children | 0 (0.0%) | 0 (0.0%) |
| Total | 0 (0.0%) | 0 (0.0%) |
Income Below Poverty Among Married-Couple vs Single-Parent Households in Rose Farm
| Children | Married-Couple Families | Single-Parent Households |
| No Children | 0 (0.0%) | 0 (0.0%) |
| 1 or 2 Children | 0 (0.0%) | 0 (0.0%) |
| 3 or 4 Children | 0 (0.0%) | 0 (0.0%) |
| 5 or more Children | 0 (0.0%) | 0 (0.0%) |
| Total | 0 (0.0%) | 0 (0.0%) |
Race in Rose Farm
The most populous races in Rose Farm are , and White / Caucasian (93 | 100.0%).
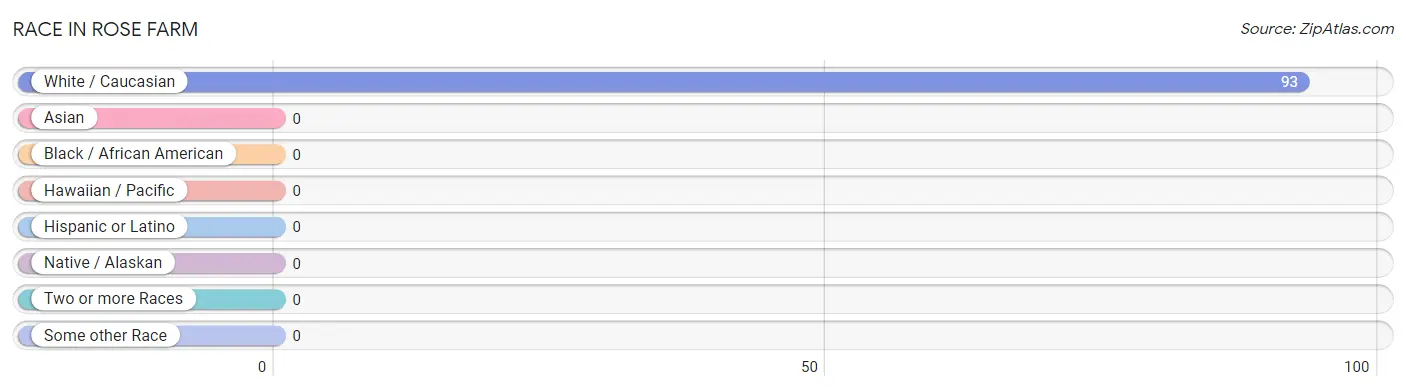
| Race | # Population | % Population |
| Asian | 0 | 0.0% |
| Black / African American | 0 | 0.0% |
| Hawaiian / Pacific | 0 | 0.0% |
| Hispanic or Latino | 0 | 0.0% |
| Native / Alaskan | 0 | 0.0% |
| White / Caucasian | 93 | 100.0% |
| Two or more Races | 0 | 0.0% |
| Some other Race | 0 | 0.0% |
| Total | 93 | 100.0% |
Ancestry in Rose Farm
The most populous ancestries reported in Rose Farm are English (39 | 41.9%), American (23 | 24.7%), German (23 | 24.7%), Scottish (16 | 17.2%), and Irish (13 | 14.0%), together accounting for 122.6% of all Rose Farm residents.
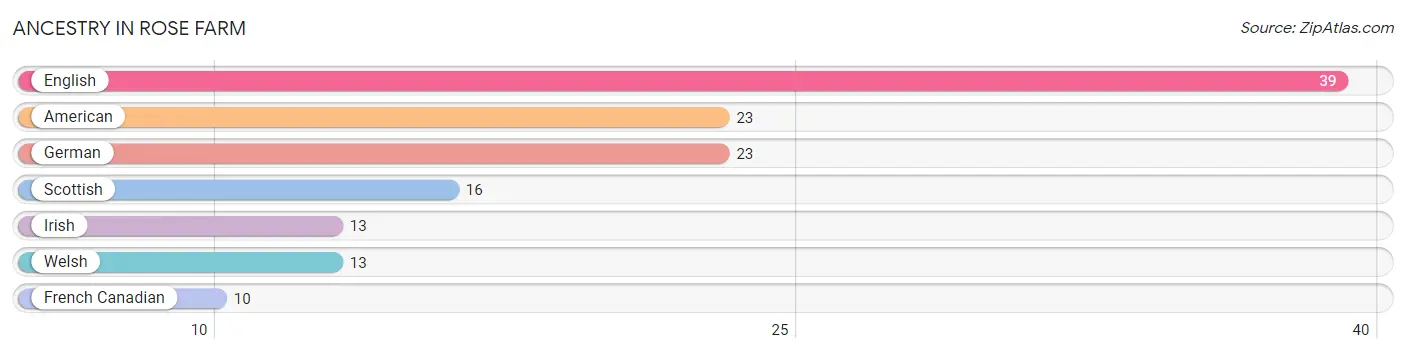
| Ancestry | # Population | % Population |
| American | 23 | 24.7% |
| English | 39 | 41.9% |
| French Canadian | 10 | 10.7% |
| German | 23 | 24.7% |
| Irish | 13 | 14.0% |
| Scottish | 16 | 17.2% |
| Welsh | 13 | 14.0% | View All 7 Rows |
Immigrants in Rose Farm

| Immigration Origin | # Population | % Population | View All 0 Rows |
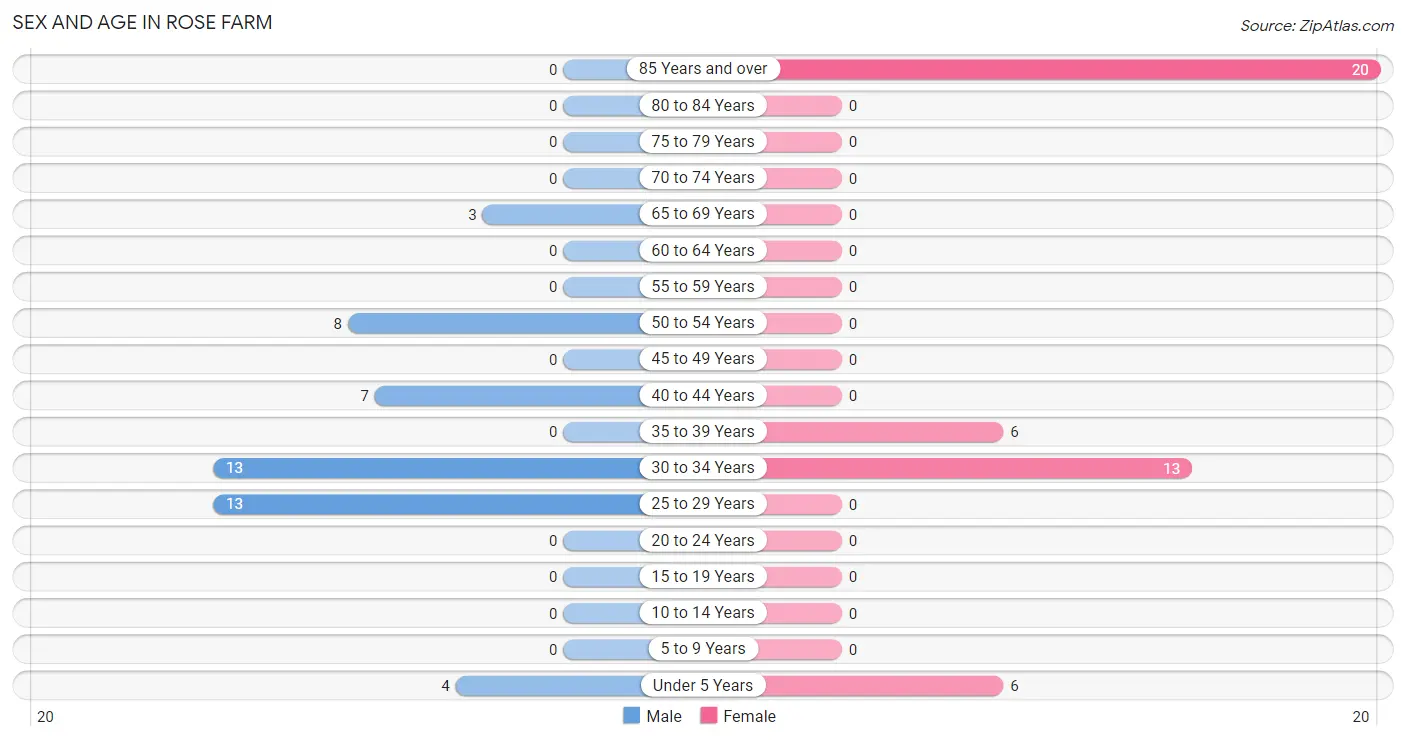
Sex and Age in Rose Farm
Sex and Age in Rose Farm
The most populous age groups in Rose Farm are 25 to 29 Years (13 | 27.1%) for men and 85 Years and over (20 | 44.4%) for women.
| Age Bracket | Male | Female |
| Under 5 Years | 4 (8.3%) | 6 (13.3%) |
| 5 to 9 Years | 0 (0.0%) | 0 (0.0%) |
| 10 to 14 Years | 0 (0.0%) | 0 (0.0%) |
| 15 to 19 Years | 0 (0.0%) | 0 (0.0%) |
| 20 to 24 Years | 0 (0.0%) | 0 (0.0%) |
| 25 to 29 Years | 13 (27.1%) | 0 (0.0%) |
| 30 to 34 Years | 13 (27.1%) | 13 (28.9%) |
| 35 to 39 Years | 0 (0.0%) | 6 (13.3%) |
| 40 to 44 Years | 7 (14.6%) | 0 (0.0%) |
| 45 to 49 Years | 0 (0.0%) | 0 (0.0%) |
| 50 to 54 Years | 8 (16.7%) | 0 (0.0%) |
| 55 to 59 Years | 0 (0.0%) | 0 (0.0%) |
| 60 to 64 Years | 0 (0.0%) | 0 (0.0%) |
| 65 to 69 Years | 3 (6.2%) | 0 (0.0%) |
| 70 to 74 Years | 0 (0.0%) | 0 (0.0%) |
| 75 to 79 Years | 0 (0.0%) | 0 (0.0%) |
| 80 to 84 Years | 0 (0.0%) | 0 (0.0%) |
| 85 Years and over | 0 (0.0%) | 20 (44.4%) |
| Total | 48 (100.0%) | 45 (100.0%) |
Families and Households in Rose Farm
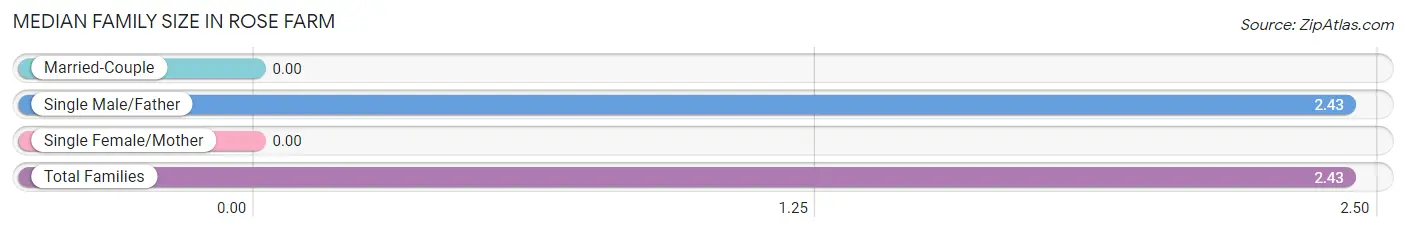
Median Family Size in Rose Farm
| Family Type | # Families | Family Size |
| Married-Couple | 0 (0.0%) | - |
| Single Male/Father | 7 (100.0%) | 2.43 |
| Single Female/Mother | 0 (0.0%) | - |
| Total Families | 7 (100.0%) | 2.43 |
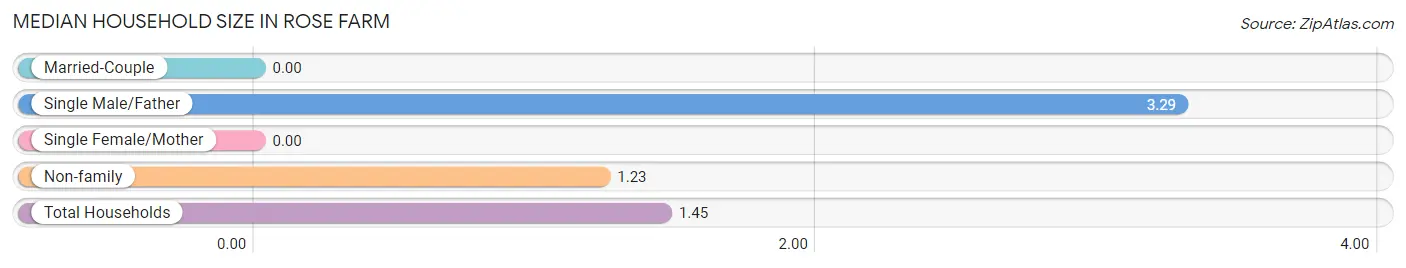
Median Household Size in Rose Farm
| Household Type | # Households | Household Size |
| Married-Couple | 0 (0.0%) | - |
| Single Male/Father | 7 (10.9%) | 3.29 |
| Single Female/Mother | 0 (0.0%) | - |
| Non-family | 57 (89.1%) | 1.23 |
| Total Households | 64 (100.0%) | 1.45 |
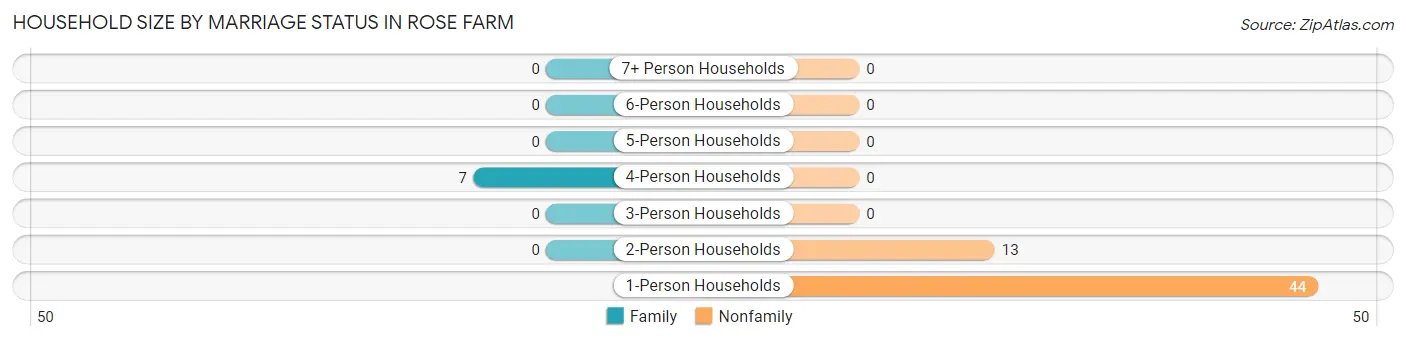
Household Size by Marriage Status in Rose Farm
Out of a total of 64 households in Rose Farm, 7 (10.9%) are family households, while 57 (89.1%) are nonfamily households. The most numerous type of family households are 4-person households, comprising 7, and the most common type of nonfamily households are 1-person households, comprising 44.
| Household Size | Family Households | Nonfamily Households |
| 1-Person Households | - | 44 (68.8%) |
| 2-Person Households | 0 (0.0%) | 13 (20.3%) |
| 3-Person Households | 0 (0.0%) | 0 (0.0%) |
| 4-Person Households | 7 (10.9%) | 0 (0.0%) |
| 5-Person Households | 0 (0.0%) | 0 (0.0%) |
| 6-Person Households | 0 (0.0%) | 0 (0.0%) |
| 7+ Person Households | 0 (0.0%) | 0 (0.0%) |
| Total | 7 (10.9%) | 57 (89.1%) |
Female Fertility in Rose Farm
Fertility by Age in Rose Farm
Average fertility rate in Rose Farm is 316.0 births per 1,000 women. Women in the age bracket of 35 to 50 years have the highest fertility rate with 1,000.0 births per 1,000 women. Women in the age bracket of 35 to 50 years acount for 100.0% of all women with births.
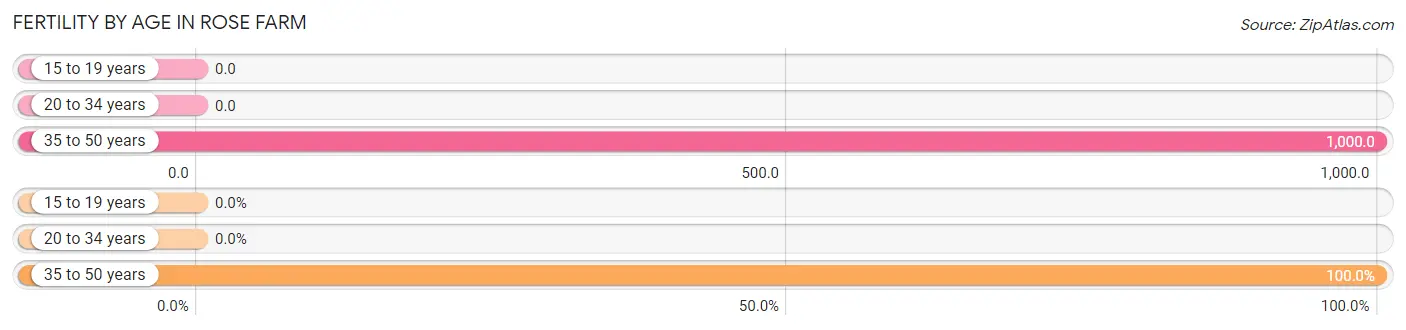
| Age Bracket | Women with Births | Births / 1,000 Women |
| 15 to 19 years | 0 (0.0%) | 0.0 |
| 20 to 34 years | 0 (0.0%) | 0.0 |
| 35 to 50 years | 6 (100.0%) | 1,000.0 |
| Total | 6 (100.0%) | 316.0 |
Fertility by Age by Marriage Status in Rose Farm
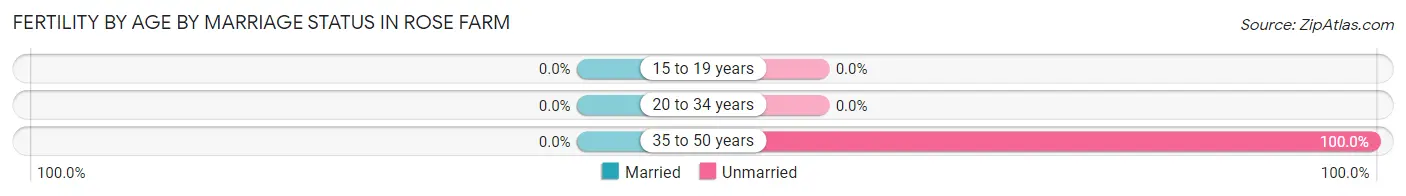
| Age Bracket | Married | Unmarried |
| 15 to 19 years | 0 (0.0%) | 0 (0.0%) |
| 20 to 34 years | 0 (0.0%) | 0 (0.0%) |
| 35 to 50 years | 0 (0.0%) | 6 (100.0%) |
| Total | 0 (0.0%) | 6 (100.0%) |
Fertility by Education in Rose Farm
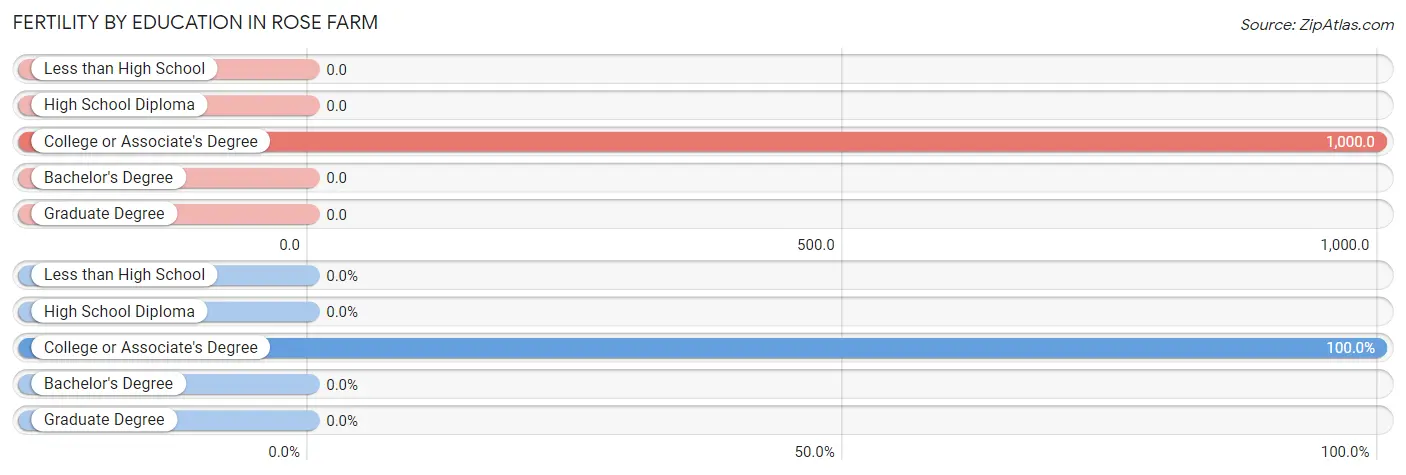
| Educational Attainment | Women with Births | Births / 1,000 Women |
| Less than High School | 0 (0.0%) | 0.0 |
| High School Diploma | 0 (0.0%) | 0.0 |
| College or Associate's Degree | 6 (100.0%) | 1,000.0 |
| Bachelor's Degree | 0 (0.0%) | 0.0 |
| Graduate Degree | 0 (0.0%) | 0.0 |
| Total | 6 (100.0%) | 316.0 |
Fertility by Education by Marriage Status in Rose Farm
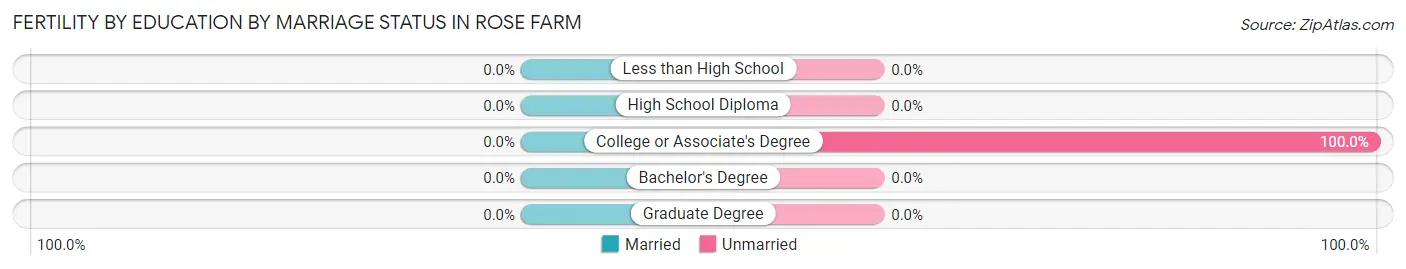
| Educational Attainment | Married | Unmarried |
| Less than High School | 0 (0.0%) | 0 (0.0%) |
| High School Diploma | 0 (0.0%) | 0 (0.0%) |
| College or Associate's Degree | 0 (0.0%) | 6 (100.0%) |
| Bachelor's Degree | 0 (0.0%) | 0 (0.0%) |
| Graduate Degree | 0 (0.0%) | 0 (0.0%) |
| Total | 0 (0.0%) | 6 (100.0%) |
Employment Characteristics in Rose Farm
Employment by Class of Employer in Rose Farm
Among the 52 employed individuals in Rose Farm, , and private company employees (52 | 100.0%) make up the most common classes of employment.
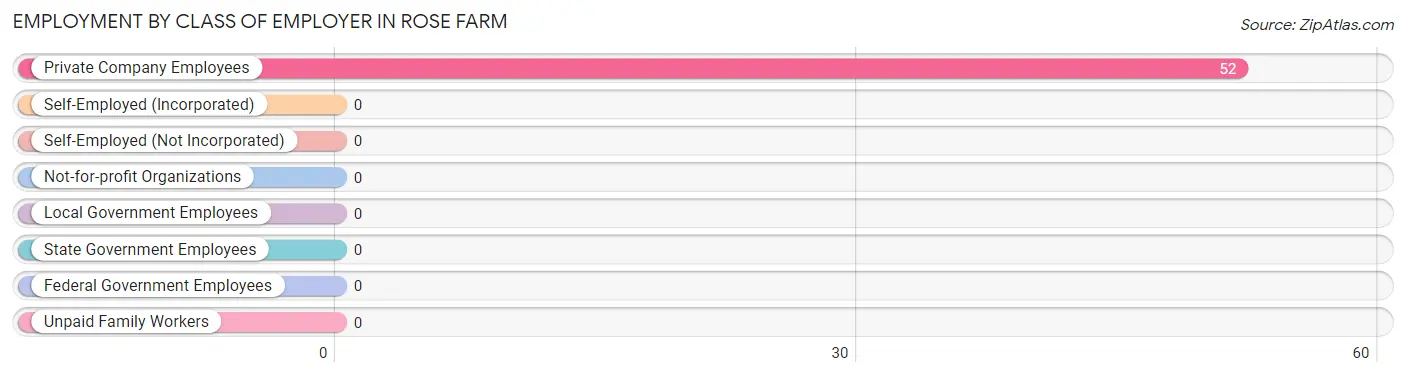
| Employer Class | # Employees | % Employees |
| Private Company Employees | 52 | 100.0% |
| Self-Employed (Incorporated) | 0 | 0.0% |
| Self-Employed (Not Incorporated) | 0 | 0.0% |
| Not-for-profit Organizations | 0 | 0.0% |
| Local Government Employees | 0 | 0.0% |
| State Government Employees | 0 | 0.0% |
| Federal Government Employees | 0 | 0.0% |
| Unpaid Family Workers | 0 | 0.0% |
| Total | 52 | 100.0% |
Employment Status by Age in Rose Farm
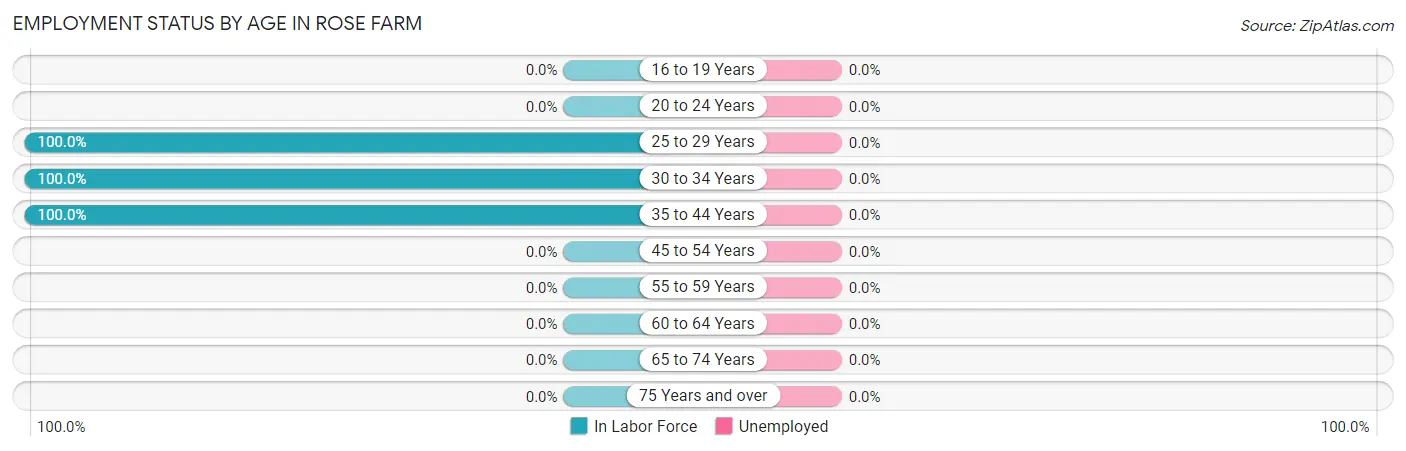
| Age Bracket | In Labor Force | Unemployed |
| 16 to 19 Years | 0 (0.0%) | 0 (0.0%) |
| 20 to 24 Years | 0 (0.0%) | 0 (0.0%) |
| 25 to 29 Years | 13 (100.0%) | 0 (0.0%) |
| 30 to 34 Years | 26 (100.0%) | 0 (0.0%) |
| 35 to 44 Years | 13 (100.0%) | 0 (0.0%) |
| 45 to 54 Years | 0 (0.0%) | 0 (0.0%) |
| 55 to 59 Years | 0 (0.0%) | 0 (0.0%) |
| 60 to 64 Years | 0 (0.0%) | 0 (0.0%) |
| 65 to 74 Years | 0 (0.0%) | 0 (0.0%) |
| 75 Years and over | 0 (0.0%) | 0 (0.0%) |
| Total | 52 (62.7%) | 0 (0.0%) |
Employment Status by Educational Attainment in Rose Farm
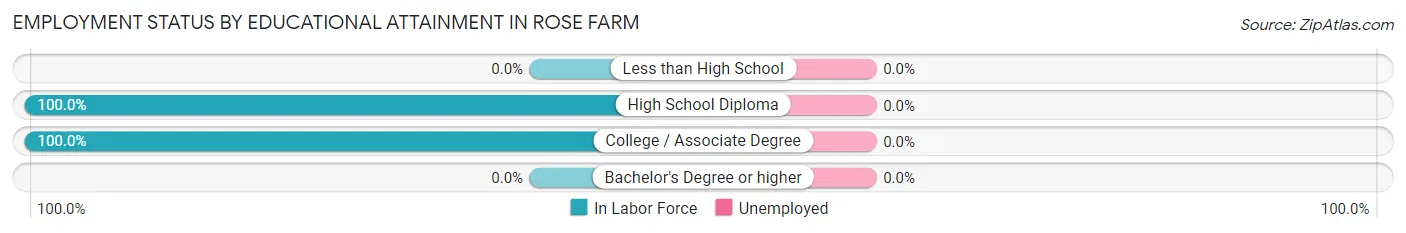
| Educational Attainment | In Labor Force | Unemployed |
| Less than High School | 0 (0.0%) | 0 (0.0%) |
| High School Diploma | 26 (100.0%) | 0 (0.0%) |
| College / Associate Degree | 26 (100.0%) | 0 (0.0%) |
| Bachelor's Degree or higher | 0 (0.0%) | 0 (0.0%) |
| Total | 52 (86.7%) | 0 (0.0%) |
Employment Occupations by Sex in Rose Farm
Management, Business, Science and Arts Occupations
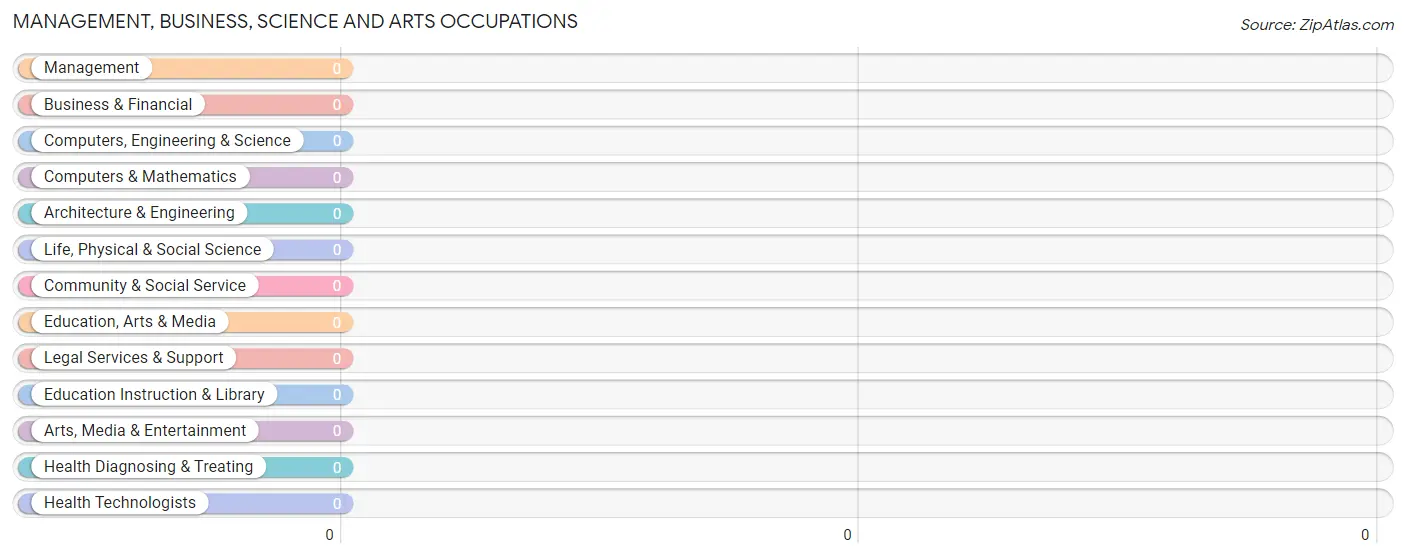
Management, Business, Science and Arts Occupations by Sex
| Occupation | Male | Female |
| Management | 0 (0.0%) | 0 (0.0%) |
| Business & Financial | 0 (0.0%) | 0 (0.0%) |
| Computers, Engineering & Science | 0 (0.0%) | 0 (0.0%) |
| Computers & Mathematics | 0 (0.0%) | 0 (0.0%) |
| Architecture & Engineering | 0 (0.0%) | 0 (0.0%) |
| Life, Physical & Social Science | 0 (0.0%) | 0 (0.0%) |
| Community & Social Service | 0 (0.0%) | 0 (0.0%) |
| Education, Arts & Media | 0 (0.0%) | 0 (0.0%) |
| Legal Services & Support | 0 (0.0%) | 0 (0.0%) |
| Education Instruction & Library | 0 (0.0%) | 0 (0.0%) |
| Arts, Media & Entertainment | 0 (0.0%) | 0 (0.0%) |
| Health Diagnosing & Treating | 0 (0.0%) | 0 (0.0%) |
| Health Technologists | 0 (0.0%) | 0 (0.0%) |
| Total (Category) | 0 (0.0%) | 0 (0.0%) |
| Total (Overall) | 33 (63.5%) | 19 (36.5%) |
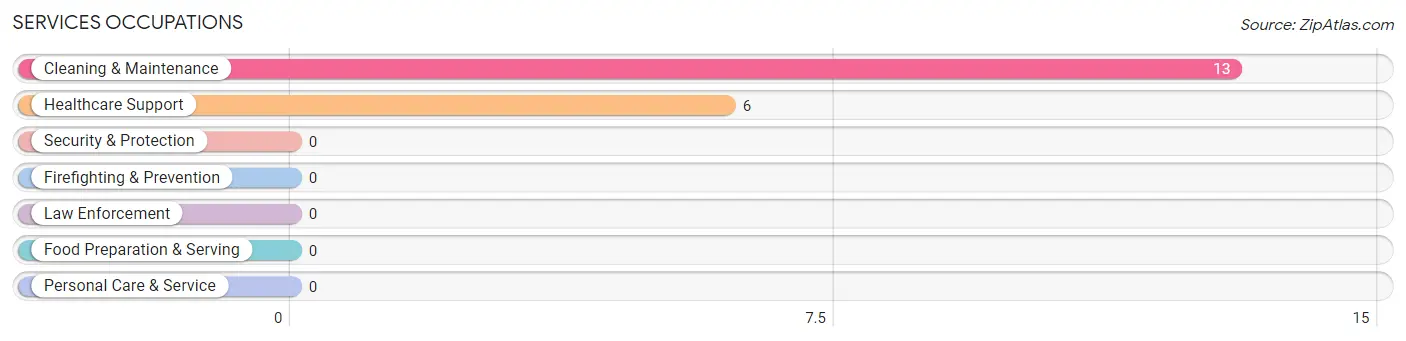
Services Occupations
The most common Services occupations in Rose Farm are Cleaning & Maintenance (13 | 25.0%), and Healthcare Support (6 | 11.5%).
Services Occupations by Sex
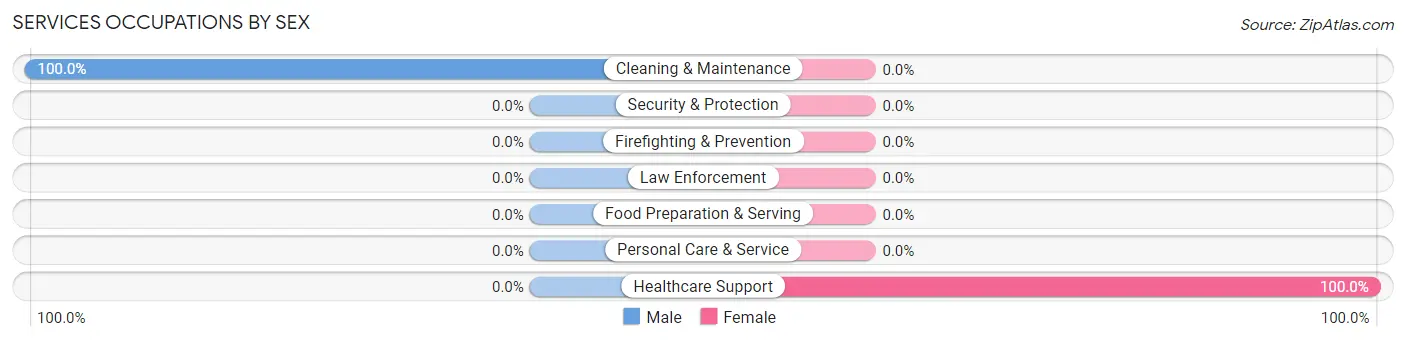
| Occupation | Male | Female |
| Healthcare Support | 0 (0.0%) | 6 (100.0%) |
| Security & Protection | 0 (0.0%) | 0 (0.0%) |
| Firefighting & Prevention | 0 (0.0%) | 0 (0.0%) |
| Law Enforcement | 0 (0.0%) | 0 (0.0%) |
| Food Preparation & Serving | 0 (0.0%) | 0 (0.0%) |
| Cleaning & Maintenance | 13 (100.0%) | 0 (0.0%) |
| Personal Care & Service | 0 (0.0%) | 0 (0.0%) |
| Total (Category) | 13 (68.4%) | 6 (31.6%) |
| Total (Overall) | 33 (63.5%) | 19 (36.5%) |
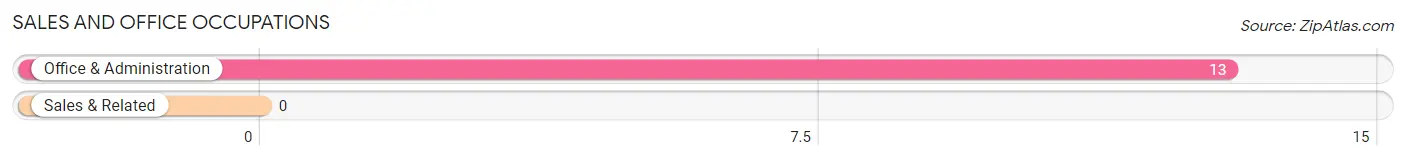
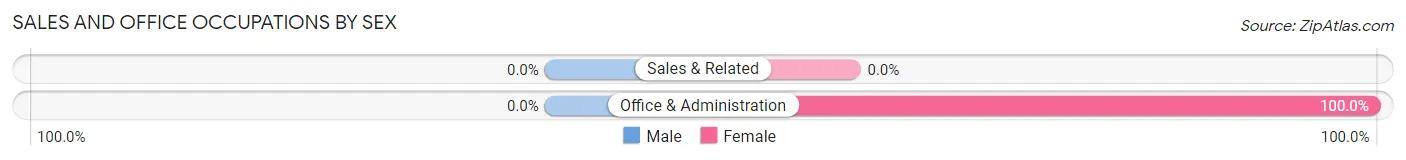
Sales and Office Occupations
The most common Sales and Office occupations in Rose Farm are , and Office & Administration (13 | 25.0%).
Sales and Office Occupations by Sex
| Occupation | Male | Female |
| Sales & Related | 0 (0.0%) | 0 (0.0%) |
| Office & Administration | 0 (0.0%) | 13 (100.0%) |
| Total (Category) | 0 (0.0%) | 13 (100.0%) |
| Total (Overall) | 33 (63.5%) | 19 (36.5%) |
Natural Resources, Construction and Maintenance Occupations
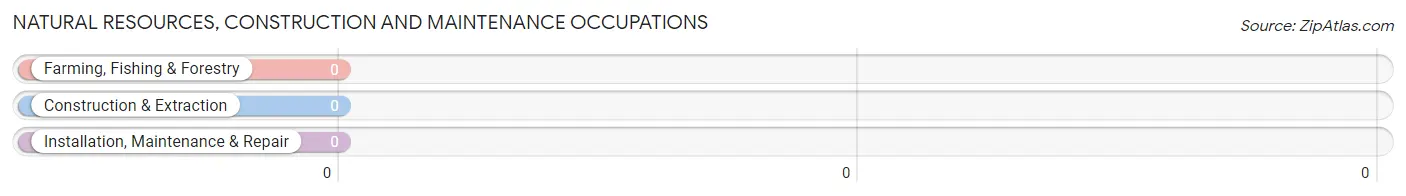
Natural Resources, Construction and Maintenance Occupations by Sex
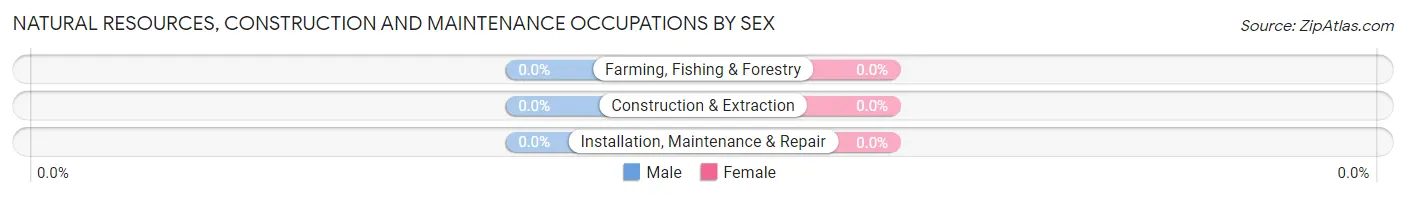
| Occupation | Male | Female |
| Farming, Fishing & Forestry | 0 (0.0%) | 0 (0.0%) |
| Construction & Extraction | 0 (0.0%) | 0 (0.0%) |
| Installation, Maintenance & Repair | 0 (0.0%) | 0 (0.0%) |
| Total (Category) | 0 (0.0%) | 0 (0.0%) |
| Total (Overall) | 33 (63.5%) | 19 (36.5%) |
Production, Transportation and Moving Occupations
The most common Production, Transportation and Moving occupations in Rose Farm are Material Moving (13 | 25.0%), and Production (7 | 13.5%).
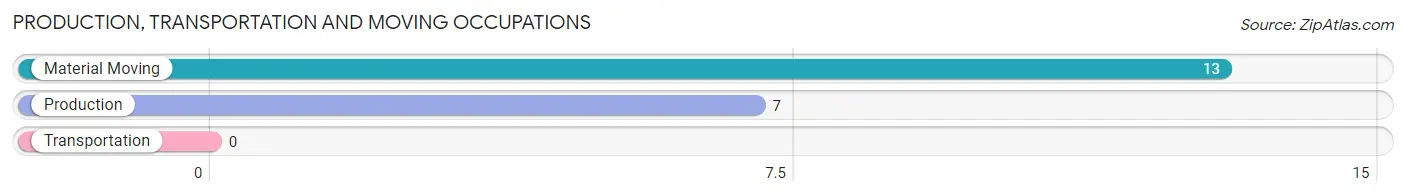
Production, Transportation and Moving Occupations by Sex
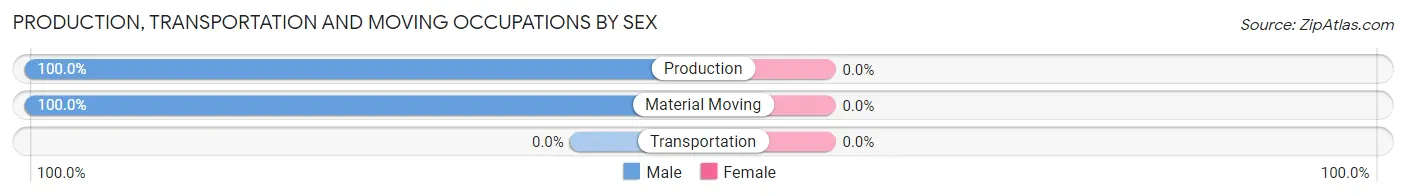
| Occupation | Male | Female |
| Production | 7 (100.0%) | 0 (0.0%) |
| Transportation | 0 (0.0%) | 0 (0.0%) |
| Material Moving | 13 (100.0%) | 0 (0.0%) |
| Total (Category) | 20 (100.0%) | 0 (0.0%) |
| Total (Overall) | 33 (63.5%) | 19 (36.5%) |
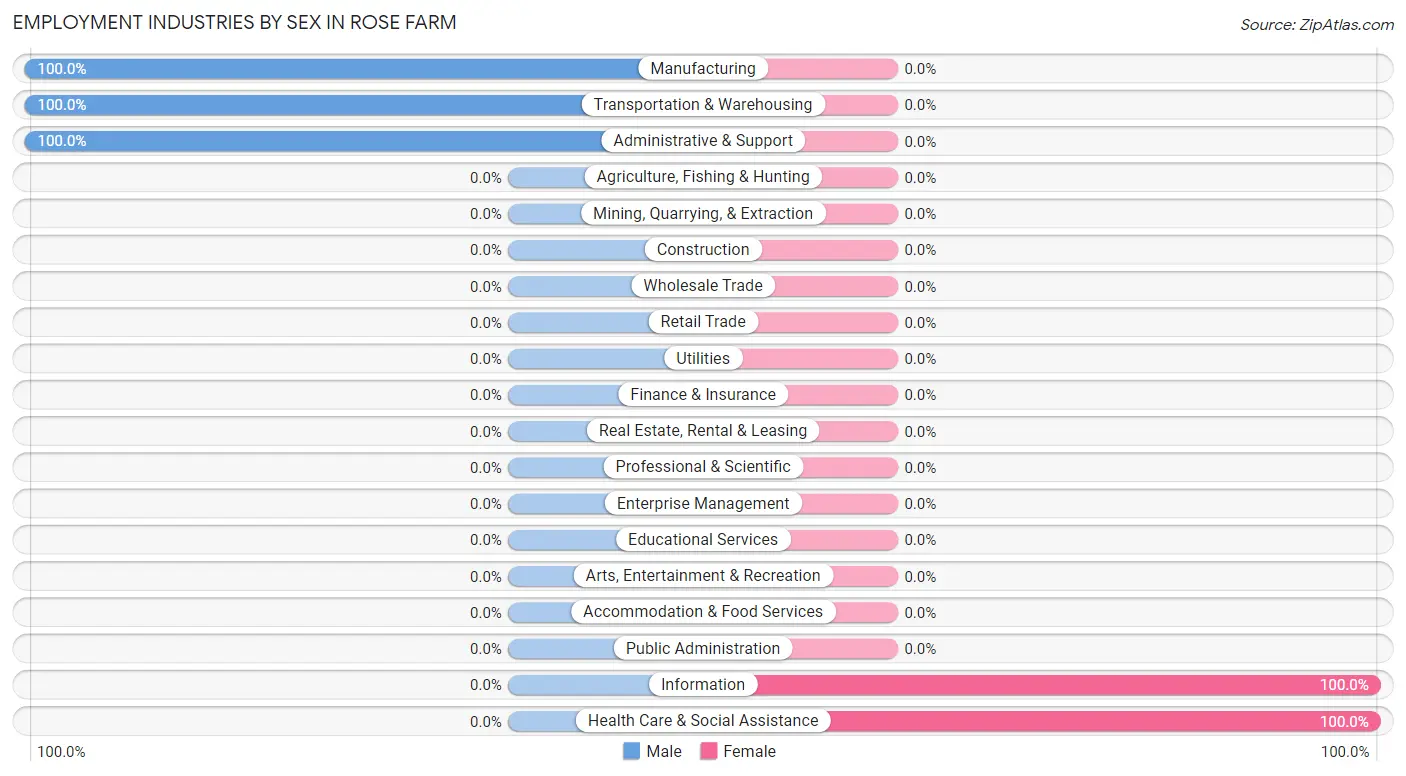
Employment Industries by Sex in Rose Farm
Employment Industries in Rose Farm
The major employment industries in Rose Farm include Transportation & Warehousing (13 | 25.0%), Information (13 | 25.0%), Administrative & Support (13 | 25.0%), Manufacturing (7 | 13.5%), and Health Care & Social Assistance (6 | 11.5%).
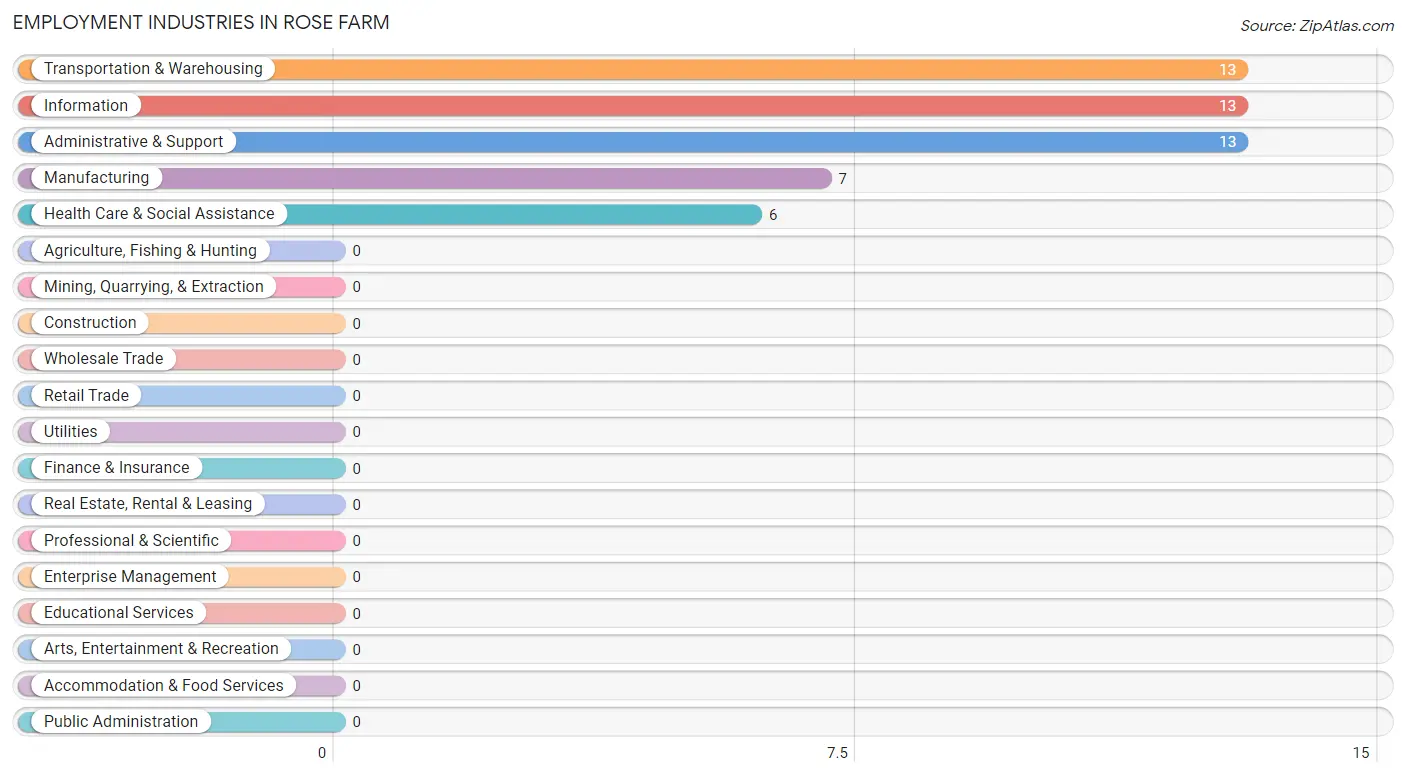
Employment Industries by Sex in Rose Farm
The Rose Farm industries that see more men than women are Manufacturing (100.0%), Transportation & Warehousing (100.0%), and Administrative & Support (100.0%), whereas the industries that tend to have a higher number of women are Information (100.0%), and Health Care & Social Assistance (100.0%).
| Industry | Male | Female |
| Agriculture, Fishing & Hunting | 0 (0.0%) | 0 (0.0%) |
| Mining, Quarrying, & Extraction | 0 (0.0%) | 0 (0.0%) |
| Construction | 0 (0.0%) | 0 (0.0%) |
| Manufacturing | 7 (100.0%) | 0 (0.0%) |
| Wholesale Trade | 0 (0.0%) | 0 (0.0%) |
| Retail Trade | 0 (0.0%) | 0 (0.0%) |
| Transportation & Warehousing | 13 (100.0%) | 0 (0.0%) |
| Utilities | 0 (0.0%) | 0 (0.0%) |
| Information | 0 (0.0%) | 13 (100.0%) |
| Finance & Insurance | 0 (0.0%) | 0 (0.0%) |
| Real Estate, Rental & Leasing | 0 (0.0%) | 0 (0.0%) |
| Professional & Scientific | 0 (0.0%) | 0 (0.0%) |
| Enterprise Management | 0 (0.0%) | 0 (0.0%) |
| Administrative & Support | 13 (100.0%) | 0 (0.0%) |
| Educational Services | 0 (0.0%) | 0 (0.0%) |
| Health Care & Social Assistance | 0 (0.0%) | 6 (100.0%) |
| Arts, Entertainment & Recreation | 0 (0.0%) | 0 (0.0%) |
| Accommodation & Food Services | 0 (0.0%) | 0 (0.0%) |
| Public Administration | 0 (0.0%) | 0 (0.0%) |
| Total | 33 (63.5%) | 19 (36.5%) |
Education in Rose Farm
School Enrollment in Rose Farm
| School Level | # Students | % Students |
| Nursery / Preschool | 0 | 0.0% |
| Kindergarten | 0 | 0.0% |
| Elementary School | 0 | 0.0% |
| Middle School | 0 | 0.0% |
| High School | 0 | 0.0% |
| College / Undergraduate | 0 | 0.0% |
| Graduate / Professional | 0 | 0.0% |
| Total | 0 | 0.0% |
School Enrollment by Age by Funding Source in Rose Farm
| Age Bracket | Public School | Private School |
| 3 to 4 Year Olds | 0 (0.0%) | 0 (0.0%) |
| 5 to 9 Year Old | 0 (0.0%) | 0 (0.0%) |
| 10 to 14 Year Olds | 0 (0.0%) | 0 (0.0%) |
| 15 to 17 Year Olds | 0 (0.0%) | 0 (0.0%) |
| 18 to 19 Year Olds | 0 (0.0%) | 0 (0.0%) |
| 20 to 24 Year Olds | 0 (0.0%) | 0 (0.0%) |
| 25 to 34 Year Olds | 0 (0.0%) | 0 (0.0%) |
| 35 Years and over | 0 (0.0%) | 0 (0.0%) |
| Total | 0 (0.0%) | 0 (0.0%) |
Educational Attainment by Field of Study in Rose Farm
| Field of Study | # Graduates | % Graduates |
| Computers & Mathematics | 0 | 0.0% |
| Bio, Nature & Agricultural | 0 | 0.0% |
| Physical & Health Sciences | 0 | 0.0% |
| Psychology | 0 | 0.0% |
| Social Sciences | 0 | 0.0% |
| Engineering | 0 | 0.0% |
| Multidisciplinary Studies | 0 | 0.0% |
| Science & Technology | 0 | 0.0% |
| Business | 0 | 0.0% |
| Education | 0 | 0.0% |
| Literature & Languages | 0 | 0.0% |
| Liberal Arts & History | 0 | 0.0% |
| Visual & Performing Arts | 0 | 0.0% |
| Communications | 0 | 0.0% |
| Arts & Humanities | 0 | 0.0% |
| Total | 0 | 0.0% |
Transportation & Commute in Rose Farm
Vehicle Availability by Sex in Rose Farm
The most prevalent vehicle ownership categories in Rose Farm are males with 1 vehicle (13, accounting for 39.4%) and females with 1 vehicle (0, making up 68.4%).
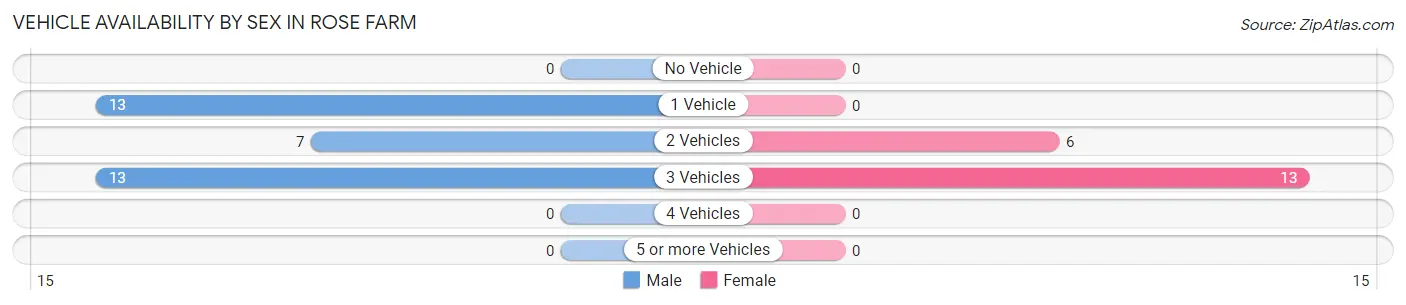
| Vehicles Available | Male | Female |
| No Vehicle | 0 (0.0%) | 0 (0.0%) |
| 1 Vehicle | 13 (39.4%) | 0 (0.0%) |
| 2 Vehicles | 7 (21.2%) | 6 (31.6%) |
| 3 Vehicles | 13 (39.4%) | 13 (68.4%) |
| 4 Vehicles | 0 (0.0%) | 0 (0.0%) |
| 5 or more Vehicles | 0 (0.0%) | 0 (0.0%) |
| Total | 33 (100.0%) | 19 (100.0%) |
Commute Time in Rose Farm
The most frequently occuring commute durations in Rose Farm are 45 to 59 minutes (26 commuters, 50.0%), 10 to 14 minutes (20 commuters, 38.5%), and 20 to 24 minutes (6 commuters, 11.5%).
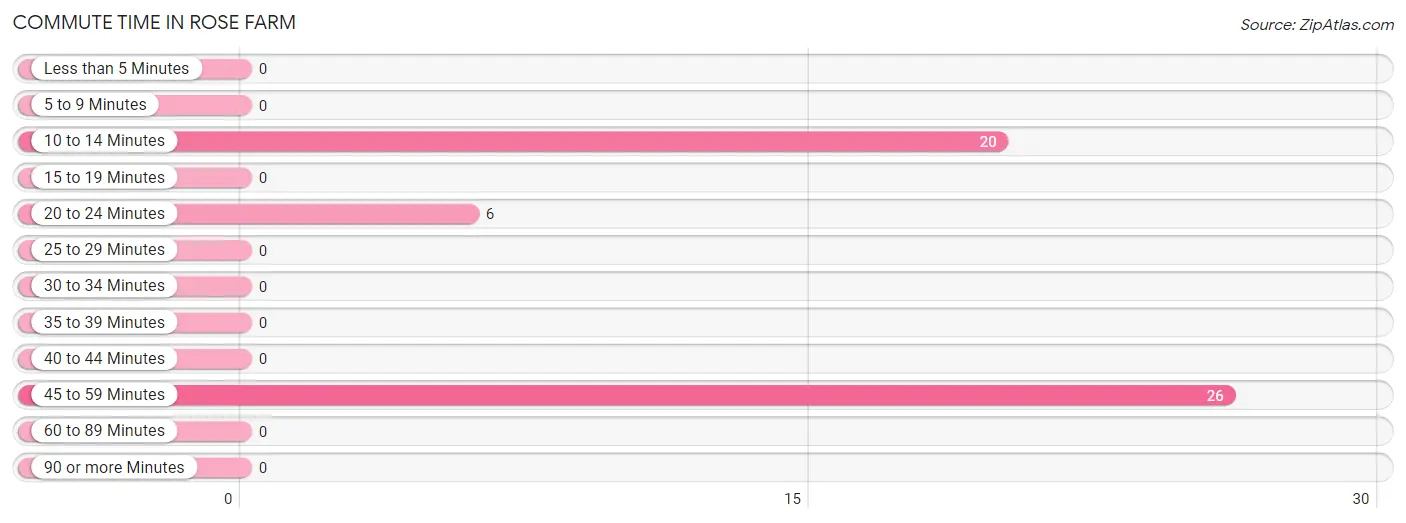
| Commute Time | # Commuters | % Commuters |
| Less than 5 Minutes | 0 | 0.0% |
| 5 to 9 Minutes | 0 | 0.0% |
| 10 to 14 Minutes | 20 | 38.5% |
| 15 to 19 Minutes | 0 | 0.0% |
| 20 to 24 Minutes | 6 | 11.5% |
| 25 to 29 Minutes | 0 | 0.0% |
| 30 to 34 Minutes | 0 | 0.0% |
| 35 to 39 Minutes | 0 | 0.0% |
| 40 to 44 Minutes | 0 | 0.0% |
| 45 to 59 Minutes | 26 | 50.0% |
| 60 to 89 Minutes | 0 | 0.0% |
| 90 or more Minutes | 0 | 0.0% |
Commute Time by Sex in Rose Farm
The most common commute times in Rose Farm are 10 to 14 minutes (20 commuters, 60.6%) for males and 45 to 59 minutes (13 commuters, 68.4%) for females.
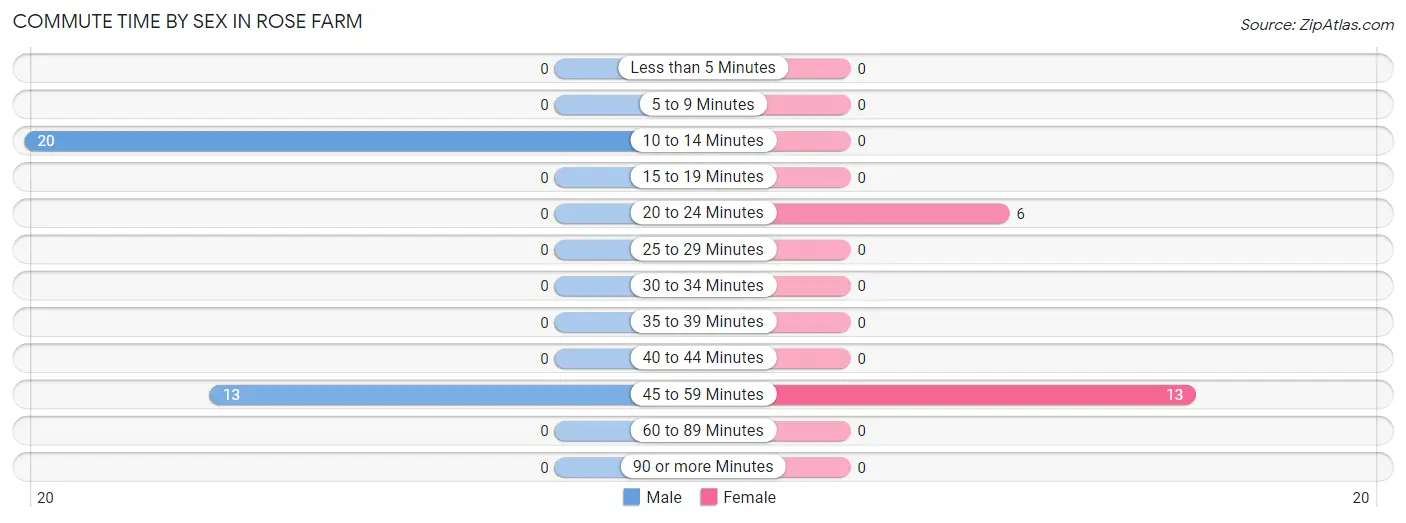
| Commute Time | Male | Female |
| Less than 5 Minutes | 0 (0.0%) | 0 (0.0%) |
| 5 to 9 Minutes | 0 (0.0%) | 0 (0.0%) |
| 10 to 14 Minutes | 20 (60.6%) | 0 (0.0%) |
| 15 to 19 Minutes | 0 (0.0%) | 0 (0.0%) |
| 20 to 24 Minutes | 0 (0.0%) | 6 (31.6%) |
| 25 to 29 Minutes | 0 (0.0%) | 0 (0.0%) |
| 30 to 34 Minutes | 0 (0.0%) | 0 (0.0%) |
| 35 to 39 Minutes | 0 (0.0%) | 0 (0.0%) |
| 40 to 44 Minutes | 0 (0.0%) | 0 (0.0%) |
| 45 to 59 Minutes | 13 (39.4%) | 13 (68.4%) |
| 60 to 89 Minutes | 0 (0.0%) | 0 (0.0%) |
| 90 or more Minutes | 0 (0.0%) | 0 (0.0%) |
Time of Departure to Work by Sex in Rose Farm
The most frequent times of departure to work in Rose Farm are 6:30 AM to 6:59 AM (13, 39.4%) for males and 9:00 AM to 9:59 AM (13, 68.4%) for females.
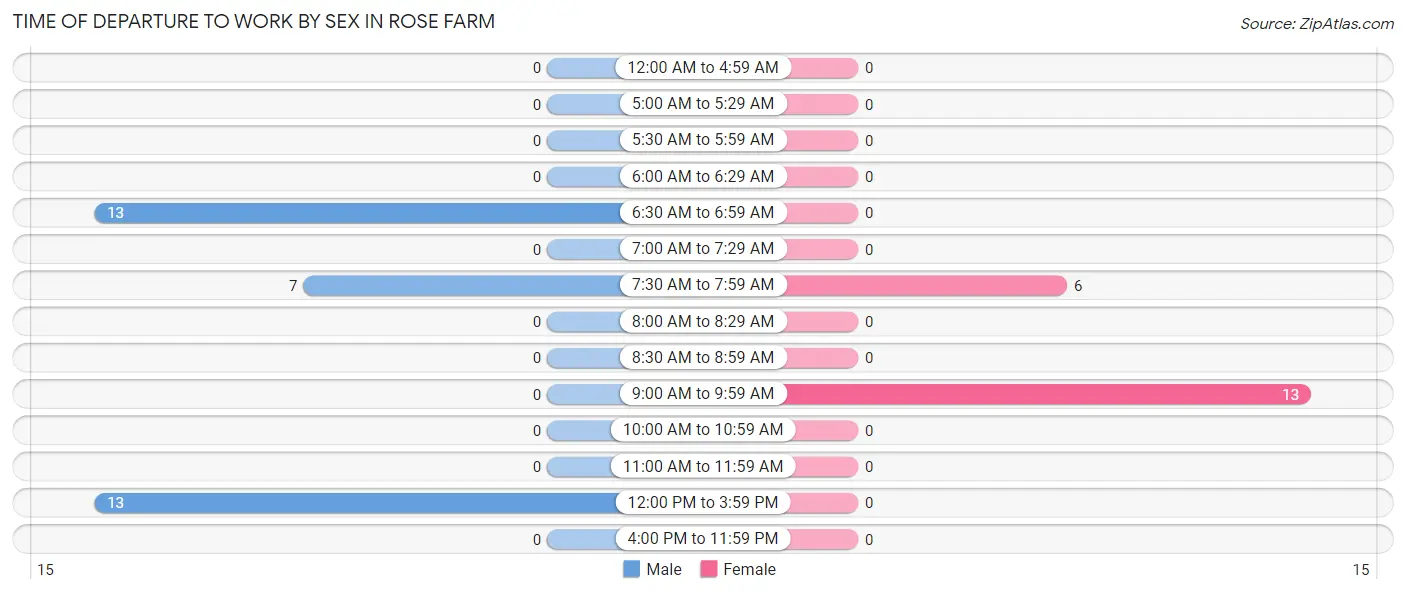
| Time of Departure | Male | Female |
| 12:00 AM to 4:59 AM | 0 (0.0%) | 0 (0.0%) |
| 5:00 AM to 5:29 AM | 0 (0.0%) | 0 (0.0%) |
| 5:30 AM to 5:59 AM | 0 (0.0%) | 0 (0.0%) |
| 6:00 AM to 6:29 AM | 0 (0.0%) | 0 (0.0%) |
| 6:30 AM to 6:59 AM | 13 (39.4%) | 0 (0.0%) |
| 7:00 AM to 7:29 AM | 0 (0.0%) | 0 (0.0%) |
| 7:30 AM to 7:59 AM | 7 (21.2%) | 6 (31.6%) |
| 8:00 AM to 8:29 AM | 0 (0.0%) | 0 (0.0%) |
| 8:30 AM to 8:59 AM | 0 (0.0%) | 0 (0.0%) |
| 9:00 AM to 9:59 AM | 0 (0.0%) | 13 (68.4%) |
| 10:00 AM to 10:59 AM | 0 (0.0%) | 0 (0.0%) |
| 11:00 AM to 11:59 AM | 0 (0.0%) | 0 (0.0%) |
| 12:00 PM to 3:59 PM | 13 (39.4%) | 0 (0.0%) |
| 4:00 PM to 11:59 PM | 0 (0.0%) | 0 (0.0%) |
| Total | 33 (100.0%) | 19 (100.0%) |
Housing Occupancy in Rose Farm
Occupancy by Ownership in Rose Farm
Of the total 64 dwellings in Rose Farm, owner-occupied units account for 38 (59.4%), while renter-occupied units make up 26 (40.6%).
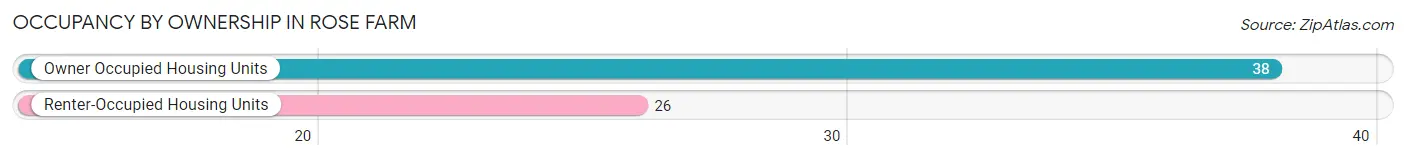
| Occupancy | # Housing Units | % Housing Units |
| Owner Occupied Housing Units | 38 | 59.4% |
| Renter-Occupied Housing Units | 26 | 40.6% |
| Total Occupied Housing Units | 64 | 100.0% |
Occupancy by Household Size in Rose Farm
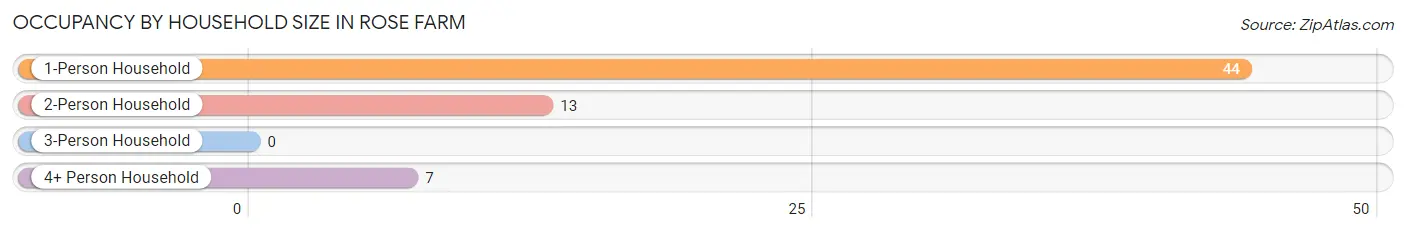
| Household Size | # Housing Units | % Housing Units |
| 1-Person Household | 44 | 68.8% |
| 2-Person Household | 13 | 20.3% |
| 3-Person Household | 0 | 0.0% |
| 4+ Person Household | 7 | 10.9% |
| Total Housing Units | 64 | 100.0% |
Occupancy by Ownership by Household Size in Rose Farm
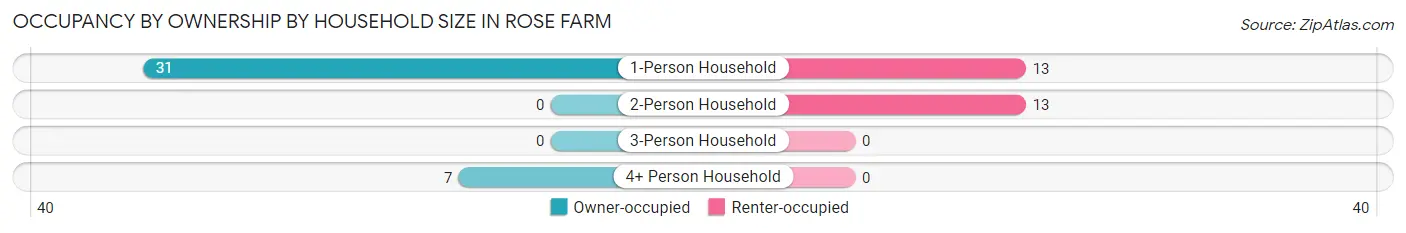
| Household Size | Owner-occupied | Renter-occupied |
| 1-Person Household | 31 (70.5%) | 13 (29.5%) |
| 2-Person Household | 0 (0.0%) | 13 (100.0%) |
| 3-Person Household | 0 (0.0%) | 0 (0.0%) |
| 4+ Person Household | 7 (100.0%) | 0 (0.0%) |
| Total Housing Units | 38 (59.4%) | 26 (40.6%) |
Occupancy by Educational Attainment in Rose Farm
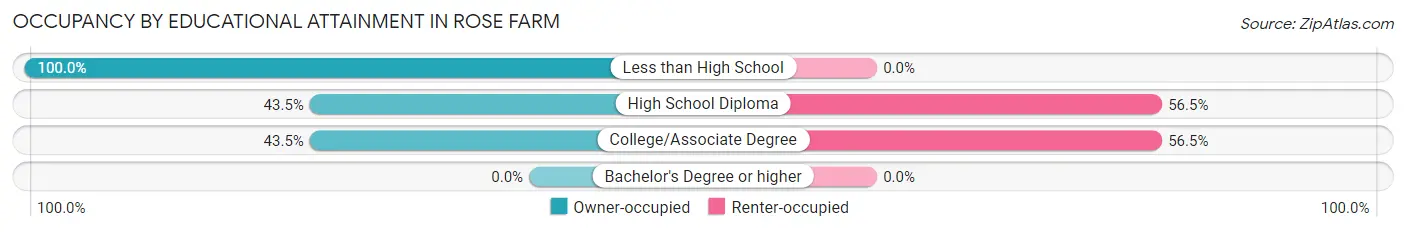
| Household Size | Owner-occupied | Renter-occupied |
| Less than High School | 18 (100.0%) | 0 (0.0%) |
| High School Diploma | 10 (43.5%) | 13 (56.5%) |
| College/Associate Degree | 10 (43.5%) | 13 (56.5%) |
| Bachelor's Degree or higher | 0 (0.0%) | 0 (0.0%) |
Occupancy by Age of Householder in Rose Farm
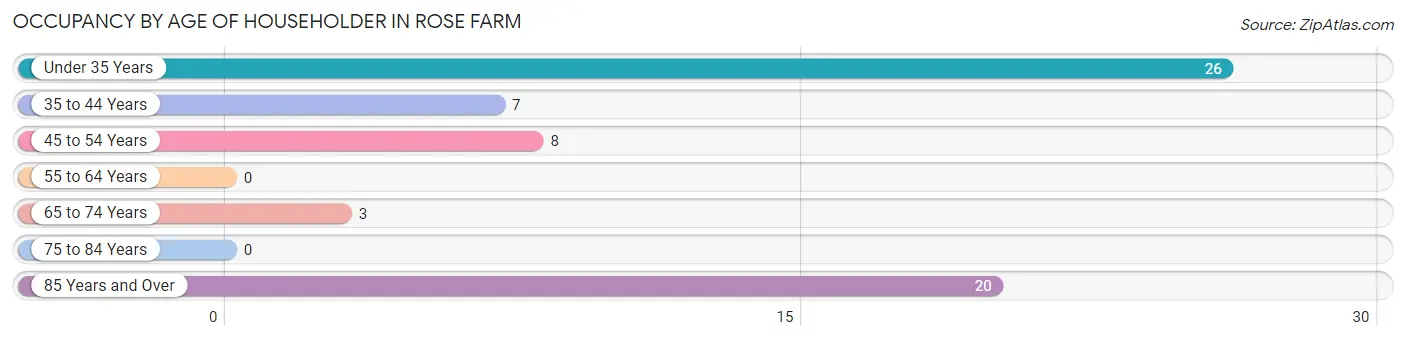
| Age Bracket | # Households | % Households |
| Under 35 Years | 26 | 40.6% |
| 35 to 44 Years | 7 | 10.9% |
| 45 to 54 Years | 8 | 12.5% |
| 55 to 64 Years | 0 | 0.0% |
| 65 to 74 Years | 3 | 4.7% |
| 75 to 84 Years | 0 | 0.0% |
| 85 Years and Over | 20 | 31.2% |
| Total | 64 | 100.0% |
Housing Finances in Rose Farm
Median Income by Occupancy in Rose Farm
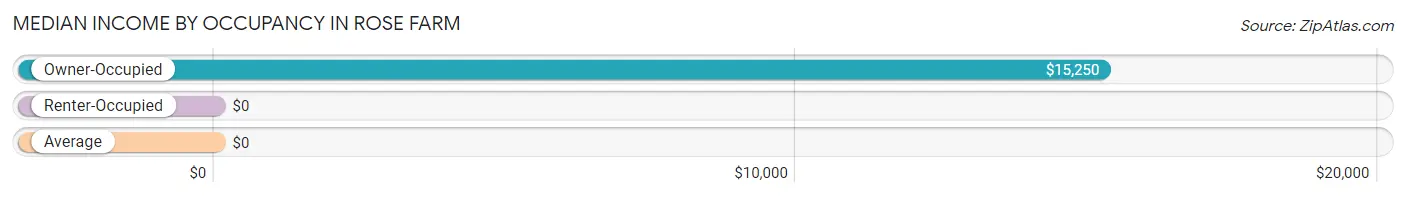
| Occupancy Type | # Households | Median Income |
| Owner-Occupied | 38 (59.4%) | $15,250 |
| Renter-Occupied | 26 (40.6%) | $0 |
| Average | 64 (100.0%) | $0 |
Occupancy by Householder Income Bracket in Rose Farm
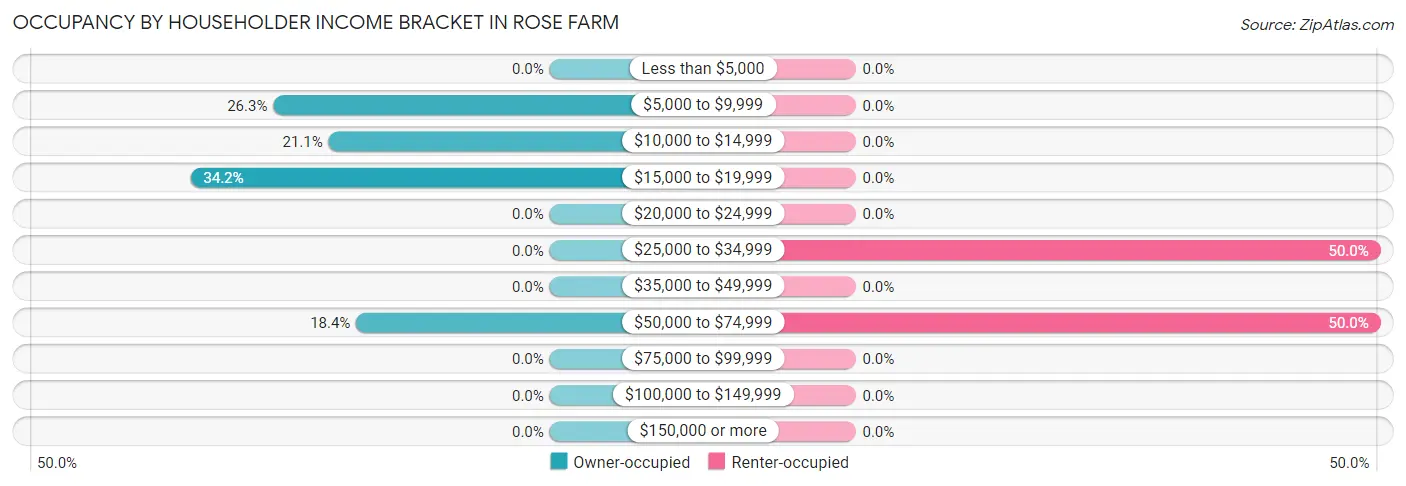
| Income Bracket | Owner-occupied | Renter-occupied |
| Less than $5,000 | 0 (0.0%) | 0 (0.0%) |
| $5,000 to $9,999 | 10 (26.3%) | 0 (0.0%) |
| $10,000 to $14,999 | 8 (21.0%) | 0 (0.0%) |
| $15,000 to $19,999 | 13 (34.2%) | 0 (0.0%) |
| $20,000 to $24,999 | 0 (0.0%) | 0 (0.0%) |
| $25,000 to $34,999 | 0 (0.0%) | 13 (50.0%) |
| $35,000 to $49,999 | 0 (0.0%) | 0 (0.0%) |
| $50,000 to $74,999 | 7 (18.4%) | 13 (50.0%) |
| $75,000 to $99,999 | 0 (0.0%) | 0 (0.0%) |
| $100,000 to $149,999 | 0 (0.0%) | 0 (0.0%) |
| $150,000 or more | 0 (0.0%) | 0 (0.0%) |
| Total | 38 (100.0%) | 26 (100.0%) |
Monthly Housing Cost Tiers in Rose Farm
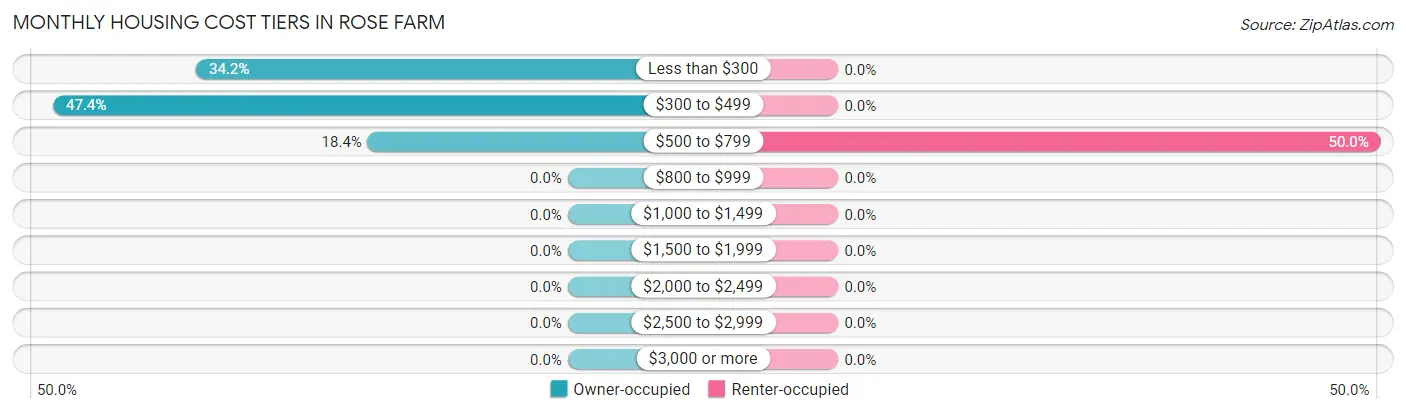
| Monthly Cost | Owner-occupied | Renter-occupied |
| Less than $300 | 13 (34.2%) | 0 (0.0%) |
| $300 to $499 | 18 (47.4%) | 0 (0.0%) |
| $500 to $799 | 7 (18.4%) | 13 (50.0%) |
| $800 to $999 | 0 (0.0%) | 0 (0.0%) |
| $1,000 to $1,499 | 0 (0.0%) | 0 (0.0%) |
| $1,500 to $1,999 | 0 (0.0%) | 0 (0.0%) |
| $2,000 to $2,499 | 0 (0.0%) | 0 (0.0%) |
| $2,500 to $2,999 | 0 (0.0%) | 0 (0.0%) |
| $3,000 or more | 0 (0.0%) | 0 (0.0%) |
| Total | 38 (100.0%) | 26 (100.0%) |
Physical Housing Characteristics in Rose Farm
Housing Structures in Rose Farm
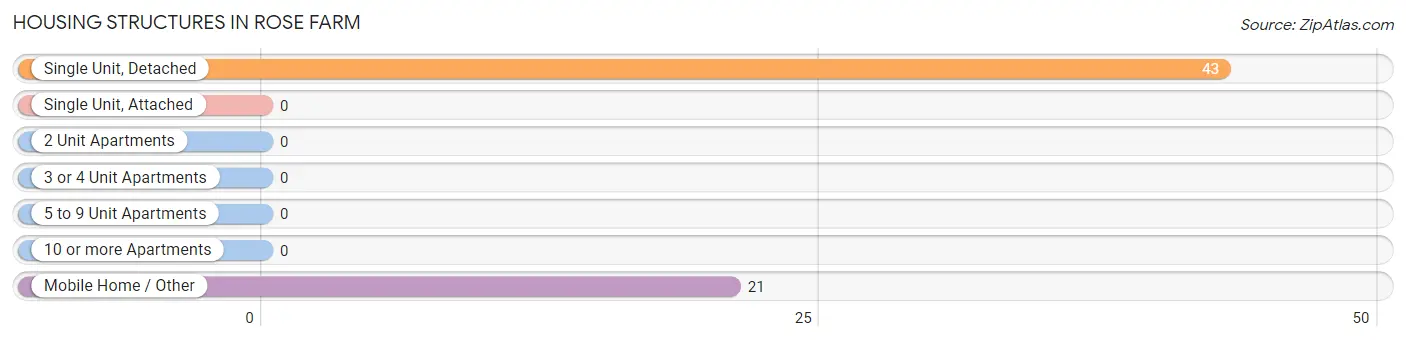
| Structure Type | # Housing Units | % Housing Units |
| Single Unit, Detached | 43 | 67.2% |
| Single Unit, Attached | 0 | 0.0% |
| 2 Unit Apartments | 0 | 0.0% |
| 3 or 4 Unit Apartments | 0 | 0.0% |
| 5 to 9 Unit Apartments | 0 | 0.0% |
| 10 or more Apartments | 0 | 0.0% |
| Mobile Home / Other | 21 | 32.8% |
| Total | 64 | 100.0% |
Housing Structures by Occupancy in Rose Farm
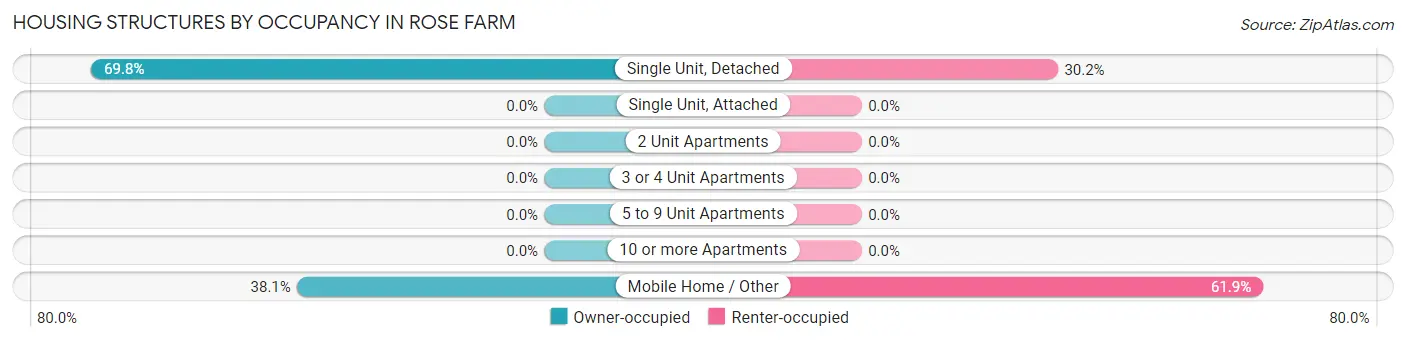
| Structure Type | Owner-occupied | Renter-occupied |
| Single Unit, Detached | 30 (69.8%) | 13 (30.2%) |
| Single Unit, Attached | 0 (0.0%) | 0 (0.0%) |
| 2 Unit Apartments | 0 (0.0%) | 0 (0.0%) |
| 3 or 4 Unit Apartments | 0 (0.0%) | 0 (0.0%) |
| 5 to 9 Unit Apartments | 0 (0.0%) | 0 (0.0%) |
| 10 or more Apartments | 0 (0.0%) | 0 (0.0%) |
| Mobile Home / Other | 8 (38.1%) | 13 (61.9%) |
| Total | 38 (59.4%) | 26 (40.6%) |
Housing Structures by Number of Rooms in Rose Farm
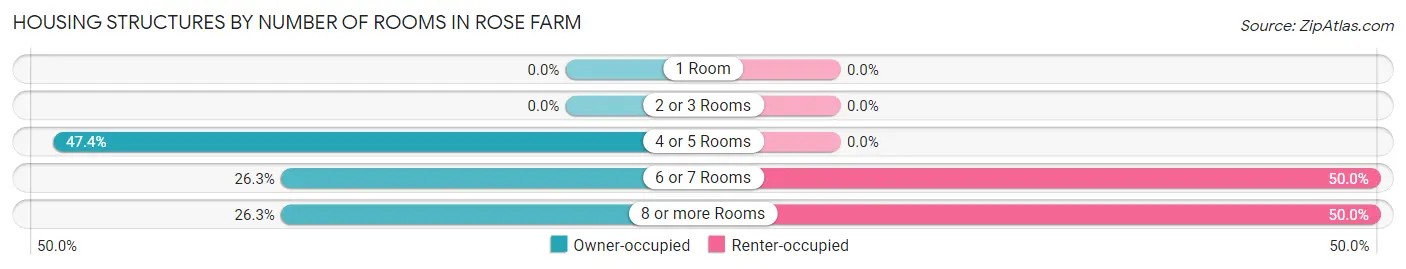
| Number of Rooms | Owner-occupied | Renter-occupied |
| 1 Room | 0 (0.0%) | 0 (0.0%) |
| 2 or 3 Rooms | 0 (0.0%) | 0 (0.0%) |
| 4 or 5 Rooms | 18 (47.4%) | 0 (0.0%) |
| 6 or 7 Rooms | 10 (26.3%) | 13 (50.0%) |
| 8 or more Rooms | 10 (26.3%) | 13 (50.0%) |
| Total | 38 (100.0%) | 26 (100.0%) |
Housing Structure by Heating Type in Rose Farm
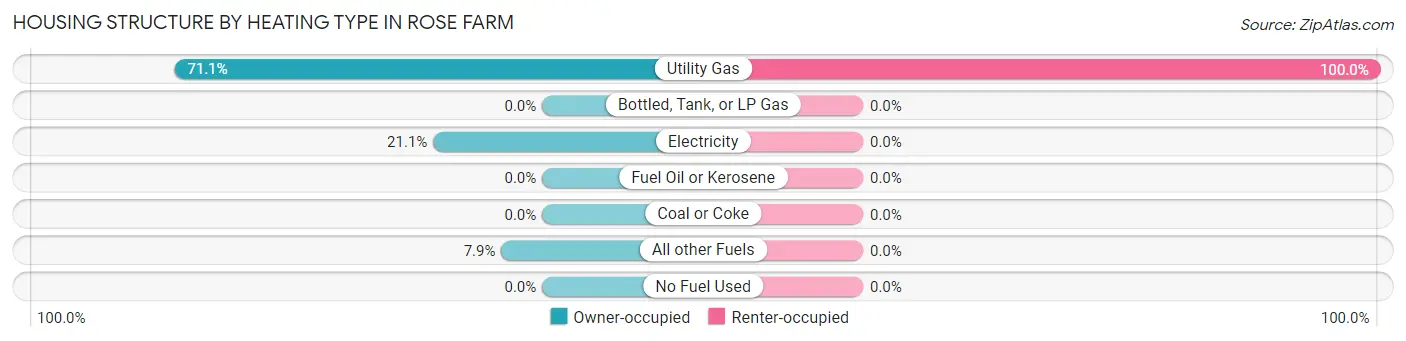
| Heating Type | Owner-occupied | Renter-occupied |
| Utility Gas | 27 (71.1%) | 26 (100.0%) |
| Bottled, Tank, or LP Gas | 0 (0.0%) | 0 (0.0%) |
| Electricity | 8 (21.0%) | 0 (0.0%) |
| Fuel Oil or Kerosene | 0 (0.0%) | 0 (0.0%) |
| Coal or Coke | 0 (0.0%) | 0 (0.0%) |
| All other Fuels | 3 (7.9%) | 0 (0.0%) |
| No Fuel Used | 0 (0.0%) | 0 (0.0%) |
| Total | 38 (100.0%) | 26 (100.0%) |
Household Vehicle Usage in Rose Farm
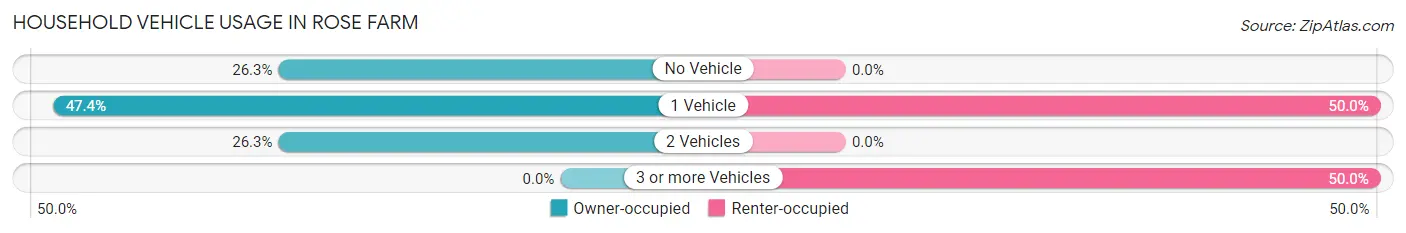
| Vehicles per Household | Owner-occupied | Renter-occupied |
| No Vehicle | 10 (26.3%) | 0 (0.0%) |
| 1 Vehicle | 18 (47.4%) | 13 (50.0%) |
| 2 Vehicles | 10 (26.3%) | 0 (0.0%) |
| 3 or more Vehicles | 0 (0.0%) | 13 (50.0%) |
| Total | 38 (100.0%) | 26 (100.0%) |
Real Estate & Mortgages in Rose Farm
Real Estate and Mortgage Overview in Rose Farm
| Characteristic | Without Mortgage | With Mortgage |
| Housing Units | 31 | 7 |
| Median Property Value | $94,500 | $0 |
| Median Household Income | $11,719 | $0 |
| Monthly Housing Costs | $313 | $0 |
| Real Estate Taxes | $690 | $0 |
Property Value by Mortgage Status in Rose Farm
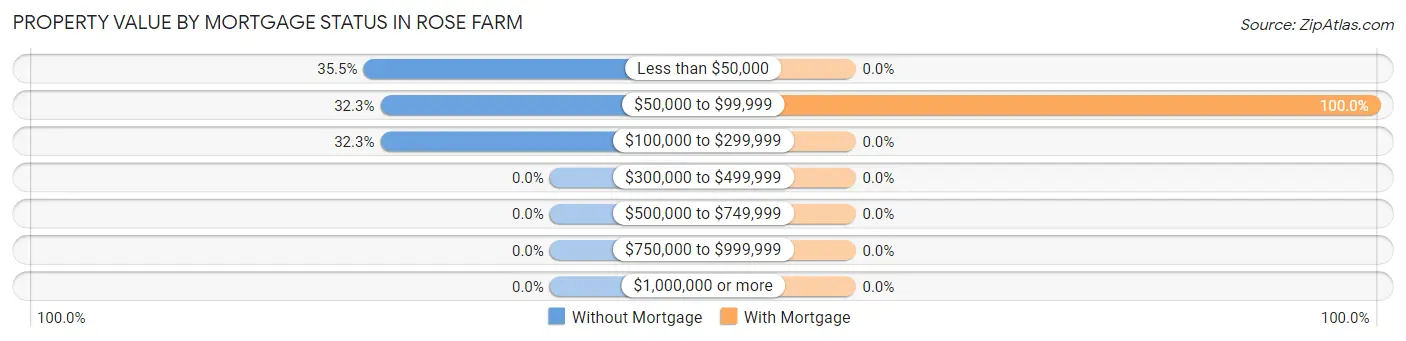
| Property Value | Without Mortgage | With Mortgage |
| Less than $50,000 | 11 (35.5%) | 0 (0.0%) |
| $50,000 to $99,999 | 10 (32.3%) | 7 (100.0%) |
| $100,000 to $299,999 | 10 (32.3%) | 0 (0.0%) |
| $300,000 to $499,999 | 0 (0.0%) | 0 (0.0%) |
| $500,000 to $749,999 | 0 (0.0%) | 0 (0.0%) |
| $750,000 to $999,999 | 0 (0.0%) | 0 (0.0%) |
| $1,000,000 or more | 0 (0.0%) | 0 (0.0%) |
| Total | 31 (100.0%) | 7 (100.0%) |
Household Income by Mortgage Status in Rose Farm
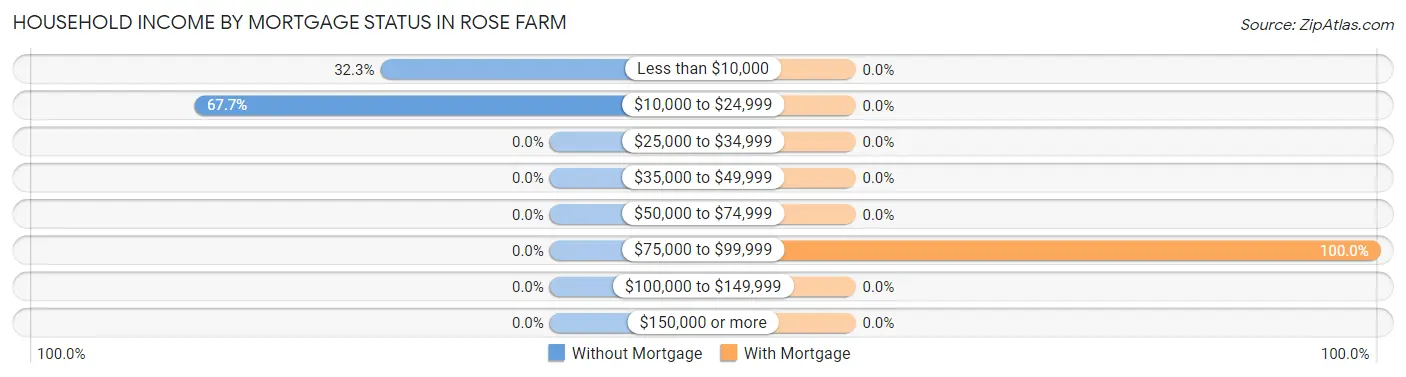
| Household Income | Without Mortgage | With Mortgage |
| Less than $10,000 | 10 (32.3%) | 0 (0.0%) |
| $10,000 to $24,999 | 21 (67.7%) | 0 (0.0%) |
| $25,000 to $34,999 | 0 (0.0%) | 0 (0.0%) |
| $35,000 to $49,999 | 0 (0.0%) | 0 (0.0%) |
| $50,000 to $74,999 | 0 (0.0%) | 0 (0.0%) |
| $75,000 to $99,999 | 0 (0.0%) | 7 (100.0%) |
| $100,000 to $149,999 | 0 (0.0%) | 0 (0.0%) |
| $150,000 or more | 0 (0.0%) | 0 (0.0%) |
| Total | 31 (100.0%) | 7 (100.0%) |
Property Value to Household Income Ratio in Rose Farm
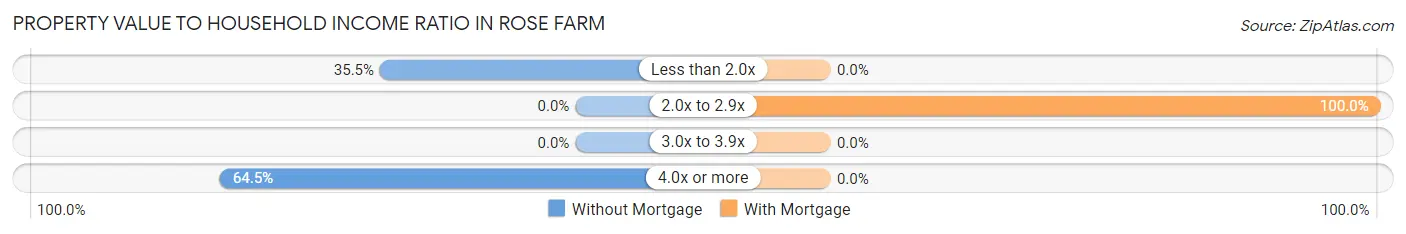
| Value-to-Income Ratio | Without Mortgage | With Mortgage |
| Less than 2.0x | 11 (35.5%) | 0 (0.0%) |
| 2.0x to 2.9x | 0 (0.0%) | 7 (100.0%) |
| 3.0x to 3.9x | 0 (0.0%) | 0 (0.0%) |
| 4.0x or more | 20 (64.5%) | 0 (0.0%) |
| Total | 31 (100.0%) | 7 (100.0%) |
Real Estate Taxes by Mortgage Status in Rose Farm
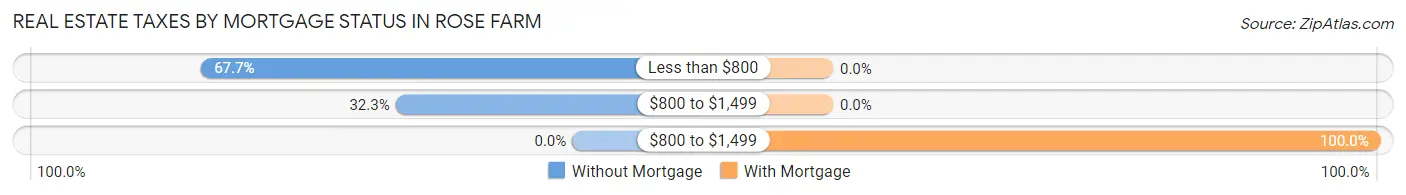
| Property Taxes | Without Mortgage | With Mortgage |
| Less than $800 | 21 (67.7%) | 0 (0.0%) |
| $800 to $1,499 | 10 (32.3%) | 0 (0.0%) |
| $800 to $1,499 | 0 (0.0%) | 7 (100.0%) |
| Total | 31 (100.0%) | 7 (100.0%) |
Health & Disability in Rose Farm
Health Insurance Coverage by Age in Rose Farm
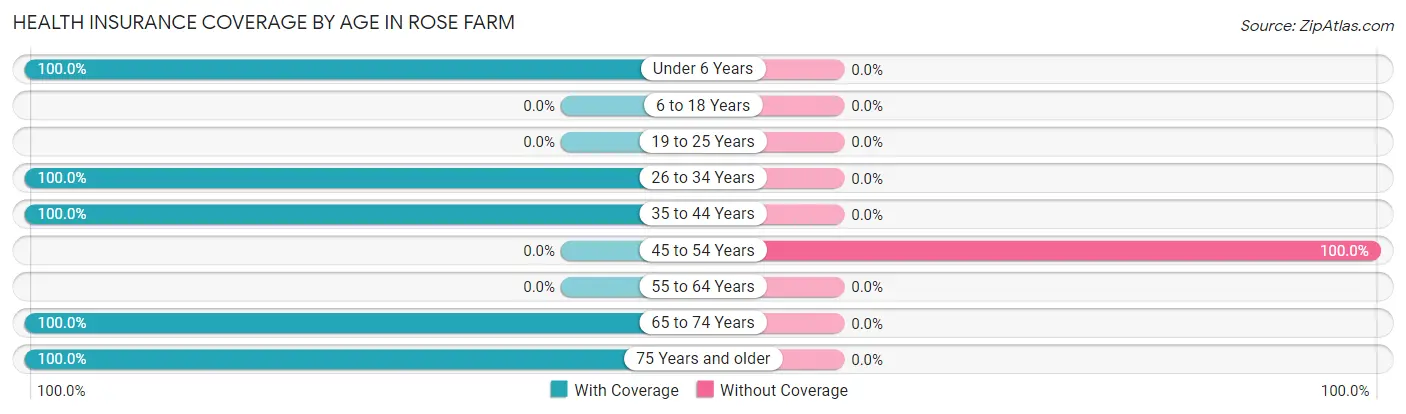
| Age Bracket | With Coverage | Without Coverage |
| Under 6 Years | 10 (100.0%) | 0 (0.0%) |
| 6 to 18 Years | 0 (0.0%) | 0 (0.0%) |
| 19 to 25 Years | 0 (0.0%) | 0 (0.0%) |
| 26 to 34 Years | 39 (100.0%) | 0 (0.0%) |
| 35 to 44 Years | 13 (100.0%) | 0 (0.0%) |
| 45 to 54 Years | 0 (0.0%) | 8 (100.0%) |
| 55 to 64 Years | 0 (0.0%) | 0 (0.0%) |
| 65 to 74 Years | 3 (100.0%) | 0 (0.0%) |
| 75 Years and older | 20 (100.0%) | 0 (0.0%) |
| Total | 85 (91.4%) | 8 (8.6%) |
Health Insurance Coverage by Citizenship Status in Rose Farm
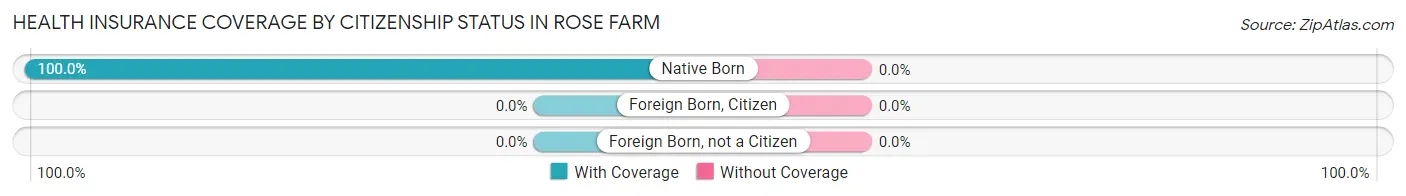
| Citizenship Status | With Coverage | Without Coverage |
| Native Born | 10 (100.0%) | 0 (0.0%) |
| Foreign Born, Citizen | 0 (0.0%) | 0 (0.0%) |
| Foreign Born, not a Citizen | 0 (0.0%) | 0 (0.0%) |
Health Insurance Coverage by Household Income in Rose Farm
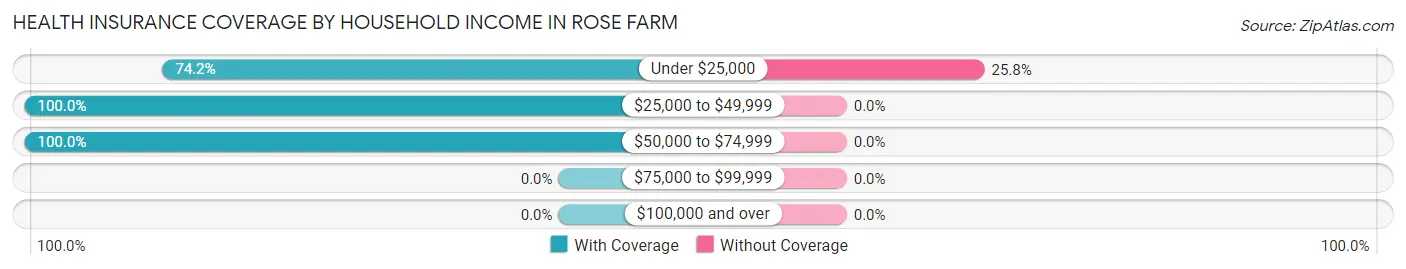
| Household Income | With Coverage | Without Coverage |
| Under $25,000 | 23 (74.2%) | 8 (25.8%) |
| $25,000 to $49,999 | 13 (100.0%) | 0 (0.0%) |
| $50,000 to $74,999 | 49 (100.0%) | 0 (0.0%) |
| $75,000 to $99,999 | 0 (0.0%) | 0 (0.0%) |
| $100,000 and over | 0 (0.0%) | 0 (0.0%) |
Public vs Private Health Insurance Coverage by Age in Rose Farm
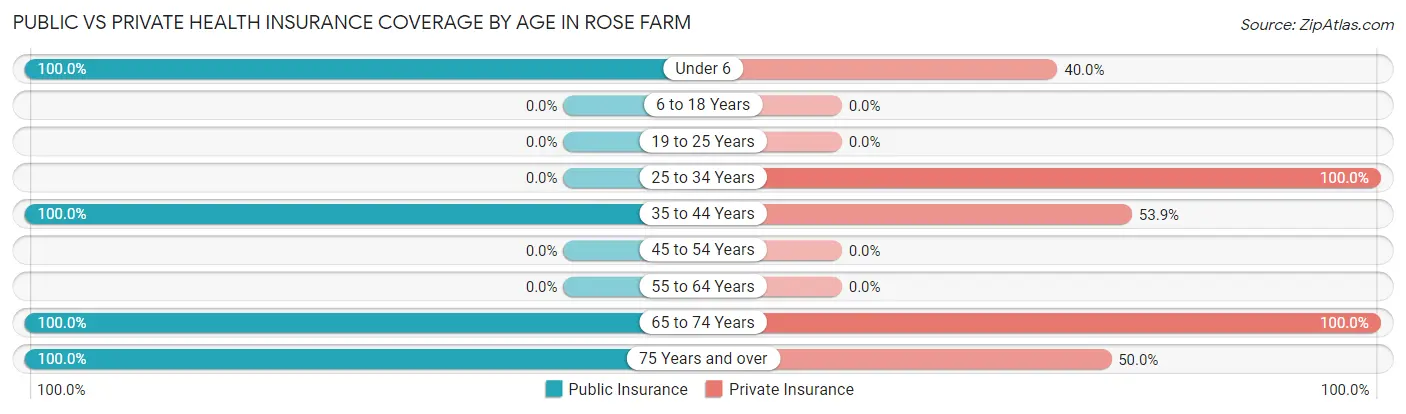
| Age Bracket | Public Insurance | Private Insurance |
| Under 6 | 10 (100.0%) | 4 (40.0%) |
| 6 to 18 Years | 0 (0.0%) | 0 (0.0%) |
| 19 to 25 Years | 0 (0.0%) | 0 (0.0%) |
| 25 to 34 Years | 0 (0.0%) | 39 (100.0%) |
| 35 to 44 Years | 13 (100.0%) | 7 (53.8%) |
| 45 to 54 Years | 0 (0.0%) | 0 (0.0%) |
| 55 to 64 Years | 0 (0.0%) | 0 (0.0%) |
| 65 to 74 Years | 3 (100.0%) | 3 (100.0%) |
| 75 Years and over | 20 (100.0%) | 10 (50.0%) |
| Total | 46 (49.5%) | 63 (67.7%) |
Disability Status by Sex by Age in Rose Farm
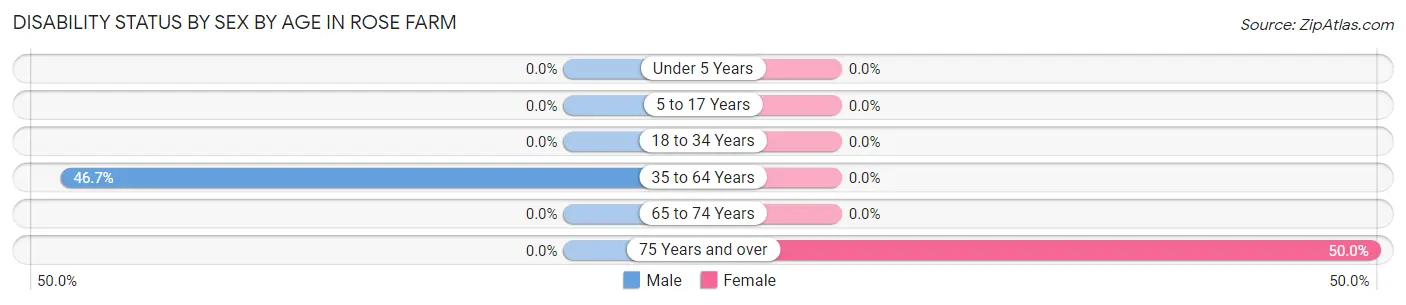
| Age Bracket | Male | Female |
| Under 5 Years | 0 (0.0%) | 0 (0.0%) |
| 5 to 17 Years | 0 (0.0%) | 0 (0.0%) |
| 18 to 34 Years | 0 (0.0%) | 0 (0.0%) |
| 35 to 64 Years | 7 (46.7%) | 0 (0.0%) |
| 65 to 74 Years | 0 (0.0%) | 0 (0.0%) |
| 75 Years and over | 0 (0.0%) | 10 (50.0%) |
Disability Class by Sex by Age in Rose Farm
Disability Class: Hearing Difficulty
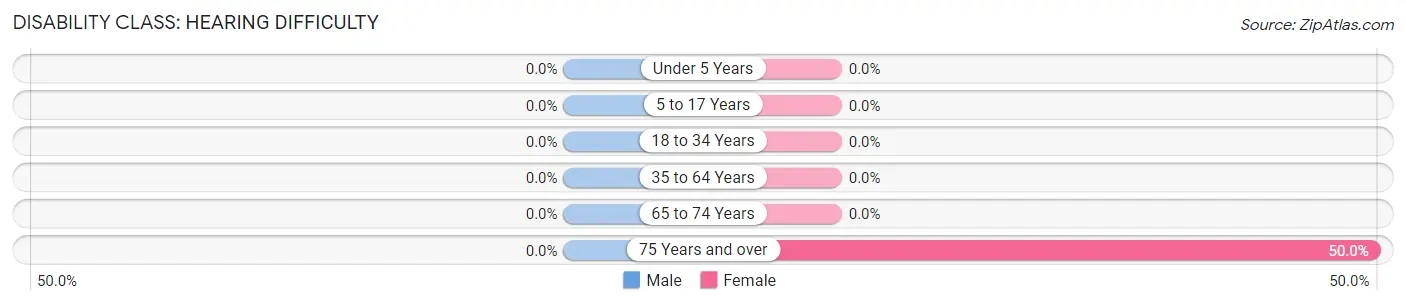
| Age Bracket | Male | Female |
| Under 5 Years | 0 (0.0%) | 0 (0.0%) |
| 5 to 17 Years | 0 (0.0%) | 0 (0.0%) |
| 18 to 34 Years | 0 (0.0%) | 0 (0.0%) |
| 35 to 64 Years | 0 (0.0%) | 0 (0.0%) |
| 65 to 74 Years | 0 (0.0%) | 0 (0.0%) |
| 75 Years and over | 0 (0.0%) | 10 (50.0%) |
Disability Class: Vision Difficulty
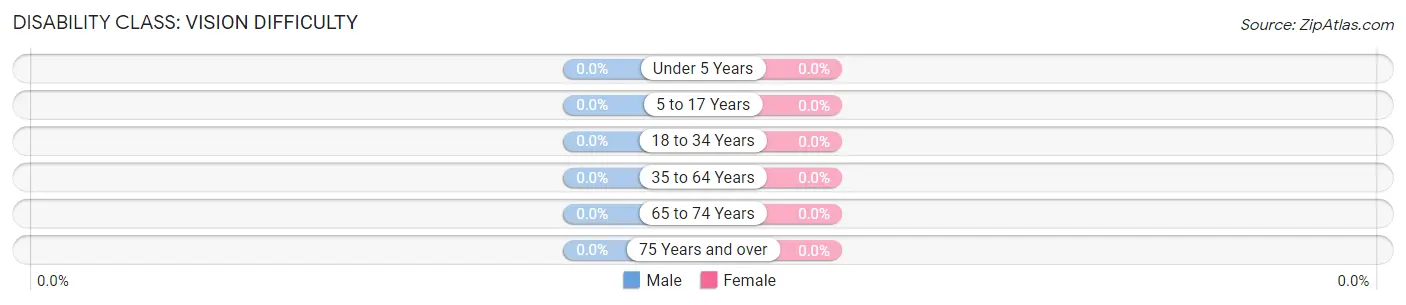
| Age Bracket | Male | Female |
| Under 5 Years | 0 (0.0%) | 0 (0.0%) |
| 5 to 17 Years | 0 (0.0%) | 0 (0.0%) |
| 18 to 34 Years | 0 (0.0%) | 0 (0.0%) |
| 35 to 64 Years | 0 (0.0%) | 0 (0.0%) |
| 65 to 74 Years | 0 (0.0%) | 0 (0.0%) |
| 75 Years and over | 0 (0.0%) | 0 (0.0%) |
Disability Class: Cognitive Difficulty
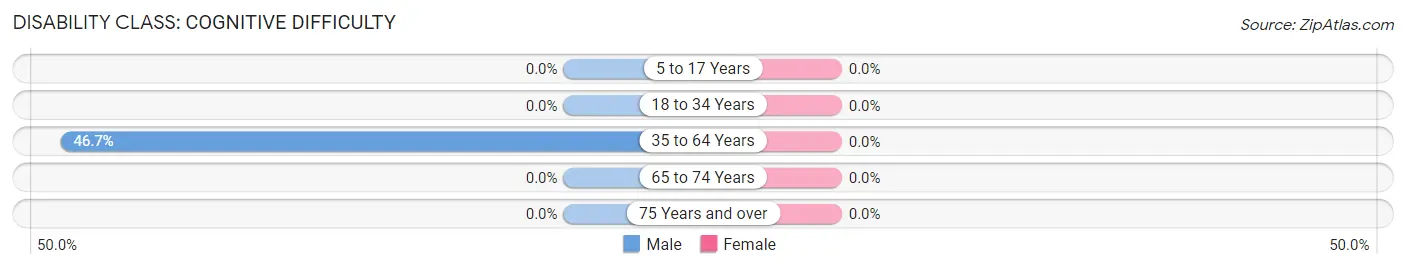
| Age Bracket | Male | Female |
| 5 to 17 Years | 0 (0.0%) | 0 (0.0%) |
| 18 to 34 Years | 0 (0.0%) | 0 (0.0%) |
| 35 to 64 Years | 7 (46.7%) | 0 (0.0%) |
| 65 to 74 Years | 0 (0.0%) | 0 (0.0%) |
| 75 Years and over | 0 (0.0%) | 0 (0.0%) |
Disability Class: Ambulatory Difficulty
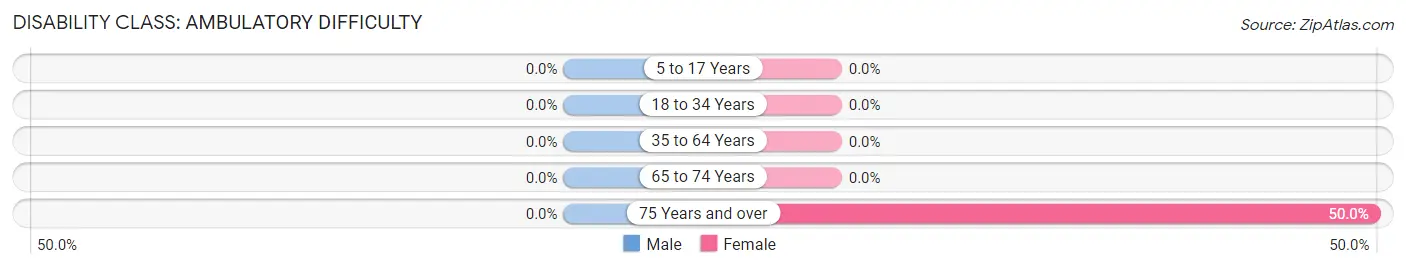
| Age Bracket | Male | Female |
| 5 to 17 Years | 0 (0.0%) | 0 (0.0%) |
| 18 to 34 Years | 0 (0.0%) | 0 (0.0%) |
| 35 to 64 Years | 0 (0.0%) | 0 (0.0%) |
| 65 to 74 Years | 0 (0.0%) | 0 (0.0%) |
| 75 Years and over | 0 (0.0%) | 10 (50.0%) |
Disability Class: Self-Care Difficulty
| Age Bracket | Male | Female |
| 5 to 17 Years | 0 (0.0%) | 0 (0.0%) |
| 18 to 34 Years | 0 (0.0%) | 0 (0.0%) |
| 35 to 64 Years | 0 (0.0%) | 0 (0.0%) |
| 65 to 74 Years | 0 (0.0%) | 0 (0.0%) |
| 75 Years and over | 0 (0.0%) | 0 (0.0%) |
Technology Access in Rose Farm
Computing Device Access in Rose Farm
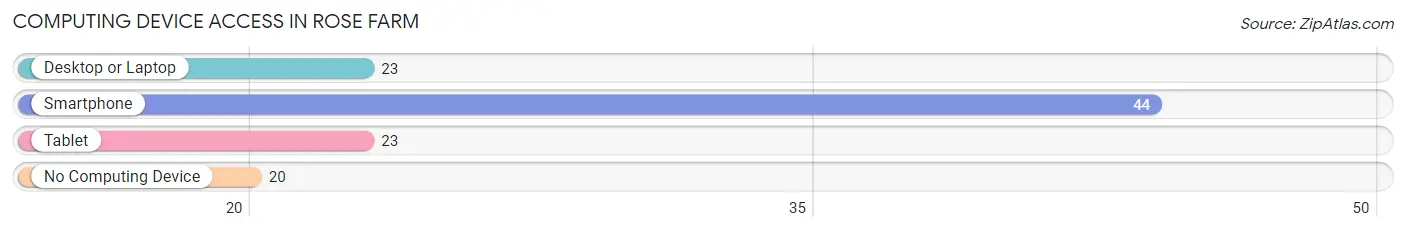
| Device Type | # Households | % Households |
| Desktop or Laptop | 23 | 35.9% |
| Smartphone | 44 | 68.8% |
| Tablet | 23 | 35.9% |
| No Computing Device | 20 | 31.2% |
| Total | 64 | 100.0% |
Internet Access in Rose Farm
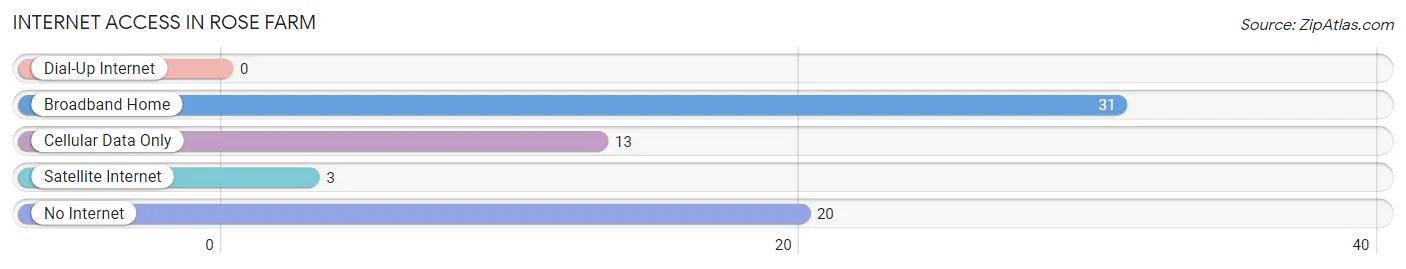
| Internet Type | # Households | % Households |
| Dial-Up Internet | 0 | 0.0% |
| Broadband Home | 31 | 48.4% |
| Cellular Data Only | 13 | 20.3% |
| Satellite Internet | 3 | 4.7% |
| No Internet | 20 | 31.2% |
| Total | 64 | 100.0% |
Rose Farm Summary
History
The small town of Rose Farm, Ohio is located in the southeastern corner of the state, in the Appalachian region. It was founded in 1820 by a group of settlers from Pennsylvania, who were looking for a place to start a new life. The town was named after the wild roses that grew in abundance in the area.
The town grew slowly over the years, and by the turn of the 20th century, it had become a thriving agricultural community. The main crops grown in the area were corn, wheat, and hay. The town also had a few small businesses, including a general store, a blacksmith, and a sawmill.
In the early 1900s, the town began to experience a period of growth and prosperity. The railroad came to town in 1906, bringing with it new opportunities for trade and commerce. The town also saw the construction of a new school, a post office, and a bank.
By the mid-1900s, Rose Farm had become a bustling small town. The population had grown to over 1,000 people, and the town had become a popular tourist destination. The town was known for its beautiful scenery, its friendly people, and its abundance of wild roses.
Geography
Rose Farm is located in the Appalachian region of Ohio, in the southeastern corner of the state. It is situated in a valley between two mountain ranges, the Allegheny Mountains to the east and the Appalachian Mountains to the west. The town is surrounded by rolling hills and lush forests.
The town is located near the Ohio River, which provides a source of water for the town and its surrounding area. The climate in Rose Farm is temperate, with hot summers and cold winters. The average annual temperature is around 50 degrees Fahrenheit.
Economy
The economy of Rose Farm is largely based on agriculture. The main crops grown in the area are corn, wheat, and hay. The town also has a few small businesses, including a general store, a blacksmith, and a sawmill.
The town is also home to a few manufacturing companies, which produce a variety of products, including furniture, clothing, and electronics. The town also has a few restaurants and bars, which provide employment for many of the town’s residents.
Demographics
As of the 2010 census, the population of Rose Farm was 1,093. The town is predominantly white, with a small minority population of African Americans, Hispanics, and Native Americans. The median household income in the town is $37,000, and the median age is 40 years old.
The town is served by the Rose Farm School District, which includes two elementary schools, a middle school, and a high school. The town also has a public library, a post office, and a few churches.
Conclusion
Rose Farm, Ohio is a small town located in the Appalachian region of the state. It was founded in 1820 by a group of settlers from Pennsylvania, and has since grown into a thriving agricultural community. The town is known for its beautiful scenery, its friendly people, and its abundance of wild roses. The economy of the town is largely based on agriculture, and it also has a few small businesses and manufacturing companies. The population of Rose Farm is predominantly white, with a small minority population of African Americans, Hispanics, and Native Americans. The town is served by the Rose Farm School District, and it also has a public library, a post office, and a few churches.
Common Questions
What is Per Capita Income in Rose Farm?
Per Capita income in Rose Farm is $19,809.
What is Inequality or Gini Index in Rose Farm?
Inequality or Gini Index in Rose Farm is 0.36.
What is the Total Population of Rose Farm?
Total Population of Rose Farm is 93.
What is the Total Male Population of Rose Farm?
Total Male Population of Rose Farm is 48.
What is the Total Female Population of Rose Farm?
Total Female Population of Rose Farm is 45.
What is the Ratio of Males per 100 Females in Rose Farm?
There are 106.67 Males per 100 Females in Rose Farm.
What is the Ratio of Females per 100 Males in Rose Farm?
There are 93.75 Females per 100 Males in Rose Farm.
What is the Median Population Age in Rose Farm?
Median Population Age in Rose Farm is 31.8 Years.
What is the Average Family Size in Rose Farm
Average Family Size in Rose Farm is 2.4 People.
What is the Average Household Size in Rose Farm
Average Household Size in Rose Farm is 1.4 People.
How Large is the Labor Force in Rose Farm?
There are 52 People in the Labor Forcein in Rose Farm.
What is the Percentage of People in the Labor Force in Rose Farm?
62.7% of People are in the Labor Force in Rose Farm.