Richmond Dale, OH Map & Demographics
Richmond Dale Map
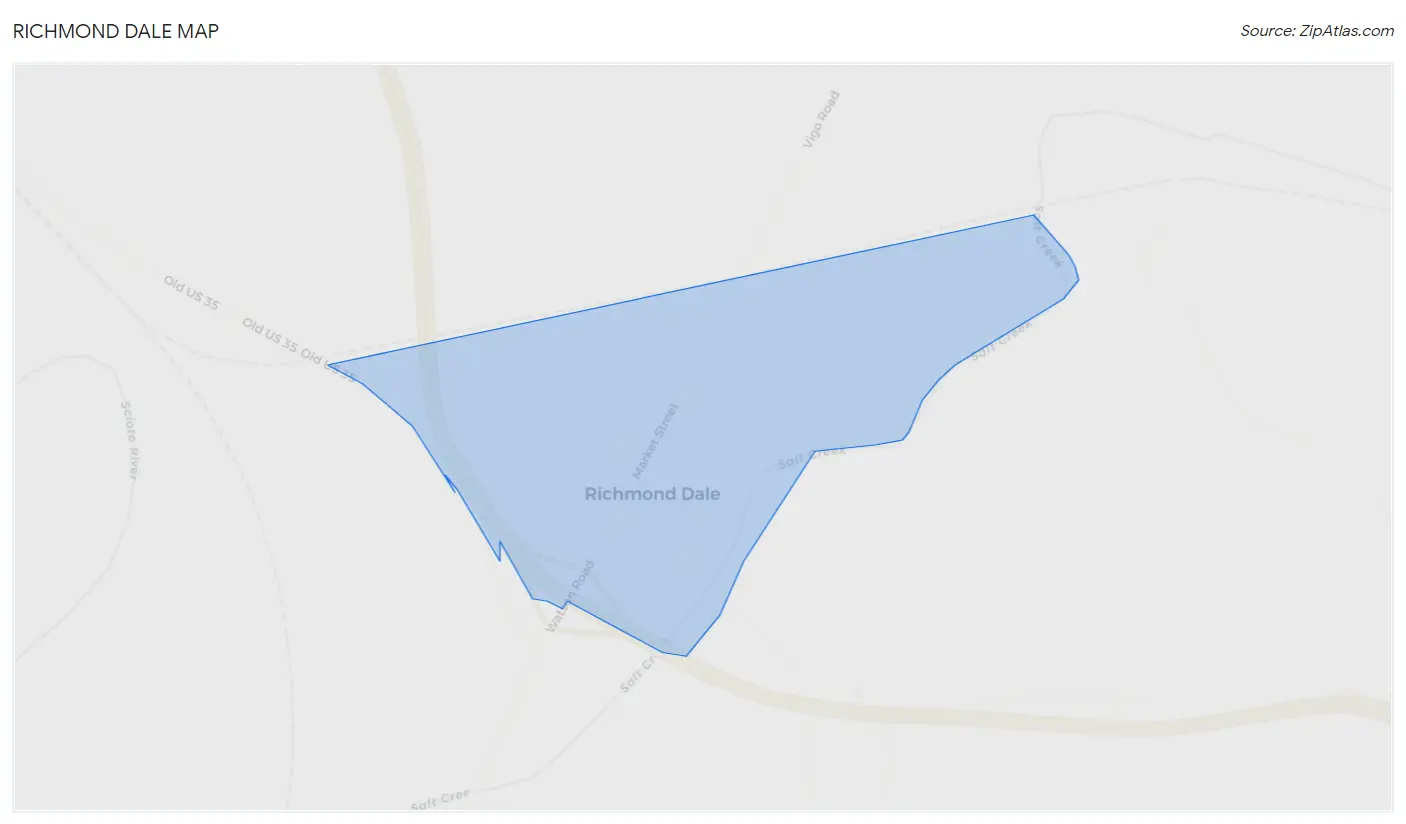
Richmond Dale Overview
$16,102
PER CAPITA INCOME
0.25
INEQUALITY / GINI INDEX
423
TOTAL POPULATION
157
MALE POPULATION
266
FEMALE POPULATION
59.02
MALES / 100 FEMALES
169.43
FEMALES / 100 MALES
28.4
MEDIAN AGE
2.7
AVG FAMILY SIZE
2.6
AVG HOUSEHOLD SIZE
104
LABOR FORCE [ PEOPLE ]
38.8%
PERCENT IN LABOR FORCE
Richmond Dale Zip Codes
Richmond Dale Area Codes
Income in Richmond Dale
Income Overview in Richmond Dale
| Characteristic | Number | Measure |
| Per Capita Income | 423 | $16,102 |
| Median Family Income | 153 | $0 |
| Mean Family Income | 153 | $55,531 |
| Median Household Income | 165 | $0 |
| Mean Household Income | 165 | $53,258 |
| Income Deficit | 153 | $0 |
| Wage / Income Gap (%) | 423 | 0.00% |
| Wage / Income Gap ($) | 423 | 100.00¢ per $1 |
| Gini / Inequality Index | 423 | 0.25 |
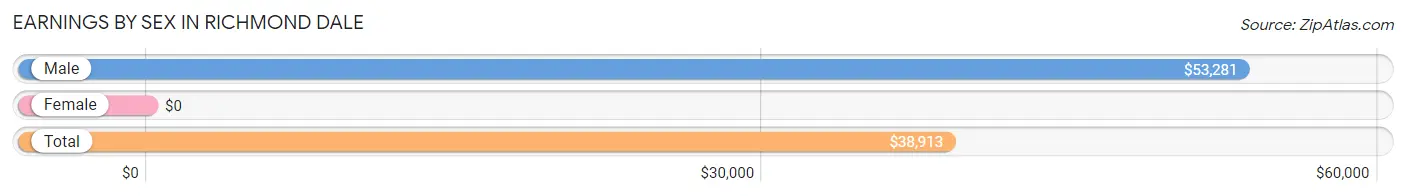
Earnings by Sex in Richmond Dale
| Sex | Number | Average Earnings |
| Male | 69 (66.3%) | $53,281 |
| Female | 35 (33.7%) | $0 |
| Total | 104 (100.0%) | $38,913 |
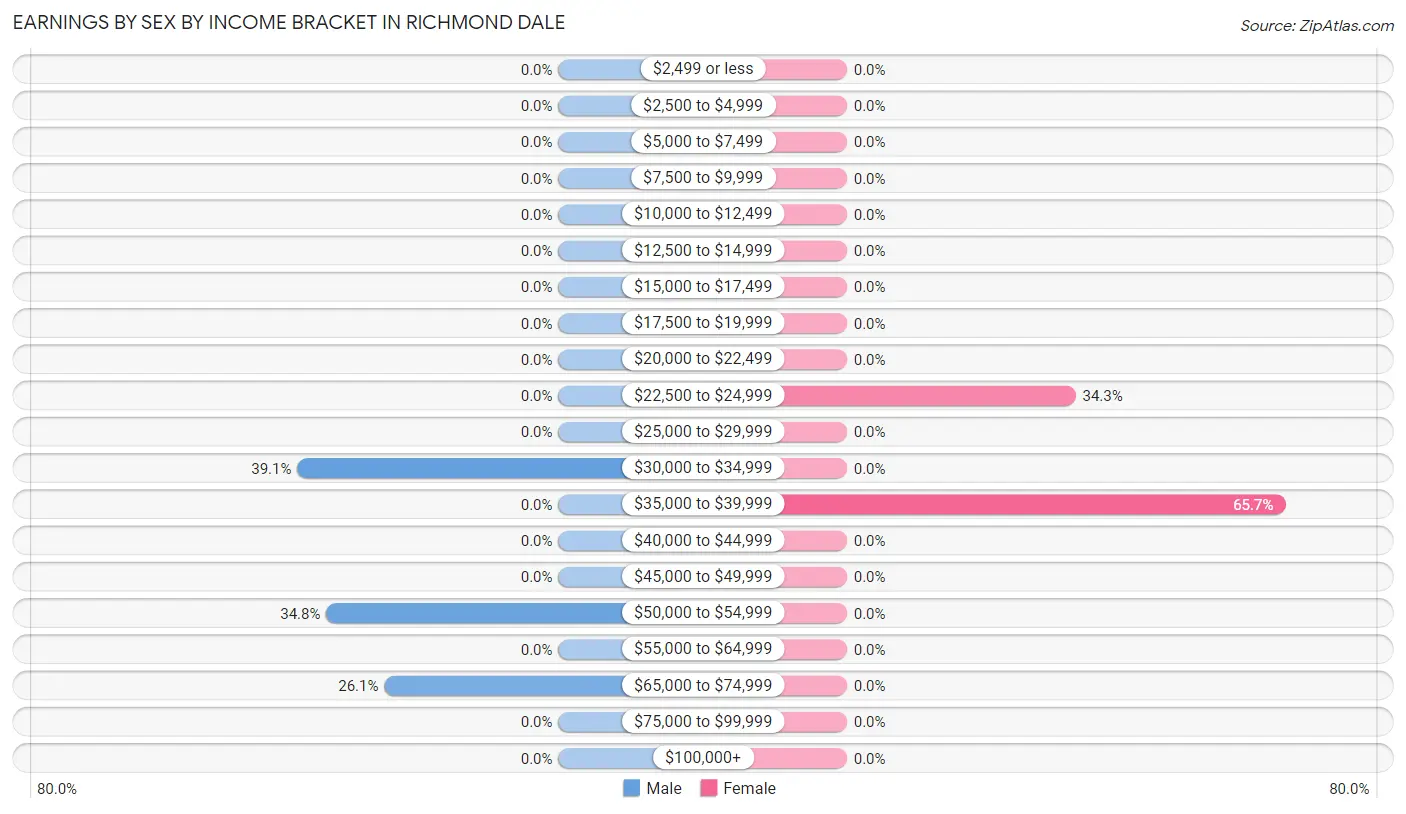
Earnings by Sex by Income Bracket in Richmond Dale
The most common earnings brackets in Richmond Dale are $30,000 to $34,999 for men (27 | 39.1%) and $35,000 to $39,999 for women (23 | 65.7%).
| Income | Male | Female |
| $2,499 or less | 0 (0.0%) | 0 (0.0%) |
| $2,500 to $4,999 | 0 (0.0%) | 0 (0.0%) |
| $5,000 to $7,499 | 0 (0.0%) | 0 (0.0%) |
| $7,500 to $9,999 | 0 (0.0%) | 0 (0.0%) |
| $10,000 to $12,499 | 0 (0.0%) | 0 (0.0%) |
| $12,500 to $14,999 | 0 (0.0%) | 0 (0.0%) |
| $15,000 to $17,499 | 0 (0.0%) | 0 (0.0%) |
| $17,500 to $19,999 | 0 (0.0%) | 0 (0.0%) |
| $20,000 to $22,499 | 0 (0.0%) | 0 (0.0%) |
| $22,500 to $24,999 | 0 (0.0%) | 12 (34.3%) |
| $25,000 to $29,999 | 0 (0.0%) | 0 (0.0%) |
| $30,000 to $34,999 | 27 (39.1%) | 0 (0.0%) |
| $35,000 to $39,999 | 0 (0.0%) | 23 (65.7%) |
| $40,000 to $44,999 | 0 (0.0%) | 0 (0.0%) |
| $45,000 to $49,999 | 0 (0.0%) | 0 (0.0%) |
| $50,000 to $54,999 | 24 (34.8%) | 0 (0.0%) |
| $55,000 to $64,999 | 0 (0.0%) | 0 (0.0%) |
| $65,000 to $74,999 | 18 (26.1%) | 0 (0.0%) |
| $75,000 to $99,999 | 0 (0.0%) | 0 (0.0%) |
| $100,000+ | 0 (0.0%) | 0 (0.0%) |
| Total | 69 (100.0%) | 35 (100.0%) |
Earnings by Sex by Educational Attainment in Richmond Dale
| Educational Attainment | Male Income | Female Income |
| Less than High School | - | - |
| High School Diploma | - | - |
| College or Associate's Degree | - | - |
| Bachelor's Degree | - | - |
| Graduate Degree | - | - |
| Total | $53,281 | $0 |
Family Income in Richmond Dale
Family Income Brackets in Richmond Dale
According to the Richmond Dale family income data, there are 77 families falling into the $25,000 to $34,999 income range, which is the most common income bracket and makes up 50.3% of all families.
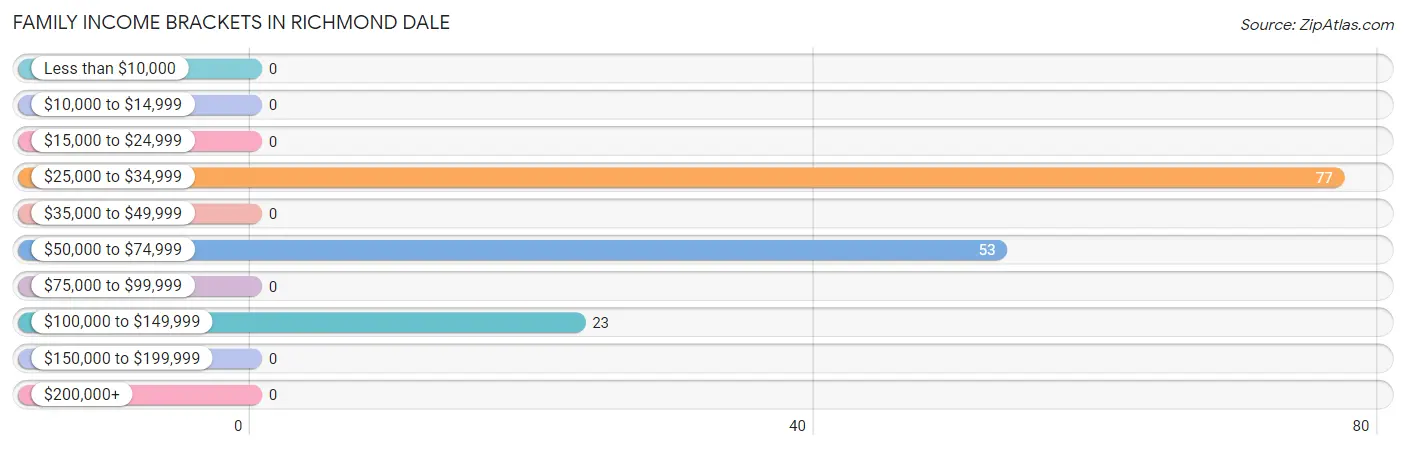
| Income Bracket | # Families | % Families |
| Less than $10,000 | 0 | 0.0% |
| $10,000 to $14,999 | 0 | 0.0% |
| $15,000 to $24,999 | 0 | 0.0% |
| $25,000 to $34,999 | 77 | 50.3% |
| $35,000 to $49,999 | 0 | 0.0% |
| $50,000 to $74,999 | 53 | 34.6% |
| $75,000 to $99,999 | 0 | 0.0% |
| $100,000 to $149,999 | 23 | 15.0% |
| $150,000 to $199,999 | 0 | 0.0% |
| $200,000+ | 0 | 0.0% |
Family Income by Famaliy Size in Richmond Dale
| Income Bracket | # Families | Median Income |
| 2-Person Families | 52 (34.0%) | $0 |
| 3-Person Families | 24 (15.7%) | $0 |
| 4-Person Families | 77 (50.3%) | $0 |
| 5-Person Families | 0 (0.0%) | $0 |
| 6-Person Families | 0 (0.0%) | $0 |
| 7+ Person Families | 0 (0.0%) | $0 |
| Total | 153 (100.0%) | $0 |
Family Income by Number of Earners in Richmond Dale
| Number of Earners | # Families | Median Income |
| No Earners | 29 (19.0%) | $0 |
| 1 Earner | 101 (66.0%) | $0 |
| 2 Earners | 23 (15.0%) | $0 |
| 3+ Earners | 0 (0.0%) | $0 |
| Total | 153 (100.0%) | $0 |
Household Income in Richmond Dale
Household Income Brackets in Richmond Dale
With 77 households falling in the category, the $25,000 to $34,999 income range is the most frequent in Richmond Dale, accounting for 46.7% of all households.
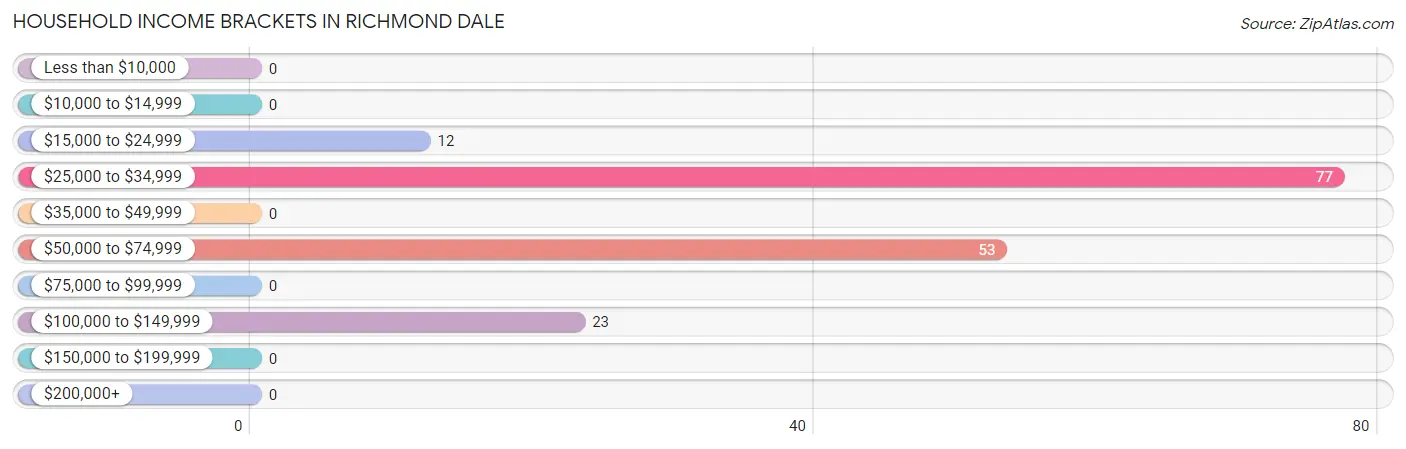
| Income Bracket | # Households | % Households |
| Less than $10,000 | 0 | 0.0% |
| $10,000 to $14,999 | 0 | 0.0% |
| $15,000 to $24,999 | 12 | 7.3% |
| $25,000 to $34,999 | 77 | 46.7% |
| $35,000 to $49,999 | 0 | 0.0% |
| $50,000 to $74,999 | 53 | 32.1% |
| $75,000 to $99,999 | 0 | 0.0% |
| $100,000 to $149,999 | 23 | 13.9% |
| $150,000 to $199,999 | 0 | 0.0% |
| $200,000+ | 0 | 0.0% |
Household Income by Householder Age in Richmond Dale
The median household income in Richmond Dale is $0, with the highest median household income of $56,118 found in the 65+ years age bracket for the primary householder. A total of 41 households (24.8%) fall into this category.
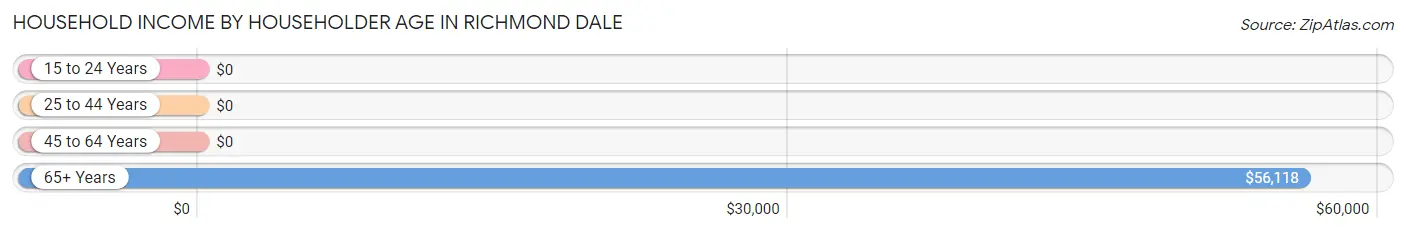
| Income Bracket | # Households | Median Income |
| 15 to 24 Years | 0 (0.0%) | $0 |
| 25 to 44 Years | 101 (61.2%) | $0 |
| 45 to 64 Years | 23 (13.9%) | $0 |
| 65+ Years | 41 (24.8%) | $56,118 |
| Total | 165 (100.0%) | $0 |
Poverty in Richmond Dale
Income Below Poverty by Sex and Age in Richmond Dale
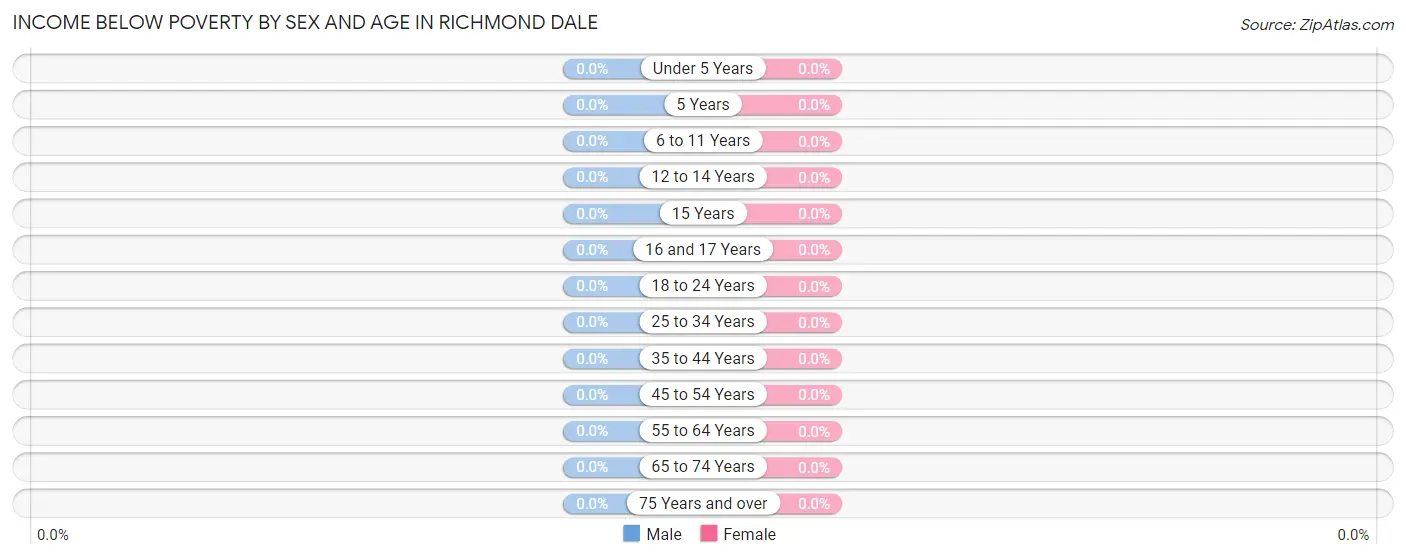
| Age Bracket | Male | Female |
| Under 5 Years | 0 (0.0%) | 0 (0.0%) |
| 5 Years | 0 (0.0%) | 0 (0.0%) |
| 6 to 11 Years | 0 (0.0%) | 0 (0.0%) |
| 12 to 14 Years | 0 (0.0%) | 0 (0.0%) |
| 15 Years | 0 (0.0%) | 0 (0.0%) |
| 16 and 17 Years | 0 (0.0%) | 0 (0.0%) |
| 18 to 24 Years | 0 (0.0%) | 0 (0.0%) |
| 25 to 34 Years | 0 (0.0%) | 0 (0.0%) |
| 35 to 44 Years | 0 (0.0%) | 0 (0.0%) |
| 45 to 54 Years | 0 (0.0%) | 0 (0.0%) |
| 55 to 64 Years | 0 (0.0%) | 0 (0.0%) |
| 65 to 74 Years | 0 (0.0%) | 0 (0.0%) |
| 75 Years and over | 0 (0.0%) | 0 (0.0%) |
| Total | 0 (0.0%) | 0 (0.0%) |
Income Above Poverty by Sex and Age in Richmond Dale
According to the poverty statistics in Richmond Dale, males aged under 5 years and females aged 6 to 11 years are the age groups that are most secure financially, with 100.0% of males and 100.0% of females in these age groups living above the poverty line.
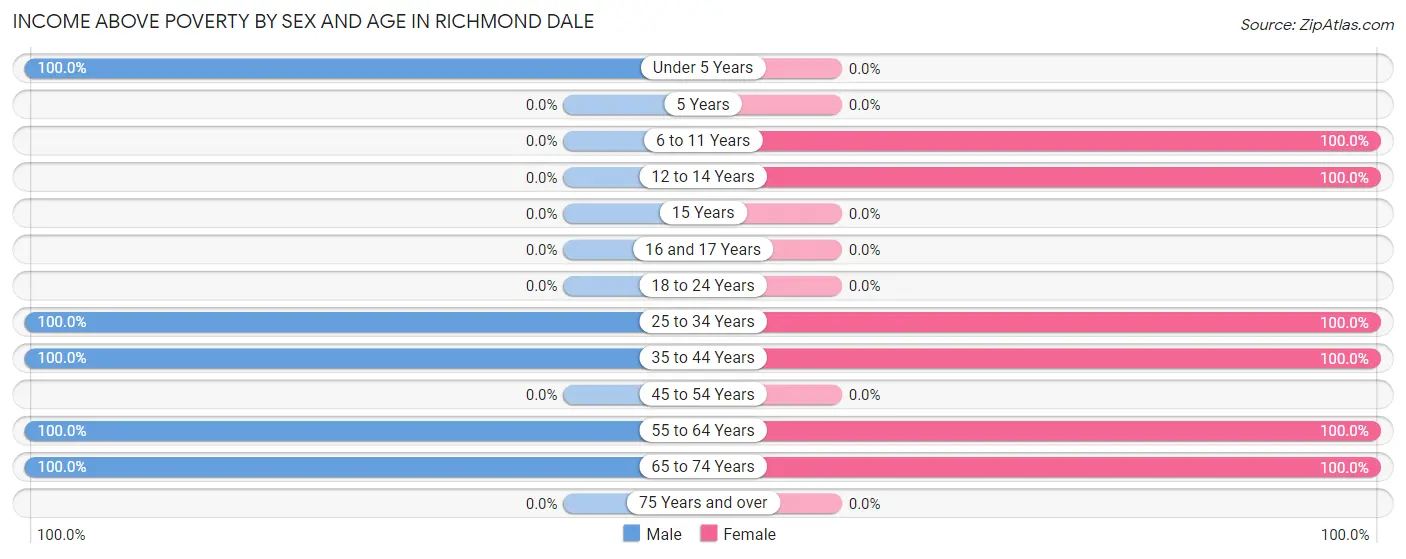
| Age Bracket | Male | Female |
| Under 5 Years | 59 (100.0%) | 0 (0.0%) |
| 5 Years | 0 (0.0%) | 0 (0.0%) |
| 6 to 11 Years | 0 (0.0%) | 74 (100.0%) |
| 12 to 14 Years | 0 (0.0%) | 22 (100.0%) |
| 15 Years | 0 (0.0%) | 0 (0.0%) |
| 16 and 17 Years | 0 (0.0%) | 0 (0.0%) |
| 18 to 24 Years | 0 (0.0%) | 0 (0.0%) |
| 25 to 34 Years | 27 (100.0%) | 77 (100.0%) |
| 35 to 44 Years | 24 (100.0%) | 23 (100.0%) |
| 45 to 54 Years | 0 (0.0%) | 0 (0.0%) |
| 55 to 64 Years | 18 (100.0%) | 47 (100.0%) |
| 65 to 74 Years | 29 (100.0%) | 23 (100.0%) |
| 75 Years and over | 0 (0.0%) | 0 (0.0%) |
| Total | 157 (100.0%) | 266 (100.0%) |
Income Below Poverty Among Married-Couple Families in Richmond Dale
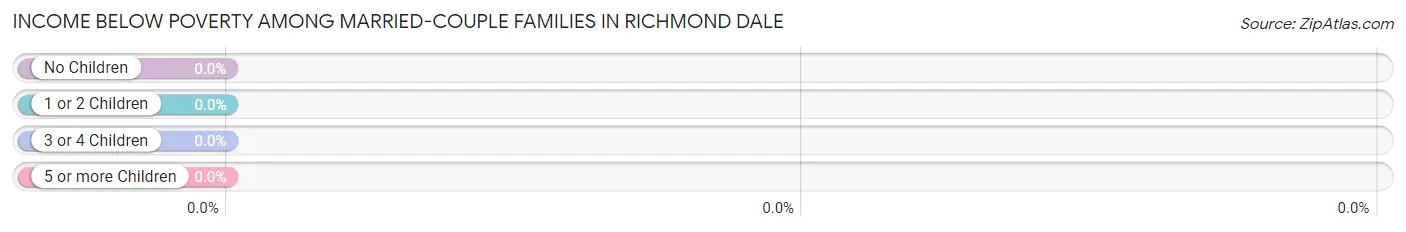
| Children | Above Poverty | Below Poverty |
| No Children | 52 (100.0%) | 0 (0.0%) |
| 1 or 2 Children | 24 (100.0%) | 0 (0.0%) |
| 3 or 4 Children | 0 (0.0%) | 0 (0.0%) |
| 5 or more Children | 0 (0.0%) | 0 (0.0%) |
| Total | 76 (100.0%) | 0 (0.0%) |
Income Below Poverty Among Single-Parent Households in Richmond Dale
| Children | Single Father | Single Mother |
| No Children | 0 (0.0%) | 0 (0.0%) |
| 1 or 2 Children | 0 (0.0%) | 0 (0.0%) |
| 3 or 4 Children | 0 (0.0%) | 0 (0.0%) |
| 5 or more Children | 0 (0.0%) | 0 (0.0%) |
| Total | 0 (0.0%) | 0 (0.0%) |
Income Below Poverty Among Married-Couple vs Single-Parent Households in Richmond Dale
| Children | Married-Couple Families | Single-Parent Households |
| No Children | 0 (0.0%) | 0 (0.0%) |
| 1 or 2 Children | 0 (0.0%) | 0 (0.0%) |
| 3 or 4 Children | 0 (0.0%) | 0 (0.0%) |
| 5 or more Children | 0 (0.0%) | 0 (0.0%) |
| Total | 0 (0.0%) | 0 (0.0%) |
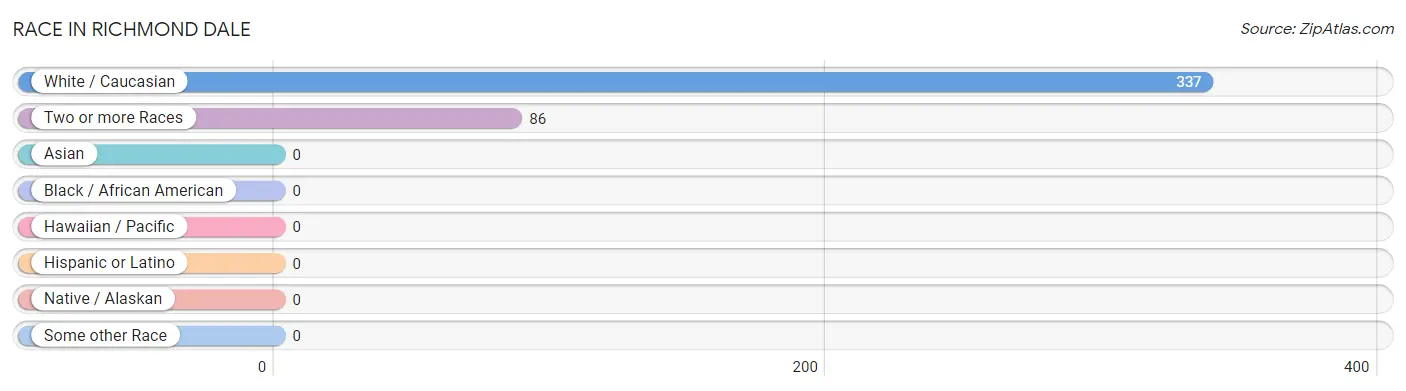
Race in Richmond Dale
The most populous races in Richmond Dale are White / Caucasian (337 | 79.7%), and Two or more Races (86 | 20.3%).
| Race | # Population | % Population |
| Asian | 0 | 0.0% |
| Black / African American | 0 | 0.0% |
| Hawaiian / Pacific | 0 | 0.0% |
| Hispanic or Latino | 0 | 0.0% |
| Native / Alaskan | 0 | 0.0% |
| White / Caucasian | 337 | 79.7% |
| Two or more Races | 86 | 20.3% |
| Some other Race | 0 | 0.0% |
| Total | 423 | 100.0% |
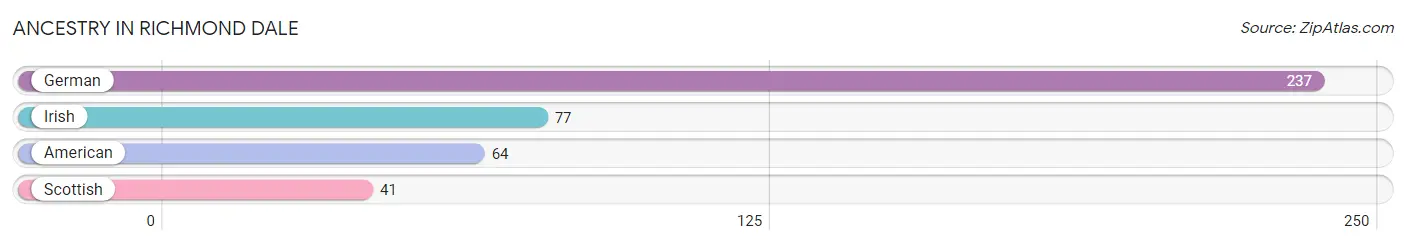
Ancestry in Richmond Dale
The most populous ancestries reported in Richmond Dale are German (237 | 56.0%), Irish (77 | 18.2%), American (64 | 15.1%), and Scottish (41 | 9.7%), together accounting for 99.0% of all Richmond Dale residents.
| Ancestry | # Population | % Population |
| American | 64 | 15.1% |
| German | 237 | 56.0% |
| Irish | 77 | 18.2% |
| Scottish | 41 | 9.7% | View All 4 Rows |
Immigrants in Richmond Dale

| Immigration Origin | # Population | % Population | View All 0 Rows |
Sex and Age in Richmond Dale
Sex and Age in Richmond Dale
The most populous age groups in Richmond Dale are Under 5 Years (59 | 37.6%) for men and 25 to 29 Years (77 | 28.9%) for women.
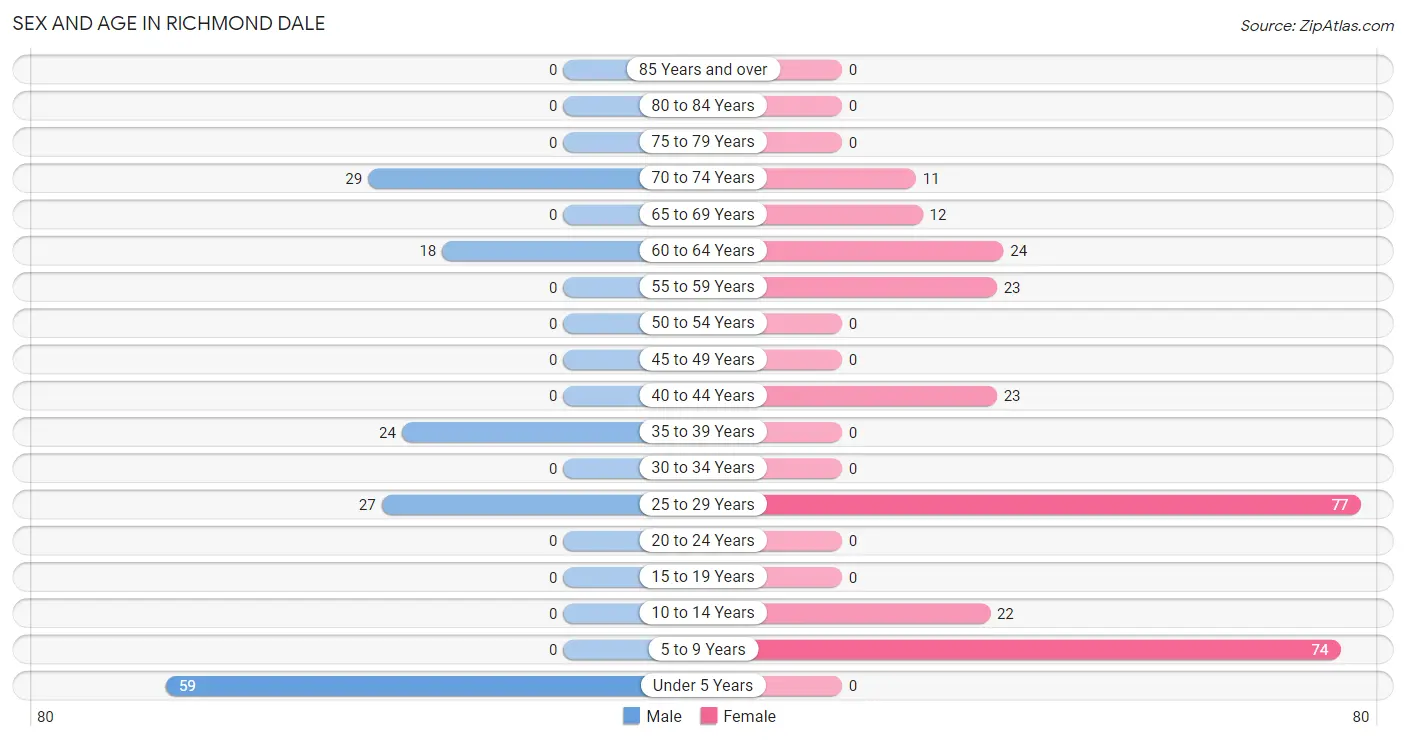
| Age Bracket | Male | Female |
| Under 5 Years | 59 (37.6%) | 0 (0.0%) |
| 5 to 9 Years | 0 (0.0%) | 74 (27.8%) |
| 10 to 14 Years | 0 (0.0%) | 22 (8.3%) |
| 15 to 19 Years | 0 (0.0%) | 0 (0.0%) |
| 20 to 24 Years | 0 (0.0%) | 0 (0.0%) |
| 25 to 29 Years | 27 (17.2%) | 77 (28.9%) |
| 30 to 34 Years | 0 (0.0%) | 0 (0.0%) |
| 35 to 39 Years | 24 (15.3%) | 0 (0.0%) |
| 40 to 44 Years | 0 (0.0%) | 23 (8.6%) |
| 45 to 49 Years | 0 (0.0%) | 0 (0.0%) |
| 50 to 54 Years | 0 (0.0%) | 0 (0.0%) |
| 55 to 59 Years | 0 (0.0%) | 23 (8.6%) |
| 60 to 64 Years | 18 (11.5%) | 24 (9.0%) |
| 65 to 69 Years | 0 (0.0%) | 12 (4.5%) |
| 70 to 74 Years | 29 (18.5%) | 11 (4.1%) |
| 75 to 79 Years | 0 (0.0%) | 0 (0.0%) |
| 80 to 84 Years | 0 (0.0%) | 0 (0.0%) |
| 85 Years and over | 0 (0.0%) | 0 (0.0%) |
| Total | 157 (100.0%) | 266 (100.0%) |
Families and Households in Richmond Dale
Median Family Size in Richmond Dale
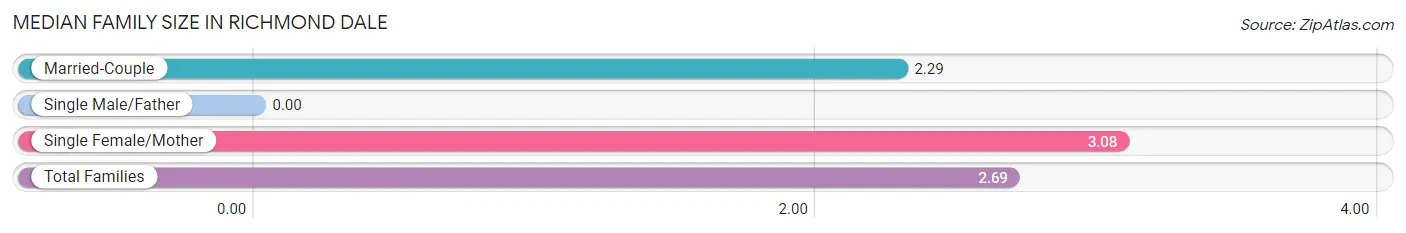
| Family Type | # Families | Family Size |
| Married-Couple | 76 (49.7%) | 2.29 |
| Single Male/Father | 0 (0.0%) | - |
| Single Female/Mother | 77 (50.3%) | 3.08 |
| Total Families | 153 (100.0%) | 2.69 |
Median Household Size in Richmond Dale
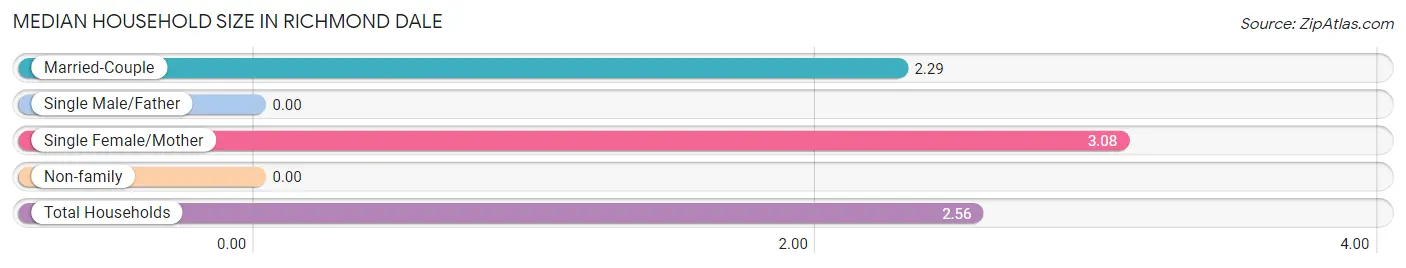
| Household Type | # Households | Household Size |
| Married-Couple | 76 (46.1%) | 2.29 |
| Single Male/Father | 0 (0.0%) | - |
| Single Female/Mother | 77 (46.7%) | 3.08 |
| Non-family | 12 (7.3%) | - |
| Total Households | 165 (100.0%) | 2.56 |
Household Size by Marriage Status in Richmond Dale
Out of a total of 165 households in Richmond Dale, 153 (92.7%) are family households, while 12 (7.3%) are nonfamily households. The most numerous type of family households are 4-person households, comprising 77, and the most common type of nonfamily households are 1-person households, comprising 12.
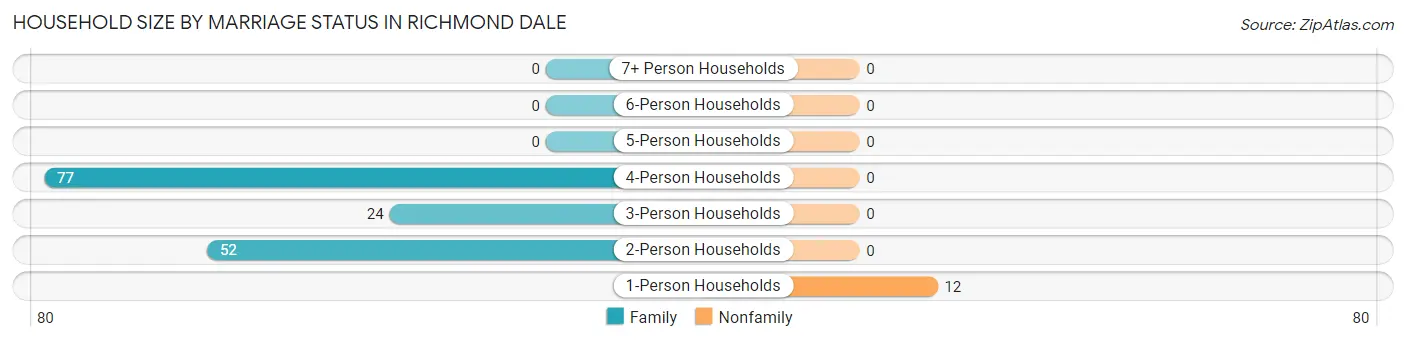
| Household Size | Family Households | Nonfamily Households |
| 1-Person Households | - | 12 (7.3%) |
| 2-Person Households | 52 (31.5%) | 0 (0.0%) |
| 3-Person Households | 24 (14.5%) | 0 (0.0%) |
| 4-Person Households | 77 (46.7%) | 0 (0.0%) |
| 5-Person Households | 0 (0.0%) | 0 (0.0%) |
| 6-Person Households | 0 (0.0%) | 0 (0.0%) |
| 7+ Person Households | 0 (0.0%) | 0 (0.0%) |
| Total | 153 (92.7%) | 12 (7.3%) |
Female Fertility in Richmond Dale
Fertility by Age in Richmond Dale
| Age Bracket | Women with Births | Births / 1,000 Women |
| 15 to 19 years | 0 (0.0%) | 0.0 |
| 20 to 34 years | 0 (0.0%) | 0.0 |
| 35 to 50 years | 0 (0.0%) | 0.0 |
| Total | 0 (0.0%) | 0.0 |
Fertility by Age by Marriage Status in Richmond Dale
| Age Bracket | Married | Unmarried |
| 15 to 19 years | 0 (0.0%) | 0 (0.0%) |
| 20 to 34 years | 0 (0.0%) | 0 (0.0%) |
| 35 to 50 years | 0 (0.0%) | 0 (0.0%) |
| Total | 0 (0.0%) | 0 (0.0%) |
Fertility by Education in Richmond Dale
| Educational Attainment | Women with Births | Births / 1,000 Women |
| Less than High School | 0 (0.0%) | 0.0 |
| High School Diploma | 0 (0.0%) | 0.0 |
| College or Associate's Degree | 0 (0.0%) | 0.0 |
| Bachelor's Degree | 0 (0.0%) | 0.0 |
| Graduate Degree | 0 (0.0%) | 0.0 |
| Total | 0 (0.0%) | 0.0 |
Fertility by Education by Marriage Status in Richmond Dale
| Educational Attainment | Married | Unmarried |
| Less than High School | 0 (0.0%) | 0 (0.0%) |
| High School Diploma | 0 (0.0%) | 0 (0.0%) |
| College or Associate's Degree | 0 (0.0%) | 0 (0.0%) |
| Bachelor's Degree | 0 (0.0%) | 0 (0.0%) |
| Graduate Degree | 0 (0.0%) | 0 (0.0%) |
| Total | 0 (0.0%) | 0 (0.0%) |
Employment Characteristics in Richmond Dale
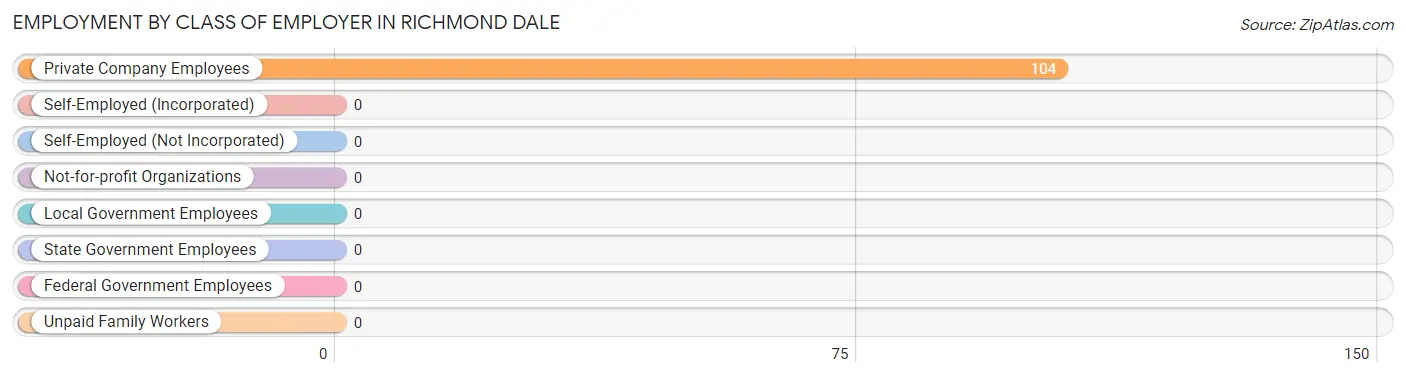
Employment by Class of Employer in Richmond Dale
Among the 104 employed individuals in Richmond Dale, , and private company employees (104 | 100.0%) make up the most common classes of employment.
| Employer Class | # Employees | % Employees |
| Private Company Employees | 104 | 100.0% |
| Self-Employed (Incorporated) | 0 | 0.0% |
| Self-Employed (Not Incorporated) | 0 | 0.0% |
| Not-for-profit Organizations | 0 | 0.0% |
| Local Government Employees | 0 | 0.0% |
| State Government Employees | 0 | 0.0% |
| Federal Government Employees | 0 | 0.0% |
| Unpaid Family Workers | 0 | 0.0% |
| Total | 104 | 100.0% |
Employment Status by Age in Richmond Dale
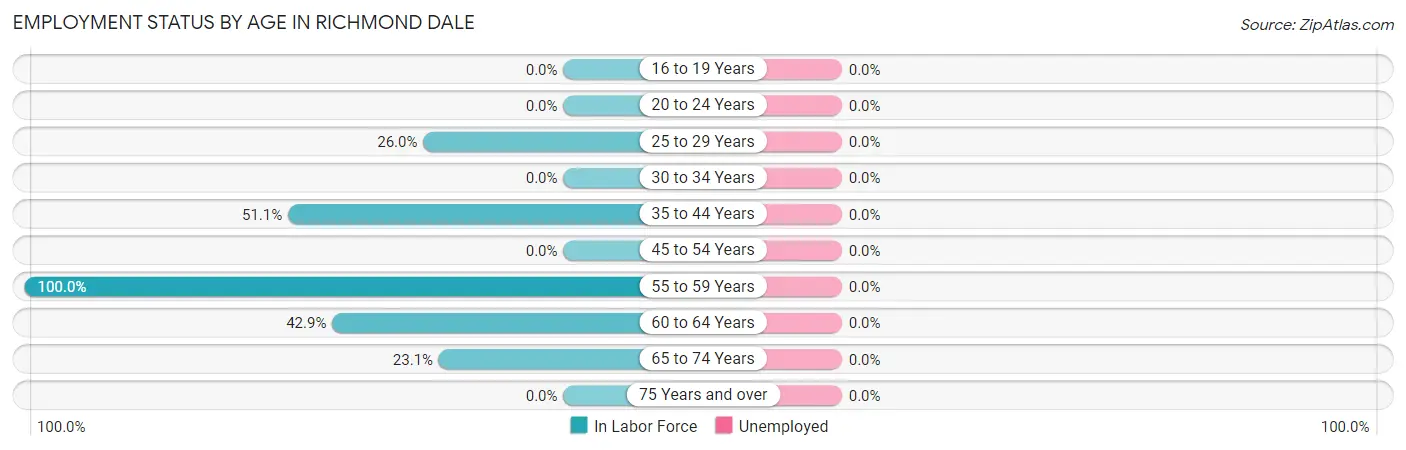
| Age Bracket | In Labor Force | Unemployed |
| 16 to 19 Years | 0 (0.0%) | 0 (0.0%) |
| 20 to 24 Years | 0 (0.0%) | 0 (0.0%) |
| 25 to 29 Years | 27 (26.0%) | 0 (0.0%) |
| 30 to 34 Years | 0 (0.0%) | 0 (0.0%) |
| 35 to 44 Years | 24 (51.1%) | 0 (0.0%) |
| 45 to 54 Years | 0 (0.0%) | 0 (0.0%) |
| 55 to 59 Years | 23 (100.0%) | 0 (0.0%) |
| 60 to 64 Years | 18 (42.9%) | 0 (0.0%) |
| 65 to 74 Years | 12 (23.1%) | 0 (0.0%) |
| 75 Years and over | 0 (0.0%) | 0 (0.0%) |
| Total | 104 (38.8%) | 0 (0.0%) |
Employment Status by Educational Attainment in Richmond Dale
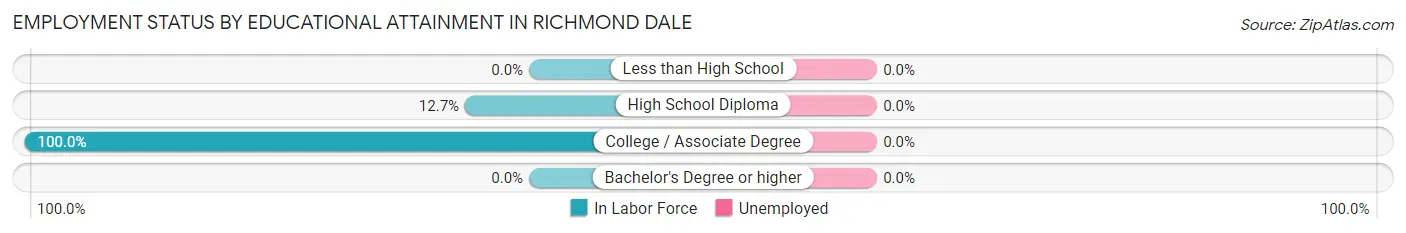
| Educational Attainment | In Labor Force | Unemployed |
| Less than High School | 0 (0.0%) | 0 (0.0%) |
| High School Diploma | 18 (12.7%) | 0 (0.0%) |
| College / Associate Degree | 74 (100.0%) | 0 (0.0%) |
| Bachelor's Degree or higher | 0 (0.0%) | 0 (0.0%) |
| Total | 92 (42.6%) | 0 (0.0%) |
Employment Occupations by Sex in Richmond Dale
Management, Business, Science and Arts Occupations
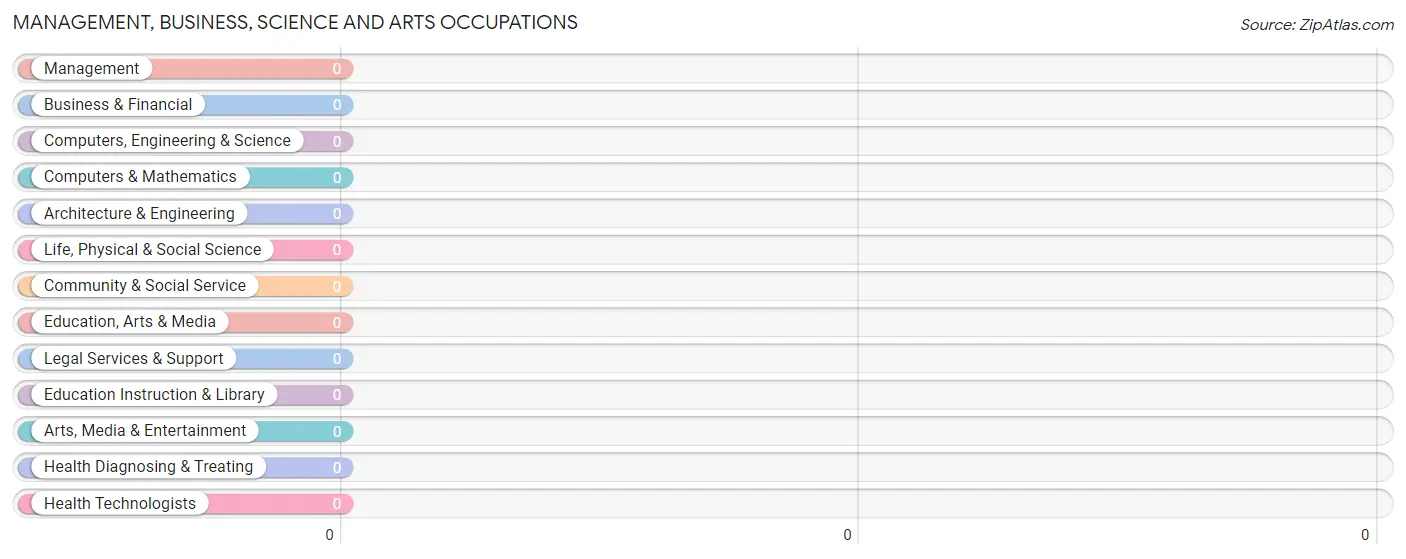
Management, Business, Science and Arts Occupations by Sex
| Occupation | Male | Female |
| Management | 0 (0.0%) | 0 (0.0%) |
| Business & Financial | 0 (0.0%) | 0 (0.0%) |
| Computers, Engineering & Science | 0 (0.0%) | 0 (0.0%) |
| Computers & Mathematics | 0 (0.0%) | 0 (0.0%) |
| Architecture & Engineering | 0 (0.0%) | 0 (0.0%) |
| Life, Physical & Social Science | 0 (0.0%) | 0 (0.0%) |
| Community & Social Service | 0 (0.0%) | 0 (0.0%) |
| Education, Arts & Media | 0 (0.0%) | 0 (0.0%) |
| Legal Services & Support | 0 (0.0%) | 0 (0.0%) |
| Education Instruction & Library | 0 (0.0%) | 0 (0.0%) |
| Arts, Media & Entertainment | 0 (0.0%) | 0 (0.0%) |
| Health Diagnosing & Treating | 0 (0.0%) | 0 (0.0%) |
| Health Technologists | 0 (0.0%) | 0 (0.0%) |
| Total (Category) | 0 (0.0%) | 0 (0.0%) |
| Total (Overall) | 69 (66.3%) | 35 (33.7%) |
Services Occupations
Services Occupations by Sex
| Occupation | Male | Female |
| Healthcare Support | 0 (0.0%) | 0 (0.0%) |
| Security & Protection | 0 (0.0%) | 0 (0.0%) |
| Firefighting & Prevention | 0 (0.0%) | 0 (0.0%) |
| Law Enforcement | 0 (0.0%) | 0 (0.0%) |
| Food Preparation & Serving | 0 (0.0%) | 0 (0.0%) |
| Cleaning & Maintenance | 0 (0.0%) | 0 (0.0%) |
| Personal Care & Service | 0 (0.0%) | 0 (0.0%) |
| Total (Category) | 0 (0.0%) | 0 (0.0%) |
| Total (Overall) | 69 (66.3%) | 35 (33.7%) |
Sales and Office Occupations
The most common Sales and Office occupations in Richmond Dale are Office & Administration (47 | 45.2%), and Sales & Related (12 | 11.5%).
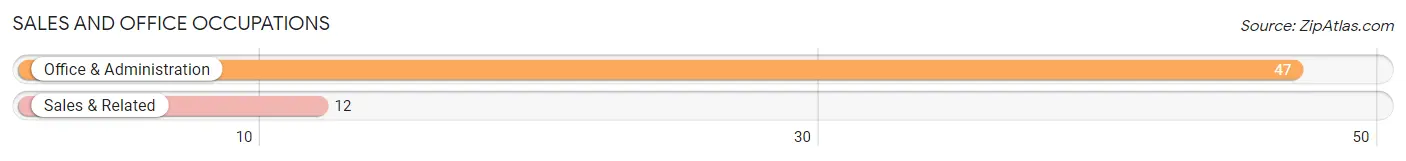
Sales and Office Occupations by Sex
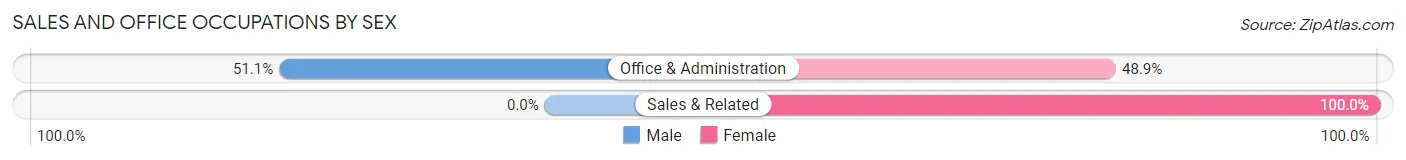
| Occupation | Male | Female |
| Sales & Related | 0 (0.0%) | 12 (100.0%) |
| Office & Administration | 24 (51.1%) | 23 (48.9%) |
| Total (Category) | 24 (40.7%) | 35 (59.3%) |
| Total (Overall) | 69 (66.3%) | 35 (33.7%) |
Natural Resources, Construction and Maintenance Occupations
Natural Resources, Construction and Maintenance Occupations by Sex
| Occupation | Male | Female |
| Farming, Fishing & Forestry | 0 (0.0%) | 0 (0.0%) |
| Construction & Extraction | 0 (0.0%) | 0 (0.0%) |
| Installation, Maintenance & Repair | 0 (0.0%) | 0 (0.0%) |
| Total (Category) | 0 (0.0%) | 0 (0.0%) |
| Total (Overall) | 69 (66.3%) | 35 (33.7%) |
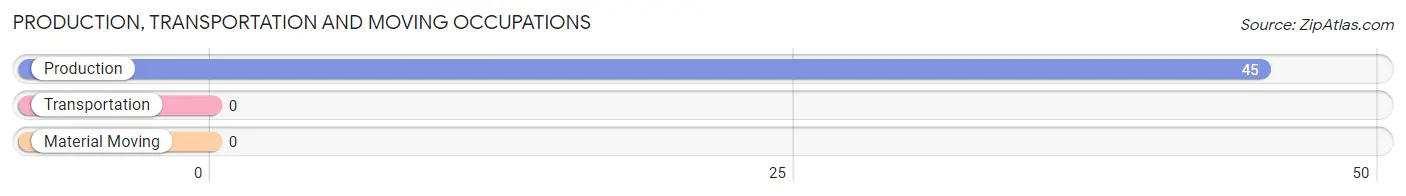
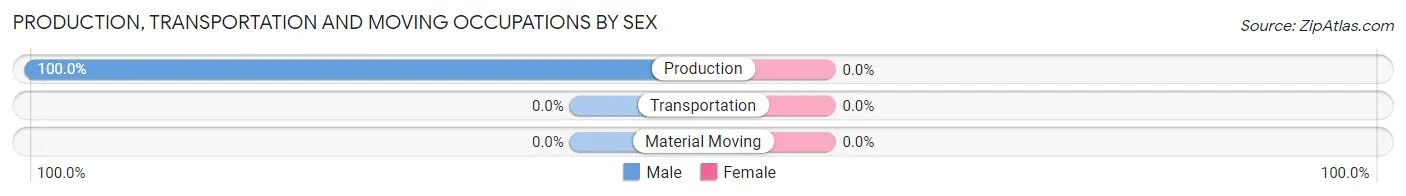
Production, Transportation and Moving Occupations
The most common Production, Transportation and Moving occupations in Richmond Dale are , and Production (45 | 43.3%).
Production, Transportation and Moving Occupations by Sex
| Occupation | Male | Female |
| Production | 45 (100.0%) | 0 (0.0%) |
| Transportation | 0 (0.0%) | 0 (0.0%) |
| Material Moving | 0 (0.0%) | 0 (0.0%) |
| Total (Category) | 45 (100.0%) | 0 (0.0%) |
| Total (Overall) | 69 (66.3%) | 35 (33.7%) |
Employment Industries by Sex in Richmond Dale
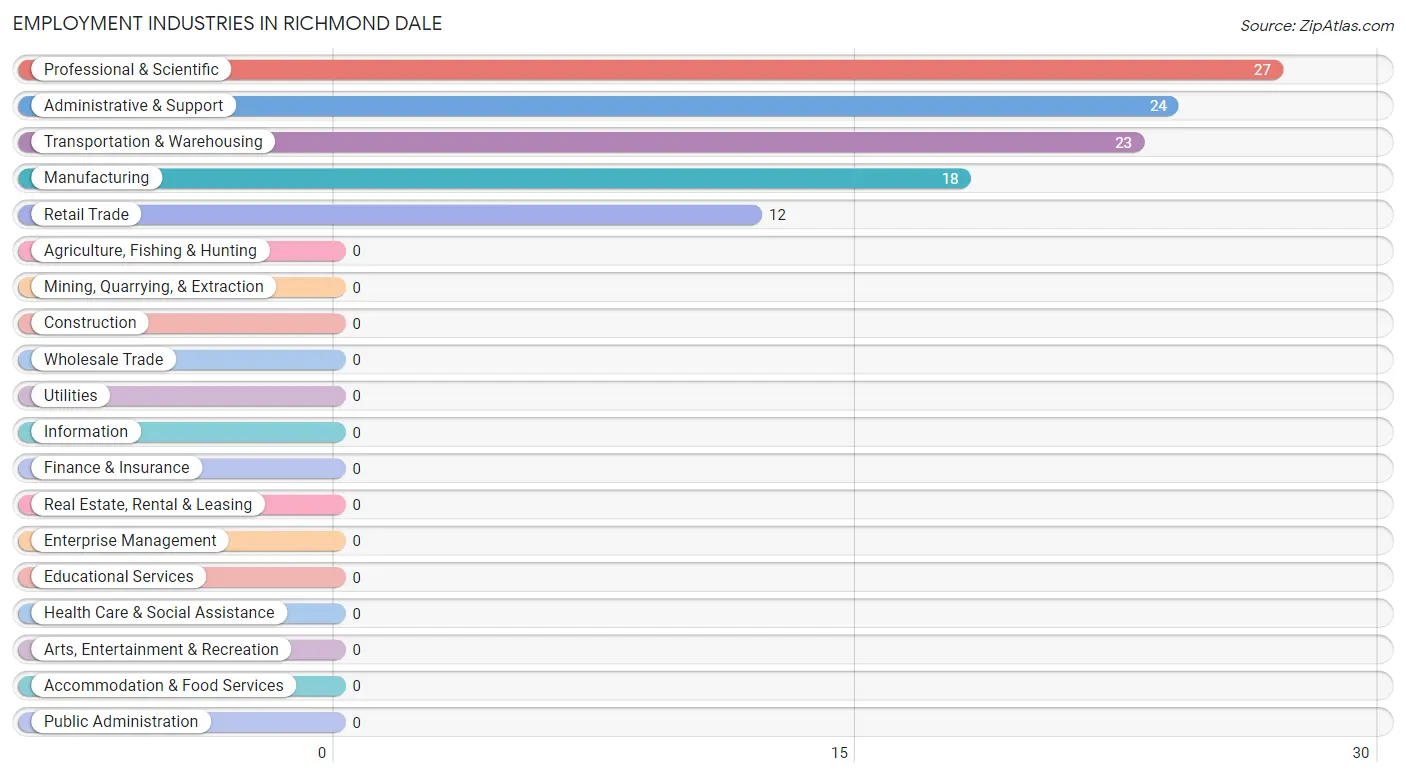
Employment Industries in Richmond Dale
The major employment industries in Richmond Dale include Professional & Scientific (27 | 26.0%), Administrative & Support (24 | 23.1%), Transportation & Warehousing (23 | 22.1%), Manufacturing (18 | 17.3%), and Retail Trade (12 | 11.5%).
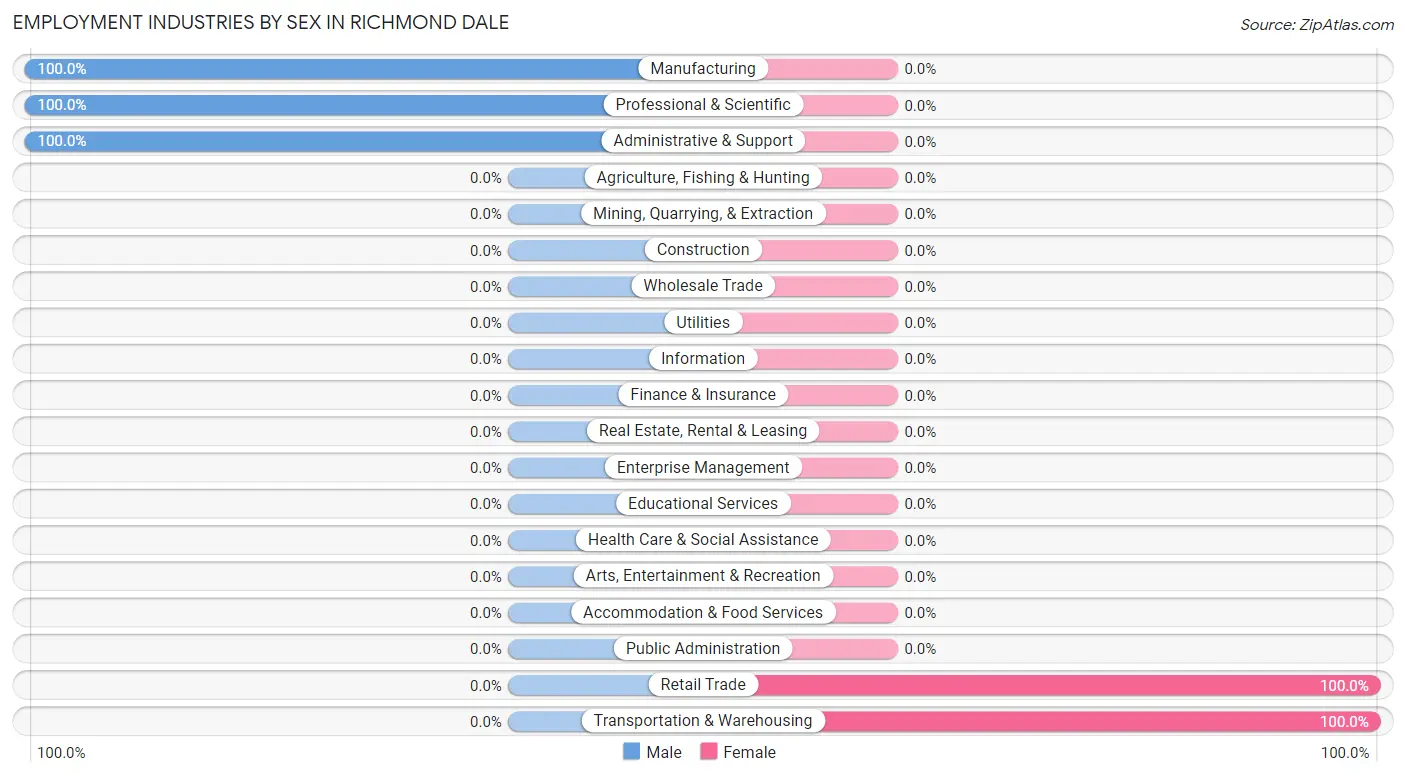
Employment Industries by Sex in Richmond Dale
The Richmond Dale industries that see more men than women are Manufacturing (100.0%), Professional & Scientific (100.0%), and Administrative & Support (100.0%), whereas the industries that tend to have a higher number of women are Retail Trade (100.0%), and Transportation & Warehousing (100.0%).
| Industry | Male | Female |
| Agriculture, Fishing & Hunting | 0 (0.0%) | 0 (0.0%) |
| Mining, Quarrying, & Extraction | 0 (0.0%) | 0 (0.0%) |
| Construction | 0 (0.0%) | 0 (0.0%) |
| Manufacturing | 18 (100.0%) | 0 (0.0%) |
| Wholesale Trade | 0 (0.0%) | 0 (0.0%) |
| Retail Trade | 0 (0.0%) | 12 (100.0%) |
| Transportation & Warehousing | 0 (0.0%) | 23 (100.0%) |
| Utilities | 0 (0.0%) | 0 (0.0%) |
| Information | 0 (0.0%) | 0 (0.0%) |
| Finance & Insurance | 0 (0.0%) | 0 (0.0%) |
| Real Estate, Rental & Leasing | 0 (0.0%) | 0 (0.0%) |
| Professional & Scientific | 27 (100.0%) | 0 (0.0%) |
| Enterprise Management | 0 (0.0%) | 0 (0.0%) |
| Administrative & Support | 24 (100.0%) | 0 (0.0%) |
| Educational Services | 0 (0.0%) | 0 (0.0%) |
| Health Care & Social Assistance | 0 (0.0%) | 0 (0.0%) |
| Arts, Entertainment & Recreation | 0 (0.0%) | 0 (0.0%) |
| Accommodation & Food Services | 0 (0.0%) | 0 (0.0%) |
| Public Administration | 0 (0.0%) | 0 (0.0%) |
| Total | 69 (66.3%) | 35 (33.7%) |
Education in Richmond Dale
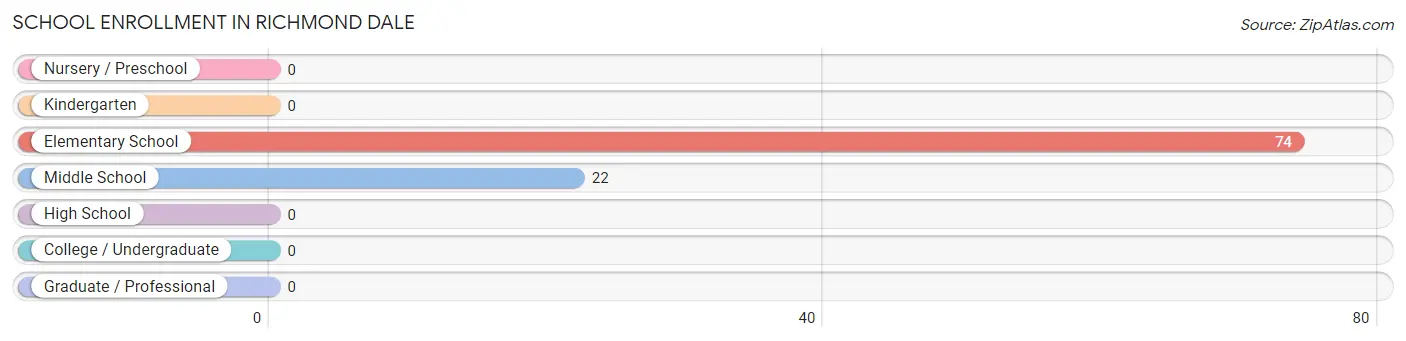
School Enrollment in Richmond Dale
The most common levels of schooling among the 96 students in Richmond Dale are elementary school (74 | 77.1%), and middle school (22 | 22.9%).
| School Level | # Students | % Students |
| Nursery / Preschool | 0 | 0.0% |
| Kindergarten | 0 | 0.0% |
| Elementary School | 74 | 77.1% |
| Middle School | 22 | 22.9% |
| High School | 0 | 0.0% |
| College / Undergraduate | 0 | 0.0% |
| Graduate / Professional | 0 | 0.0% |
| Total | 96 | 100.0% |
School Enrollment by Age by Funding Source in Richmond Dale
Out of a total of 96 students who are enrolled in schools in Richmond Dale, 22 (22.9%) attend a private institution, while the remaining 74 (77.1%) are enrolled in public schools. The age group of 10 to 14 year olds has the highest likelihood of being enrolled in private schools, with 22 (100.0% in the age bracket) enrolled. Conversely, the age group of 5 to 9 year old has the lowest likelihood of being enrolled in a private school, with 74 (100.0% in the age bracket) attending a public institution.
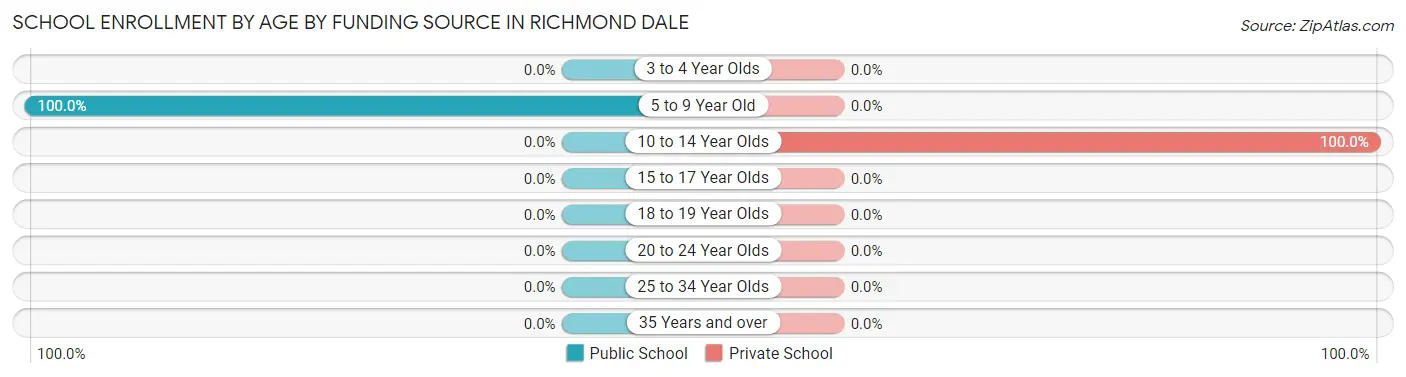
| Age Bracket | Public School | Private School |
| 3 to 4 Year Olds | 0 (0.0%) | 0 (0.0%) |
| 5 to 9 Year Old | 74 (100.0%) | 0 (0.0%) |
| 10 to 14 Year Olds | 0 (0.0%) | 22 (100.0%) |
| 15 to 17 Year Olds | 0 (0.0%) | 0 (0.0%) |
| 18 to 19 Year Olds | 0 (0.0%) | 0 (0.0%) |
| 20 to 24 Year Olds | 0 (0.0%) | 0 (0.0%) |
| 25 to 34 Year Olds | 0 (0.0%) | 0 (0.0%) |
| 35 Years and over | 0 (0.0%) | 0 (0.0%) |
| Total | 74 (77.1%) | 22 (22.9%) |
Educational Attainment by Field of Study in Richmond Dale
, and visual & performing arts (12 | 100.0%) are the most common fields of study among 12 individuals in Richmond Dale who have obtained a bachelor's degree or higher.
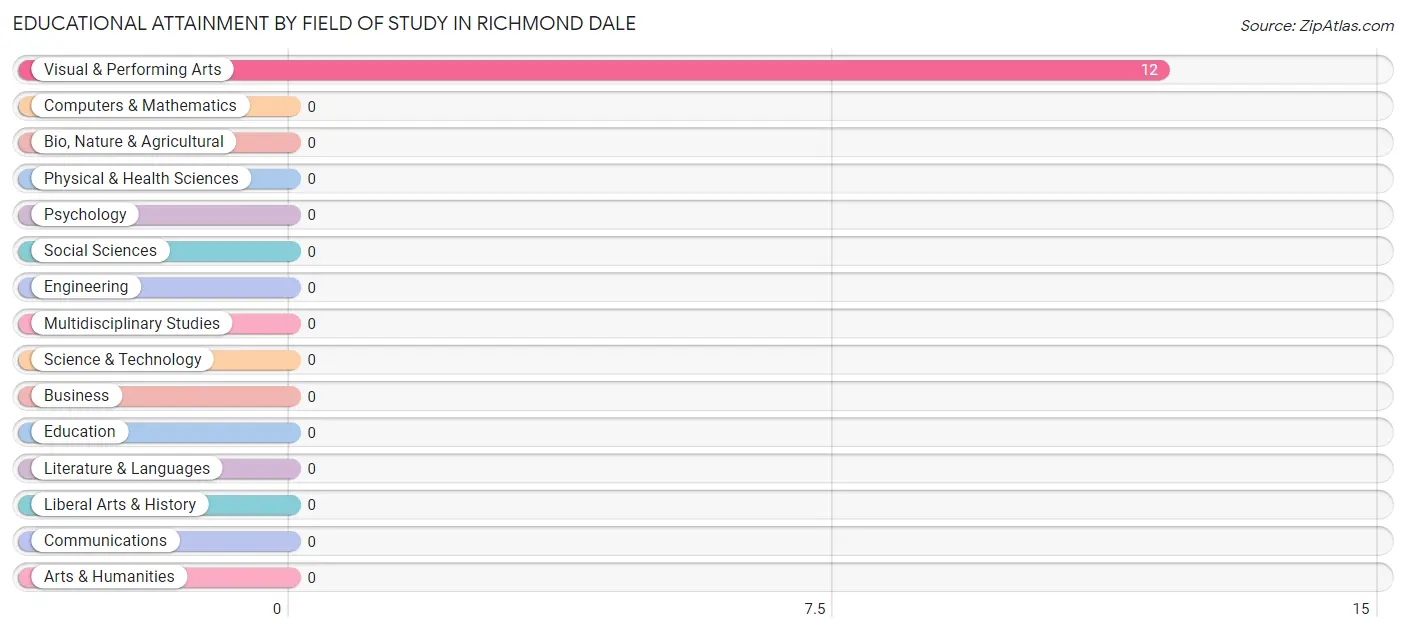
| Field of Study | # Graduates | % Graduates |
| Computers & Mathematics | 0 | 0.0% |
| Bio, Nature & Agricultural | 0 | 0.0% |
| Physical & Health Sciences | 0 | 0.0% |
| Psychology | 0 | 0.0% |
| Social Sciences | 0 | 0.0% |
| Engineering | 0 | 0.0% |
| Multidisciplinary Studies | 0 | 0.0% |
| Science & Technology | 0 | 0.0% |
| Business | 0 | 0.0% |
| Education | 0 | 0.0% |
| Literature & Languages | 0 | 0.0% |
| Liberal Arts & History | 0 | 0.0% |
| Visual & Performing Arts | 12 | 100.0% |
| Communications | 0 | 0.0% |
| Arts & Humanities | 0 | 0.0% |
| Total | 12 | 100.0% |
Transportation & Commute in Richmond Dale
Vehicle Availability by Sex in Richmond Dale
The most prevalent vehicle ownership categories in Richmond Dale are males with 2 vehicles (51, accounting for 73.9%) and females with 2 vehicles (0, making up 145.7%).
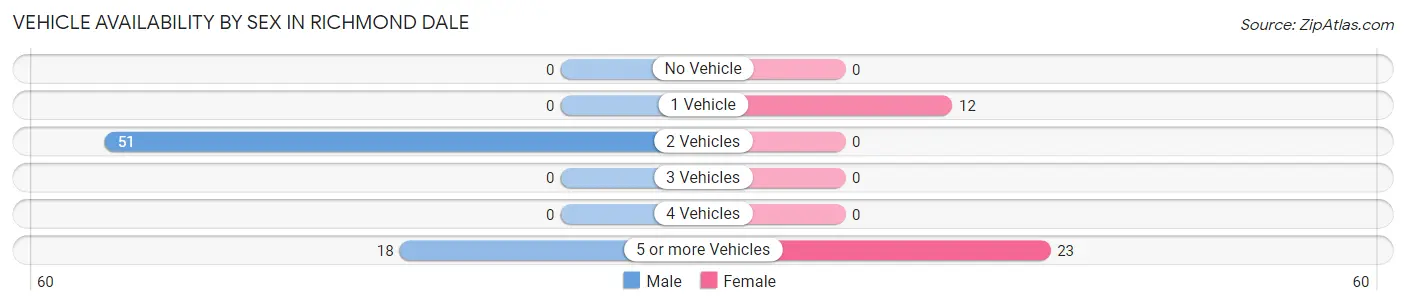
| Vehicles Available | Male | Female |
| No Vehicle | 0 (0.0%) | 0 (0.0%) |
| 1 Vehicle | 0 (0.0%) | 12 (34.3%) |
| 2 Vehicles | 51 (73.9%) | 0 (0.0%) |
| 3 Vehicles | 0 (0.0%) | 0 (0.0%) |
| 4 Vehicles | 0 (0.0%) | 0 (0.0%) |
| 5 or more Vehicles | 18 (26.1%) | 23 (65.7%) |
| Total | 69 (100.0%) | 35 (100.0%) |
Commute Time in Richmond Dale
The most frequently occuring commute durations in Richmond Dale are 15 to 19 minutes (47 commuters, 45.2%), 90 or more minutes (27 commuters, 26.0%), and 25 to 29 minutes (18 commuters, 17.3%).
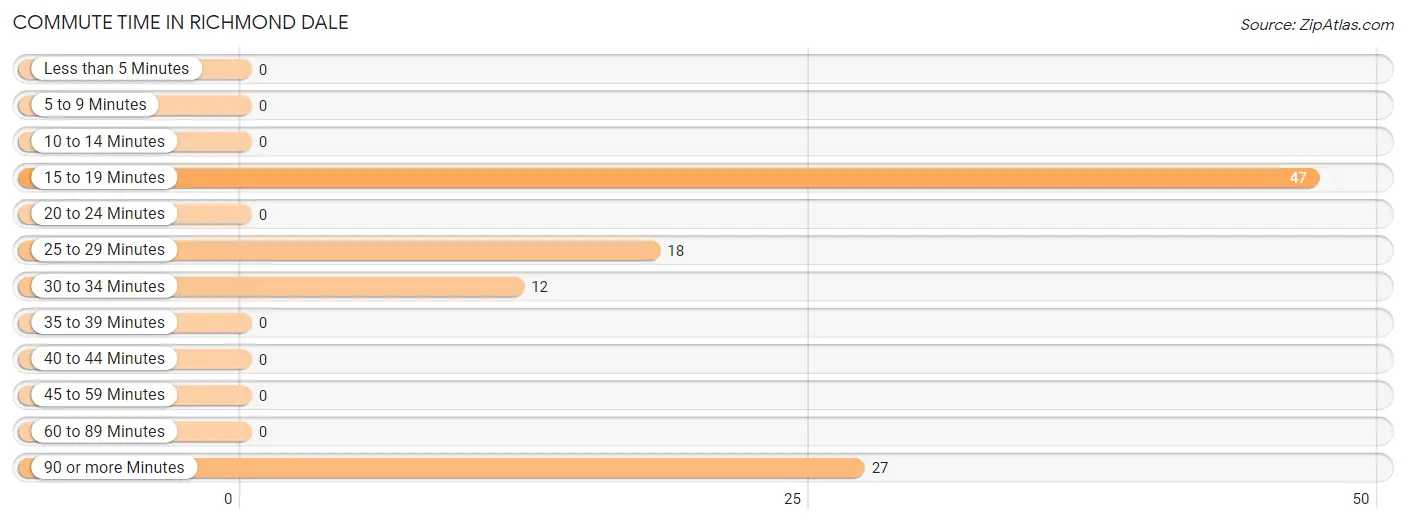
| Commute Time | # Commuters | % Commuters |
| Less than 5 Minutes | 0 | 0.0% |
| 5 to 9 Minutes | 0 | 0.0% |
| 10 to 14 Minutes | 0 | 0.0% |
| 15 to 19 Minutes | 47 | 45.2% |
| 20 to 24 Minutes | 0 | 0.0% |
| 25 to 29 Minutes | 18 | 17.3% |
| 30 to 34 Minutes | 12 | 11.5% |
| 35 to 39 Minutes | 0 | 0.0% |
| 40 to 44 Minutes | 0 | 0.0% |
| 45 to 59 Minutes | 0 | 0.0% |
| 60 to 89 Minutes | 0 | 0.0% |
| 90 or more Minutes | 27 | 26.0% |
Commute Time by Sex in Richmond Dale
The most common commute times in Richmond Dale are 90 or more minutes (27 commuters, 39.1%) for males and 15 to 19 minutes (23 commuters, 65.7%) for females.
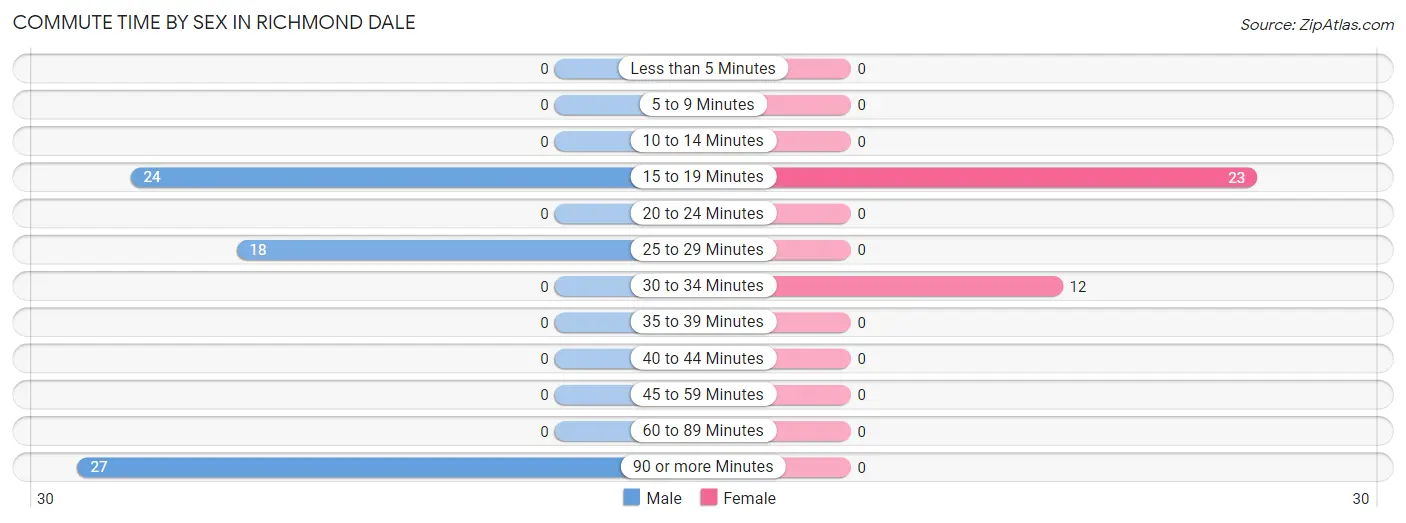
| Commute Time | Male | Female |
| Less than 5 Minutes | 0 (0.0%) | 0 (0.0%) |
| 5 to 9 Minutes | 0 (0.0%) | 0 (0.0%) |
| 10 to 14 Minutes | 0 (0.0%) | 0 (0.0%) |
| 15 to 19 Minutes | 24 (34.8%) | 23 (65.7%) |
| 20 to 24 Minutes | 0 (0.0%) | 0 (0.0%) |
| 25 to 29 Minutes | 18 (26.1%) | 0 (0.0%) |
| 30 to 34 Minutes | 0 (0.0%) | 12 (34.3%) |
| 35 to 39 Minutes | 0 (0.0%) | 0 (0.0%) |
| 40 to 44 Minutes | 0 (0.0%) | 0 (0.0%) |
| 45 to 59 Minutes | 0 (0.0%) | 0 (0.0%) |
| 60 to 89 Minutes | 0 (0.0%) | 0 (0.0%) |
| 90 or more Minutes | 27 (39.1%) | 0 (0.0%) |
Time of Departure to Work by Sex in Richmond Dale
The most frequent times of departure to work in Richmond Dale are 12:00 AM to 4:59 AM (45, 65.2%) for males and 7:30 AM to 7:59 AM (23, 65.7%) for females.
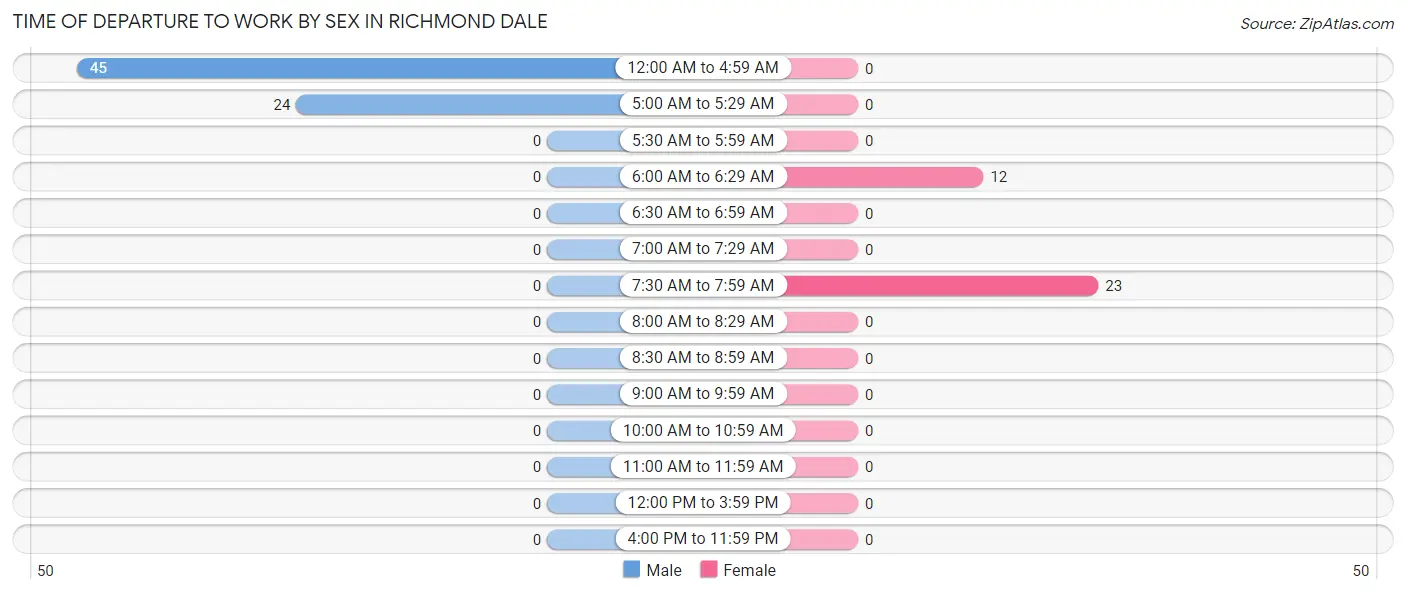
| Time of Departure | Male | Female |
| 12:00 AM to 4:59 AM | 45 (65.2%) | 0 (0.0%) |
| 5:00 AM to 5:29 AM | 24 (34.8%) | 0 (0.0%) |
| 5:30 AM to 5:59 AM | 0 (0.0%) | 0 (0.0%) |
| 6:00 AM to 6:29 AM | 0 (0.0%) | 12 (34.3%) |
| 6:30 AM to 6:59 AM | 0 (0.0%) | 0 (0.0%) |
| 7:00 AM to 7:29 AM | 0 (0.0%) | 0 (0.0%) |
| 7:30 AM to 7:59 AM | 0 (0.0%) | 23 (65.7%) |
| 8:00 AM to 8:29 AM | 0 (0.0%) | 0 (0.0%) |
| 8:30 AM to 8:59 AM | 0 (0.0%) | 0 (0.0%) |
| 9:00 AM to 9:59 AM | 0 (0.0%) | 0 (0.0%) |
| 10:00 AM to 10:59 AM | 0 (0.0%) | 0 (0.0%) |
| 11:00 AM to 11:59 AM | 0 (0.0%) | 0 (0.0%) |
| 12:00 PM to 3:59 PM | 0 (0.0%) | 0 (0.0%) |
| 4:00 PM to 11:59 PM | 0 (0.0%) | 0 (0.0%) |
| Total | 69 (100.0%) | 35 (100.0%) |
Housing Occupancy in Richmond Dale
Occupancy by Ownership in Richmond Dale
Of the total 165 dwellings in Richmond Dale, owner-occupied units account for 88 (53.3%), while renter-occupied units make up 77 (46.7%).
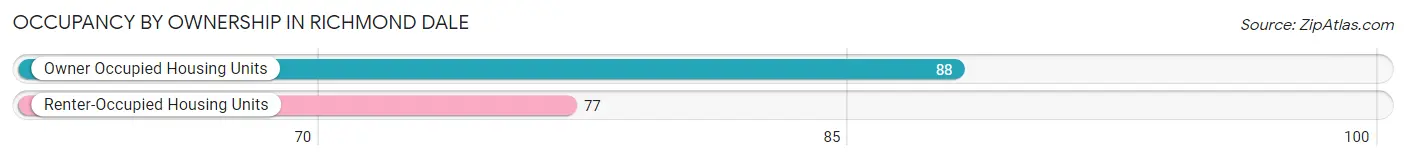
| Occupancy | # Housing Units | % Housing Units |
| Owner Occupied Housing Units | 88 | 53.3% |
| Renter-Occupied Housing Units | 77 | 46.7% |
| Total Occupied Housing Units | 165 | 100.0% |
Occupancy by Household Size in Richmond Dale
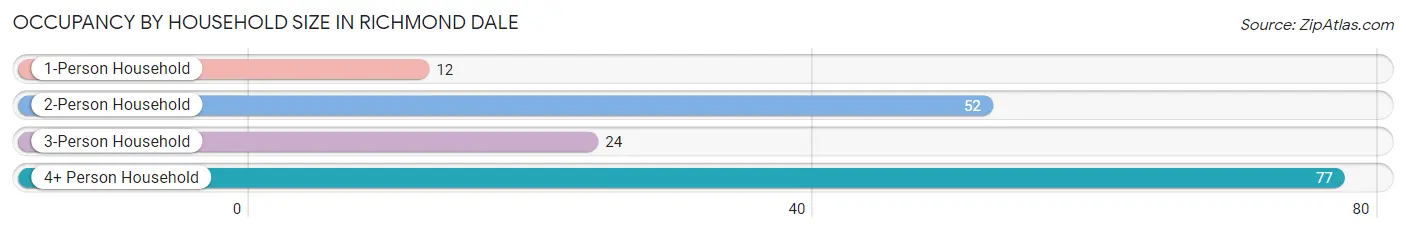
| Household Size | # Housing Units | % Housing Units |
| 1-Person Household | 12 | 7.3% |
| 2-Person Household | 52 | 31.5% |
| 3-Person Household | 24 | 14.5% |
| 4+ Person Household | 77 | 46.7% |
| Total Housing Units | 165 | 100.0% |
Occupancy by Ownership by Household Size in Richmond Dale
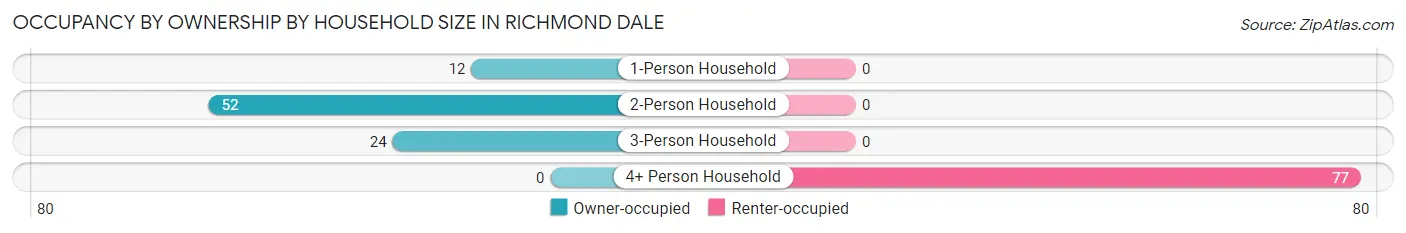
| Household Size | Owner-occupied | Renter-occupied |
| 1-Person Household | 12 (100.0%) | 0 (0.0%) |
| 2-Person Household | 52 (100.0%) | 0 (0.0%) |
| 3-Person Household | 24 (100.0%) | 0 (0.0%) |
| 4+ Person Household | 0 (0.0%) | 77 (100.0%) |
| Total Housing Units | 88 (53.3%) | 77 (46.7%) |
Occupancy by Educational Attainment in Richmond Dale
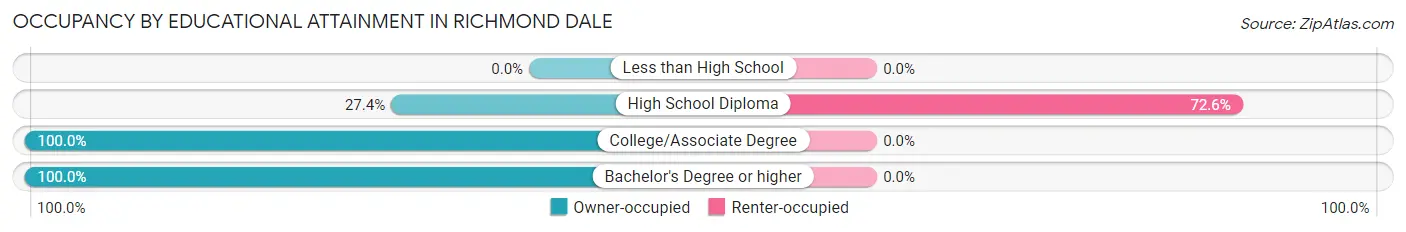
| Household Size | Owner-occupied | Renter-occupied |
| Less than High School | 0 (0.0%) | 0 (0.0%) |
| High School Diploma | 29 (27.4%) | 77 (72.6%) |
| College/Associate Degree | 47 (100.0%) | 0 (0.0%) |
| Bachelor's Degree or higher | 12 (100.0%) | 0 (0.0%) |
Occupancy by Age of Householder in Richmond Dale
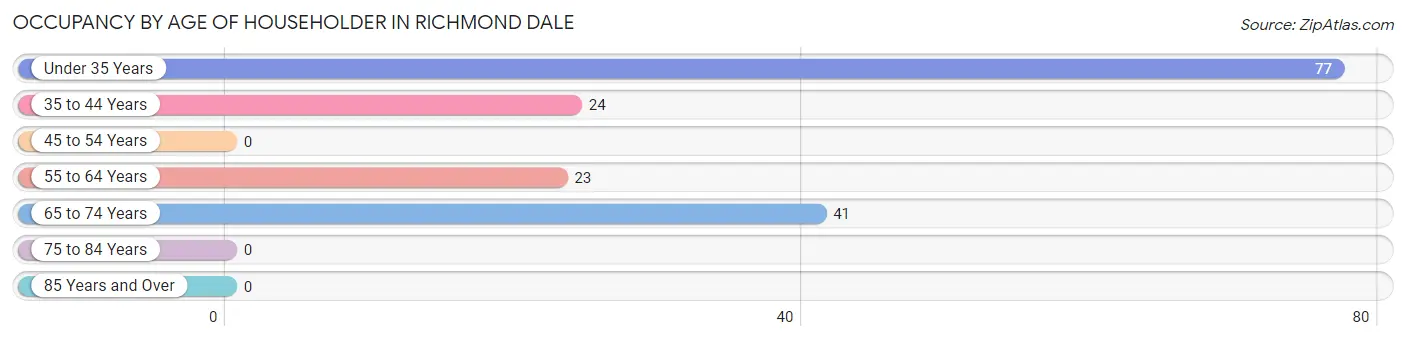
| Age Bracket | # Households | % Households |
| Under 35 Years | 77 | 46.7% |
| 35 to 44 Years | 24 | 14.5% |
| 45 to 54 Years | 0 | 0.0% |
| 55 to 64 Years | 23 | 13.9% |
| 65 to 74 Years | 41 | 24.8% |
| 75 to 84 Years | 0 | 0.0% |
| 85 Years and Over | 0 | 0.0% |
| Total | 165 | 100.0% |
Housing Finances in Richmond Dale
Median Income by Occupancy in Richmond Dale
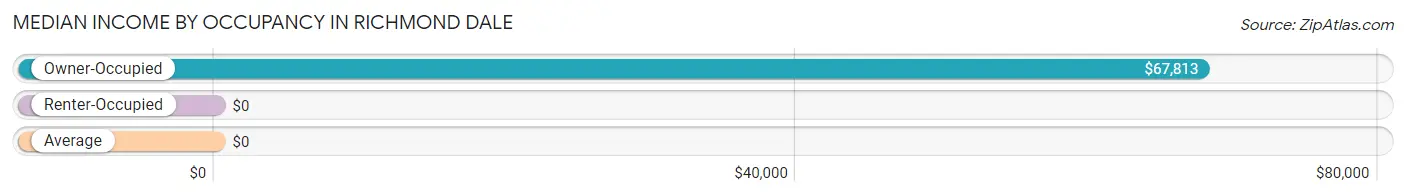
| Occupancy Type | # Households | Median Income |
| Owner-Occupied | 88 (53.3%) | $67,813 |
| Renter-Occupied | 77 (46.7%) | $0 |
| Average | 165 (100.0%) | $0 |
Occupancy by Householder Income Bracket in Richmond Dale
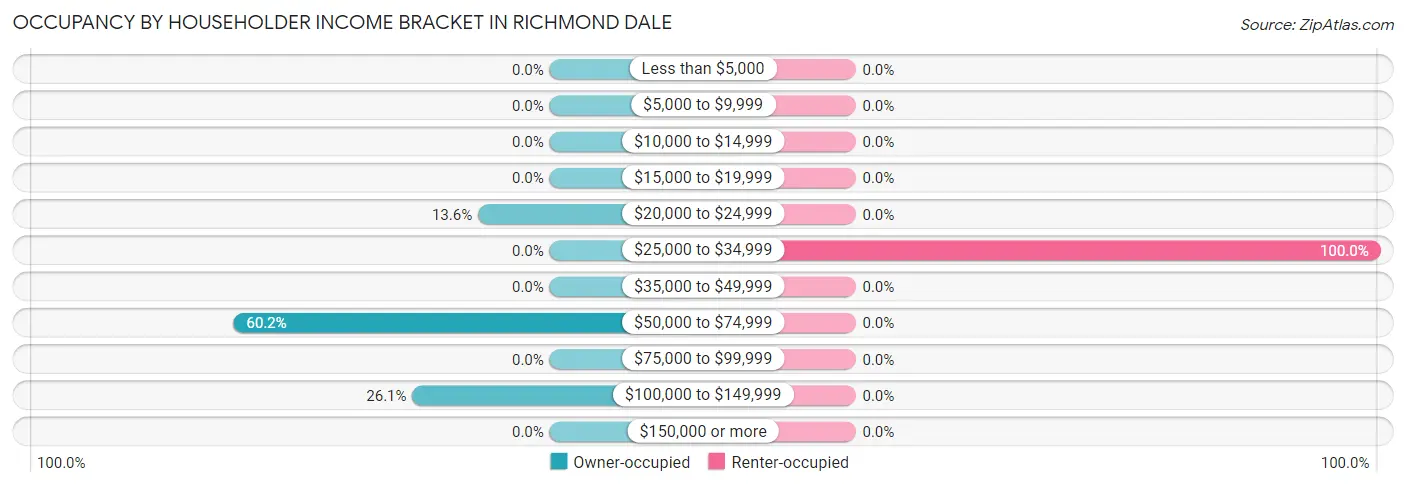
| Income Bracket | Owner-occupied | Renter-occupied |
| Less than $5,000 | 0 (0.0%) | 0 (0.0%) |
| $5,000 to $9,999 | 0 (0.0%) | 0 (0.0%) |
| $10,000 to $14,999 | 0 (0.0%) | 0 (0.0%) |
| $15,000 to $19,999 | 0 (0.0%) | 0 (0.0%) |
| $20,000 to $24,999 | 12 (13.6%) | 0 (0.0%) |
| $25,000 to $34,999 | 0 (0.0%) | 77 (100.0%) |
| $35,000 to $49,999 | 0 (0.0%) | 0 (0.0%) |
| $50,000 to $74,999 | 53 (60.2%) | 0 (0.0%) |
| $75,000 to $99,999 | 0 (0.0%) | 0 (0.0%) |
| $100,000 to $149,999 | 23 (26.1%) | 0 (0.0%) |
| $150,000 or more | 0 (0.0%) | 0 (0.0%) |
| Total | 88 (100.0%) | 77 (100.0%) |
Monthly Housing Cost Tiers in Richmond Dale
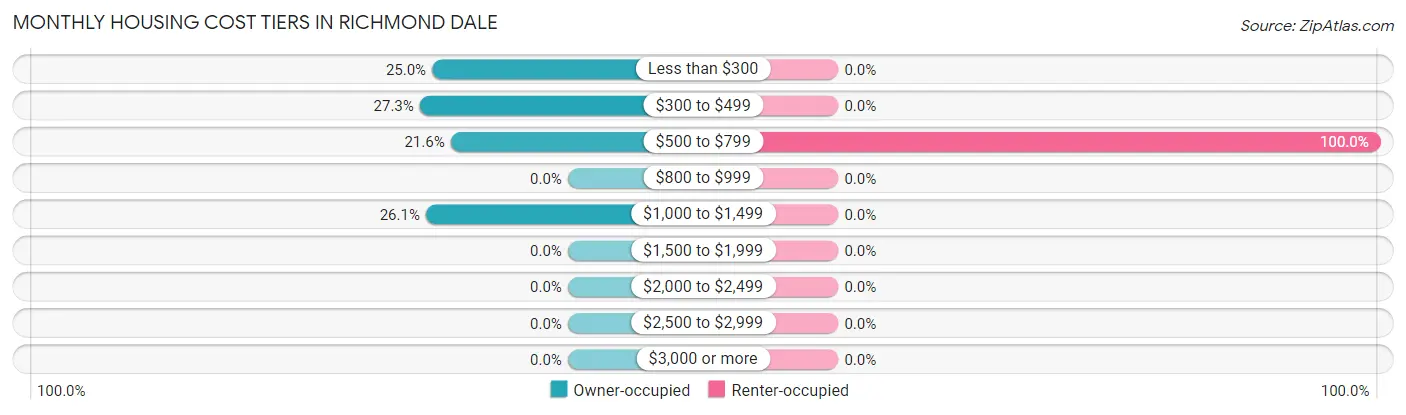
| Monthly Cost | Owner-occupied | Renter-occupied |
| Less than $300 | 22 (25.0%) | 0 (0.0%) |
| $300 to $499 | 24 (27.3%) | 0 (0.0%) |
| $500 to $799 | 19 (21.6%) | 77 (100.0%) |
| $800 to $999 | 0 (0.0%) | 0 (0.0%) |
| $1,000 to $1,499 | 23 (26.1%) | 0 (0.0%) |
| $1,500 to $1,999 | 0 (0.0%) | 0 (0.0%) |
| $2,000 to $2,499 | 0 (0.0%) | 0 (0.0%) |
| $2,500 to $2,999 | 0 (0.0%) | 0 (0.0%) |
| $3,000 or more | 0 (0.0%) | 0 (0.0%) |
| Total | 88 (100.0%) | 77 (100.0%) |
Physical Housing Characteristics in Richmond Dale
Housing Structures in Richmond Dale
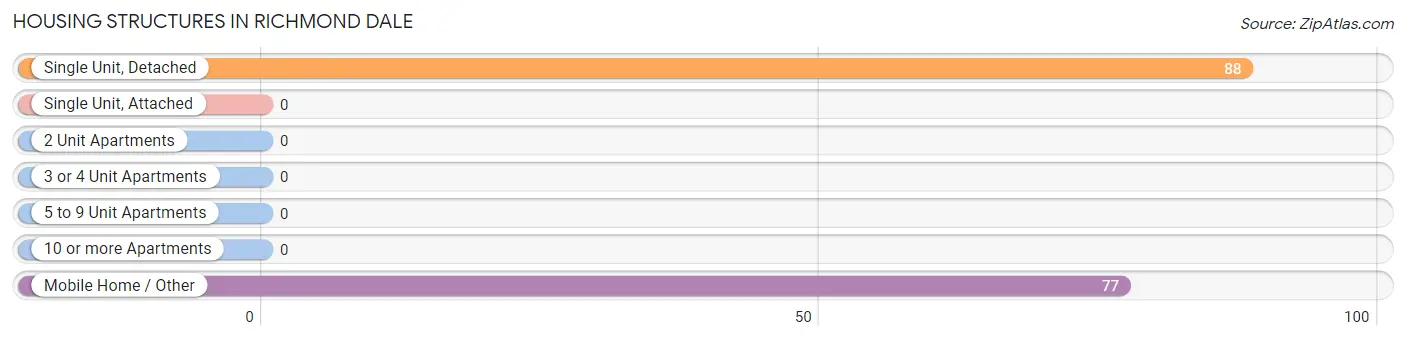
| Structure Type | # Housing Units | % Housing Units |
| Single Unit, Detached | 88 | 53.3% |
| Single Unit, Attached | 0 | 0.0% |
| 2 Unit Apartments | 0 | 0.0% |
| 3 or 4 Unit Apartments | 0 | 0.0% |
| 5 to 9 Unit Apartments | 0 | 0.0% |
| 10 or more Apartments | 0 | 0.0% |
| Mobile Home / Other | 77 | 46.7% |
| Total | 165 | 100.0% |
Housing Structures by Occupancy in Richmond Dale
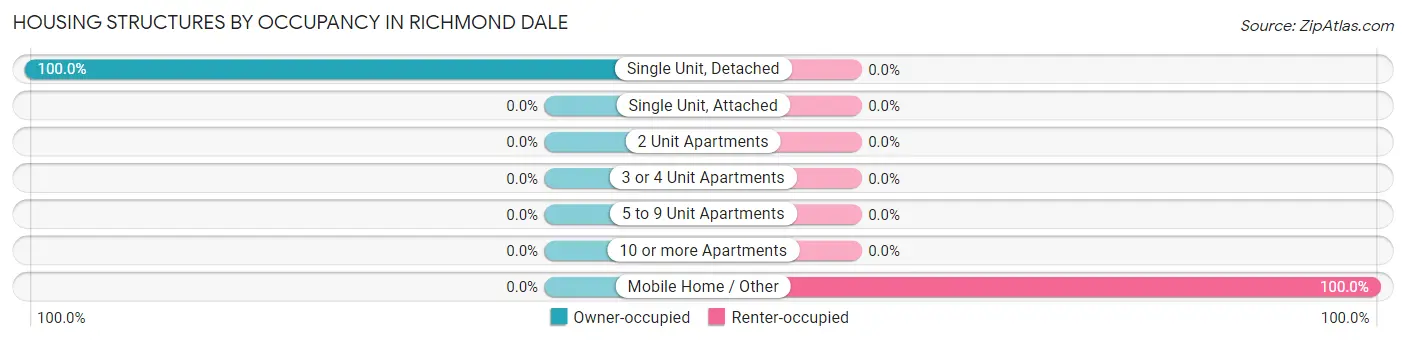
| Structure Type | Owner-occupied | Renter-occupied |
| Single Unit, Detached | 88 (100.0%) | 0 (0.0%) |
| Single Unit, Attached | 0 (0.0%) | 0 (0.0%) |
| 2 Unit Apartments | 0 (0.0%) | 0 (0.0%) |
| 3 or 4 Unit Apartments | 0 (0.0%) | 0 (0.0%) |
| 5 to 9 Unit Apartments | 0 (0.0%) | 0 (0.0%) |
| 10 or more Apartments | 0 (0.0%) | 0 (0.0%) |
| Mobile Home / Other | 0 (0.0%) | 77 (100.0%) |
| Total | 88 (53.3%) | 77 (46.7%) |
Housing Structures by Number of Rooms in Richmond Dale
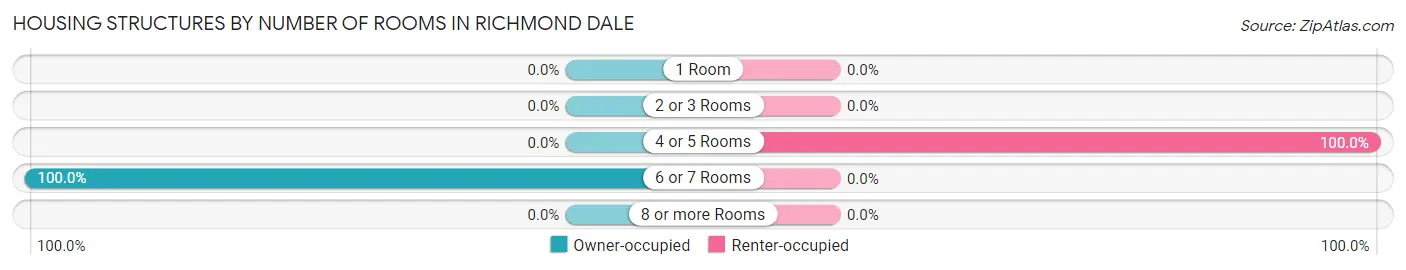
| Number of Rooms | Owner-occupied | Renter-occupied |
| 1 Room | 0 (0.0%) | 0 (0.0%) |
| 2 or 3 Rooms | 0 (0.0%) | 0 (0.0%) |
| 4 or 5 Rooms | 0 (0.0%) | 77 (100.0%) |
| 6 or 7 Rooms | 88 (100.0%) | 0 (0.0%) |
| 8 or more Rooms | 0 (0.0%) | 0 (0.0%) |
| Total | 88 (100.0%) | 77 (100.0%) |
Housing Structure by Heating Type in Richmond Dale
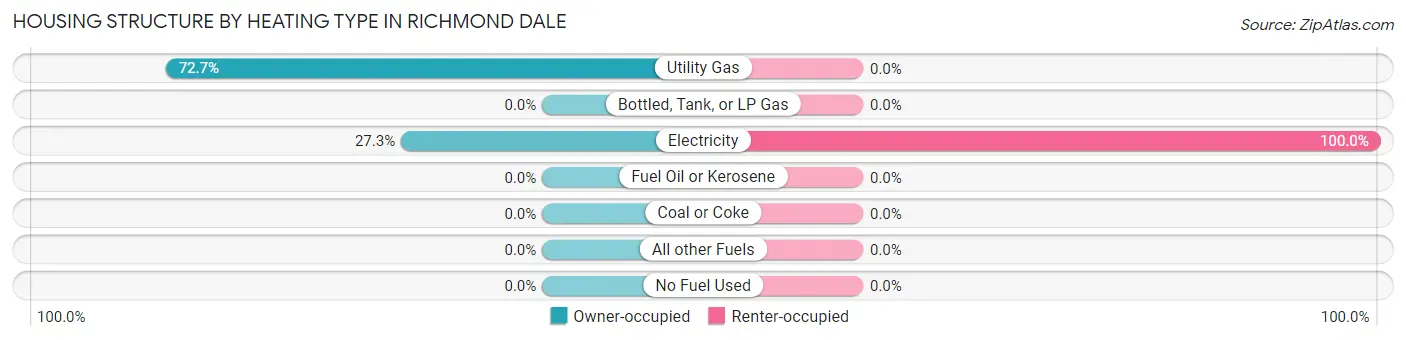
| Heating Type | Owner-occupied | Renter-occupied |
| Utility Gas | 64 (72.7%) | 0 (0.0%) |
| Bottled, Tank, or LP Gas | 0 (0.0%) | 0 (0.0%) |
| Electricity | 24 (27.3%) | 77 (100.0%) |
| Fuel Oil or Kerosene | 0 (0.0%) | 0 (0.0%) |
| Coal or Coke | 0 (0.0%) | 0 (0.0%) |
| All other Fuels | 0 (0.0%) | 0 (0.0%) |
| No Fuel Used | 0 (0.0%) | 0 (0.0%) |
| Total | 88 (100.0%) | 77 (100.0%) |
Household Vehicle Usage in Richmond Dale
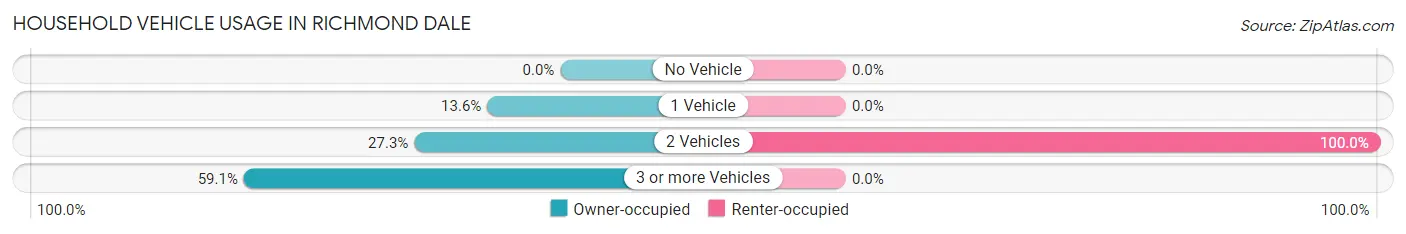
| Vehicles per Household | Owner-occupied | Renter-occupied |
| No Vehicle | 0 (0.0%) | 0 (0.0%) |
| 1 Vehicle | 12 (13.6%) | 0 (0.0%) |
| 2 Vehicles | 24 (27.3%) | 77 (100.0%) |
| 3 or more Vehicles | 52 (59.1%) | 0 (0.0%) |
| Total | 88 (100.0%) | 77 (100.0%) |
Real Estate & Mortgages in Richmond Dale
Real Estate and Mortgage Overview in Richmond Dale
| Characteristic | Without Mortgage | With Mortgage |
| Housing Units | 65 | 23 |
| Median Property Value | $106,100 | $0 |
| Median Household Income | $57,875 | $0 |
| Monthly Housing Costs | $444 | $0 |
| Real Estate Taxes | $1,219 | $0 |
Property Value by Mortgage Status in Richmond Dale
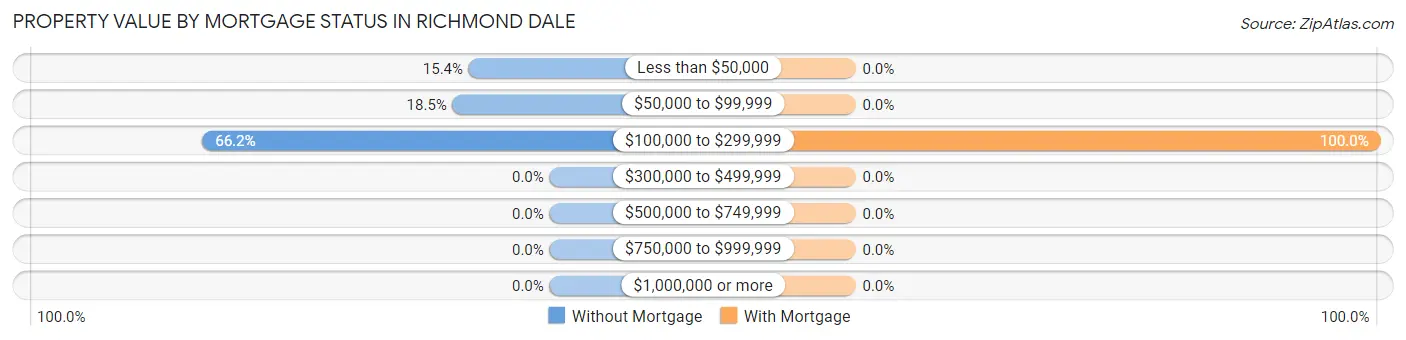
| Property Value | Without Mortgage | With Mortgage |
| Less than $50,000 | 10 (15.4%) | 0 (0.0%) |
| $50,000 to $99,999 | 12 (18.5%) | 0 (0.0%) |
| $100,000 to $299,999 | 43 (66.1%) | 23 (100.0%) |
| $300,000 to $499,999 | 0 (0.0%) | 0 (0.0%) |
| $500,000 to $749,999 | 0 (0.0%) | 0 (0.0%) |
| $750,000 to $999,999 | 0 (0.0%) | 0 (0.0%) |
| $1,000,000 or more | 0 (0.0%) | 0 (0.0%) |
| Total | 65 (100.0%) | 23 (100.0%) |
Household Income by Mortgage Status in Richmond Dale
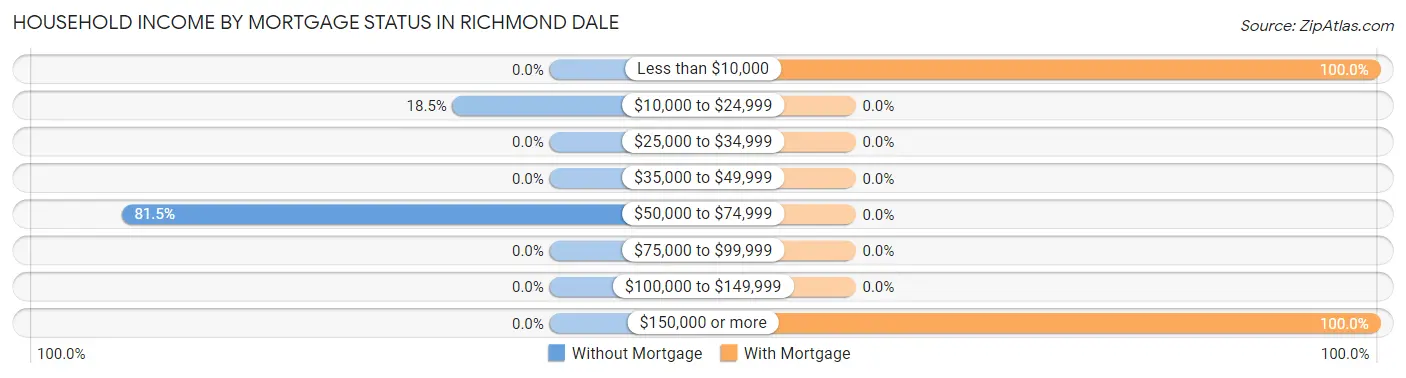
| Household Income | Without Mortgage | With Mortgage |
| Less than $10,000 | 0 (0.0%) | 23 (100.0%) |
| $10,000 to $24,999 | 12 (18.5%) | 0 (0.0%) |
| $25,000 to $34,999 | 0 (0.0%) | 0 (0.0%) |
| $35,000 to $49,999 | 0 (0.0%) | 0 (0.0%) |
| $50,000 to $74,999 | 53 (81.5%) | 0 (0.0%) |
| $75,000 to $99,999 | 0 (0.0%) | 0 (0.0%) |
| $100,000 to $149,999 | 0 (0.0%) | 0 (0.0%) |
| $150,000 or more | 0 (0.0%) | 23 (100.0%) |
| Total | 65 (100.0%) | 23 (100.0%) |
Property Value to Household Income Ratio in Richmond Dale
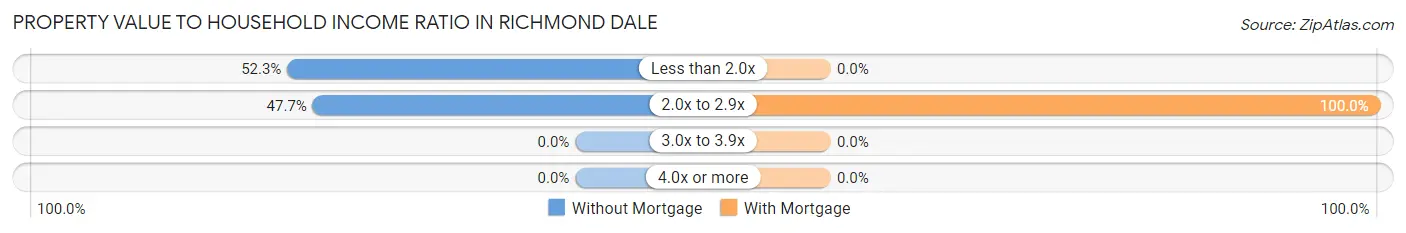
| Value-to-Income Ratio | Without Mortgage | With Mortgage |
| Less than 2.0x | 34 (52.3%) | 0 (0.0%) |
| 2.0x to 2.9x | 31 (47.7%) | 23 (100.0%) |
| 3.0x to 3.9x | 0 (0.0%) | 0 (0.0%) |
| 4.0x or more | 0 (0.0%) | 0 (0.0%) |
| Total | 65 (100.0%) | 23 (100.0%) |
Real Estate Taxes by Mortgage Status in Richmond Dale
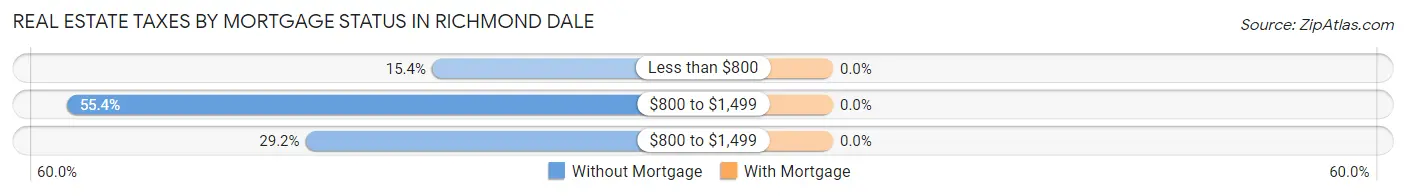
| Property Taxes | Without Mortgage | With Mortgage |
| Less than $800 | 10 (15.4%) | 0 (0.0%) |
| $800 to $1,499 | 36 (55.4%) | 0 (0.0%) |
| $800 to $1,499 | 19 (29.2%) | 0 (0.0%) |
| Total | 65 (100.0%) | 23 (100.0%) |
Health & Disability in Richmond Dale
Health Insurance Coverage by Age in Richmond Dale
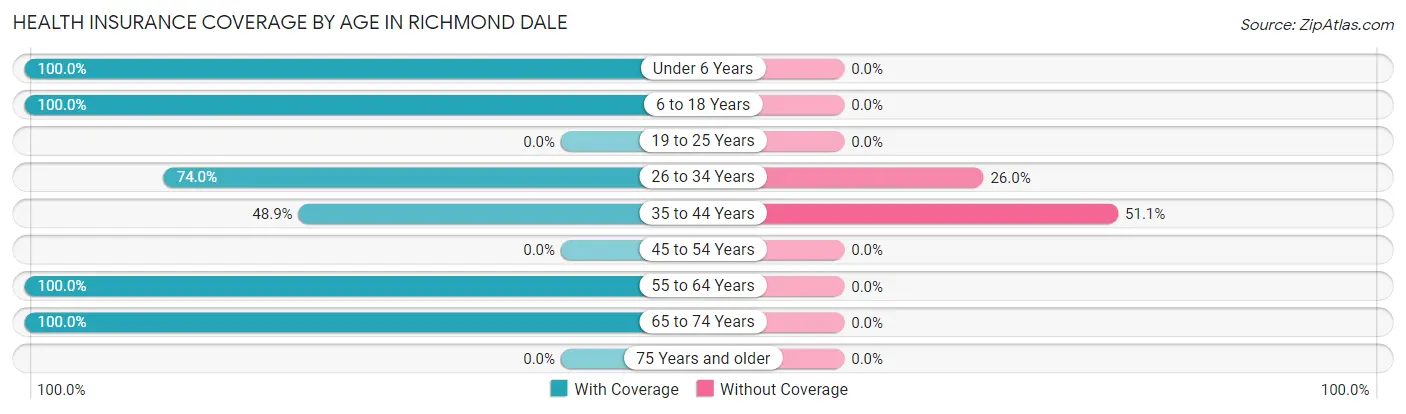
| Age Bracket | With Coverage | Without Coverage |
| Under 6 Years | 59 (100.0%) | 0 (0.0%) |
| 6 to 18 Years | 96 (100.0%) | 0 (0.0%) |
| 19 to 25 Years | 0 (0.0%) | 0 (0.0%) |
| 26 to 34 Years | 77 (74.0%) | 27 (26.0%) |
| 35 to 44 Years | 23 (48.9%) | 24 (51.1%) |
| 45 to 54 Years | 0 (0.0%) | 0 (0.0%) |
| 55 to 64 Years | 65 (100.0%) | 0 (0.0%) |
| 65 to 74 Years | 52 (100.0%) | 0 (0.0%) |
| 75 Years and older | 0 (0.0%) | 0 (0.0%) |
| Total | 372 (87.9%) | 51 (12.1%) |
Health Insurance Coverage by Citizenship Status in Richmond Dale
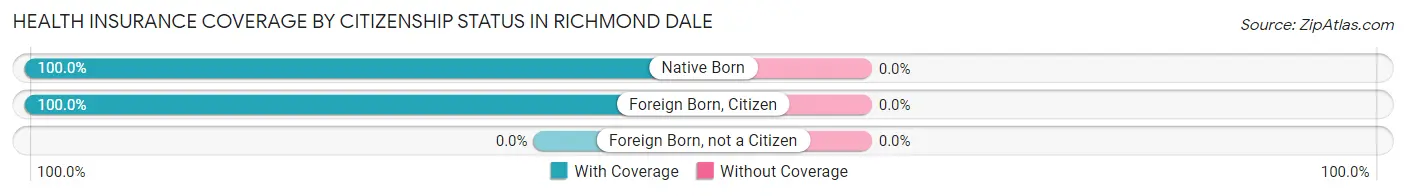
| Citizenship Status | With Coverage | Without Coverage |
| Native Born | 59 (100.0%) | 0 (0.0%) |
| Foreign Born, Citizen | 96 (100.0%) | 0 (0.0%) |
| Foreign Born, not a Citizen | 0 (0.0%) | 0 (0.0%) |
Health Insurance Coverage by Household Income in Richmond Dale
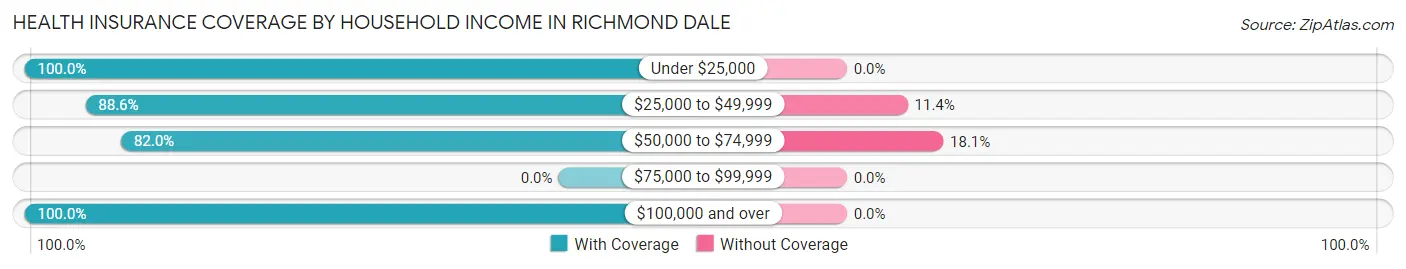
| Household Income | With Coverage | Without Coverage |
| Under $25,000 | 12 (100.0%) | 0 (0.0%) |
| $25,000 to $49,999 | 210 (88.6%) | 27 (11.4%) |
| $50,000 to $74,999 | 109 (82.0%) | 24 (18.0%) |
| $75,000 to $99,999 | 0 (0.0%) | 0 (0.0%) |
| $100,000 and over | 41 (100.0%) | 0 (0.0%) |
Public vs Private Health Insurance Coverage by Age in Richmond Dale
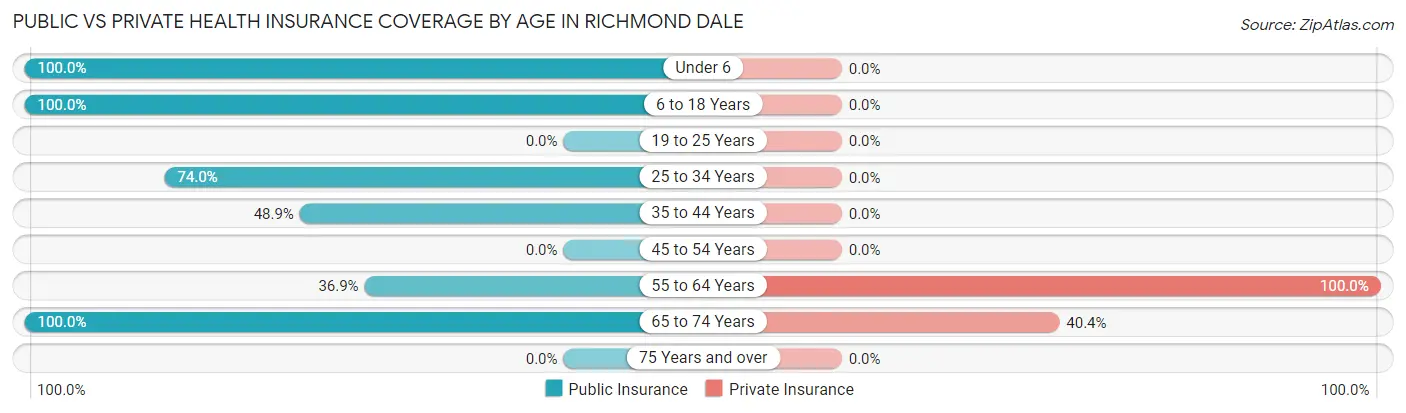
| Age Bracket | Public Insurance | Private Insurance |
| Under 6 | 59 (100.0%) | 0 (0.0%) |
| 6 to 18 Years | 96 (100.0%) | 0 (0.0%) |
| 19 to 25 Years | 0 (0.0%) | 0 (0.0%) |
| 25 to 34 Years | 77 (74.0%) | 0 (0.0%) |
| 35 to 44 Years | 23 (48.9%) | 0 (0.0%) |
| 45 to 54 Years | 0 (0.0%) | 0 (0.0%) |
| 55 to 64 Years | 24 (36.9%) | 65 (100.0%) |
| 65 to 74 Years | 52 (100.0%) | 21 (40.4%) |
| 75 Years and over | 0 (0.0%) | 0 (0.0%) |
| Total | 331 (78.2%) | 86 (20.3%) |
Disability Status by Sex by Age in Richmond Dale
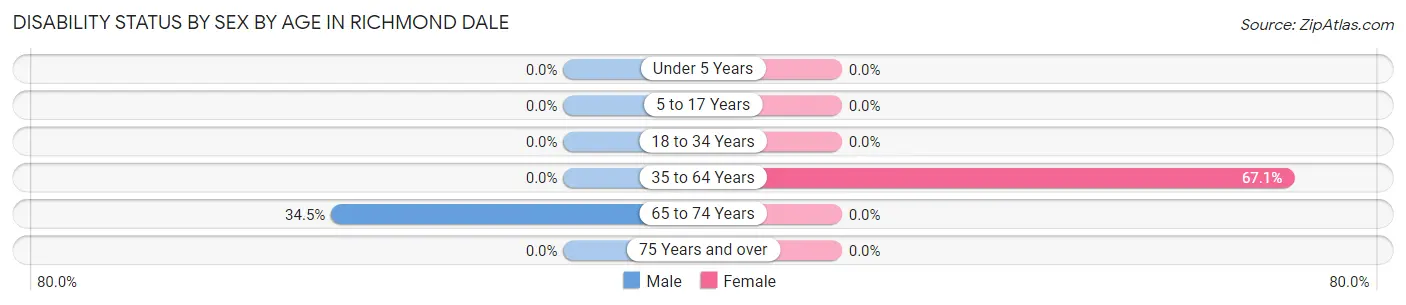
| Age Bracket | Male | Female |
| Under 5 Years | 0 (0.0%) | 0 (0.0%) |
| 5 to 17 Years | 0 (0.0%) | 0 (0.0%) |
| 18 to 34 Years | 0 (0.0%) | 0 (0.0%) |
| 35 to 64 Years | 0 (0.0%) | 47 (67.1%) |
| 65 to 74 Years | 10 (34.5%) | 0 (0.0%) |
| 75 Years and over | 0 (0.0%) | 0 (0.0%) |
Disability Class by Sex by Age in Richmond Dale
Disability Class: Hearing Difficulty
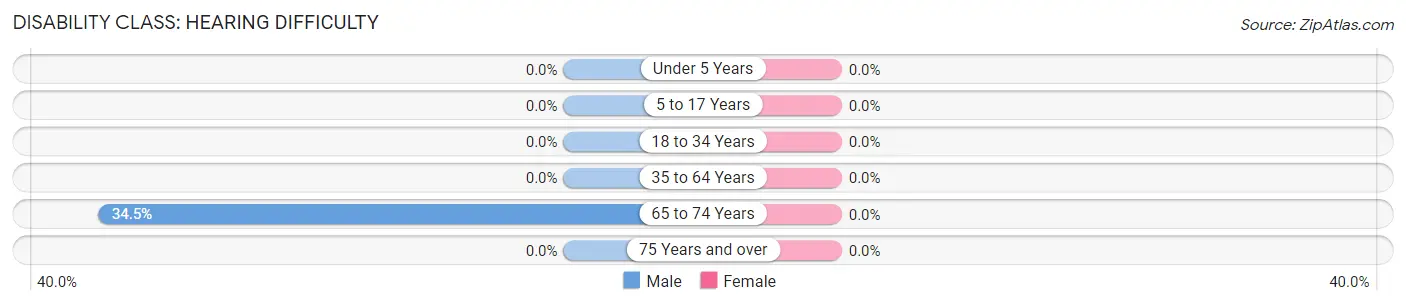
| Age Bracket | Male | Female |
| Under 5 Years | 0 (0.0%) | 0 (0.0%) |
| 5 to 17 Years | 0 (0.0%) | 0 (0.0%) |
| 18 to 34 Years | 0 (0.0%) | 0 (0.0%) |
| 35 to 64 Years | 0 (0.0%) | 0 (0.0%) |
| 65 to 74 Years | 10 (34.5%) | 0 (0.0%) |
| 75 Years and over | 0 (0.0%) | 0 (0.0%) |
Disability Class: Vision Difficulty
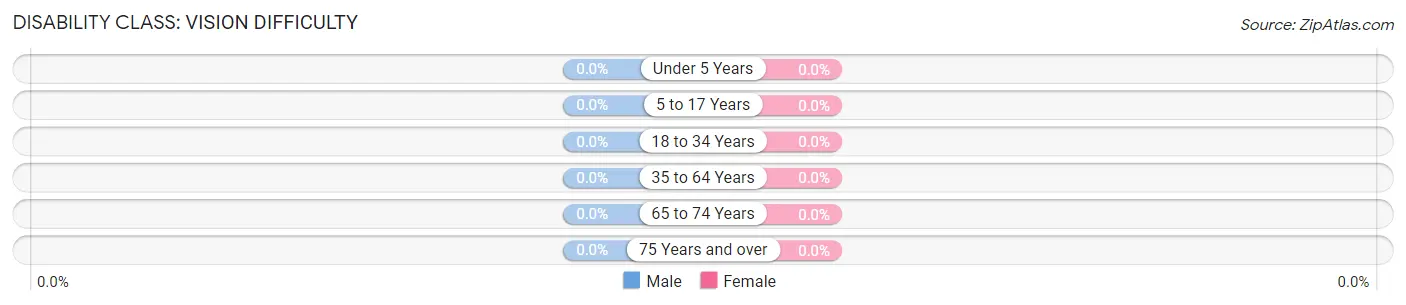
| Age Bracket | Male | Female |
| Under 5 Years | 0 (0.0%) | 0 (0.0%) |
| 5 to 17 Years | 0 (0.0%) | 0 (0.0%) |
| 18 to 34 Years | 0 (0.0%) | 0 (0.0%) |
| 35 to 64 Years | 0 (0.0%) | 0 (0.0%) |
| 65 to 74 Years | 0 (0.0%) | 0 (0.0%) |
| 75 Years and over | 0 (0.0%) | 0 (0.0%) |
Disability Class: Cognitive Difficulty
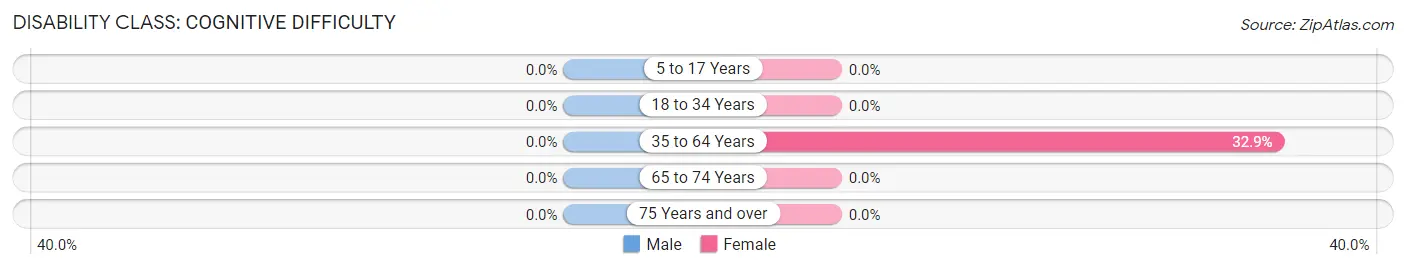
| Age Bracket | Male | Female |
| 5 to 17 Years | 0 (0.0%) | 0 (0.0%) |
| 18 to 34 Years | 0 (0.0%) | 0 (0.0%) |
| 35 to 64 Years | 0 (0.0%) | 23 (32.9%) |
| 65 to 74 Years | 0 (0.0%) | 0 (0.0%) |
| 75 Years and over | 0 (0.0%) | 0 (0.0%) |
Disability Class: Ambulatory Difficulty
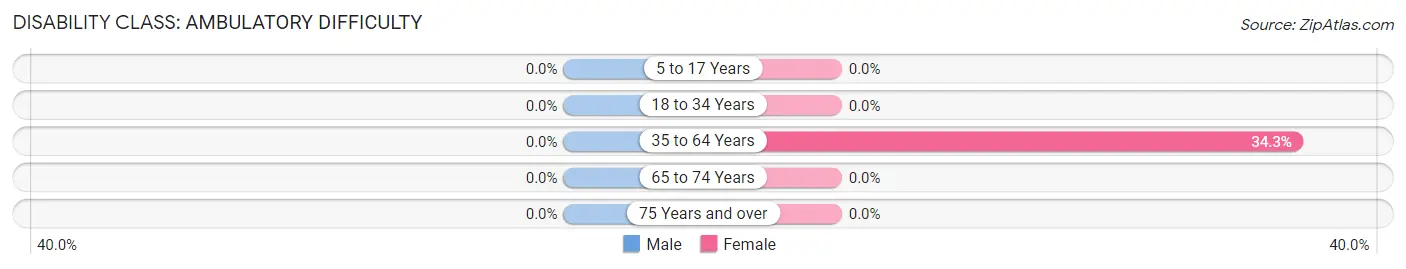
| Age Bracket | Male | Female |
| 5 to 17 Years | 0 (0.0%) | 0 (0.0%) |
| 18 to 34 Years | 0 (0.0%) | 0 (0.0%) |
| 35 to 64 Years | 0 (0.0%) | 24 (34.3%) |
| 65 to 74 Years | 0 (0.0%) | 0 (0.0%) |
| 75 Years and over | 0 (0.0%) | 0 (0.0%) |
Disability Class: Self-Care Difficulty
| Age Bracket | Male | Female |
| 5 to 17 Years | 0 (0.0%) | 0 (0.0%) |
| 18 to 34 Years | 0 (0.0%) | 0 (0.0%) |
| 35 to 64 Years | 0 (0.0%) | 0 (0.0%) |
| 65 to 74 Years | 0 (0.0%) | 0 (0.0%) |
| 75 Years and over | 0 (0.0%) | 0 (0.0%) |
Technology Access in Richmond Dale
Computing Device Access in Richmond Dale
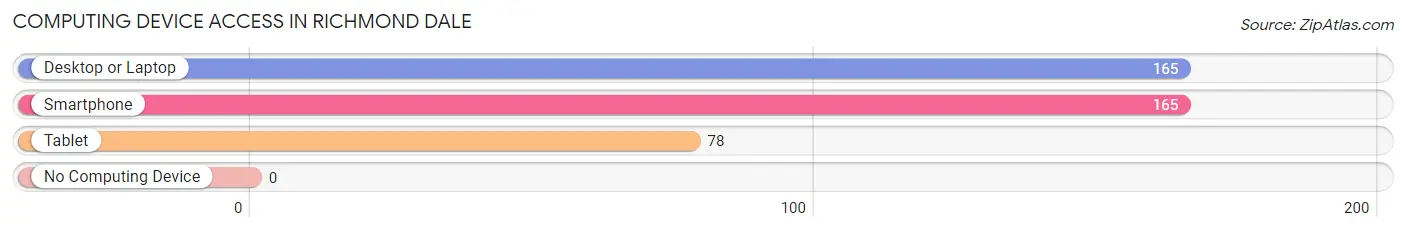
| Device Type | # Households | % Households |
| Desktop or Laptop | 165 | 100.0% |
| Smartphone | 165 | 100.0% |
| Tablet | 78 | 47.3% |
| No Computing Device | 0 | 0.0% |
| Total | 165 | 100.0% |
Internet Access in Richmond Dale
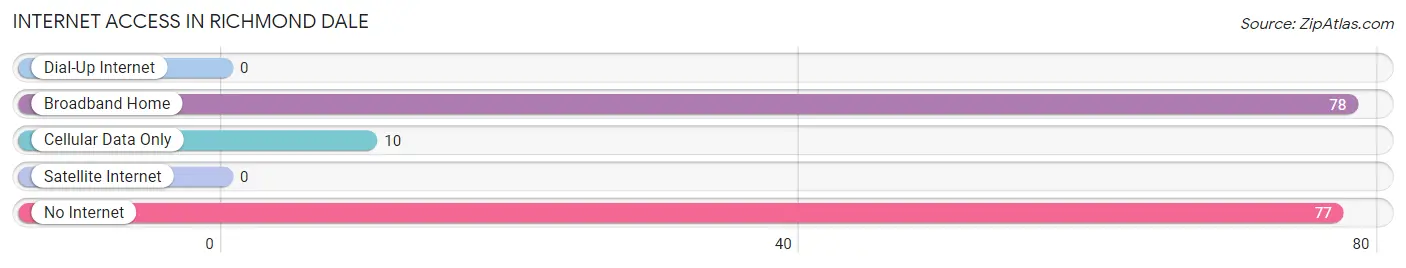
| Internet Type | # Households | % Households |
| Dial-Up Internet | 0 | 0.0% |
| Broadband Home | 78 | 47.3% |
| Cellular Data Only | 10 | 6.1% |
| Satellite Internet | 0 | 0.0% |
| No Internet | 77 | 46.7% |
| Total | 165 | 100.0% |
Richmond Dale Summary
Richmond Dale is a small unincorporated community located in Ross County, Ohio. It is situated in the foothills of the Appalachian Mountains, approximately 10 miles south of Chillicothe, the county seat. The community is located along the Scioto River, and is home to a population of approximately 500 people.
History
Richmond Dale was founded in 1817 by a group of settlers from Richmond, Virginia. The settlers named the community after their hometown, and it quickly became a thriving agricultural center. The community was home to a variety of businesses, including a grist mill, a sawmill, a blacksmith shop, and a general store.
In 1845, the Scioto and Hocking Valley Railroad was built through Richmond Dale, connecting the community to Chillicothe and other nearby towns. This allowed for the easy transportation of goods and people, and helped to further spur the growth of the community.
In the late 19th century, Richmond Dale was home to a variety of industries, including a brickyard, a furniture factory, and a canning factory. The community also had a number of churches, schools, and other businesses.
Geography
Richmond Dale is located in the foothills of the Appalachian Mountains, approximately 10 miles south of Chillicothe. The community is situated along the Scioto River, and is surrounded by rolling hills and farmland. The climate in Richmond Dale is generally mild, with hot summers and cold winters.
Economy
Richmond Dale is a small, rural community with a limited economy. The primary industries in the area are agriculture and tourism. The community is home to a number of farms, which produce a variety of crops, including corn, soybeans, and hay.
The community is also home to a number of tourist attractions, including the Scioto River, the historic Richmond Dale Church, and the Richmond Dale Historical Society Museum. These attractions draw visitors from all over the region, and help to support the local economy.
Demographics
As of the 2010 census, Richmond Dale had a population of 498 people. The racial makeup of the community was 97.2% White, 0.6% African American, 0.2% Native American, 0.2% Asian, 0.2% from other races, and 1.8% from two or more races. Hispanic or Latino of any race were 0.8% of the population.
The median household income in Richmond Dale was $41,250, and the median family income was $45,000. The per capita income was $19,845. About 11.2% of families and 13.2% of the population were below the poverty line, including 17.2% of those under age 18 and 8.3% of those age 65 or over.
Conclusion
Richmond Dale is a small, rural community located in Ross County, Ohio. It is situated in the foothills of the Appalachian Mountains, and is home to a population of approximately 500 people. The community is primarily agricultural, with a number of farms producing a variety of crops. It is also home to a number of tourist attractions, which help to support the local economy. The population of Richmond Dale is predominantly white, with a median household income of $41,250.
Common Questions
What is Per Capita Income in Richmond Dale?
Per Capita income in Richmond Dale is $16,102.
What is Inequality or Gini Index in Richmond Dale?
Inequality or Gini Index in Richmond Dale is 0.25.
What is the Total Population of Richmond Dale?
Total Population of Richmond Dale is 423.
What is the Total Male Population of Richmond Dale?
Total Male Population of Richmond Dale is 157.
What is the Total Female Population of Richmond Dale?
Total Female Population of Richmond Dale is 266.
What is the Ratio of Males per 100 Females in Richmond Dale?
There are 59.02 Males per 100 Females in Richmond Dale.
What is the Ratio of Females per 100 Males in Richmond Dale?
There are 169.43 Females per 100 Males in Richmond Dale.
What is the Median Population Age in Richmond Dale?
Median Population Age in Richmond Dale is 28.4 Years.
What is the Average Family Size in Richmond Dale
Average Family Size in Richmond Dale is 2.7 People.
What is the Average Household Size in Richmond Dale
Average Household Size in Richmond Dale is 2.6 People.
How Large is the Labor Force in Richmond Dale?
There are 104 People in the Labor Forcein in Richmond Dale.
What is the Percentage of People in the Labor Force in Richmond Dale?
38.8% of People are in the Labor Force in Richmond Dale.