Zip Codes with the Highest Percentage of Population Employed in Administrative & Support Services in Columbus, OH
RELATED REPORTS & OPTIONS
Administrative & Support Services
Columbus
Compare Zip Codes
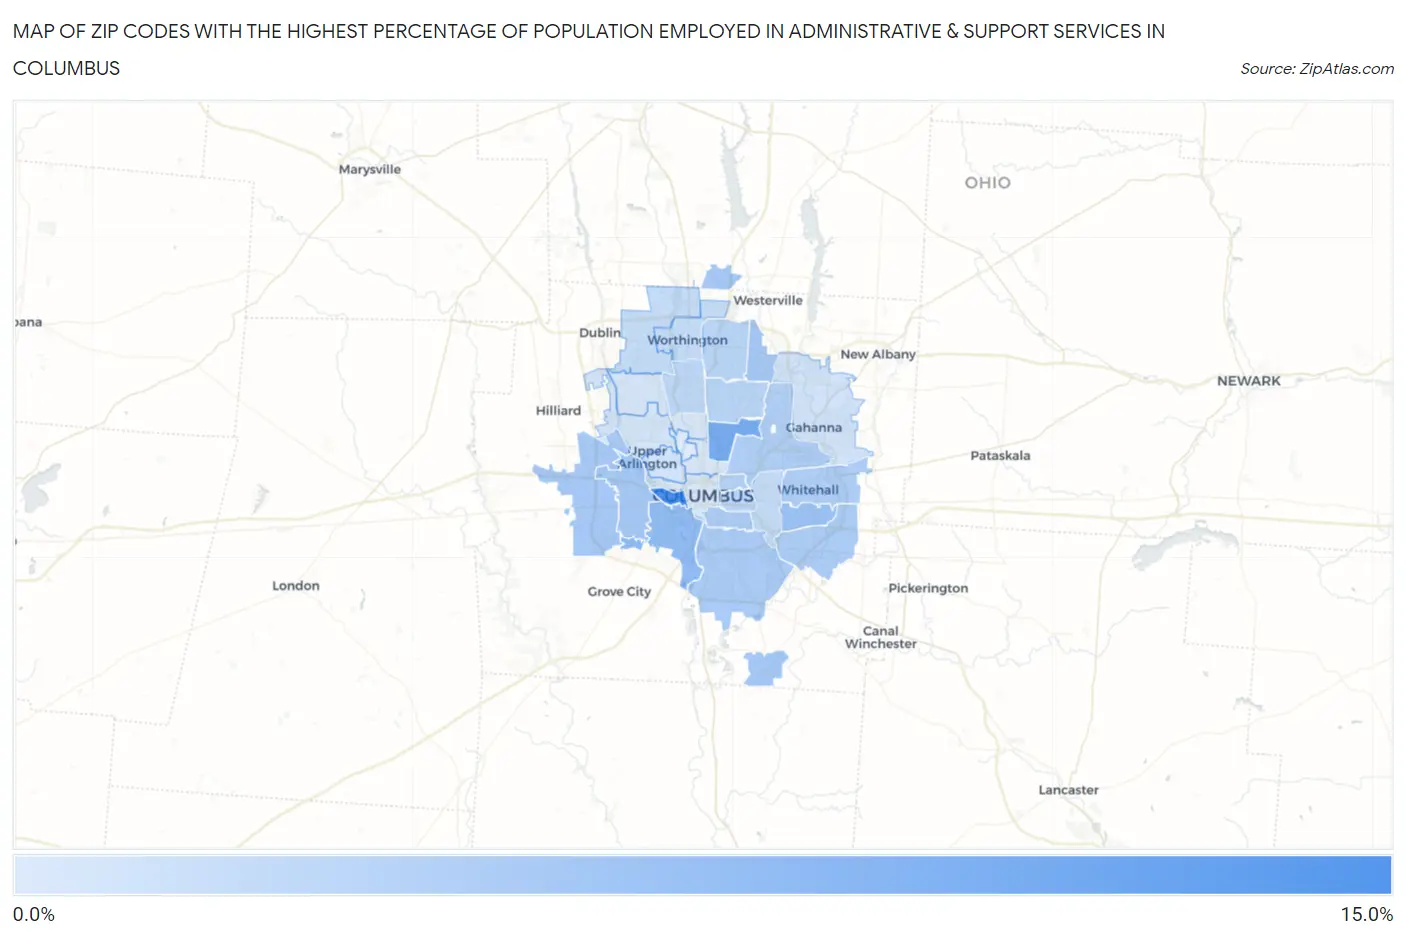
Map of Zip Codes with the Highest Percentage of Population Employed in Administrative & Support Services in Columbus
1.7%
14.8%
Zip Codes with the Highest Percentage of Population Employed in Administrative & Support Services in Columbus, OH
| Zip Code | % Employed | vs State | vs National | |
| 1. | 43222 | 14.8% | 3.7%(+11.1)#23 | 4.1%(+10.7)#545 |
| 2. | 43211 | 10.3% | 3.7%(+6.62)#44 | 4.1%(+6.19)#1,187 |
| 3. | 43223 | 8.2% | 3.7%(+4.43)#81 | 4.1%(+4.00)#2,174 |
| 4. | 43227 | 7.1% | 3.7%(+3.38)#118 | 4.1%(+2.96)#3,091 |
| 5. | 43204 | 6.4% | 3.7%(+2.66)#153 | 4.1%(+2.24)#4,099 |
| 6. | 43240 | 6.4% | 3.7%(+2.65)#154 | 4.1%(+2.22)#4,120 |
| 7. | 43228 | 6.3% | 3.7%(+2.61)#156 | 4.1%(+2.18)#4,188 |
| 8. | 43231 | 6.3% | 3.7%(+2.60)#157 | 4.1%(+2.17)#4,208 |
| 9. | 43217 | 6.3% | 3.7%(+2.58)#158 | 4.1%(+2.16)#4,232 |
| 10. | 43207 | 5.9% | 3.7%(+2.18)#189 | 4.1%(+1.76)#4,945 |
| 11. | 43232 | 5.8% | 3.7%(+2.12)#194 | 4.1%(+1.69)#5,069 |
| 12. | 43206 | 5.8% | 3.7%(+2.06)#200 | 4.1%(+1.64)#5,178 |
| 13. | 43213 | 5.6% | 3.7%(+1.88)#215 | 4.1%(+1.45)#5,589 |
| 14. | 43219 | 5.4% | 3.7%(+1.66)#235 | 4.1%(+1.23)#6,114 |
| 15. | 43203 | 5.1% | 3.7%(+1.34)#264 | 4.1%(+0.914)#6,935 |
| 16. | 43229 | 4.5% | 3.7%(+0.770)#342 | 4.1%(+0.344)#8,747 |
| 17. | 43224 | 4.5% | 3.7%(+0.763)#344 | 4.1%(+0.337)#8,758 |
| 18. | 43205 | 4.2% | 3.7%(+0.510)#375 | 4.1%(+0.085)#9,681 |
| 19. | 43214 | 4.2% | 3.7%(+0.509)#376 | 4.1%(+0.084)#9,683 |
| 20. | 43085 | 3.6% | 3.7%(-0.082)#461 | 4.1%(-0.507)#12,275 |
| 21. | 43209 | 3.6% | 3.7%(-0.086)#462 | 4.1%(-0.512)#12,286 |
| 22. | 43235 | 3.6% | 3.7%(-0.125)#471 | 4.1%(-0.550)#12,478 |
| 23. | 43212 | 2.7% | 3.7%(-1.02)#676 | 4.1%(-1.44)#17,042 |
| 24. | 43230 | 2.6% | 3.7%(-1.10)#699 | 4.1%(-1.53)#17,501 |
| 25. | 43221 | 2.5% | 3.7%(-1.23)#715 | 4.1%(-1.66)#18,182 |
| 26. | 43220 | 2.3% | 3.7%(-1.38)#754 | 4.1%(-1.81)#18,983 |
| 27. | 43215 | 2.1% | 3.7%(-1.65)#812 | 4.1%(-2.07)#20,247 |
| 28. | 43201 | 1.8% | 3.7%(-1.91)#865 | 4.1%(-2.33)#21,438 |
| 29. | 43202 | 1.8% | 3.7%(-1.94)#871 | 4.1%(-2.36)#21,585 |
| 30. | 43210 | 1.7% | 3.7%(-2.03)#885 | 4.1%(-2.46)#22,011 |
1
Common Questions
What are the Top 10 Zip Codes with the Highest Percentage of Population Employed in Administrative & Support Services in Columbus, OH?
Top 10 Zip Codes with the Highest Percentage of Population Employed in Administrative & Support Services in Columbus, OH are:
What zip code has the Highest Percentage of Population Employed in Administrative & Support Services in Columbus, OH?
43222 has the Highest Percentage of Population Employed in Administrative & Support Services in Columbus, OH with 14.8%.
What is the Percentage of Population Employed in Administrative & Support Services in Columbus, OH?
Percentage of Population Employed in Administrative & Support Services in Columbus is 4.7%.
What is the Percentage of Population Employed in Administrative & Support Services in Ohio?
Percentage of Population Employed in Administrative & Support Services in Ohio is 3.7%.
What is the Percentage of Population Employed in Administrative & Support Services in the United States?
Percentage of Population Employed in Administrative & Support Services in the United States is 4.1%.