Richwood, OH Map & Demographics
Richwood Map
Richwood Overview
$36,754
PER CAPITA INCOME
$76,818
AVG FAMILY INCOME
$63,185
AVG HOUSEHOLD INCOME
5.5%
WAGE / INCOME GAP [ % ]
94.5¢/ $1
WAGE / INCOME GAP [ $ ]
0.51
INEQUALITY / GINI INDEX
2,222
TOTAL POPULATION
1,068
MALE POPULATION
1,154
FEMALE POPULATION
92.55
MALES / 100 FEMALES
108.05
FEMALES / 100 MALES
38.2
MEDIAN AGE
3.1
AVG FAMILY SIZE
2.4
AVG HOUSEHOLD SIZE
1,144
LABOR FORCE [ PEOPLE ]
66.1%
PERCENT IN LABOR FORCE
4.0%
UNEMPLOYMENT RATE
Richwood Zip Codes
Income in Richwood
Income Overview in Richwood
Per Capita Income in Richwood is $36,754, while median incomes of families and households are $76,818 and $63,185 respectively.
| Characteristic | Number | Measure |
| Per Capita Income | 2,222 | $36,754 |
| Median Family Income | 542 | $76,818 |
| Mean Family Income | 542 | $114,052 |
| Median Household Income | 931 | $63,185 |
| Mean Household Income | 931 | $90,273 |
| Income Deficit | 542 | $0 |
| Wage / Income Gap (%) | 2,222 | 5.53% |
| Wage / Income Gap ($) | 2,222 | 94.47¢ per $1 |
| Gini / Inequality Index | 2,222 | 0.51 |
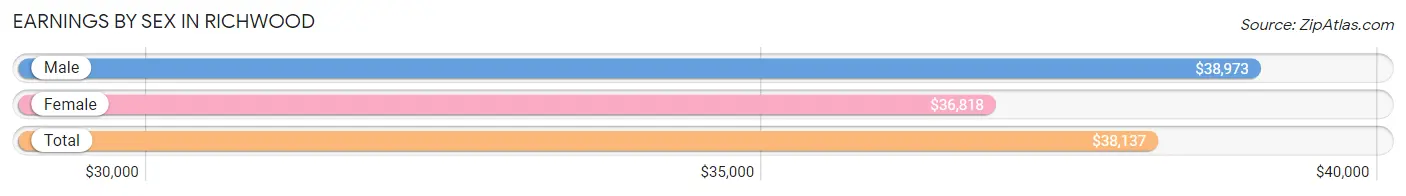
Earnings by Sex in Richwood
Average Earnings in Richwood are $38,137, $38,973 for men and $36,818 for women, a difference of 5.5%.
| Sex | Number | Average Earnings |
| Male | 633 (53.8%) | $38,973 |
| Female | 544 (46.2%) | $36,818 |
| Total | 1,177 (100.0%) | $38,137 |
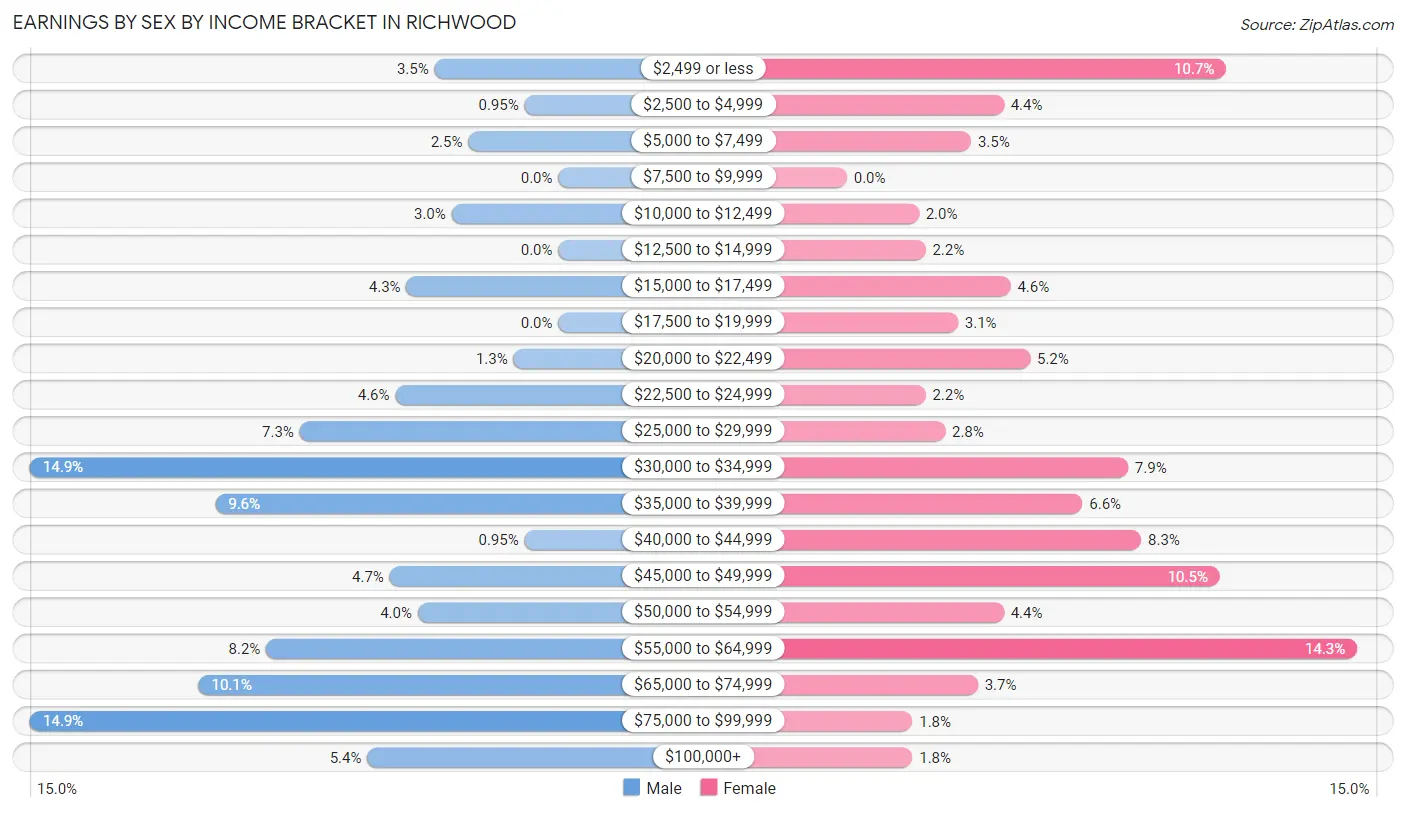
Earnings by Sex by Income Bracket in Richwood
The most common earnings brackets in Richwood are $30,000 to $34,999 for men (94 | 14.8%) and $55,000 to $64,999 for women (78 | 14.3%).
| Income | Male | Female |
| $2,499 or less | 22 (3.5%) | 58 (10.7%) |
| $2,500 to $4,999 | 6 (0.9%) | 24 (4.4%) |
| $5,000 to $7,499 | 16 (2.5%) | 19 (3.5%) |
| $7,500 to $9,999 | 0 (0.0%) | 0 (0.0%) |
| $10,000 to $12,499 | 19 (3.0%) | 11 (2.0%) |
| $12,500 to $14,999 | 0 (0.0%) | 12 (2.2%) |
| $15,000 to $17,499 | 27 (4.3%) | 25 (4.6%) |
| $17,500 to $19,999 | 0 (0.0%) | 17 (3.1%) |
| $20,000 to $22,499 | 8 (1.3%) | 28 (5.1%) |
| $22,500 to $24,999 | 29 (4.6%) | 12 (2.2%) |
| $25,000 to $29,999 | 46 (7.3%) | 15 (2.8%) |
| $30,000 to $34,999 | 94 (14.8%) | 43 (7.9%) |
| $35,000 to $39,999 | 61 (9.6%) | 36 (6.6%) |
| $40,000 to $44,999 | 6 (0.9%) | 45 (8.3%) |
| $45,000 to $49,999 | 30 (4.7%) | 57 (10.5%) |
| $50,000 to $54,999 | 25 (4.0%) | 24 (4.4%) |
| $55,000 to $64,999 | 52 (8.2%) | 78 (14.3%) |
| $65,000 to $74,999 | 64 (10.1%) | 20 (3.7%) |
| $75,000 to $99,999 | 94 (14.8%) | 10 (1.8%) |
| $100,000+ | 34 (5.4%) | 10 (1.8%) |
| Total | 633 (100.0%) | 544 (100.0%) |
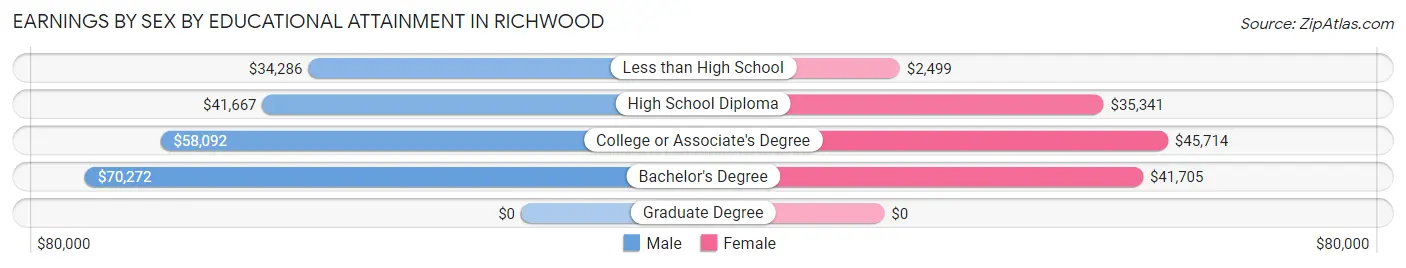
Earnings by Sex by Educational Attainment in Richwood
Average earnings in Richwood are $48,810 for men and $38,750 for women, a difference of 20.6%. Men with an educational attainment of bachelor's degree enjoy the highest average annual earnings of $70,272, while those with less than high school education earn the least with $34,286. Women with an educational attainment of college or associate's degree earn the most with the average annual earnings of $45,714, while those with less than high school education have the smallest earnings of $2,499.
| Educational Attainment | Male Income | Female Income |
| Less than High School | $34,286 | $2,499 |
| High School Diploma | $41,667 | $35,341 |
| College or Associate's Degree | $58,092 | $45,714 |
| Bachelor's Degree | $70,272 | $41,705 |
| Graduate Degree | - | - |
| Total | $48,810 | $38,750 |
Family Income in Richwood
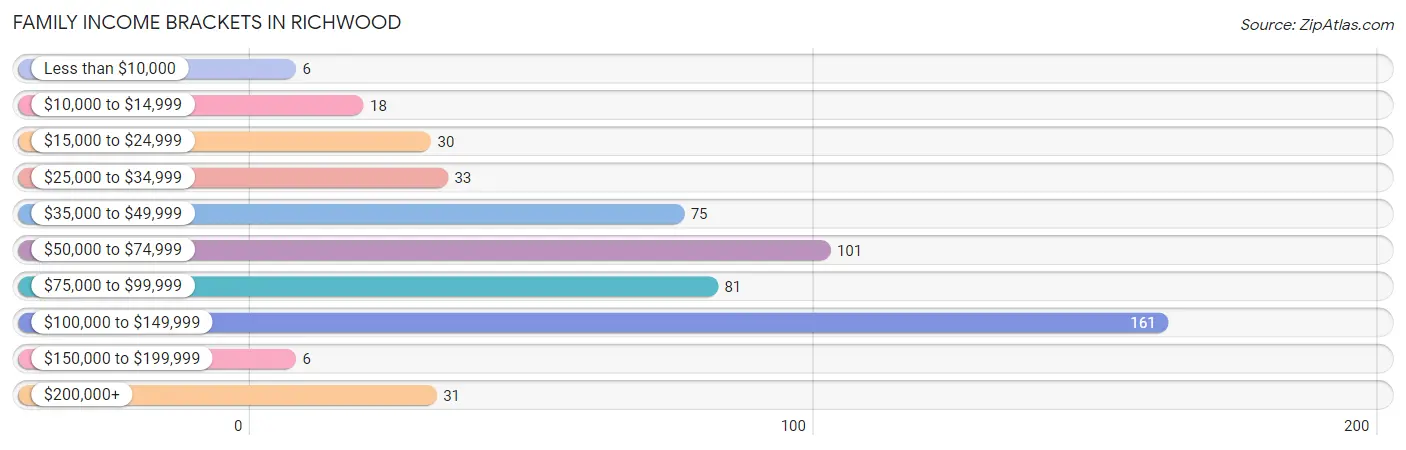
Family Income Brackets in Richwood
According to the Richwood family income data, there are 161 families falling into the $100,000 to $149,999 income range, which is the most common income bracket and makes up 29.7% of all families. Conversely, the less than $10,000 income bracket is the least frequent group with only 6 families (1.1%) belonging to this category.
| Income Bracket | # Families | % Families |
| Less than $10,000 | 6 | 1.1% |
| $10,000 to $14,999 | 18 | 3.3% |
| $15,000 to $24,999 | 30 | 5.5% |
| $25,000 to $34,999 | 33 | 6.1% |
| $35,000 to $49,999 | 75 | 13.8% |
| $50,000 to $74,999 | 101 | 18.6% |
| $75,000 to $99,999 | 81 | 14.9% |
| $100,000 to $149,999 | 161 | 29.7% |
| $150,000 to $199,999 | 6 | 1.1% |
| $200,000+ | 31 | 5.7% |
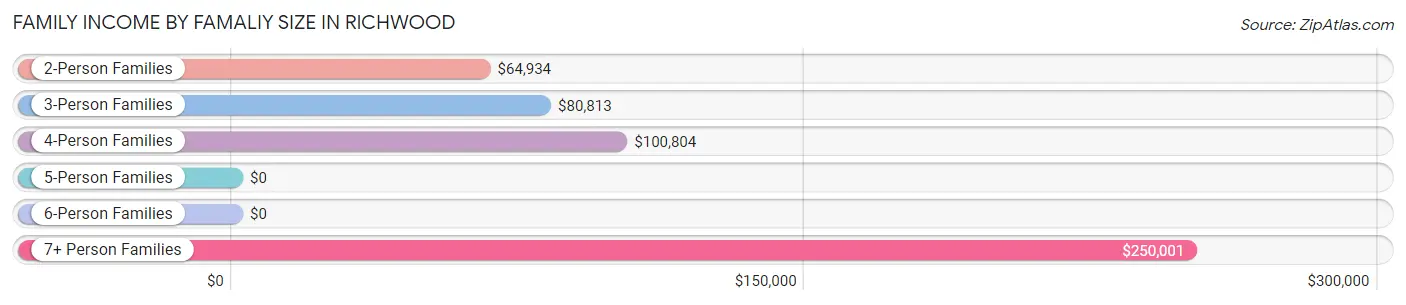
Family Income by Famaliy Size in Richwood
7+ person families (17 | 3.1%) account for the highest median family income in Richwood with $250,001 per family, while 7+ person families (17 | 3.1%) have the highest median income of $35,714 per family member.
| Income Bracket | # Families | Median Income |
| 2-Person Families | 223 (41.1%) | $64,934 |
| 3-Person Families | 121 (22.3%) | $80,813 |
| 4-Person Families | 95 (17.5%) | $100,804 |
| 5-Person Families | 67 (12.4%) | $0 |
| 6-Person Families | 19 (3.5%) | $0 |
| 7+ Person Families | 17 (3.1%) | $250,001 |
| Total | 542 (100.0%) | $76,818 |
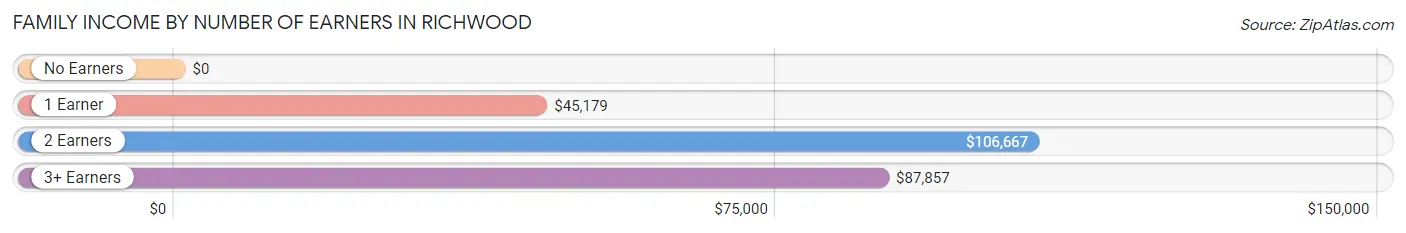
Family Income by Number of Earners in Richwood
| Number of Earners | # Families | Median Income |
| No Earners | 73 (13.5%) | $0 |
| 1 Earner | 191 (35.2%) | $45,179 |
| 2 Earners | 224 (41.3%) | $106,667 |
| 3+ Earners | 54 (10.0%) | $87,857 |
| Total | 542 (100.0%) | $76,818 |
Household Income in Richwood
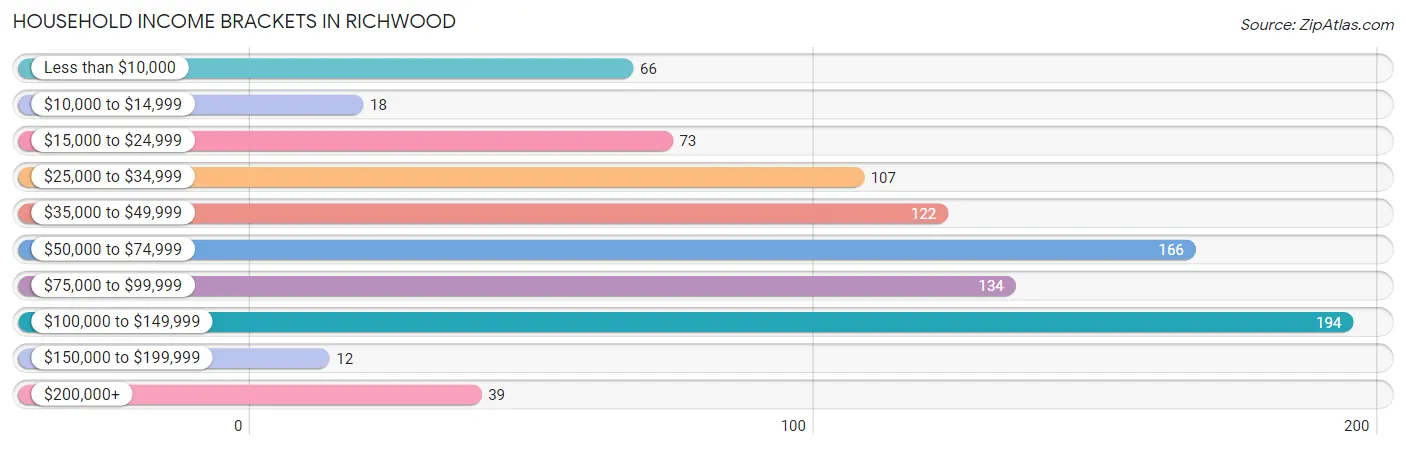
Household Income Brackets in Richwood
With 194 households falling in the category, the $100,000 to $149,999 income range is the most frequent in Richwood, accounting for 20.8% of all households. In contrast, only 12 households (1.3%) fall into the $150,000 to $199,999 income bracket, making it the least populous group.
| Income Bracket | # Households | % Households |
| Less than $10,000 | 66 | 7.1% |
| $10,000 to $14,999 | 18 | 1.9% |
| $15,000 to $24,999 | 73 | 7.8% |
| $25,000 to $34,999 | 107 | 11.5% |
| $35,000 to $49,999 | 122 | 13.1% |
| $50,000 to $74,999 | 166 | 17.8% |
| $75,000 to $99,999 | 134 | 14.4% |
| $100,000 to $149,999 | 194 | 20.8% |
| $150,000 to $199,999 | 12 | 1.3% |
| $200,000+ | 39 | 4.2% |
Household Income by Householder Age in Richwood
The median household income in Richwood is $63,185, with the highest median household income of $72,375 found in the 25 to 44 years age bracket for the primary householder. A total of 295 households (31.7%) fall into this category. Meanwhile, the 15 to 24 years age bracket for the primary householder has the lowest median household income of $0, with 12 households (1.3%) in this group.
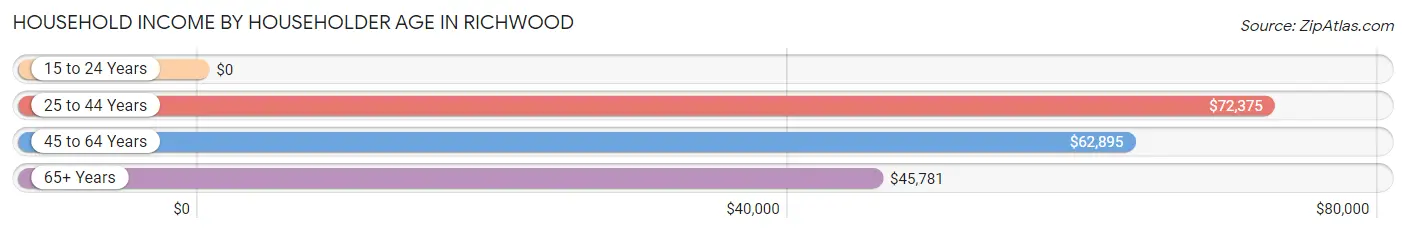
| Income Bracket | # Households | Median Income |
| 15 to 24 Years | 12 (1.3%) | $0 |
| 25 to 44 Years | 295 (31.7%) | $72,375 |
| 45 to 64 Years | 424 (45.5%) | $62,895 |
| 65+ Years | 200 (21.5%) | $45,781 |
| Total | 931 (100.0%) | $63,185 |
Poverty in Richwood
Income Below Poverty by Sex and Age in Richwood
With 11.6% poverty level for males and 13.1% for females among the residents of Richwood, 15 year old males and 16 and 17 year old females are the most vulnerable to poverty, with 12 males (27.9%) and 24 females (54.5%) in their respective age groups living below the poverty level.
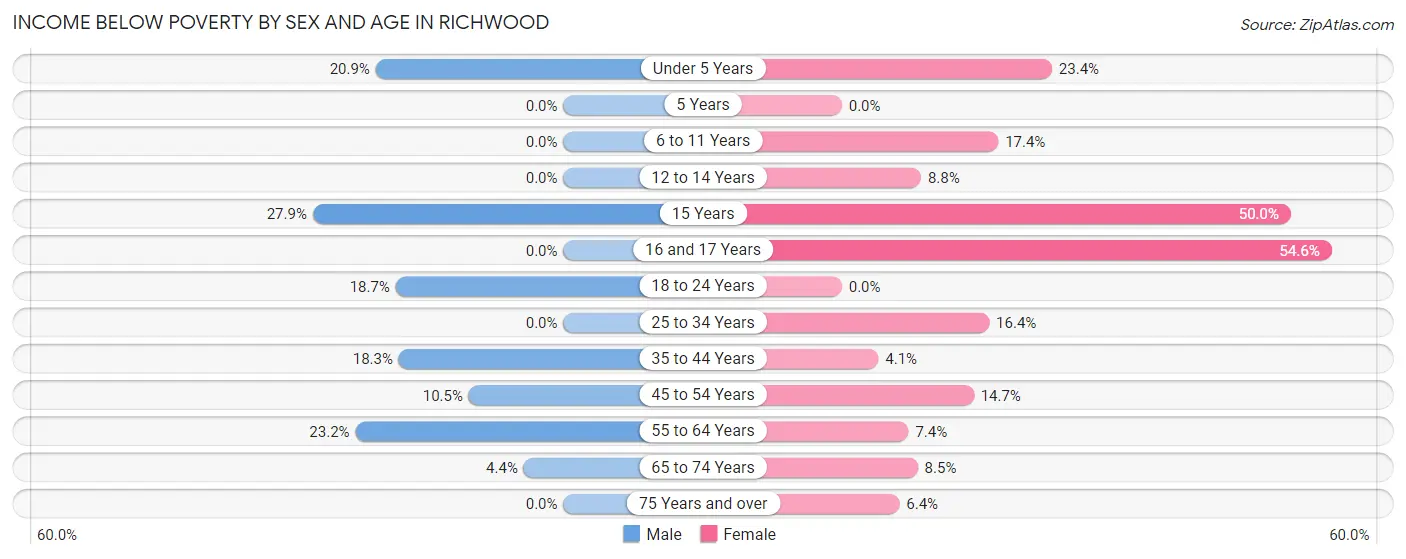
| Age Bracket | Male | Female |
| Under 5 Years | 14 (20.9%) | 11 (23.4%) |
| 5 Years | 0 (0.0%) | 0 (0.0%) |
| 6 to 11 Years | 0 (0.0%) | 23 (17.4%) |
| 12 to 14 Years | 0 (0.0%) | 9 (8.8%) |
| 15 Years | 12 (27.9%) | 4 (50.0%) |
| 16 and 17 Years | 0 (0.0%) | 24 (54.5%) |
| 18 to 24 Years | 14 (18.7%) | 0 (0.0%) |
| 25 to 34 Years | 0 (0.0%) | 32 (16.4%) |
| 35 to 44 Years | 22 (18.3%) | 5 (4.1%) |
| 45 to 54 Years | 18 (10.5%) | 21 (14.7%) |
| 55 to 64 Years | 41 (23.2%) | 11 (7.4%) |
| 65 to 74 Years | 3 (4.4%) | 6 (8.5%) |
| 75 Years and over | 0 (0.0%) | 5 (6.4%) |
| Total | 124 (11.6%) | 151 (13.1%) |
Income Above Poverty by Sex and Age in Richwood
According to the poverty statistics in Richwood, males aged 6 to 11 years and females aged 5 years are the age groups that are most secure financially, with 100.0% of males and 100.0% of females in these age groups living above the poverty line.
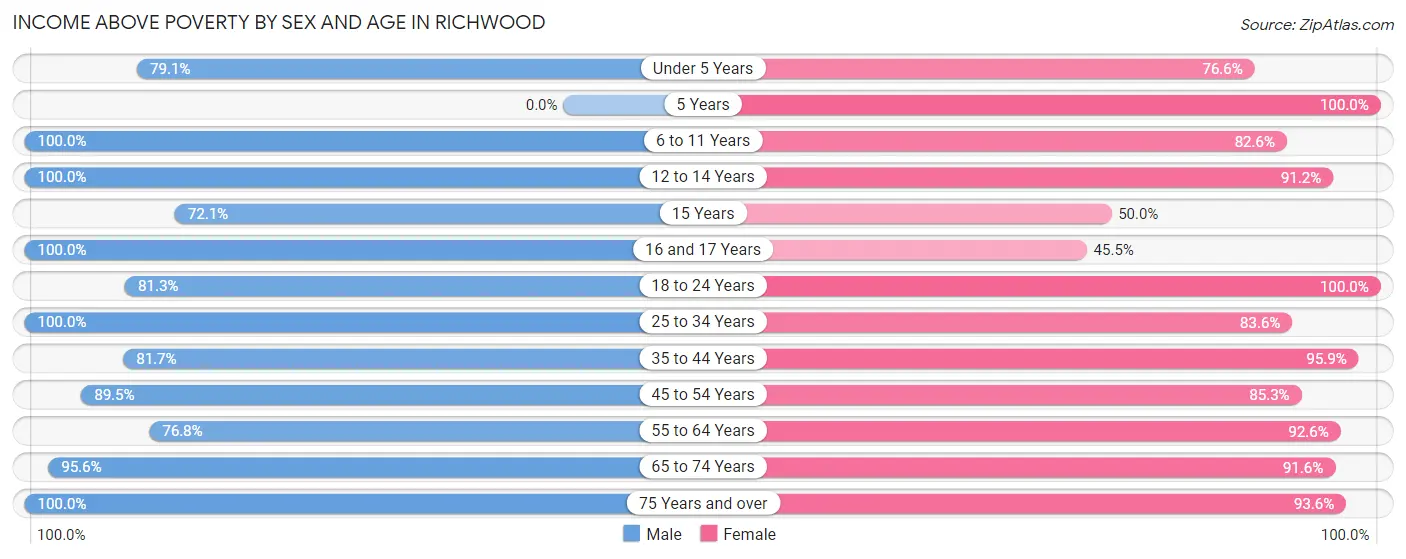
| Age Bracket | Male | Female |
| Under 5 Years | 53 (79.1%) | 36 (76.6%) |
| 5 Years | 0 (0.0%) | 4 (100.0%) |
| 6 to 11 Years | 42 (100.0%) | 109 (82.6%) |
| 12 to 14 Years | 46 (100.0%) | 93 (91.2%) |
| 15 Years | 31 (72.1%) | 4 (50.0%) |
| 16 and 17 Years | 11 (100.0%) | 20 (45.5%) |
| 18 to 24 Years | 61 (81.3%) | 59 (100.0%) |
| 25 to 34 Years | 182 (100.0%) | 163 (83.6%) |
| 35 to 44 Years | 98 (81.7%) | 118 (95.9%) |
| 45 to 54 Years | 153 (89.5%) | 122 (85.3%) |
| 55 to 64 Years | 136 (76.8%) | 137 (92.6%) |
| 65 to 74 Years | 65 (95.6%) | 65 (91.5%) |
| 75 Years and over | 66 (100.0%) | 73 (93.6%) |
| Total | 944 (88.4%) | 1,003 (86.9%) |
Income Below Poverty Among Married-Couple Families in Richwood
The poverty statistics for married-couple families in Richwood show that 5.5% or 20 of the total 363 families live below the poverty line. Families with 5 or more children have the highest poverty rate of 41.7%, comprising of 5 families. On the other hand, families with no children have the lowest poverty rate of 0.0%, which includes 0 families.
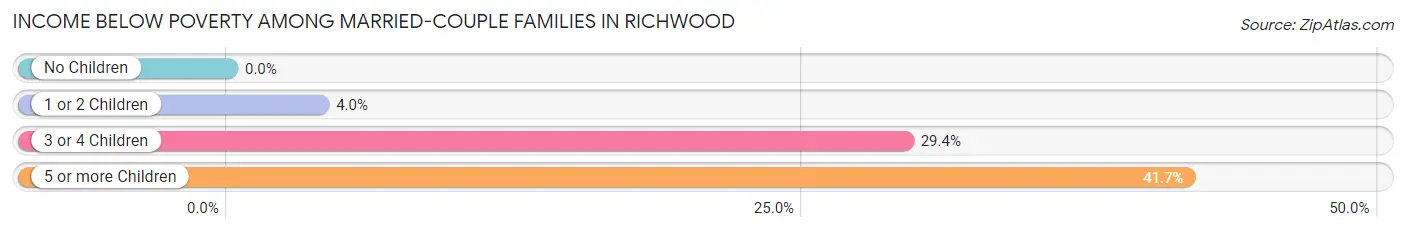
| Children | Above Poverty | Below Poverty |
| No Children | 191 (100.0%) | 0 (0.0%) |
| 1 or 2 Children | 121 (96.0%) | 5 (4.0%) |
| 3 or 4 Children | 24 (70.6%) | 10 (29.4%) |
| 5 or more Children | 7 (58.3%) | 5 (41.7%) |
| Total | 343 (94.5%) | 20 (5.5%) |
Income Below Poverty Among Single-Parent Households in Richwood
According to the poverty data in Richwood, 26.0% or 19 single-father households and 5.7% or 6 single-mother households are living below the poverty line. Among single-father households, those with 1 or 2 children have the highest poverty rate, with 19 households (42.2%) experiencing poverty. Likewise, among single-mother households, those with 1 or 2 children have the highest poverty rate, with 6 households (26.1%) falling below the poverty line.
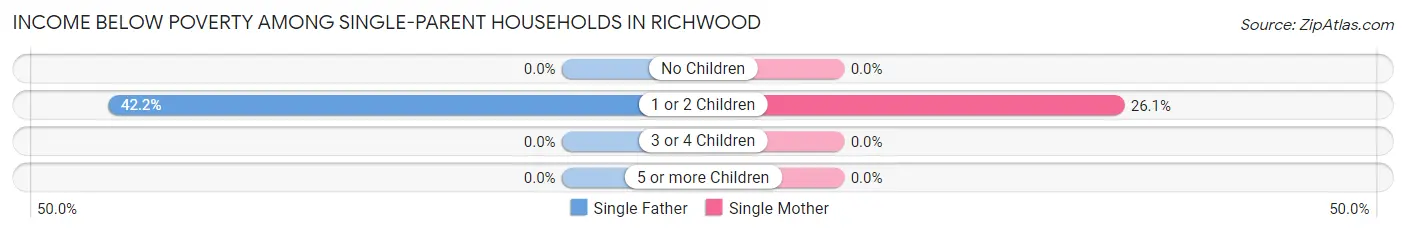
| Children | Single Father | Single Mother |
| No Children | 0 (0.0%) | 0 (0.0%) |
| 1 or 2 Children | 19 (42.2%) | 6 (26.1%) |
| 3 or 4 Children | 0 (0.0%) | 0 (0.0%) |
| 5 or more Children | 0 (0.0%) | 0 (0.0%) |
| Total | 19 (26.0%) | 6 (5.7%) |
Income Below Poverty Among Married-Couple vs Single-Parent Households in Richwood
The poverty data for Richwood shows that 20 of the married-couple family households (5.5%) and 25 of the single-parent households (14.0%) are living below the poverty level. Within the married-couple family households, those with 5 or more children have the highest poverty rate, with 5 households (41.7%) falling below the poverty line. Among the single-parent households, those with 1 or 2 children have the highest poverty rate, with 25 household (36.8%) living below poverty.
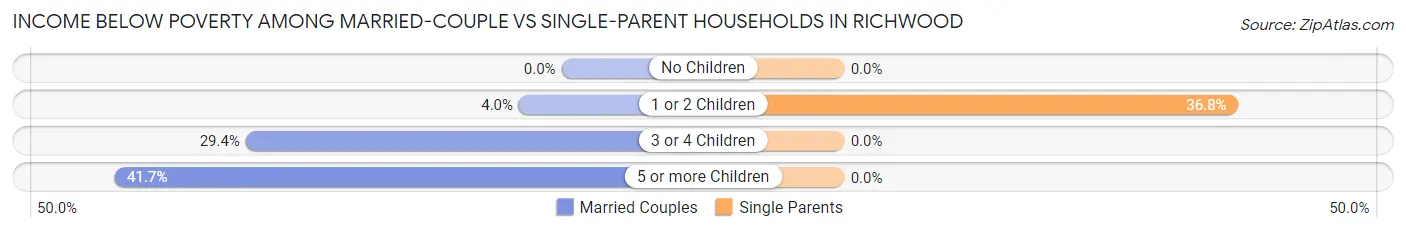
| Children | Married-Couple Families | Single-Parent Households |
| No Children | 0 (0.0%) | 0 (0.0%) |
| 1 or 2 Children | 5 (4.0%) | 25 (36.8%) |
| 3 or 4 Children | 10 (29.4%) | 0 (0.0%) |
| 5 or more Children | 5 (41.7%) | 0 (0.0%) |
| Total | 20 (5.5%) | 25 (14.0%) |
Race in Richwood
The most populous races in Richwood are White / Caucasian (2,030 | 91.4%), Two or more Races (136 | 6.1%), and Hispanic or Latino (90 | 4.1%).
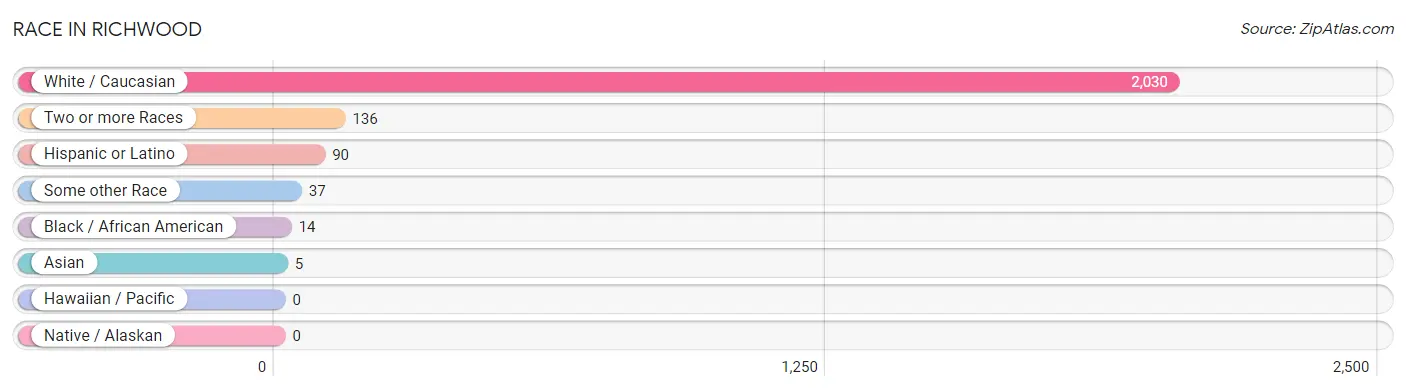
| Race | # Population | % Population |
| Asian | 5 | 0.2% |
| Black / African American | 14 | 0.6% |
| Hawaiian / Pacific | 0 | 0.0% |
| Hispanic or Latino | 90 | 4.1% |
| Native / Alaskan | 0 | 0.0% |
| White / Caucasian | 2,030 | 91.4% |
| Two or more Races | 136 | 6.1% |
| Some other Race | 37 | 1.7% |
| Total | 2,222 | 100.0% |
Ancestry in Richwood
The most populous ancestries reported in Richwood are German (419 | 18.9%), Irish (374 | 16.8%), American (339 | 15.3%), English (139 | 6.3%), and Italian (102 | 4.6%), together accounting for 61.8% of all Richwood residents.
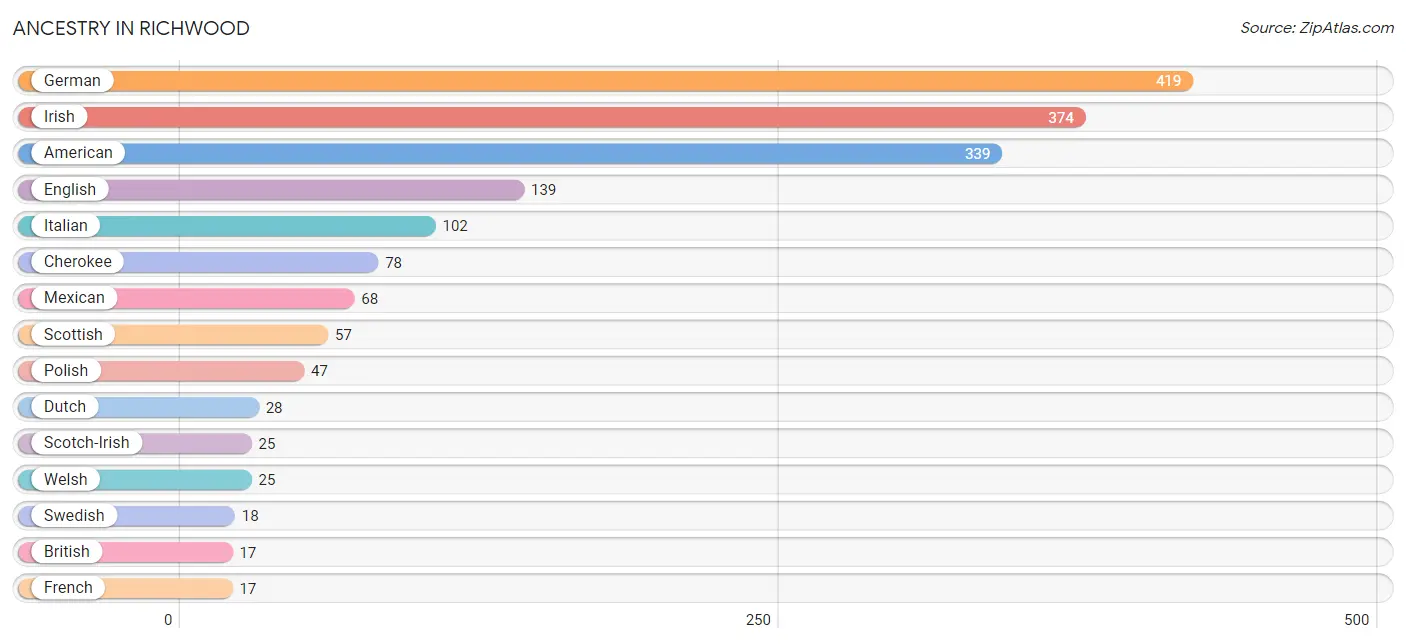
| Ancestry | # Population | % Population |
| American | 339 | 15.3% |
| Austrian | 5 | 0.2% |
| Bhutanese | 10 | 0.4% |
| British | 17 | 0.8% |
| Central American | 13 | 0.6% |
| Cherokee | 78 | 3.5% |
| Colombian | 9 | 0.4% |
| Dutch | 28 | 1.3% |
| English | 139 | 6.3% |
| European | 6 | 0.3% |
| French | 17 | 0.8% |
| German | 419 | 18.9% |
| Guatemalan | 13 | 0.6% |
| Icelander | 6 | 0.3% |
| Indian (Asian) | 12 | 0.5% |
| Irish | 374 | 16.8% |
| Italian | 102 | 4.6% |
| Mexican | 68 | 3.1% |
| Polish | 47 | 2.1% |
| Portuguese | 6 | 0.3% |
| Scotch-Irish | 25 | 1.1% |
| Scottish | 57 | 2.6% |
| South American | 9 | 0.4% |
| Swedish | 18 | 0.8% |
| Welsh | 25 | 1.1% |
| West Indian | 10 | 0.4% | View All 26 Rows |
Immigrants in Richwood
The most numerous immigrant groups reported in Richwood came from Latin America (39 | 1.8%), Central America (31 | 1.4%), Mexico (31 | 1.4%), South America (8 | 0.4%), and Brazil (5 | 0.2%), together accounting for 5.2% of all Richwood residents.
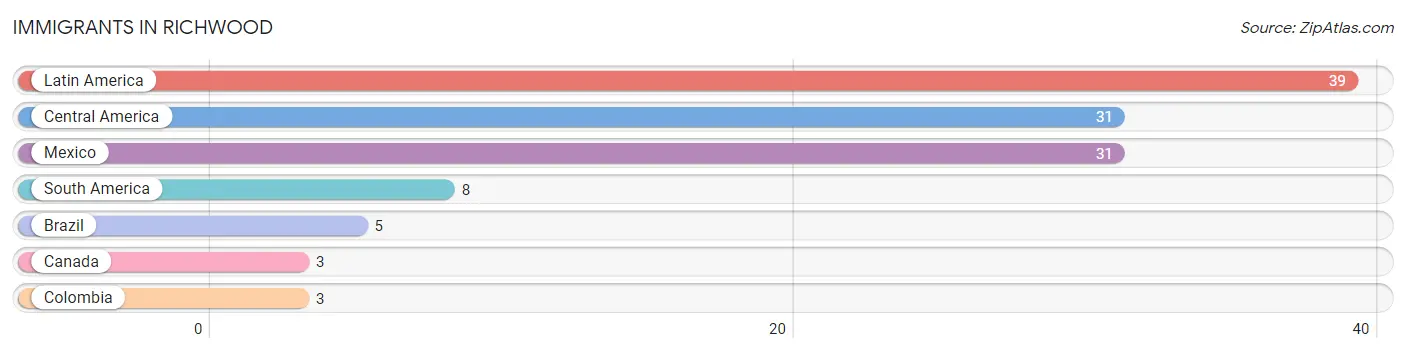
| Immigration Origin | # Population | % Population |
| Brazil | 5 | 0.2% |
| Canada | 3 | 0.1% |
| Central America | 31 | 1.4% |
| Colombia | 3 | 0.1% |
| Latin America | 39 | 1.8% |
| Mexico | 31 | 1.4% |
| South America | 8 | 0.4% | View All 7 Rows |
Sex and Age in Richwood
Sex and Age in Richwood
The most populous age groups in Richwood are 60 to 64 Years (119 | 11.1%) for men and 10 to 14 Years (142 | 12.3%) for women.
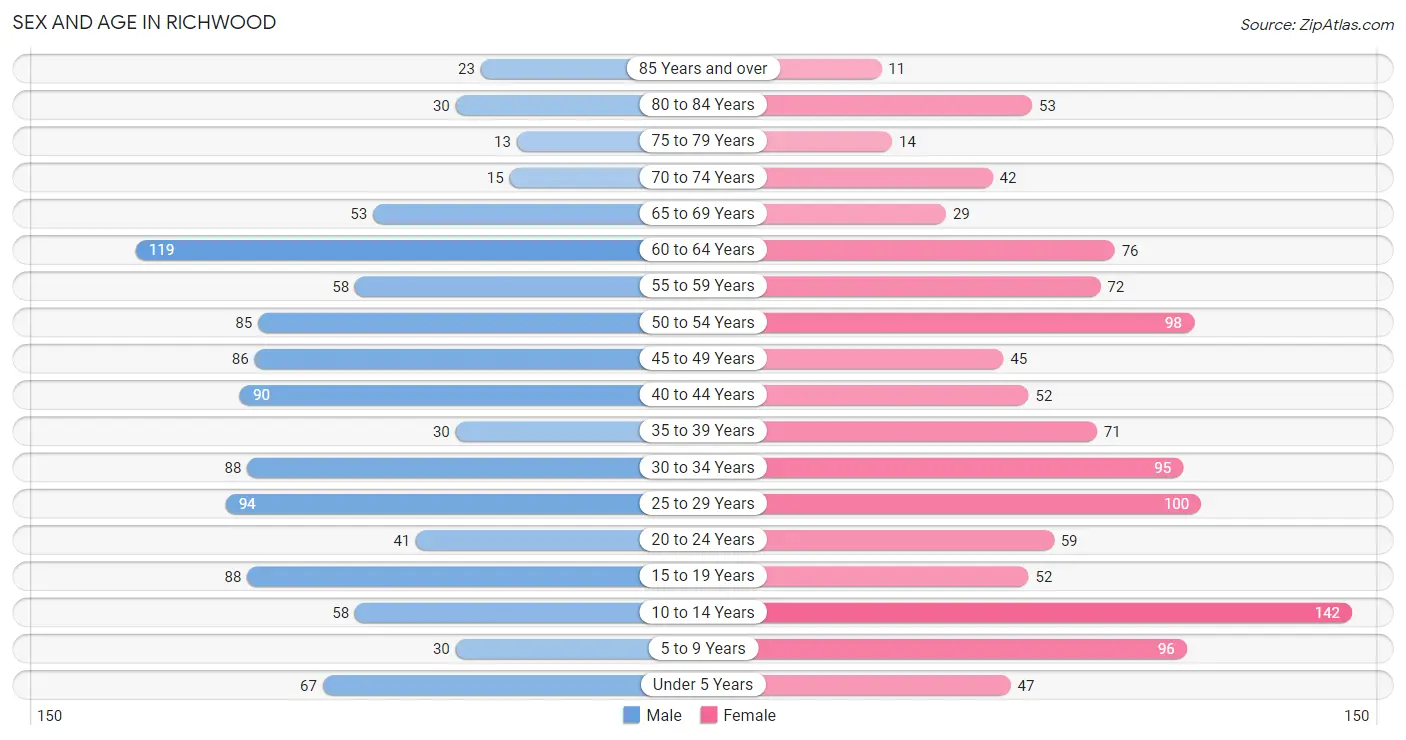
| Age Bracket | Male | Female |
| Under 5 Years | 67 (6.3%) | 47 (4.1%) |
| 5 to 9 Years | 30 (2.8%) | 96 (8.3%) |
| 10 to 14 Years | 58 (5.4%) | 142 (12.3%) |
| 15 to 19 Years | 88 (8.2%) | 52 (4.5%) |
| 20 to 24 Years | 41 (3.8%) | 59 (5.1%) |
| 25 to 29 Years | 94 (8.8%) | 100 (8.7%) |
| 30 to 34 Years | 88 (8.2%) | 95 (8.2%) |
| 35 to 39 Years | 30 (2.8%) | 71 (6.1%) |
| 40 to 44 Years | 90 (8.4%) | 52 (4.5%) |
| 45 to 49 Years | 86 (8.1%) | 45 (3.9%) |
| 50 to 54 Years | 85 (8.0%) | 98 (8.5%) |
| 55 to 59 Years | 58 (5.4%) | 72 (6.2%) |
| 60 to 64 Years | 119 (11.1%) | 76 (6.6%) |
| 65 to 69 Years | 53 (5.0%) | 29 (2.5%) |
| 70 to 74 Years | 15 (1.4%) | 42 (3.6%) |
| 75 to 79 Years | 13 (1.2%) | 14 (1.2%) |
| 80 to 84 Years | 30 (2.8%) | 53 (4.6%) |
| 85 Years and over | 23 (2.1%) | 11 (0.9%) |
| Total | 1,068 (100.0%) | 1,154 (100.0%) |
Families and Households in Richwood
Median Family Size in Richwood
The median family size in Richwood is 3.11 persons per family, with single female/mother families (106 | 19.6%) accounting for the largest median family size of 3.29 persons per family. On the other hand, single male/father families (73 | 13.5%) represent the smallest median family size with 2.34 persons per family.
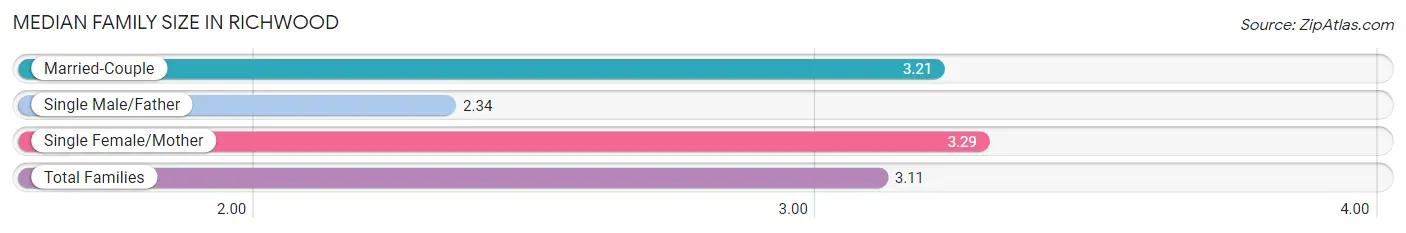
| Family Type | # Families | Family Size |
| Married-Couple | 363 (67.0%) | 3.21 |
| Single Male/Father | 73 (13.5%) | 2.34 |
| Single Female/Mother | 106 (19.6%) | 3.29 |
| Total Families | 542 (100.0%) | 3.11 |
Median Household Size in Richwood
The median household size in Richwood is 2.39 persons per household, with single female/mother households (106 | 11.4%) accounting for the largest median household size of 3.42 persons per household. non-family households (389 | 41.8%) represent the smallest median household size with 1.27 persons per household.
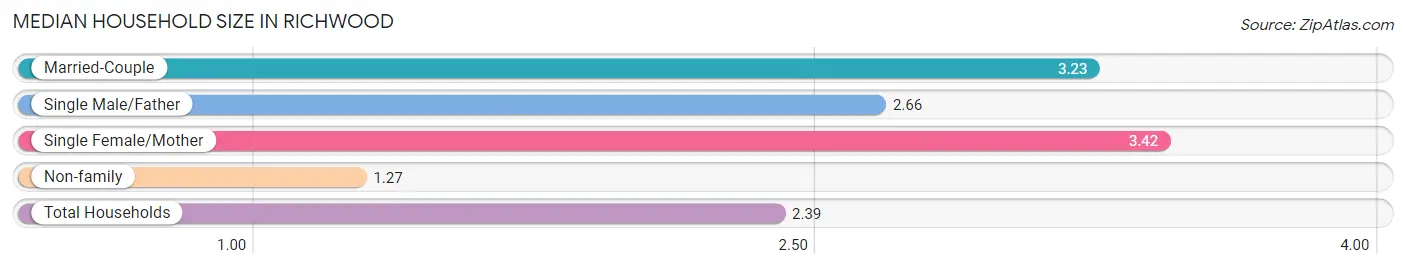
| Household Type | # Households | Household Size |
| Married-Couple | 363 (39.0%) | 3.23 |
| Single Male/Father | 73 (7.8%) | 2.66 |
| Single Female/Mother | 106 (11.4%) | 3.42 |
| Non-family | 389 (41.8%) | 1.27 |
| Total Households | 931 (100.0%) | 2.39 |
Household Size by Marriage Status in Richwood
Out of a total of 931 households in Richwood, 542 (58.2%) are family households, while 389 (41.8%) are nonfamily households. The most numerous type of family households are 2-person households, comprising 203, and the most common type of nonfamily households are 1-person households, comprising 285.
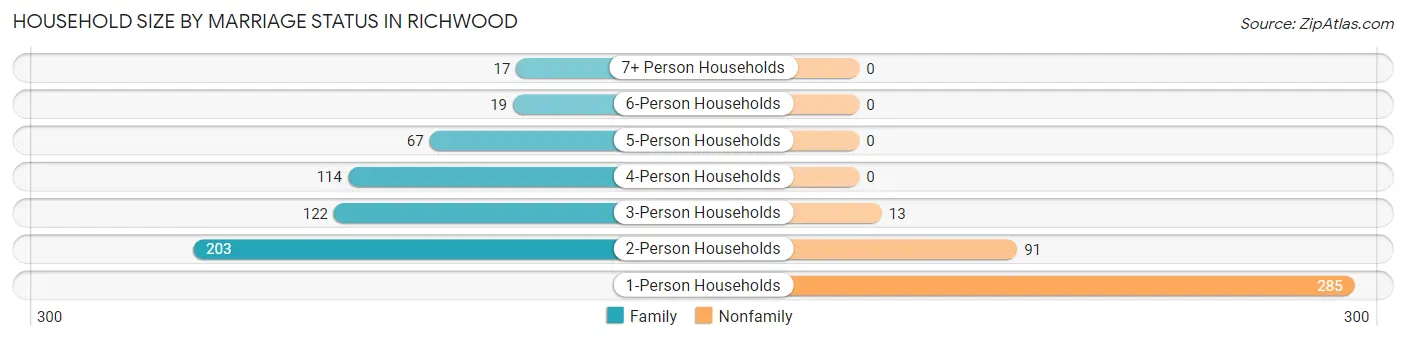
| Household Size | Family Households | Nonfamily Households |
| 1-Person Households | - | 285 (30.6%) |
| 2-Person Households | 203 (21.8%) | 91 (9.8%) |
| 3-Person Households | 122 (13.1%) | 13 (1.4%) |
| 4-Person Households | 114 (12.2%) | 0 (0.0%) |
| 5-Person Households | 67 (7.2%) | 0 (0.0%) |
| 6-Person Households | 19 (2.0%) | 0 (0.0%) |
| 7+ Person Households | 17 (1.8%) | 0 (0.0%) |
| Total | 542 (58.2%) | 389 (41.8%) |
Female Fertility in Richwood
Fertility by Age in Richwood
Average fertility rate in Richwood is 37.0 births per 1,000 women. Women in the age bracket of 35 to 50 years have the highest fertility rate with 43.0 births per 1,000 women. Women in the age bracket of 20 to 34 years acount for 55.6% of all women with births.
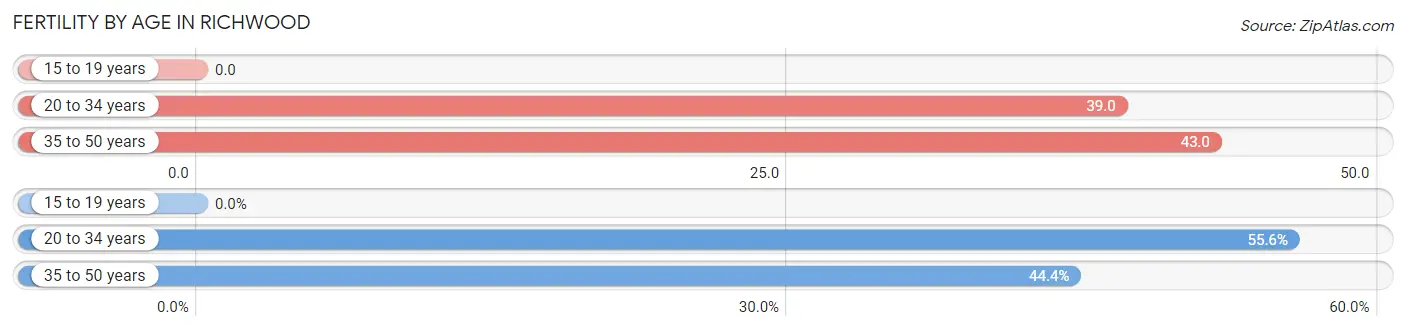
| Age Bracket | Women with Births | Births / 1,000 Women |
| 15 to 19 years | 0 (0.0%) | 0.0 |
| 20 to 34 years | 10 (55.6%) | 39.0 |
| 35 to 50 years | 8 (44.4%) | 43.0 |
| Total | 18 (100.0%) | 37.0 |
Fertility by Age by Marriage Status in Richwood
55.6% of women with births (18) in Richwood are married. The highest percentage of unmarried women with births falls into 20 to 34 years age bracket with 80.0% of them unmarried at the time of birth, while the lowest percentage of unmarried women with births belong to 35 to 50 years age bracket with 0.0% of them unmarried.
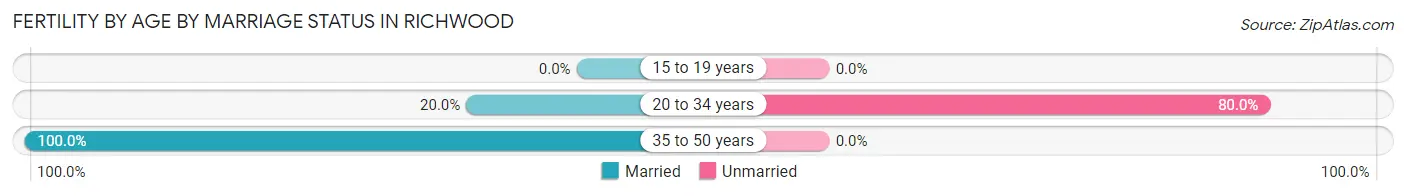
| Age Bracket | Married | Unmarried |
| 15 to 19 years | 0 (0.0%) | 0 (0.0%) |
| 20 to 34 years | 2 (20.0%) | 8 (80.0%) |
| 35 to 50 years | 8 (100.0%) | 0 (0.0%) |
| Total | 10 (55.6%) | 8 (44.4%) |
Fertility by Education in Richwood
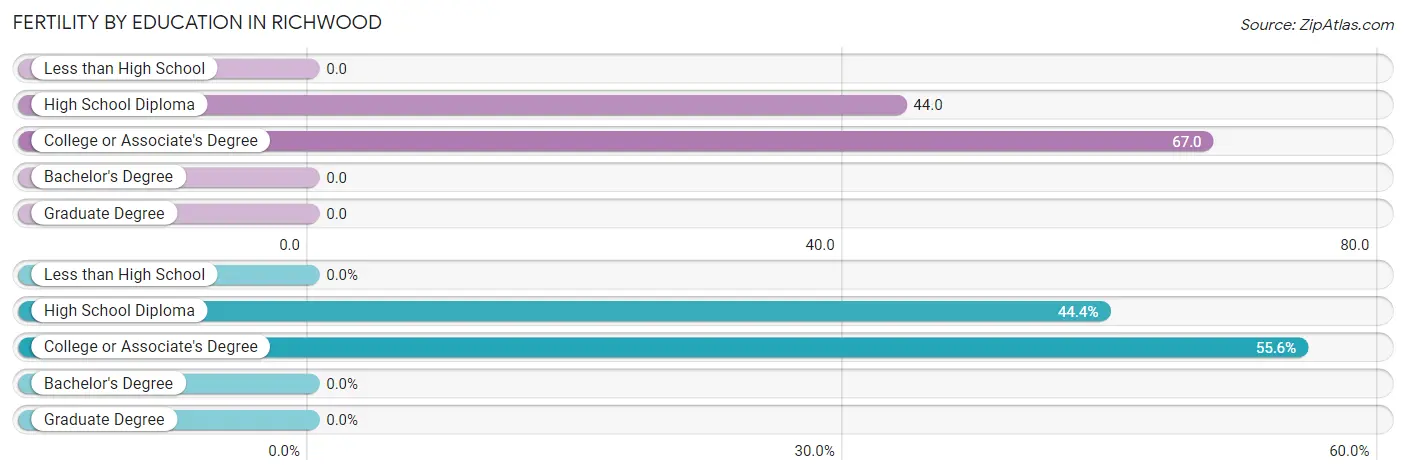
| Educational Attainment | Women with Births | Births / 1,000 Women |
| Less than High School | 0 (0.0%) | 0.0 |
| High School Diploma | 8 (44.4%) | 44.0 |
| College or Associate's Degree | 10 (55.6%) | 67.0 |
| Bachelor's Degree | 0 (0.0%) | 0.0 |
| Graduate Degree | 0 (0.0%) | 0.0 |
| Total | 18 (100.0%) | 37.0 |
Fertility by Education by Marriage Status in Richwood
44.4% of women with births in Richwood are unmarried. Women with the educational attainment of college or associate's degree are most likely to be married with 100.0% of them married at childbirth, while women with the educational attainment of high school diploma are least likely to be married with 100.0% of them unmarried at childbirth.
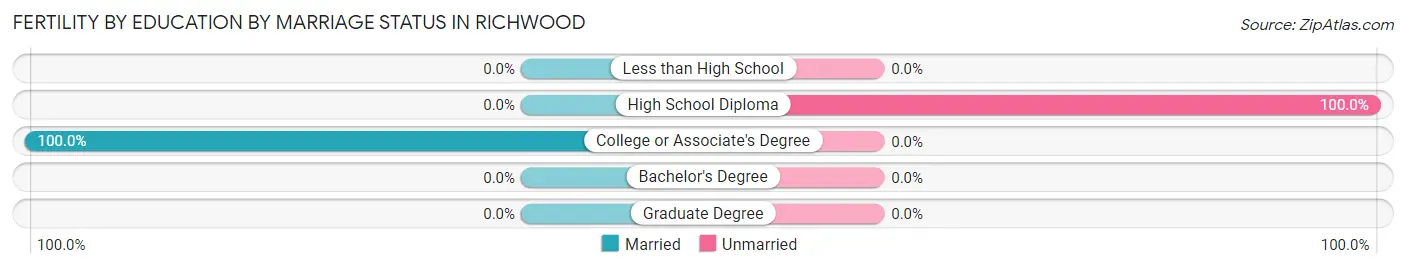
| Educational Attainment | Married | Unmarried |
| Less than High School | 0 (0.0%) | 0 (0.0%) |
| High School Diploma | 0 (0.0%) | 8 (100.0%) |
| College or Associate's Degree | 10 (100.0%) | 0 (0.0%) |
| Bachelor's Degree | 0 (0.0%) | 0 (0.0%) |
| Graduate Degree | 0 (0.0%) | 0 (0.0%) |
| Total | 10 (55.6%) | 8 (44.4%) |
Employment Characteristics in Richwood
Employment by Class of Employer in Richwood
Among the 1,074 employed individuals in Richwood, private company employees (787 | 73.3%), local government employees (80 | 7.4%), and self-employed (not incorporated) (75 | 7.0%) make up the most common classes of employment.
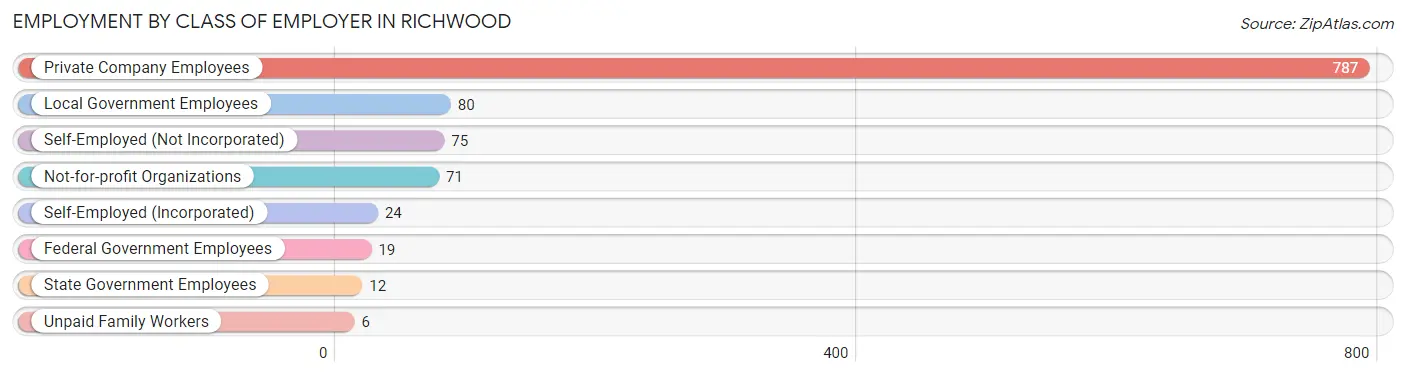
| Employer Class | # Employees | % Employees |
| Private Company Employees | 787 | 73.3% |
| Self-Employed (Incorporated) | 24 | 2.2% |
| Self-Employed (Not Incorporated) | 75 | 7.0% |
| Not-for-profit Organizations | 71 | 6.6% |
| Local Government Employees | 80 | 7.4% |
| State Government Employees | 12 | 1.1% |
| Federal Government Employees | 19 | 1.8% |
| Unpaid Family Workers | 6 | 0.6% |
| Total | 1,074 | 100.0% |
Employment Status by Age in Richwood
According to the labor force statistics for Richwood, out of the total population over 16 years of age (1,731), 66.1% or 1,144 individuals are in the labor force, with 4.0% or 46 of them unemployed. The age group with the highest labor force participation rate is 20 to 24 years, with 100.0% or 100 individuals in the labor force. Within the labor force, the 35 to 44 years age range has the highest percentage of unemployed individuals, with 10.4% or 22 of them being unemployed.
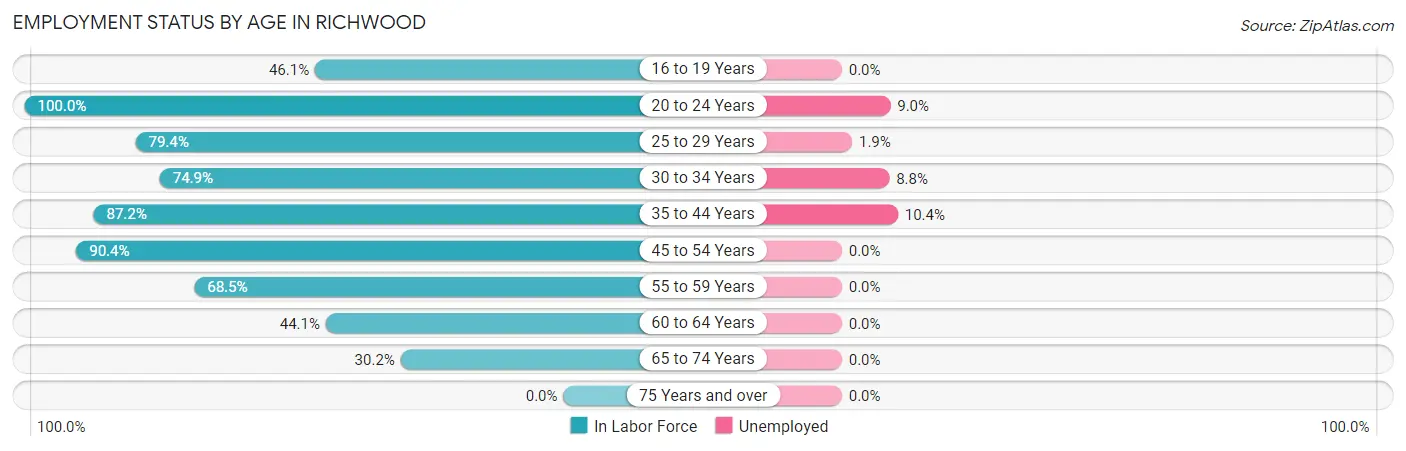
| Age Bracket | In Labor Force | Unemployed |
| 16 to 19 Years | 41 (46.1%) | 0 (0.0%) |
| 20 to 24 Years | 100 (100.0%) | 9 (9.0%) |
| 25 to 29 Years | 154 (79.4%) | 3 (1.9%) |
| 30 to 34 Years | 137 (74.9%) | 12 (8.8%) |
| 35 to 44 Years | 212 (87.2%) | 22 (10.4%) |
| 45 to 54 Years | 284 (90.4%) | 0 (0.0%) |
| 55 to 59 Years | 89 (68.5%) | 0 (0.0%) |
| 60 to 64 Years | 86 (44.1%) | 0 (0.0%) |
| 65 to 74 Years | 42 (30.2%) | 0 (0.0%) |
| 75 Years and over | 0 (0.0%) | 0 (0.0%) |
| Total | 1,144 (66.1%) | 46 (4.0%) |
Employment Status by Educational Attainment in Richwood
According to labor force statistics for Richwood, 76.4% of individuals (962) out of the total population between 25 and 64 years of age (1,259) are in the labor force, with 3.8% or 37 of them being unemployed. The group with the highest labor force participation rate are those with the educational attainment of bachelor's degree or higher, with 100.0% or 123 individuals in the labor force. Within the labor force, individuals with high school diploma education have the highest percentage of unemployment, with 7.8% or 37 of them being unemployed.
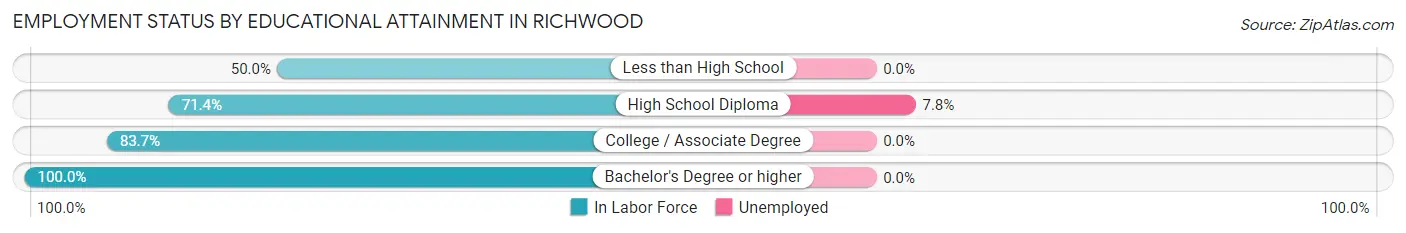
| Educational Attainment | In Labor Force | Unemployed |
| Less than High School | 44 (50.0%) | 0 (0.0%) |
| High School Diploma | 476 (71.4%) | 52 (7.8%) |
| College / Associate Degree | 319 (83.7%) | 0 (0.0%) |
| Bachelor's Degree or higher | 123 (100.0%) | 0 (0.0%) |
| Total | 962 (76.4%) | 48 (3.8%) |
Employment Occupations by Sex in Richwood
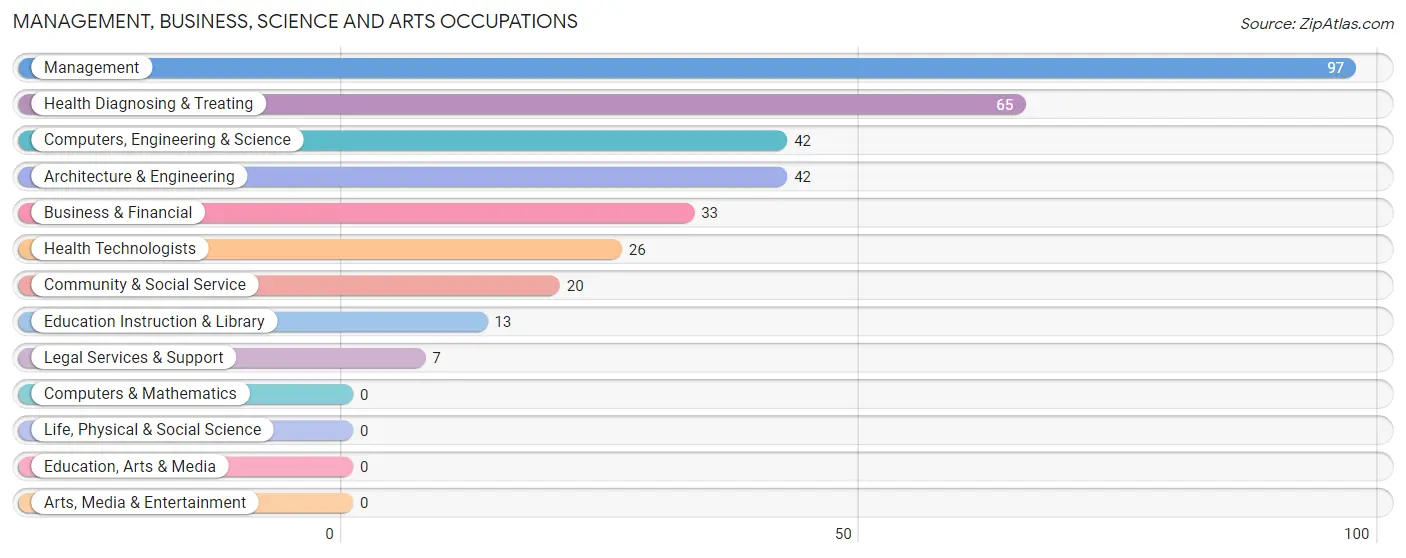
Management, Business, Science and Arts Occupations
The most common Management, Business, Science and Arts occupations in Richwood are Management (97 | 8.8%), Health Diagnosing & Treating (65 | 5.9%), Computers, Engineering & Science (42 | 3.8%), Architecture & Engineering (42 | 3.8%), and Business & Financial (33 | 3.0%).
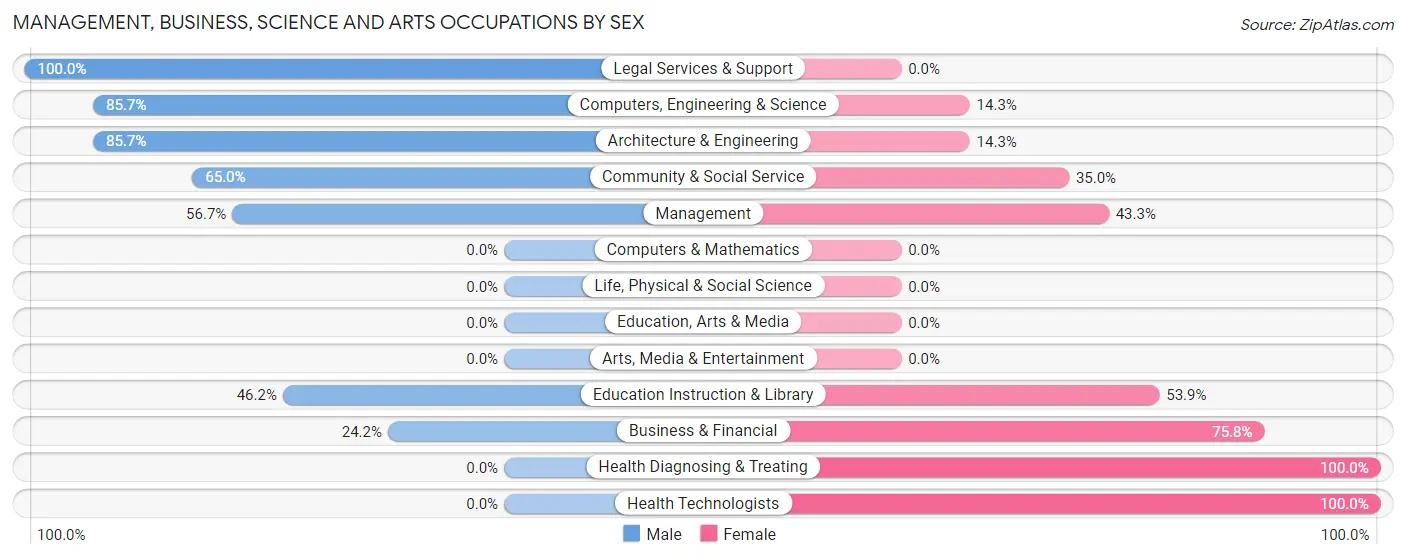
Management, Business, Science and Arts Occupations by Sex
Within the Management, Business, Science and Arts occupations in Richwood, the most male-oriented occupations are Legal Services & Support (100.0%), Computers, Engineering & Science (85.7%), and Architecture & Engineering (85.7%), while the most female-oriented occupations are Health Diagnosing & Treating (100.0%), Health Technologists (100.0%), and Business & Financial (75.8%).
| Occupation | Male | Female |
| Management | 55 (56.7%) | 42 (43.3%) |
| Business & Financial | 8 (24.2%) | 25 (75.8%) |
| Computers, Engineering & Science | 36 (85.7%) | 6 (14.3%) |
| Computers & Mathematics | 0 (0.0%) | 0 (0.0%) |
| Architecture & Engineering | 36 (85.7%) | 6 (14.3%) |
| Life, Physical & Social Science | 0 (0.0%) | 0 (0.0%) |
| Community & Social Service | 13 (65.0%) | 7 (35.0%) |
| Education, Arts & Media | 0 (0.0%) | 0 (0.0%) |
| Legal Services & Support | 7 (100.0%) | 0 (0.0%) |
| Education Instruction & Library | 6 (46.2%) | 7 (53.8%) |
| Arts, Media & Entertainment | 0 (0.0%) | 0 (0.0%) |
| Health Diagnosing & Treating | 0 (0.0%) | 65 (100.0%) |
| Health Technologists | 0 (0.0%) | 26 (100.0%) |
| Total (Category) | 112 (43.6%) | 145 (56.4%) |
| Total (Overall) | 614 (55.9%) | 485 (44.1%) |
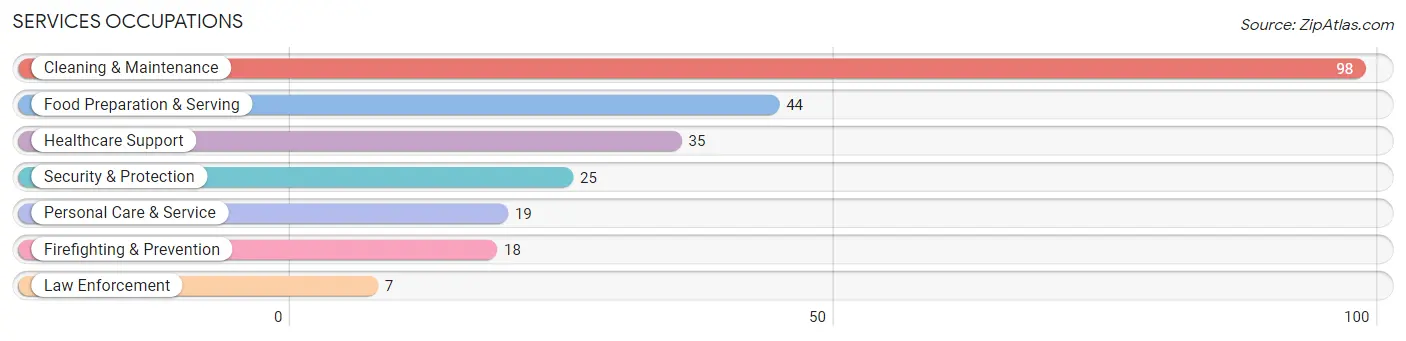
Services Occupations
The most common Services occupations in Richwood are Cleaning & Maintenance (98 | 8.9%), Food Preparation & Serving (44 | 4.0%), Healthcare Support (35 | 3.2%), Security & Protection (25 | 2.3%), and Personal Care & Service (19 | 1.7%).
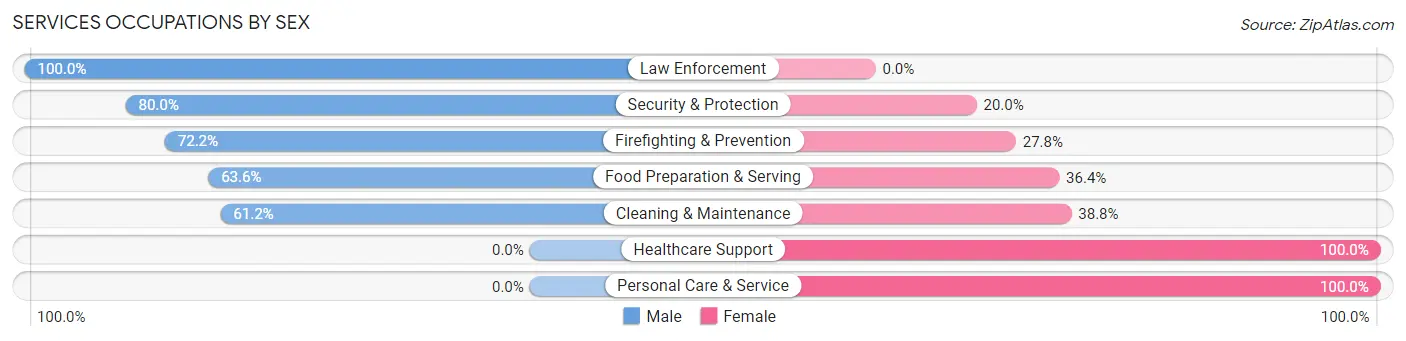
Services Occupations by Sex
Within the Services occupations in Richwood, the most male-oriented occupations are Law Enforcement (100.0%), Security & Protection (80.0%), and Firefighting & Prevention (72.2%), while the most female-oriented occupations are Healthcare Support (100.0%), Personal Care & Service (100.0%), and Cleaning & Maintenance (38.8%).
| Occupation | Male | Female |
| Healthcare Support | 0 (0.0%) | 35 (100.0%) |
| Security & Protection | 20 (80.0%) | 5 (20.0%) |
| Firefighting & Prevention | 13 (72.2%) | 5 (27.8%) |
| Law Enforcement | 7 (100.0%) | 0 (0.0%) |
| Food Preparation & Serving | 28 (63.6%) | 16 (36.4%) |
| Cleaning & Maintenance | 60 (61.2%) | 38 (38.8%) |
| Personal Care & Service | 0 (0.0%) | 19 (100.0%) |
| Total (Category) | 108 (48.9%) | 113 (51.1%) |
| Total (Overall) | 614 (55.9%) | 485 (44.1%) |
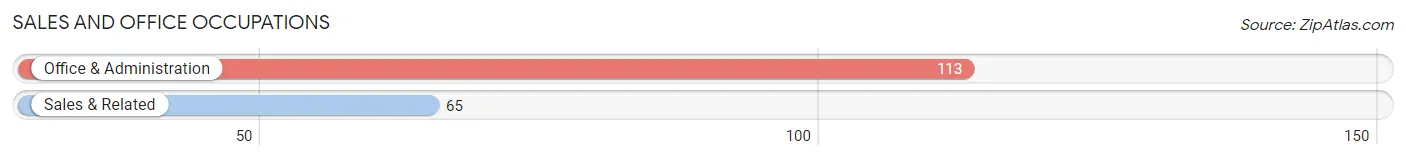
Sales and Office Occupations
The most common Sales and Office occupations in Richwood are Office & Administration (113 | 10.3%), and Sales & Related (65 | 5.9%).
Sales and Office Occupations by Sex
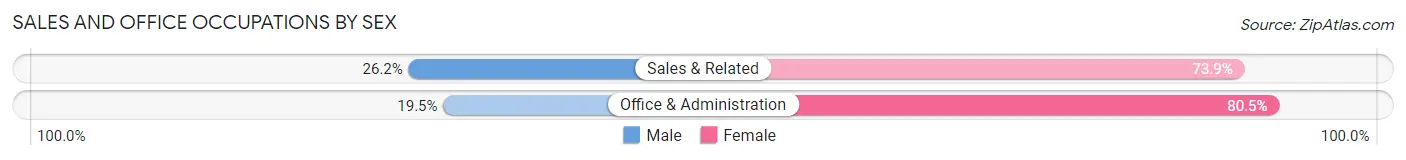
| Occupation | Male | Female |
| Sales & Related | 17 (26.2%) | 48 (73.9%) |
| Office & Administration | 22 (19.5%) | 91 (80.5%) |
| Total (Category) | 39 (21.9%) | 139 (78.1%) |
| Total (Overall) | 614 (55.9%) | 485 (44.1%) |
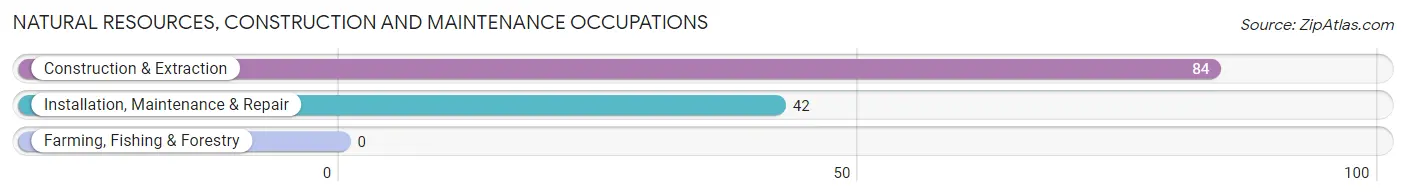
Natural Resources, Construction and Maintenance Occupations
The most common Natural Resources, Construction and Maintenance occupations in Richwood are Construction & Extraction (84 | 7.6%), and Installation, Maintenance & Repair (42 | 3.8%).
Natural Resources, Construction and Maintenance Occupations by Sex
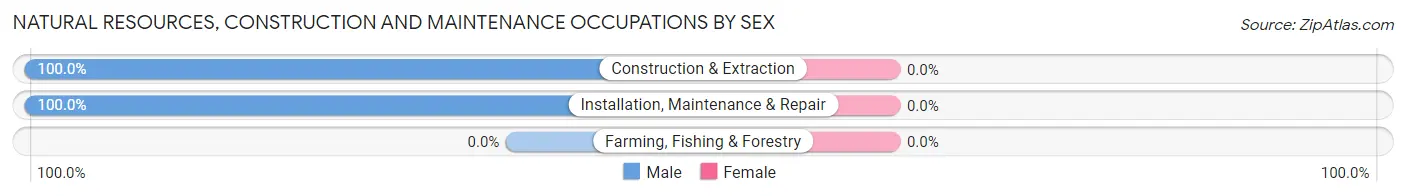
| Occupation | Male | Female |
| Farming, Fishing & Forestry | 0 (0.0%) | 0 (0.0%) |
| Construction & Extraction | 84 (100.0%) | 0 (0.0%) |
| Installation, Maintenance & Repair | 42 (100.0%) | 0 (0.0%) |
| Total (Category) | 126 (100.0%) | 0 (0.0%) |
| Total (Overall) | 614 (55.9%) | 485 (44.1%) |
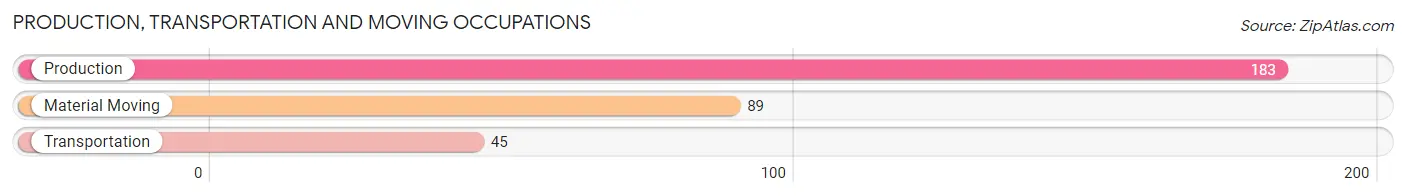
Production, Transportation and Moving Occupations
The most common Production, Transportation and Moving occupations in Richwood are Production (183 | 16.7%), Material Moving (89 | 8.1%), and Transportation (45 | 4.1%).
Production, Transportation and Moving Occupations by Sex
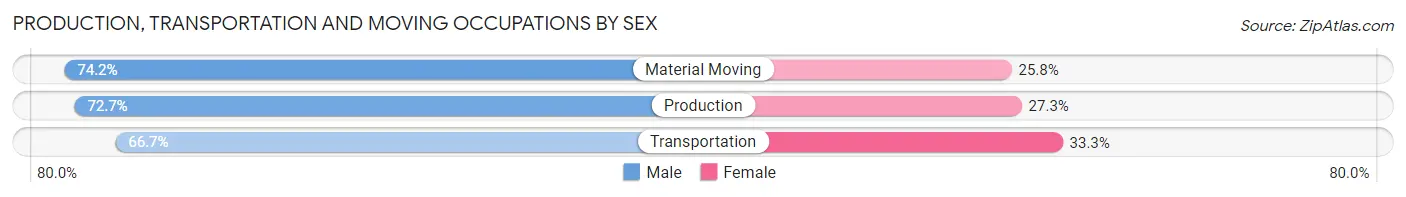
| Occupation | Male | Female |
| Production | 133 (72.7%) | 50 (27.3%) |
| Transportation | 30 (66.7%) | 15 (33.3%) |
| Material Moving | 66 (74.2%) | 23 (25.8%) |
| Total (Category) | 229 (72.2%) | 88 (27.8%) |
| Total (Overall) | 614 (55.9%) | 485 (44.1%) |
Employment Industries by Sex in Richwood
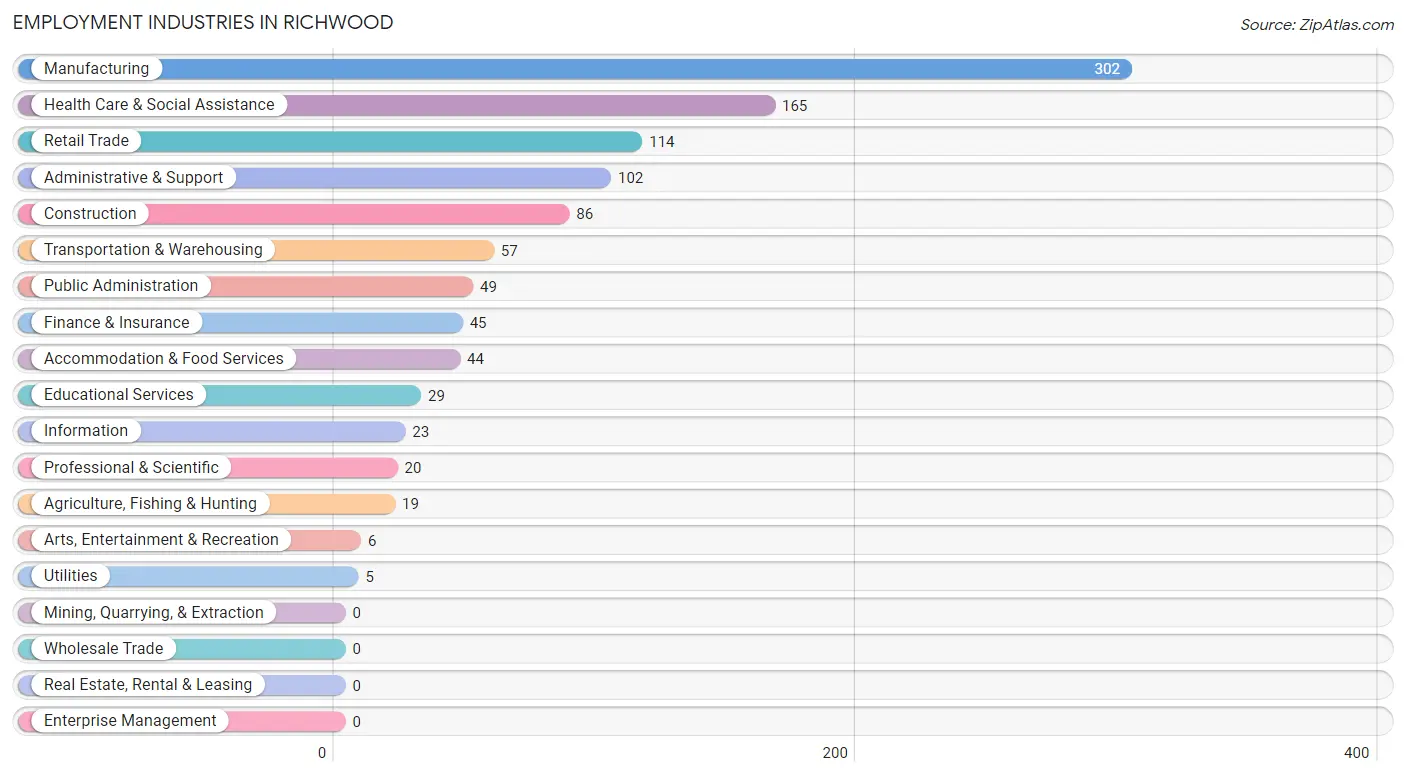
Employment Industries in Richwood
The major employment industries in Richwood include Manufacturing (302 | 27.5%), Health Care & Social Assistance (165 | 15.0%), Retail Trade (114 | 10.4%), Administrative & Support (102 | 9.3%), and Construction (86 | 7.8%).
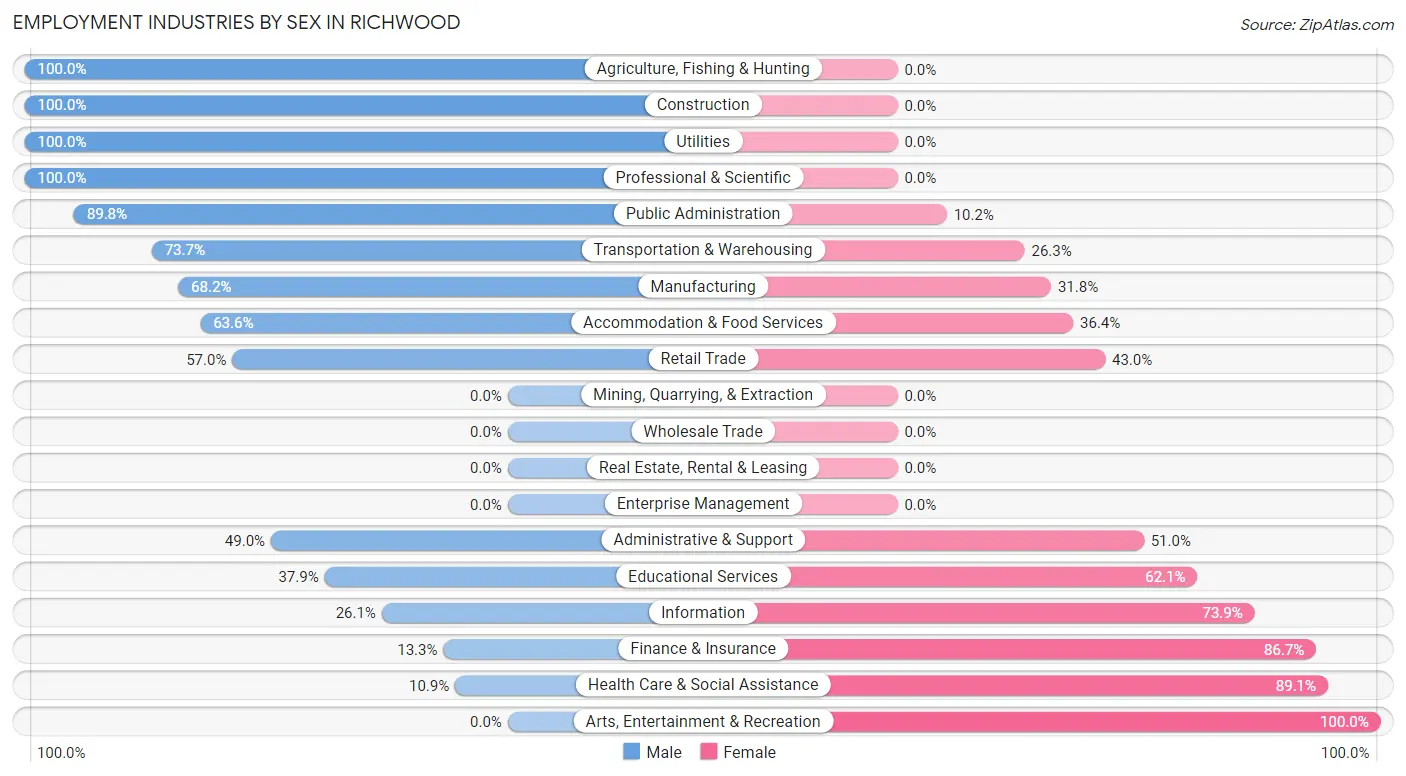
Employment Industries by Sex in Richwood
The Richwood industries that see more men than women are Agriculture, Fishing & Hunting (100.0%), Construction (100.0%), and Utilities (100.0%), whereas the industries that tend to have a higher number of women are Arts, Entertainment & Recreation (100.0%), Health Care & Social Assistance (89.1%), and Finance & Insurance (86.7%).
| Industry | Male | Female |
| Agriculture, Fishing & Hunting | 19 (100.0%) | 0 (0.0%) |
| Mining, Quarrying, & Extraction | 0 (0.0%) | 0 (0.0%) |
| Construction | 86 (100.0%) | 0 (0.0%) |
| Manufacturing | 206 (68.2%) | 96 (31.8%) |
| Wholesale Trade | 0 (0.0%) | 0 (0.0%) |
| Retail Trade | 65 (57.0%) | 49 (43.0%) |
| Transportation & Warehousing | 42 (73.7%) | 15 (26.3%) |
| Utilities | 5 (100.0%) | 0 (0.0%) |
| Information | 6 (26.1%) | 17 (73.9%) |
| Finance & Insurance | 6 (13.3%) | 39 (86.7%) |
| Real Estate, Rental & Leasing | 0 (0.0%) | 0 (0.0%) |
| Professional & Scientific | 20 (100.0%) | 0 (0.0%) |
| Enterprise Management | 0 (0.0%) | 0 (0.0%) |
| Administrative & Support | 50 (49.0%) | 52 (51.0%) |
| Educational Services | 11 (37.9%) | 18 (62.1%) |
| Health Care & Social Assistance | 18 (10.9%) | 147 (89.1%) |
| Arts, Entertainment & Recreation | 0 (0.0%) | 6 (100.0%) |
| Accommodation & Food Services | 28 (63.6%) | 16 (36.4%) |
| Public Administration | 44 (89.8%) | 5 (10.2%) |
| Total | 614 (55.9%) | 485 (44.1%) |
Education in Richwood
School Enrollment in Richwood
The most common levels of schooling among the 465 students in Richwood are middle school (147 | 31.6%), high school (132 | 28.4%), and elementary school (109 | 23.4%).
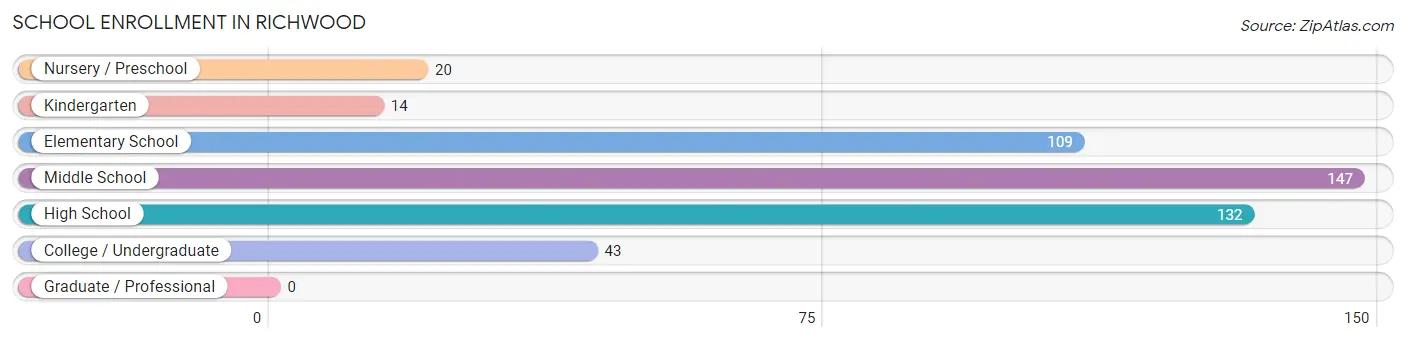
| School Level | # Students | % Students |
| Nursery / Preschool | 20 | 4.3% |
| Kindergarten | 14 | 3.0% |
| Elementary School | 109 | 23.4% |
| Middle School | 147 | 31.6% |
| High School | 132 | 28.4% |
| College / Undergraduate | 43 | 9.2% |
| Graduate / Professional | 0 | 0.0% |
| Total | 465 | 100.0% |
School Enrollment by Age by Funding Source in Richwood
Out of a total of 465 students who are enrolled in schools in Richwood, 4 (0.9%) attend a private institution, while the remaining 461 (99.1%) are enrolled in public schools. The age group of 5 to 9 year old has the highest likelihood of being enrolled in private schools, with 4 (4.0% in the age bracket) enrolled. Conversely, the age group of 3 to 4 year olds has the lowest likelihood of being enrolled in a private school, with 16 (100.0% in the age bracket) attending a public institution.
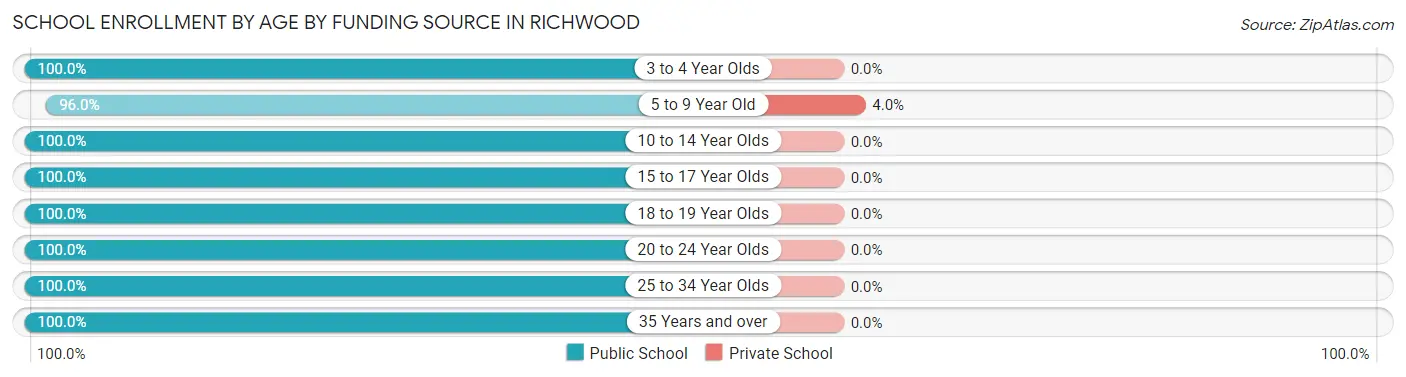
| Age Bracket | Public School | Private School |
| 3 to 4 Year Olds | 16 (100.0%) | 0 (0.0%) |
| 5 to 9 Year Old | 95 (96.0%) | 4 (4.0%) |
| 10 to 14 Year Olds | 200 (100.0%) | 0 (0.0%) |
| 15 to 17 Year Olds | 102 (100.0%) | 0 (0.0%) |
| 18 to 19 Year Olds | 5 (100.0%) | 0 (0.0%) |
| 20 to 24 Year Olds | 21 (100.0%) | 0 (0.0%) |
| 25 to 34 Year Olds | 17 (100.0%) | 0 (0.0%) |
| 35 Years and over | 5 (100.0%) | 0 (0.0%) |
| Total | 461 (99.1%) | 4 (0.9%) |
Educational Attainment by Field of Study in Richwood
Business (62 | 40.3%), education (43 | 27.9%), physical & health sciences (23 | 14.9%), communications (9 | 5.8%), and literature & languages (6 | 3.9%) are the most common fields of study among 154 individuals in Richwood who have obtained a bachelor's degree or higher.
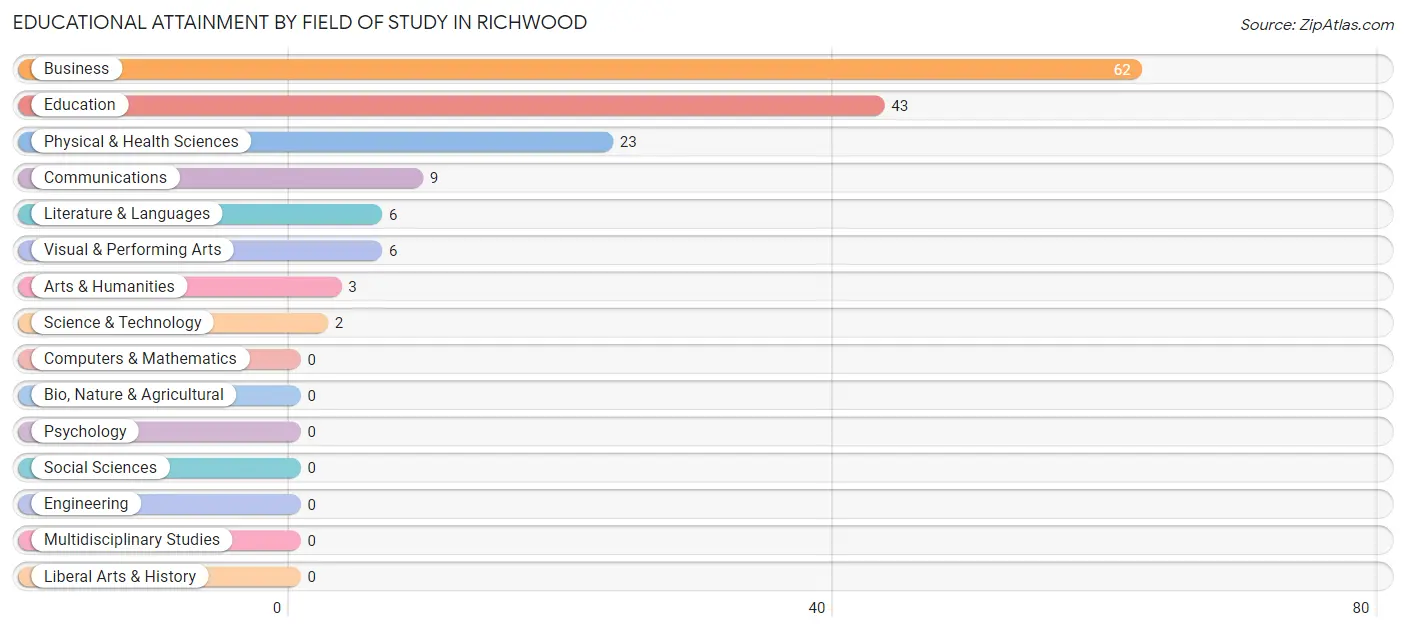
| Field of Study | # Graduates | % Graduates |
| Computers & Mathematics | 0 | 0.0% |
| Bio, Nature & Agricultural | 0 | 0.0% |
| Physical & Health Sciences | 23 | 14.9% |
| Psychology | 0 | 0.0% |
| Social Sciences | 0 | 0.0% |
| Engineering | 0 | 0.0% |
| Multidisciplinary Studies | 0 | 0.0% |
| Science & Technology | 2 | 1.3% |
| Business | 62 | 40.3% |
| Education | 43 | 27.9% |
| Literature & Languages | 6 | 3.9% |
| Liberal Arts & History | 0 | 0.0% |
| Visual & Performing Arts | 6 | 3.9% |
| Communications | 9 | 5.8% |
| Arts & Humanities | 3 | 1.9% |
| Total | 154 | 100.0% |
Transportation & Commute in Richwood
Vehicle Availability by Sex in Richwood
The most prevalent vehicle ownership categories in Richwood are males with 2 vehicles (228, accounting for 38.4%) and females with 2 vehicles (116, making up 47.5%).
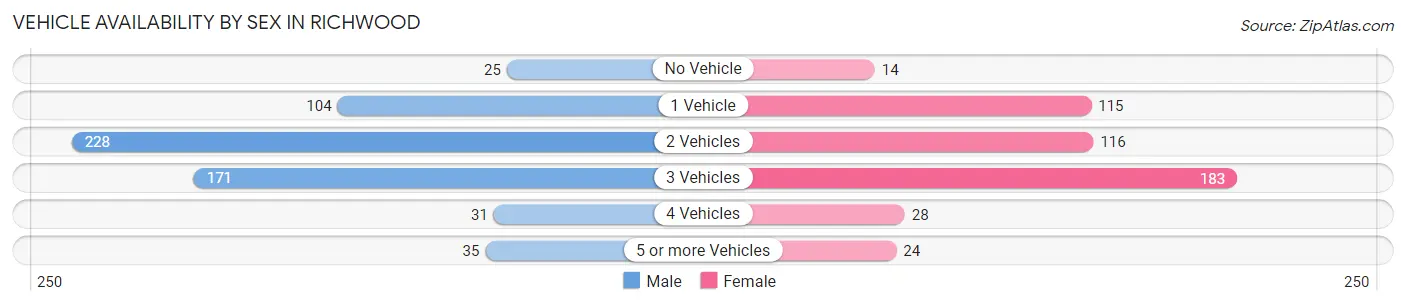
| Vehicles Available | Male | Female |
| No Vehicle | 25 (4.2%) | 14 (2.9%) |
| 1 Vehicle | 104 (17.5%) | 115 (24.0%) |
| 2 Vehicles | 228 (38.4%) | 116 (24.2%) |
| 3 Vehicles | 171 (28.8%) | 183 (38.1%) |
| 4 Vehicles | 31 (5.2%) | 28 (5.8%) |
| 5 or more Vehicles | 35 (5.9%) | 24 (5.0%) |
| Total | 594 (100.0%) | 480 (100.0%) |
Commute Time in Richwood
The most frequently occuring commute durations in Richwood are 30 to 34 minutes (258 commuters, 24.8%), 20 to 24 minutes (156 commuters, 15.0%), and 25 to 29 minutes (144 commuters, 13.9%).
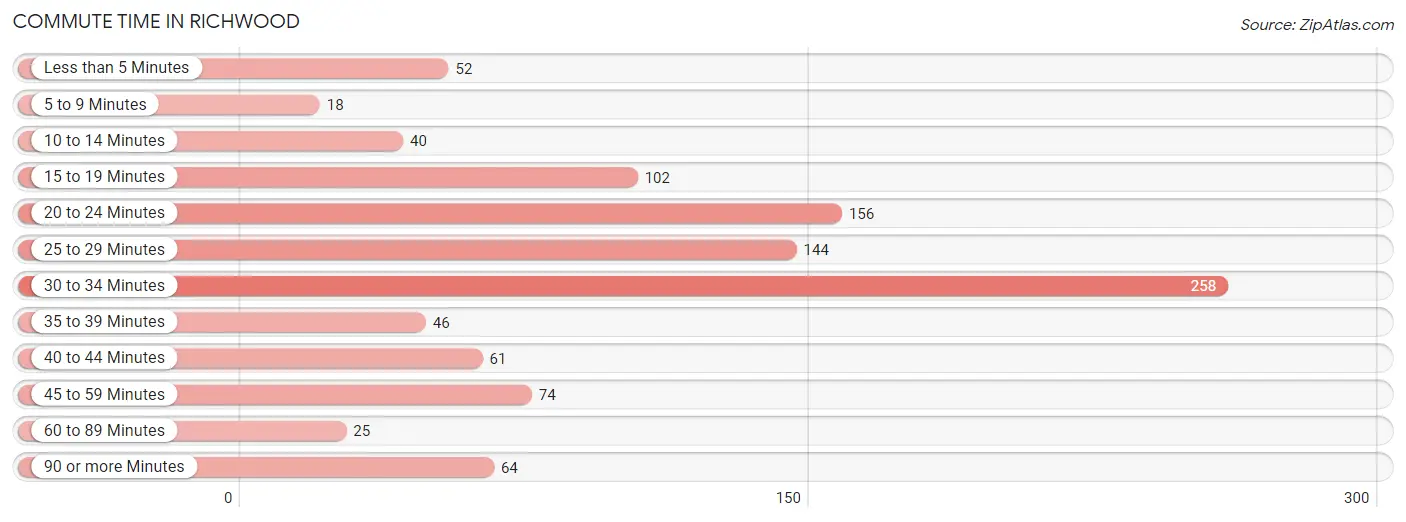
| Commute Time | # Commuters | % Commuters |
| Less than 5 Minutes | 52 | 5.0% |
| 5 to 9 Minutes | 18 | 1.7% |
| 10 to 14 Minutes | 40 | 3.8% |
| 15 to 19 Minutes | 102 | 9.8% |
| 20 to 24 Minutes | 156 | 15.0% |
| 25 to 29 Minutes | 144 | 13.9% |
| 30 to 34 Minutes | 258 | 24.8% |
| 35 to 39 Minutes | 46 | 4.4% |
| 40 to 44 Minutes | 61 | 5.9% |
| 45 to 59 Minutes | 74 | 7.1% |
| 60 to 89 Minutes | 25 | 2.4% |
| 90 or more Minutes | 64 | 6.1% |
Commute Time by Sex in Richwood
The most common commute times in Richwood are 30 to 34 minutes (117 commuters, 19.9%) for males and 30 to 34 minutes (141 commuters, 31.2%) for females.
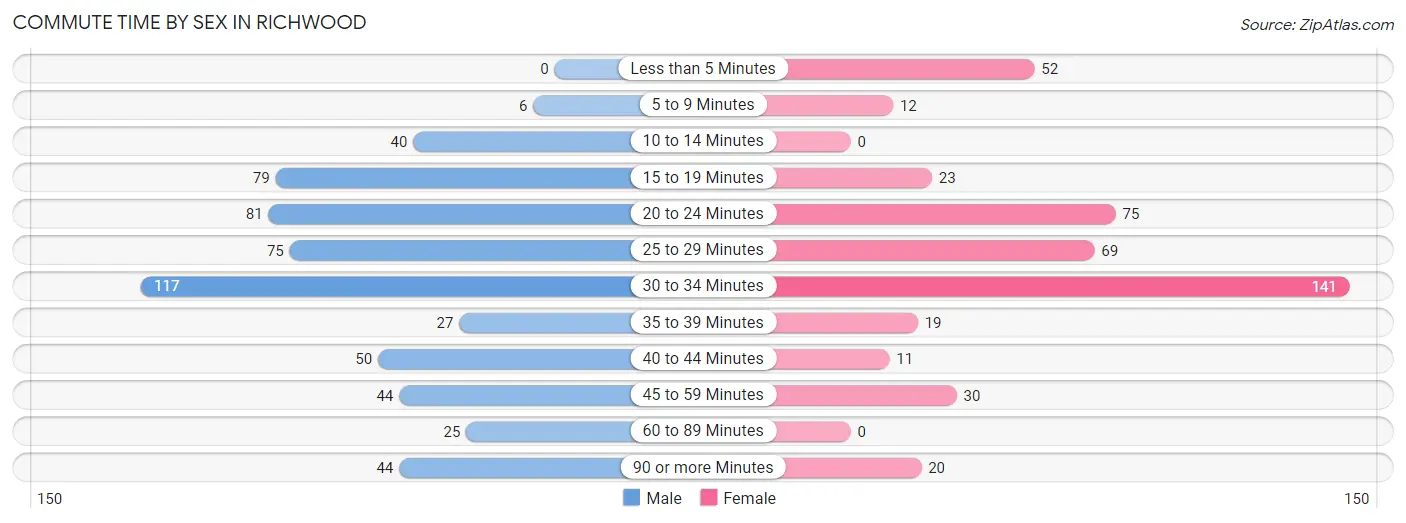
| Commute Time | Male | Female |
| Less than 5 Minutes | 0 (0.0%) | 52 (11.5%) |
| 5 to 9 Minutes | 6 (1.0%) | 12 (2.6%) |
| 10 to 14 Minutes | 40 (6.8%) | 0 (0.0%) |
| 15 to 19 Minutes | 79 (13.4%) | 23 (5.1%) |
| 20 to 24 Minutes | 81 (13.8%) | 75 (16.6%) |
| 25 to 29 Minutes | 75 (12.8%) | 69 (15.3%) |
| 30 to 34 Minutes | 117 (19.9%) | 141 (31.2%) |
| 35 to 39 Minutes | 27 (4.6%) | 19 (4.2%) |
| 40 to 44 Minutes | 50 (8.5%) | 11 (2.4%) |
| 45 to 59 Minutes | 44 (7.5%) | 30 (6.6%) |
| 60 to 89 Minutes | 25 (4.3%) | 0 (0.0%) |
| 90 or more Minutes | 44 (7.5%) | 20 (4.4%) |
Time of Departure to Work by Sex in Richwood
The most frequent times of departure to work in Richwood are 5:00 AM to 5:29 AM (90, 15.3%) for males and 8:00 AM to 8:29 AM (60, 13.3%) for females.
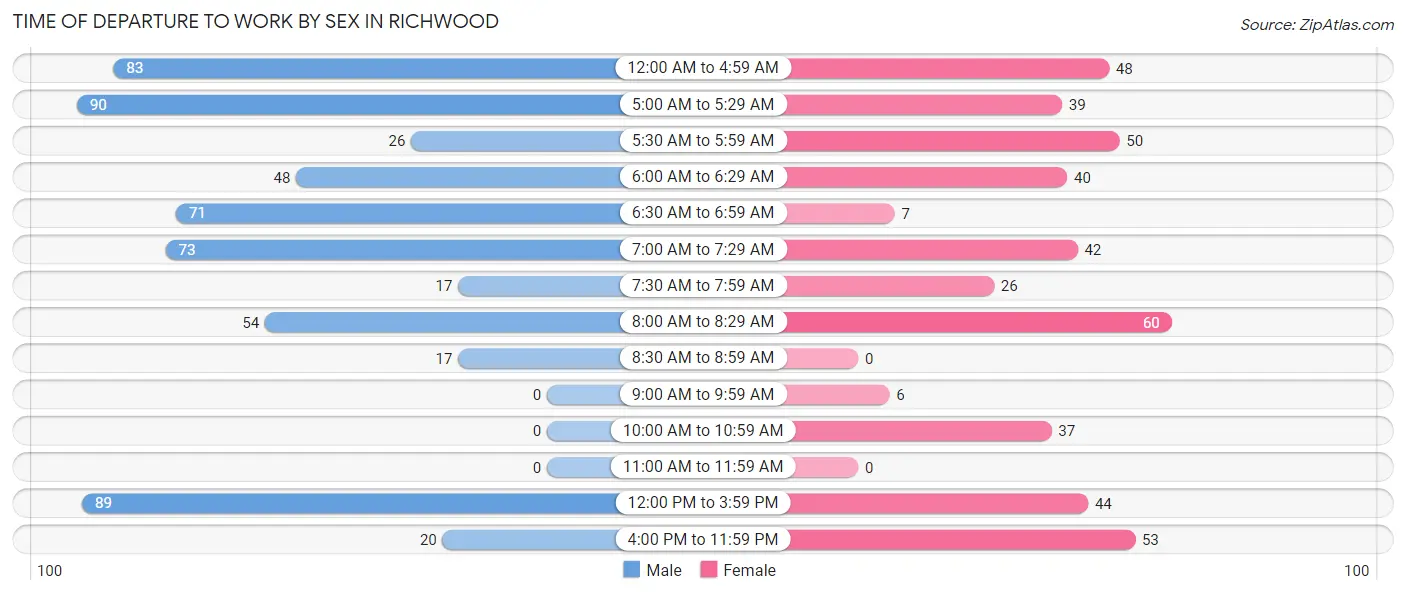
| Time of Departure | Male | Female |
| 12:00 AM to 4:59 AM | 83 (14.1%) | 48 (10.6%) |
| 5:00 AM to 5:29 AM | 90 (15.3%) | 39 (8.6%) |
| 5:30 AM to 5:59 AM | 26 (4.4%) | 50 (11.1%) |
| 6:00 AM to 6:29 AM | 48 (8.2%) | 40 (8.8%) |
| 6:30 AM to 6:59 AM | 71 (12.1%) | 7 (1.5%) |
| 7:00 AM to 7:29 AM | 73 (12.4%) | 42 (9.3%) |
| 7:30 AM to 7:59 AM | 17 (2.9%) | 26 (5.8%) |
| 8:00 AM to 8:29 AM | 54 (9.2%) | 60 (13.3%) |
| 8:30 AM to 8:59 AM | 17 (2.9%) | 0 (0.0%) |
| 9:00 AM to 9:59 AM | 0 (0.0%) | 6 (1.3%) |
| 10:00 AM to 10:59 AM | 0 (0.0%) | 37 (8.2%) |
| 11:00 AM to 11:59 AM | 0 (0.0%) | 0 (0.0%) |
| 12:00 PM to 3:59 PM | 89 (15.1%) | 44 (9.7%) |
| 4:00 PM to 11:59 PM | 20 (3.4%) | 53 (11.7%) |
| Total | 588 (100.0%) | 452 (100.0%) |
Housing Occupancy in Richwood
Occupancy by Ownership in Richwood
Of the total 931 dwellings in Richwood, owner-occupied units account for 645 (69.3%), while renter-occupied units make up 286 (30.7%).
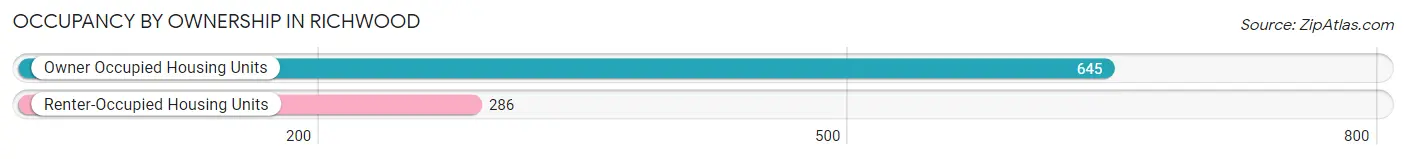
| Occupancy | # Housing Units | % Housing Units |
| Owner Occupied Housing Units | 645 | 69.3% |
| Renter-Occupied Housing Units | 286 | 30.7% |
| Total Occupied Housing Units | 931 | 100.0% |
Occupancy by Household Size in Richwood
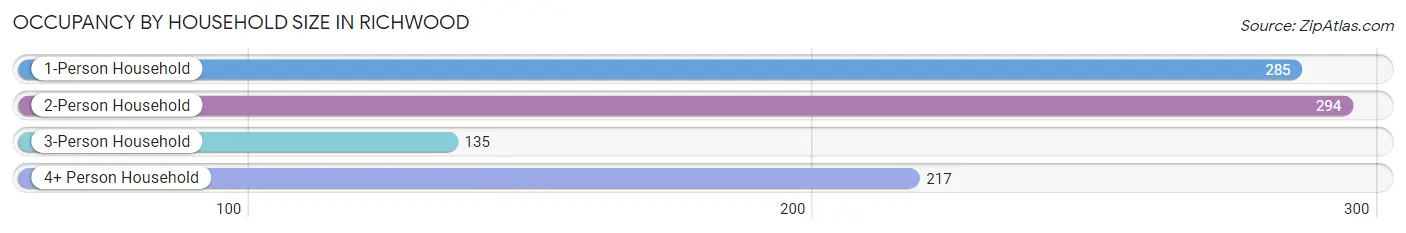
| Household Size | # Housing Units | % Housing Units |
| 1-Person Household | 285 | 30.6% |
| 2-Person Household | 294 | 31.6% |
| 3-Person Household | 135 | 14.5% |
| 4+ Person Household | 217 | 23.3% |
| Total Housing Units | 931 | 100.0% |
Occupancy by Ownership by Household Size in Richwood
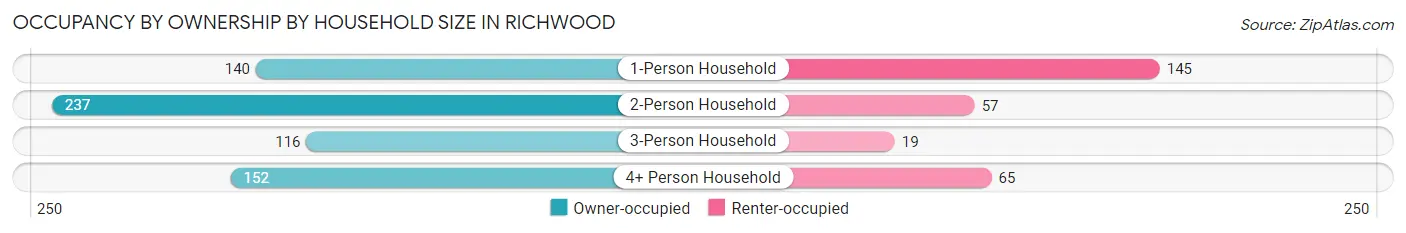
| Household Size | Owner-occupied | Renter-occupied |
| 1-Person Household | 140 (49.1%) | 145 (50.9%) |
| 2-Person Household | 237 (80.6%) | 57 (19.4%) |
| 3-Person Household | 116 (85.9%) | 19 (14.1%) |
| 4+ Person Household | 152 (70.1%) | 65 (29.9%) |
| Total Housing Units | 645 (69.3%) | 286 (30.7%) |
Occupancy by Educational Attainment in Richwood
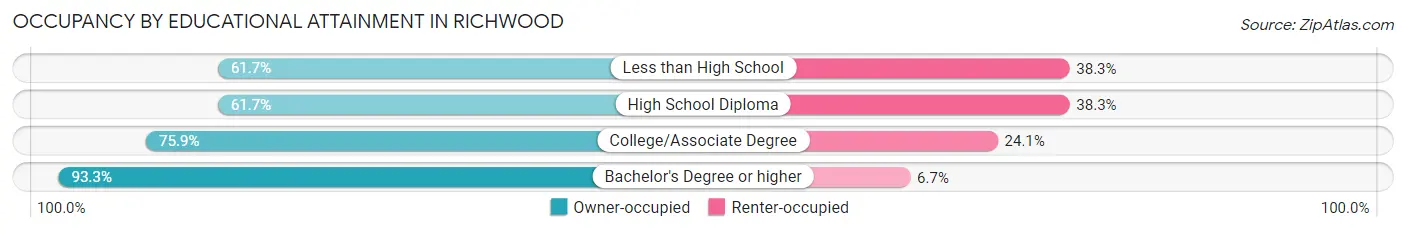
| Household Size | Owner-occupied | Renter-occupied |
| Less than High School | 29 (61.7%) | 18 (38.3%) |
| High School Diploma | 306 (61.7%) | 190 (38.3%) |
| College/Associate Degree | 227 (75.9%) | 72 (24.1%) |
| Bachelor's Degree or higher | 83 (93.3%) | 6 (6.7%) |
Occupancy by Age of Householder in Richwood
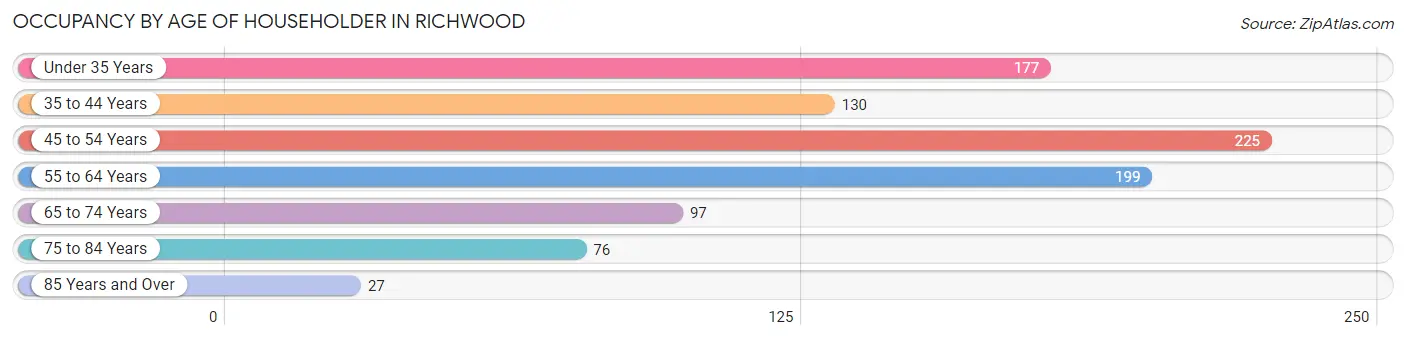
| Age Bracket | # Households | % Households |
| Under 35 Years | 177 | 19.0% |
| 35 to 44 Years | 130 | 14.0% |
| 45 to 54 Years | 225 | 24.2% |
| 55 to 64 Years | 199 | 21.4% |
| 65 to 74 Years | 97 | 10.4% |
| 75 to 84 Years | 76 | 8.2% |
| 85 Years and Over | 27 | 2.9% |
| Total | 931 | 100.0% |
Housing Finances in Richwood
Median Income by Occupancy in Richwood
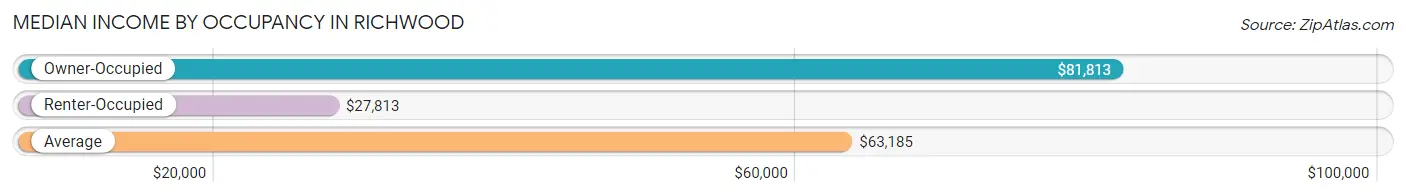
| Occupancy Type | # Households | Median Income |
| Owner-Occupied | 645 (69.3%) | $81,813 |
| Renter-Occupied | 286 (30.7%) | $27,813 |
| Average | 931 (100.0%) | $63,185 |
Occupancy by Householder Income Bracket in Richwood
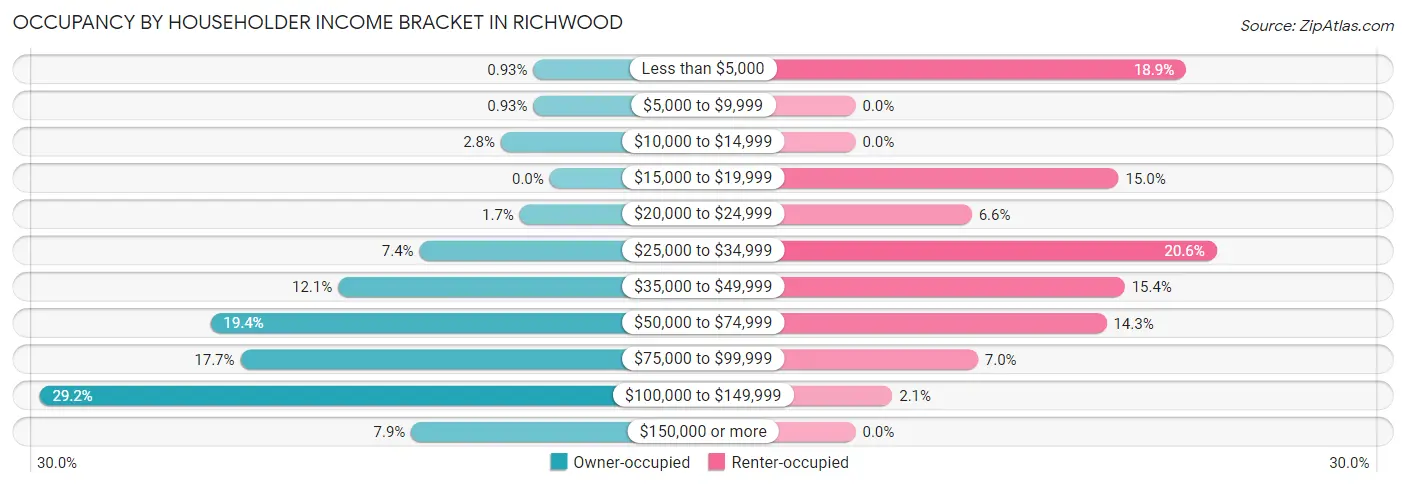
| Income Bracket | Owner-occupied | Renter-occupied |
| Less than $5,000 | 6 (0.9%) | 54 (18.9%) |
| $5,000 to $9,999 | 6 (0.9%) | 0 (0.0%) |
| $10,000 to $14,999 | 18 (2.8%) | 0 (0.0%) |
| $15,000 to $19,999 | 0 (0.0%) | 43 (15.0%) |
| $20,000 to $24,999 | 11 (1.7%) | 19 (6.6%) |
| $25,000 to $34,999 | 48 (7.4%) | 59 (20.6%) |
| $35,000 to $49,999 | 78 (12.1%) | 44 (15.4%) |
| $50,000 to $74,999 | 125 (19.4%) | 41 (14.3%) |
| $75,000 to $99,999 | 114 (17.7%) | 20 (7.0%) |
| $100,000 to $149,999 | 188 (29.1%) | 6 (2.1%) |
| $150,000 or more | 51 (7.9%) | 0 (0.0%) |
| Total | 645 (100.0%) | 286 (100.0%) |
Monthly Housing Cost Tiers in Richwood
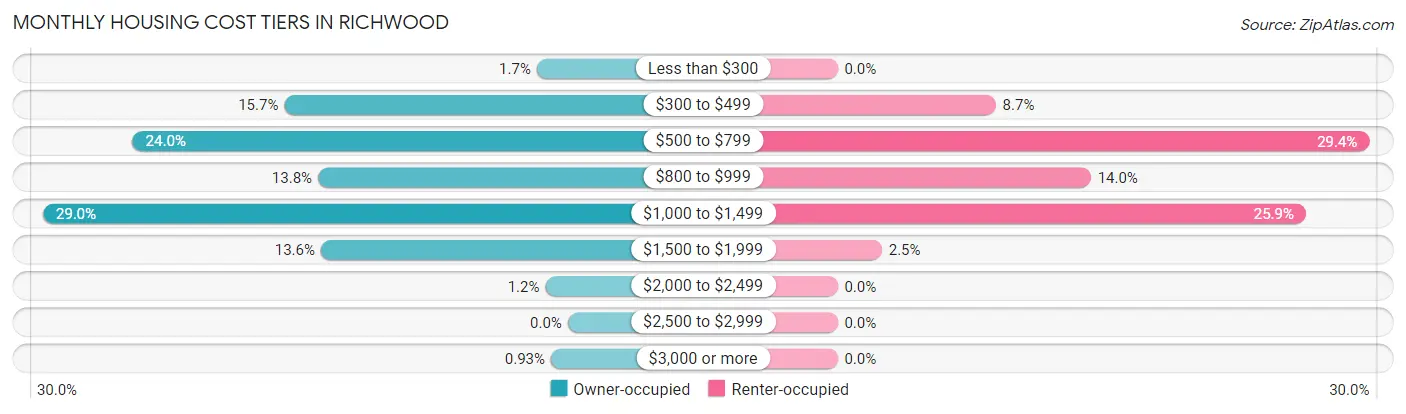
| Monthly Cost | Owner-occupied | Renter-occupied |
| Less than $300 | 11 (1.7%) | 0 (0.0%) |
| $300 to $499 | 101 (15.7%) | 25 (8.7%) |
| $500 to $799 | 155 (24.0%) | 84 (29.4%) |
| $800 to $999 | 89 (13.8%) | 40 (14.0%) |
| $1,000 to $1,499 | 187 (29.0%) | 74 (25.9%) |
| $1,500 to $1,999 | 88 (13.6%) | 7 (2.5%) |
| $2,000 to $2,499 | 8 (1.2%) | 0 (0.0%) |
| $2,500 to $2,999 | 0 (0.0%) | 0 (0.0%) |
| $3,000 or more | 6 (0.9%) | 0 (0.0%) |
| Total | 645 (100.0%) | 286 (100.0%) |
Physical Housing Characteristics in Richwood
Housing Structures in Richwood
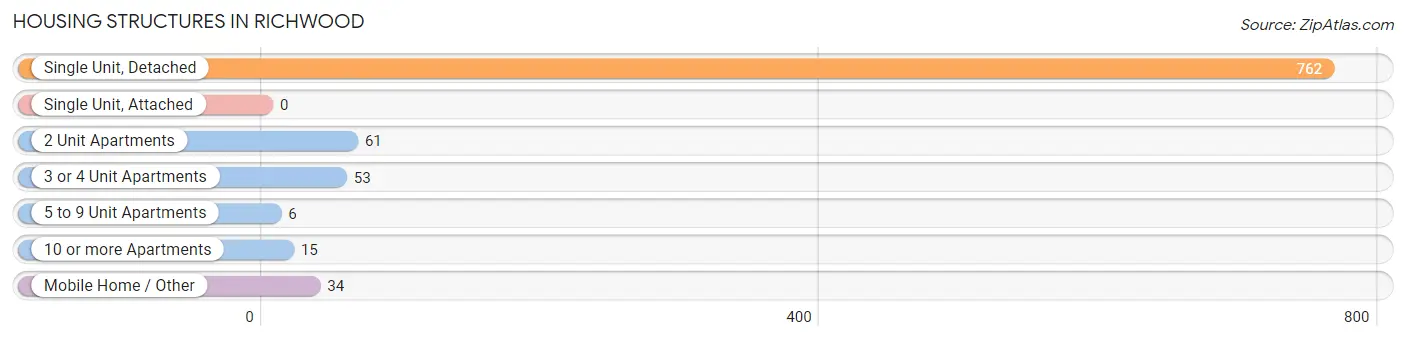
| Structure Type | # Housing Units | % Housing Units |
| Single Unit, Detached | 762 | 81.9% |
| Single Unit, Attached | 0 | 0.0% |
| 2 Unit Apartments | 61 | 6.6% |
| 3 or 4 Unit Apartments | 53 | 5.7% |
| 5 to 9 Unit Apartments | 6 | 0.6% |
| 10 or more Apartments | 15 | 1.6% |
| Mobile Home / Other | 34 | 3.6% |
| Total | 931 | 100.0% |
Housing Structures by Occupancy in Richwood
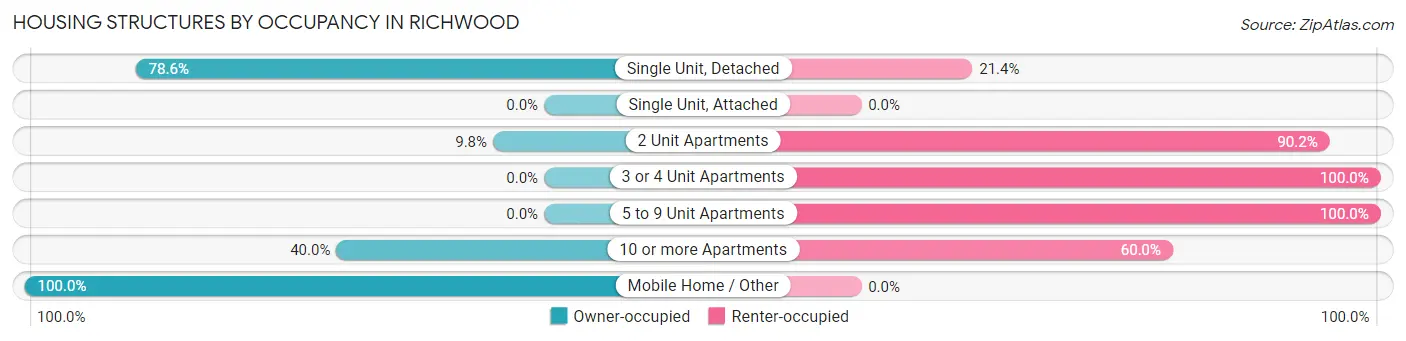
| Structure Type | Owner-occupied | Renter-occupied |
| Single Unit, Detached | 599 (78.6%) | 163 (21.4%) |
| Single Unit, Attached | 0 (0.0%) | 0 (0.0%) |
| 2 Unit Apartments | 6 (9.8%) | 55 (90.2%) |
| 3 or 4 Unit Apartments | 0 (0.0%) | 53 (100.0%) |
| 5 to 9 Unit Apartments | 0 (0.0%) | 6 (100.0%) |
| 10 or more Apartments | 6 (40.0%) | 9 (60.0%) |
| Mobile Home / Other | 34 (100.0%) | 0 (0.0%) |
| Total | 645 (69.3%) | 286 (30.7%) |
Housing Structures by Number of Rooms in Richwood
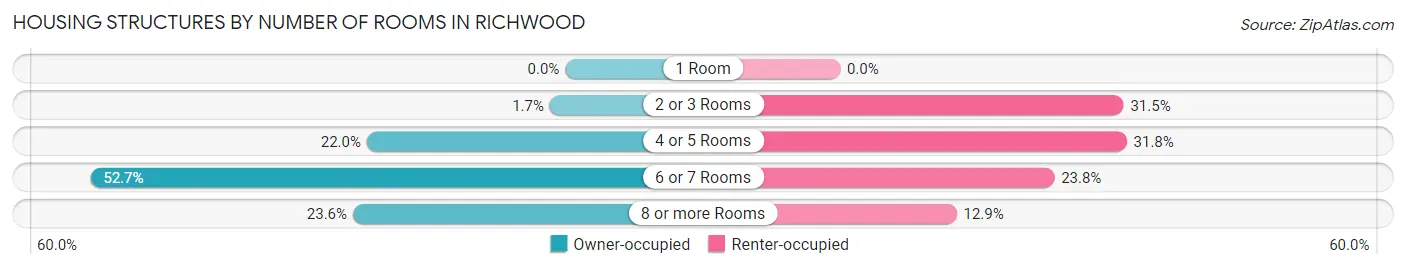
| Number of Rooms | Owner-occupied | Renter-occupied |
| 1 Room | 0 (0.0%) | 0 (0.0%) |
| 2 or 3 Rooms | 11 (1.7%) | 90 (31.5%) |
| 4 or 5 Rooms | 142 (22.0%) | 91 (31.8%) |
| 6 or 7 Rooms | 340 (52.7%) | 68 (23.8%) |
| 8 or more Rooms | 152 (23.6%) | 37 (12.9%) |
| Total | 645 (100.0%) | 286 (100.0%) |
Housing Structure by Heating Type in Richwood
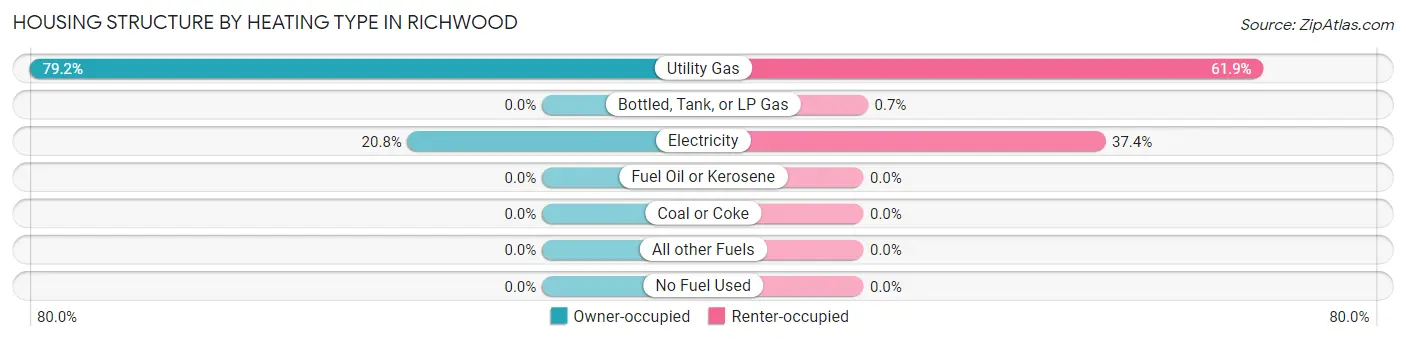
| Heating Type | Owner-occupied | Renter-occupied |
| Utility Gas | 511 (79.2%) | 177 (61.9%) |
| Bottled, Tank, or LP Gas | 0 (0.0%) | 2 (0.7%) |
| Electricity | 134 (20.8%) | 107 (37.4%) |
| Fuel Oil or Kerosene | 0 (0.0%) | 0 (0.0%) |
| Coal or Coke | 0 (0.0%) | 0 (0.0%) |
| All other Fuels | 0 (0.0%) | 0 (0.0%) |
| No Fuel Used | 0 (0.0%) | 0 (0.0%) |
| Total | 645 (100.0%) | 286 (100.0%) |
Household Vehicle Usage in Richwood
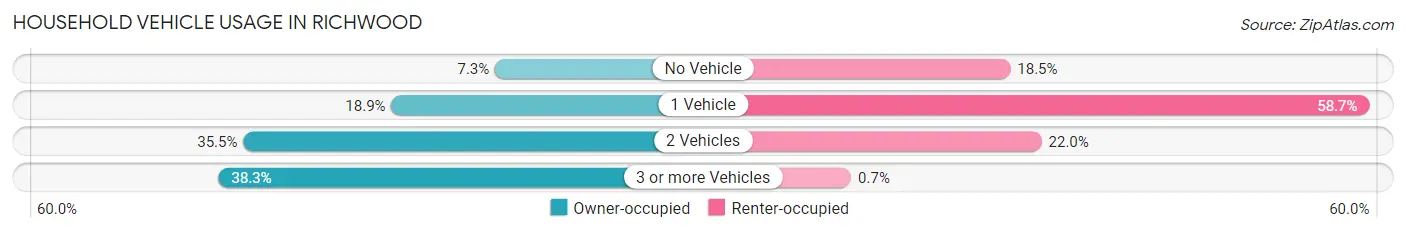
| Vehicles per Household | Owner-occupied | Renter-occupied |
| No Vehicle | 47 (7.3%) | 53 (18.5%) |
| 1 Vehicle | 122 (18.9%) | 168 (58.7%) |
| 2 Vehicles | 229 (35.5%) | 63 (22.0%) |
| 3 or more Vehicles | 247 (38.3%) | 2 (0.7%) |
| Total | 645 (100.0%) | 286 (100.0%) |
Real Estate & Mortgages in Richwood
Real Estate and Mortgage Overview in Richwood
| Characteristic | Without Mortgage | With Mortgage |
| Housing Units | 235 | 410 |
| Median Property Value | $143,800 | $160,800 |
| Median Household Income | $64,879 | $20 |
| Monthly Housing Costs | $515 | $6 |
| Real Estate Taxes | $1,614 | $24 |
Property Value by Mortgage Status in Richwood
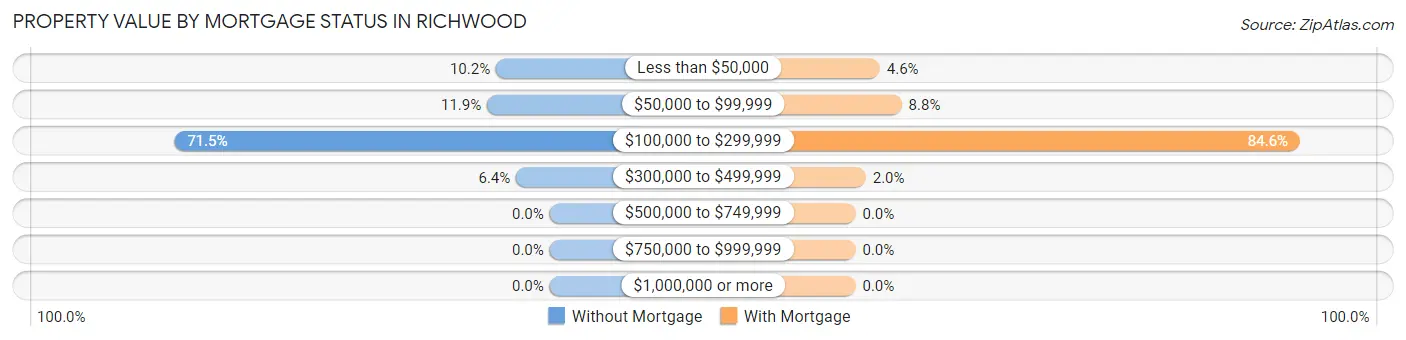
| Property Value | Without Mortgage | With Mortgage |
| Less than $50,000 | 24 (10.2%) | 19 (4.6%) |
| $50,000 to $99,999 | 28 (11.9%) | 36 (8.8%) |
| $100,000 to $299,999 | 168 (71.5%) | 347 (84.6%) |
| $300,000 to $499,999 | 15 (6.4%) | 8 (1.9%) |
| $500,000 to $749,999 | 0 (0.0%) | 0 (0.0%) |
| $750,000 to $999,999 | 0 (0.0%) | 0 (0.0%) |
| $1,000,000 or more | 0 (0.0%) | 0 (0.0%) |
| Total | 235 (100.0%) | 410 (100.0%) |
Household Income by Mortgage Status in Richwood
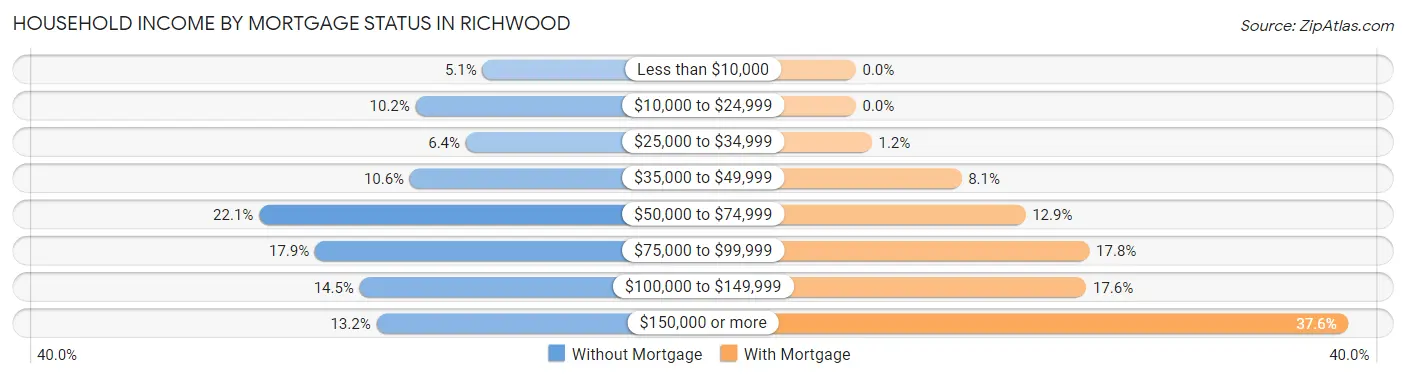
| Household Income | Without Mortgage | With Mortgage |
| Less than $10,000 | 12 (5.1%) | 0 (0.0%) |
| $10,000 to $24,999 | 24 (10.2%) | 0 (0.0%) |
| $25,000 to $34,999 | 15 (6.4%) | 5 (1.2%) |
| $35,000 to $49,999 | 25 (10.6%) | 33 (8.1%) |
| $50,000 to $74,999 | 52 (22.1%) | 53 (12.9%) |
| $75,000 to $99,999 | 42 (17.9%) | 73 (17.8%) |
| $100,000 to $149,999 | 34 (14.5%) | 72 (17.6%) |
| $150,000 or more | 31 (13.2%) | 154 (37.6%) |
| Total | 235 (100.0%) | 410 (100.0%) |
Property Value to Household Income Ratio in Richwood
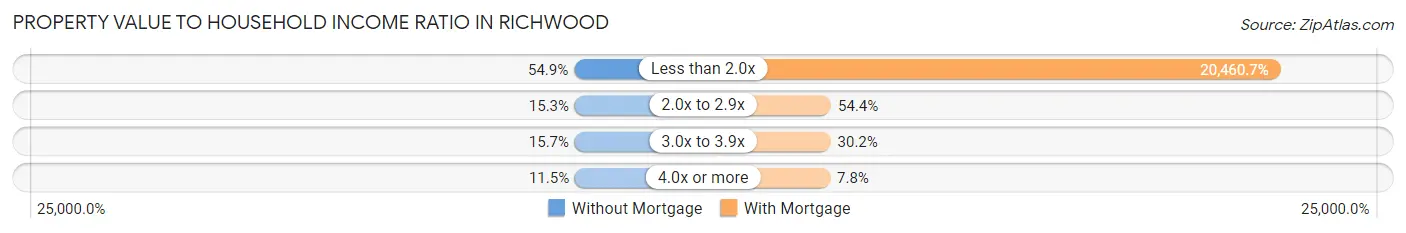
| Value-to-Income Ratio | Without Mortgage | With Mortgage |
| Less than 2.0x | 129 (54.9%) | 83,889 (20,460.7%) |
| 2.0x to 2.9x | 36 (15.3%) | 223 (54.4%) |
| 3.0x to 3.9x | 37 (15.7%) | 124 (30.2%) |
| 4.0x or more | 27 (11.5%) | 32 (7.8%) |
| Total | 235 (100.0%) | 410 (100.0%) |
Real Estate Taxes by Mortgage Status in Richwood
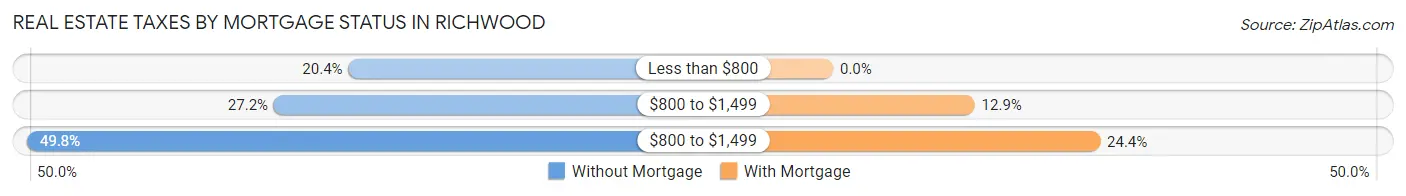
| Property Taxes | Without Mortgage | With Mortgage |
| Less than $800 | 48 (20.4%) | 0 (0.0%) |
| $800 to $1,499 | 64 (27.2%) | 53 (12.9%) |
| $800 to $1,499 | 117 (49.8%) | 100 (24.4%) |
| Total | 235 (100.0%) | 410 (100.0%) |
Health & Disability in Richwood
Health Insurance Coverage by Age in Richwood
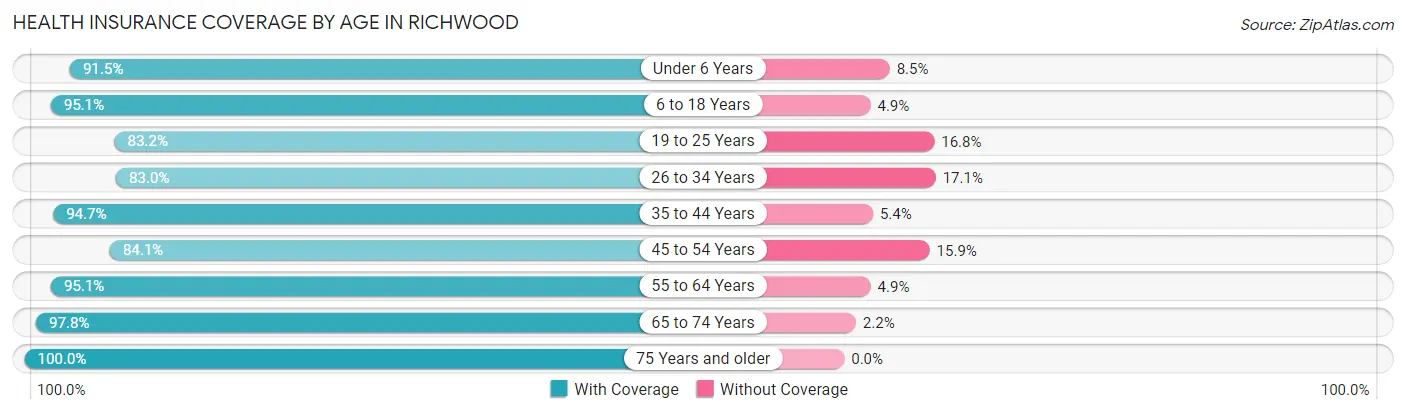
| Age Bracket | With Coverage | Without Coverage |
| Under 6 Years | 108 (91.5%) | 10 (8.5%) |
| 6 to 18 Years | 428 (95.1%) | 22 (4.9%) |
| 19 to 25 Years | 119 (83.2%) | 24 (16.8%) |
| 26 to 34 Years | 287 (83.0%) | 59 (17.1%) |
| 35 to 44 Years | 230 (94.7%) | 13 (5.3%) |
| 45 to 54 Years | 264 (84.1%) | 50 (15.9%) |
| 55 to 64 Years | 309 (95.1%) | 16 (4.9%) |
| 65 to 74 Years | 136 (97.8%) | 3 (2.2%) |
| 75 Years and older | 144 (100.0%) | 0 (0.0%) |
| Total | 2,025 (91.1%) | 197 (8.9%) |
Health Insurance Coverage by Citizenship Status in Richwood
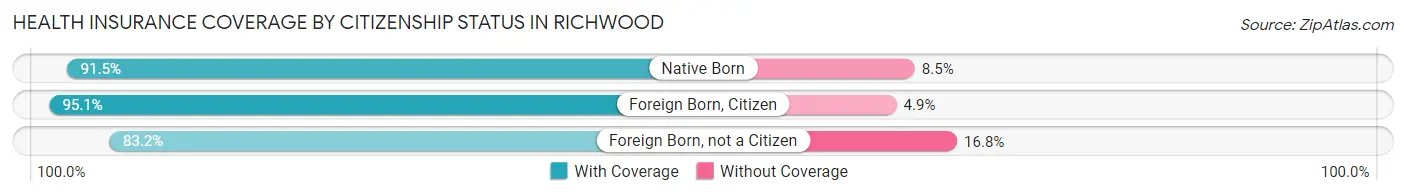
| Citizenship Status | With Coverage | Without Coverage |
| Native Born | 108 (91.5%) | 10 (8.5%) |
| Foreign Born, Citizen | 428 (95.1%) | 22 (4.9%) |
| Foreign Born, not a Citizen | 119 (83.2%) | 24 (16.8%) |
Health Insurance Coverage by Household Income in Richwood
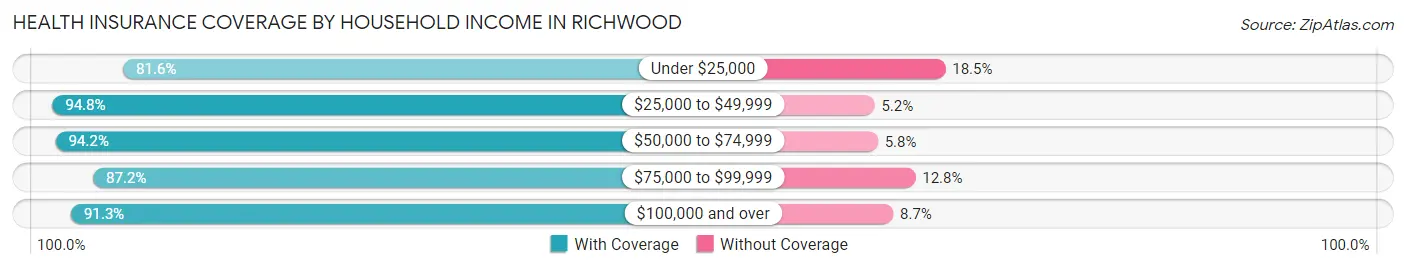
| Household Income | With Coverage | Without Coverage |
| Under $25,000 | 168 (81.6%) | 38 (18.4%) |
| $25,000 to $49,999 | 511 (94.8%) | 28 (5.2%) |
| $50,000 to $74,999 | 374 (94.2%) | 23 (5.8%) |
| $75,000 to $99,999 | 299 (87.2%) | 44 (12.8%) |
| $100,000 and over | 673 (91.3%) | 64 (8.7%) |
Public vs Private Health Insurance Coverage by Age in Richwood
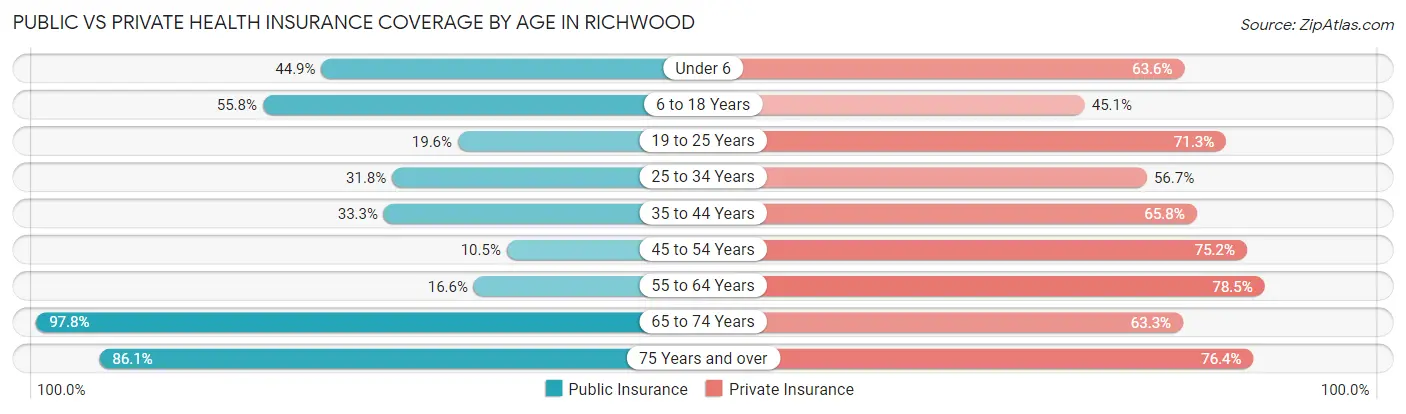
| Age Bracket | Public Insurance | Private Insurance |
| Under 6 | 53 (44.9%) | 75 (63.6%) |
| 6 to 18 Years | 251 (55.8%) | 203 (45.1%) |
| 19 to 25 Years | 28 (19.6%) | 102 (71.3%) |
| 25 to 34 Years | 110 (31.8%) | 196 (56.7%) |
| 35 to 44 Years | 81 (33.3%) | 160 (65.8%) |
| 45 to 54 Years | 33 (10.5%) | 236 (75.2%) |
| 55 to 64 Years | 54 (16.6%) | 255 (78.5%) |
| 65 to 74 Years | 136 (97.8%) | 88 (63.3%) |
| 75 Years and over | 124 (86.1%) | 110 (76.4%) |
| Total | 870 (39.2%) | 1,425 (64.1%) |
Disability Status by Sex by Age in Richwood
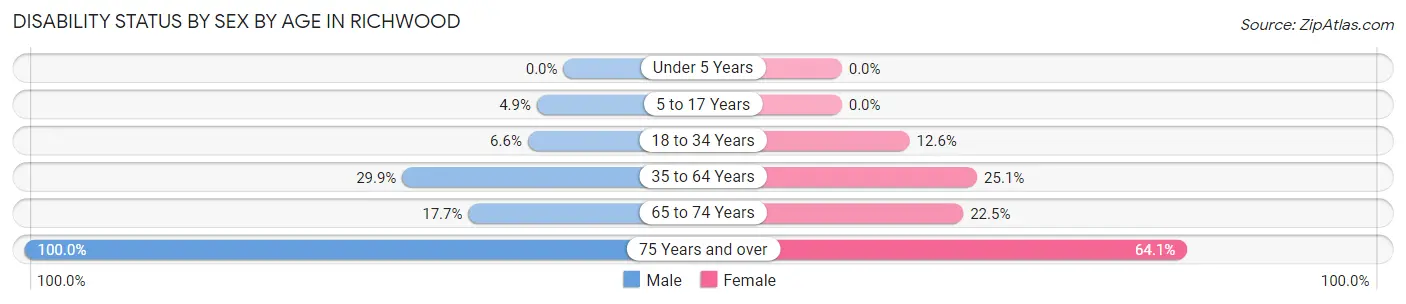
| Age Bracket | Male | Female |
| Under 5 Years | 0 (0.0%) | 0 (0.0%) |
| 5 to 17 Years | 7 (4.9%) | 0 (0.0%) |
| 18 to 34 Years | 17 (6.6%) | 32 (12.6%) |
| 35 to 64 Years | 140 (29.9%) | 104 (25.1%) |
| 65 to 74 Years | 12 (17.6%) | 16 (22.5%) |
| 75 Years and over | 66 (100.0%) | 50 (64.1%) |
Disability Class by Sex by Age in Richwood
Disability Class: Hearing Difficulty
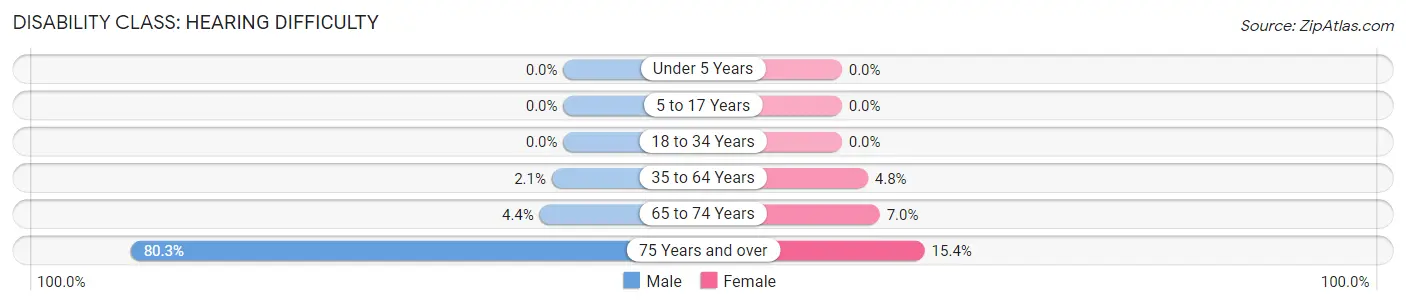
| Age Bracket | Male | Female |
| Under 5 Years | 0 (0.0%) | 0 (0.0%) |
| 5 to 17 Years | 0 (0.0%) | 0 (0.0%) |
| 18 to 34 Years | 0 (0.0%) | 0 (0.0%) |
| 35 to 64 Years | 10 (2.1%) | 20 (4.8%) |
| 65 to 74 Years | 3 (4.4%) | 5 (7.0%) |
| 75 Years and over | 53 (80.3%) | 12 (15.4%) |
Disability Class: Vision Difficulty
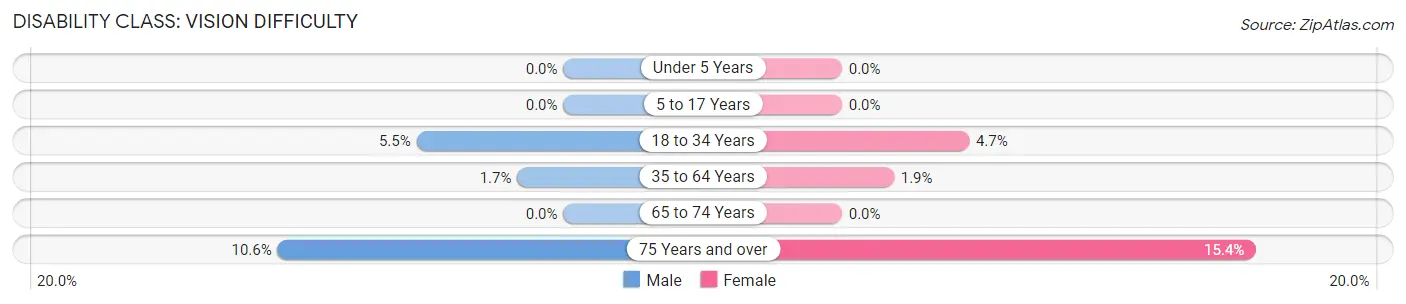
| Age Bracket | Male | Female |
| Under 5 Years | 0 (0.0%) | 0 (0.0%) |
| 5 to 17 Years | 0 (0.0%) | 0 (0.0%) |
| 18 to 34 Years | 14 (5.4%) | 12 (4.7%) |
| 35 to 64 Years | 8 (1.7%) | 8 (1.9%) |
| 65 to 74 Years | 0 (0.0%) | 0 (0.0%) |
| 75 Years and over | 7 (10.6%) | 12 (15.4%) |
Disability Class: Cognitive Difficulty
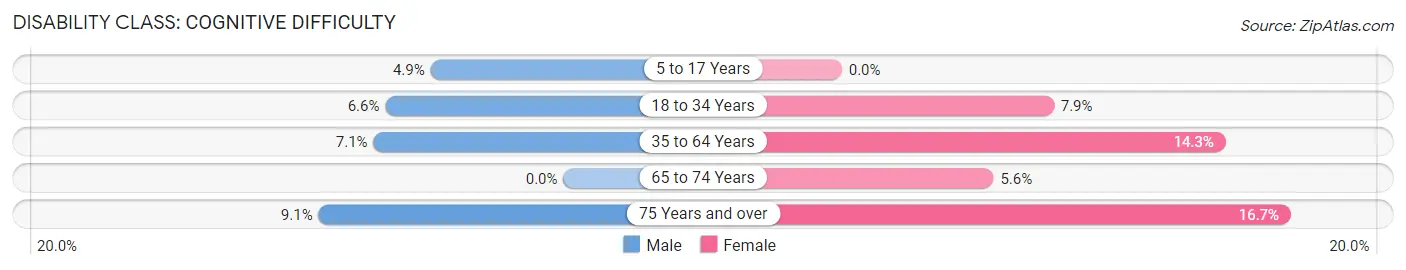
| Age Bracket | Male | Female |
| 5 to 17 Years | 7 (4.9%) | 0 (0.0%) |
| 18 to 34 Years | 17 (6.6%) | 20 (7.9%) |
| 35 to 64 Years | 33 (7.0%) | 59 (14.2%) |
| 65 to 74 Years | 0 (0.0%) | 4 (5.6%) |
| 75 Years and over | 6 (9.1%) | 13 (16.7%) |
Disability Class: Ambulatory Difficulty
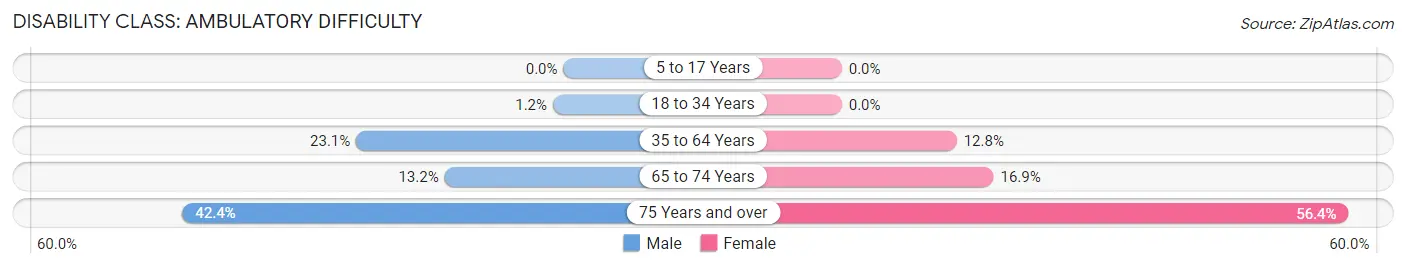
| Age Bracket | Male | Female |
| 5 to 17 Years | 0 (0.0%) | 0 (0.0%) |
| 18 to 34 Years | 3 (1.2%) | 0 (0.0%) |
| 35 to 64 Years | 108 (23.1%) | 53 (12.8%) |
| 65 to 74 Years | 9 (13.2%) | 12 (16.9%) |
| 75 Years and over | 28 (42.4%) | 44 (56.4%) |
Disability Class: Self-Care Difficulty
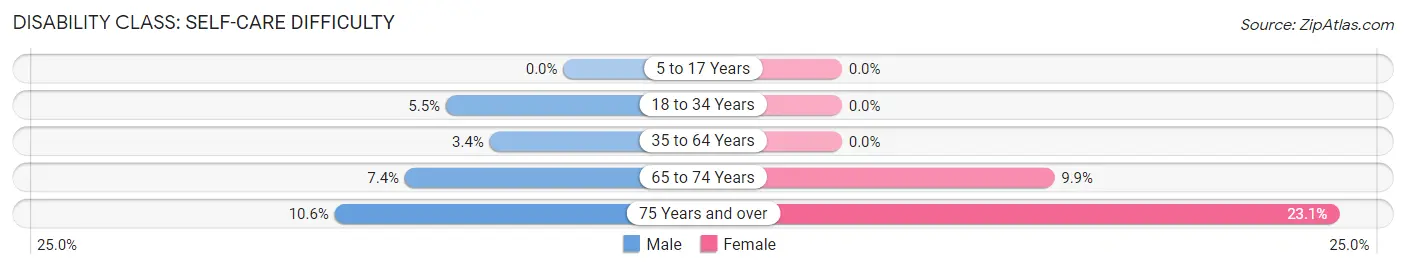
| Age Bracket | Male | Female |
| 5 to 17 Years | 0 (0.0%) | 0 (0.0%) |
| 18 to 34 Years | 14 (5.4%) | 0 (0.0%) |
| 35 to 64 Years | 16 (3.4%) | 0 (0.0%) |
| 65 to 74 Years | 5 (7.3%) | 7 (9.9%) |
| 75 Years and over | 7 (10.6%) | 18 (23.1%) |
Technology Access in Richwood
Computing Device Access in Richwood
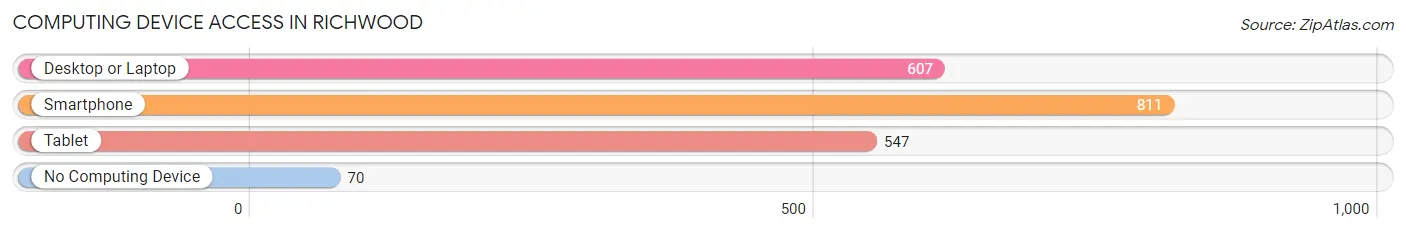
| Device Type | # Households | % Households |
| Desktop or Laptop | 607 | 65.2% |
| Smartphone | 811 | 87.1% |
| Tablet | 547 | 58.8% |
| No Computing Device | 70 | 7.5% |
| Total | 931 | 100.0% |
Internet Access in Richwood
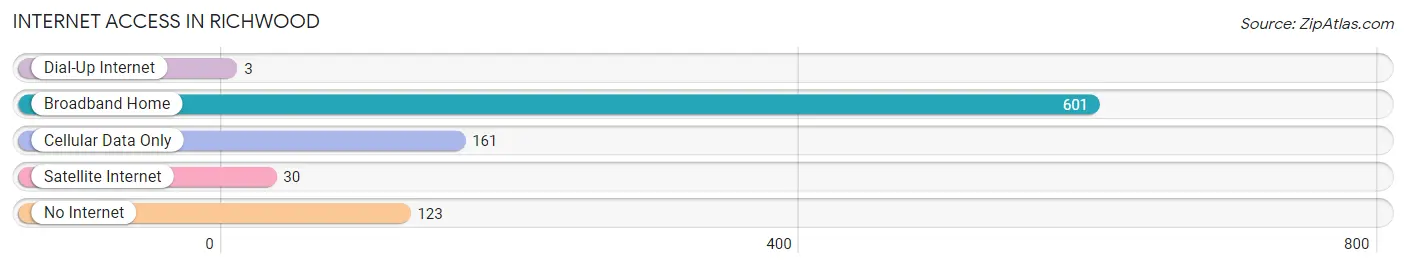
| Internet Type | # Households | % Households |
| Dial-Up Internet | 3 | 0.3% |
| Broadband Home | 601 | 64.5% |
| Cellular Data Only | 161 | 17.3% |
| Satellite Internet | 30 | 3.2% |
| No Internet | 123 | 13.2% |
| Total | 931 | 100.0% |
Richwood Summary
Richwood, Ohio is a small village located in Union County, Ohio. It is situated on the banks of the Scioto River, approximately 25 miles northwest of Columbus. The village has a population of approximately 2,500 people and is part of the Marysville-Plain City Metropolitan Statistical Area.
History
Richwood was founded in 1837 by a group of settlers from Richwood, Virginia. The village was named after the original settlement in Virginia. The settlers were attracted to the area due to its fertile soil and abundant natural resources. The village was incorporated in 1845 and quickly became a thriving agricultural community.
In the late 19th century, Richwood began to experience a period of growth and development. The village was connected to the outside world by the Columbus and Toledo Railroad in 1881. This allowed for the transportation of goods and services to and from the village. In addition, the village was connected to the outside world by the Ohio and Erie Canal in 1892. This allowed for the transportation of goods and services to and from the village.
The village experienced a period of growth and development in the early 20th century. The village was connected to the outside world by the Columbus and Toledo Railroad in 1881. This allowed for the transportation of goods and services to and from the village. In addition, the village was connected to the outside world by the Ohio and Erie Canal in 1892. This allowed for the transportation of goods and services to and from the village.
The village experienced a period of decline in the mid-20th century. The decline was due to the decline of the agricultural industry in the area. The village was also affected by the Great Depression and World War II. The village experienced a period of revitalization in the late 20th century. The village was connected to the outside world by the Columbus and Toledo Railroad in 1881. This allowed for the transportation of goods and services to and from the village. In addition, the village was connected to the outside world by the Ohio and Erie Canal in 1892. This allowed for the transportation of goods and services to and from the village.
Geography
Richwood is located in Union County, Ohio. The village is situated on the banks of the Scioto River, approximately 25 miles northwest of Columbus. The village has a total area of 1.2 square miles, all of which is land. The village is located in the Central Lowland region of Ohio. The terrain is mostly flat with some rolling hills. The village is located in the humid continental climate zone.
Economy
Richwood’s economy is primarily based on agriculture. The village is home to several farms that produce a variety of crops, including corn, soybeans, wheat, and hay. The village is also home to several businesses, including a grocery store, a hardware store, and a restaurant. The village is also home to several manufacturing companies, including a plastics manufacturer and a metal fabrication company.
Demographics
As of the 2010 census, Richwood had a population of 2,500 people. The racial makeup of the village was 97.2% White, 0.8% African American, 0.4% Native American, 0.4% Asian, and 1.2% from other races. The median household income was $41,250 and the median family income was $50,000. The per capita income was $20,000. The village had a poverty rate of 11.2%.
Conclusion
Richwood, Ohio is a small village located in Union County, Ohio. It is situated on the banks of the Scioto River, approximately 25 miles northwest of Columbus. The village has a population of approximately 2,500 people and is part of the Marysville-Plain City Metropolitan Statistical Area. Richwood was founded in 1837 by a group of settlers from Richwood, Virginia. The village has a primarily agricultural economy and is home to several businesses and manufacturing companies. The village has a population that is 97.2% White, 0.8% African American, 0.4% Native American, 0.4% Asian, and 1.2% from other races. The median household income was $41,250 and the median family income was $50,000. The per capita income was $20,000. The village had a poverty rate of 11.2%. Richwood is a small village with a rich history and a diverse economy.
Common Questions
What is Per Capita Income in Richwood?
Per Capita income in Richwood is $36,754.
What is the Median Family Income in Richwood?
Median Family Income in Richwood is $76,818.
What is the Median Household income in Richwood?
Median Household Income in Richwood is $63,185.
What is Income or Wage Gap in Richwood?
Income or Wage Gap in Richwood is 5.5%.
Women in Richwood earn 94.5 cents for every dollar earned by a man.
What is Inequality or Gini Index in Richwood?
Inequality or Gini Index in Richwood is 0.51.
What is the Total Population of Richwood?
Total Population of Richwood is 2,222.
What is the Total Male Population of Richwood?
Total Male Population of Richwood is 1,068.
What is the Total Female Population of Richwood?
Total Female Population of Richwood is 1,154.
What is the Ratio of Males per 100 Females in Richwood?
There are 92.55 Males per 100 Females in Richwood.
What is the Ratio of Females per 100 Males in Richwood?
There are 108.05 Females per 100 Males in Richwood.
What is the Median Population Age in Richwood?
Median Population Age in Richwood is 38.2 Years.
What is the Average Family Size in Richwood
Average Family Size in Richwood is 3.1 People.
What is the Average Household Size in Richwood
Average Household Size in Richwood is 2.4 People.
How Large is the Labor Force in Richwood?
There are 1,144 People in the Labor Forcein in Richwood.
What is the Percentage of People in the Labor Force in Richwood?
66.1% of People are in the Labor Force in Richwood.
What is the Unemployment Rate in Richwood?
Unemployment Rate in Richwood is 4.0%.