Zip Codes with the Highest Percentage of Population Employed in Administrative & Support Services in Strongsville, OH
RELATED REPORTS & OPTIONS
Administrative & Support Services
Strongsville
Compare Zip Codes
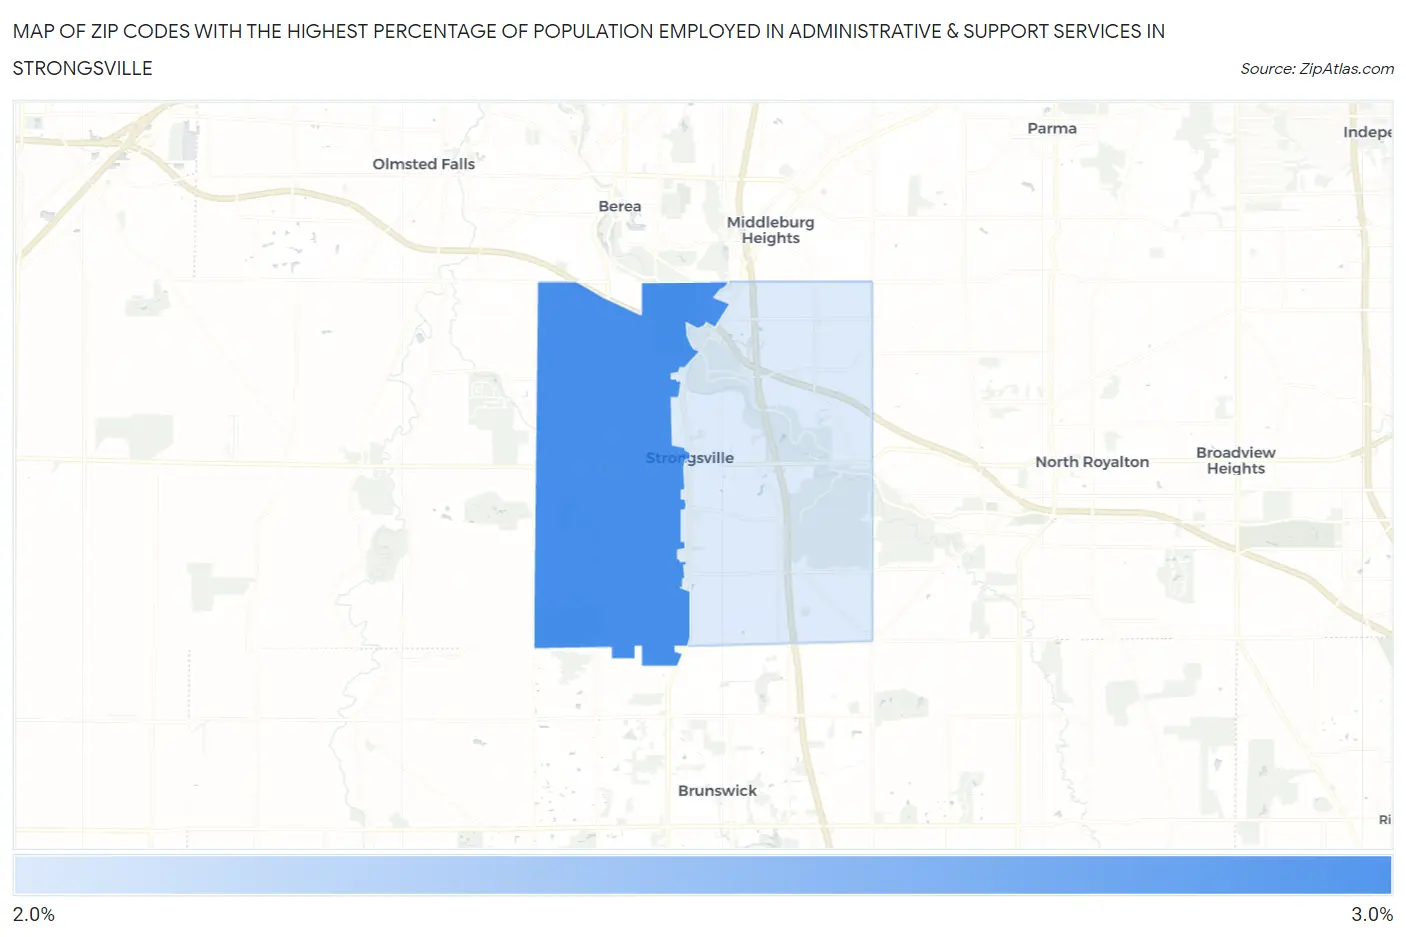
Map of Zip Codes with the Highest Percentage of Population Employed in Administrative & Support Services in Strongsville
2.4%
2.6%
Zip Codes with the Highest Percentage of Population Employed in Administrative & Support Services in Strongsville, OH
| Zip Code | % Employed | vs State | vs National | |
| 1. | 44149 | 2.6% | 3.7%(-1.16)#707 | 4.1%(-1.59)#17,809 |
| 2. | 44136 | 2.4% | 3.7%(-1.34)#743 | 4.1%(-1.77)#18,754 |
1
Common Questions
What are the Top Zip Codes with the Highest Percentage of Population Employed in Administrative & Support Services in Strongsville, OH?
Top Zip Codes with the Highest Percentage of Population Employed in Administrative & Support Services in Strongsville, OH are:
What zip code has the Highest Percentage of Population Employed in Administrative & Support Services in Strongsville, OH?
44149 has the Highest Percentage of Population Employed in Administrative & Support Services in Strongsville, OH with 2.6%.
What is the Percentage of Population Employed in Administrative & Support Services in Strongsville, OH?
Percentage of Population Employed in Administrative & Support Services in Strongsville is 2.5%.
What is the Percentage of Population Employed in Administrative & Support Services in Ohio?
Percentage of Population Employed in Administrative & Support Services in Ohio is 3.7%.
What is the Percentage of Population Employed in Administrative & Support Services in the United States?
Percentage of Population Employed in Administrative & Support Services in the United States is 4.1%.