Miamitown, OH Map & Demographics
Miamitown Map
Miamitown Overview
$36,062
PER CAPITA INCOME
$58,158
AVG FAMILY INCOME
$61,161
AVG HOUSEHOLD INCOME
14.2%
WAGE / INCOME GAP [ % ]
85.8¢/ $1
WAGE / INCOME GAP [ $ ]
0.24
INEQUALITY / GINI INDEX
959
TOTAL POPULATION
502
MALE POPULATION
457
FEMALE POPULATION
109.85
MALES / 100 FEMALES
91.04
FEMALES / 100 MALES
36.3
MEDIAN AGE
2.8
AVG FAMILY SIZE
1.6
AVG HOUSEHOLD SIZE
546
LABOR FORCE [ PEOPLE ]
66.6%
PERCENT IN LABOR FORCE
Miamitown Zip Codes
Miamitown Area Codes
Income in Miamitown
Income Overview in Miamitown
Per Capita Income in Miamitown is $36,062, while median incomes of families and households are $58,158 and $61,161 respectively.
| Characteristic | Number | Measure |
| Per Capita Income | 959 | $36,062 |
| Median Family Income | 160 | $58,158 |
| Mean Family Income | 160 | $56,828 |
| Median Household Income | 603 | $61,161 |
| Mean Household Income | 603 | $57,446 |
| Income Deficit | 160 | $0 |
| Wage / Income Gap (%) | 959 | 14.19% |
| Wage / Income Gap ($) | 959 | 85.81¢ per $1 |
| Gini / Inequality Index | 959 | 0.24 |
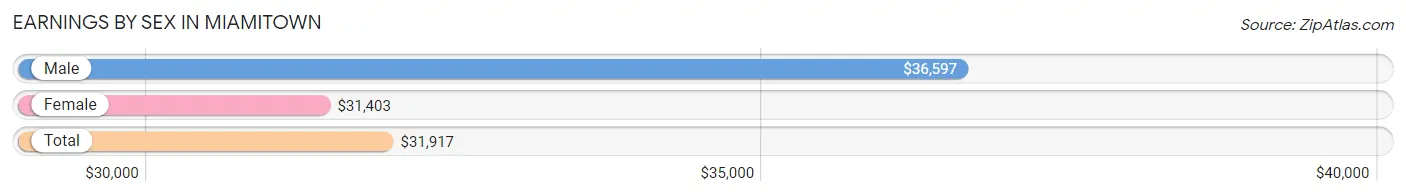
Earnings by Sex in Miamitown
Average Earnings in Miamitown are $31,917, $36,597 for men and $31,403 for women, a difference of 14.2%.
| Sex | Number | Average Earnings |
| Male | 281 (50.9%) | $36,597 |
| Female | 271 (49.1%) | $31,403 |
| Total | 552 (100.0%) | $31,917 |
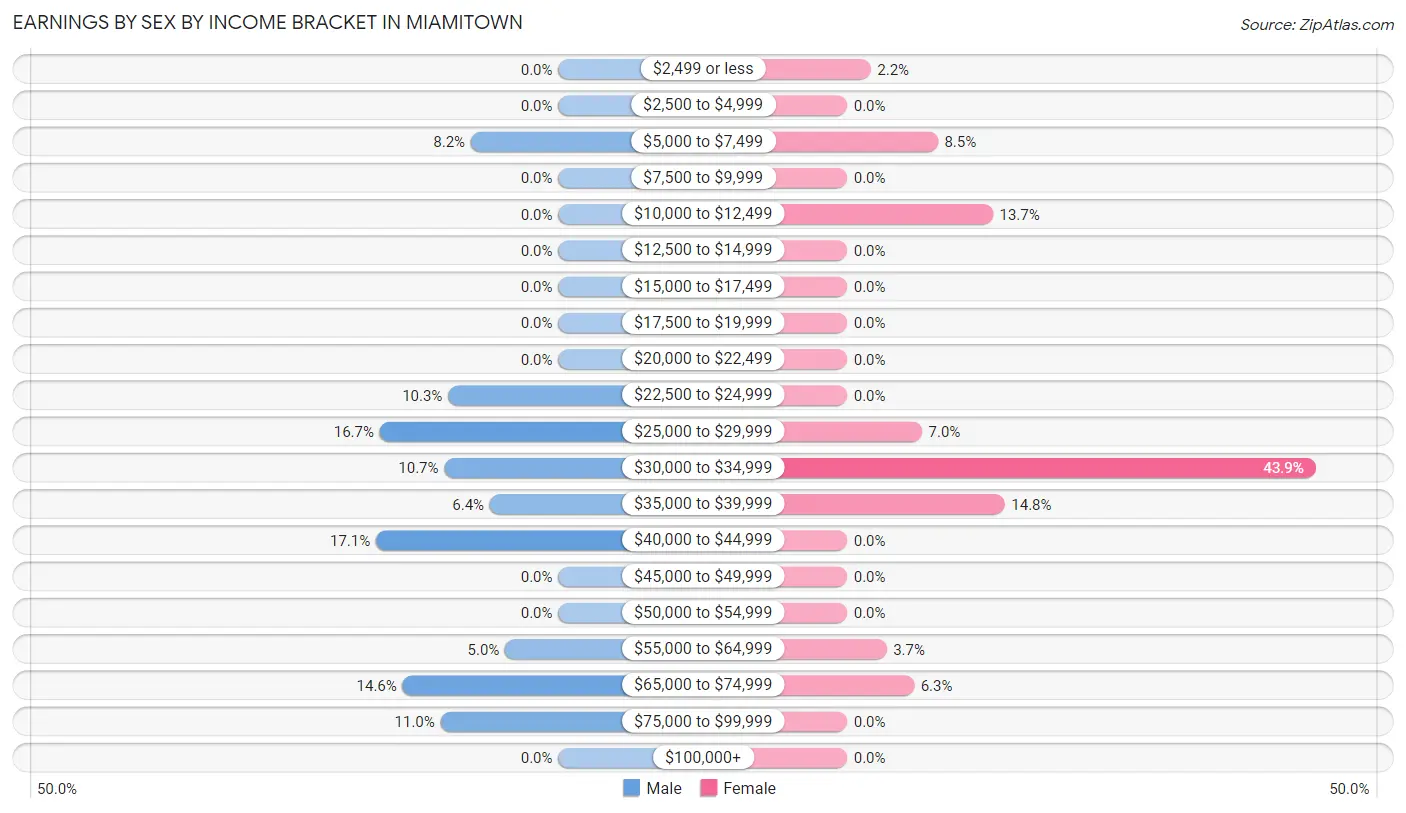
Earnings by Sex by Income Bracket in Miamitown
The most common earnings brackets in Miamitown are $40,000 to $44,999 for men (48 | 17.1%) and $30,000 to $34,999 for women (119 | 43.9%).
| Income | Male | Female |
| $2,499 or less | 0 (0.0%) | 6 (2.2%) |
| $2,500 to $4,999 | 0 (0.0%) | 0 (0.0%) |
| $5,000 to $7,499 | 23 (8.2%) | 23 (8.5%) |
| $7,500 to $9,999 | 0 (0.0%) | 0 (0.0%) |
| $10,000 to $12,499 | 0 (0.0%) | 37 (13.7%) |
| $12,500 to $14,999 | 0 (0.0%) | 0 (0.0%) |
| $15,000 to $17,499 | 0 (0.0%) | 0 (0.0%) |
| $17,500 to $19,999 | 0 (0.0%) | 0 (0.0%) |
| $20,000 to $22,499 | 0 (0.0%) | 0 (0.0%) |
| $22,500 to $24,999 | 29 (10.3%) | 0 (0.0%) |
| $25,000 to $29,999 | 47 (16.7%) | 19 (7.0%) |
| $30,000 to $34,999 | 30 (10.7%) | 119 (43.9%) |
| $35,000 to $39,999 | 18 (6.4%) | 40 (14.8%) |
| $40,000 to $44,999 | 48 (17.1%) | 0 (0.0%) |
| $45,000 to $49,999 | 0 (0.0%) | 0 (0.0%) |
| $50,000 to $54,999 | 0 (0.0%) | 0 (0.0%) |
| $55,000 to $64,999 | 14 (5.0%) | 10 (3.7%) |
| $65,000 to $74,999 | 41 (14.6%) | 17 (6.3%) |
| $75,000 to $99,999 | 31 (11.0%) | 0 (0.0%) |
| $100,000+ | 0 (0.0%) | 0 (0.0%) |
| Total | 281 (100.0%) | 271 (100.0%) |
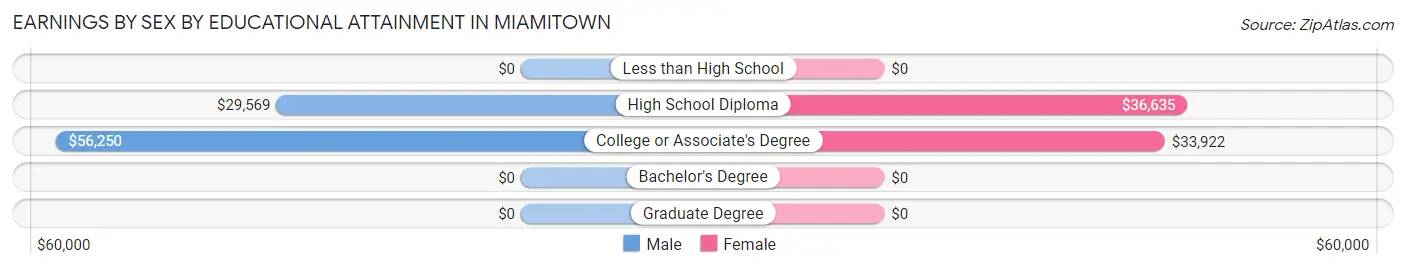
Earnings by Sex by Educational Attainment in Miamitown
Average earnings in Miamitown are $40,545 for men and $32,974 for women, a difference of 18.7%. Men with an educational attainment of college or associate's degree enjoy the highest average annual earnings of $56,250, while those with high school diploma education earn the least with $29,569. Women with an educational attainment of high school diploma earn the most with the average annual earnings of $36,635, while those with college or associate's degree education have the smallest earnings of $33,922.
| Educational Attainment | Male Income | Female Income |
| Less than High School | - | - |
| High School Diploma | $29,569 | $36,635 |
| College or Associate's Degree | $56,250 | $33,922 |
| Bachelor's Degree | - | - |
| Graduate Degree | - | - |
| Total | $40,545 | $32,974 |
Family Income in Miamitown
Family Income Brackets in Miamitown
According to the Miamitown family income data, there are 99 families falling into the $50,000 to $74,999 income range, which is the most common income bracket and makes up 61.9% of all families.
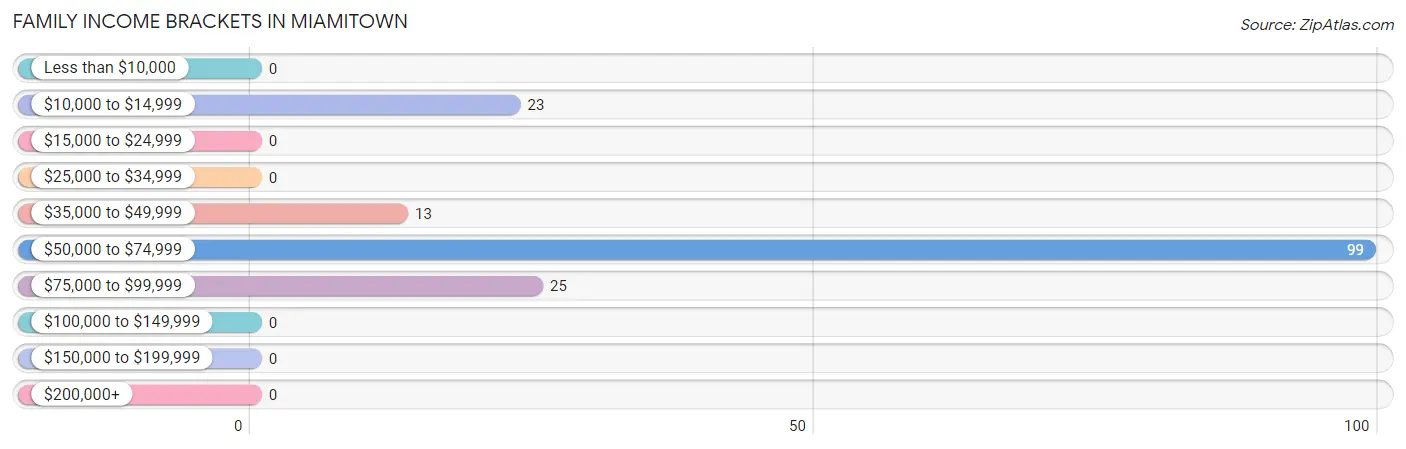
| Income Bracket | # Families | % Families |
| Less than $10,000 | 0 | 0.0% |
| $10,000 to $14,999 | 23 | 14.4% |
| $15,000 to $24,999 | 0 | 0.0% |
| $25,000 to $34,999 | 0 | 0.0% |
| $35,000 to $49,999 | 13 | 8.1% |
| $50,000 to $74,999 | 99 | 61.9% |
| $75,000 to $99,999 | 25 | 15.6% |
| $100,000 to $149,999 | 0 | 0.0% |
| $150,000 to $199,999 | 0 | 0.0% |
| $200,000+ | 0 | 0.0% |
Family Income by Famaliy Size in Miamitown
2-person families (112 | 70.0%) account for the highest median family income in Miamitown with $58,026 per family, while 2-person families (112 | 70.0%) have the highest median income of $29,013 per family member.
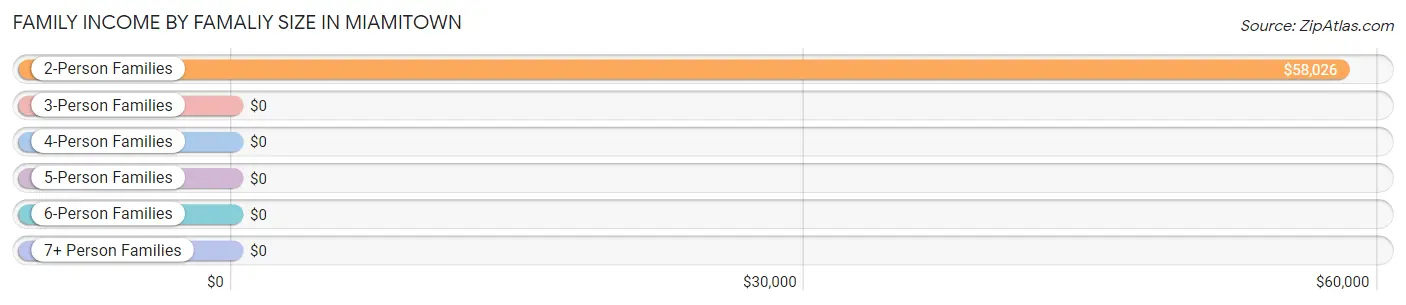
| Income Bracket | # Families | Median Income |
| 2-Person Families | 112 (70.0%) | $58,026 |
| 3-Person Families | 0 (0.0%) | $0 |
| 4-Person Families | 23 (14.4%) | $0 |
| 5-Person Families | 25 (15.6%) | $0 |
| 6-Person Families | 0 (0.0%) | $0 |
| 7+ Person Families | 0 (0.0%) | $0 |
| Total | 160 (100.0%) | $58,158 |
Family Income by Number of Earners in Miamitown
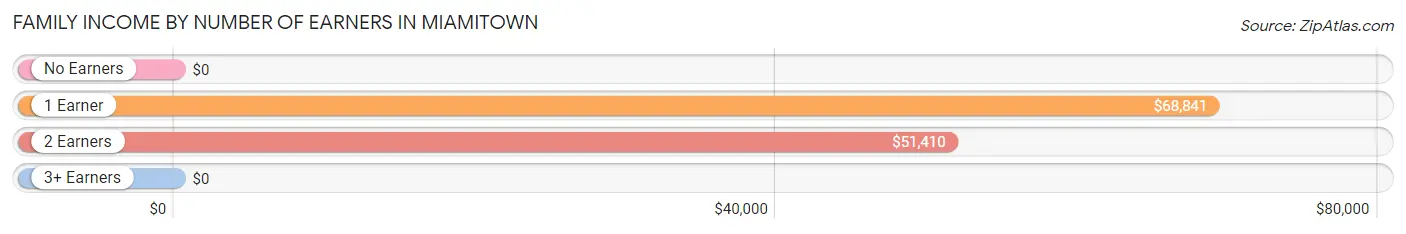
| Number of Earners | # Families | Median Income |
| No Earners | 0 (0.0%) | $0 |
| 1 Earner | 70 (43.8%) | $68,841 |
| 2 Earners | 90 (56.2%) | $51,410 |
| 3+ Earners | 0 (0.0%) | $0 |
| Total | 160 (100.0%) | $58,158 |
Household Income in Miamitown
Household Income Brackets in Miamitown
With 204 households falling in the category, the $50,000 to $74,999 income range is the most frequent in Miamitown, accounting for 33.8% of all households.
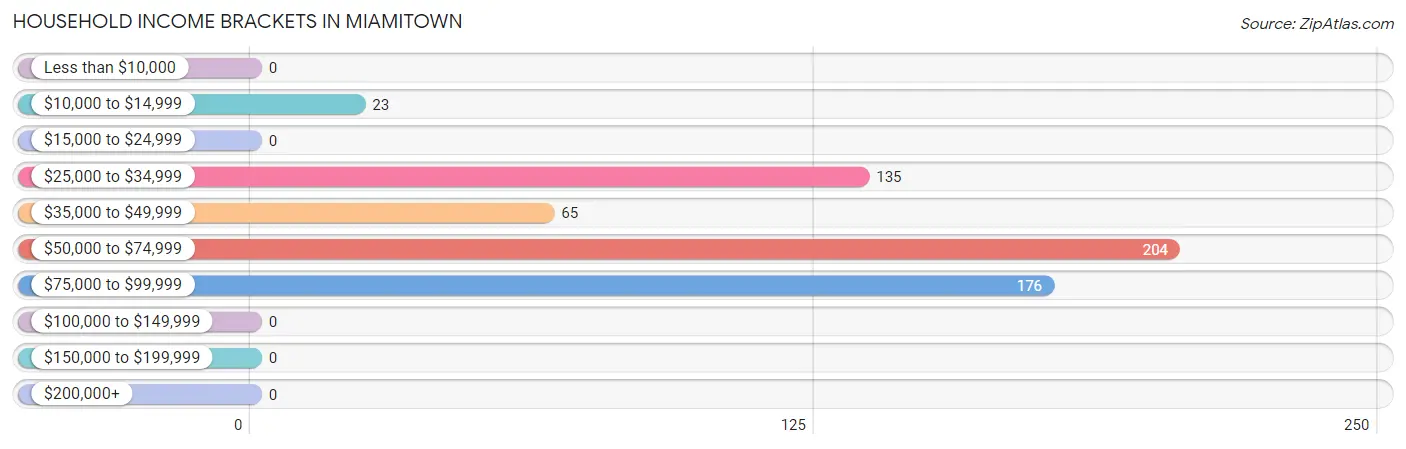
| Income Bracket | # Households | % Households |
| Less than $10,000 | 0 | 0.0% |
| $10,000 to $14,999 | 23 | 3.8% |
| $15,000 to $24,999 | 0 | 0.0% |
| $25,000 to $34,999 | 135 | 22.4% |
| $35,000 to $49,999 | 65 | 10.8% |
| $50,000 to $74,999 | 204 | 33.8% |
| $75,000 to $99,999 | 176 | 29.2% |
| $100,000 to $149,999 | 0 | 0.0% |
| $150,000 to $199,999 | 0 | 0.0% |
| $200,000+ | 0 | 0.0% |
Household Income by Householder Age in Miamitown
The median household income in Miamitown is $61,161, with the highest median household income of $85,506 found in the 65+ years age bracket for the primary householder. A total of 217 households (36.0%) fall into this category. Meanwhile, the 15 to 24 years age bracket for the primary householder has the lowest median household income of $0, with 90 households (14.9%) in this group.
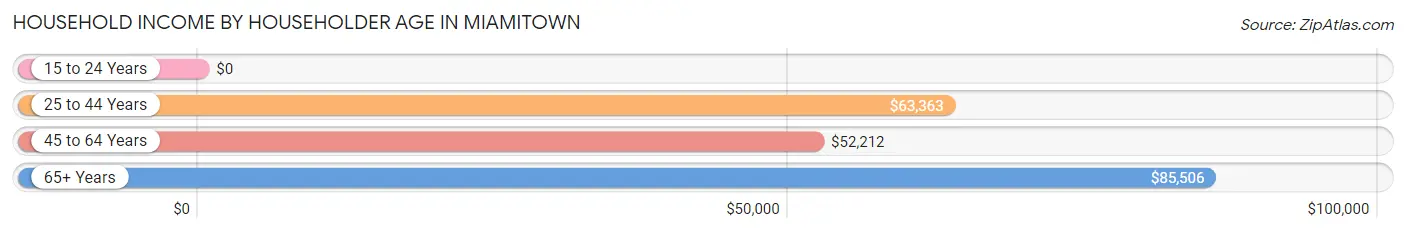
| Income Bracket | # Households | Median Income |
| 15 to 24 Years | 90 (14.9%) | $0 |
| 25 to 44 Years | 173 (28.7%) | $63,363 |
| 45 to 64 Years | 123 (20.4%) | $52,212 |
| 65+ Years | 217 (36.0%) | $85,506 |
| Total | 603 (100.0%) | $61,161 |
Poverty in Miamitown
Income Below Poverty by Sex and Age in Miamitown
With 9.6% poverty level for males and 10.3% for females among the residents of Miamitown, under 5 year old males and 6 to 11 year old females are the most vulnerable to poverty, with 25 males (100.0%) and 24 females (54.5%) in their respective age groups living below the poverty level.
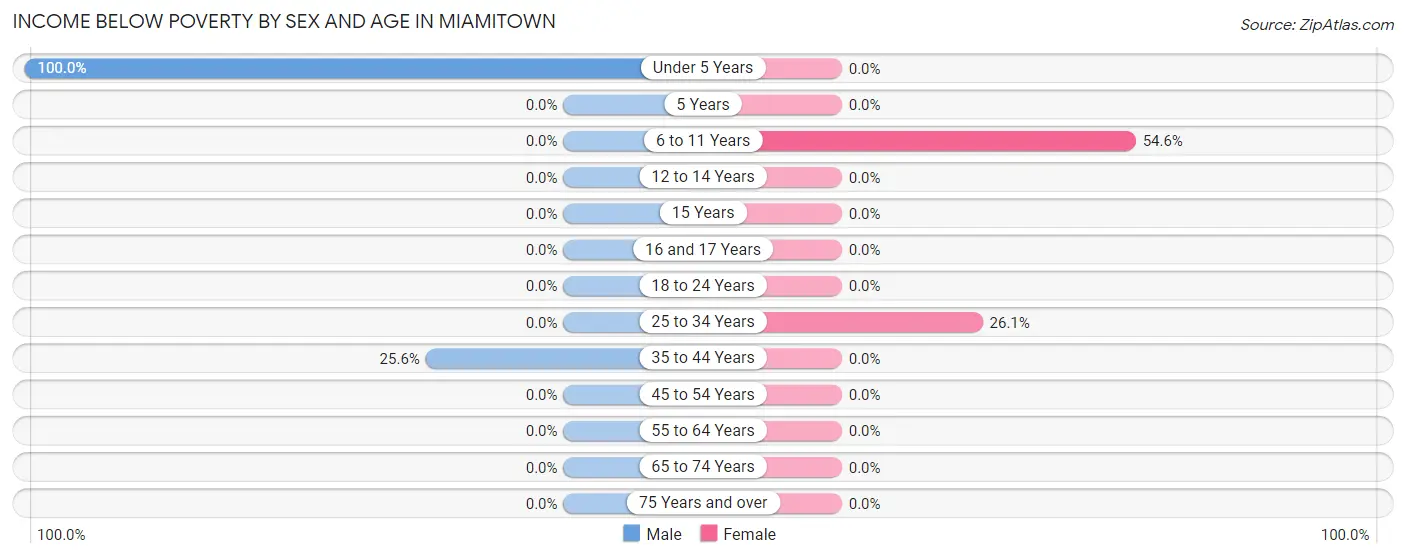
| Age Bracket | Male | Female |
| Under 5 Years | 25 (100.0%) | 0 (0.0%) |
| 5 Years | 0 (0.0%) | 0 (0.0%) |
| 6 to 11 Years | 0 (0.0%) | 24 (54.5%) |
| 12 to 14 Years | 0 (0.0%) | 0 (0.0%) |
| 15 Years | 0 (0.0%) | 0 (0.0%) |
| 16 and 17 Years | 0 (0.0%) | 0 (0.0%) |
| 18 to 24 Years | 0 (0.0%) | 0 (0.0%) |
| 25 to 34 Years | 0 (0.0%) | 23 (26.1%) |
| 35 to 44 Years | 23 (25.6%) | 0 (0.0%) |
| 45 to 54 Years | 0 (0.0%) | 0 (0.0%) |
| 55 to 64 Years | 0 (0.0%) | 0 (0.0%) |
| 65 to 74 Years | 0 (0.0%) | 0 (0.0%) |
| 75 Years and over | 0 (0.0%) | 0 (0.0%) |
| Total | 48 (9.6%) | 47 (10.3%) |
Income Above Poverty by Sex and Age in Miamitown
According to the poverty statistics in Miamitown, males aged 6 to 11 years and females aged 12 to 14 years are the age groups that are most secure financially, with 100.0% of males and 100.0% of females in these age groups living above the poverty line.
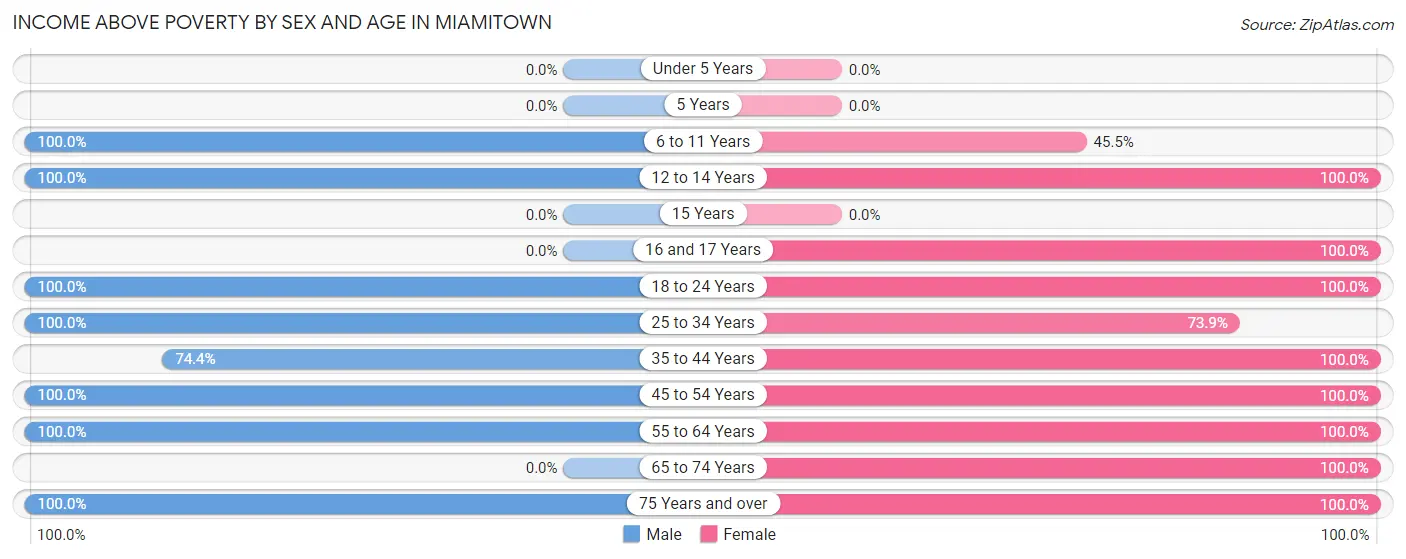
| Age Bracket | Male | Female |
| Under 5 Years | 0 (0.0%) | 0 (0.0%) |
| 5 Years | 0 (0.0%) | 0 (0.0%) |
| 6 to 11 Years | 10 (100.0%) | 20 (45.5%) |
| 12 to 14 Years | 50 (100.0%) | 10 (100.0%) |
| 15 Years | 0 (0.0%) | 0 (0.0%) |
| 16 and 17 Years | 0 (0.0%) | 12 (100.0%) |
| 18 to 24 Years | 30 (100.0%) | 119 (100.0%) |
| 25 to 34 Years | 65 (100.0%) | 65 (73.9%) |
| 35 to 44 Years | 67 (74.4%) | 23 (100.0%) |
| 45 to 54 Years | 57 (100.0%) | 53 (100.0%) |
| 55 to 64 Years | 39 (100.0%) | 27 (100.0%) |
| 65 to 74 Years | 0 (0.0%) | 65 (100.0%) |
| 75 Years and over | 136 (100.0%) | 16 (100.0%) |
| Total | 454 (90.4%) | 410 (89.7%) |
Income Below Poverty Among Married-Couple Families in Miamitown
The poverty statistics for married-couple families in Miamitown show that 26.4% or 23 of the total 87 families live below the poverty line. Families with 1 or 2 children have the highest poverty rate of 59.0%, comprising of 23 families. On the other hand, families with no children have the lowest poverty rate of 0.0%, which includes 0 families.
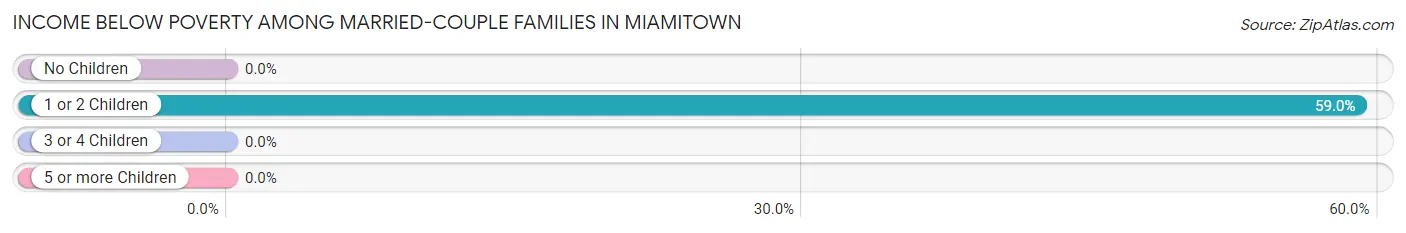
| Children | Above Poverty | Below Poverty |
| No Children | 39 (100.0%) | 0 (0.0%) |
| 1 or 2 Children | 16 (41.0%) | 23 (59.0%) |
| 3 or 4 Children | 9 (100.0%) | 0 (0.0%) |
| 5 or more Children | 0 (0.0%) | 0 (0.0%) |
| Total | 64 (73.6%) | 23 (26.4%) |
Income Below Poverty Among Single-Parent Households in Miamitown
| Children | Single Father | Single Mother |
| No Children | 0 (0.0%) | 0 (0.0%) |
| 1 or 2 Children | 0 (0.0%) | 0 (0.0%) |
| 3 or 4 Children | 0 (0.0%) | 0 (0.0%) |
| 5 or more Children | 0 (0.0%) | 0 (0.0%) |
| Total | 0 (0.0%) | 0 (0.0%) |
Income Below Poverty Among Married-Couple vs Single-Parent Households in Miamitown
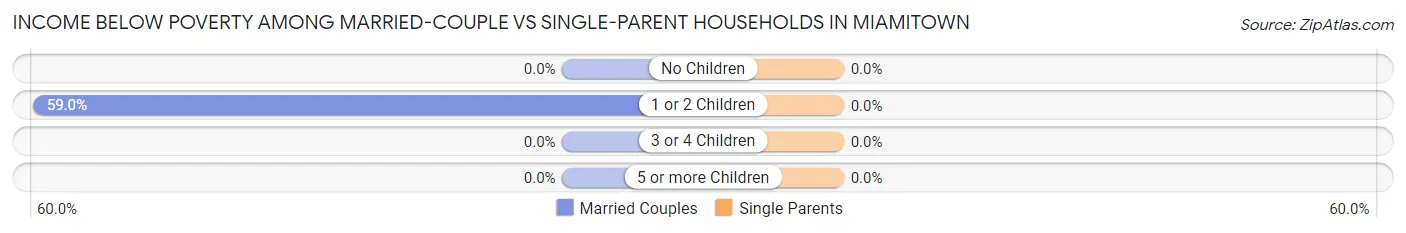
| Children | Married-Couple Families | Single-Parent Households |
| No Children | 0 (0.0%) | 0 (0.0%) |
| 1 or 2 Children | 23 (59.0%) | 0 (0.0%) |
| 3 or 4 Children | 0 (0.0%) | 0 (0.0%) |
| 5 or more Children | 0 (0.0%) | 0 (0.0%) |
| Total | 23 (26.4%) | 0 (0.0%) |
Race in Miamitown
The most populous races in Miamitown are , and White / Caucasian (959 | 100.0%).
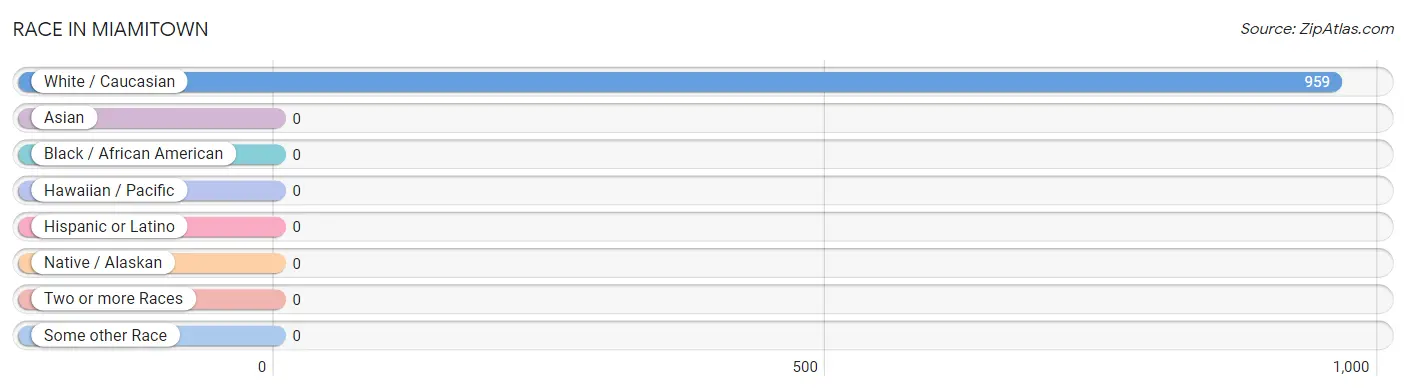
| Race | # Population | % Population |
| Asian | 0 | 0.0% |
| Black / African American | 0 | 0.0% |
| Hawaiian / Pacific | 0 | 0.0% |
| Hispanic or Latino | 0 | 0.0% |
| Native / Alaskan | 0 | 0.0% |
| White / Caucasian | 959 | 100.0% |
| Two or more Races | 0 | 0.0% |
| Some other Race | 0 | 0.0% |
| Total | 959 | 100.0% |
Ancestry in Miamitown
The most populous ancestries reported in Miamitown are German (348 | 36.3%), Irish (84 | 8.8%), English (47 | 4.9%), Scottish (35 | 3.6%), and American (31 | 3.2%), together accounting for 56.8% of all Miamitown residents.
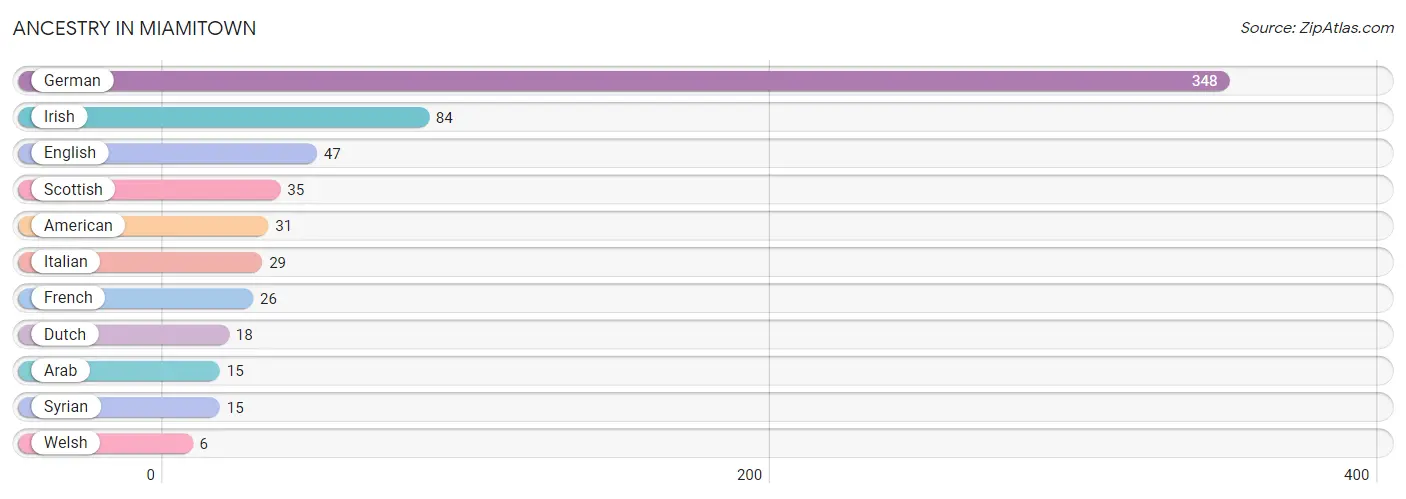
| Ancestry | # Population | % Population |
| American | 31 | 3.2% |
| Arab | 15 | 1.6% |
| Dutch | 18 | 1.9% |
| English | 47 | 4.9% |
| French | 26 | 2.7% |
| German | 348 | 36.3% |
| Irish | 84 | 8.8% |
| Italian | 29 | 3.0% |
| Scottish | 35 | 3.6% |
| Syrian | 15 | 1.6% |
| Welsh | 6 | 0.6% | View All 11 Rows |
Immigrants in Miamitown

| Immigration Origin | # Population | % Population | View All 0 Rows |
Sex and Age in Miamitown
Sex and Age in Miamitown
The most populous age groups in Miamitown are 80 to 84 Years (136 | 27.1%) for men and 20 to 24 Years (90 | 19.7%) for women.
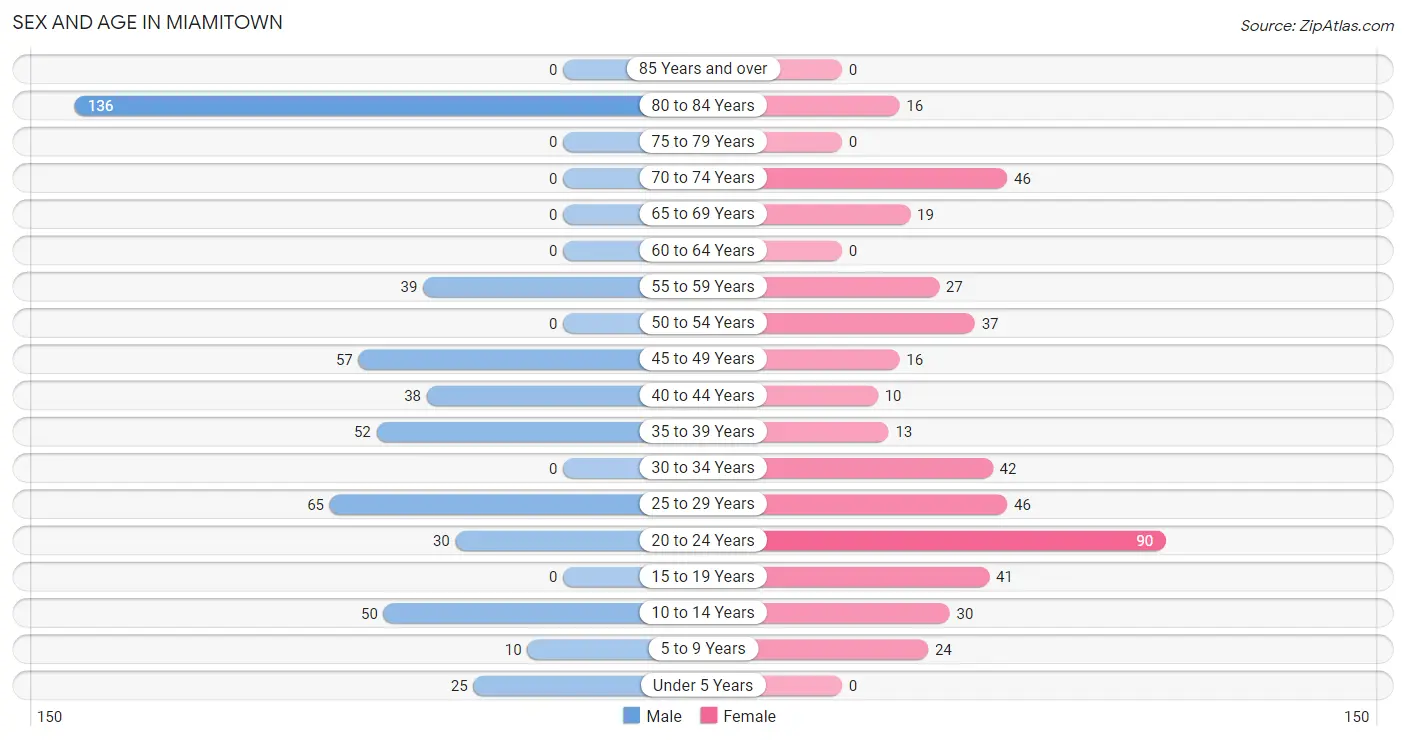
| Age Bracket | Male | Female |
| Under 5 Years | 25 (5.0%) | 0 (0.0%) |
| 5 to 9 Years | 10 (2.0%) | 24 (5.2%) |
| 10 to 14 Years | 50 (10.0%) | 30 (6.6%) |
| 15 to 19 Years | 0 (0.0%) | 41 (9.0%) |
| 20 to 24 Years | 30 (6.0%) | 90 (19.7%) |
| 25 to 29 Years | 65 (13.0%) | 46 (10.1%) |
| 30 to 34 Years | 0 (0.0%) | 42 (9.2%) |
| 35 to 39 Years | 52 (10.4%) | 13 (2.8%) |
| 40 to 44 Years | 38 (7.6%) | 10 (2.2%) |
| 45 to 49 Years | 57 (11.4%) | 16 (3.5%) |
| 50 to 54 Years | 0 (0.0%) | 37 (8.1%) |
| 55 to 59 Years | 39 (7.8%) | 27 (5.9%) |
| 60 to 64 Years | 0 (0.0%) | 0 (0.0%) |
| 65 to 69 Years | 0 (0.0%) | 19 (4.2%) |
| 70 to 74 Years | 0 (0.0%) | 46 (10.1%) |
| 75 to 79 Years | 0 (0.0%) | 0 (0.0%) |
| 80 to 84 Years | 136 (27.1%) | 16 (3.5%) |
| 85 Years and over | 0 (0.0%) | 0 (0.0%) |
| Total | 502 (100.0%) | 457 (100.0%) |
Families and Households in Miamitown
Median Family Size in Miamitown
The median family size in Miamitown is 2.76 persons per family, with married-couple families (87 | 54.4%) accounting for the largest median family size of 3.48 persons per family. On the other hand, single male/father families (41 | 25.6%) represent the smallest median family size with 1.90 persons per family.
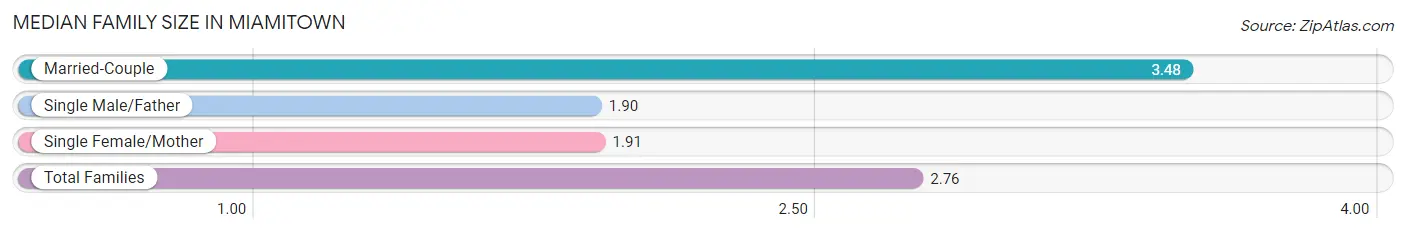
| Family Type | # Families | Family Size |
| Married-Couple | 87 (54.4%) | 3.48 |
| Single Male/Father | 41 (25.6%) | 1.90 |
| Single Female/Mother | 32 (20.0%) | 1.91 |
| Total Families | 160 (100.0%) | 2.76 |
Median Household Size in Miamitown
The median household size in Miamitown is 1.59 persons per household, with married-couple households (87 | 14.4%) accounting for the largest median household size of 3.48 persons per household. non-family households (443 | 73.5%) represent the smallest median household size with 1.14 persons per household.
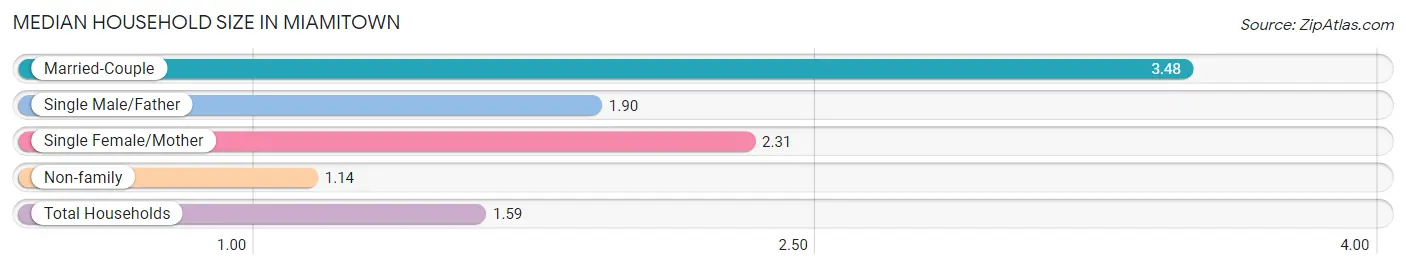
| Household Type | # Households | Household Size |
| Married-Couple | 87 (14.4%) | 3.48 |
| Single Male/Father | 41 (6.8%) | 1.90 |
| Single Female/Mother | 32 (5.3%) | 2.31 |
| Non-family | 443 (73.5%) | 1.14 |
| Total Households | 603 (100.0%) | 1.59 |
Household Size by Marriage Status in Miamitown
Out of a total of 603 households in Miamitown, 160 (26.5%) are family households, while 443 (73.5%) are nonfamily households. The most numerous type of family households are 2-person households, comprising 99, and the most common type of nonfamily households are 1-person households, comprising 382.
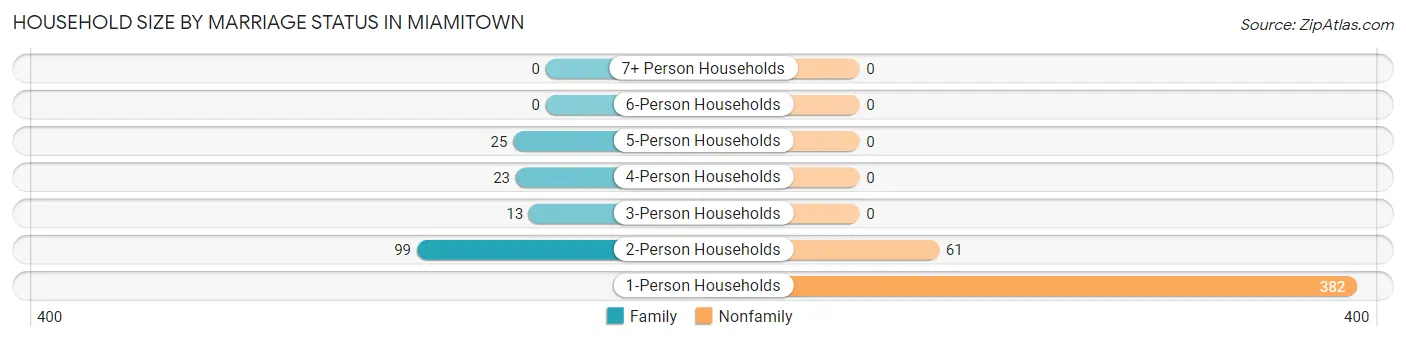
| Household Size | Family Households | Nonfamily Households |
| 1-Person Households | - | 382 (63.3%) |
| 2-Person Households | 99 (16.4%) | 61 (10.1%) |
| 3-Person Households | 13 (2.2%) | 0 (0.0%) |
| 4-Person Households | 23 (3.8%) | 0 (0.0%) |
| 5-Person Households | 25 (4.2%) | 0 (0.0%) |
| 6-Person Households | 0 (0.0%) | 0 (0.0%) |
| 7+ Person Households | 0 (0.0%) | 0 (0.0%) |
| Total | 160 (26.5%) | 443 (73.5%) |
Female Fertility in Miamitown
Fertility by Age in Miamitown
Average fertility rate in Miamitown is 78.0 births per 1,000 women. Women in the age bracket of 20 to 34 years have the highest fertility rate with 129.0 births per 1,000 women. Women in the age bracket of 20 to 34 years acount for 100.0% of all women with births.
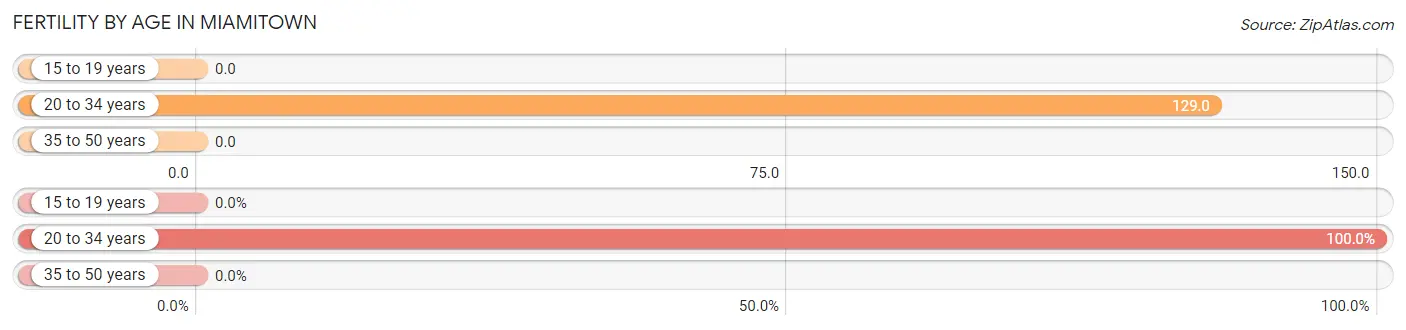
| Age Bracket | Women with Births | Births / 1,000 Women |
| 15 to 19 years | 0 (0.0%) | 0.0 |
| 20 to 34 years | 23 (100.0%) | 129.0 |
| 35 to 50 years | 0 (0.0%) | 0.0 |
| Total | 23 (100.0%) | 78.0 |
Fertility by Age by Marriage Status in Miamitown
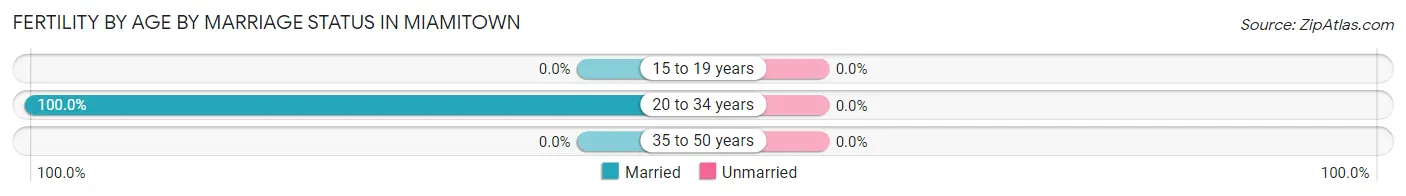
| Age Bracket | Married | Unmarried |
| 15 to 19 years | 0 (0.0%) | 0 (0.0%) |
| 20 to 34 years | 23 (100.0%) | 0 (0.0%) |
| 35 to 50 years | 0 (0.0%) | 0 (0.0%) |
| Total | 23 (100.0%) | 0 (0.0%) |
Fertility by Education in Miamitown
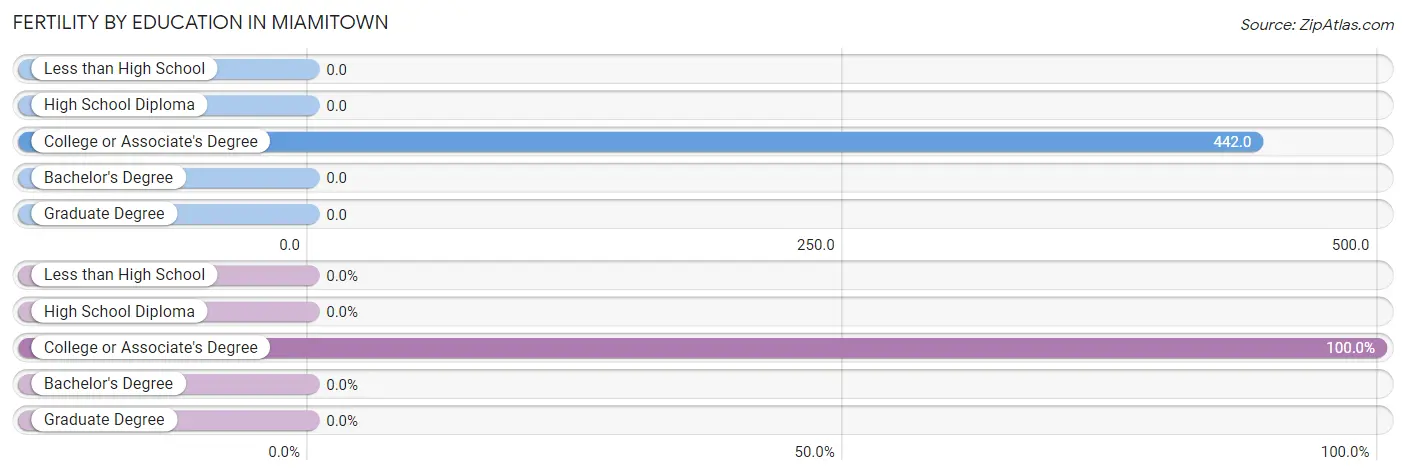
| Educational Attainment | Women with Births | Births / 1,000 Women |
| Less than High School | 0 (0.0%) | 0.0 |
| High School Diploma | 0 (0.0%) | 0.0 |
| College or Associate's Degree | 23 (100.0%) | 442.0 |
| Bachelor's Degree | 0 (0.0%) | 0.0 |
| Graduate Degree | 0 (0.0%) | 0.0 |
| Total | 23 (100.0%) | 78.0 |
Fertility by Education by Marriage Status in Miamitown
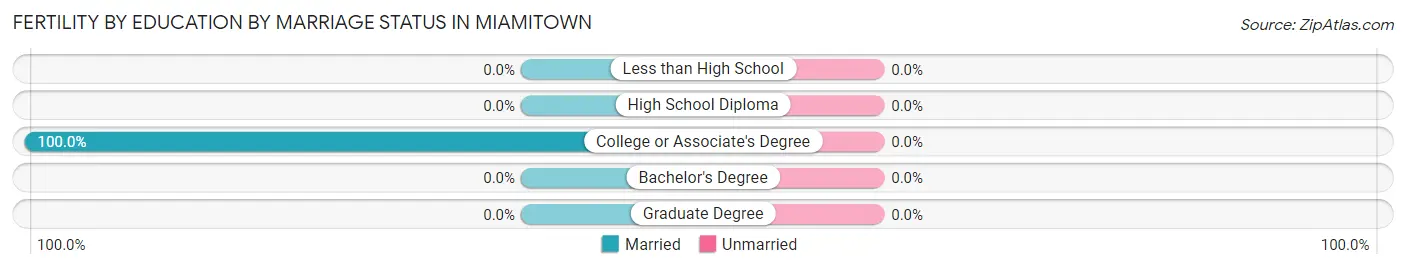
| Educational Attainment | Married | Unmarried |
| Less than High School | 0 (0.0%) | 0 (0.0%) |
| High School Diploma | 0 (0.0%) | 0 (0.0%) |
| College or Associate's Degree | 23 (100.0%) | 0 (0.0%) |
| Bachelor's Degree | 0 (0.0%) | 0 (0.0%) |
| Graduate Degree | 0 (0.0%) | 0 (0.0%) |
| Total | 23 (100.0%) | 0 (0.0%) |
Employment Characteristics in Miamitown
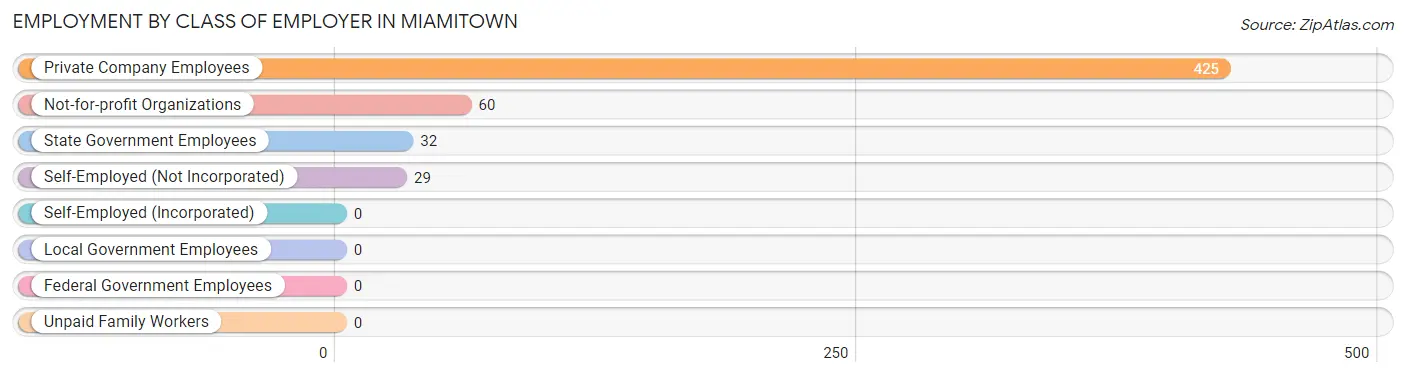
Employment by Class of Employer in Miamitown
Among the 546 employed individuals in Miamitown, private company employees (425 | 77.8%), not-for-profit organizations (60 | 11.0%), and state government employees (32 | 5.9%) make up the most common classes of employment.
| Employer Class | # Employees | % Employees |
| Private Company Employees | 425 | 77.8% |
| Self-Employed (Incorporated) | 0 | 0.0% |
| Self-Employed (Not Incorporated) | 29 | 5.3% |
| Not-for-profit Organizations | 60 | 11.0% |
| Local Government Employees | 0 | 0.0% |
| State Government Employees | 32 | 5.9% |
| Federal Government Employees | 0 | 0.0% |
| Unpaid Family Workers | 0 | 0.0% |
| Total | 546 | 100.0% |
Employment Status by Age in Miamitown
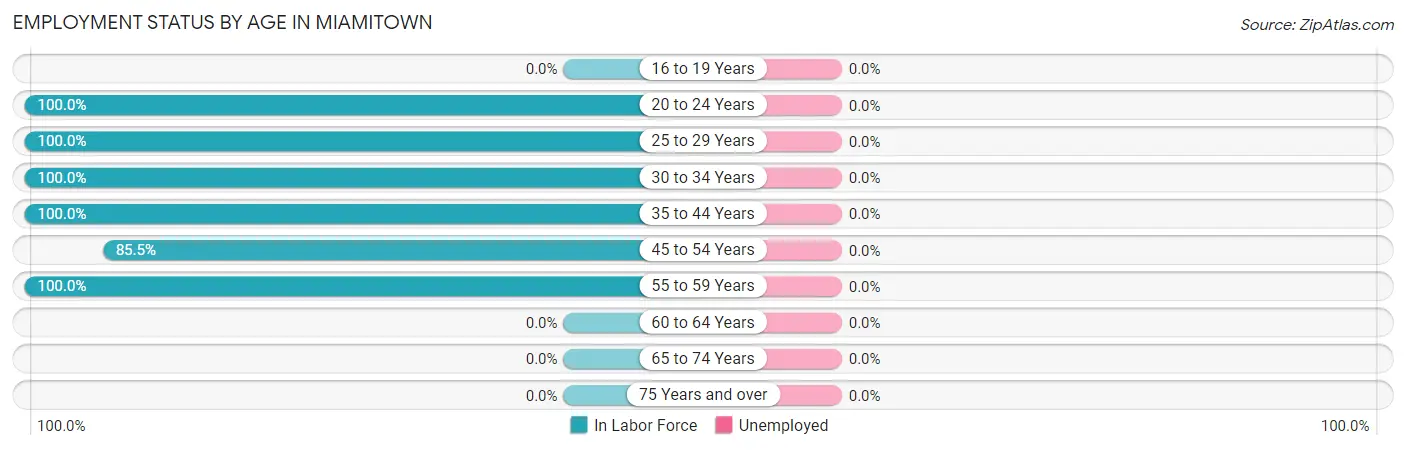
| Age Bracket | In Labor Force | Unemployed |
| 16 to 19 Years | 0 (0.0%) | 0 (0.0%) |
| 20 to 24 Years | 120 (100.0%) | 0 (0.0%) |
| 25 to 29 Years | 111 (100.0%) | 0 (0.0%) |
| 30 to 34 Years | 42 (100.0%) | 0 (0.0%) |
| 35 to 44 Years | 113 (100.0%) | 0 (0.0%) |
| 45 to 54 Years | 94 (85.5%) | 0 (0.0%) |
| 55 to 59 Years | 66 (100.0%) | 0 (0.0%) |
| 60 to 64 Years | 0 (0.0%) | 0 (0.0%) |
| 65 to 74 Years | 0 (0.0%) | 0 (0.0%) |
| 75 Years and over | 0 (0.0%) | 0 (0.0%) |
| Total | 546 (66.6%) | 0 (0.0%) |
Employment Status by Educational Attainment in Miamitown
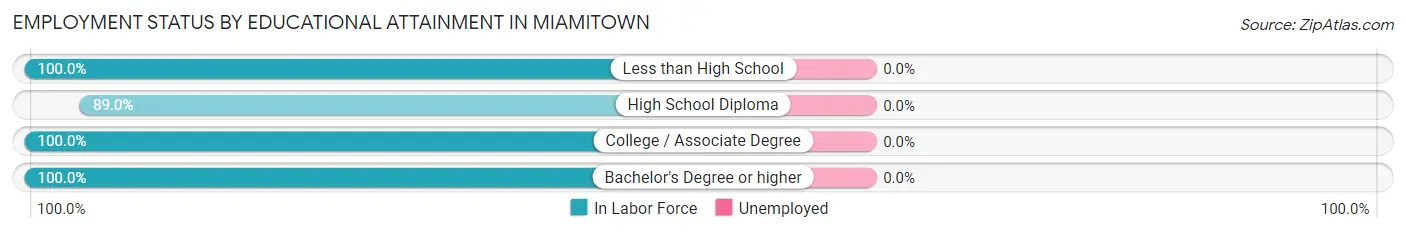
| Educational Attainment | In Labor Force | Unemployed |
| Less than High School | 16 (100.0%) | 0 (0.0%) |
| High School Diploma | 129 (89.0%) | 0 (0.0%) |
| College / Associate Degree | 175 (100.0%) | 0 (0.0%) |
| Bachelor's Degree or higher | 106 (100.0%) | 0 (0.0%) |
| Total | 426 (96.4%) | 0 (0.0%) |
Employment Occupations by Sex in Miamitown
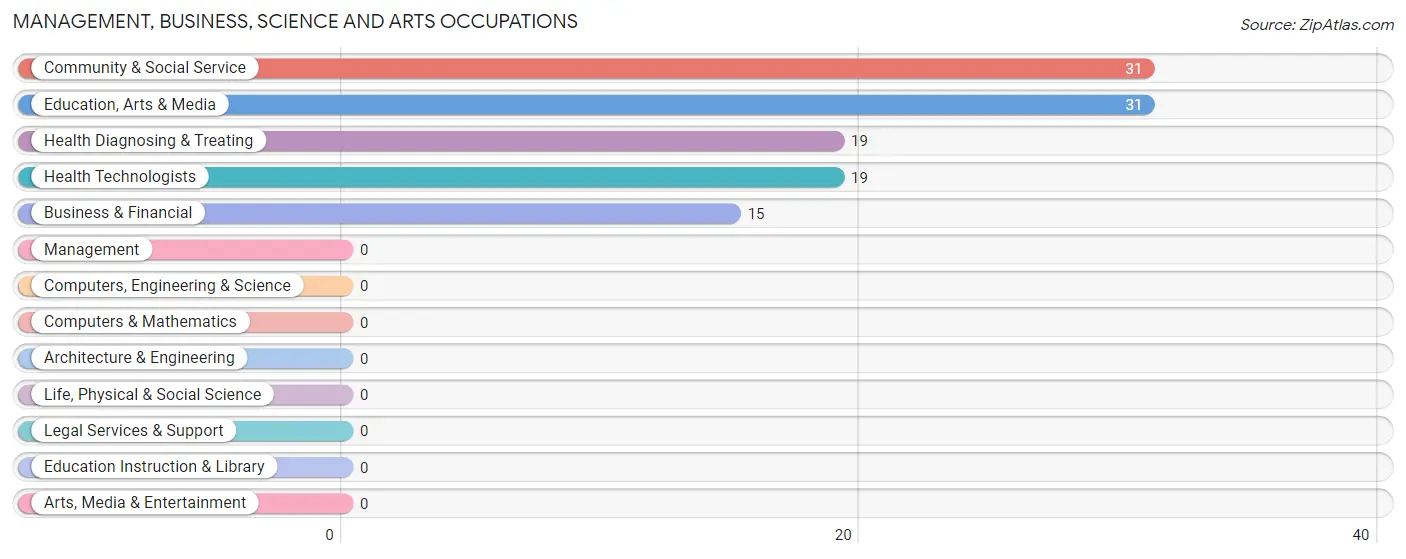
Management, Business, Science and Arts Occupations
The most common Management, Business, Science and Arts occupations in Miamitown are Community & Social Service (31 | 5.7%), Education, Arts & Media (31 | 5.7%), Health Diagnosing & Treating (19 | 3.5%), Health Technologists (19 | 3.5%), and Business & Financial (15 | 2.8%).
Management, Business, Science and Arts Occupations by Sex
Within the Management, Business, Science and Arts occupations in Miamitown, the most male-oriented occupations are Business & Financial (100.0%), Community & Social Service (45.2%), and Education, Arts & Media (45.2%), while the most female-oriented occupations are Health Diagnosing & Treating (100.0%), Health Technologists (100.0%), and Community & Social Service (54.8%).
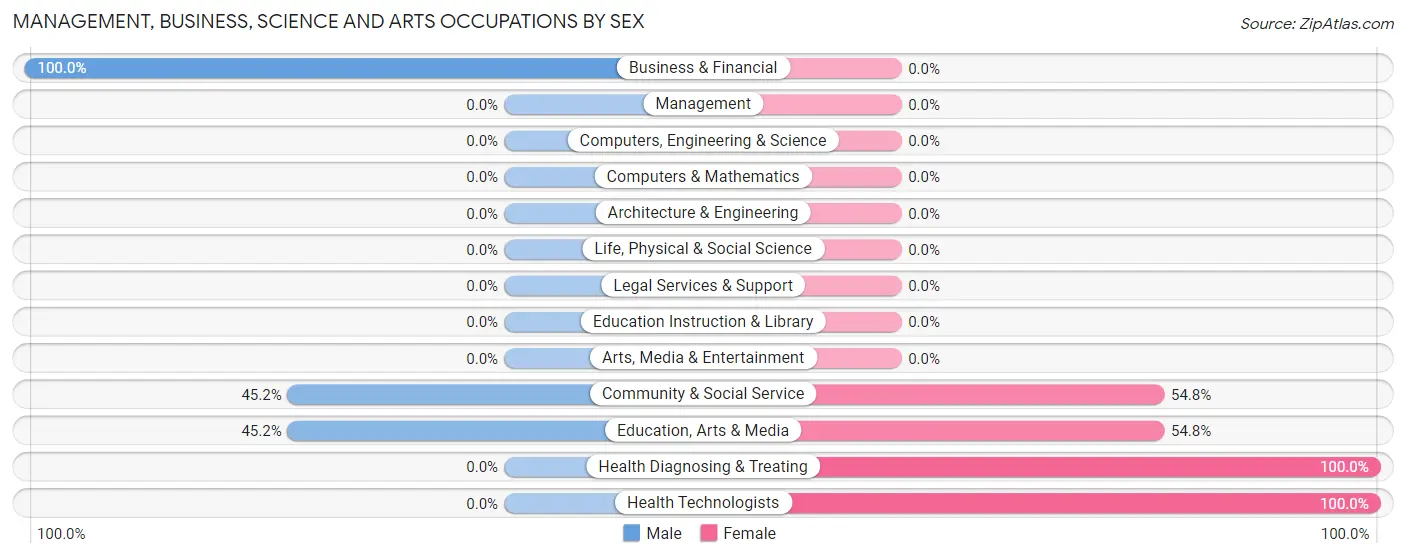
| Occupation | Male | Female |
| Management | 0 (0.0%) | 0 (0.0%) |
| Business & Financial | 15 (100.0%) | 0 (0.0%) |
| Computers, Engineering & Science | 0 (0.0%) | 0 (0.0%) |
| Computers & Mathematics | 0 (0.0%) | 0 (0.0%) |
| Architecture & Engineering | 0 (0.0%) | 0 (0.0%) |
| Life, Physical & Social Science | 0 (0.0%) | 0 (0.0%) |
| Community & Social Service | 14 (45.2%) | 17 (54.8%) |
| Education, Arts & Media | 14 (45.2%) | 17 (54.8%) |
| Legal Services & Support | 0 (0.0%) | 0 (0.0%) |
| Education Instruction & Library | 0 (0.0%) | 0 (0.0%) |
| Arts, Media & Entertainment | 0 (0.0%) | 0 (0.0%) |
| Health Diagnosing & Treating | 0 (0.0%) | 19 (100.0%) |
| Health Technologists | 0 (0.0%) | 19 (100.0%) |
| Total (Category) | 29 (44.6%) | 36 (55.4%) |
| Total (Overall) | 281 (51.5%) | 265 (48.5%) |
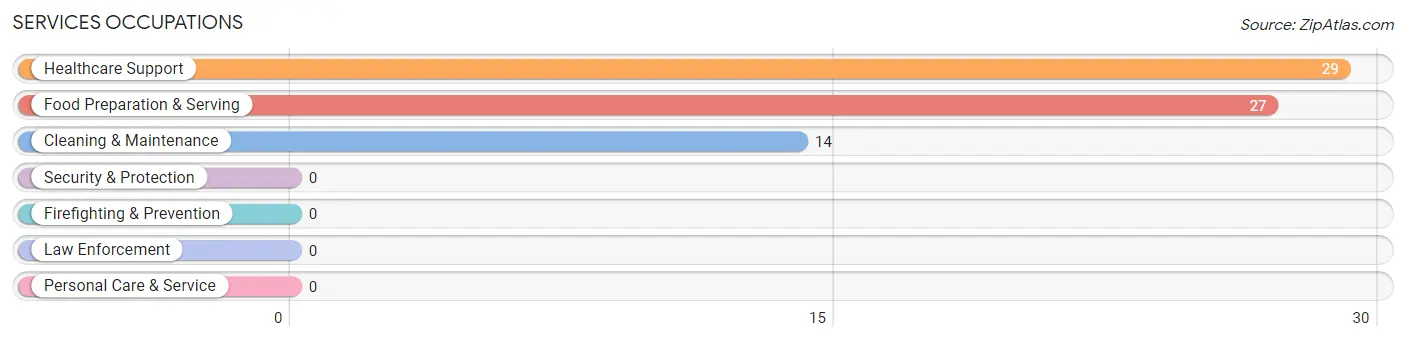
Services Occupations
The most common Services occupations in Miamitown are Healthcare Support (29 | 5.3%), Food Preparation & Serving (27 | 5.0%), and Cleaning & Maintenance (14 | 2.6%).
Services Occupations by Sex
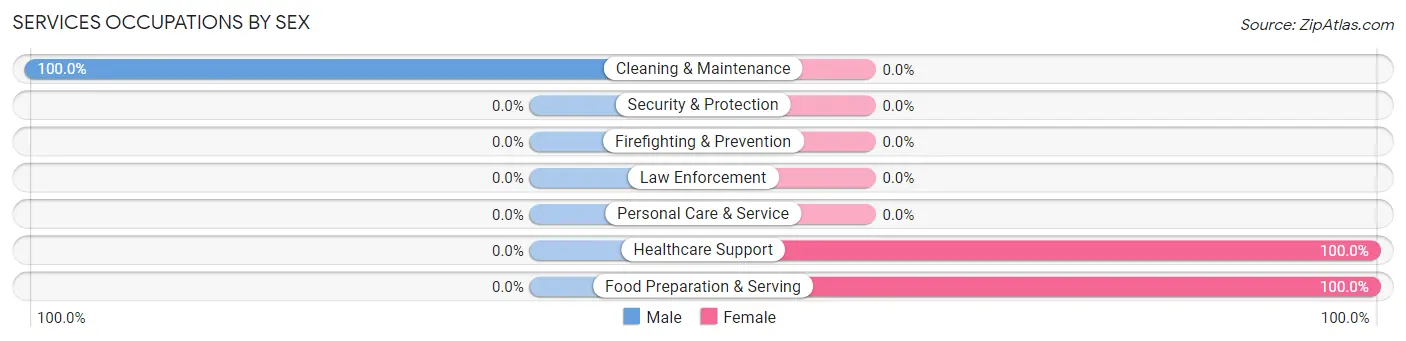
| Occupation | Male | Female |
| Healthcare Support | 0 (0.0%) | 29 (100.0%) |
| Security & Protection | 0 (0.0%) | 0 (0.0%) |
| Firefighting & Prevention | 0 (0.0%) | 0 (0.0%) |
| Law Enforcement | 0 (0.0%) | 0 (0.0%) |
| Food Preparation & Serving | 0 (0.0%) | 27 (100.0%) |
| Cleaning & Maintenance | 14 (100.0%) | 0 (0.0%) |
| Personal Care & Service | 0 (0.0%) | 0 (0.0%) |
| Total (Category) | 14 (20.0%) | 56 (80.0%) |
| Total (Overall) | 281 (51.5%) | 265 (48.5%) |
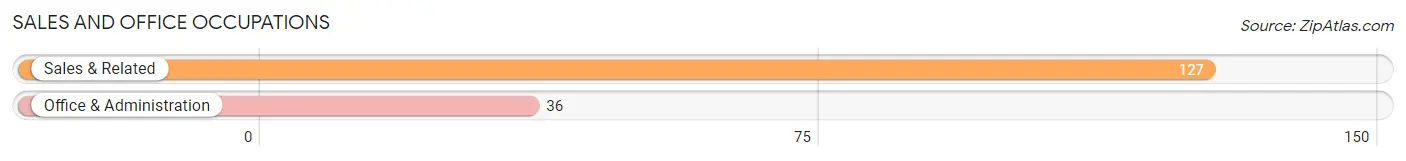
Sales and Office Occupations
The most common Sales and Office occupations in Miamitown are Sales & Related (127 | 23.3%), and Office & Administration (36 | 6.6%).
Sales and Office Occupations by Sex
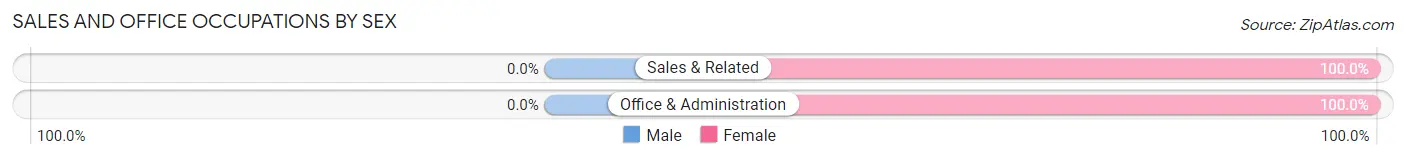
| Occupation | Male | Female |
| Sales & Related | 0 (0.0%) | 127 (100.0%) |
| Office & Administration | 0 (0.0%) | 36 (100.0%) |
| Total (Category) | 0 (0.0%) | 163 (100.0%) |
| Total (Overall) | 281 (51.5%) | 265 (48.5%) |
Natural Resources, Construction and Maintenance Occupations
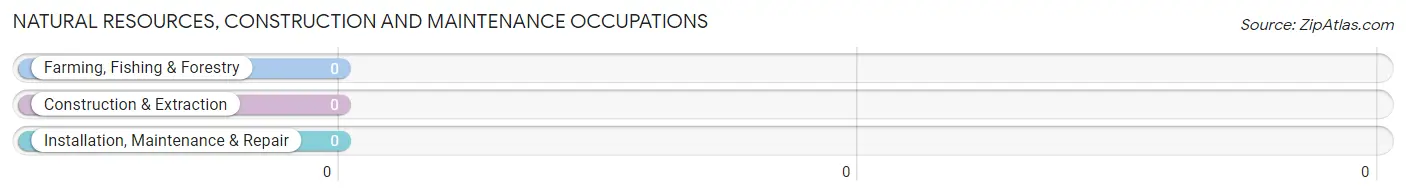
Natural Resources, Construction and Maintenance Occupations by Sex
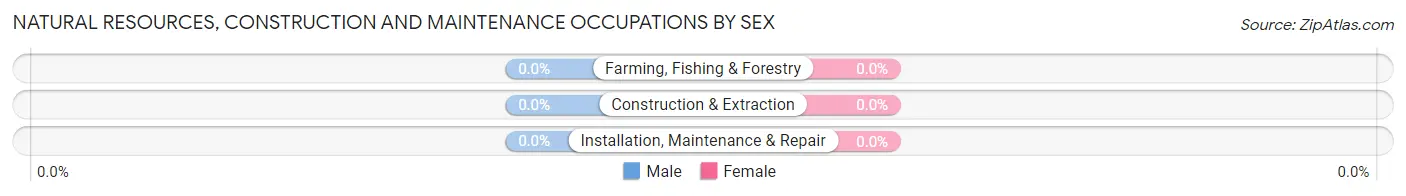
| Occupation | Male | Female |
| Farming, Fishing & Forestry | 0 (0.0%) | 0 (0.0%) |
| Construction & Extraction | 0 (0.0%) | 0 (0.0%) |
| Installation, Maintenance & Repair | 0 (0.0%) | 0 (0.0%) |
| Total (Category) | 0 (0.0%) | 0 (0.0%) |
| Total (Overall) | 281 (51.5%) | 265 (48.5%) |
Production, Transportation and Moving Occupations
The most common Production, Transportation and Moving occupations in Miamitown are Production (125 | 22.9%), Transportation (100 | 18.3%), and Material Moving (23 | 4.2%).
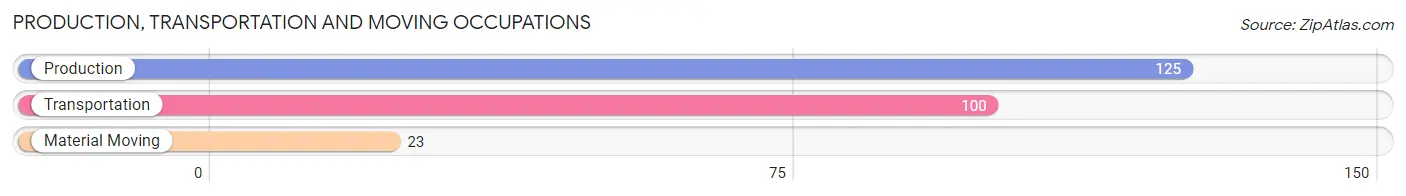
Production, Transportation and Moving Occupations by Sex
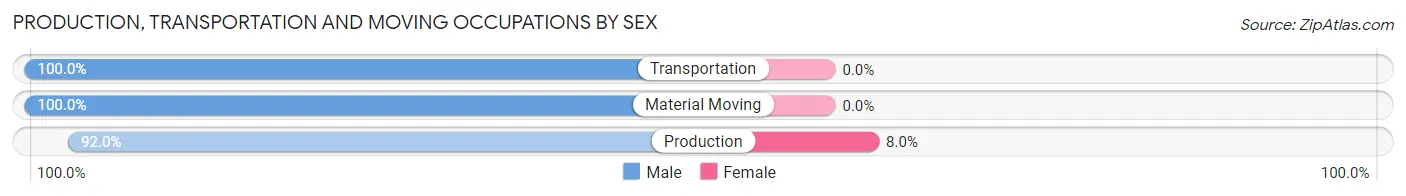
| Occupation | Male | Female |
| Production | 115 (92.0%) | 10 (8.0%) |
| Transportation | 100 (100.0%) | 0 (0.0%) |
| Material Moving | 23 (100.0%) | 0 (0.0%) |
| Total (Category) | 238 (96.0%) | 10 (4.0%) |
| Total (Overall) | 281 (51.5%) | 265 (48.5%) |
Employment Industries by Sex in Miamitown
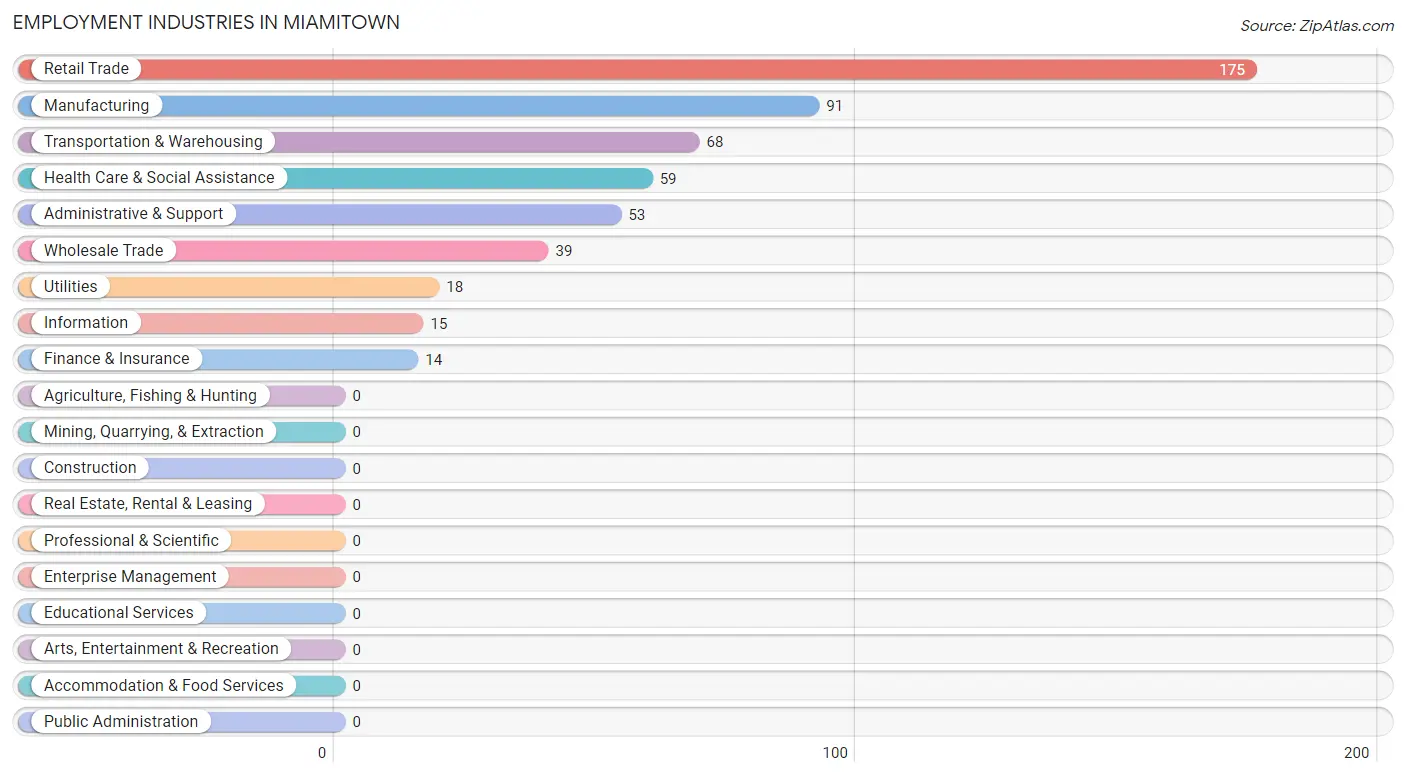
Employment Industries in Miamitown
The major employment industries in Miamitown include Retail Trade (175 | 32.1%), Manufacturing (91 | 16.7%), Transportation & Warehousing (68 | 12.4%), Health Care & Social Assistance (59 | 10.8%), and Administrative & Support (53 | 9.7%).
Employment Industries by Sex in Miamitown
The Miamitown industries that see more men than women are Wholesale Trade (100.0%), Utilities (100.0%), and Information (100.0%), whereas the industries that tend to have a higher number of women are Finance & Insurance (100.0%), Retail Trade (90.9%), and Health Care & Social Assistance (78.0%).
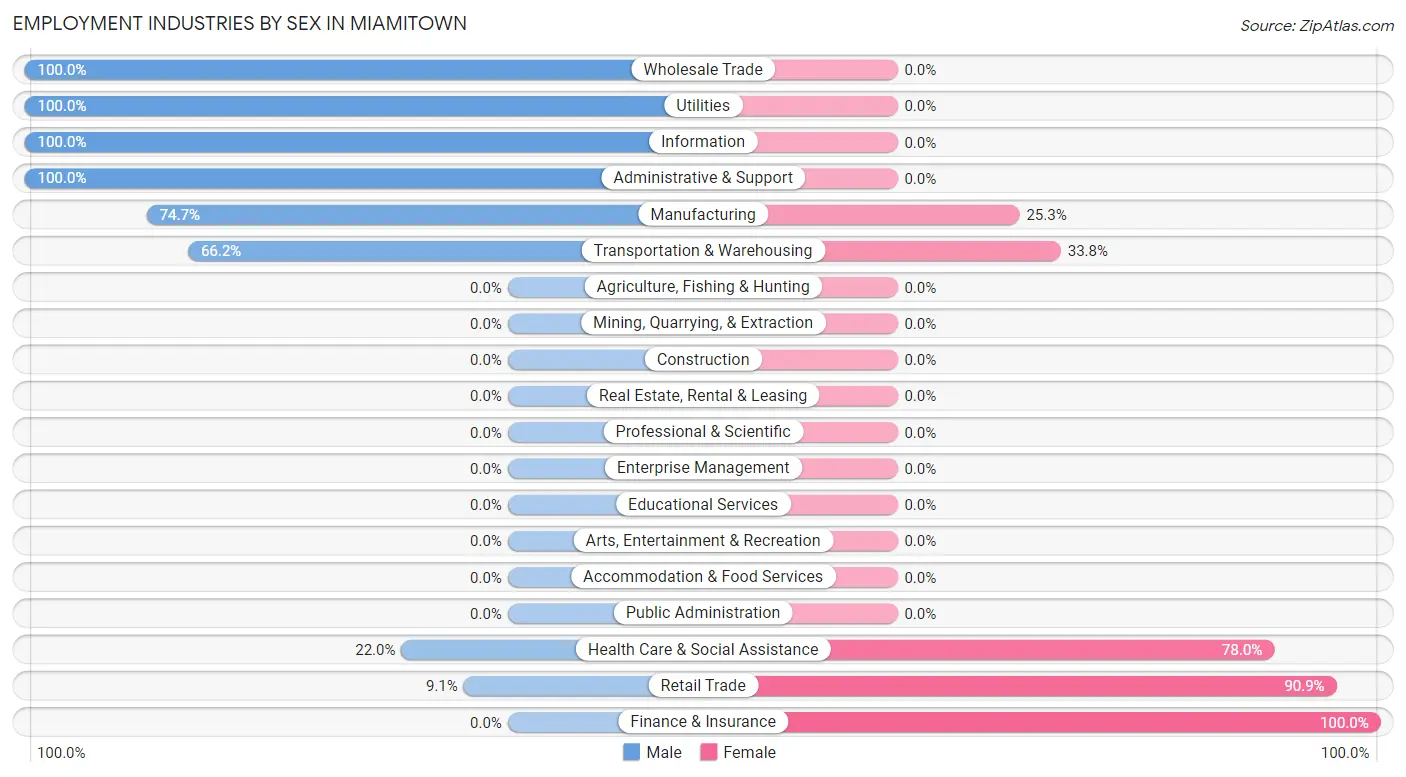
| Industry | Male | Female |
| Agriculture, Fishing & Hunting | 0 (0.0%) | 0 (0.0%) |
| Mining, Quarrying, & Extraction | 0 (0.0%) | 0 (0.0%) |
| Construction | 0 (0.0%) | 0 (0.0%) |
| Manufacturing | 68 (74.7%) | 23 (25.3%) |
| Wholesale Trade | 39 (100.0%) | 0 (0.0%) |
| Retail Trade | 16 (9.1%) | 159 (90.9%) |
| Transportation & Warehousing | 45 (66.2%) | 23 (33.8%) |
| Utilities | 18 (100.0%) | 0 (0.0%) |
| Information | 15 (100.0%) | 0 (0.0%) |
| Finance & Insurance | 0 (0.0%) | 14 (100.0%) |
| Real Estate, Rental & Leasing | 0 (0.0%) | 0 (0.0%) |
| Professional & Scientific | 0 (0.0%) | 0 (0.0%) |
| Enterprise Management | 0 (0.0%) | 0 (0.0%) |
| Administrative & Support | 53 (100.0%) | 0 (0.0%) |
| Educational Services | 0 (0.0%) | 0 (0.0%) |
| Health Care & Social Assistance | 13 (22.0%) | 46 (78.0%) |
| Arts, Entertainment & Recreation | 0 (0.0%) | 0 (0.0%) |
| Accommodation & Food Services | 0 (0.0%) | 0 (0.0%) |
| Public Administration | 0 (0.0%) | 0 (0.0%) |
| Total | 281 (51.5%) | 265 (48.5%) |
Education in Miamitown
School Enrollment in Miamitown
The most common levels of schooling among the 172 students in Miamitown are middle school (60 | 34.9%), college / undergraduate (46 | 26.7%), and elementary school (44 | 25.6%).
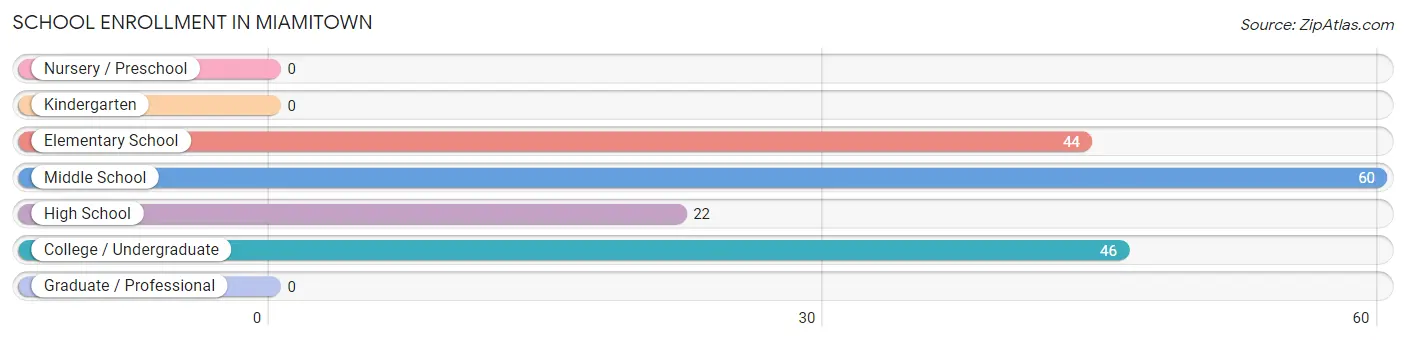
| School Level | # Students | % Students |
| Nursery / Preschool | 0 | 0.0% |
| Kindergarten | 0 | 0.0% |
| Elementary School | 44 | 25.6% |
| Middle School | 60 | 34.9% |
| High School | 22 | 12.8% |
| College / Undergraduate | 46 | 26.7% |
| Graduate / Professional | 0 | 0.0% |
| Total | 172 | 100.0% |
School Enrollment by Age by Funding Source in Miamitown
Out of a total of 172 students who are enrolled in schools in Miamitown, 10 (5.8%) attend a private institution, while the remaining 162 (94.2%) are enrolled in public schools. The age group of 5 to 9 year old has the highest likelihood of being enrolled in private schools, with 10 (29.4% in the age bracket) enrolled. Conversely, the age group of 10 to 14 year olds has the lowest likelihood of being enrolled in a private school, with 80 (100.0% in the age bracket) attending a public institution.
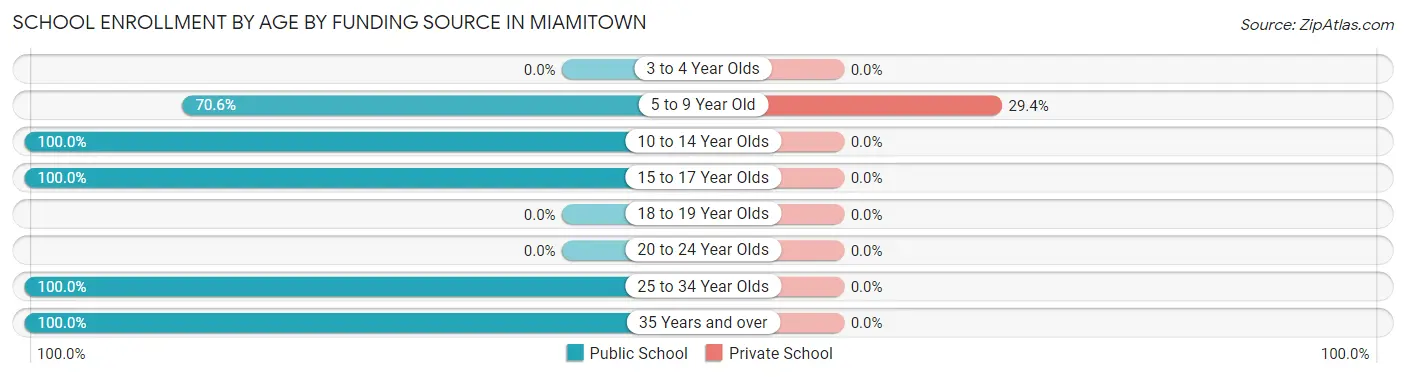
| Age Bracket | Public School | Private School |
| 3 to 4 Year Olds | 0 (0.0%) | 0 (0.0%) |
| 5 to 9 Year Old | 24 (70.6%) | 10 (29.4%) |
| 10 to 14 Year Olds | 80 (100.0%) | 0 (0.0%) |
| 15 to 17 Year Olds | 12 (100.0%) | 0 (0.0%) |
| 18 to 19 Year Olds | 0 (0.0%) | 0 (0.0%) |
| 20 to 24 Year Olds | 0 (0.0%) | 0 (0.0%) |
| 25 to 34 Year Olds | 23 (100.0%) | 0 (0.0%) |
| 35 Years and over | 23 (100.0%) | 0 (0.0%) |
| Total | 162 (94.2%) | 10 (5.8%) |
Educational Attainment by Field of Study in Miamitown
Physical & health sciences (37 | 28.7%), visual & performing arts (37 | 28.7%), arts & humanities (32 | 24.8%), psychology (17 | 13.2%), and education (6 | 4.6%) are the most common fields of study among 129 individuals in Miamitown who have obtained a bachelor's degree or higher.
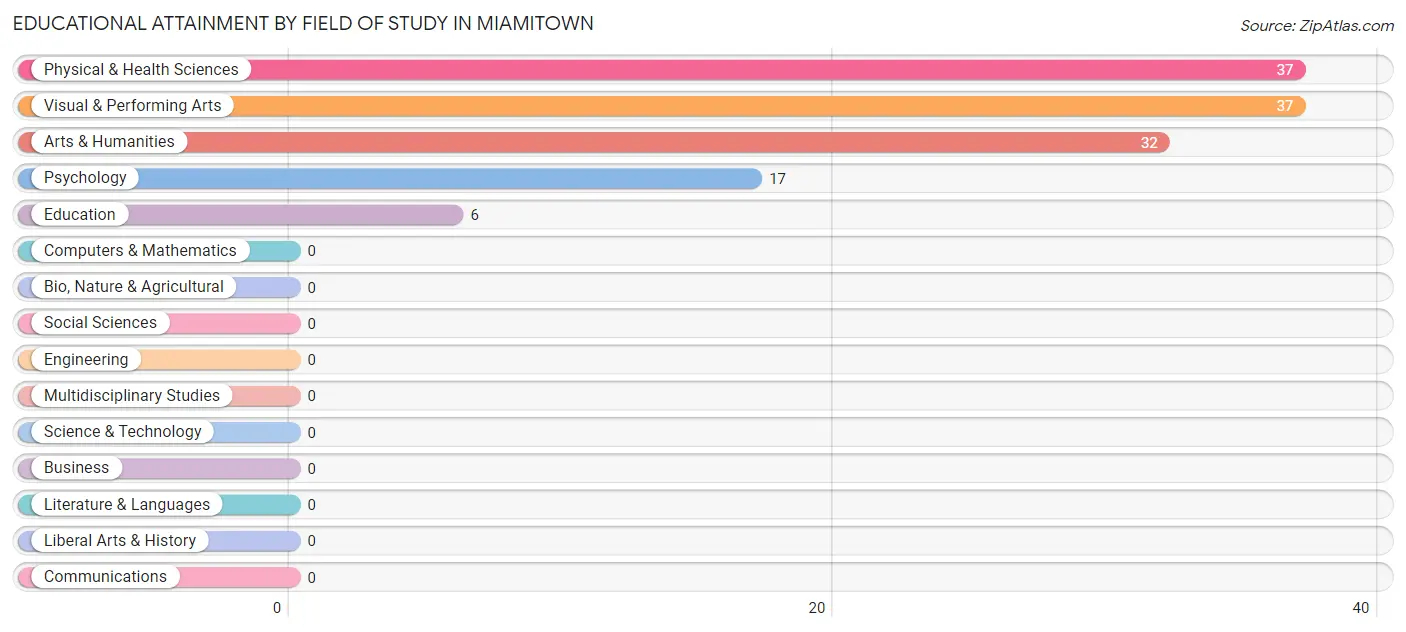
| Field of Study | # Graduates | % Graduates |
| Computers & Mathematics | 0 | 0.0% |
| Bio, Nature & Agricultural | 0 | 0.0% |
| Physical & Health Sciences | 37 | 28.7% |
| Psychology | 17 | 13.2% |
| Social Sciences | 0 | 0.0% |
| Engineering | 0 | 0.0% |
| Multidisciplinary Studies | 0 | 0.0% |
| Science & Technology | 0 | 0.0% |
| Business | 0 | 0.0% |
| Education | 6 | 4.6% |
| Literature & Languages | 0 | 0.0% |
| Liberal Arts & History | 0 | 0.0% |
| Visual & Performing Arts | 37 | 28.7% |
| Communications | 0 | 0.0% |
| Arts & Humanities | 32 | 24.8% |
| Total | 129 | 100.0% |
Transportation & Commute in Miamitown
Vehicle Availability by Sex in Miamitown
The most prevalent vehicle ownership categories in Miamitown are males with 2 vehicles (195, accounting for 69.4%) and females with 2 vehicles (145, making up 73.6%).
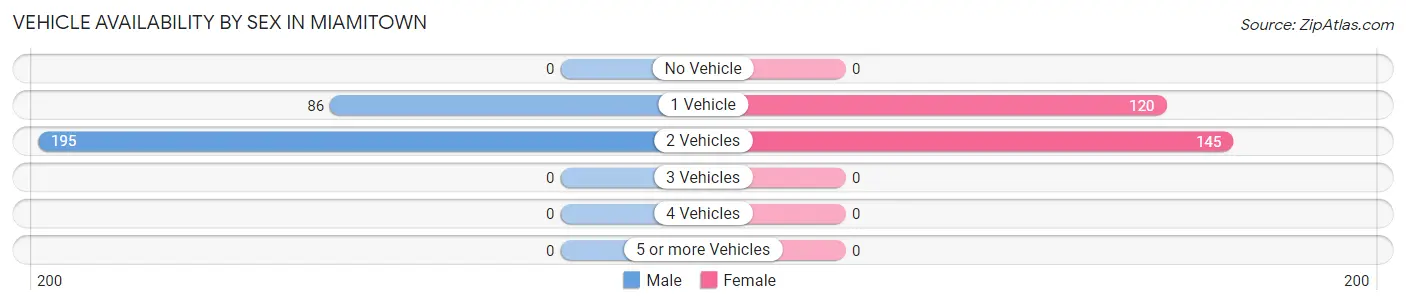
| Vehicles Available | Male | Female |
| No Vehicle | 0 (0.0%) | 0 (0.0%) |
| 1 Vehicle | 86 (30.6%) | 120 (45.3%) |
| 2 Vehicles | 195 (69.4%) | 145 (54.7%) |
| 3 Vehicles | 0 (0.0%) | 0 (0.0%) |
| 4 Vehicles | 0 (0.0%) | 0 (0.0%) |
| 5 or more Vehicles | 0 (0.0%) | 0 (0.0%) |
| Total | 281 (100.0%) | 265 (100.0%) |
Commute Time in Miamitown
The most frequently occuring commute durations in Miamitown are 30 to 34 minutes (225 commuters, 42.3%), 45 to 59 minutes (99 commuters, 18.6%), and 15 to 19 minutes (95 commuters, 17.9%).
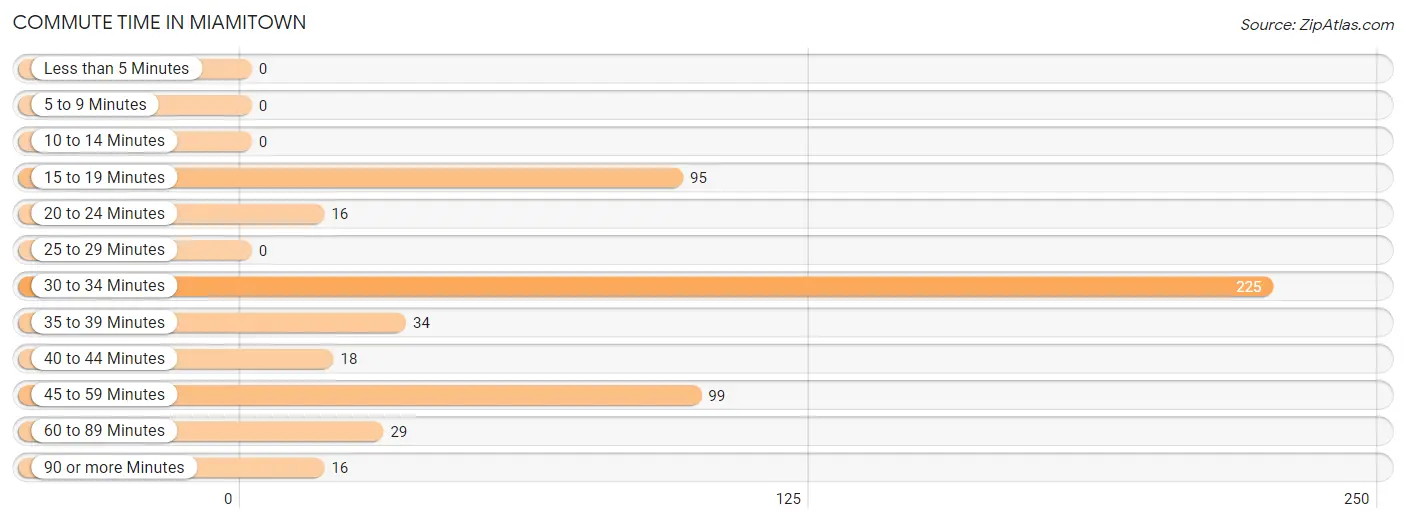
| Commute Time | # Commuters | % Commuters |
| Less than 5 Minutes | 0 | 0.0% |
| 5 to 9 Minutes | 0 | 0.0% |
| 10 to 14 Minutes | 0 | 0.0% |
| 15 to 19 Minutes | 95 | 17.9% |
| 20 to 24 Minutes | 16 | 3.0% |
| 25 to 29 Minutes | 0 | 0.0% |
| 30 to 34 Minutes | 225 | 42.3% |
| 35 to 39 Minutes | 34 | 6.4% |
| 40 to 44 Minutes | 18 | 3.4% |
| 45 to 59 Minutes | 99 | 18.6% |
| 60 to 89 Minutes | 29 | 5.4% |
| 90 or more Minutes | 16 | 3.0% |
Commute Time by Sex in Miamitown
The most common commute times in Miamitown are 45 to 59 minutes (80 commuters, 30.0%) for males and 30 to 34 minutes (151 commuters, 57.0%) for females.
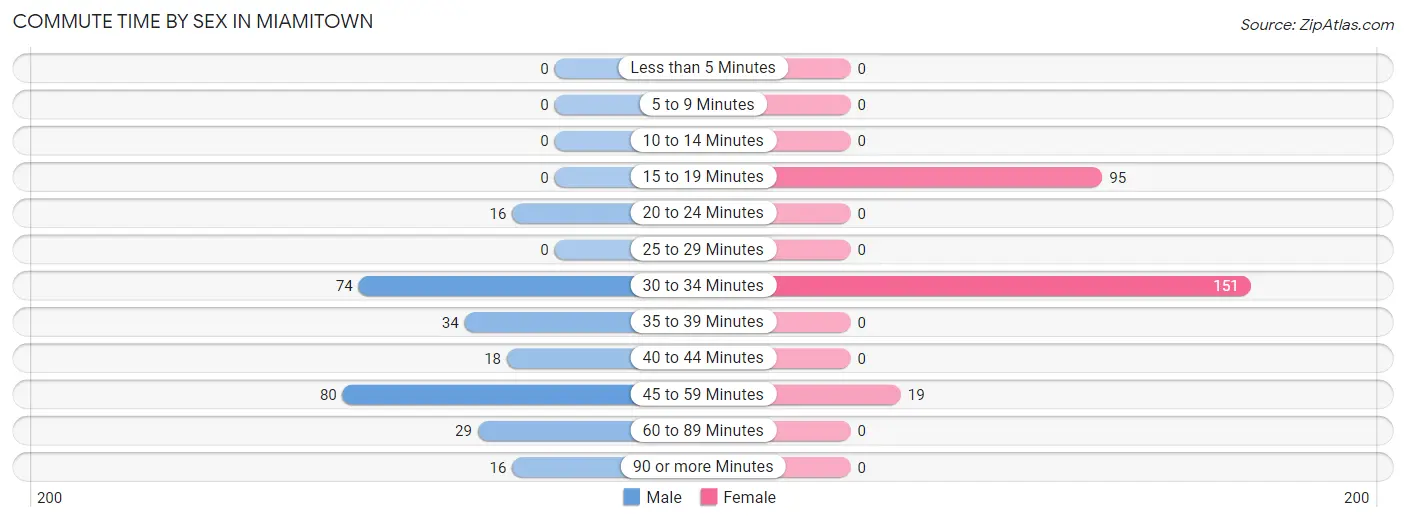
| Commute Time | Male | Female |
| Less than 5 Minutes | 0 (0.0%) | 0 (0.0%) |
| 5 to 9 Minutes | 0 (0.0%) | 0 (0.0%) |
| 10 to 14 Minutes | 0 (0.0%) | 0 (0.0%) |
| 15 to 19 Minutes | 0 (0.0%) | 95 (35.8%) |
| 20 to 24 Minutes | 16 (6.0%) | 0 (0.0%) |
| 25 to 29 Minutes | 0 (0.0%) | 0 (0.0%) |
| 30 to 34 Minutes | 74 (27.7%) | 151 (57.0%) |
| 35 to 39 Minutes | 34 (12.7%) | 0 (0.0%) |
| 40 to 44 Minutes | 18 (6.7%) | 0 (0.0%) |
| 45 to 59 Minutes | 80 (30.0%) | 19 (7.2%) |
| 60 to 89 Minutes | 29 (10.9%) | 0 (0.0%) |
| 90 or more Minutes | 16 (6.0%) | 0 (0.0%) |
Time of Departure to Work by Sex in Miamitown
The most frequent times of departure to work in Miamitown are 5:30 AM to 5:59 AM (88, 33.0%) for males and 8:00 AM to 8:29 AM (127, 47.9%) for females.
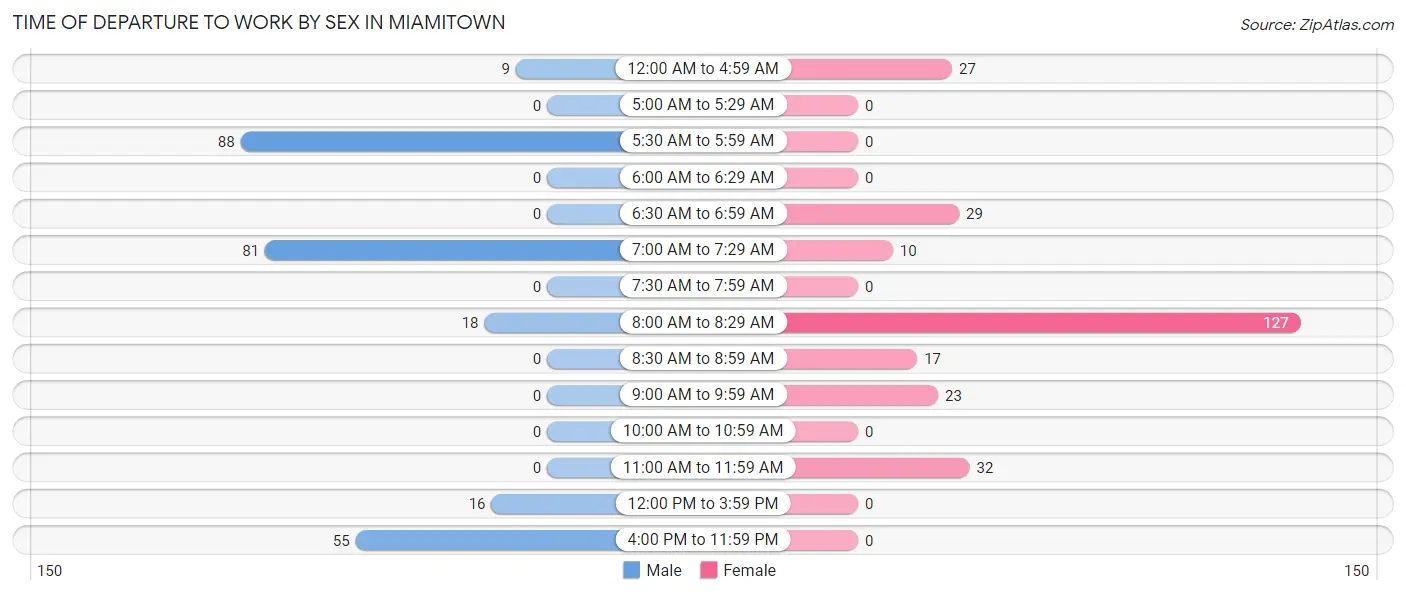
| Time of Departure | Male | Female |
| 12:00 AM to 4:59 AM | 9 (3.4%) | 27 (10.2%) |
| 5:00 AM to 5:29 AM | 0 (0.0%) | 0 (0.0%) |
| 5:30 AM to 5:59 AM | 88 (33.0%) | 0 (0.0%) |
| 6:00 AM to 6:29 AM | 0 (0.0%) | 0 (0.0%) |
| 6:30 AM to 6:59 AM | 0 (0.0%) | 29 (10.9%) |
| 7:00 AM to 7:29 AM | 81 (30.3%) | 10 (3.8%) |
| 7:30 AM to 7:59 AM | 0 (0.0%) | 0 (0.0%) |
| 8:00 AM to 8:29 AM | 18 (6.7%) | 127 (47.9%) |
| 8:30 AM to 8:59 AM | 0 (0.0%) | 17 (6.4%) |
| 9:00 AM to 9:59 AM | 0 (0.0%) | 23 (8.7%) |
| 10:00 AM to 10:59 AM | 0 (0.0%) | 0 (0.0%) |
| 11:00 AM to 11:59 AM | 0 (0.0%) | 32 (12.1%) |
| 12:00 PM to 3:59 PM | 16 (6.0%) | 0 (0.0%) |
| 4:00 PM to 11:59 PM | 55 (20.6%) | 0 (0.0%) |
| Total | 267 (100.0%) | 265 (100.0%) |
Housing Occupancy in Miamitown
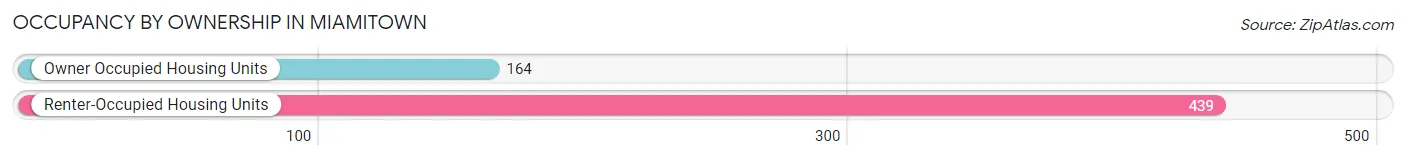
Occupancy by Ownership in Miamitown
Of the total 603 dwellings in Miamitown, owner-occupied units account for 164 (27.2%), while renter-occupied units make up 439 (72.8%).
| Occupancy | # Housing Units | % Housing Units |
| Owner Occupied Housing Units | 164 | 27.2% |
| Renter-Occupied Housing Units | 439 | 72.8% |
| Total Occupied Housing Units | 603 | 100.0% |
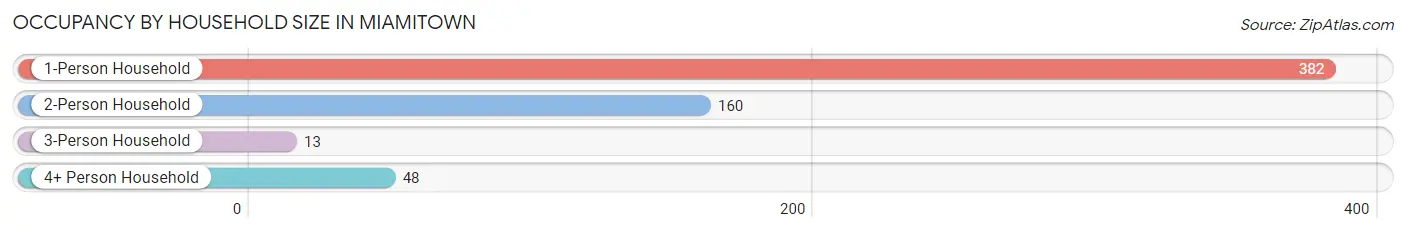
Occupancy by Household Size in Miamitown
| Household Size | # Housing Units | % Housing Units |
| 1-Person Household | 382 | 63.3% |
| 2-Person Household | 160 | 26.5% |
| 3-Person Household | 13 | 2.2% |
| 4+ Person Household | 48 | 8.0% |
| Total Housing Units | 603 | 100.0% |
Occupancy by Ownership by Household Size in Miamitown
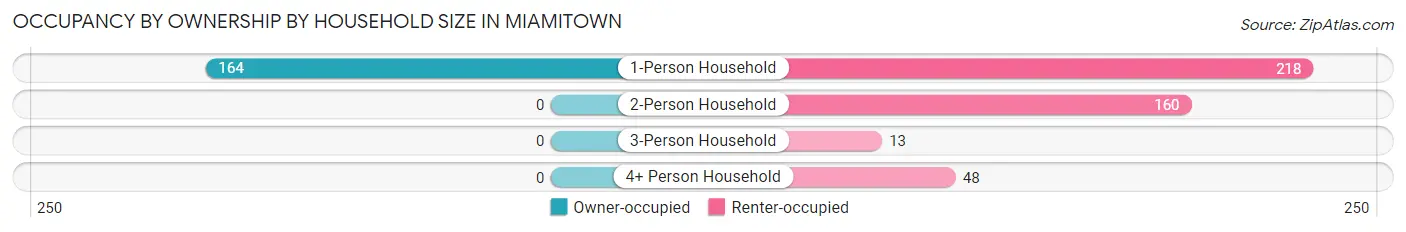
| Household Size | Owner-occupied | Renter-occupied |
| 1-Person Household | 164 (42.9%) | 218 (57.1%) |
| 2-Person Household | 0 (0.0%) | 160 (100.0%) |
| 3-Person Household | 0 (0.0%) | 13 (100.0%) |
| 4+ Person Household | 0 (0.0%) | 48 (100.0%) |
| Total Housing Units | 164 (27.2%) | 439 (72.8%) |
Occupancy by Educational Attainment in Miamitown
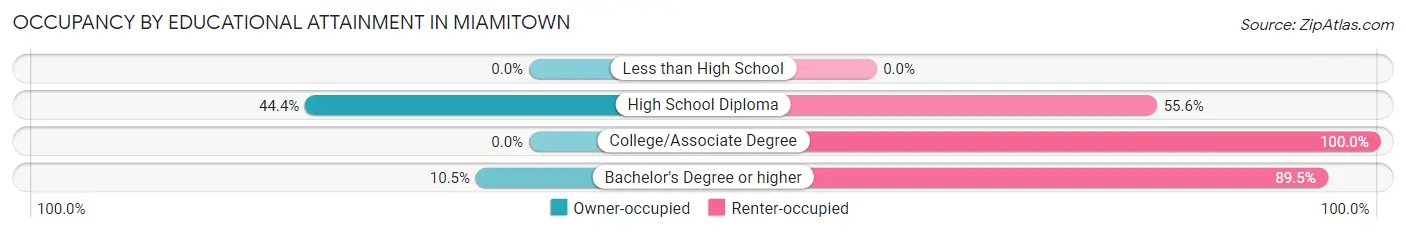
| Household Size | Owner-occupied | Renter-occupied |
| Less than High School | 0 (0.0%) | 0 (0.0%) |
| High School Diploma | 158 (44.4%) | 198 (55.6%) |
| College/Associate Degree | 0 (0.0%) | 190 (100.0%) |
| Bachelor's Degree or higher | 6 (10.5%) | 51 (89.5%) |
Occupancy by Age of Householder in Miamitown
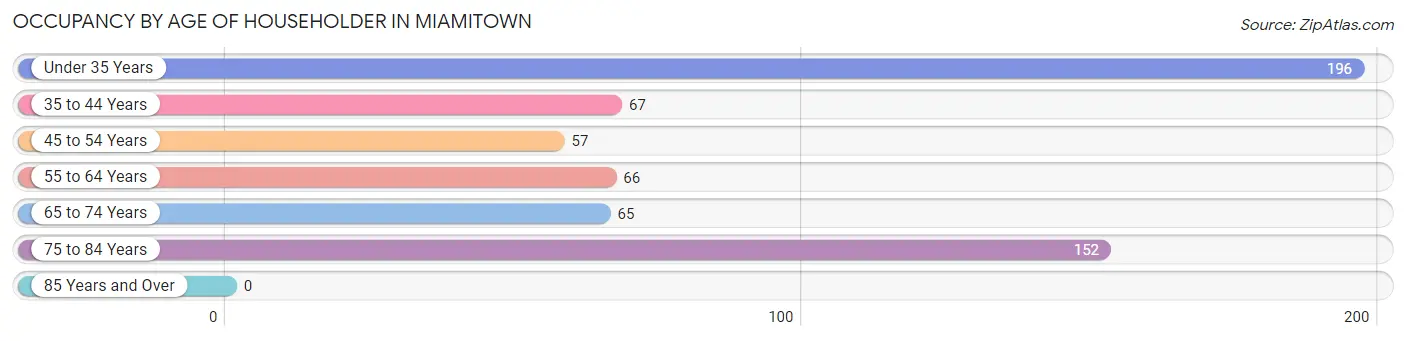
| Age Bracket | # Households | % Households |
| Under 35 Years | 196 | 32.5% |
| 35 to 44 Years | 67 | 11.1% |
| 45 to 54 Years | 57 | 9.5% |
| 55 to 64 Years | 66 | 11.0% |
| 65 to 74 Years | 65 | 10.8% |
| 75 to 84 Years | 152 | 25.2% |
| 85 Years and Over | 0 | 0.0% |
| Total | 603 | 100.0% |
Housing Finances in Miamitown
Median Income by Occupancy in Miamitown
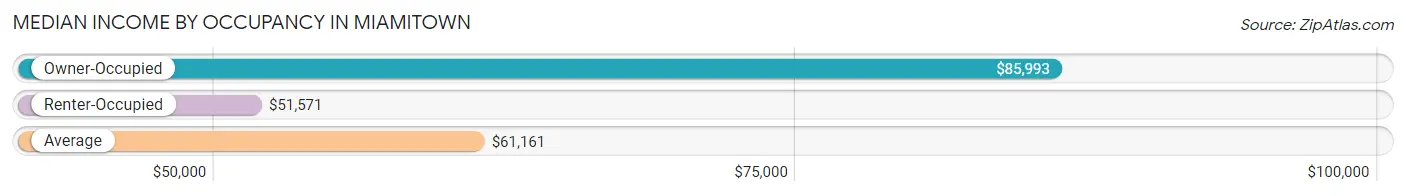
| Occupancy Type | # Households | Median Income |
| Owner-Occupied | 164 (27.2%) | $85,993 |
| Renter-Occupied | 439 (72.8%) | $51,571 |
| Average | 603 (100.0%) | $61,161 |
Occupancy by Householder Income Bracket in Miamitown
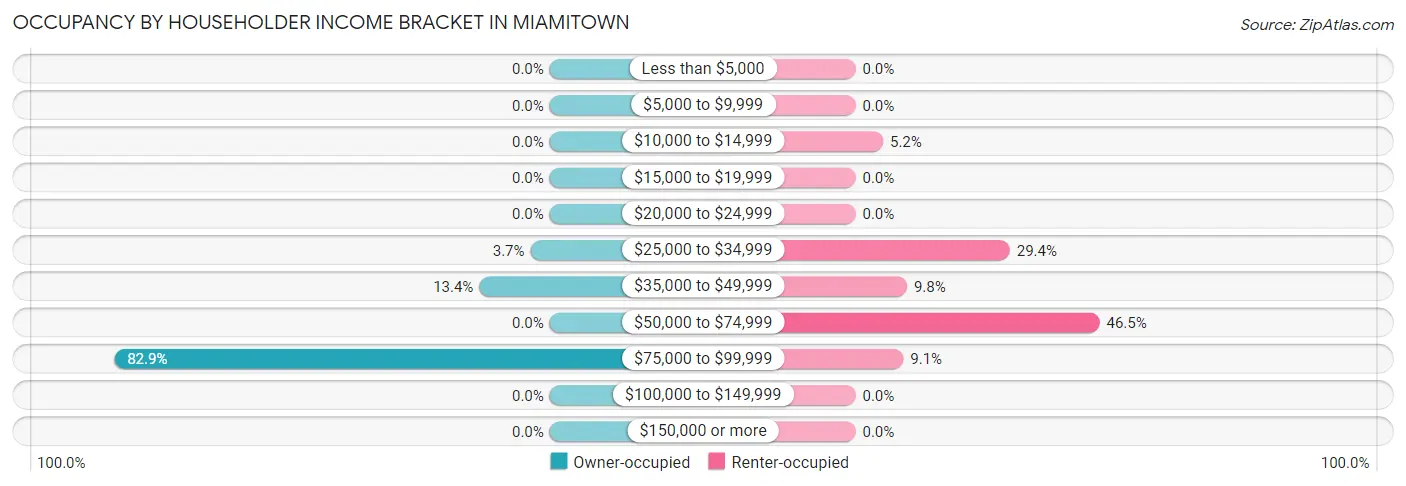
| Income Bracket | Owner-occupied | Renter-occupied |
| Less than $5,000 | 0 (0.0%) | 0 (0.0%) |
| $5,000 to $9,999 | 0 (0.0%) | 0 (0.0%) |
| $10,000 to $14,999 | 0 (0.0%) | 23 (5.2%) |
| $15,000 to $19,999 | 0 (0.0%) | 0 (0.0%) |
| $20,000 to $24,999 | 0 (0.0%) | 0 (0.0%) |
| $25,000 to $34,999 | 6 (3.7%) | 129 (29.4%) |
| $35,000 to $49,999 | 22 (13.4%) | 43 (9.8%) |
| $50,000 to $74,999 | 0 (0.0%) | 204 (46.5%) |
| $75,000 to $99,999 | 136 (82.9%) | 40 (9.1%) |
| $100,000 to $149,999 | 0 (0.0%) | 0 (0.0%) |
| $150,000 or more | 0 (0.0%) | 0 (0.0%) |
| Total | 164 (100.0%) | 439 (100.0%) |
Monthly Housing Cost Tiers in Miamitown
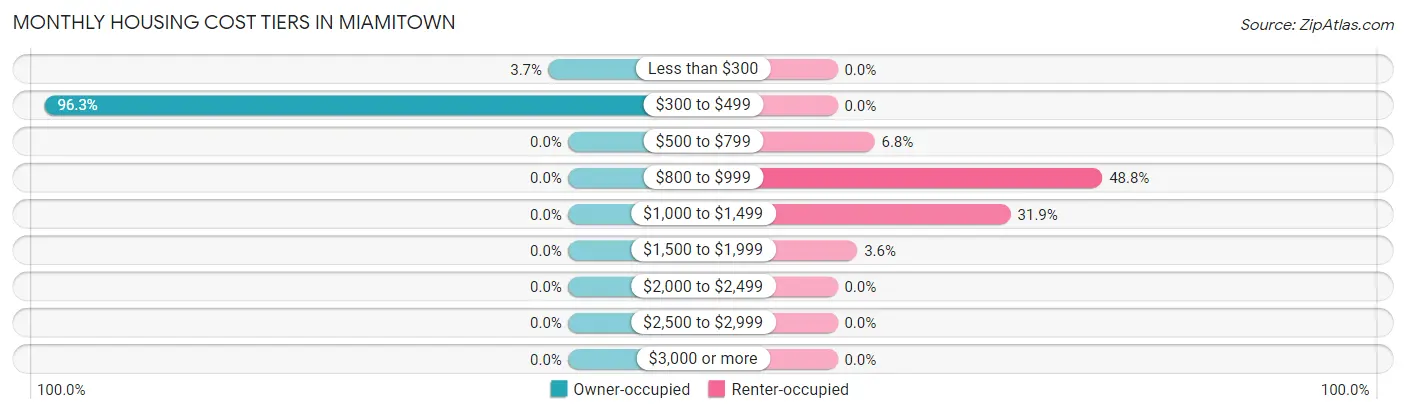
| Monthly Cost | Owner-occupied | Renter-occupied |
| Less than $300 | 6 (3.7%) | 0 (0.0%) |
| $300 to $499 | 158 (96.3%) | 0 (0.0%) |
| $500 to $799 | 0 (0.0%) | 30 (6.8%) |
| $800 to $999 | 0 (0.0%) | 214 (48.7%) |
| $1,000 to $1,499 | 0 (0.0%) | 140 (31.9%) |
| $1,500 to $1,999 | 0 (0.0%) | 16 (3.6%) |
| $2,000 to $2,499 | 0 (0.0%) | 0 (0.0%) |
| $2,500 to $2,999 | 0 (0.0%) | 0 (0.0%) |
| $3,000 or more | 0 (0.0%) | 0 (0.0%) |
| Total | 164 (100.0%) | 439 (100.0%) |
Physical Housing Characteristics in Miamitown
Housing Structures in Miamitown
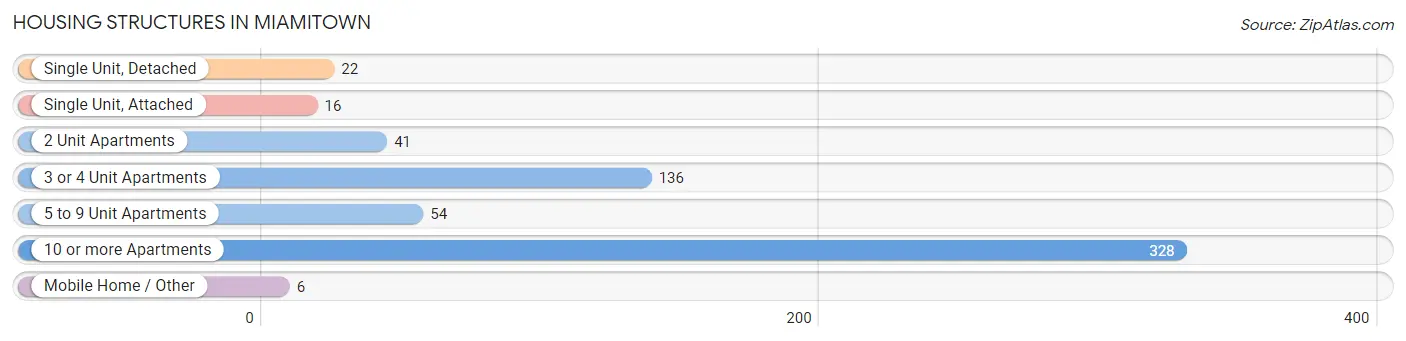
| Structure Type | # Housing Units | % Housing Units |
| Single Unit, Detached | 22 | 3.6% |
| Single Unit, Attached | 16 | 2.6% |
| 2 Unit Apartments | 41 | 6.8% |
| 3 or 4 Unit Apartments | 136 | 22.6% |
| 5 to 9 Unit Apartments | 54 | 9.0% |
| 10 or more Apartments | 328 | 54.4% |
| Mobile Home / Other | 6 | 1.0% |
| Total | 603 | 100.0% |
Housing Structures by Occupancy in Miamitown
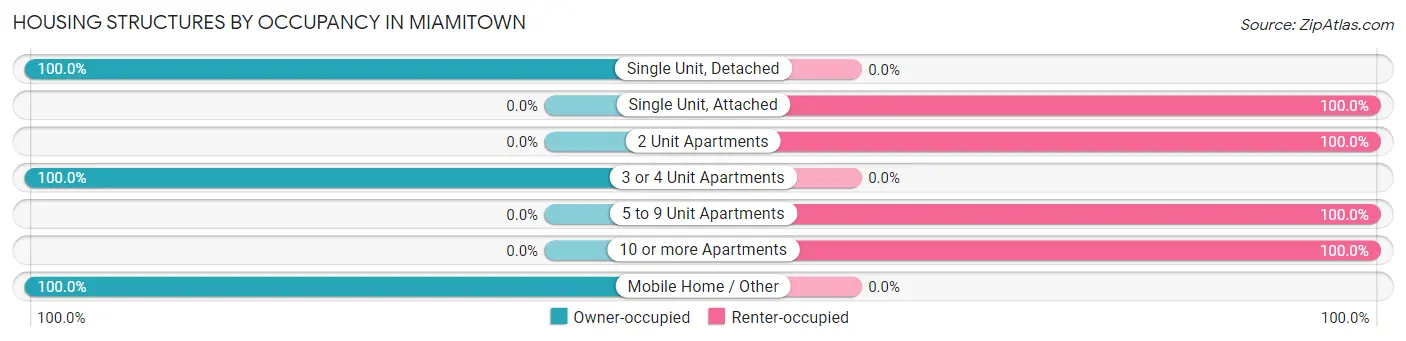
| Structure Type | Owner-occupied | Renter-occupied |
| Single Unit, Detached | 22 (100.0%) | 0 (0.0%) |
| Single Unit, Attached | 0 (0.0%) | 16 (100.0%) |
| 2 Unit Apartments | 0 (0.0%) | 41 (100.0%) |
| 3 or 4 Unit Apartments | 136 (100.0%) | 0 (0.0%) |
| 5 to 9 Unit Apartments | 0 (0.0%) | 54 (100.0%) |
| 10 or more Apartments | 0 (0.0%) | 328 (100.0%) |
| Mobile Home / Other | 6 (100.0%) | 0 (0.0%) |
| Total | 164 (27.2%) | 439 (72.8%) |
Housing Structures by Number of Rooms in Miamitown
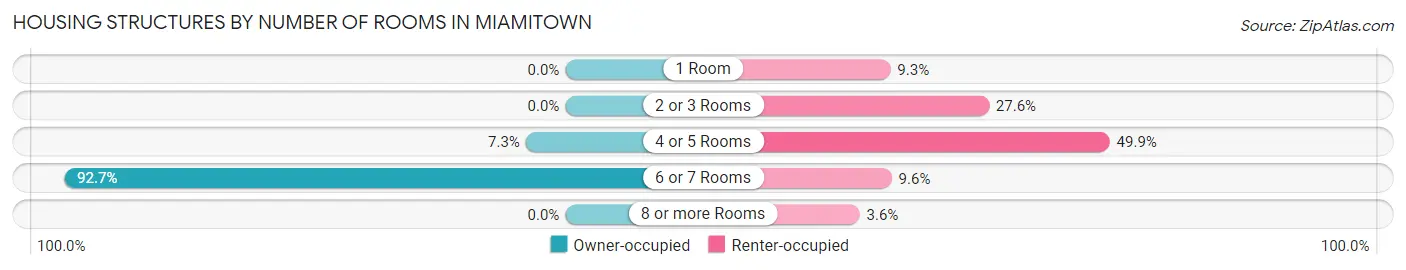
| Number of Rooms | Owner-occupied | Renter-occupied |
| 1 Room | 0 (0.0%) | 41 (9.3%) |
| 2 or 3 Rooms | 0 (0.0%) | 121 (27.6%) |
| 4 or 5 Rooms | 12 (7.3%) | 219 (49.9%) |
| 6 or 7 Rooms | 152 (92.7%) | 42 (9.6%) |
| 8 or more Rooms | 0 (0.0%) | 16 (3.6%) |
| Total | 164 (100.0%) | 439 (100.0%) |
Housing Structure by Heating Type in Miamitown
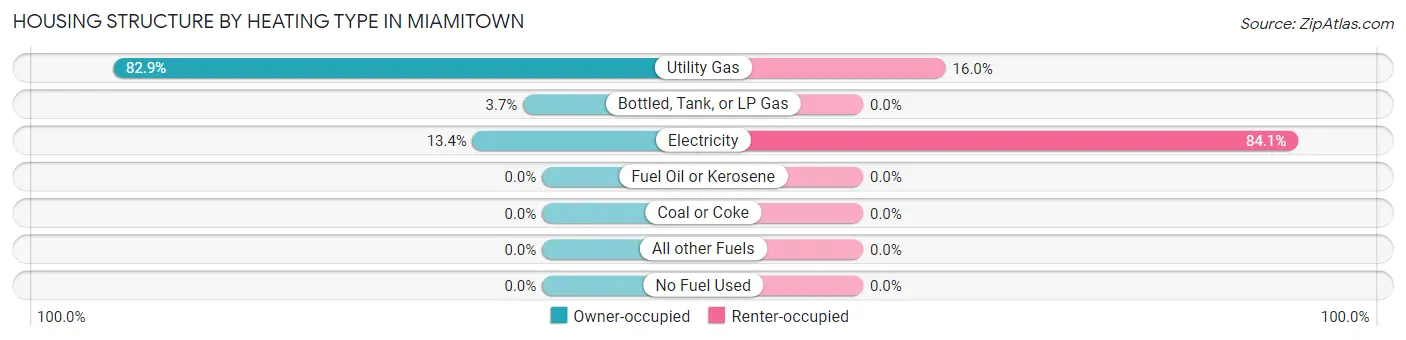
| Heating Type | Owner-occupied | Renter-occupied |
| Utility Gas | 136 (82.9%) | 70 (16.0%) |
| Bottled, Tank, or LP Gas | 6 (3.7%) | 0 (0.0%) |
| Electricity | 22 (13.4%) | 369 (84.1%) |
| Fuel Oil or Kerosene | 0 (0.0%) | 0 (0.0%) |
| Coal or Coke | 0 (0.0%) | 0 (0.0%) |
| All other Fuels | 0 (0.0%) | 0 (0.0%) |
| No Fuel Used | 0 (0.0%) | 0 (0.0%) |
| Total | 164 (100.0%) | 439 (100.0%) |
Household Vehicle Usage in Miamitown
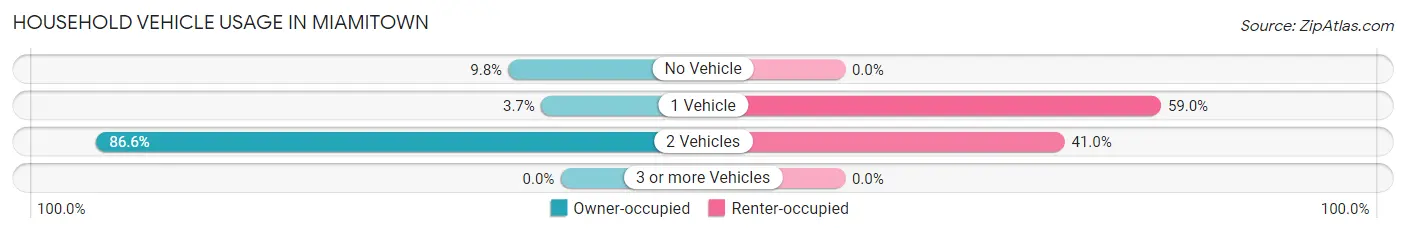
| Vehicles per Household | Owner-occupied | Renter-occupied |
| No Vehicle | 16 (9.8%) | 0 (0.0%) |
| 1 Vehicle | 6 (3.7%) | 259 (59.0%) |
| 2 Vehicles | 142 (86.6%) | 180 (41.0%) |
| 3 or more Vehicles | 0 (0.0%) | 0 (0.0%) |
| Total | 164 (100.0%) | 439 (100.0%) |
Real Estate & Mortgages in Miamitown
Real Estate and Mortgage Overview in Miamitown
| Characteristic | Without Mortgage | With Mortgage |
| Housing Units | 164 | 0 |
| Median Property Value | $22,900 | $0 |
| Median Household Income | $85,993 | $0 |
| Monthly Housing Costs | $372 | $0 |
| Real Estate Taxes | $1,279 | $0 |
Property Value by Mortgage Status in Miamitown
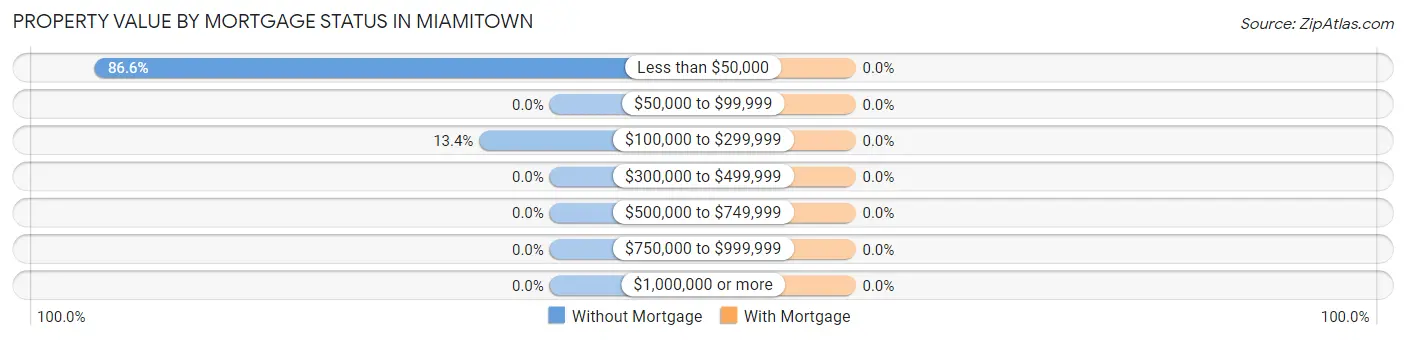
| Property Value | Without Mortgage | With Mortgage |
| Less than $50,000 | 142 (86.6%) | 0 (0.0%) |
| $50,000 to $99,999 | 0 (0.0%) | 0 (0.0%) |
| $100,000 to $299,999 | 22 (13.4%) | 0 (0.0%) |
| $300,000 to $499,999 | 0 (0.0%) | 0 (0.0%) |
| $500,000 to $749,999 | 0 (0.0%) | 0 (0.0%) |
| $750,000 to $999,999 | 0 (0.0%) | 0 (0.0%) |
| $1,000,000 or more | 0 (0.0%) | 0 (0.0%) |
| Total | 164 (100.0%) | 0 (0.0%) |
Household Income by Mortgage Status in Miamitown
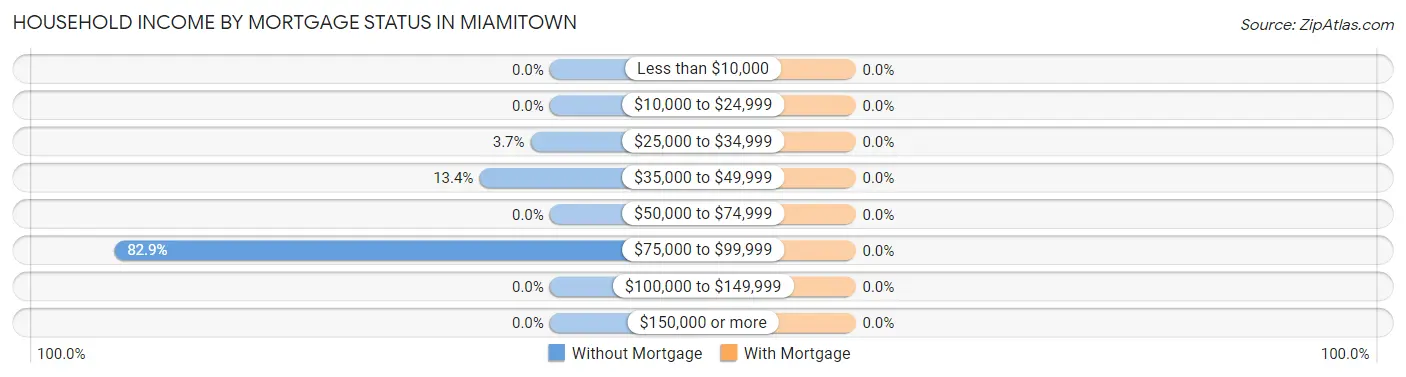
| Household Income | Without Mortgage | With Mortgage |
| Less than $10,000 | 0 (0.0%) | 0 (0.0%) |
| $10,000 to $24,999 | 0 (0.0%) | 0 (0.0%) |
| $25,000 to $34,999 | 6 (3.7%) | 0 (0.0%) |
| $35,000 to $49,999 | 22 (13.4%) | 0 (0.0%) |
| $50,000 to $74,999 | 0 (0.0%) | 0 (0.0%) |
| $75,000 to $99,999 | 136 (82.9%) | 0 (0.0%) |
| $100,000 to $149,999 | 0 (0.0%) | 0 (0.0%) |
| $150,000 or more | 0 (0.0%) | 0 (0.0%) |
| Total | 164 (100.0%) | 0 (0.0%) |
Property Value to Household Income Ratio in Miamitown
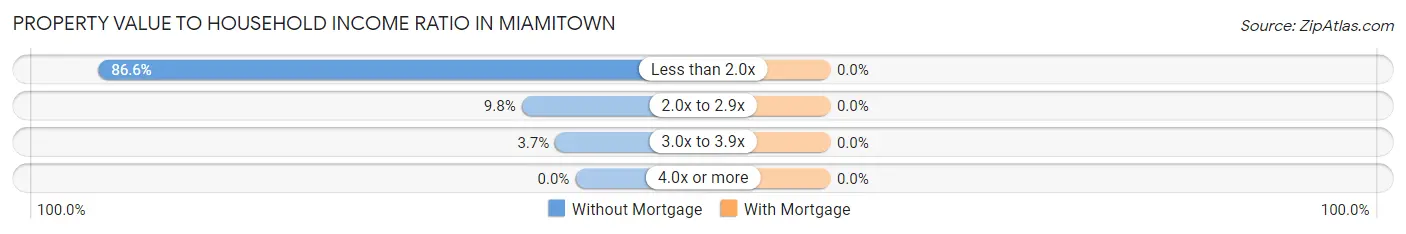
| Value-to-Income Ratio | Without Mortgage | With Mortgage |
| Less than 2.0x | 142 (86.6%) | 0 (0.0%) |
| 2.0x to 2.9x | 16 (9.8%) | 0 (0.0%) |
| 3.0x to 3.9x | 6 (3.7%) | 0 (0.0%) |
| 4.0x or more | 0 (0.0%) | 0 (0.0%) |
| Total | 164 (100.0%) | 0 (0.0%) |
Real Estate Taxes by Mortgage Status in Miamitown
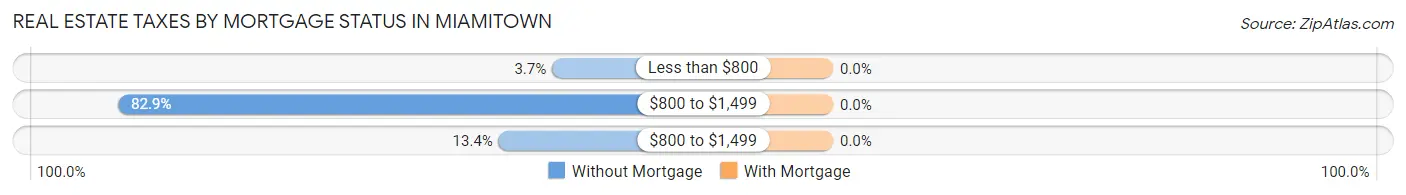
| Property Taxes | Without Mortgage | With Mortgage |
| Less than $800 | 6 (3.7%) | 0 (0.0%) |
| $800 to $1,499 | 136 (82.9%) | 0 (0.0%) |
| $800 to $1,499 | 22 (13.4%) | 0 (0.0%) |
| Total | 164 (100.0%) | 0 (0.0%) |
Health & Disability in Miamitown
Health Insurance Coverage by Age in Miamitown
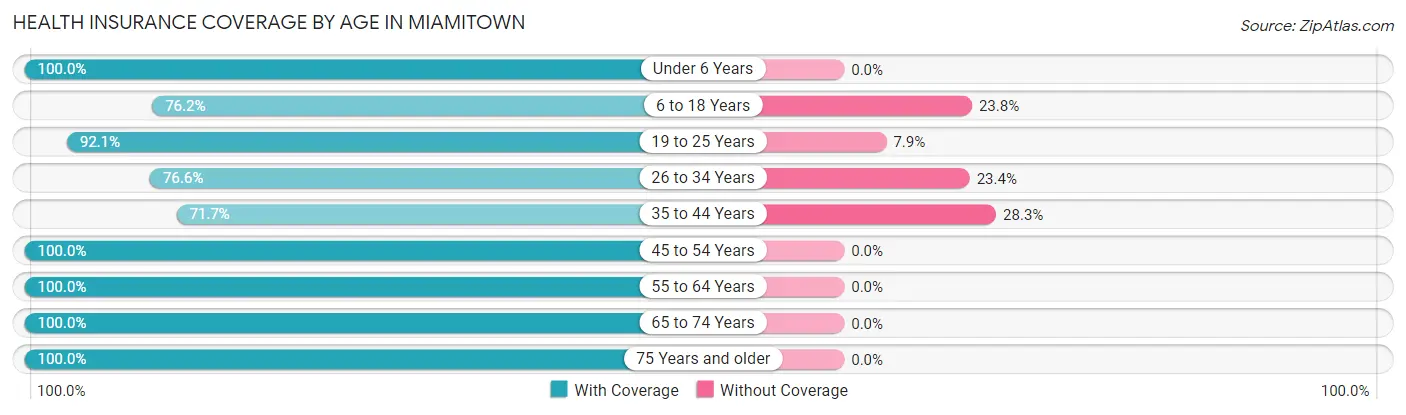
| Age Bracket | With Coverage | Without Coverage |
| Under 6 Years | 25 (100.0%) | 0 (0.0%) |
| 6 to 18 Years | 96 (76.2%) | 30 (23.8%) |
| 19 to 25 Years | 164 (92.1%) | 14 (7.9%) |
| 26 to 34 Years | 95 (76.6%) | 29 (23.4%) |
| 35 to 44 Years | 81 (71.7%) | 32 (28.3%) |
| 45 to 54 Years | 110 (100.0%) | 0 (0.0%) |
| 55 to 64 Years | 66 (100.0%) | 0 (0.0%) |
| 65 to 74 Years | 65 (100.0%) | 0 (0.0%) |
| 75 Years and older | 152 (100.0%) | 0 (0.0%) |
| Total | 854 (89.0%) | 105 (11.0%) |
Health Insurance Coverage by Citizenship Status in Miamitown
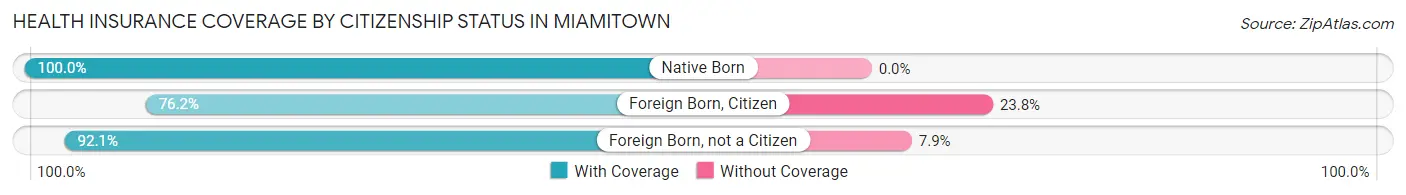
| Citizenship Status | With Coverage | Without Coverage |
| Native Born | 25 (100.0%) | 0 (0.0%) |
| Foreign Born, Citizen | 96 (76.2%) | 30 (23.8%) |
| Foreign Born, not a Citizen | 164 (92.1%) | 14 (7.9%) |
Health Insurance Coverage by Household Income in Miamitown
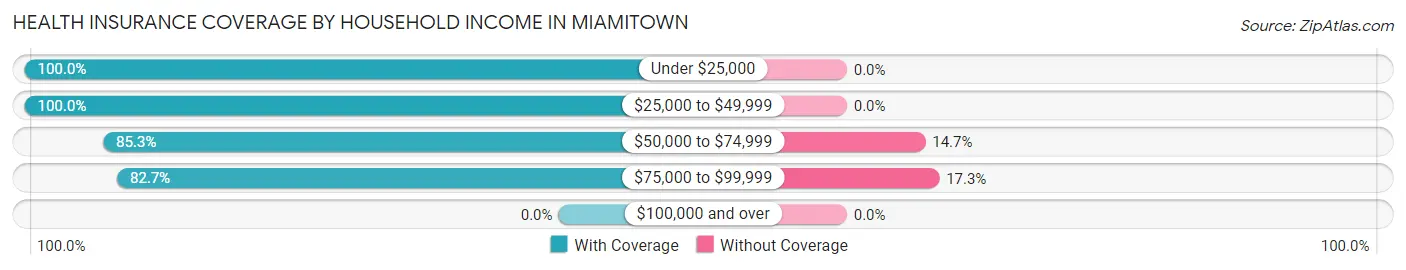
| Household Income | With Coverage | Without Coverage |
| Under $25,000 | 95 (100.0%) | 0 (0.0%) |
| $25,000 to $49,999 | 200 (100.0%) | 0 (0.0%) |
| $50,000 to $74,999 | 325 (85.3%) | 56 (14.7%) |
| $75,000 to $99,999 | 234 (82.7%) | 49 (17.3%) |
| $100,000 and over | 0 (0.0%) | 0 (0.0%) |
Public vs Private Health Insurance Coverage by Age in Miamitown
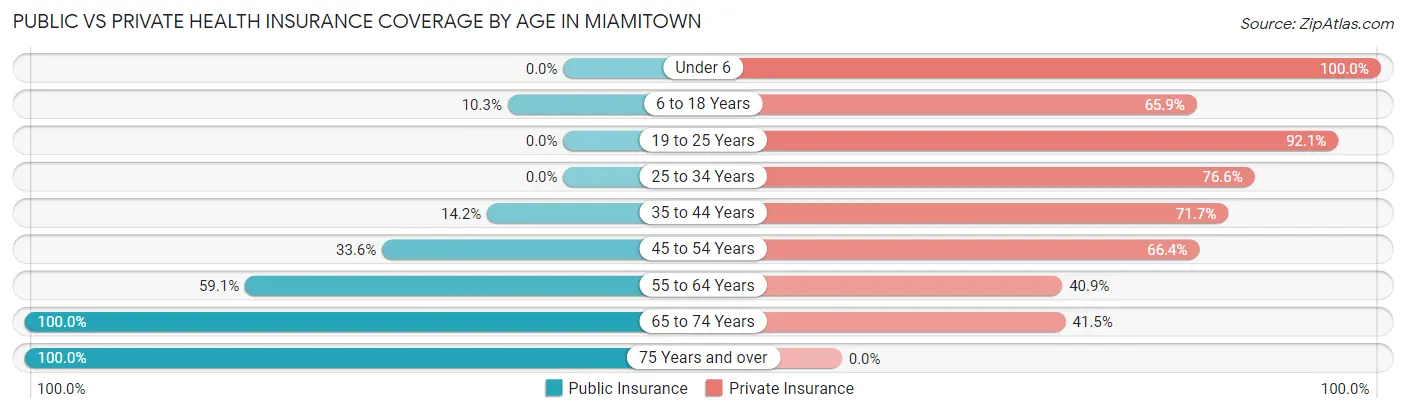
| Age Bracket | Public Insurance | Private Insurance |
| Under 6 | 0 (0.0%) | 25 (100.0%) |
| 6 to 18 Years | 13 (10.3%) | 83 (65.9%) |
| 19 to 25 Years | 0 (0.0%) | 164 (92.1%) |
| 25 to 34 Years | 0 (0.0%) | 95 (76.6%) |
| 35 to 44 Years | 16 (14.2%) | 81 (71.7%) |
| 45 to 54 Years | 37 (33.6%) | 73 (66.4%) |
| 55 to 64 Years | 39 (59.1%) | 27 (40.9%) |
| 65 to 74 Years | 65 (100.0%) | 27 (41.5%) |
| 75 Years and over | 152 (100.0%) | 0 (0.0%) |
| Total | 322 (33.6%) | 575 (60.0%) |
Disability Status by Sex by Age in Miamitown
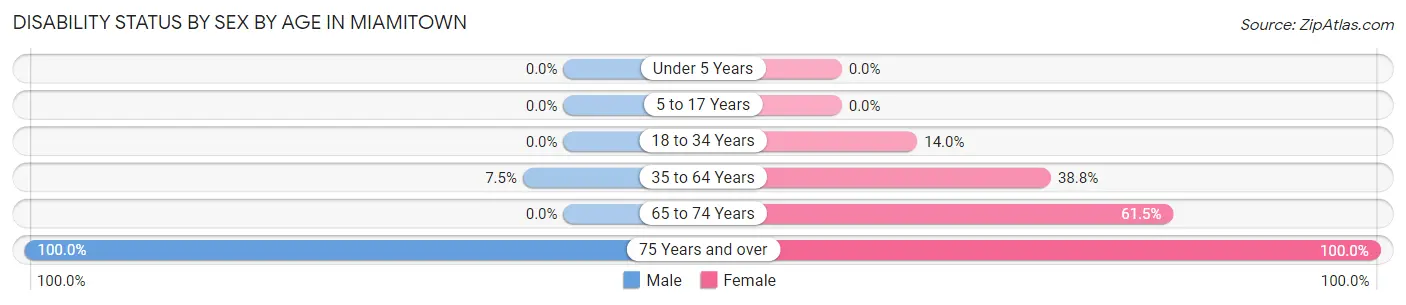
| Age Bracket | Male | Female |
| Under 5 Years | 0 (0.0%) | 0 (0.0%) |
| 5 to 17 Years | 0 (0.0%) | 0 (0.0%) |
| 18 to 34 Years | 0 (0.0%) | 29 (14.0%) |
| 35 to 64 Years | 14 (7.5%) | 40 (38.8%) |
| 65 to 74 Years | 0 (0.0%) | 40 (61.5%) |
| 75 Years and over | 136 (100.0%) | 16 (100.0%) |
Disability Class by Sex by Age in Miamitown
Disability Class: Hearing Difficulty
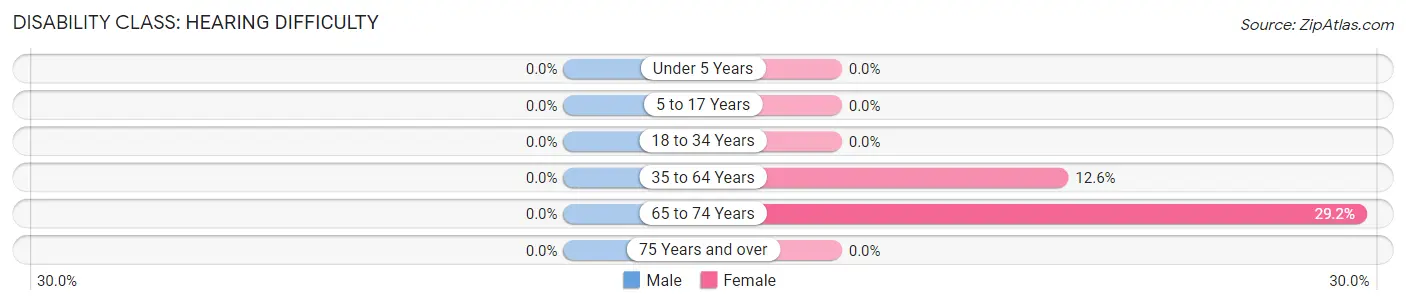
| Age Bracket | Male | Female |
| Under 5 Years | 0 (0.0%) | 0 (0.0%) |
| 5 to 17 Years | 0 (0.0%) | 0 (0.0%) |
| 18 to 34 Years | 0 (0.0%) | 0 (0.0%) |
| 35 to 64 Years | 0 (0.0%) | 13 (12.6%) |
| 65 to 74 Years | 0 (0.0%) | 19 (29.2%) |
| 75 Years and over | 0 (0.0%) | 0 (0.0%) |
Disability Class: Vision Difficulty
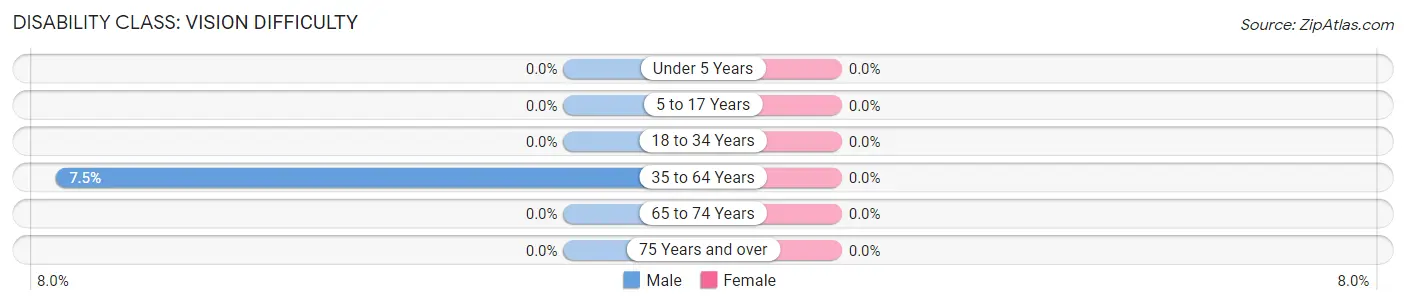
| Age Bracket | Male | Female |
| Under 5 Years | 0 (0.0%) | 0 (0.0%) |
| 5 to 17 Years | 0 (0.0%) | 0 (0.0%) |
| 18 to 34 Years | 0 (0.0%) | 0 (0.0%) |
| 35 to 64 Years | 14 (7.5%) | 0 (0.0%) |
| 65 to 74 Years | 0 (0.0%) | 0 (0.0%) |
| 75 Years and over | 0 (0.0%) | 0 (0.0%) |
Disability Class: Cognitive Difficulty
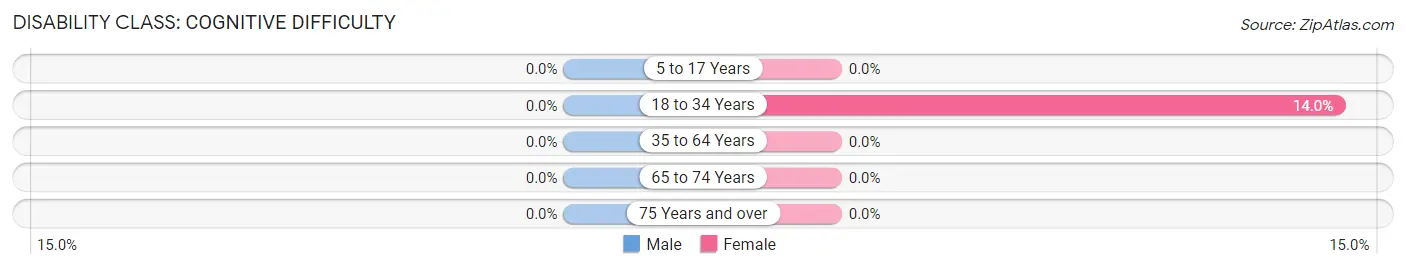
| Age Bracket | Male | Female |
| 5 to 17 Years | 0 (0.0%) | 0 (0.0%) |
| 18 to 34 Years | 0 (0.0%) | 29 (14.0%) |
| 35 to 64 Years | 0 (0.0%) | 0 (0.0%) |
| 65 to 74 Years | 0 (0.0%) | 0 (0.0%) |
| 75 Years and over | 0 (0.0%) | 0 (0.0%) |
Disability Class: Ambulatory Difficulty
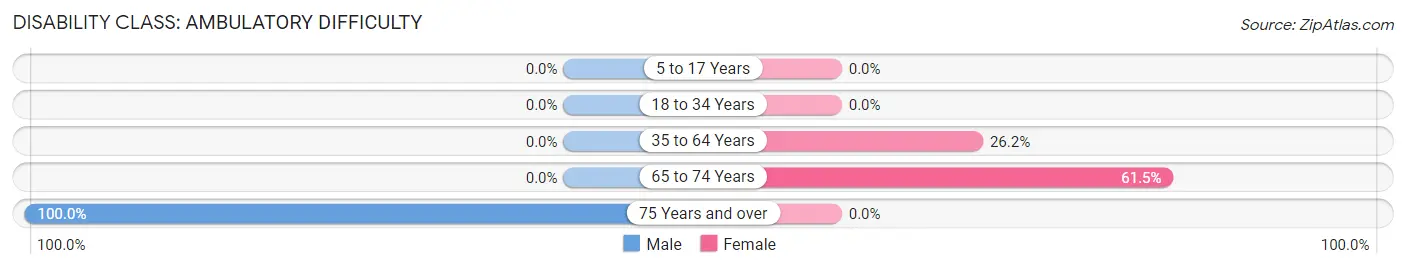
| Age Bracket | Male | Female |
| 5 to 17 Years | 0 (0.0%) | 0 (0.0%) |
| 18 to 34 Years | 0 (0.0%) | 0 (0.0%) |
| 35 to 64 Years | 0 (0.0%) | 27 (26.2%) |
| 65 to 74 Years | 0 (0.0%) | 40 (61.5%) |
| 75 Years and over | 136 (100.0%) | 0 (0.0%) |
Disability Class: Self-Care Difficulty
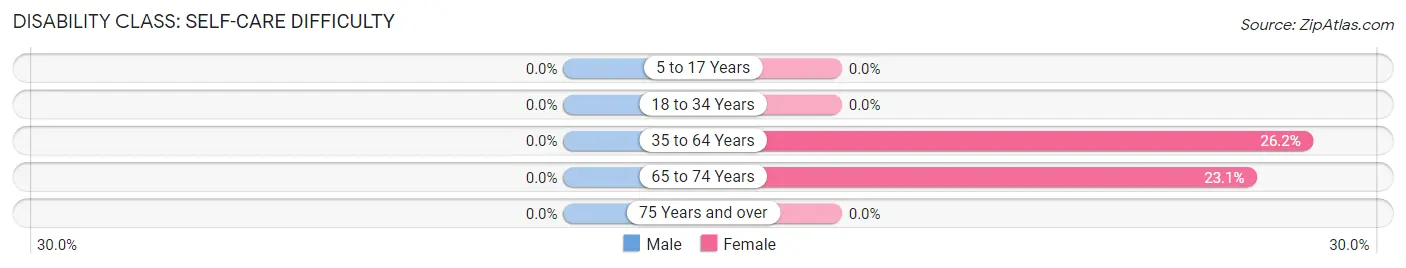
| Age Bracket | Male | Female |
| 5 to 17 Years | 0 (0.0%) | 0 (0.0%) |
| 18 to 34 Years | 0 (0.0%) | 0 (0.0%) |
| 35 to 64 Years | 0 (0.0%) | 27 (26.2%) |
| 65 to 74 Years | 0 (0.0%) | 15 (23.1%) |
| 75 Years and over | 0 (0.0%) | 0 (0.0%) |
Technology Access in Miamitown
Computing Device Access in Miamitown
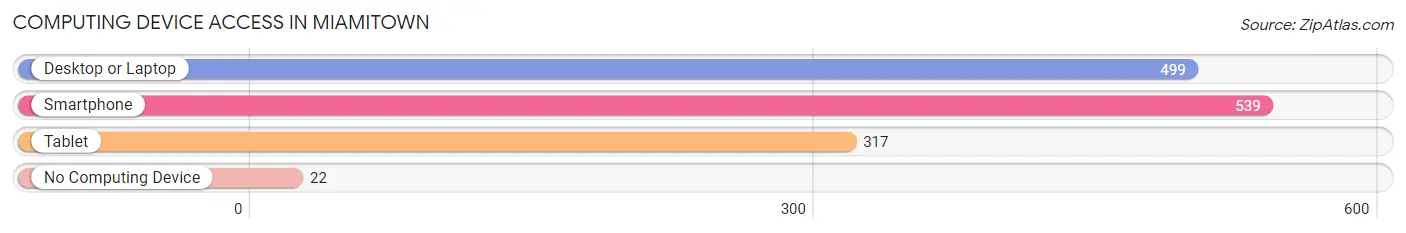
| Device Type | # Households | % Households |
| Desktop or Laptop | 499 | 82.8% |
| Smartphone | 539 | 89.4% |
| Tablet | 317 | 52.6% |
| No Computing Device | 22 | 3.6% |
| Total | 603 | 100.0% |
Internet Access in Miamitown
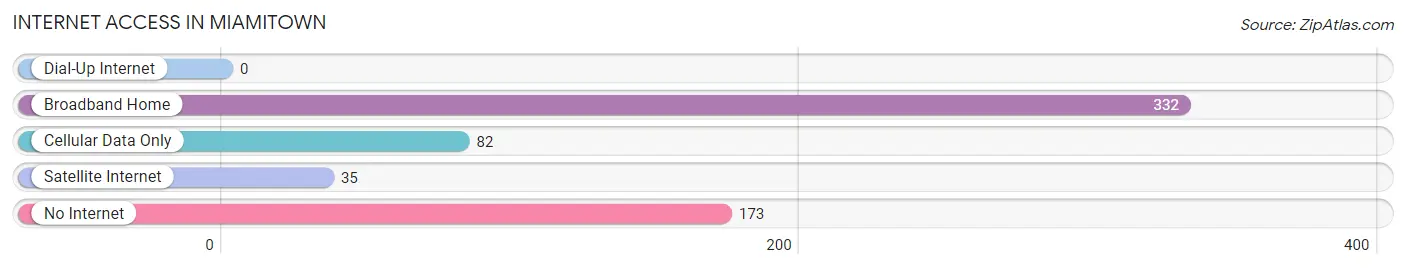
| Internet Type | # Households | % Households |
| Dial-Up Internet | 0 | 0.0% |
| Broadband Home | 332 | 55.1% |
| Cellular Data Only | 82 | 13.6% |
| Satellite Internet | 35 | 5.8% |
| No Internet | 173 | 28.7% |
| Total | 603 | 100.0% |
Miamitown Summary
Miamitown is a small village located in the southwestern corner of Ohio, in the county of Hamilton. It is situated on the banks of the Great Miami River, and is part of the Cincinnati metropolitan area. The village has a population of approximately 1,000 people, and is known for its rural charm and small-town atmosphere.
History
Miamitown was founded in 1817 by a group of settlers from Kentucky. The village was originally known as “Miamisburg”, and was named after the Great Miami River, which runs through the area. The village was incorporated in 1845, and the first post office was established in 1846.
In the late 19th century, Miamitown was a thriving agricultural community, with a variety of crops being grown in the area. The village was also home to several mills, which provided employment for many of the residents.
In the early 20th century, the village began to experience a decline in population, as many of the residents moved away in search of better economic opportunities. However, the village has experienced a resurgence in recent years, with many new businesses and residents moving to the area.
Geography
Miamitown is located in the southwestern corner of Ohio, in the county of Hamilton. The village is situated on the banks of the Great Miami River, and is part of the Cincinnati metropolitan area. The village is located approximately 25 miles from downtown Cincinnati, and is accessible via Interstate 75.
The village is situated in a rural area, and is surrounded by farmland and wooded areas. The village is also home to several parks, including Miamitown Park, which features a playground, picnic area, and walking trails.
Economy
Miamitown’s economy is largely based on agriculture and tourism. The village is home to several farms, which produce a variety of crops, including corn, soybeans, and wheat. The village is also home to several wineries, which produce a variety of wines.
In addition, the village is home to several small businesses, including restaurants, shops, and other services. The village is also home to several manufacturing companies, which produce a variety of products, including furniture, clothing, and electronics.
Demographics
As of the 2010 census, the population of Miamitown was 1,000 people. The village is predominantly white, with approximately 95% of the population being Caucasian. The village is also home to a small Hispanic population, with approximately 4% of the population being of Hispanic or Latino origin.
The median household income in Miamitown is approximately $50,000, and the median home value is approximately $150,000. The village is home to several churches, including the Miamitown United Methodist Church and the Miamitown Baptist Church.
Conclusion
Miamitown is a small village located in the southwestern corner of Ohio, in the county of Hamilton. The village has a population of approximately 1,000 people, and is known for its rural charm and small-town atmosphere. The village’s economy is largely based on agriculture and tourism, and the village is home to several small businesses, churches, and manufacturing companies. The village is predominantly white, with approximately 95% of the population being Caucasian. The median household income in Miamitown is approximately $50,000, and the median home value is approximately $150,000.
Common Questions
What is Per Capita Income in Miamitown?
Per Capita income in Miamitown is $36,062.
What is the Median Family Income in Miamitown?
Median Family Income in Miamitown is $58,158.
What is the Median Household income in Miamitown?
Median Household Income in Miamitown is $61,161.
What is Income or Wage Gap in Miamitown?
Income or Wage Gap in Miamitown is 14.2%.
Women in Miamitown earn 85.8 cents for every dollar earned by a man.
What is Inequality or Gini Index in Miamitown?
Inequality or Gini Index in Miamitown is 0.24.
What is the Total Population of Miamitown?
Total Population of Miamitown is 959.
What is the Total Male Population of Miamitown?
Total Male Population of Miamitown is 502.
What is the Total Female Population of Miamitown?
Total Female Population of Miamitown is 457.
What is the Ratio of Males per 100 Females in Miamitown?
There are 109.85 Males per 100 Females in Miamitown.
What is the Ratio of Females per 100 Males in Miamitown?
There are 91.04 Females per 100 Males in Miamitown.
What is the Median Population Age in Miamitown?
Median Population Age in Miamitown is 36.3 Years.
What is the Average Family Size in Miamitown
Average Family Size in Miamitown is 2.8 People.
What is the Average Household Size in Miamitown
Average Household Size in Miamitown is 1.6 People.
How Large is the Labor Force in Miamitown?
There are 546 People in the Labor Forcein in Miamitown.
What is the Percentage of People in the Labor Force in Miamitown?
66.6% of People are in the Labor Force in Miamitown.