McDermott, OH Map & Demographics
McDermott Map
McDermott Overview
$12,650
PER CAPITA INCOME
$48,208
AVG FAMILY INCOME
$48,208
AVG HOUSEHOLD INCOME
0.14
INEQUALITY / GINI INDEX
529
TOTAL POPULATION
163
MALE POPULATION
366
FEMALE POPULATION
44.54
MALES / 100 FEMALES
224.54
FEMALES / 100 MALES
15.7
MEDIAN AGE
3.8
AVG FAMILY SIZE
3.8
AVG HOUSEHOLD SIZE
188
LABOR FORCE [ PEOPLE ]
76.1%
PERCENT IN LABOR FORCE
8.5%
UNEMPLOYMENT RATE
Income in McDermott
Income Overview in McDermott
Per Capita Income in McDermott is $12,650, while median incomes of families and households are $48,208 and $48,208 respectively.
| Characteristic | Number | Measure |
| Per Capita Income | 529 | $12,650 |
| Median Family Income | 134 | $48,208 |
| Mean Family Income | 134 | $48,805 |
| Median Household Income | 134 | $48,208 |
| Mean Household Income | 134 | $48,805 |
| Income Deficit | 134 | $0 |
| Wage / Income Gap (%) | 529 | 0.00% |
| Wage / Income Gap ($) | 529 | 100.00¢ per $1 |
| Gini / Inequality Index | 529 | 0.14 |
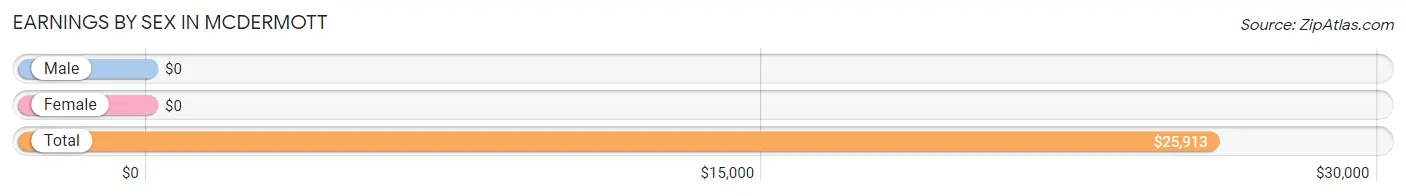
Earnings by Sex in McDermott
| Sex | Number | Average Earnings |
| Male | 71 (41.3%) | $0 |
| Female | 101 (58.7%) | $0 |
| Total | 172 (100.0%) | $25,913 |
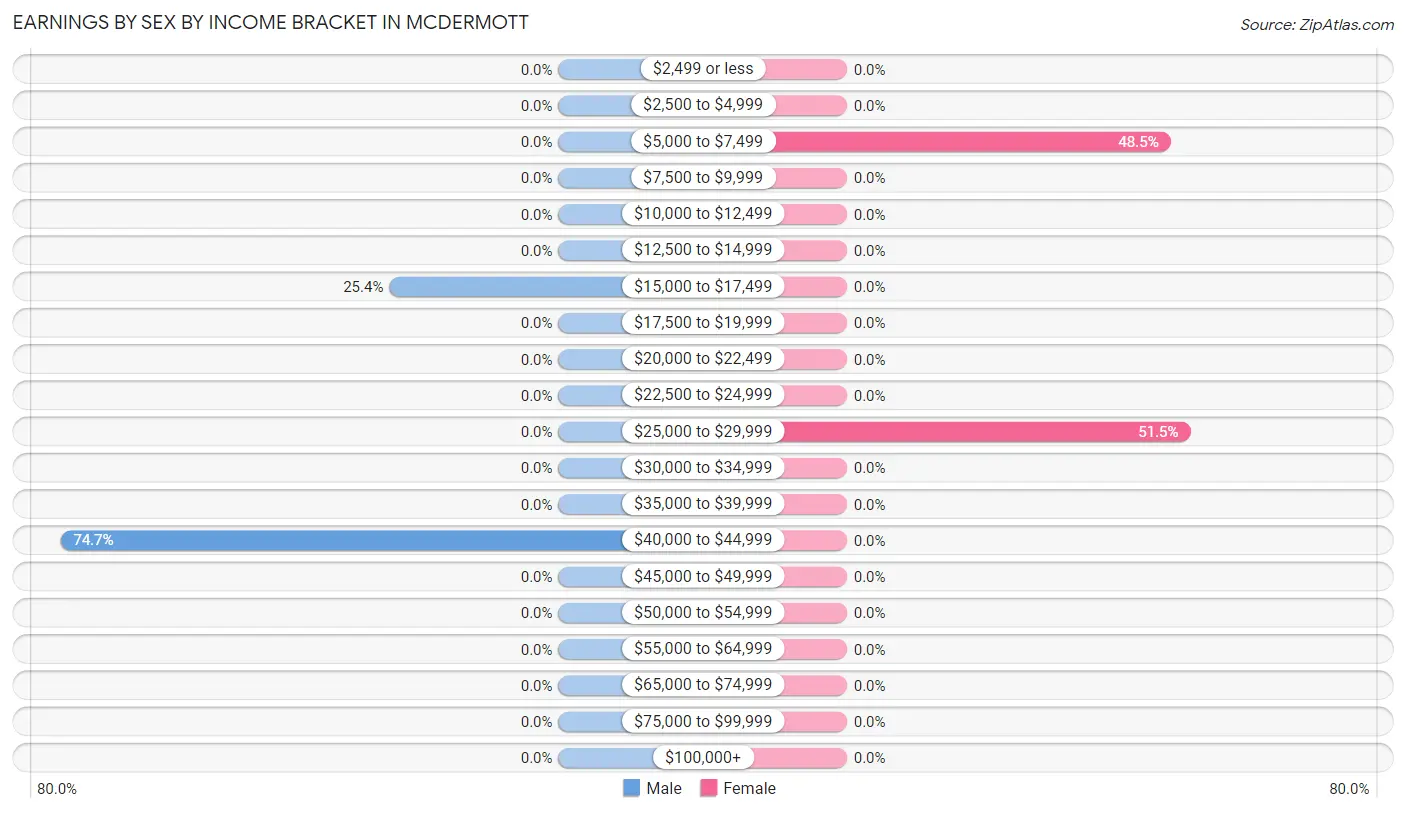
Earnings by Sex by Income Bracket in McDermott
The most common earnings brackets in McDermott are $40,000 to $44,999 for men (53 | 74.7%) and $25,000 to $29,999 for women (52 | 51.5%).
| Income | Male | Female |
| $2,499 or less | 0 (0.0%) | 0 (0.0%) |
| $2,500 to $4,999 | 0 (0.0%) | 0 (0.0%) |
| $5,000 to $7,499 | 0 (0.0%) | 49 (48.5%) |
| $7,500 to $9,999 | 0 (0.0%) | 0 (0.0%) |
| $10,000 to $12,499 | 0 (0.0%) | 0 (0.0%) |
| $12,500 to $14,999 | 0 (0.0%) | 0 (0.0%) |
| $15,000 to $17,499 | 18 (25.4%) | 0 (0.0%) |
| $17,500 to $19,999 | 0 (0.0%) | 0 (0.0%) |
| $20,000 to $22,499 | 0 (0.0%) | 0 (0.0%) |
| $22,500 to $24,999 | 0 (0.0%) | 0 (0.0%) |
| $25,000 to $29,999 | 0 (0.0%) | 52 (51.5%) |
| $30,000 to $34,999 | 0 (0.0%) | 0 (0.0%) |
| $35,000 to $39,999 | 0 (0.0%) | 0 (0.0%) |
| $40,000 to $44,999 | 53 (74.7%) | 0 (0.0%) |
| $45,000 to $49,999 | 0 (0.0%) | 0 (0.0%) |
| $50,000 to $54,999 | 0 (0.0%) | 0 (0.0%) |
| $55,000 to $64,999 | 0 (0.0%) | 0 (0.0%) |
| $65,000 to $74,999 | 0 (0.0%) | 0 (0.0%) |
| $75,000 to $99,999 | 0 (0.0%) | 0 (0.0%) |
| $100,000+ | 0 (0.0%) | 0 (0.0%) |
| Total | 71 (100.0%) | 101 (100.0%) |
Earnings by Sex by Educational Attainment in McDermott
| Educational Attainment | Male Income | Female Income |
| Less than High School | - | - |
| High School Diploma | - | - |
| College or Associate's Degree | - | - |
| Bachelor's Degree | - | - |
| Graduate Degree | - | - |
| Total | - | - |
Family Income in McDermott
Family Income Brackets in McDermott
According to the McDermott family income data, there are 105 families falling into the $35,000 to $49,999 income range, which is the most common income bracket and makes up 78.4% of all families.
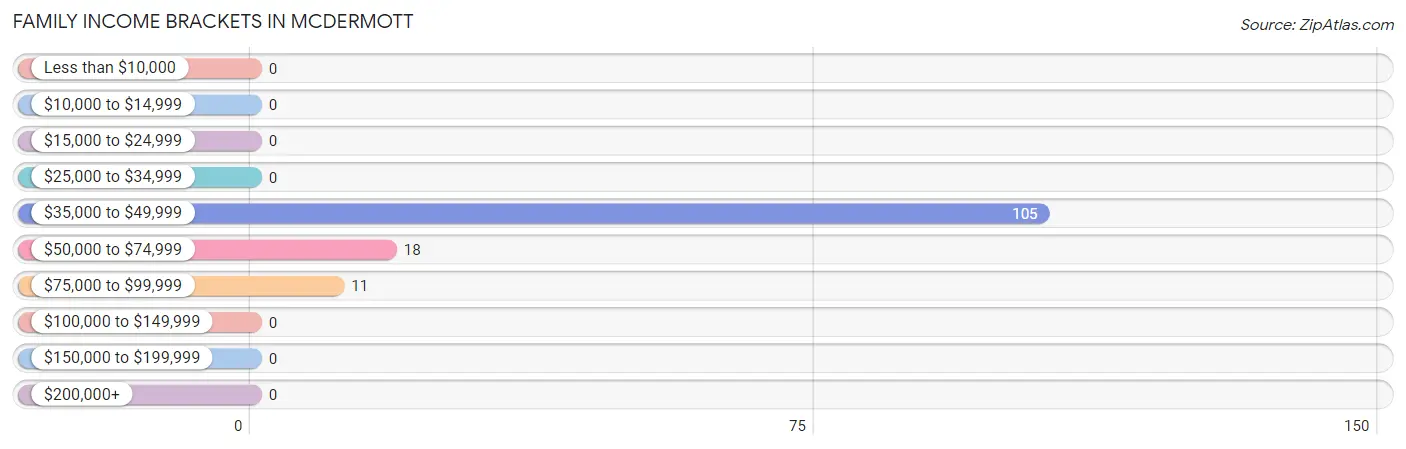
| Income Bracket | # Families | % Families |
| Less than $10,000 | 0 | 0.0% |
| $10,000 to $14,999 | 0 | 0.0% |
| $15,000 to $24,999 | 0 | 0.0% |
| $25,000 to $34,999 | 0 | 0.0% |
| $35,000 to $49,999 | 105 | 78.4% |
| $50,000 to $74,999 | 18 | 13.4% |
| $75,000 to $99,999 | 11 | 8.2% |
| $100,000 to $149,999 | 0 | 0.0% |
| $150,000 to $199,999 | 0 | 0.0% |
| $200,000+ | 0 | 0.0% |
Family Income by Famaliy Size in McDermott
| Income Bracket | # Families | Median Income |
| 2-Person Families | 11 (8.2%) | $0 |
| 3-Person Families | 18 (13.4%) | $0 |
| 4-Person Families | 105 (78.4%) | $0 |
| 5-Person Families | 0 (0.0%) | $0 |
| 6-Person Families | 0 (0.0%) | $0 |
| 7+ Person Families | 0 (0.0%) | $0 |
| Total | 134 (100.0%) | $48,208 |
Family Income by Number of Earners in McDermott
| Number of Earners | # Families | Median Income |
| No Earners | 11 (8.2%) | $0 |
| 1 Earner | 70 (52.2%) | $0 |
| 2 Earners | 53 (39.6%) | $0 |
| 3+ Earners | 0 (0.0%) | $0 |
| Total | 134 (100.0%) | $48,208 |
Household Income in McDermott
Household Income Brackets in McDermott
With 105 households falling in the category, the $35,000 to $49,999 income range is the most frequent in McDermott, accounting for 78.4% of all households.
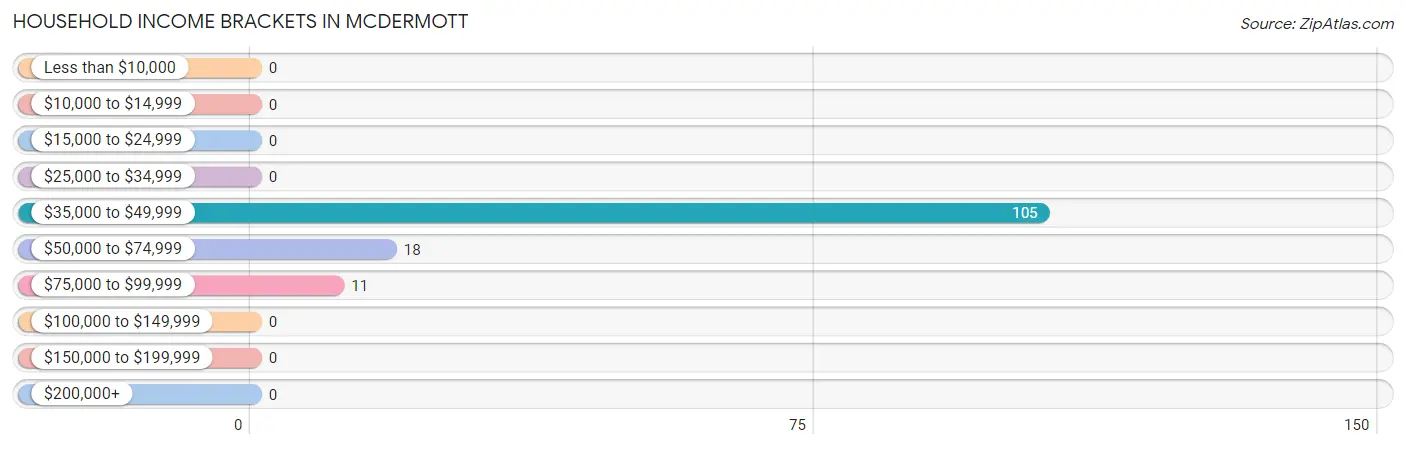
| Income Bracket | # Households | % Households |
| Less than $10,000 | 0 | 0.0% |
| $10,000 to $14,999 | 0 | 0.0% |
| $15,000 to $24,999 | 0 | 0.0% |
| $25,000 to $34,999 | 0 | 0.0% |
| $35,000 to $49,999 | 105 | 78.4% |
| $50,000 to $74,999 | 18 | 13.4% |
| $75,000 to $99,999 | 11 | 8.2% |
| $100,000 to $149,999 | 0 | 0.0% |
| $150,000 to $199,999 | 0 | 0.0% |
| $200,000+ | 0 | 0.0% |
Household Income by Householder Age in McDermott
The median household income in McDermott is $48,208, with the highest median household income of $47,948 found in the 25 to 44 years age bracket for the primary householder. A total of 123 households (91.8%) fall into this category.
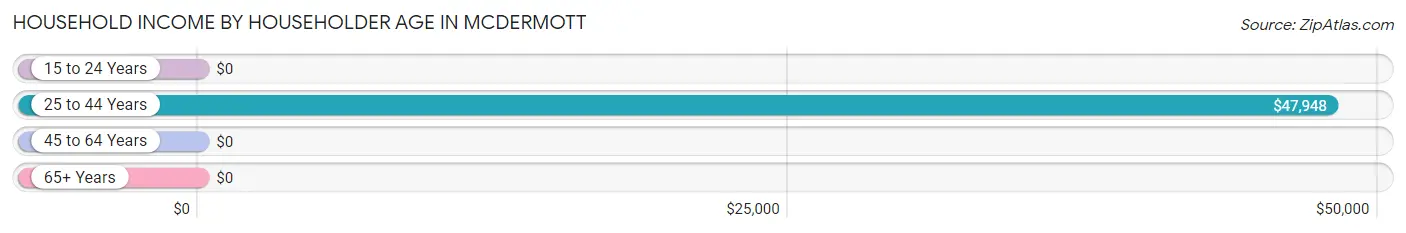
| Income Bracket | # Households | Median Income |
| 15 to 24 Years | 0 (0.0%) | $0 |
| 25 to 44 Years | 123 (91.8%) | $47,948 |
| 45 to 64 Years | 0 (0.0%) | $0 |
| 65+ Years | 11 (8.2%) | $0 |
| Total | 134 (100.0%) | $48,208 |
Poverty in McDermott
Income Below Poverty by Sex and Age in McDermott
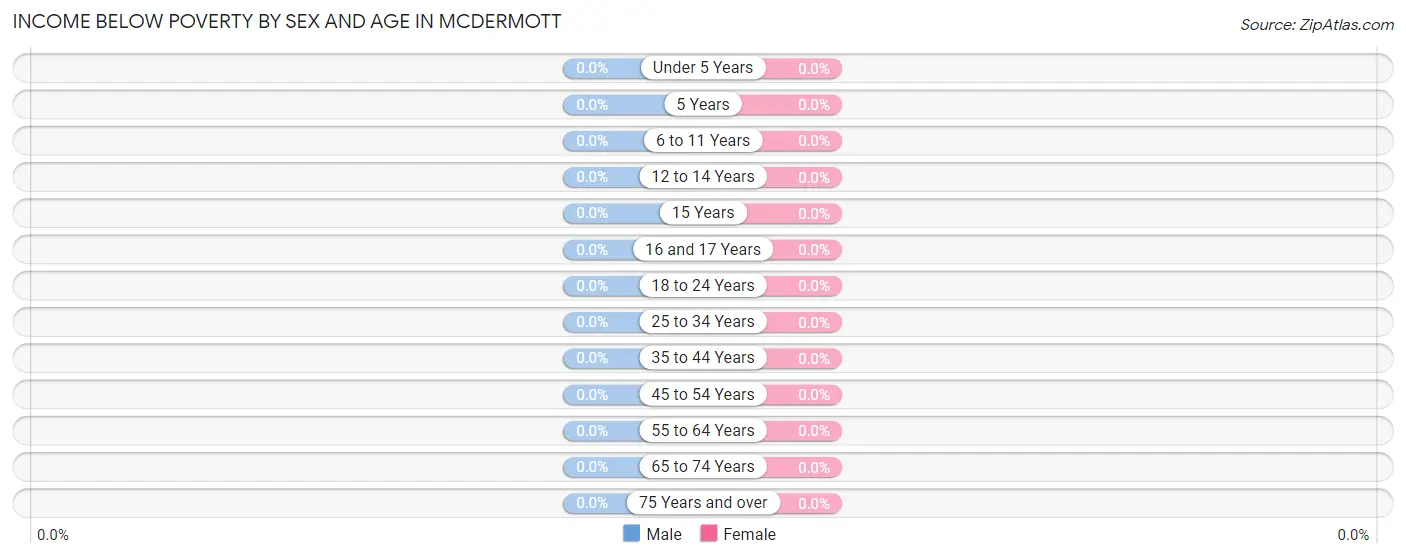
| Age Bracket | Male | Female |
| Under 5 Years | 0 (0.0%) | 0 (0.0%) |
| 5 Years | 0 (0.0%) | 0 (0.0%) |
| 6 to 11 Years | 0 (0.0%) | 0 (0.0%) |
| 12 to 14 Years | 0 (0.0%) | 0 (0.0%) |
| 15 Years | 0 (0.0%) | 0 (0.0%) |
| 16 and 17 Years | 0 (0.0%) | 0 (0.0%) |
| 18 to 24 Years | 0 (0.0%) | 0 (0.0%) |
| 25 to 34 Years | 0 (0.0%) | 0 (0.0%) |
| 35 to 44 Years | 0 (0.0%) | 0 (0.0%) |
| 45 to 54 Years | 0 (0.0%) | 0 (0.0%) |
| 55 to 64 Years | 0 (0.0%) | 0 (0.0%) |
| 65 to 74 Years | 0 (0.0%) | 0 (0.0%) |
| 75 Years and over | 0 (0.0%) | 0 (0.0%) |
| Total | 0 (0.0%) | 0 (0.0%) |
Income Above Poverty by Sex and Age in McDermott
According to the poverty statistics in McDermott, males aged 15 years and females aged under 5 years are the age groups that are most secure financially, with 100.0% of males and 100.0% of females in these age groups living above the poverty line.
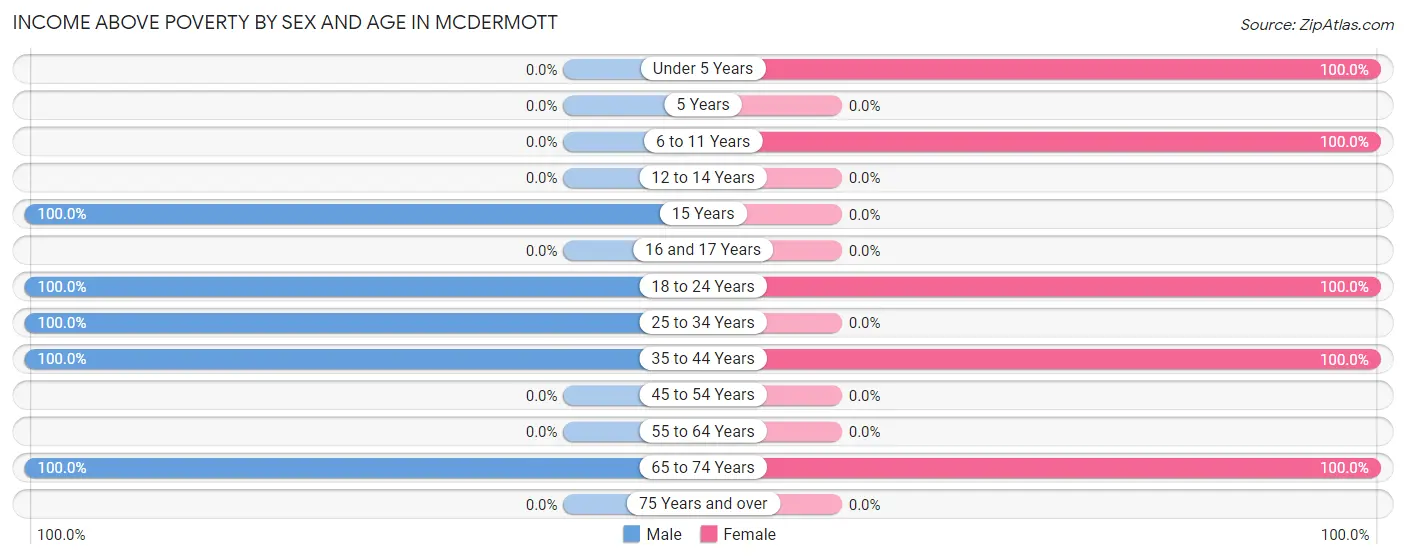
| Age Bracket | Male | Female |
| Under 5 Years | 0 (0.0%) | 128 (100.0%) |
| 5 Years | 0 (0.0%) | 0 (0.0%) |
| 6 to 11 Years | 0 (0.0%) | 102 (100.0%) |
| 12 to 14 Years | 0 (0.0%) | 0 (0.0%) |
| 15 Years | 52 (100.0%) | 0 (0.0%) |
| 16 and 17 Years | 0 (0.0%) | 0 (0.0%) |
| 18 to 24 Years | 16 (100.0%) | 49 (100.0%) |
| 25 to 34 Years | 53 (100.0%) | 0 (0.0%) |
| 35 to 44 Years | 18 (100.0%) | 67 (100.0%) |
| 45 to 54 Years | 0 (0.0%) | 0 (0.0%) |
| 55 to 64 Years | 0 (0.0%) | 0 (0.0%) |
| 65 to 74 Years | 11 (100.0%) | 11 (100.0%) |
| 75 Years and over | 0 (0.0%) | 0 (0.0%) |
| Total | 150 (100.0%) | 357 (100.0%) |
Income Below Poverty Among Married-Couple Families in McDermott
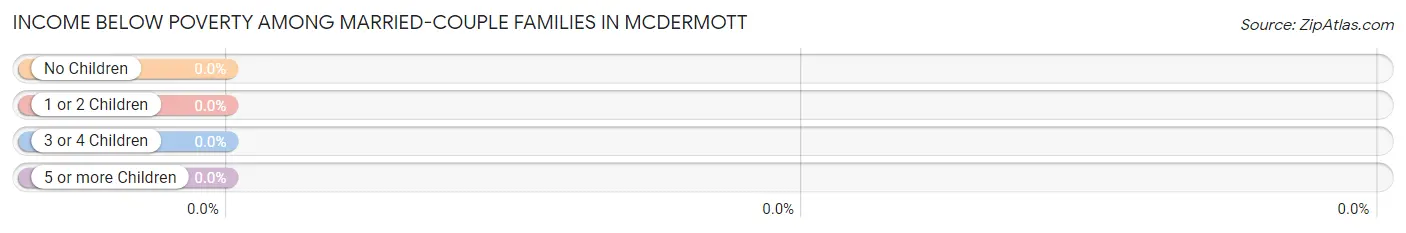
| Children | Above Poverty | Below Poverty |
| No Children | 29 (100.0%) | 0 (0.0%) |
| 1 or 2 Children | 53 (100.0%) | 0 (0.0%) |
| 3 or 4 Children | 0 (0.0%) | 0 (0.0%) |
| 5 or more Children | 0 (0.0%) | 0 (0.0%) |
| Total | 82 (100.0%) | 0 (0.0%) |
Income Below Poverty Among Single-Parent Households in McDermott
| Children | Single Father | Single Mother |
| No Children | 0 (0.0%) | 0 (0.0%) |
| 1 or 2 Children | 0 (0.0%) | 0 (0.0%) |
| 3 or 4 Children | 0 (0.0%) | 0 (0.0%) |
| 5 or more Children | 0 (0.0%) | 0 (0.0%) |
| Total | 0 (0.0%) | 0 (0.0%) |
Income Below Poverty Among Married-Couple vs Single-Parent Households in McDermott
| Children | Married-Couple Families | Single-Parent Households |
| No Children | 0 (0.0%) | 0 (0.0%) |
| 1 or 2 Children | 0 (0.0%) | 0 (0.0%) |
| 3 or 4 Children | 0 (0.0%) | 0 (0.0%) |
| 5 or more Children | 0 (0.0%) | 0 (0.0%) |
| Total | 0 (0.0%) | 0 (0.0%) |
Race in McDermott
The most populous races in McDermott are White / Caucasian (516 | 97.5%), and Black / African American (13 | 2.5%).
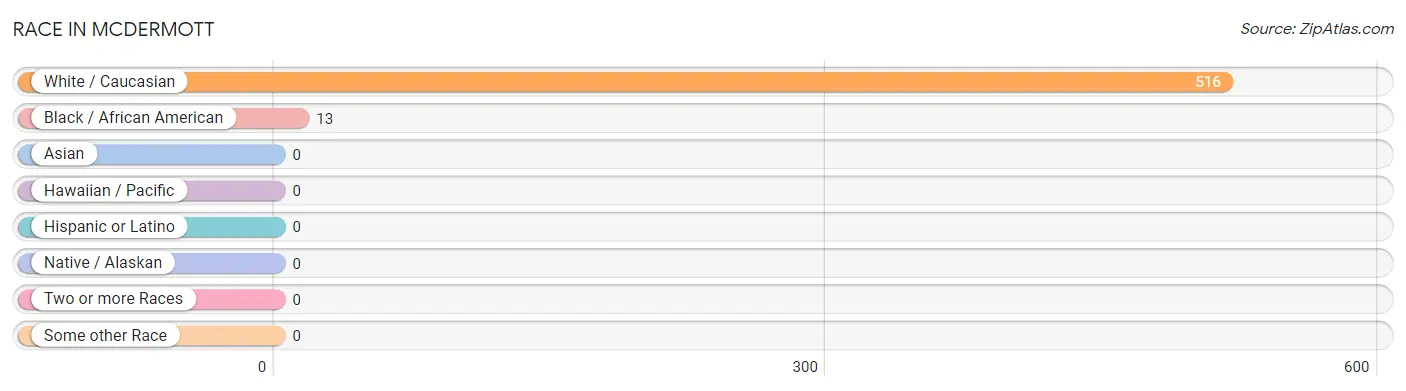
| Race | # Population | % Population |
| Asian | 0 | 0.0% |
| Black / African American | 13 | 2.5% |
| Hawaiian / Pacific | 0 | 0.0% |
| Hispanic or Latino | 0 | 0.0% |
| Native / Alaskan | 0 | 0.0% |
| White / Caucasian | 516 | 97.5% |
| Two or more Races | 0 | 0.0% |
| Some other Race | 0 | 0.0% |
| Total | 529 | 100.0% |
Ancestry in McDermott
The most populous ancestries reported in McDermott are German (18 | 3.4%), Irish (18 | 3.4%), and French Canadian (15 | 2.8%), together accounting for 9.6% of all McDermott residents.
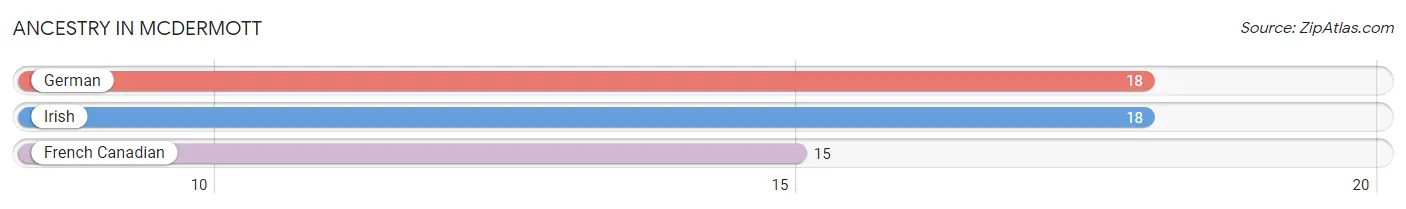
| Ancestry | # Population | % Population |
| French Canadian | 15 | 2.8% |
| German | 18 | 3.4% |
| Irish | 18 | 3.4% | View All 3 Rows |
Immigrants in McDermott

| Immigration Origin | # Population | % Population | View All 0 Rows |
Sex and Age in McDermott
Sex and Age in McDermott
The most populous age groups in McDermott are 15 to 19 Years (68 | 41.7%) for men and Under 5 Years (128 | 35.0%) for women.
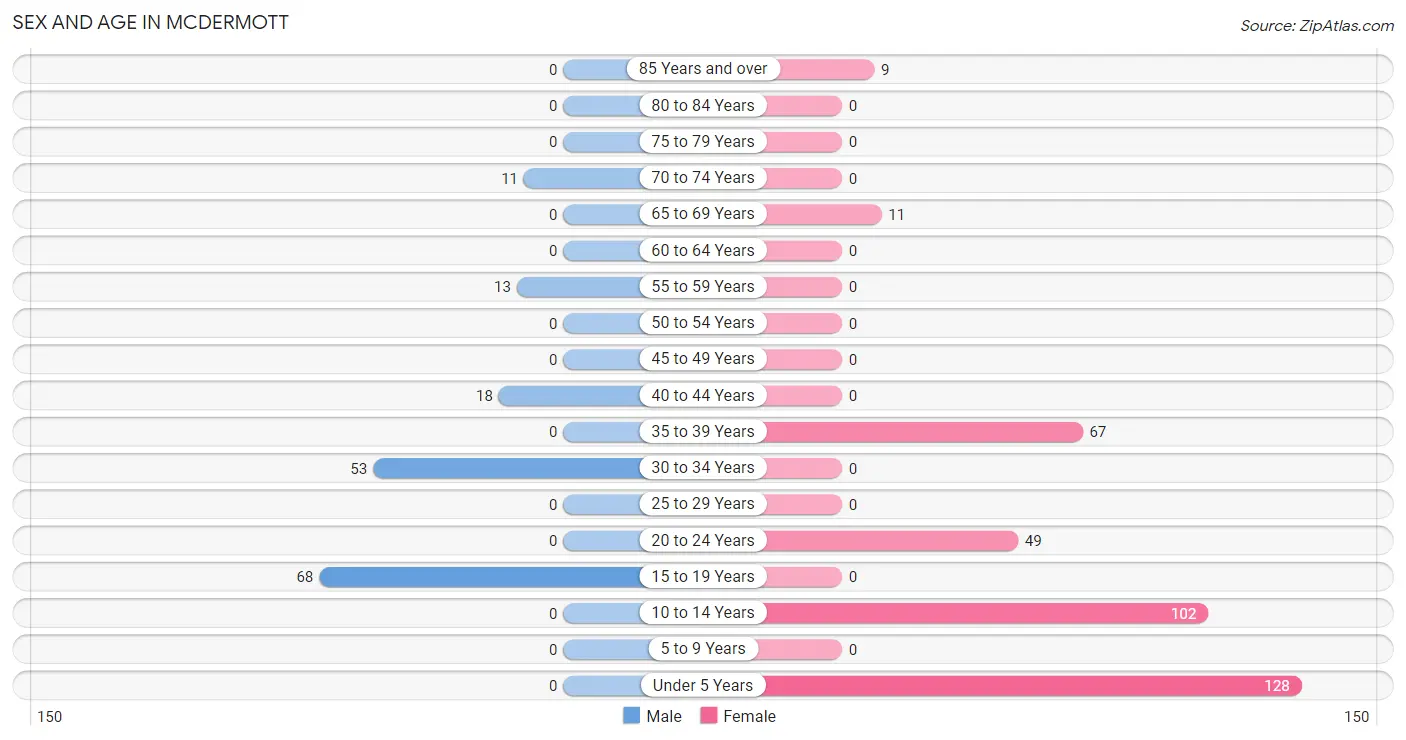
| Age Bracket | Male | Female |
| Under 5 Years | 0 (0.0%) | 128 (35.0%) |
| 5 to 9 Years | 0 (0.0%) | 0 (0.0%) |
| 10 to 14 Years | 0 (0.0%) | 102 (27.9%) |
| 15 to 19 Years | 68 (41.7%) | 0 (0.0%) |
| 20 to 24 Years | 0 (0.0%) | 49 (13.4%) |
| 25 to 29 Years | 0 (0.0%) | 0 (0.0%) |
| 30 to 34 Years | 53 (32.5%) | 0 (0.0%) |
| 35 to 39 Years | 0 (0.0%) | 67 (18.3%) |
| 40 to 44 Years | 18 (11.0%) | 0 (0.0%) |
| 45 to 49 Years | 0 (0.0%) | 0 (0.0%) |
| 50 to 54 Years | 0 (0.0%) | 0 (0.0%) |
| 55 to 59 Years | 13 (8.0%) | 0 (0.0%) |
| 60 to 64 Years | 0 (0.0%) | 0 (0.0%) |
| 65 to 69 Years | 0 (0.0%) | 11 (3.0%) |
| 70 to 74 Years | 11 (6.8%) | 0 (0.0%) |
| 75 to 79 Years | 0 (0.0%) | 0 (0.0%) |
| 80 to 84 Years | 0 (0.0%) | 0 (0.0%) |
| 85 Years and over | 0 (0.0%) | 9 (2.5%) |
| Total | 163 (100.0%) | 366 (100.0%) |
Families and Households in McDermott
Median Family Size in McDermott
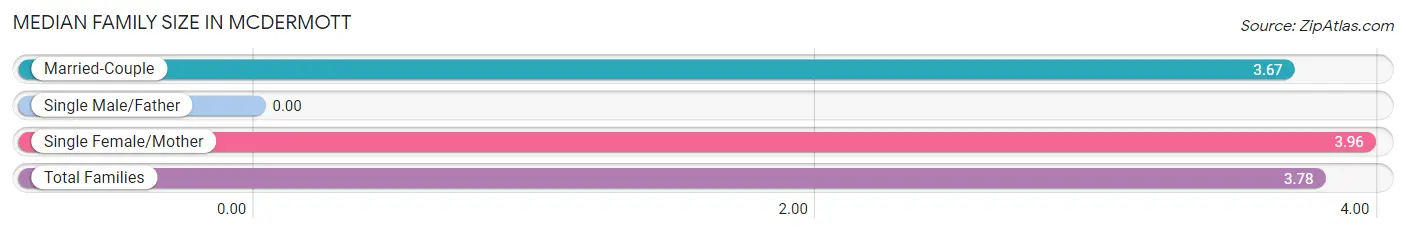
| Family Type | # Families | Family Size |
| Married-Couple | 82 (61.2%) | 3.67 |
| Single Male/Father | 0 (0.0%) | - |
| Single Female/Mother | 52 (38.8%) | 3.96 |
| Total Families | 134 (100.0%) | 3.78 |
Median Household Size in McDermott
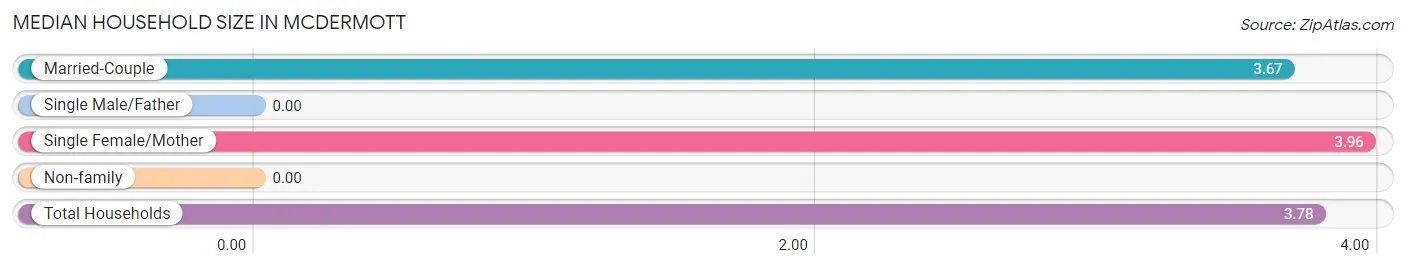
| Household Type | # Households | Household Size |
| Married-Couple | 82 (61.2%) | 3.67 |
| Single Male/Father | 0 (0.0%) | - |
| Single Female/Mother | 52 (38.8%) | 3.96 |
| Non-family | 0 (0.0%) | - |
| Total Households | 134 (100.0%) | 3.78 |
Household Size by Marriage Status in McDermott
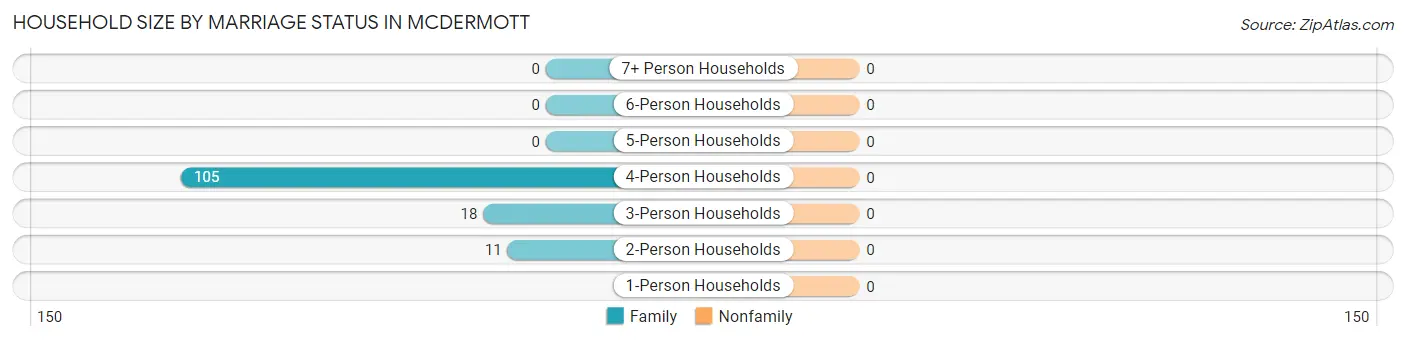
| Household Size | Family Households | Nonfamily Households |
| 1-Person Households | - | 0 (0.0%) |
| 2-Person Households | 11 (8.2%) | 0 (0.0%) |
| 3-Person Households | 18 (13.4%) | 0 (0.0%) |
| 4-Person Households | 105 (78.4%) | 0 (0.0%) |
| 5-Person Households | 0 (0.0%) | 0 (0.0%) |
| 6-Person Households | 0 (0.0%) | 0 (0.0%) |
| 7+ Person Households | 0 (0.0%) | 0 (0.0%) |
| Total | 134 (100.0%) | 0 (0.0%) |
Female Fertility in McDermott
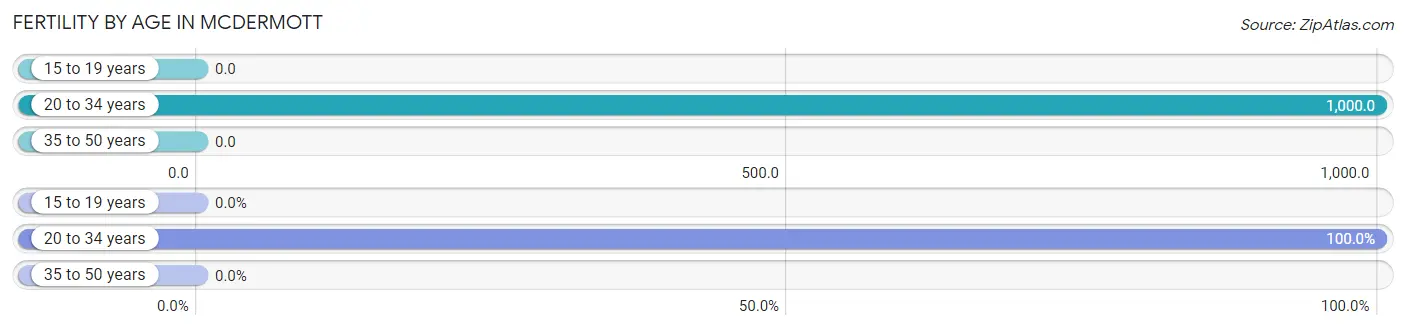
Fertility by Age in McDermott
Average fertility rate in McDermott is 422.0 births per 1,000 women. Women in the age bracket of 20 to 34 years have the highest fertility rate with 1,000.0 births per 1,000 women. Women in the age bracket of 20 to 34 years acount for 100.0% of all women with births.
| Age Bracket | Women with Births | Births / 1,000 Women |
| 15 to 19 years | 0 (0.0%) | 0.0 |
| 20 to 34 years | 49 (100.0%) | 1,000.0 |
| 35 to 50 years | 0 (0.0%) | 0.0 |
| Total | 49 (100.0%) | 422.0 |
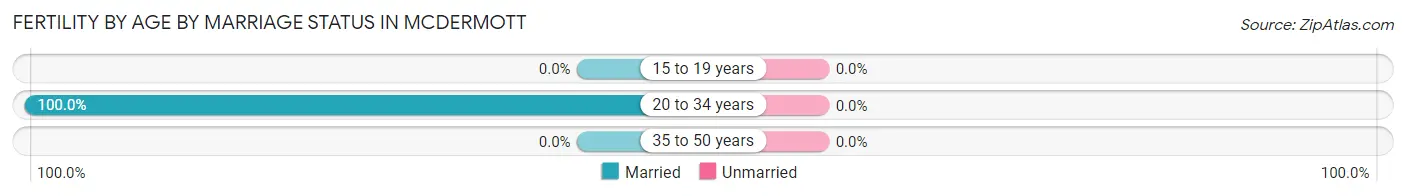
Fertility by Age by Marriage Status in McDermott
| Age Bracket | Married | Unmarried |
| 15 to 19 years | 0 (0.0%) | 0 (0.0%) |
| 20 to 34 years | 49 (100.0%) | 0 (0.0%) |
| 35 to 50 years | 0 (0.0%) | 0 (0.0%) |
| Total | 49 (100.0%) | 0 (0.0%) |
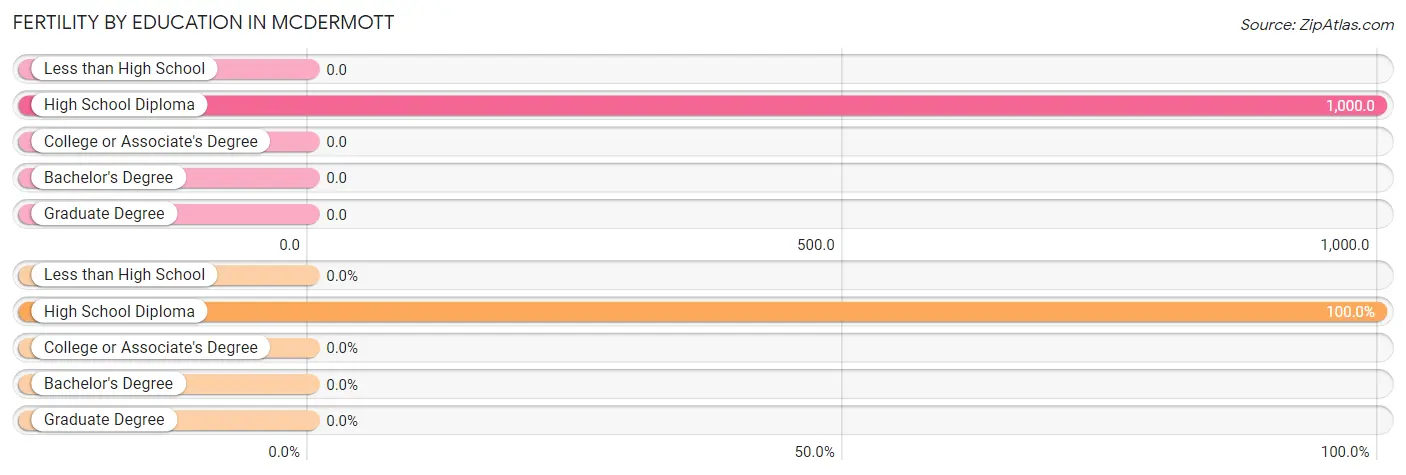
Fertility by Education in McDermott
| Educational Attainment | Women with Births | Births / 1,000 Women |
| Less than High School | 0 (0.0%) | 0.0 |
| High School Diploma | 49 (100.0%) | 1,000.0 |
| College or Associate's Degree | 0 (0.0%) | 0.0 |
| Bachelor's Degree | 0 (0.0%) | 0.0 |
| Graduate Degree | 0 (0.0%) | 0.0 |
| Total | 49 (100.0%) | 422.0 |
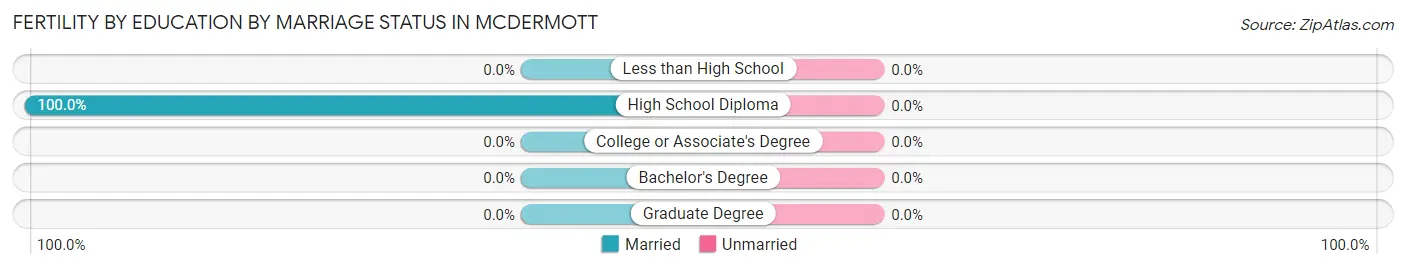
Fertility by Education by Marriage Status in McDermott
| Educational Attainment | Married | Unmarried |
| Less than High School | 0 (0.0%) | 0 (0.0%) |
| High School Diploma | 49 (100.0%) | 0 (0.0%) |
| College or Associate's Degree | 0 (0.0%) | 0 (0.0%) |
| Bachelor's Degree | 0 (0.0%) | 0 (0.0%) |
| Graduate Degree | 0 (0.0%) | 0 (0.0%) |
| Total | 49 (100.0%) | 0 (0.0%) |
Employment Characteristics in McDermott
Employment by Class of Employer in McDermott
Among the 123 employed individuals in McDermott, local government employees (53 | 43.1%), private company employees (52 | 42.3%), and self-employed (incorporated) (18 | 14.6%) make up the most common classes of employment.
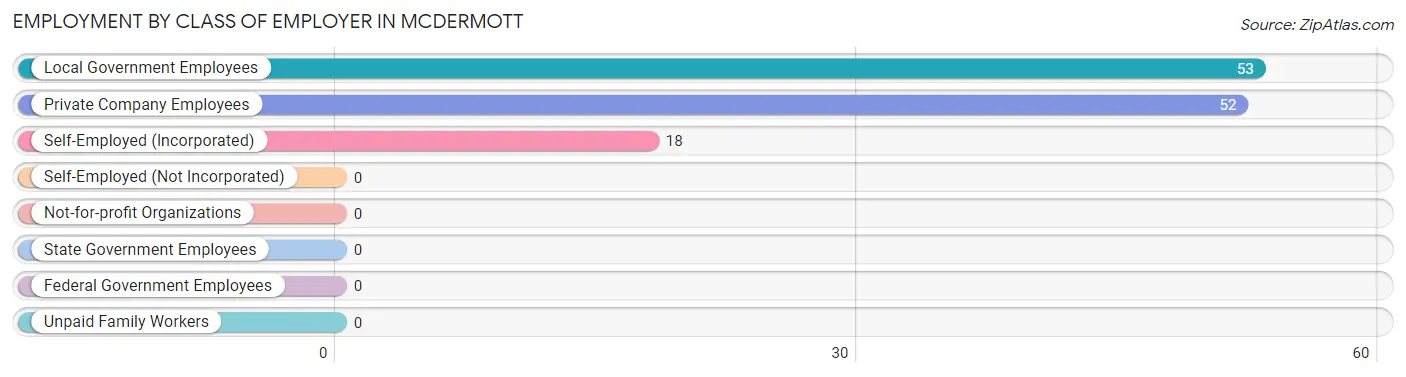
| Employer Class | # Employees | % Employees |
| Private Company Employees | 52 | 42.3% |
| Self-Employed (Incorporated) | 18 | 14.6% |
| Self-Employed (Not Incorporated) | 0 | 0.0% |
| Not-for-profit Organizations | 0 | 0.0% |
| Local Government Employees | 53 | 43.1% |
| State Government Employees | 0 | 0.0% |
| Federal Government Employees | 0 | 0.0% |
| Unpaid Family Workers | 0 | 0.0% |
| Total | 123 | 100.0% |
Employment Status by Age in McDermott
According to the labor force statistics for McDermott, out of the total population over 16 years of age (247), 76.1% or 188 individuals are in the labor force, with 8.5% or 16 of them unemployed. The age group with the highest labor force participation rate is 16 to 19 years, with 100.0% or 16 individuals in the labor force. Within the labor force, the 16 to 19 years age range has the highest percentage of unemployed individuals, with 100.0% or 16 of them being unemployed.
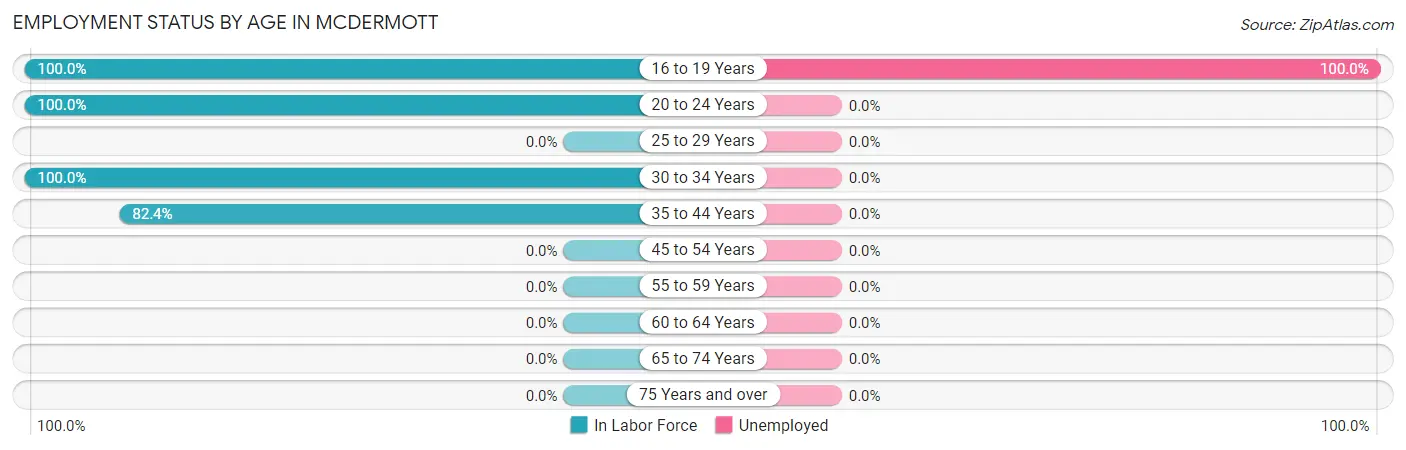
| Age Bracket | In Labor Force | Unemployed |
| 16 to 19 Years | 16 (100.0%) | 16 (100.0%) |
| 20 to 24 Years | 49 (100.0%) | 0 (0.0%) |
| 25 to 29 Years | 0 (0.0%) | 0 (0.0%) |
| 30 to 34 Years | 53 (100.0%) | 0 (0.0%) |
| 35 to 44 Years | 70 (82.4%) | 0 (0.0%) |
| 45 to 54 Years | 0 (0.0%) | 0 (0.0%) |
| 55 to 59 Years | 0 (0.0%) | 0 (0.0%) |
| 60 to 64 Years | 0 (0.0%) | 0 (0.0%) |
| 65 to 74 Years | 0 (0.0%) | 0 (0.0%) |
| 75 Years and over | 0 (0.0%) | 0 (0.0%) |
| Total | 188 (76.1%) | 16 (8.5%) |
Employment Status by Educational Attainment in McDermott
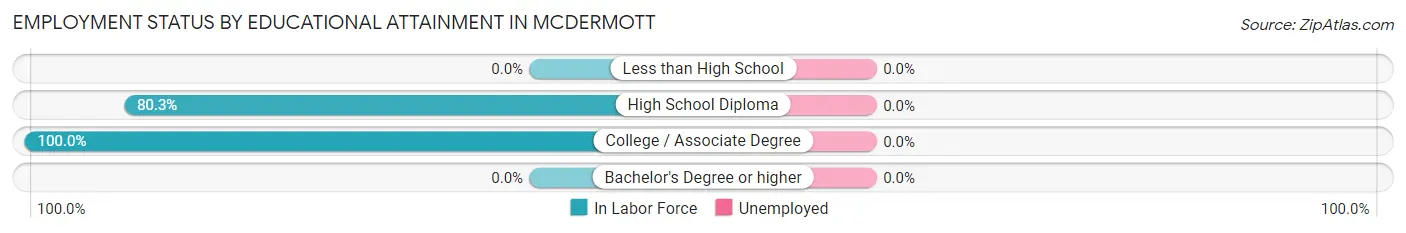
| Educational Attainment | In Labor Force | Unemployed |
| Less than High School | 0 (0.0%) | 0 (0.0%) |
| High School Diploma | 53 (80.3%) | 0 (0.0%) |
| College / Associate Degree | 70 (100.0%) | 0 (0.0%) |
| Bachelor's Degree or higher | 0 (0.0%) | 0 (0.0%) |
| Total | 123 (81.5%) | 0 (0.0%) |
Employment Occupations by Sex in McDermott
Management, Business, Science and Arts Occupations
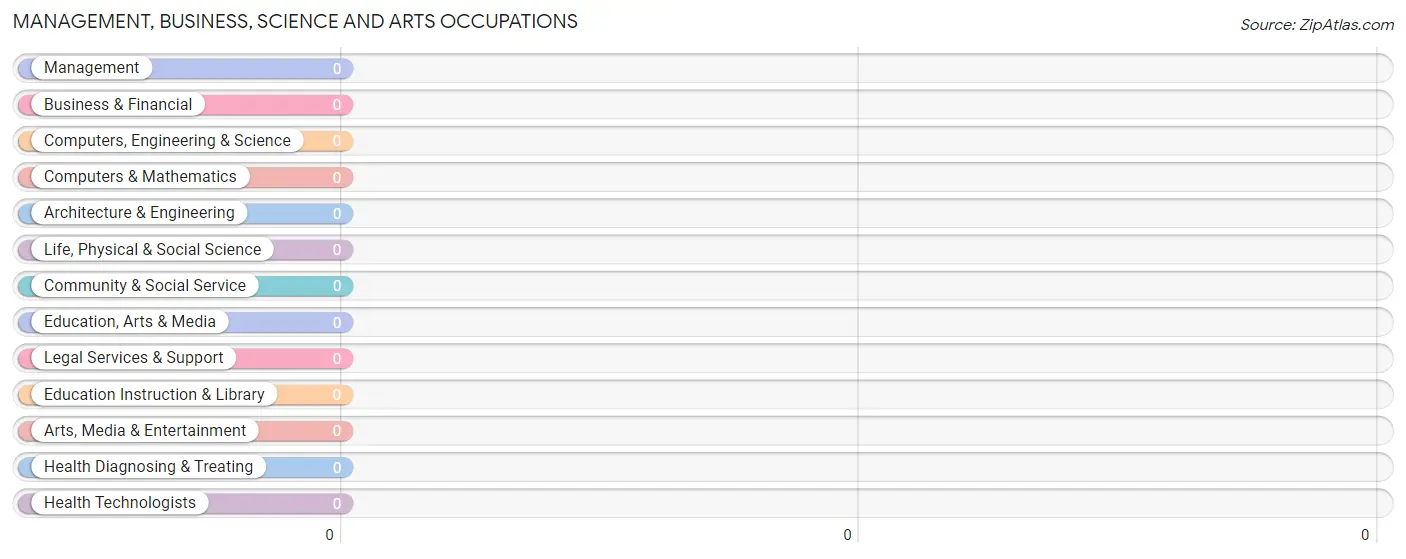
Management, Business, Science and Arts Occupations by Sex
| Occupation | Male | Female |
| Management | 0 (0.0%) | 0 (0.0%) |
| Business & Financial | 0 (0.0%) | 0 (0.0%) |
| Computers, Engineering & Science | 0 (0.0%) | 0 (0.0%) |
| Computers & Mathematics | 0 (0.0%) | 0 (0.0%) |
| Architecture & Engineering | 0 (0.0%) | 0 (0.0%) |
| Life, Physical & Social Science | 0 (0.0%) | 0 (0.0%) |
| Community & Social Service | 0 (0.0%) | 0 (0.0%) |
| Education, Arts & Media | 0 (0.0%) | 0 (0.0%) |
| Legal Services & Support | 0 (0.0%) | 0 (0.0%) |
| Education Instruction & Library | 0 (0.0%) | 0 (0.0%) |
| Arts, Media & Entertainment | 0 (0.0%) | 0 (0.0%) |
| Health Diagnosing & Treating | 0 (0.0%) | 0 (0.0%) |
| Health Technologists | 0 (0.0%) | 0 (0.0%) |
| Total (Category) | 0 (0.0%) | 0 (0.0%) |
| Total (Overall) | 71 (41.3%) | 101 (58.7%) |
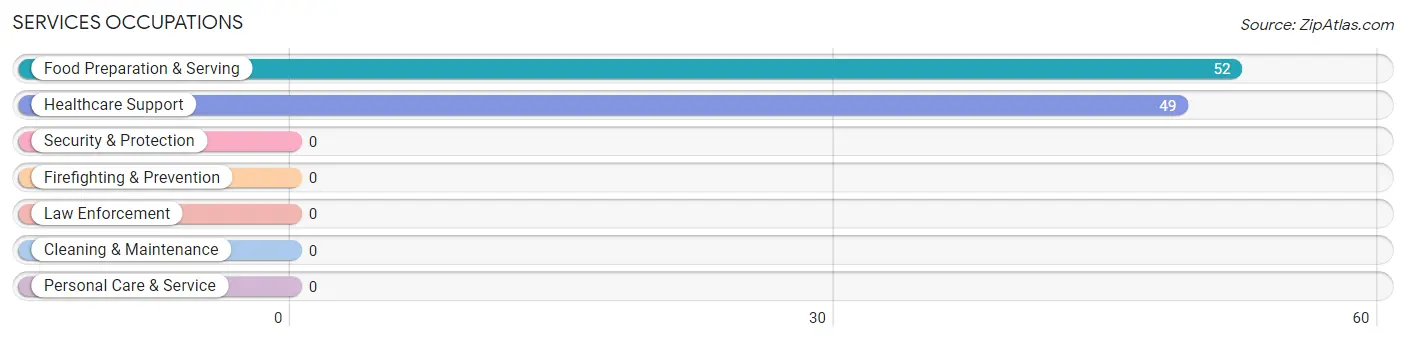
Services Occupations
The most common Services occupations in McDermott are Food Preparation & Serving (52 | 30.2%), and Healthcare Support (49 | 28.5%).
Services Occupations by Sex
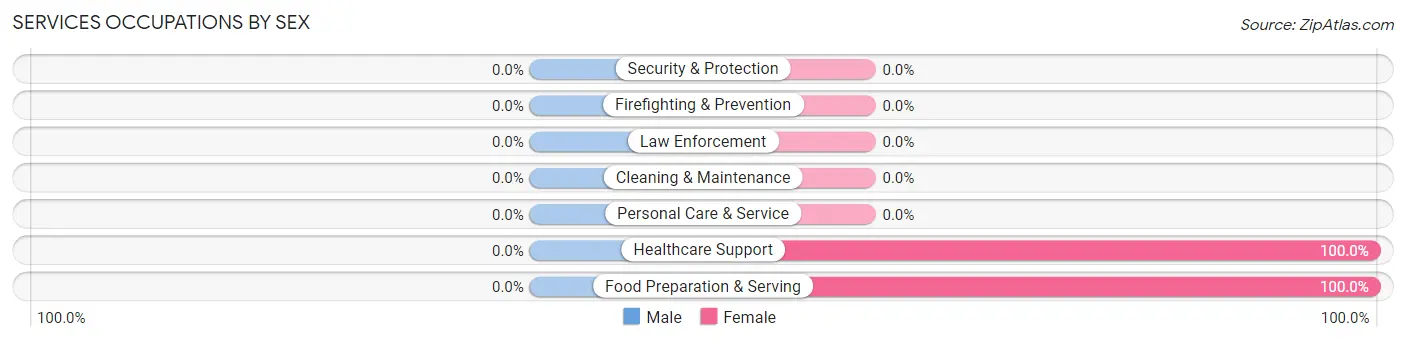
| Occupation | Male | Female |
| Healthcare Support | 0 (0.0%) | 49 (100.0%) |
| Security & Protection | 0 (0.0%) | 0 (0.0%) |
| Firefighting & Prevention | 0 (0.0%) | 0 (0.0%) |
| Law Enforcement | 0 (0.0%) | 0 (0.0%) |
| Food Preparation & Serving | 0 (0.0%) | 52 (100.0%) |
| Cleaning & Maintenance | 0 (0.0%) | 0 (0.0%) |
| Personal Care & Service | 0 (0.0%) | 0 (0.0%) |
| Total (Category) | 0 (0.0%) | 101 (100.0%) |
| Total (Overall) | 71 (41.3%) | 101 (58.7%) |
Sales and Office Occupations
Sales and Office Occupations by Sex
| Occupation | Male | Female |
| Sales & Related | 0 (0.0%) | 0 (0.0%) |
| Office & Administration | 0 (0.0%) | 0 (0.0%) |
| Total (Category) | 0 (0.0%) | 0 (0.0%) |
| Total (Overall) | 71 (41.3%) | 101 (58.7%) |
Natural Resources, Construction and Maintenance Occupations
The most common Natural Resources, Construction and Maintenance occupations in McDermott are , and Construction & Extraction (71 | 41.3%).
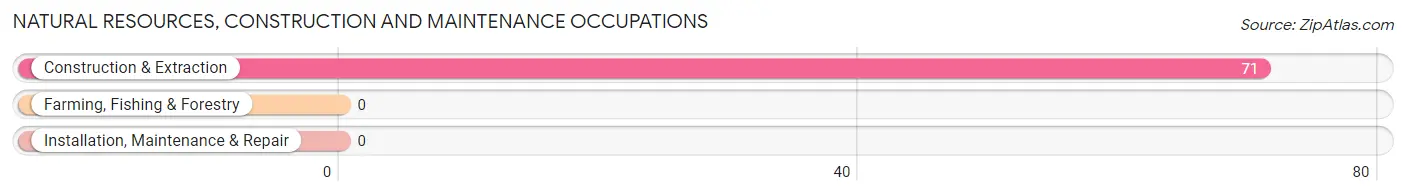
Natural Resources, Construction and Maintenance Occupations by Sex
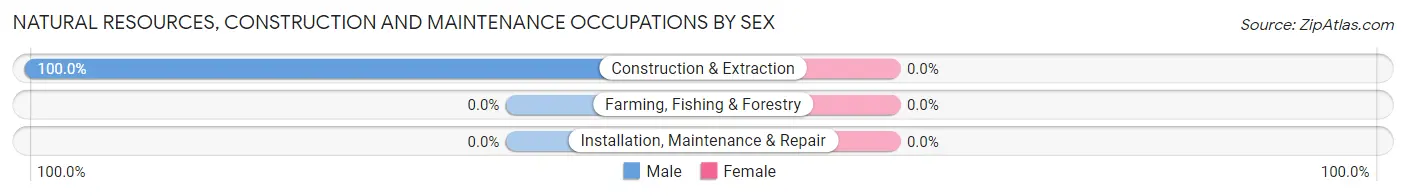
| Occupation | Male | Female |
| Farming, Fishing & Forestry | 0 (0.0%) | 0 (0.0%) |
| Construction & Extraction | 71 (100.0%) | 0 (0.0%) |
| Installation, Maintenance & Repair | 0 (0.0%) | 0 (0.0%) |
| Total (Category) | 71 (100.0%) | 0 (0.0%) |
| Total (Overall) | 71 (41.3%) | 101 (58.7%) |
Production, Transportation and Moving Occupations
Production, Transportation and Moving Occupations by Sex
| Occupation | Male | Female |
| Production | 0 (0.0%) | 0 (0.0%) |
| Transportation | 0 (0.0%) | 0 (0.0%) |
| Material Moving | 0 (0.0%) | 0 (0.0%) |
| Total (Category) | 0 (0.0%) | 0 (0.0%) |
| Total (Overall) | 71 (41.3%) | 101 (58.7%) |
Employment Industries by Sex in McDermott
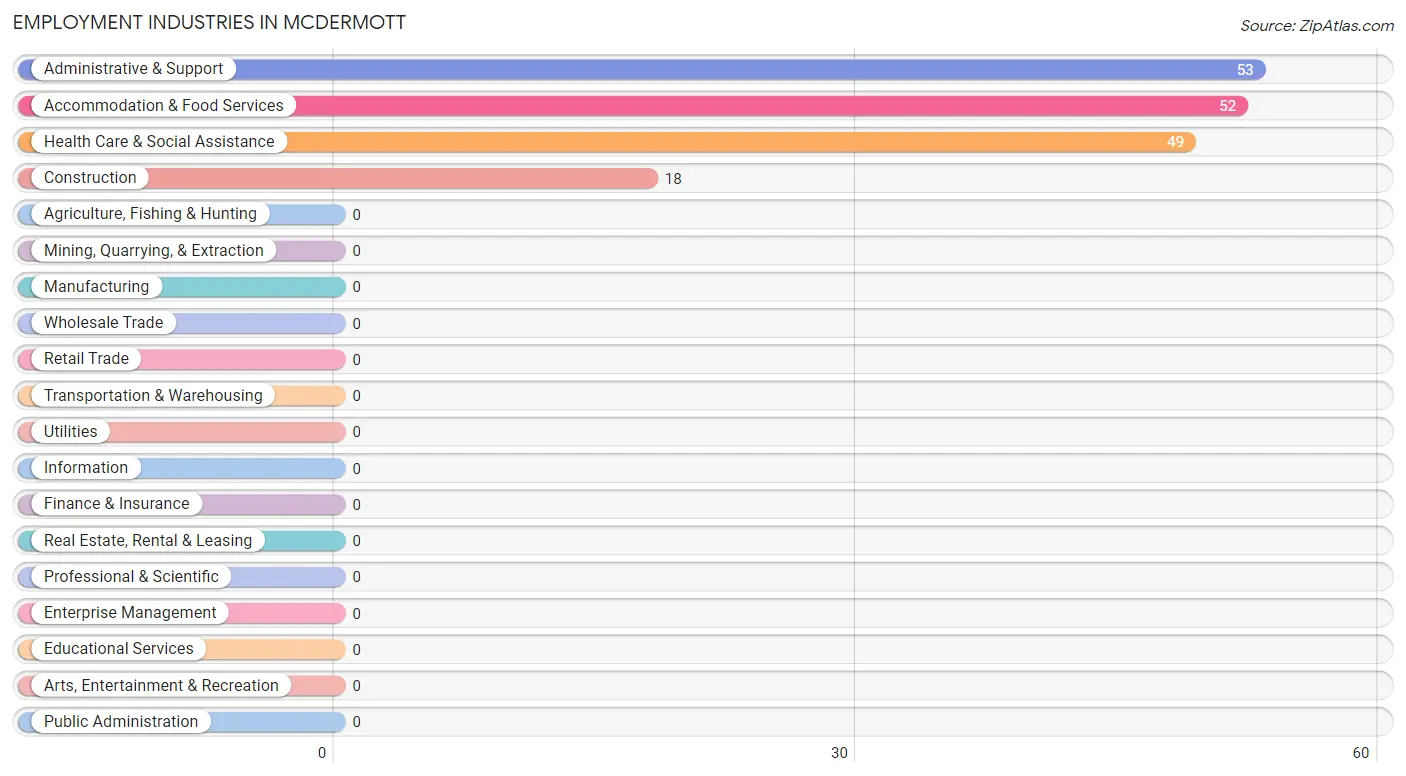
Employment Industries in McDermott
The major employment industries in McDermott include Administrative & Support (53 | 30.8%), Accommodation & Food Services (52 | 30.2%), Health Care & Social Assistance (49 | 28.5%), and Construction (18 | 10.5%).
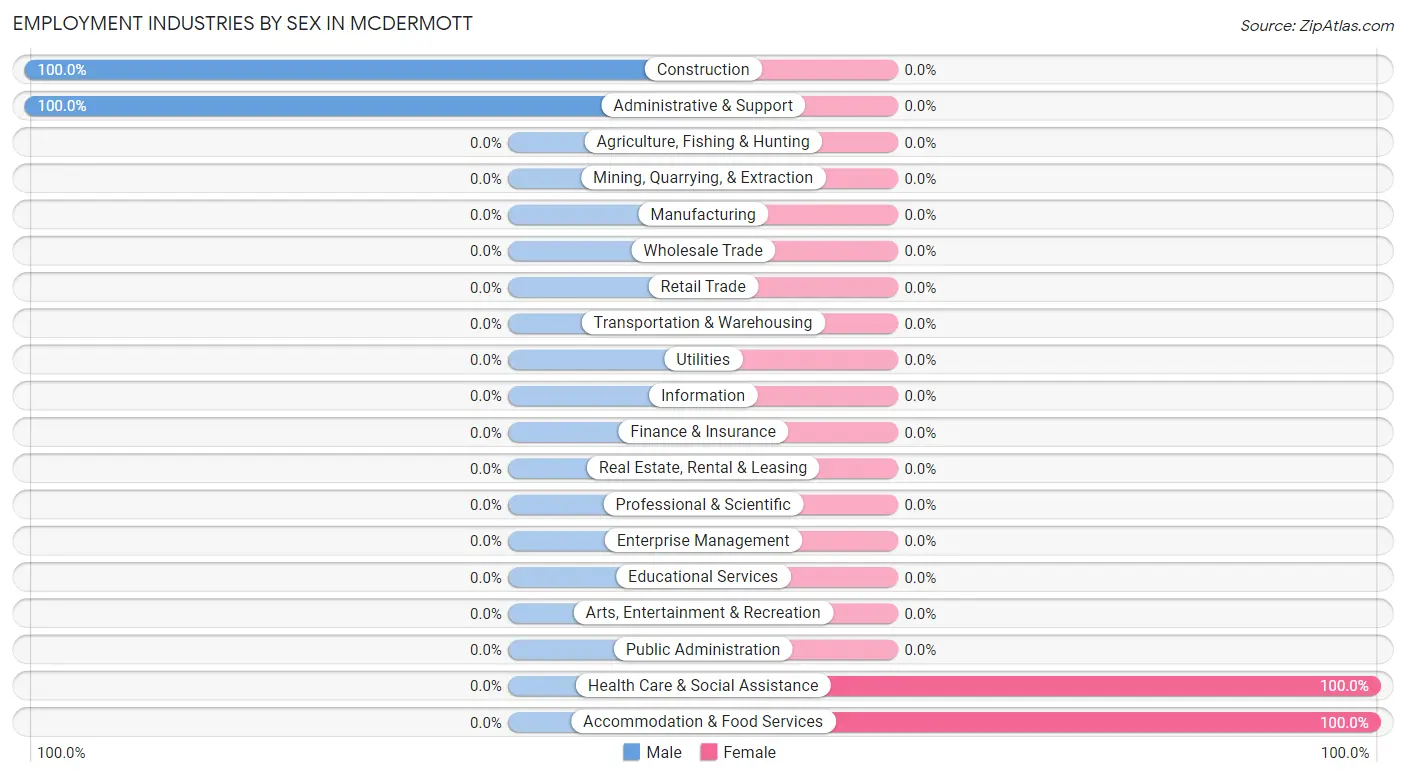
Employment Industries by Sex in McDermott
The McDermott industries that see more men than women are Construction (100.0%), and Administrative & Support (100.0%), whereas the industries that tend to have a higher number of women are Health Care & Social Assistance (100.0%), and Accommodation & Food Services (100.0%).
| Industry | Male | Female |
| Agriculture, Fishing & Hunting | 0 (0.0%) | 0 (0.0%) |
| Mining, Quarrying, & Extraction | 0 (0.0%) | 0 (0.0%) |
| Construction | 18 (100.0%) | 0 (0.0%) |
| Manufacturing | 0 (0.0%) | 0 (0.0%) |
| Wholesale Trade | 0 (0.0%) | 0 (0.0%) |
| Retail Trade | 0 (0.0%) | 0 (0.0%) |
| Transportation & Warehousing | 0 (0.0%) | 0 (0.0%) |
| Utilities | 0 (0.0%) | 0 (0.0%) |
| Information | 0 (0.0%) | 0 (0.0%) |
| Finance & Insurance | 0 (0.0%) | 0 (0.0%) |
| Real Estate, Rental & Leasing | 0 (0.0%) | 0 (0.0%) |
| Professional & Scientific | 0 (0.0%) | 0 (0.0%) |
| Enterprise Management | 0 (0.0%) | 0 (0.0%) |
| Administrative & Support | 53 (100.0%) | 0 (0.0%) |
| Educational Services | 0 (0.0%) | 0 (0.0%) |
| Health Care & Social Assistance | 0 (0.0%) | 49 (100.0%) |
| Arts, Entertainment & Recreation | 0 (0.0%) | 0 (0.0%) |
| Accommodation & Food Services | 0 (0.0%) | 52 (100.0%) |
| Public Administration | 0 (0.0%) | 0 (0.0%) |
| Total | 71 (41.3%) | 101 (58.7%) |
Education in McDermott
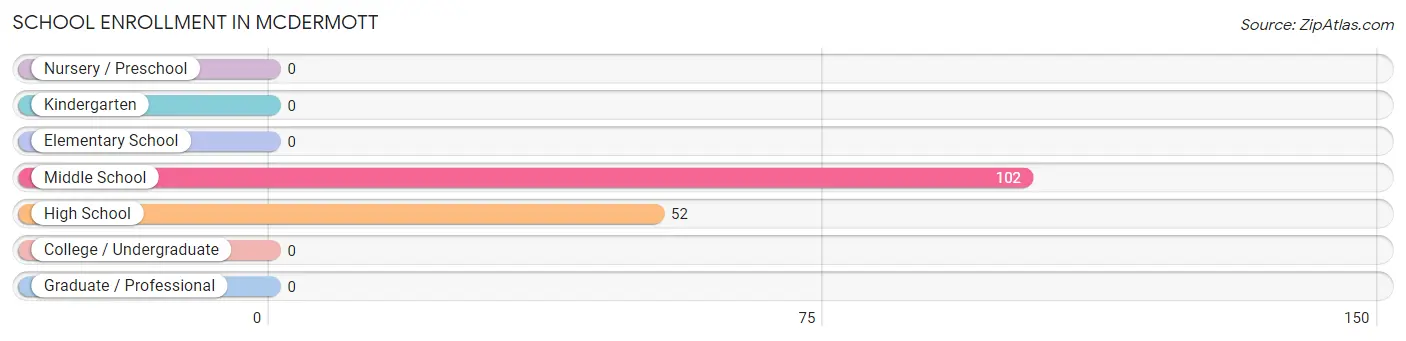
School Enrollment in McDermott
The most common levels of schooling among the 154 students in McDermott are middle school (102 | 66.2%), and high school (52 | 33.8%).
| School Level | # Students | % Students |
| Nursery / Preschool | 0 | 0.0% |
| Kindergarten | 0 | 0.0% |
| Elementary School | 0 | 0.0% |
| Middle School | 102 | 66.2% |
| High School | 52 | 33.8% |
| College / Undergraduate | 0 | 0.0% |
| Graduate / Professional | 0 | 0.0% |
| Total | 154 | 100.0% |
School Enrollment by Age by Funding Source in McDermott
Out of a total of 154 students who are enrolled in schools in McDermott, 52 (33.8%) attend a private institution, while the remaining 102 (66.2%) are enrolled in public schools. The age group of 15 to 17 year olds has the highest likelihood of being enrolled in private schools, with 52 (100.0% in the age bracket) enrolled. Conversely, the age group of 10 to 14 year olds has the lowest likelihood of being enrolled in a private school, with 102 (100.0% in the age bracket) attending a public institution.
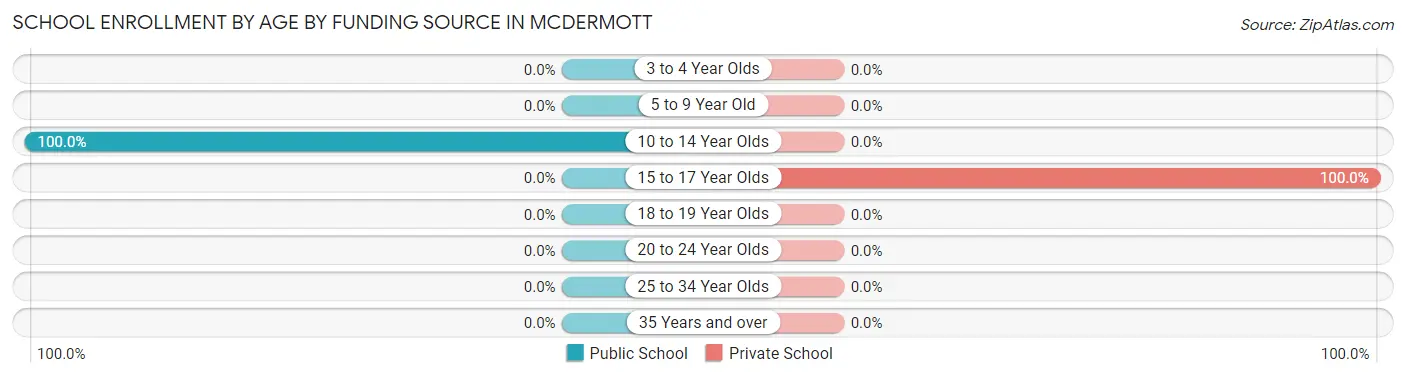
| Age Bracket | Public School | Private School |
| 3 to 4 Year Olds | 0 (0.0%) | 0 (0.0%) |
| 5 to 9 Year Old | 0 (0.0%) | 0 (0.0%) |
| 10 to 14 Year Olds | 102 (100.0%) | 0 (0.0%) |
| 15 to 17 Year Olds | 0 (0.0%) | 52 (100.0%) |
| 18 to 19 Year Olds | 0 (0.0%) | 0 (0.0%) |
| 20 to 24 Year Olds | 0 (0.0%) | 0 (0.0%) |
| 25 to 34 Year Olds | 0 (0.0%) | 0 (0.0%) |
| 35 Years and over | 0 (0.0%) | 0 (0.0%) |
| Total | 102 (66.2%) | 52 (33.8%) |
Educational Attainment by Field of Study in McDermott
, and education (11 | 100.0%) are the most common fields of study among 11 individuals in McDermott who have obtained a bachelor's degree or higher.
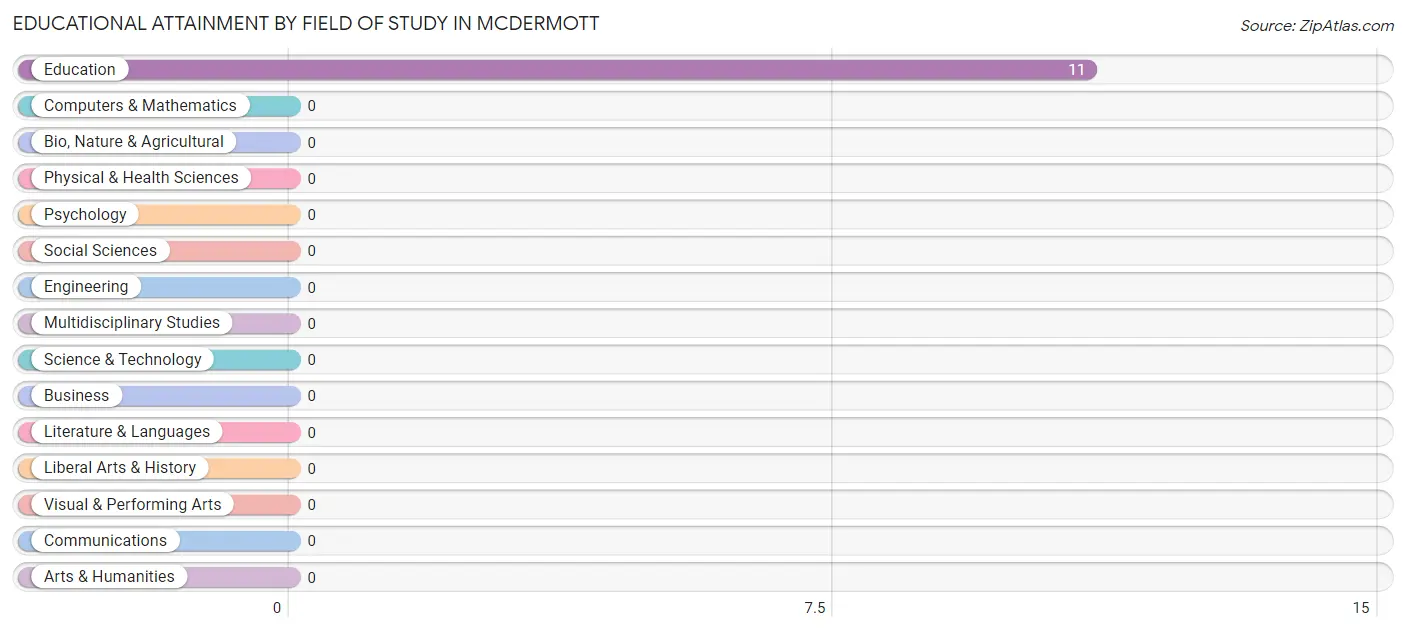
| Field of Study | # Graduates | % Graduates |
| Computers & Mathematics | 0 | 0.0% |
| Bio, Nature & Agricultural | 0 | 0.0% |
| Physical & Health Sciences | 0 | 0.0% |
| Psychology | 0 | 0.0% |
| Social Sciences | 0 | 0.0% |
| Engineering | 0 | 0.0% |
| Multidisciplinary Studies | 0 | 0.0% |
| Science & Technology | 0 | 0.0% |
| Business | 0 | 0.0% |
| Education | 11 | 100.0% |
| Literature & Languages | 0 | 0.0% |
| Liberal Arts & History | 0 | 0.0% |
| Visual & Performing Arts | 0 | 0.0% |
| Communications | 0 | 0.0% |
| Arts & Humanities | 0 | 0.0% |
| Total | 11 | 100.0% |
Transportation & Commute in McDermott
Vehicle Availability by Sex in McDermott
The most prevalent vehicle ownership categories in McDermott are males with 2 vehicles (71, accounting for 100.0%) and females with 2 vehicles (0, making up 136.5%).
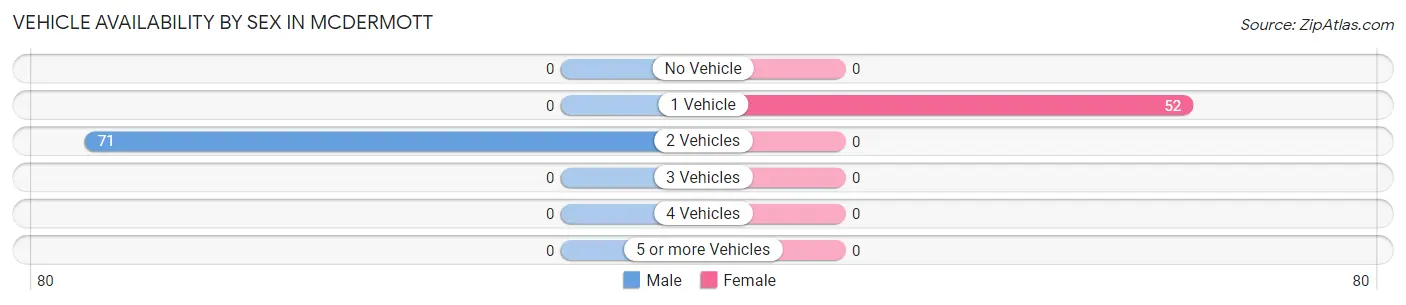
| Vehicles Available | Male | Female |
| No Vehicle | 0 (0.0%) | 0 (0.0%) |
| 1 Vehicle | 0 (0.0%) | 52 (100.0%) |
| 2 Vehicles | 71 (100.0%) | 0 (0.0%) |
| 3 Vehicles | 0 (0.0%) | 0 (0.0%) |
| 4 Vehicles | 0 (0.0%) | 0 (0.0%) |
| 5 or more Vehicles | 0 (0.0%) | 0 (0.0%) |
| Total | 71 (100.0%) | 52 (100.0%) |
Commute Time in McDermott
The most frequently occuring commute durations in McDermott are 25 to 29 minutes (53 commuters, 43.1%), 5 to 9 minutes (52 commuters, 42.3%), and 30 to 34 minutes (18 commuters, 14.6%).
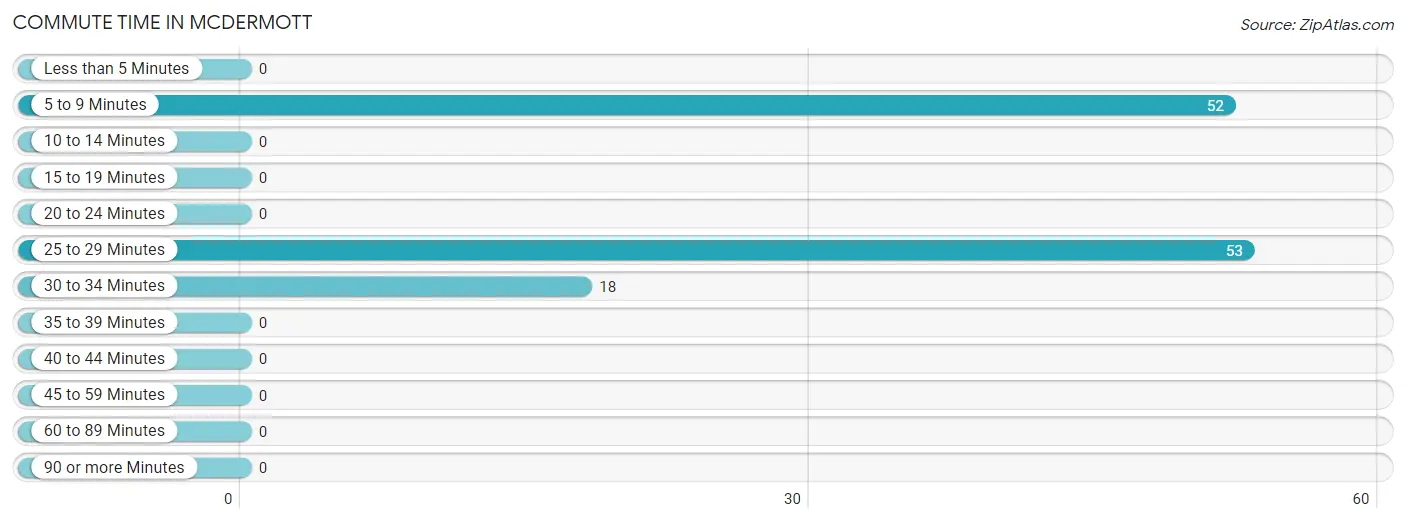
| Commute Time | # Commuters | % Commuters |
| Less than 5 Minutes | 0 | 0.0% |
| 5 to 9 Minutes | 52 | 42.3% |
| 10 to 14 Minutes | 0 | 0.0% |
| 15 to 19 Minutes | 0 | 0.0% |
| 20 to 24 Minutes | 0 | 0.0% |
| 25 to 29 Minutes | 53 | 43.1% |
| 30 to 34 Minutes | 18 | 14.6% |
| 35 to 39 Minutes | 0 | 0.0% |
| 40 to 44 Minutes | 0 | 0.0% |
| 45 to 59 Minutes | 0 | 0.0% |
| 60 to 89 Minutes | 0 | 0.0% |
| 90 or more Minutes | 0 | 0.0% |
Commute Time by Sex in McDermott
The most common commute times in McDermott are 25 to 29 minutes (53 commuters, 74.7%) for males and 5 to 9 minutes (52 commuters, 100.0%) for females.
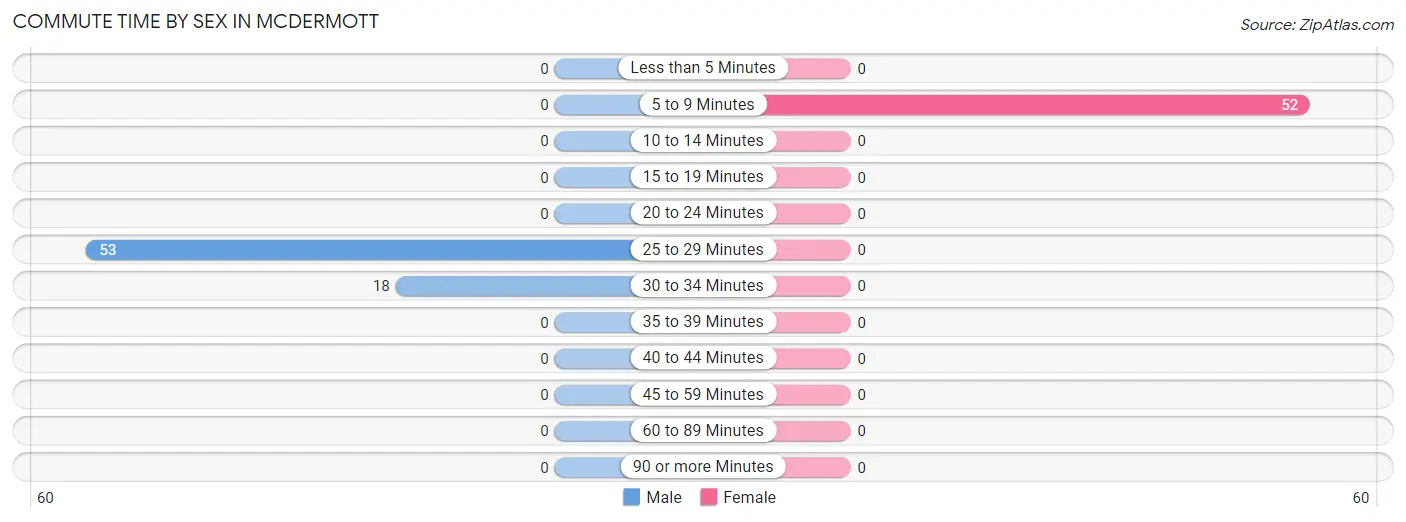
| Commute Time | Male | Female |
| Less than 5 Minutes | 0 (0.0%) | 0 (0.0%) |
| 5 to 9 Minutes | 0 (0.0%) | 52 (100.0%) |
| 10 to 14 Minutes | 0 (0.0%) | 0 (0.0%) |
| 15 to 19 Minutes | 0 (0.0%) | 0 (0.0%) |
| 20 to 24 Minutes | 0 (0.0%) | 0 (0.0%) |
| 25 to 29 Minutes | 53 (74.7%) | 0 (0.0%) |
| 30 to 34 Minutes | 18 (25.4%) | 0 (0.0%) |
| 35 to 39 Minutes | 0 (0.0%) | 0 (0.0%) |
| 40 to 44 Minutes | 0 (0.0%) | 0 (0.0%) |
| 45 to 59 Minutes | 0 (0.0%) | 0 (0.0%) |
| 60 to 89 Minutes | 0 (0.0%) | 0 (0.0%) |
| 90 or more Minutes | 0 (0.0%) | 0 (0.0%) |
Time of Departure to Work by Sex in McDermott
The most frequent times of departure to work in McDermott are 6:00 AM to 6:29 AM (53, 74.7%) for males and 12:00 PM to 3:59 PM (52, 100.0%) for females.
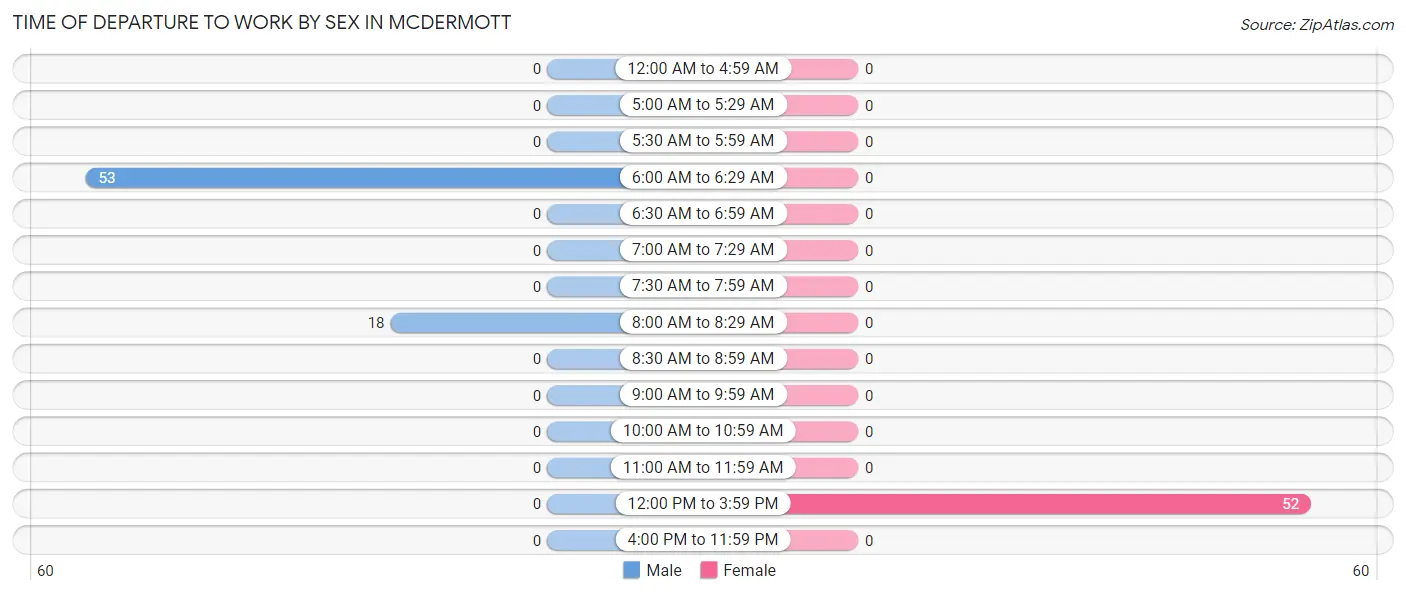
| Time of Departure | Male | Female |
| 12:00 AM to 4:59 AM | 0 (0.0%) | 0 (0.0%) |
| 5:00 AM to 5:29 AM | 0 (0.0%) | 0 (0.0%) |
| 5:30 AM to 5:59 AM | 0 (0.0%) | 0 (0.0%) |
| 6:00 AM to 6:29 AM | 53 (74.7%) | 0 (0.0%) |
| 6:30 AM to 6:59 AM | 0 (0.0%) | 0 (0.0%) |
| 7:00 AM to 7:29 AM | 0 (0.0%) | 0 (0.0%) |
| 7:30 AM to 7:59 AM | 0 (0.0%) | 0 (0.0%) |
| 8:00 AM to 8:29 AM | 18 (25.4%) | 0 (0.0%) |
| 8:30 AM to 8:59 AM | 0 (0.0%) | 0 (0.0%) |
| 9:00 AM to 9:59 AM | 0 (0.0%) | 0 (0.0%) |
| 10:00 AM to 10:59 AM | 0 (0.0%) | 0 (0.0%) |
| 11:00 AM to 11:59 AM | 0 (0.0%) | 0 (0.0%) |
| 12:00 PM to 3:59 PM | 0 (0.0%) | 52 (100.0%) |
| 4:00 PM to 11:59 PM | 0 (0.0%) | 0 (0.0%) |
| Total | 71 (100.0%) | 52 (100.0%) |
Housing Occupancy in McDermott
Occupancy by Ownership in McDermott
Of the total 134 dwellings in McDermott, owner-occupied units account for 134 (100.0%), while renter-occupied units make up 0 (0.0%).
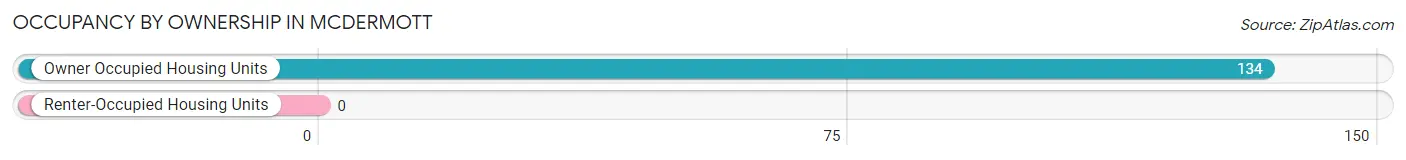
| Occupancy | # Housing Units | % Housing Units |
| Owner Occupied Housing Units | 134 | 100.0% |
| Renter-Occupied Housing Units | 0 | 0.0% |
| Total Occupied Housing Units | 134 | 100.0% |
Occupancy by Household Size in McDermott
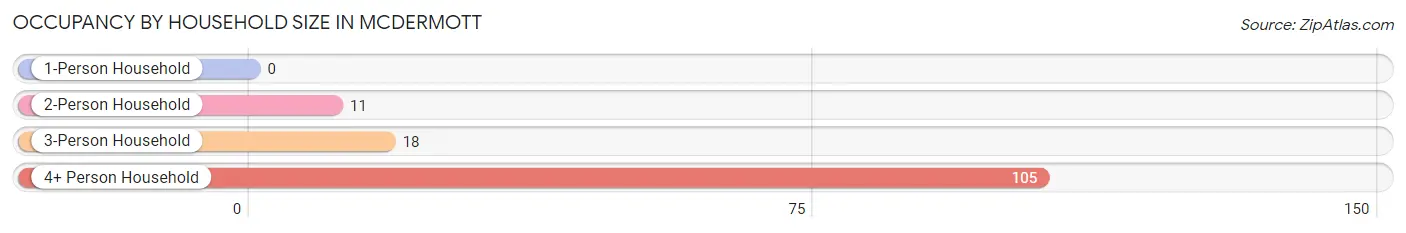
| Household Size | # Housing Units | % Housing Units |
| 1-Person Household | 0 | 0.0% |
| 2-Person Household | 11 | 8.2% |
| 3-Person Household | 18 | 13.4% |
| 4+ Person Household | 105 | 78.4% |
| Total Housing Units | 134 | 100.0% |
Occupancy by Ownership by Household Size in McDermott
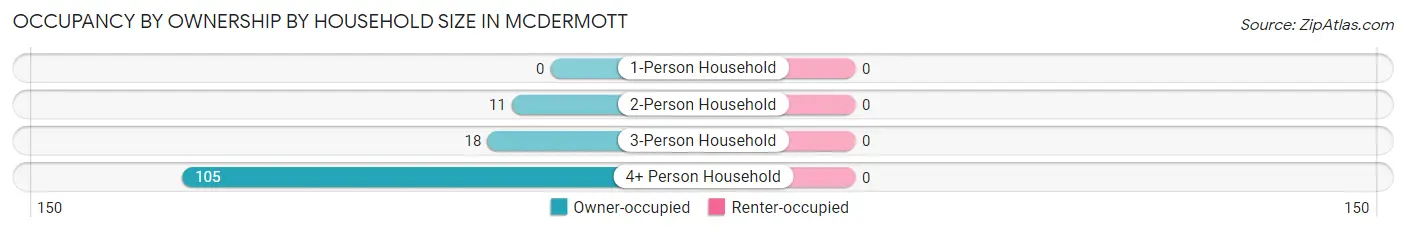
| Household Size | Owner-occupied | Renter-occupied |
| 1-Person Household | 0 (0.0%) | 0 (0.0%) |
| 2-Person Household | 11 (100.0%) | 0 (0.0%) |
| 3-Person Household | 18 (100.0%) | 0 (0.0%) |
| 4+ Person Household | 105 (100.0%) | 0 (0.0%) |
| Total Housing Units | 134 (100.0%) | 0 (0.0%) |
Occupancy by Educational Attainment in McDermott
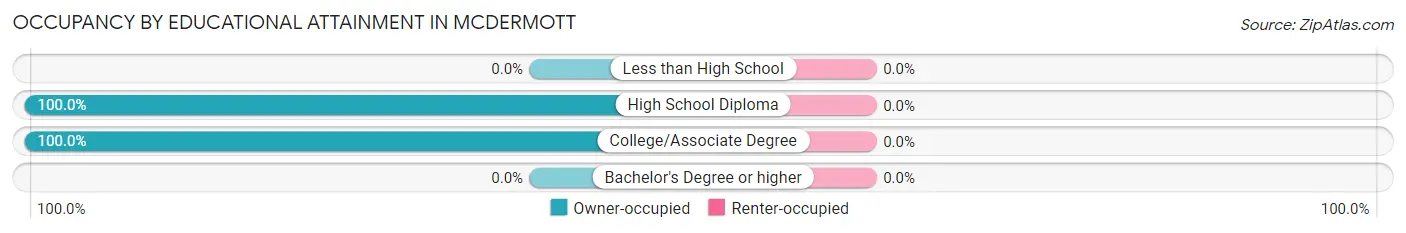
| Household Size | Owner-occupied | Renter-occupied |
| Less than High School | 0 (0.0%) | 0 (0.0%) |
| High School Diploma | 64 (100.0%) | 0 (0.0%) |
| College/Associate Degree | 70 (100.0%) | 0 (0.0%) |
| Bachelor's Degree or higher | 0 (0.0%) | 0 (0.0%) |
Occupancy by Age of Householder in McDermott
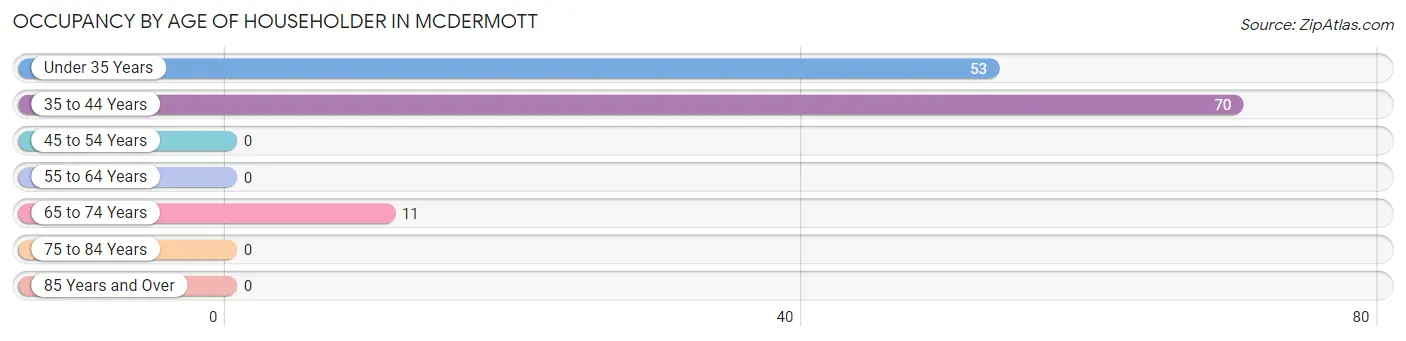
| Age Bracket | # Households | % Households |
| Under 35 Years | 53 | 39.6% |
| 35 to 44 Years | 70 | 52.2% |
| 45 to 54 Years | 0 | 0.0% |
| 55 to 64 Years | 0 | 0.0% |
| 65 to 74 Years | 11 | 8.2% |
| 75 to 84 Years | 0 | 0.0% |
| 85 Years and Over | 0 | 0.0% |
| Total | 134 | 100.0% |
Housing Finances in McDermott
Median Income by Occupancy in McDermott
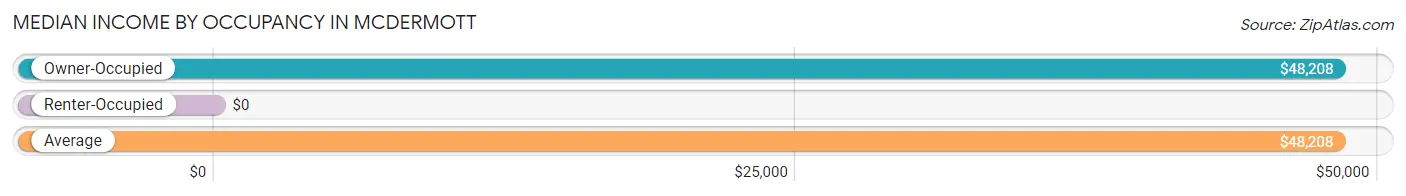
| Occupancy Type | # Households | Median Income |
| Owner-Occupied | 134 (100.0%) | $48,208 |
| Renter-Occupied | 0 (0.0%) | $0 |
| Average | 134 (100.0%) | $48,208 |
Occupancy by Householder Income Bracket in McDermott
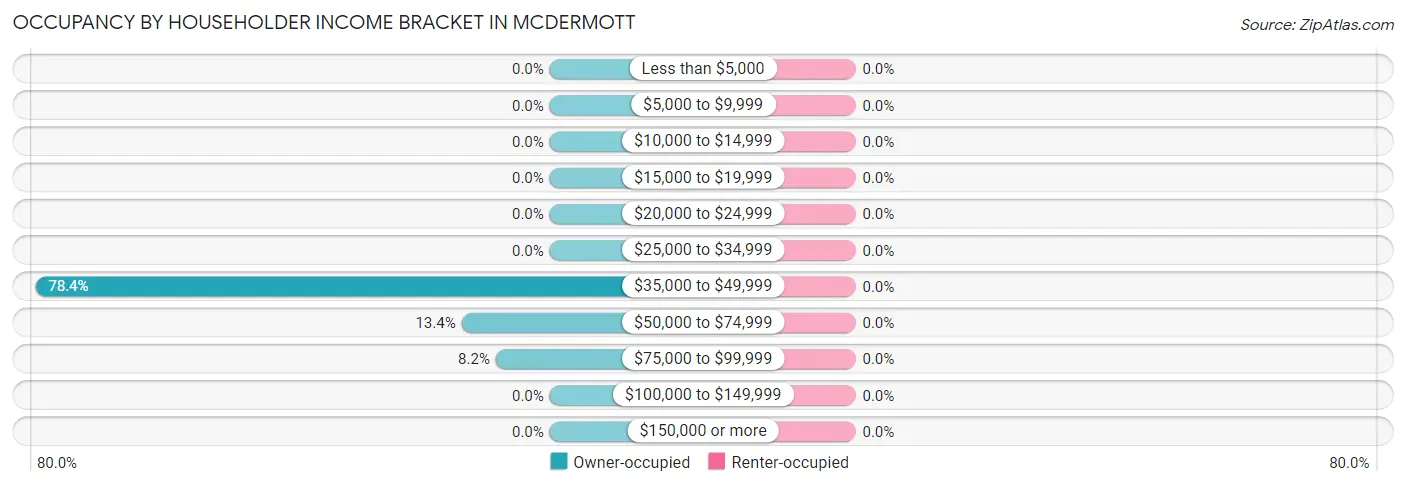
| Income Bracket | Owner-occupied | Renter-occupied |
| Less than $5,000 | 0 (0.0%) | 0 (0.0%) |
| $5,000 to $9,999 | 0 (0.0%) | 0 (0.0%) |
| $10,000 to $14,999 | 0 (0.0%) | 0 (0.0%) |
| $15,000 to $19,999 | 0 (0.0%) | 0 (0.0%) |
| $20,000 to $24,999 | 0 (0.0%) | 0 (0.0%) |
| $25,000 to $34,999 | 0 (0.0%) | 0 (0.0%) |
| $35,000 to $49,999 | 105 (78.4%) | 0 (0.0%) |
| $50,000 to $74,999 | 18 (13.4%) | 0 (0.0%) |
| $75,000 to $99,999 | 11 (8.2%) | 0 (0.0%) |
| $100,000 to $149,999 | 0 (0.0%) | 0 (0.0%) |
| $150,000 or more | 0 (0.0%) | 0 (0.0%) |
| Total | 134 (100.0%) | 0 (0.0%) |
Monthly Housing Cost Tiers in McDermott
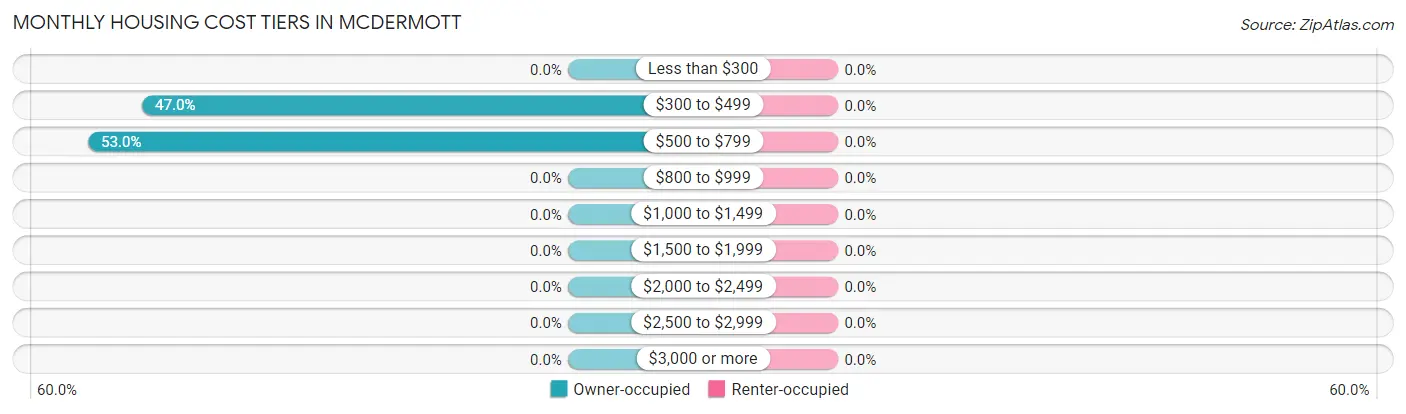
| Monthly Cost | Owner-occupied | Renter-occupied |
| Less than $300 | 0 (0.0%) | 0 (0.0%) |
| $300 to $499 | 63 (47.0%) | 0 (0.0%) |
| $500 to $799 | 71 (53.0%) | 0 (0.0%) |
| $800 to $999 | 0 (0.0%) | 0 (0.0%) |
| $1,000 to $1,499 | 0 (0.0%) | 0 (0.0%) |
| $1,500 to $1,999 | 0 (0.0%) | 0 (0.0%) |
| $2,000 to $2,499 | 0 (0.0%) | 0 (0.0%) |
| $2,500 to $2,999 | 0 (0.0%) | 0 (0.0%) |
| $3,000 or more | 0 (0.0%) | 0 (0.0%) |
| Total | 134 (100.0%) | 0 (0.0%) |
Physical Housing Characteristics in McDermott
Housing Structures in McDermott
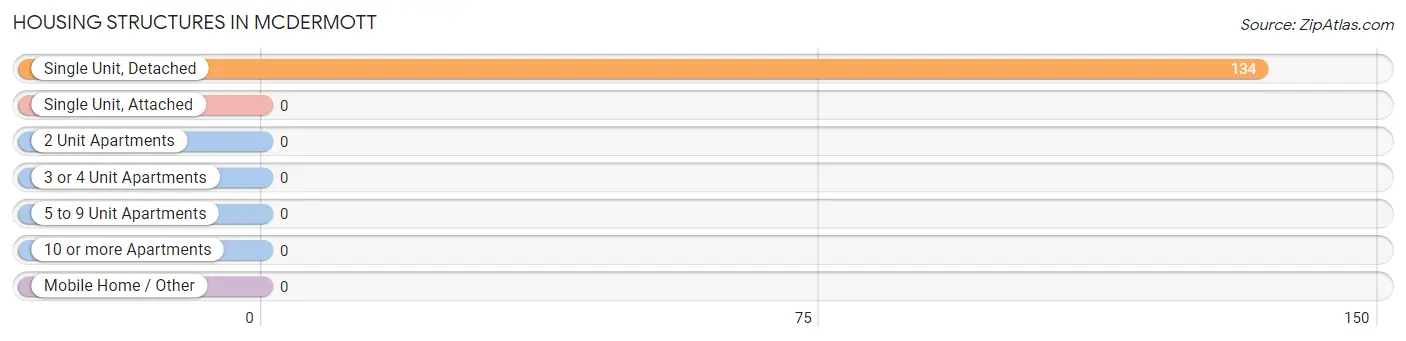
| Structure Type | # Housing Units | % Housing Units |
| Single Unit, Detached | 134 | 100.0% |
| Single Unit, Attached | 0 | 0.0% |
| 2 Unit Apartments | 0 | 0.0% |
| 3 or 4 Unit Apartments | 0 | 0.0% |
| 5 to 9 Unit Apartments | 0 | 0.0% |
| 10 or more Apartments | 0 | 0.0% |
| Mobile Home / Other | 0 | 0.0% |
| Total | 134 | 100.0% |
Housing Structures by Occupancy in McDermott
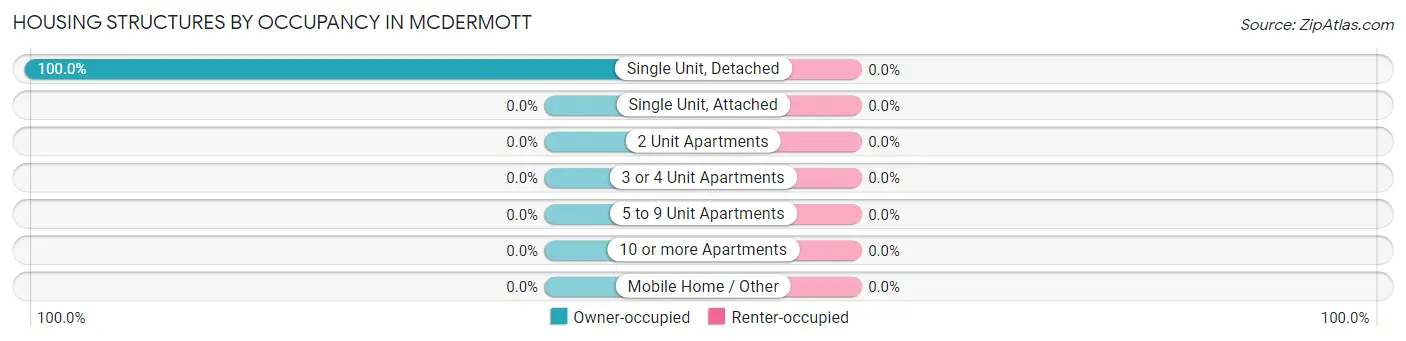
| Structure Type | Owner-occupied | Renter-occupied |
| Single Unit, Detached | 134 (100.0%) | 0 (0.0%) |
| Single Unit, Attached | 0 (0.0%) | 0 (0.0%) |
| 2 Unit Apartments | 0 (0.0%) | 0 (0.0%) |
| 3 or 4 Unit Apartments | 0 (0.0%) | 0 (0.0%) |
| 5 to 9 Unit Apartments | 0 (0.0%) | 0 (0.0%) |
| 10 or more Apartments | 0 (0.0%) | 0 (0.0%) |
| Mobile Home / Other | 0 (0.0%) | 0 (0.0%) |
| Total | 134 (100.0%) | 0 (0.0%) |
Housing Structures by Number of Rooms in McDermott
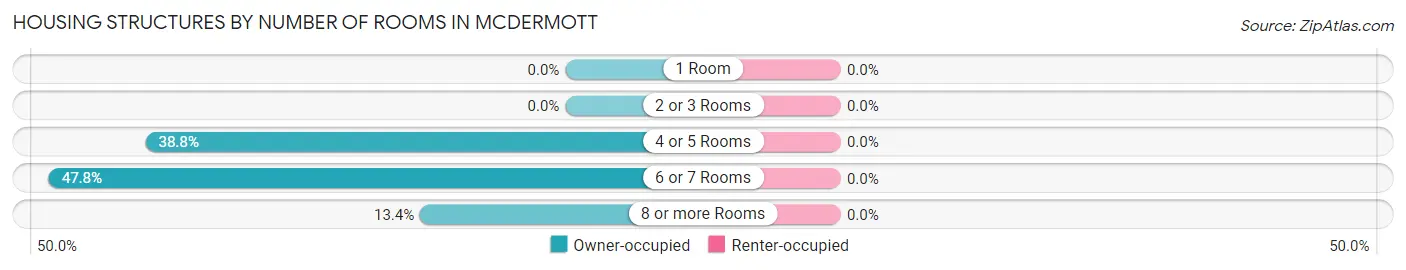
| Number of Rooms | Owner-occupied | Renter-occupied |
| 1 Room | 0 (0.0%) | 0 (0.0%) |
| 2 or 3 Rooms | 0 (0.0%) | 0 (0.0%) |
| 4 or 5 Rooms | 52 (38.8%) | 0 (0.0%) |
| 6 or 7 Rooms | 64 (47.8%) | 0 (0.0%) |
| 8 or more Rooms | 18 (13.4%) | 0 (0.0%) |
| Total | 134 (100.0%) | 0 (0.0%) |
Housing Structure by Heating Type in McDermott
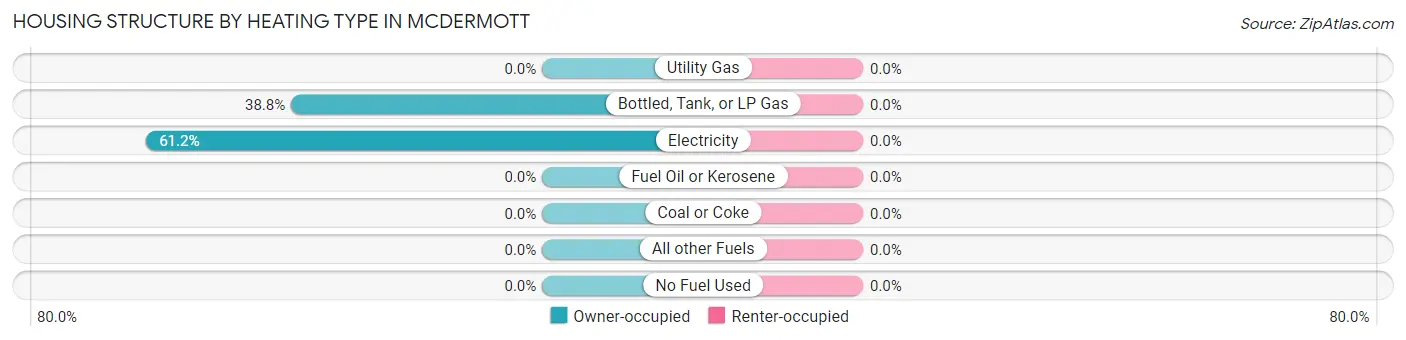
| Heating Type | Owner-occupied | Renter-occupied |
| Utility Gas | 0 (0.0%) | 0 (0.0%) |
| Bottled, Tank, or LP Gas | 52 (38.8%) | 0 (0.0%) |
| Electricity | 82 (61.2%) | 0 (0.0%) |
| Fuel Oil or Kerosene | 0 (0.0%) | 0 (0.0%) |
| Coal or Coke | 0 (0.0%) | 0 (0.0%) |
| All other Fuels | 0 (0.0%) | 0 (0.0%) |
| No Fuel Used | 0 (0.0%) | 0 (0.0%) |
| Total | 134 (100.0%) | 0 (0.0%) |
Household Vehicle Usage in McDermott
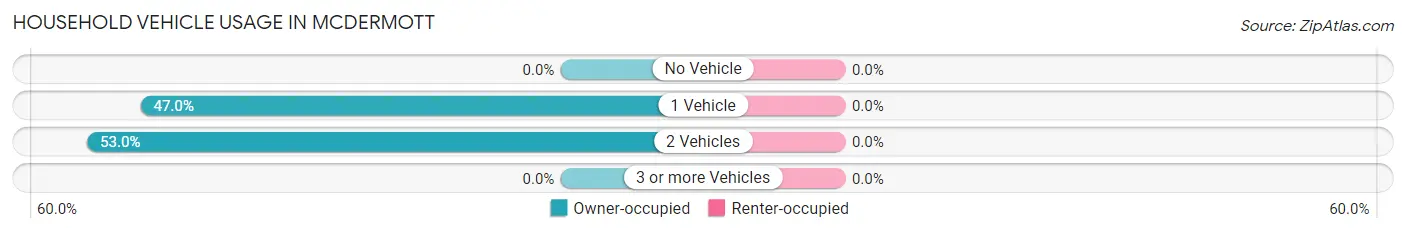
| Vehicles per Household | Owner-occupied | Renter-occupied |
| No Vehicle | 0 (0.0%) | 0 (0.0%) |
| 1 Vehicle | 63 (47.0%) | 0 (0.0%) |
| 2 Vehicles | 71 (53.0%) | 0 (0.0%) |
| 3 or more Vehicles | 0 (0.0%) | 0 (0.0%) |
| Total | 134 (100.0%) | 0 (0.0%) |
Real Estate & Mortgages in McDermott
Real Estate and Mortgage Overview in McDermott
| Characteristic | Without Mortgage | With Mortgage |
| Housing Units | 81 | 53 |
| Median Property Value | - | - |
| Median Household Income | - | - |
| Monthly Housing Costs | $389 | $0 |
| Real Estate Taxes | $716 | $0 |
Property Value by Mortgage Status in McDermott
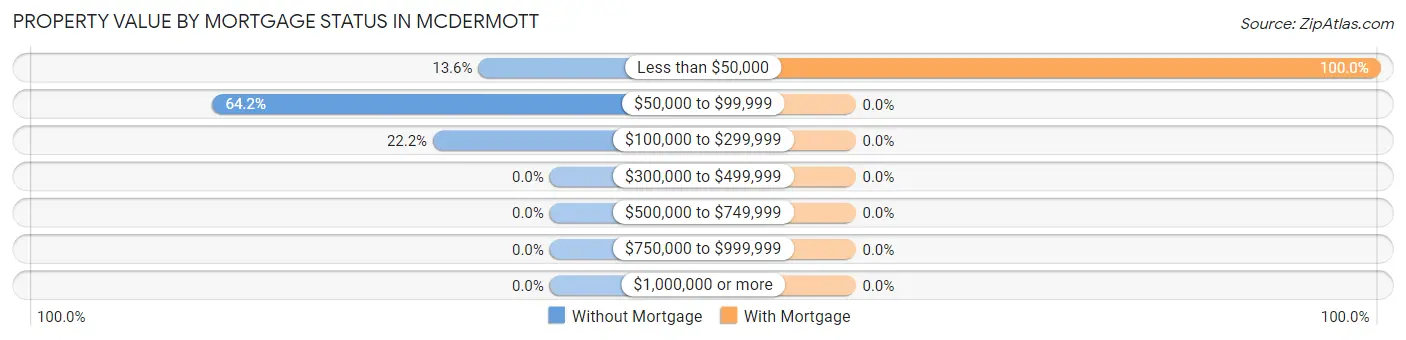
| Property Value | Without Mortgage | With Mortgage |
| Less than $50,000 | 11 (13.6%) | 53 (100.0%) |
| $50,000 to $99,999 | 52 (64.2%) | 0 (0.0%) |
| $100,000 to $299,999 | 18 (22.2%) | 0 (0.0%) |
| $300,000 to $499,999 | 0 (0.0%) | 0 (0.0%) |
| $500,000 to $749,999 | 0 (0.0%) | 0 (0.0%) |
| $750,000 to $999,999 | 0 (0.0%) | 0 (0.0%) |
| $1,000,000 or more | 0 (0.0%) | 0 (0.0%) |
| Total | 81 (100.0%) | 53 (100.0%) |
Household Income by Mortgage Status in McDermott
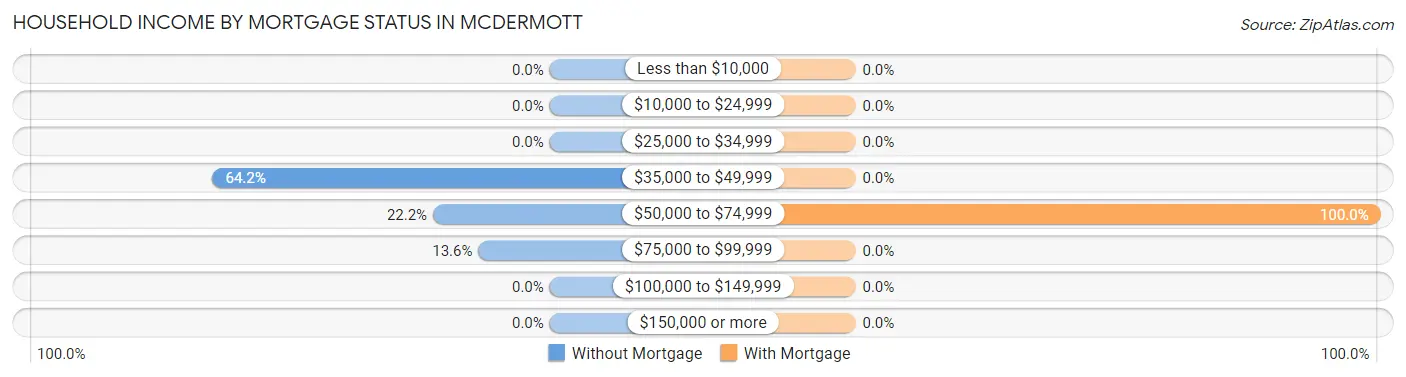
| Household Income | Without Mortgage | With Mortgage |
| Less than $10,000 | 0 (0.0%) | 0 (0.0%) |
| $10,000 to $24,999 | 0 (0.0%) | 0 (0.0%) |
| $25,000 to $34,999 | 0 (0.0%) | 0 (0.0%) |
| $35,000 to $49,999 | 52 (64.2%) | 0 (0.0%) |
| $50,000 to $74,999 | 18 (22.2%) | 53 (100.0%) |
| $75,000 to $99,999 | 11 (13.6%) | 0 (0.0%) |
| $100,000 to $149,999 | 0 (0.0%) | 0 (0.0%) |
| $150,000 or more | 0 (0.0%) | 0 (0.0%) |
| Total | 81 (100.0%) | 53 (100.0%) |
Property Value to Household Income Ratio in McDermott
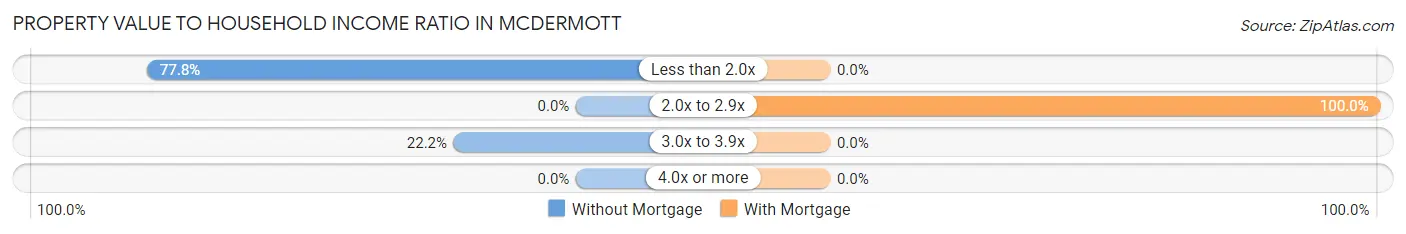
| Value-to-Income Ratio | Without Mortgage | With Mortgage |
| Less than 2.0x | 63 (77.8%) | 0 (0.0%) |
| 2.0x to 2.9x | 0 (0.0%) | 53 (100.0%) |
| 3.0x to 3.9x | 18 (22.2%) | 0 (0.0%) |
| 4.0x or more | 0 (0.0%) | 0 (0.0%) |
| Total | 81 (100.0%) | 53 (100.0%) |
Real Estate Taxes by Mortgage Status in McDermott
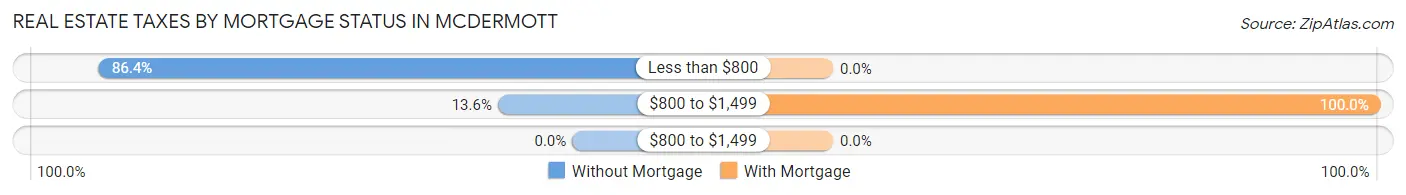
| Property Taxes | Without Mortgage | With Mortgage |
| Less than $800 | 70 (86.4%) | 0 (0.0%) |
| $800 to $1,499 | 11 (13.6%) | 53 (100.0%) |
| $800 to $1,499 | 0 (0.0%) | 0 (0.0%) |
| Total | 81 (100.0%) | 53 (100.0%) |
Health & Disability in McDermott
Health Insurance Coverage by Age in McDermott
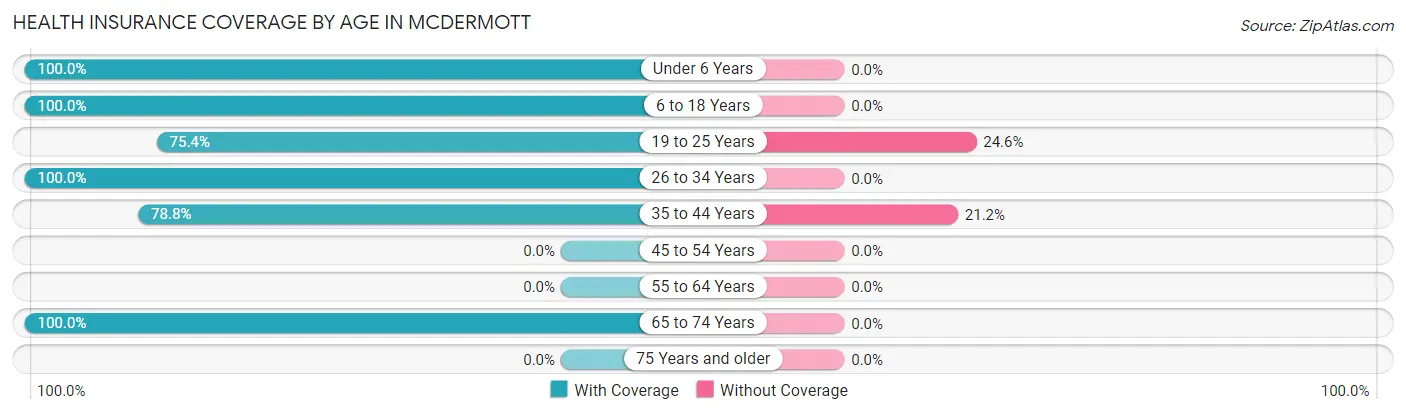
| Age Bracket | With Coverage | Without Coverage |
| Under 6 Years | 128 (100.0%) | 0 (0.0%) |
| 6 to 18 Years | 154 (100.0%) | 0 (0.0%) |
| 19 to 25 Years | 49 (75.4%) | 16 (24.6%) |
| 26 to 34 Years | 53 (100.0%) | 0 (0.0%) |
| 35 to 44 Years | 67 (78.8%) | 18 (21.2%) |
| 45 to 54 Years | 0 (0.0%) | 0 (0.0%) |
| 55 to 64 Years | 0 (0.0%) | 0 (0.0%) |
| 65 to 74 Years | 22 (100.0%) | 0 (0.0%) |
| 75 Years and older | 0 (0.0%) | 0 (0.0%) |
| Total | 473 (93.3%) | 34 (6.7%) |
Health Insurance Coverage by Citizenship Status in McDermott
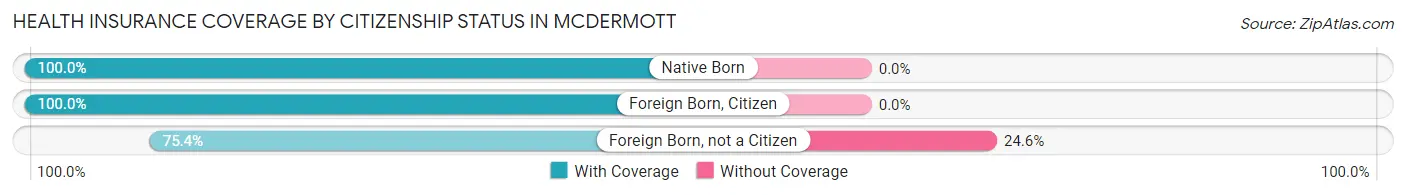
| Citizenship Status | With Coverage | Without Coverage |
| Native Born | 128 (100.0%) | 0 (0.0%) |
| Foreign Born, Citizen | 154 (100.0%) | 0 (0.0%) |
| Foreign Born, not a Citizen | 49 (75.4%) | 16 (24.6%) |
Health Insurance Coverage by Household Income in McDermott
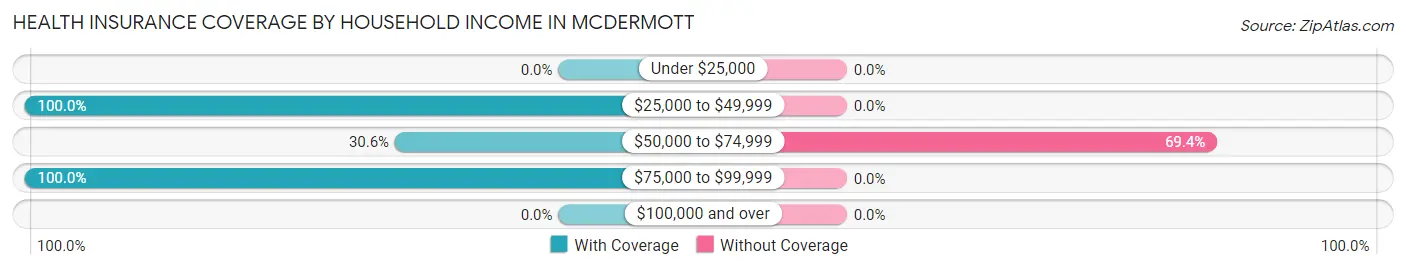
| Household Income | With Coverage | Without Coverage |
| Under $25,000 | 0 (0.0%) | 0 (0.0%) |
| $25,000 to $49,999 | 436 (100.0%) | 0 (0.0%) |
| $50,000 to $74,999 | 15 (30.6%) | 34 (69.4%) |
| $75,000 to $99,999 | 22 (100.0%) | 0 (0.0%) |
| $100,000 and over | 0 (0.0%) | 0 (0.0%) |
Public vs Private Health Insurance Coverage by Age in McDermott
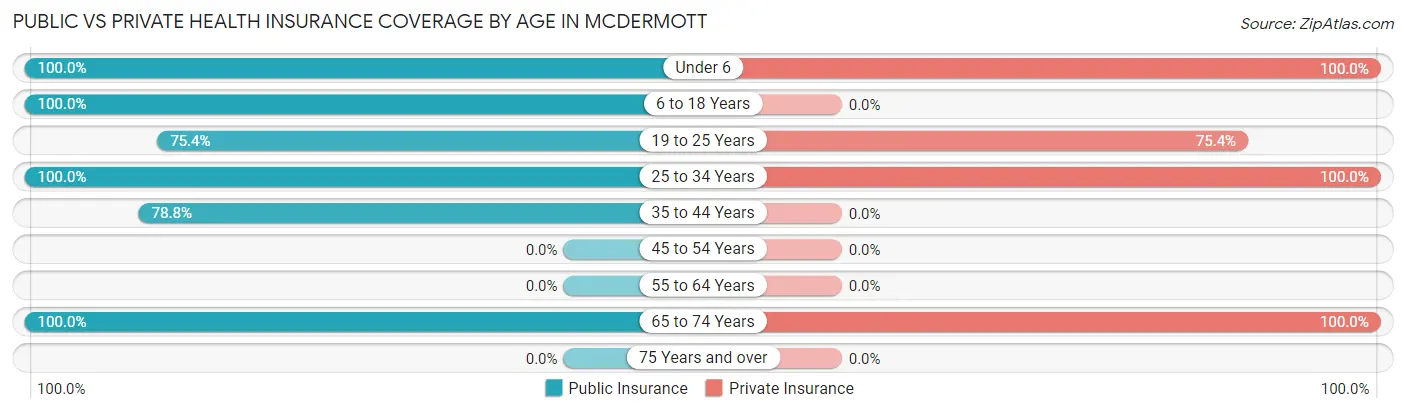
| Age Bracket | Public Insurance | Private Insurance |
| Under 6 | 128 (100.0%) | 128 (100.0%) |
| 6 to 18 Years | 154 (100.0%) | 0 (0.0%) |
| 19 to 25 Years | 49 (75.4%) | 49 (75.4%) |
| 25 to 34 Years | 53 (100.0%) | 53 (100.0%) |
| 35 to 44 Years | 67 (78.8%) | 0 (0.0%) |
| 45 to 54 Years | 0 (0.0%) | 0 (0.0%) |
| 55 to 64 Years | 0 (0.0%) | 0 (0.0%) |
| 65 to 74 Years | 22 (100.0%) | 22 (100.0%) |
| 75 Years and over | 0 (0.0%) | 0 (0.0%) |
| Total | 473 (93.3%) | 252 (49.7%) |
Disability Status by Sex by Age in McDermott
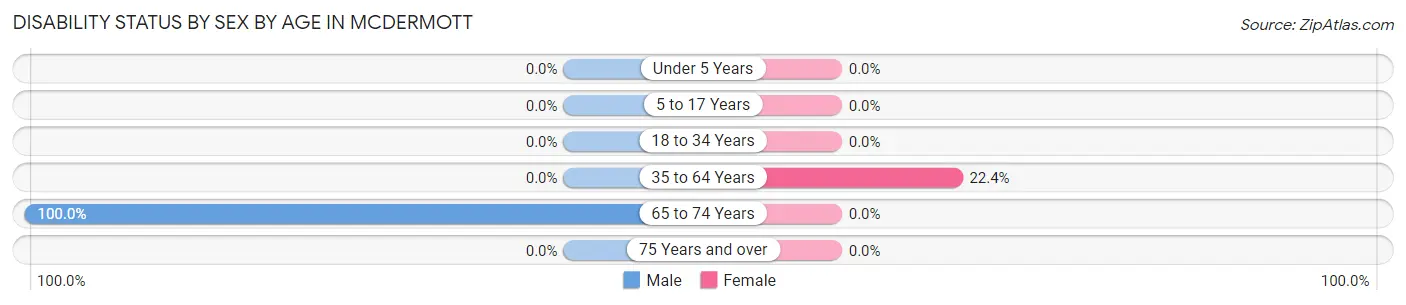
| Age Bracket | Male | Female |
| Under 5 Years | 0 (0.0%) | 0 (0.0%) |
| 5 to 17 Years | 0 (0.0%) | 0 (0.0%) |
| 18 to 34 Years | 0 (0.0%) | 0 (0.0%) |
| 35 to 64 Years | 0 (0.0%) | 15 (22.4%) |
| 65 to 74 Years | 11 (100.0%) | 0 (0.0%) |
| 75 Years and over | 0 (0.0%) | 0 (0.0%) |
Disability Class by Sex by Age in McDermott
Disability Class: Hearing Difficulty
| Age Bracket | Male | Female |
| Under 5 Years | 0 (0.0%) | 0 (0.0%) |
| 5 to 17 Years | 0 (0.0%) | 0 (0.0%) |
| 18 to 34 Years | 0 (0.0%) | 0 (0.0%) |
| 35 to 64 Years | 0 (0.0%) | 0 (0.0%) |
| 65 to 74 Years | 0 (0.0%) | 0 (0.0%) |
| 75 Years and over | 0 (0.0%) | 0 (0.0%) |
Disability Class: Vision Difficulty
| Age Bracket | Male | Female |
| Under 5 Years | 0 (0.0%) | 0 (0.0%) |
| 5 to 17 Years | 0 (0.0%) | 0 (0.0%) |
| 18 to 34 Years | 0 (0.0%) | 0 (0.0%) |
| 35 to 64 Years | 0 (0.0%) | 0 (0.0%) |
| 65 to 74 Years | 0 (0.0%) | 0 (0.0%) |
| 75 Years and over | 0 (0.0%) | 0 (0.0%) |
Disability Class: Cognitive Difficulty
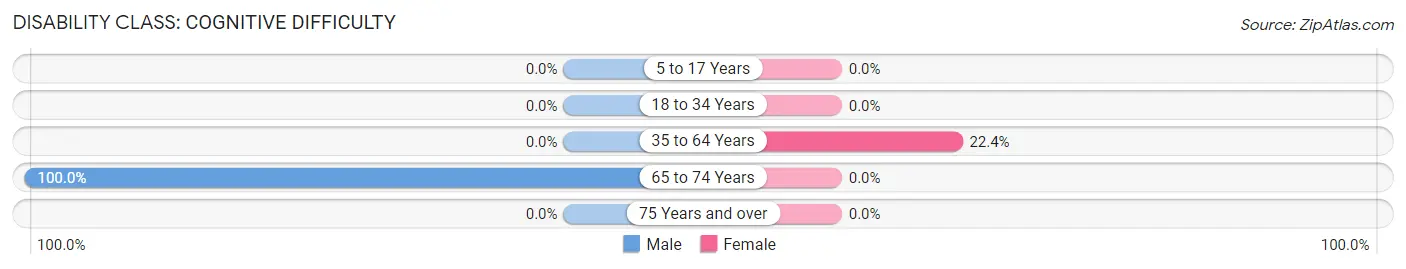
| Age Bracket | Male | Female |
| 5 to 17 Years | 0 (0.0%) | 0 (0.0%) |
| 18 to 34 Years | 0 (0.0%) | 0 (0.0%) |
| 35 to 64 Years | 0 (0.0%) | 15 (22.4%) |
| 65 to 74 Years | 11 (100.0%) | 0 (0.0%) |
| 75 Years and over | 0 (0.0%) | 0 (0.0%) |
Disability Class: Ambulatory Difficulty
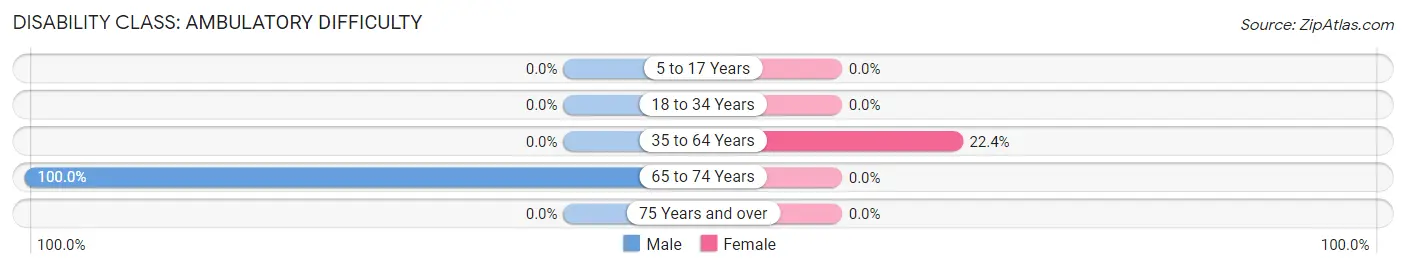
| Age Bracket | Male | Female |
| 5 to 17 Years | 0 (0.0%) | 0 (0.0%) |
| 18 to 34 Years | 0 (0.0%) | 0 (0.0%) |
| 35 to 64 Years | 0 (0.0%) | 15 (22.4%) |
| 65 to 74 Years | 11 (100.0%) | 0 (0.0%) |
| 75 Years and over | 0 (0.0%) | 0 (0.0%) |
Disability Class: Self-Care Difficulty
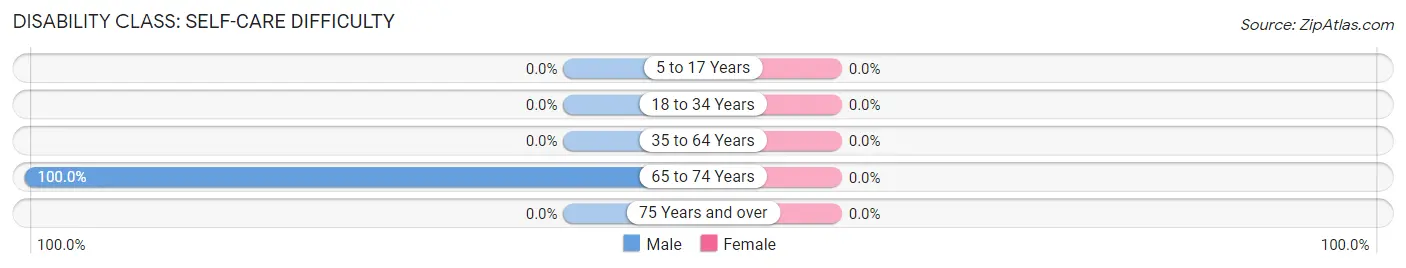
| Age Bracket | Male | Female |
| 5 to 17 Years | 0 (0.0%) | 0 (0.0%) |
| 18 to 34 Years | 0 (0.0%) | 0 (0.0%) |
| 35 to 64 Years | 0 (0.0%) | 0 (0.0%) |
| 65 to 74 Years | 11 (100.0%) | 0 (0.0%) |
| 75 Years and over | 0 (0.0%) | 0 (0.0%) |
Technology Access in McDermott
Computing Device Access in McDermott
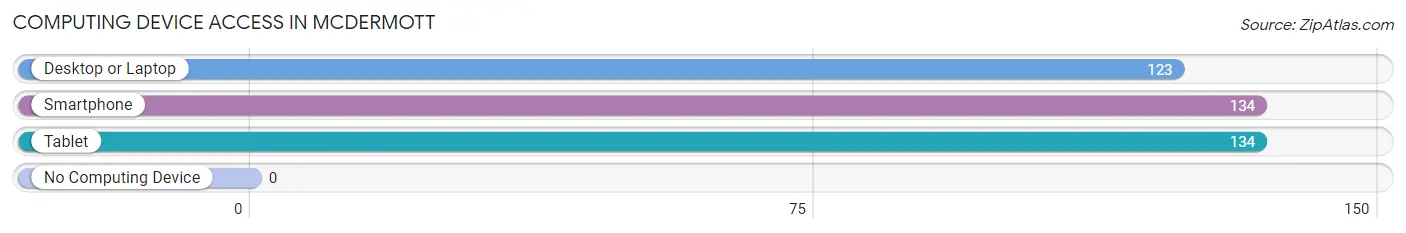
| Device Type | # Households | % Households |
| Desktop or Laptop | 123 | 91.8% |
| Smartphone | 134 | 100.0% |
| Tablet | 134 | 100.0% |
| No Computing Device | 0 | 0.0% |
| Total | 134 | 100.0% |
Internet Access in McDermott
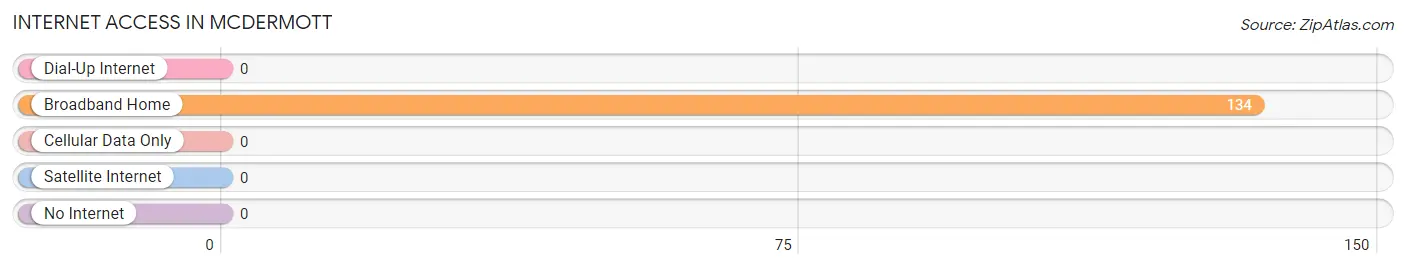
| Internet Type | # Households | % Households |
| Dial-Up Internet | 0 | 0.0% |
| Broadband Home | 134 | 100.0% |
| Cellular Data Only | 0 | 0.0% |
| Satellite Internet | 0 | 0.0% |
| No Internet | 0 | 0.0% |
| Total | 134 | 100.0% |
McDermott Summary
McDermott is a small village located in Scioto County, Ohio. It is situated along the Ohio River, approximately 10 miles south of Portsmouth. The village has a population of approximately 500 people and is part of the Portsmouth Micropolitan Statistical Area.
History
McDermott was founded in 1845 by William McDermott, a local farmer. The village was originally known as McDermott’s Landing, and was a popular stop for steamboats traveling up and down the Ohio River. The village was officially incorporated in 1876.
In the late 19th century, McDermott was a thriving river port. The village was home to several businesses, including a sawmill, a grist mill, a blacksmith shop, and a general store. The village also had a post office, a school, and a church.
In the early 20th century, McDermott began to decline. The steamboat industry was in decline, and the village was bypassed by the railroad. The population began to decline, and by the 1950s, the village was nearly abandoned.
In the late 20th century, McDermott began to experience a resurgence. The village was designated as a historic district in the 1980s, and several of the original buildings were restored. The village also began to attract new businesses, including a winery, a brewery, and a bed and breakfast.
Geography
McDermott is located in Scioto County, Ohio. The village is situated along the Ohio River, approximately 10 miles south of Portsmouth. The village is located in a rural area, and is surrounded by farmland. The nearest major city is Cincinnati, which is approximately 90 miles to the south.
The climate in McDermott is humid continental, with hot summers and cold winters. The average annual temperature is 54°F, and the average annual precipitation is 40 inches.
Economy
The economy of McDermott is largely based on tourism. The village is home to several wineries, breweries, and bed and breakfasts, which attract visitors from around the region. The village also has several antique shops, which are popular with tourists.
In addition to tourism, McDermott is home to several small businesses, including a grocery store, a hardware store, and a gas station. The village also has a post office and a library.
Demographics
As of the 2010 census, the population of McDermott was 498. The racial makeup of the village was 97.2% White, 0.6% African American, 0.2% Native American, 0.2% Asian, 0.2% from other races, and 1.8% from two or more races. Hispanic or Latino of any race were 0.8% of the population.
The median household income in McDermott was $37,500, and the median family income was $41,250. The per capita income was $17,845. About 11.2% of families and 13.2% of the population were below the poverty line, including 17.2% of those under age 18 and 8.3% of those age 65 or over.
Common Questions
What is Per Capita Income in McDermott?
Per Capita income in McDermott is $12,650.
What is the Median Family Income in McDermott?
Median Family Income in McDermott is $48,208.
What is the Median Household income in McDermott?
Median Household Income in McDermott is $48,208.
What is Inequality or Gini Index in McDermott?
Inequality or Gini Index in McDermott is 0.14.
What is the Total Population of McDermott?
Total Population of McDermott is 529.
What is the Total Male Population of McDermott?
Total Male Population of McDermott is 163.
What is the Total Female Population of McDermott?
Total Female Population of McDermott is 366.
What is the Ratio of Males per 100 Females in McDermott?
There are 44.54 Males per 100 Females in McDermott.
What is the Ratio of Females per 100 Males in McDermott?
There are 224.54 Females per 100 Males in McDermott.
What is the Median Population Age in McDermott?
Median Population Age in McDermott is 15.7 Years.
What is the Average Family Size in McDermott
Average Family Size in McDermott is 3.8 People.
What is the Average Household Size in McDermott
Average Household Size in McDermott is 3.8 People.
How Large is the Labor Force in McDermott?
There are 188 People in the Labor Forcein in McDermott.
What is the Percentage of People in the Labor Force in McDermott?
76.1% of People are in the Labor Force in McDermott.
What is the Unemployment Rate in McDermott?
Unemployment Rate in McDermott is 8.5%.