Zip Codes with the Highest Percentage of Population Employed in Administrative & Support Services in Cincinnati, OH
RELATED REPORTS & OPTIONS
Administrative & Support Services
Cincinnati
Compare Zip Codes
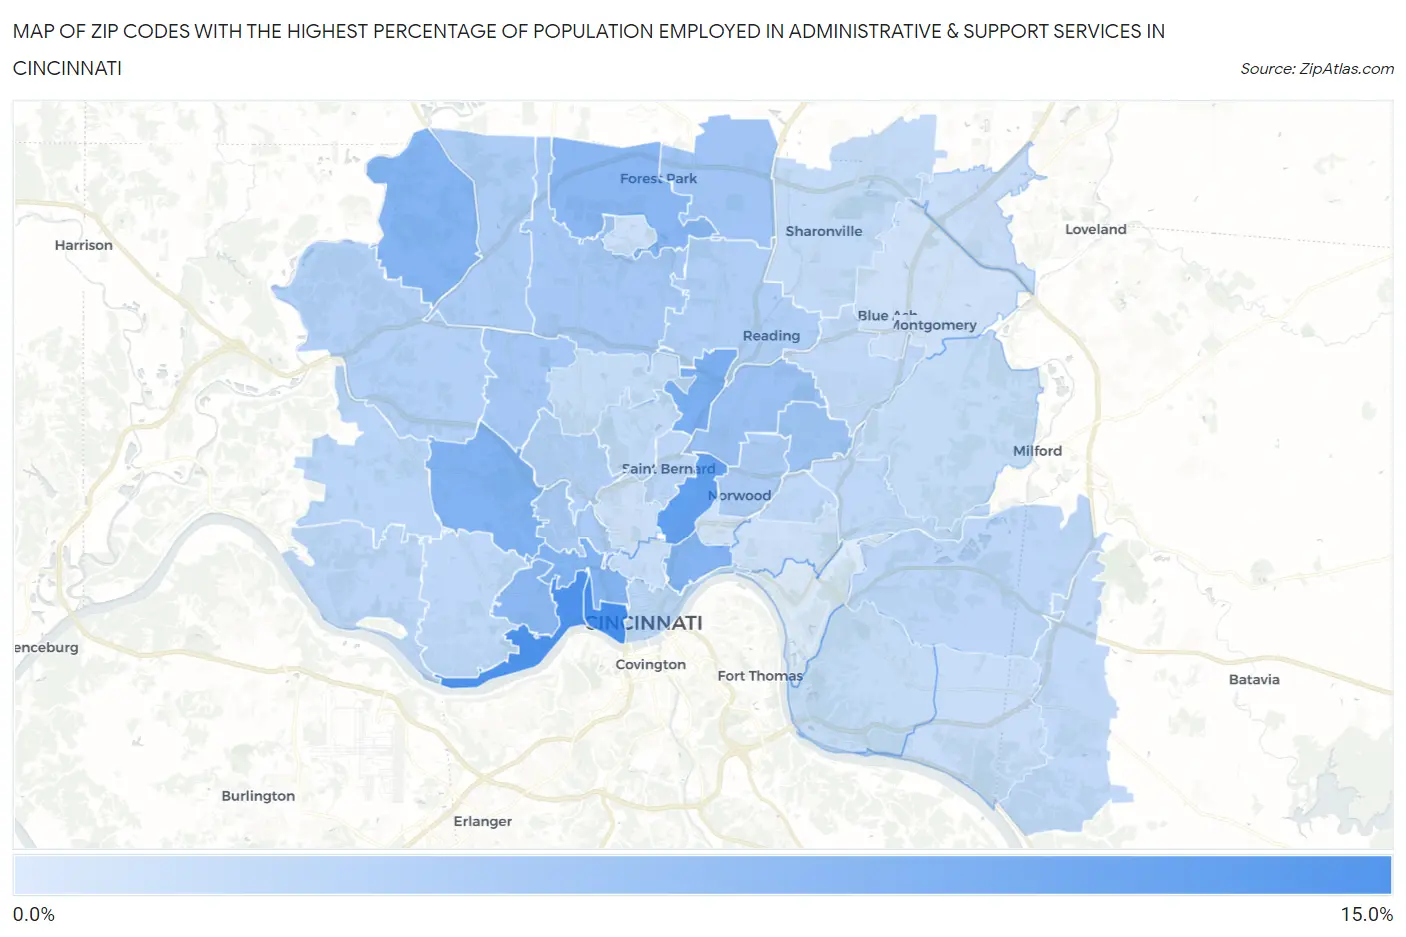
Map of Zip Codes with the Highest Percentage of Population Employed in Administrative & Support Services in Cincinnati
0.75%
13.4%
Zip Codes with the Highest Percentage of Population Employed in Administrative & Support Services in Cincinnati, OH
| Zip Code | % Employed | vs State | vs National | |
| 1. | 45203 | 13.4% | 3.7%(+9.66)#29 | 4.1%(+9.24)#680 |
| 2. | 45204 | 12.8% | 3.7%(+9.11)#33 | 4.1%(+8.68)#736 |
| 3. | 45229 | 11.0% | 3.7%(+7.24)#38 | 4.1%(+6.82)#1,026 |
| 4. | 45216 | 8.7% | 3.7%(+4.98)#66 | 4.1%(+4.55)#1,842 |
| 5. | 45211 | 8.4% | 3.7%(+4.72)#74 | 4.1%(+4.29)#2,002 |
| 6. | 45252 | 8.0% | 3.7%(+4.29)#84 | 4.1%(+3.86)#2,262 |
| 7. | 45206 | 8.0% | 3.7%(+4.24)#88 | 4.1%(+3.81)#2,310 |
| 8. | 45214 | 7.9% | 3.7%(+4.22)#89 | 4.1%(+3.80)#2,319 |
| 9. | 45240 | 7.6% | 3.7%(+3.83)#101 | 4.1%(+3.40)#2,639 |
| 10. | 45205 | 7.4% | 3.7%(+3.63)#111 | 4.1%(+3.20)#2,839 |
| 11. | 45237 | 6.2% | 3.7%(+2.47)#165 | 4.1%(+2.04)#4,425 |
| 12. | 45213 | 5.9% | 3.7%(+2.17)#190 | 4.1%(+1.75)#4,958 |
| 13. | 45246 | 5.6% | 3.7%(+1.90)#212 | 4.1%(+1.48)#5,529 |
| 14. | 45239 | 5.2% | 3.7%(+1.51)#246 | 4.1%(+1.09)#6,506 |
| 15. | 45231 | 5.2% | 3.7%(+1.45)#250 | 4.1%(+1.02)#6,651 |
| 16. | 45225 | 4.9% | 3.7%(+1.20)#279 | 4.1%(+0.776)#7,327 |
| 17. | 45212 | 4.7% | 3.7%(+1.02)#310 | 4.1%(+0.595)#7,894 |
| 18. | 45251 | 4.6% | 3.7%(+0.915)#319 | 4.1%(+0.490)#8,227 |
| 19. | 45215 | 4.4% | 3.7%(+0.653)#360 | 4.1%(+0.228)#9,174 |
| 20. | 45223 | 4.1% | 3.7%(+0.378)#398 | 4.1%(-0.047)#10,230 |
| 21. | 45247 | 4.1% | 3.7%(+0.367)#399 | 4.1%(-0.059)#10,277 |
| 22. | 45248 | 3.6% | 3.7%(-0.109)#467 | 4.1%(-0.535)#12,397 |
| 23. | 45202 | 3.5% | 3.7%(-0.265)#500 | 4.1%(-0.691)#13,167 |
| 24. | 45233 | 3.4% | 3.7%(-0.322)#508 | 4.1%(-0.748)#13,428 |
| 25. | 45244 | 3.4% | 3.7%(-0.353)#515 | 4.1%(-0.779)#13,585 |
| 26. | 45217 | 3.3% | 3.7%(-0.403)#529 | 4.1%(-0.828)#13,838 |
| 27. | 45238 | 3.2% | 3.7%(-0.488)#546 | 4.1%(-0.914)#14,270 |
| 28. | 45209 | 3.1% | 3.7%(-0.580)#568 | 4.1%(-1.01)#14,774 |
| 29. | 45227 | 3.1% | 3.7%(-0.613)#575 | 4.1%(-1.04)#14,937 |
| 30. | 45236 | 3.0% | 3.7%(-0.760)#606 | 4.1%(-1.19)#15,661 |
| 31. | 45245 | 2.9% | 3.7%(-0.781)#609 | 4.1%(-1.21)#15,776 |
| 32. | 45241 | 2.8% | 3.7%(-0.898)#647 | 4.1%(-1.32)#16,386 |
| 33. | 45232 | 2.7% | 3.7%(-1.02)#680 | 4.1%(-1.45)#17,079 |
| 34. | 45230 | 2.7% | 3.7%(-1.05)#685 | 4.1%(-1.47)#17,199 |
| 35. | 45243 | 2.7% | 3.7%(-1.06)#686 | 4.1%(-1.49)#17,282 |
| 36. | 45224 | 2.6% | 3.7%(-1.08)#694 | 4.1%(-1.51)#17,400 |
| 37. | 45255 | 2.5% | 3.7%(-1.26)#722 | 4.1%(-1.68)#18,311 |
| 38. | 45219 | 2.4% | 3.7%(-1.32)#737 | 4.1%(-1.75)#18,644 |
| 39. | 45249 | 2.4% | 3.7%(-1.36)#745 | 4.1%(-1.79)#18,878 |
| 40. | 45220 | 2.1% | 3.7%(-1.60)#801 | 4.1%(-2.03)#20,031 |
| 41. | 45218 | 2.1% | 3.7%(-1.61)#805 | 4.1%(-2.04)#20,102 |
| 42. | 45208 | 1.9% | 3.7%(-1.82)#852 | 4.1%(-2.24)#21,053 |
| 43. | 45242 | 1.8% | 3.7%(-1.92)#867 | 4.1%(-2.35)#21,502 |
| 44. | 45207 | 1.6% | 3.7%(-2.07)#891 | 4.1%(-2.50)#22,167 |
| 45. | 45226 | 0.75% | 3.7%(-2.98)#1,007 | 4.1%(-3.40)#25,256 |
1
Common Questions
What are the Top 10 Zip Codes with the Highest Percentage of Population Employed in Administrative & Support Services in Cincinnati, OH?
Top 10 Zip Codes with the Highest Percentage of Population Employed in Administrative & Support Services in Cincinnati, OH are:
What zip code has the Highest Percentage of Population Employed in Administrative & Support Services in Cincinnati, OH?
45203 has the Highest Percentage of Population Employed in Administrative & Support Services in Cincinnati, OH with 13.4%.
What is the Percentage of Population Employed in Administrative & Support Services in Cincinnati, OH?
Percentage of Population Employed in Administrative & Support Services in Cincinnati is 4.7%.
What is the Percentage of Population Employed in Administrative & Support Services in Ohio?
Percentage of Population Employed in Administrative & Support Services in Ohio is 3.7%.
What is the Percentage of Population Employed in Administrative & Support Services in the United States?
Percentage of Population Employed in Administrative & Support Services in the United States is 4.1%.