Zip Codes with the Highest Percentage of Population Employed in Administrative & Support Services in Warren, OH
RELATED REPORTS & OPTIONS
Administrative & Support Services
Warren
Compare Zip Codes
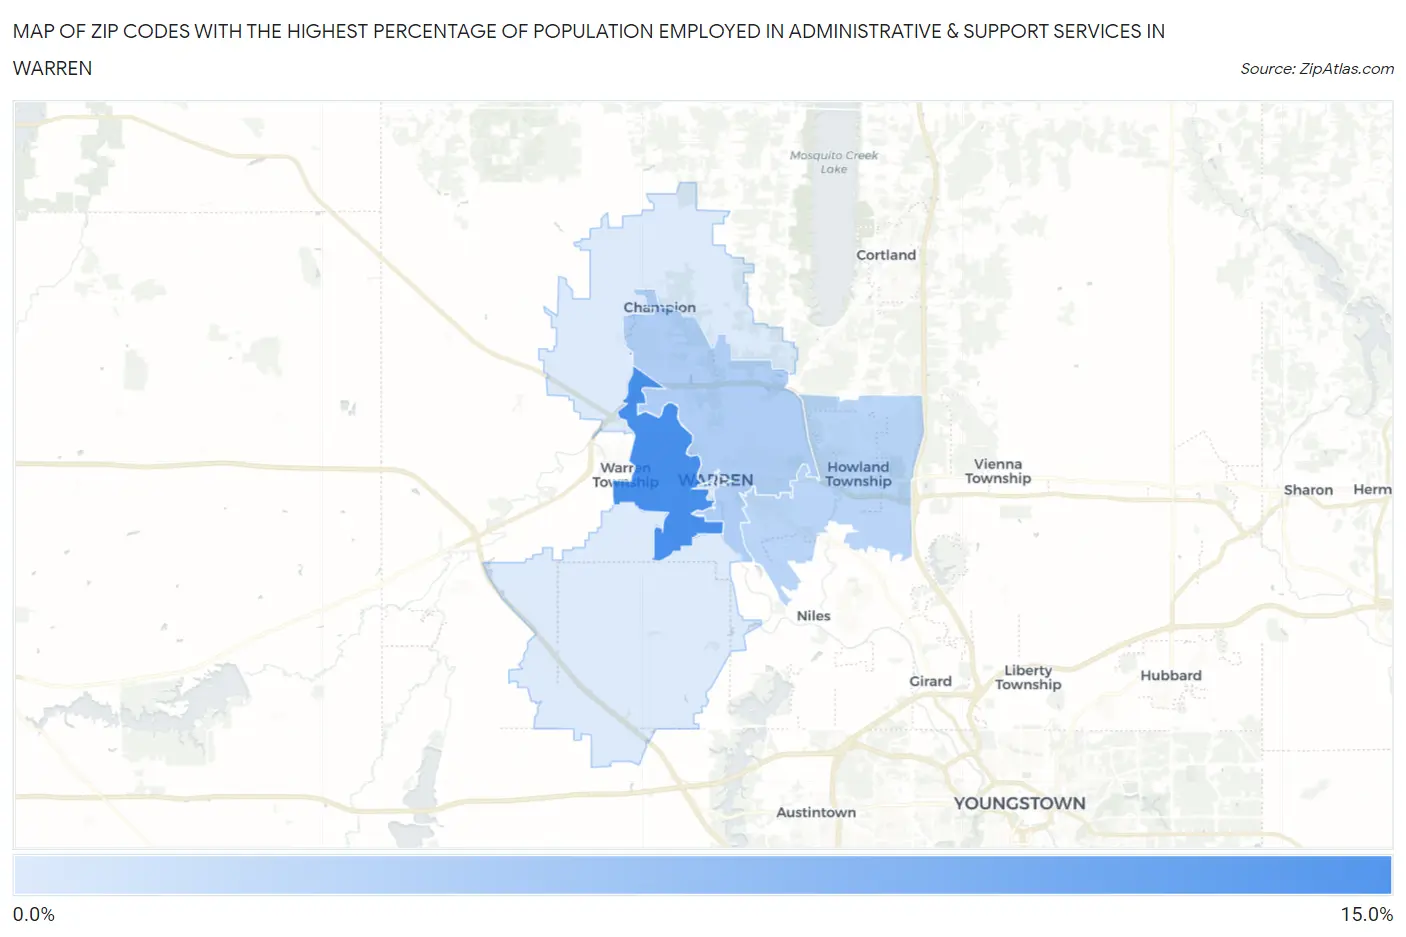
Map of Zip Codes with the Highest Percentage of Population Employed in Administrative & Support Services in Warren
2.5%
11.3%
Zip Codes with the Highest Percentage of Population Employed in Administrative & Support Services in Warren, OH
| Zip Code | % Employed | vs State | vs National | |
| 1. | 44485 | 11.3% | 3.7%(+7.55)#36 | 4.1%(+7.12)#966 |
| 2. | 44483 | 5.1% | 3.7%(+1.40)#255 | 4.1%(+0.971)#6,794 |
| 3. | 44484 | 4.5% | 3.7%(+0.768)#343 | 4.1%(+0.342)#8,749 |
| 4. | 44481 | 2.5% | 3.7%(-1.24)#718 | 4.1%(-1.67)#18,236 |
1
Common Questions
What are the Top 3 Zip Codes with the Highest Percentage of Population Employed in Administrative & Support Services in Warren, OH?
Top 3 Zip Codes with the Highest Percentage of Population Employed in Administrative & Support Services in Warren, OH are:
What zip code has the Highest Percentage of Population Employed in Administrative & Support Services in Warren, OH?
44485 has the Highest Percentage of Population Employed in Administrative & Support Services in Warren, OH with 11.3%.
What is the Percentage of Population Employed in Administrative & Support Services in Warren, OH?
Percentage of Population Employed in Administrative & Support Services in Warren is 7.5%.
What is the Percentage of Population Employed in Administrative & Support Services in Ohio?
Percentage of Population Employed in Administrative & Support Services in Ohio is 3.7%.
What is the Percentage of Population Employed in Administrative & Support Services in the United States?
Percentage of Population Employed in Administrative & Support Services in the United States is 4.1%.