New Alexandria, OH Map & Demographics
New Alexandria Map
New Alexandria Overview
$26,051
PER CAPITA INCOME
$81,875
AVG FAMILY INCOME
$75,750
AVG HOUSEHOLD INCOME
0.33
INEQUALITY / GINI INDEX
327
TOTAL POPULATION
176
MALE POPULATION
151
FEMALE POPULATION
116.56
MALES / 100 FEMALES
85.80
FEMALES / 100 MALES
44.3
MEDIAN AGE
3.2
AVG FAMILY SIZE
3.0
AVG HOUSEHOLD SIZE
164
LABOR FORCE [ PEOPLE ]
58.6%
PERCENT IN LABOR FORCE
7.3%
UNEMPLOYMENT RATE
Income in New Alexandria
Income Overview in New Alexandria
Per Capita Income in New Alexandria is $26,051, while median incomes of families and households are $81,875 and $75,750 respectively.
| Characteristic | Number | Measure |
| Per Capita Income | 327 | $26,051 |
| Median Family Income | 95 | $81,875 |
| Mean Family Income | 95 | $78,482 |
| Median Household Income | 111 | $75,750 |
| Mean Household Income | 111 | $74,768 |
| Income Deficit | 95 | $0 |
| Wage / Income Gap (%) | 327 | 0.00% |
| Wage / Income Gap ($) | 327 | 100.00¢ per $1 |
| Gini / Inequality Index | 327 | 0.33 |
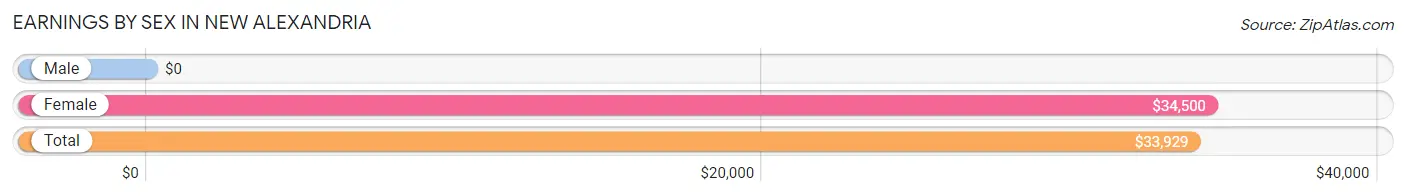
Earnings by Sex in New Alexandria
| Sex | Number | Average Earnings |
| Male | 106 (63.1%) | $0 |
| Female | 62 (36.9%) | $34,500 |
| Total | 168 (100.0%) | $33,929 |
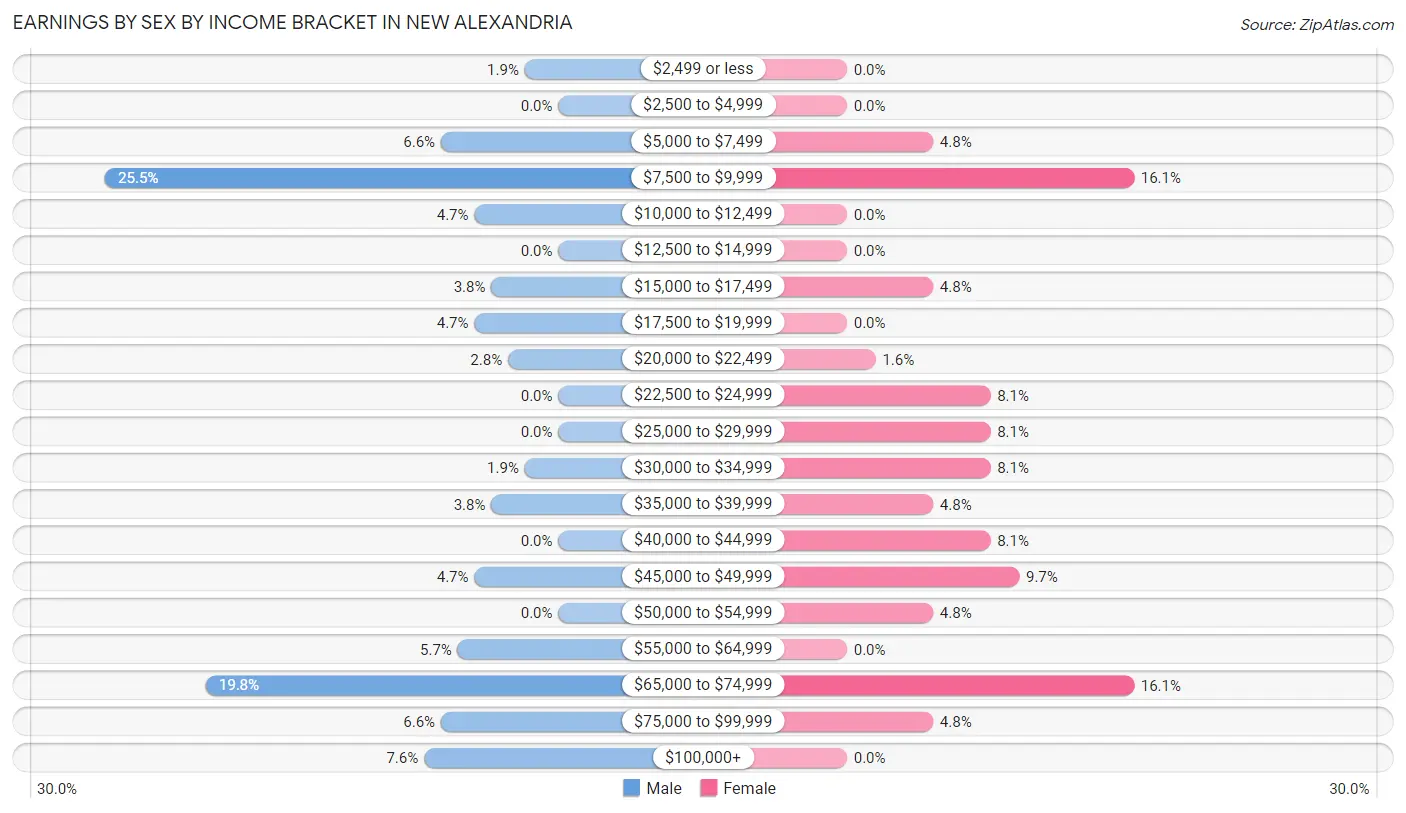
Earnings by Sex by Income Bracket in New Alexandria
The most common earnings brackets in New Alexandria are $7,500 to $9,999 for men (27 | 25.5%) and $7,500 to $9,999 for women (10 | 16.1%).
| Income | Male | Female |
| $2,499 or less | 2 (1.9%) | 0 (0.0%) |
| $2,500 to $4,999 | 0 (0.0%) | 0 (0.0%) |
| $5,000 to $7,499 | 7 (6.6%) | 3 (4.8%) |
| $7,500 to $9,999 | 27 (25.5%) | 10 (16.1%) |
| $10,000 to $12,499 | 5 (4.7%) | 0 (0.0%) |
| $12,500 to $14,999 | 0 (0.0%) | 0 (0.0%) |
| $15,000 to $17,499 | 4 (3.8%) | 3 (4.8%) |
| $17,500 to $19,999 | 5 (4.7%) | 0 (0.0%) |
| $20,000 to $22,499 | 3 (2.8%) | 1 (1.6%) |
| $22,500 to $24,999 | 0 (0.0%) | 5 (8.1%) |
| $25,000 to $29,999 | 0 (0.0%) | 5 (8.1%) |
| $30,000 to $34,999 | 2 (1.9%) | 5 (8.1%) |
| $35,000 to $39,999 | 4 (3.8%) | 3 (4.8%) |
| $40,000 to $44,999 | 0 (0.0%) | 5 (8.1%) |
| $45,000 to $49,999 | 5 (4.7%) | 6 (9.7%) |
| $50,000 to $54,999 | 0 (0.0%) | 3 (4.8%) |
| $55,000 to $64,999 | 6 (5.7%) | 0 (0.0%) |
| $65,000 to $74,999 | 21 (19.8%) | 10 (16.1%) |
| $75,000 to $99,999 | 7 (6.6%) | 3 (4.8%) |
| $100,000+ | 8 (7.5%) | 0 (0.0%) |
| Total | 106 (100.0%) | 62 (100.0%) |
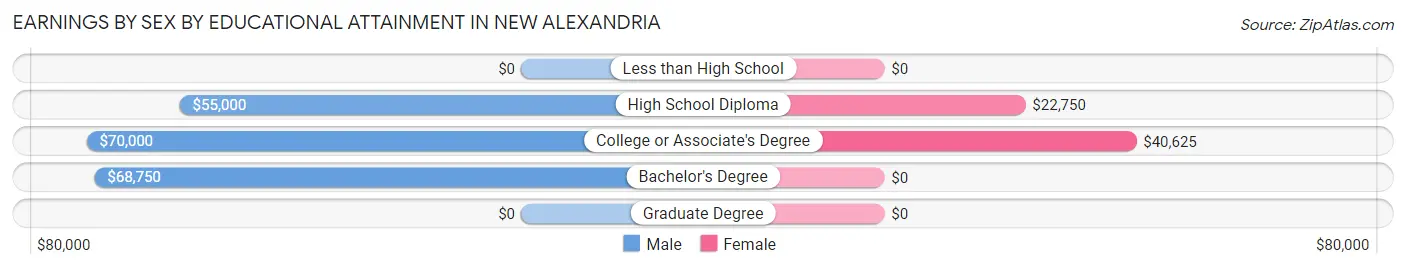
Earnings by Sex by Educational Attainment in New Alexandria
Average earnings in New Alexandria are $67,875 for men and $35,000 for women, a difference of 48.4%. Men with an educational attainment of college or associate's degree enjoy the highest average annual earnings of $70,000, while those with high school diploma education earn the least with $55,000. Women with an educational attainment of college or associate's degree earn the most with the average annual earnings of $40,625, while those with high school diploma education have the smallest earnings of $22,750.
| Educational Attainment | Male Income | Female Income |
| Less than High School | - | - |
| High School Diploma | $55,000 | $22,750 |
| College or Associate's Degree | $70,000 | $40,625 |
| Bachelor's Degree | $68,750 | $0 |
| Graduate Degree | - | - |
| Total | $67,875 | $35,000 |
Family Income in New Alexandria
Family Income Brackets in New Alexandria
According to the New Alexandria family income data, there are 30 families falling into the $75,000 to $99,999 income range, which is the most common income bracket and makes up 31.6% of all families.
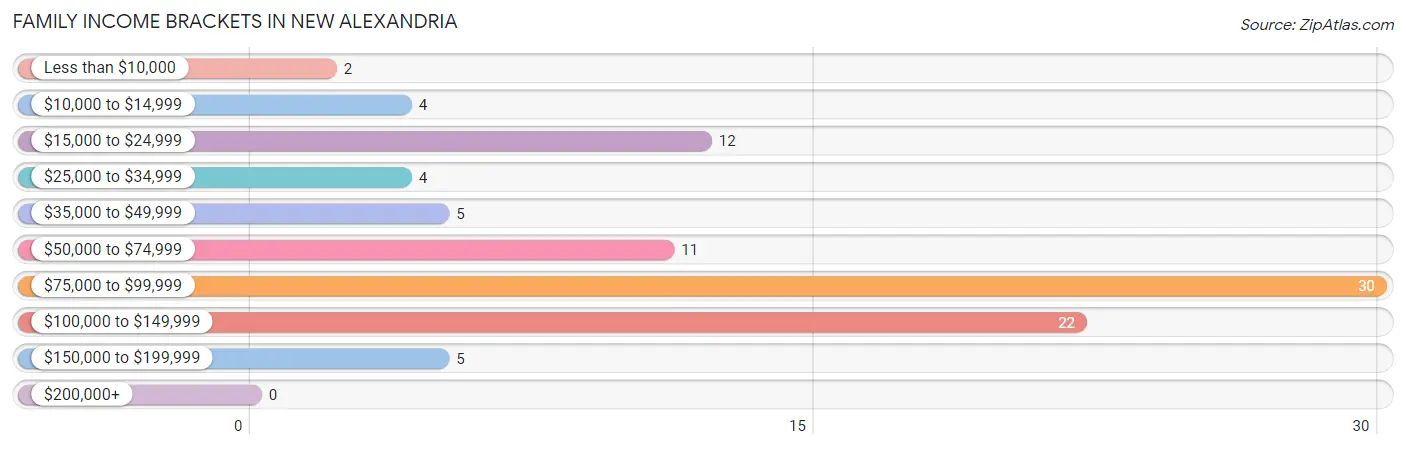
| Income Bracket | # Families | % Families |
| Less than $10,000 | 2 | 2.1% |
| $10,000 to $14,999 | 4 | 4.2% |
| $15,000 to $24,999 | 12 | 12.6% |
| $25,000 to $34,999 | 4 | 4.2% |
| $35,000 to $49,999 | 5 | 5.3% |
| $50,000 to $74,999 | 11 | 11.6% |
| $75,000 to $99,999 | 30 | 31.6% |
| $100,000 to $149,999 | 22 | 23.2% |
| $150,000 to $199,999 | 5 | 5.3% |
| $200,000+ | 0 | 0.0% |
Family Income by Famaliy Size in New Alexandria
3-person families (15 | 15.8%) account for the highest median family income in New Alexandria with $98,250 per family, while 2-person families (57 | 60.0%) have the highest median income of $37,708 per family member.
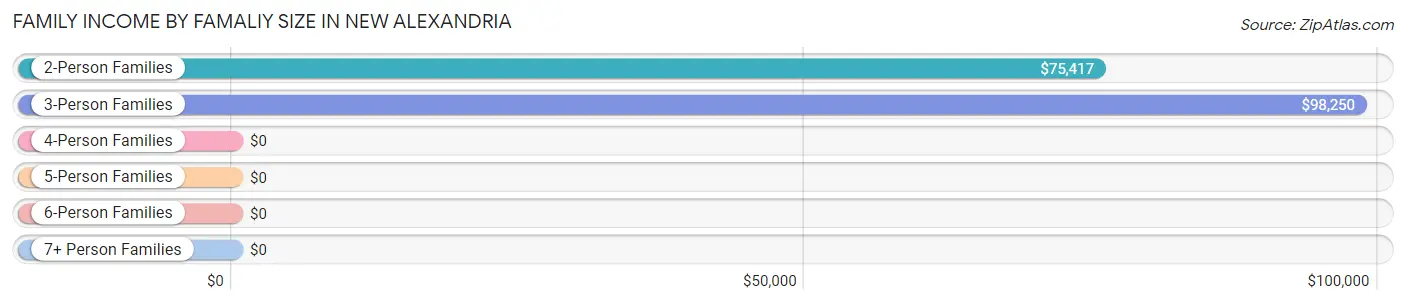
| Income Bracket | # Families | Median Income |
| 2-Person Families | 57 (60.0%) | $75,417 |
| 3-Person Families | 15 (15.8%) | $98,250 |
| 4-Person Families | 13 (13.7%) | $0 |
| 5-Person Families | 2 (2.1%) | $0 |
| 6-Person Families | 0 (0.0%) | $0 |
| 7+ Person Families | 8 (8.4%) | $0 |
| Total | 95 (100.0%) | $81,875 |
Family Income by Number of Earners in New Alexandria
The median family income in New Alexandria is $81,875, with families comprising 3+ earners (16) having the highest median family income of $128,750, while families with no earners (22) have the lowest median family income of $21,250, accounting for 16.8% and 23.2% of families, respectively.
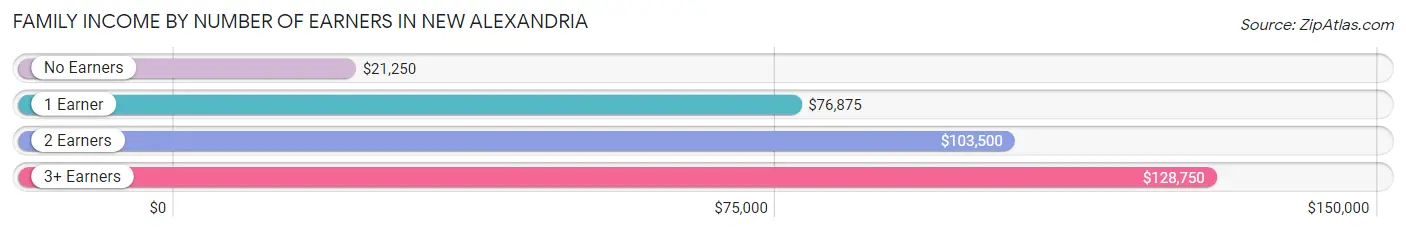
| Number of Earners | # Families | Median Income |
| No Earners | 22 (23.2%) | $21,250 |
| 1 Earner | 39 (41.0%) | $76,875 |
| 2 Earners | 18 (19.0%) | $103,500 |
| 3+ Earners | 16 (16.8%) | $128,750 |
| Total | 95 (100.0%) | $81,875 |
Household Income in New Alexandria
Household Income Brackets in New Alexandria
With 29 households falling in the category, the $75,000 to $99,999 income range is the most frequent in New Alexandria, accounting for 26.1% of all households.
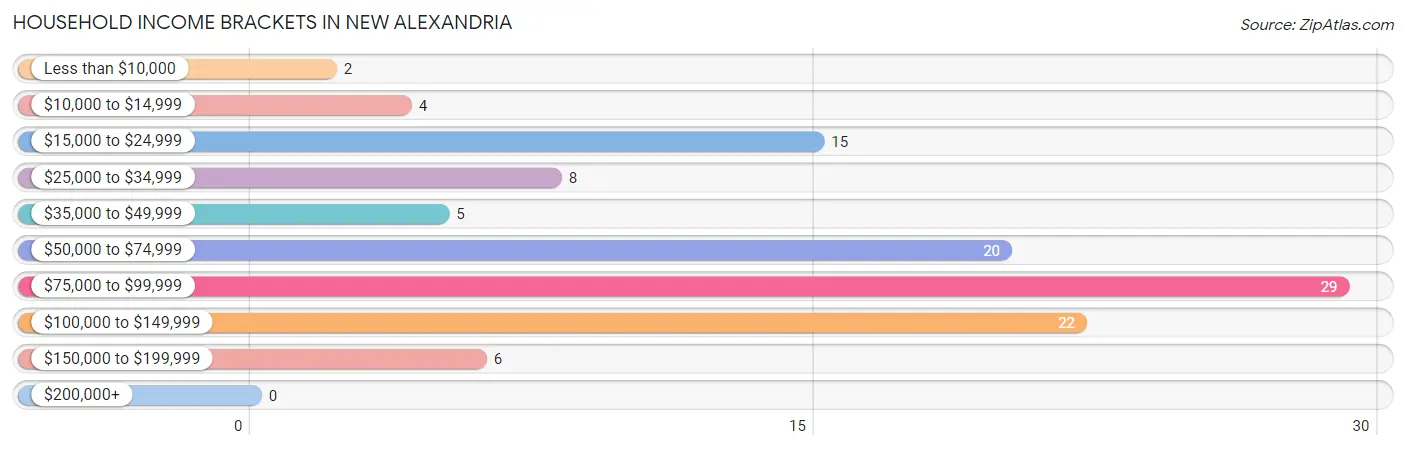
| Income Bracket | # Households | % Households |
| Less than $10,000 | 2 | 1.8% |
| $10,000 to $14,999 | 4 | 3.6% |
| $15,000 to $24,999 | 15 | 13.5% |
| $25,000 to $34,999 | 8 | 7.2% |
| $35,000 to $49,999 | 5 | 4.5% |
| $50,000 to $74,999 | 20 | 18.0% |
| $75,000 to $99,999 | 29 | 26.1% |
| $100,000 to $149,999 | 22 | 19.8% |
| $150,000 to $199,999 | 6 | 5.4% |
| $200,000+ | 0 | 0.0% |
Household Income by Householder Age in New Alexandria
The median household income in New Alexandria is $75,750, with the highest median household income of $104,000 found in the 25 to 44 years age bracket for the primary householder. A total of 34 households (30.6%) fall into this category. Meanwhile, the 15 to 24 years age bracket for the primary householder has the lowest median household income of $0, with 3 households (2.7%) in this group.
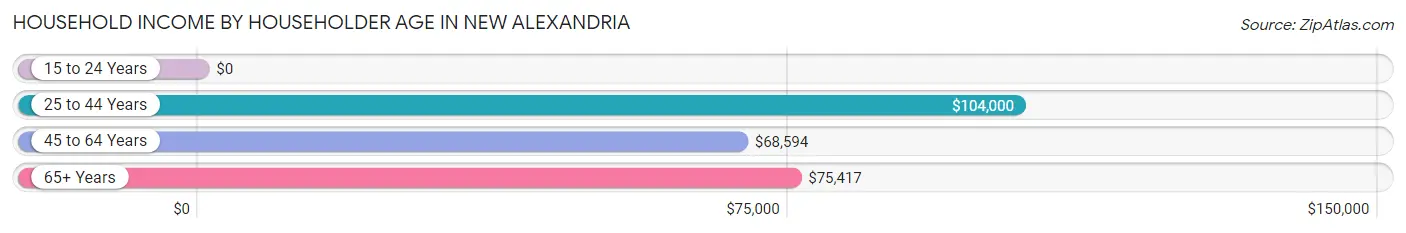
| Income Bracket | # Households | Median Income |
| 15 to 24 Years | 3 (2.7%) | $0 |
| 25 to 44 Years | 34 (30.6%) | $104,000 |
| 45 to 64 Years | 27 (24.3%) | $68,594 |
| 65+ Years | 47 (42.3%) | $75,417 |
| Total | 111 (100.0%) | $75,750 |
Poverty in New Alexandria
Income Below Poverty by Sex and Age in New Alexandria
With 9.1% poverty level for males and 12.6% for females among the residents of New Alexandria, 6 to 11 year old males and 16 and 17 year old females are the most vulnerable to poverty, with 3 males (60.0%) and 4 females (100.0%) in their respective age groups living below the poverty level.
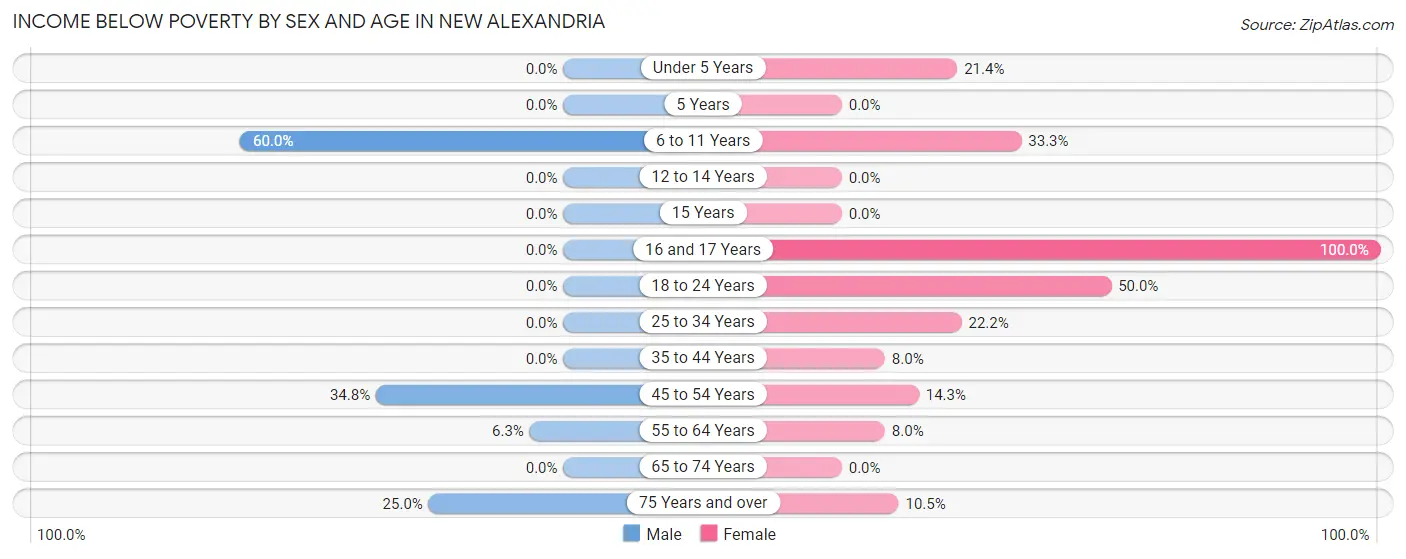
| Age Bracket | Male | Female |
| Under 5 Years | 0 (0.0%) | 3 (21.4%) |
| 5 Years | 0 (0.0%) | 0 (0.0%) |
| 6 to 11 Years | 3 (60.0%) | 1 (33.3%) |
| 12 to 14 Years | 0 (0.0%) | 0 (0.0%) |
| 15 Years | 0 (0.0%) | 0 (0.0%) |
| 16 and 17 Years | 0 (0.0%) | 4 (100.0%) |
| 18 to 24 Years | 0 (0.0%) | 2 (50.0%) |
| 25 to 34 Years | 0 (0.0%) | 2 (22.2%) |
| 35 to 44 Years | 0 (0.0%) | 2 (8.0%) |
| 45 to 54 Years | 8 (34.8%) | 1 (14.3%) |
| 55 to 64 Years | 1 (6.2%) | 2 (8.0%) |
| 65 to 74 Years | 0 (0.0%) | 0 (0.0%) |
| 75 Years and over | 4 (25.0%) | 2 (10.5%) |
| Total | 16 (9.1%) | 19 (12.6%) |
Income Above Poverty by Sex and Age in New Alexandria
According to the poverty statistics in New Alexandria, males aged under 5 years and females aged 12 to 14 years are the age groups that are most secure financially, with 100.0% of males and 100.0% of females in these age groups living above the poverty line.
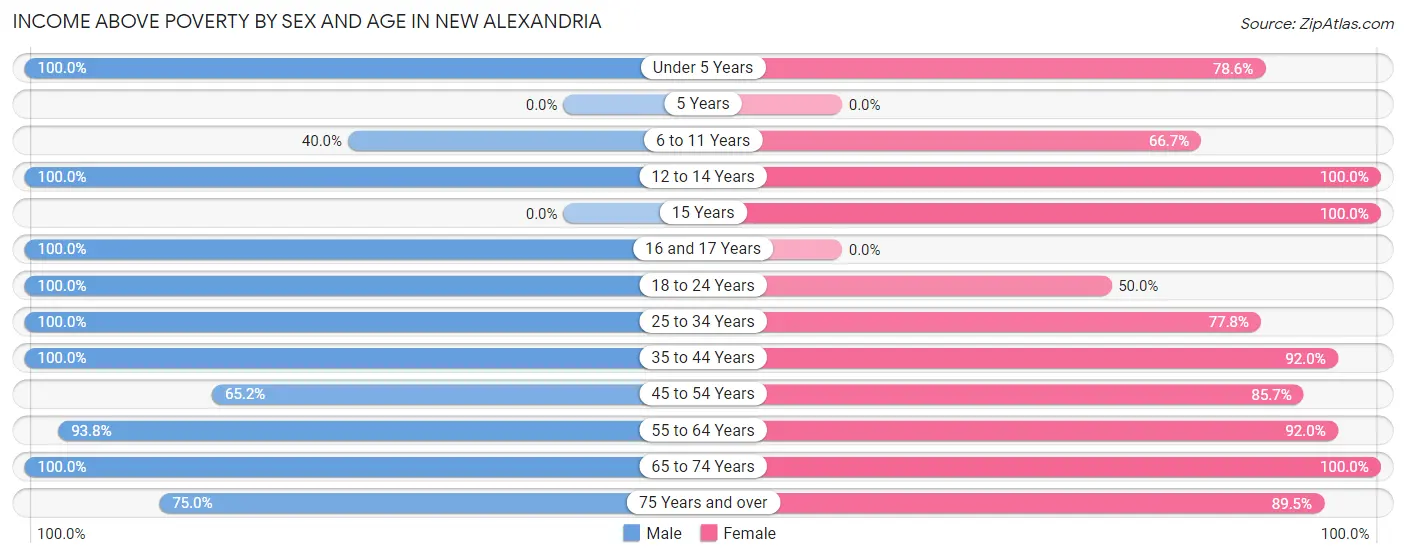
| Age Bracket | Male | Female |
| Under 5 Years | 5 (100.0%) | 11 (78.6%) |
| 5 Years | 0 (0.0%) | 0 (0.0%) |
| 6 to 11 Years | 2 (40.0%) | 2 (66.7%) |
| 12 to 14 Years | 4 (100.0%) | 15 (100.0%) |
| 15 Years | 0 (0.0%) | 1 (100.0%) |
| 16 and 17 Years | 6 (100.0%) | 0 (0.0%) |
| 18 to 24 Years | 49 (100.0%) | 2 (50.0%) |
| 25 to 34 Years | 11 (100.0%) | 7 (77.8%) |
| 35 to 44 Years | 19 (100.0%) | 23 (92.0%) |
| 45 to 54 Years | 15 (65.2%) | 6 (85.7%) |
| 55 to 64 Years | 15 (93.8%) | 23 (92.0%) |
| 65 to 74 Years | 22 (100.0%) | 25 (100.0%) |
| 75 Years and over | 12 (75.0%) | 17 (89.5%) |
| Total | 160 (90.9%) | 132 (87.4%) |
Income Below Poverty Among Married-Couple Families in New Alexandria
The poverty statistics for married-couple families in New Alexandria show that 8.1% or 6 of the total 74 families live below the poverty line. Families with 1 or 2 children have the highest poverty rate of 11.1%, comprising of 2 families. On the other hand, families with 3 or 4 children have the lowest poverty rate of 0.0%, which includes 0 families.
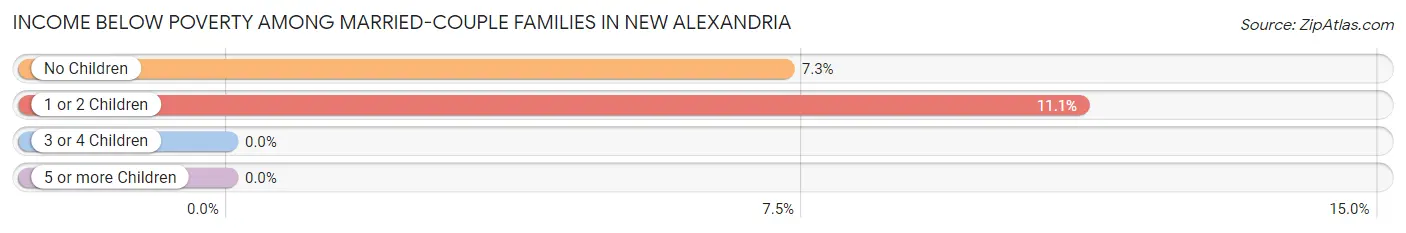
| Children | Above Poverty | Below Poverty |
| No Children | 51 (92.7%) | 4 (7.3%) |
| 1 or 2 Children | 16 (88.9%) | 2 (11.1%) |
| 3 or 4 Children | 1 (100.0%) | 0 (0.0%) |
| 5 or more Children | 0 (0.0%) | 0 (0.0%) |
| Total | 68 (91.9%) | 6 (8.1%) |
Income Below Poverty Among Single-Parent Households in New Alexandria
According to the poverty data in New Alexandria, 14.3% or 1 single-father households and 21.4% or 3 single-mother households are living below the poverty line. Among single-father households, those with 1 or 2 children have the highest poverty rate, with 1 households (50.0%) experiencing poverty. Likewise, among single-mother households, those with 1 or 2 children have the highest poverty rate, with 2 households (100.0%) falling below the poverty line.
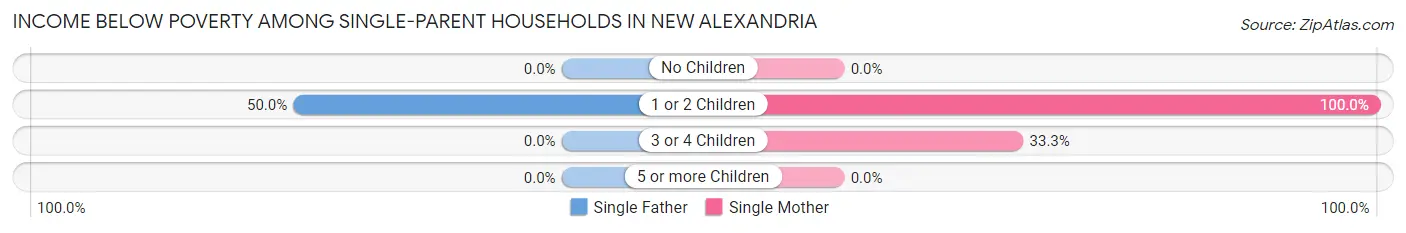
| Children | Single Father | Single Mother |
| No Children | 0 (0.0%) | 0 (0.0%) |
| 1 or 2 Children | 1 (50.0%) | 2 (100.0%) |
| 3 or 4 Children | 0 (0.0%) | 1 (33.3%) |
| 5 or more Children | 0 (0.0%) | 0 (0.0%) |
| Total | 1 (14.3%) | 3 (21.4%) |
Income Below Poverty Among Married-Couple vs Single-Parent Households in New Alexandria
The poverty data for New Alexandria shows that 6 of the married-couple family households (8.1%) and 4 of the single-parent households (19.1%) are living below the poverty level. Within the married-couple family households, those with 1 or 2 children have the highest poverty rate, with 2 households (11.1%) falling below the poverty line. Among the single-parent households, those with 1 or 2 children have the highest poverty rate, with 3 household (75.0%) living below poverty.
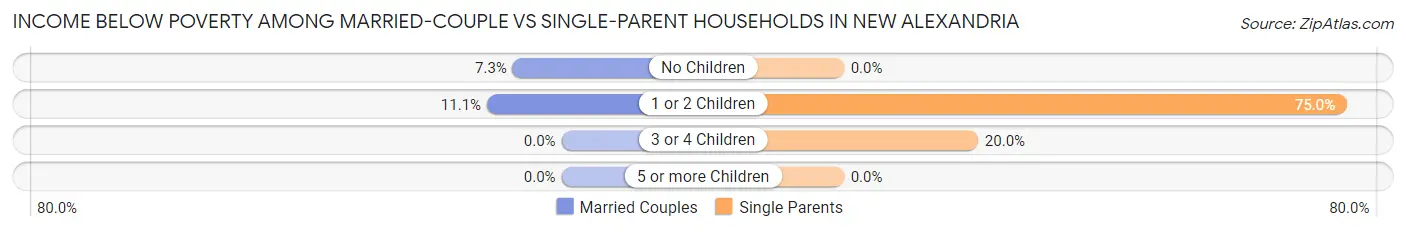
| Children | Married-Couple Families | Single-Parent Households |
| No Children | 4 (7.3%) | 0 (0.0%) |
| 1 or 2 Children | 2 (11.1%) | 3 (75.0%) |
| 3 or 4 Children | 0 (0.0%) | 1 (20.0%) |
| 5 or more Children | 0 (0.0%) | 0 (0.0%) |
| Total | 6 (8.1%) | 4 (19.1%) |
Race in New Alexandria
The most populous races in New Alexandria are White / Caucasian (326 | 99.7%), and Two or more Races (1 | 0.3%).
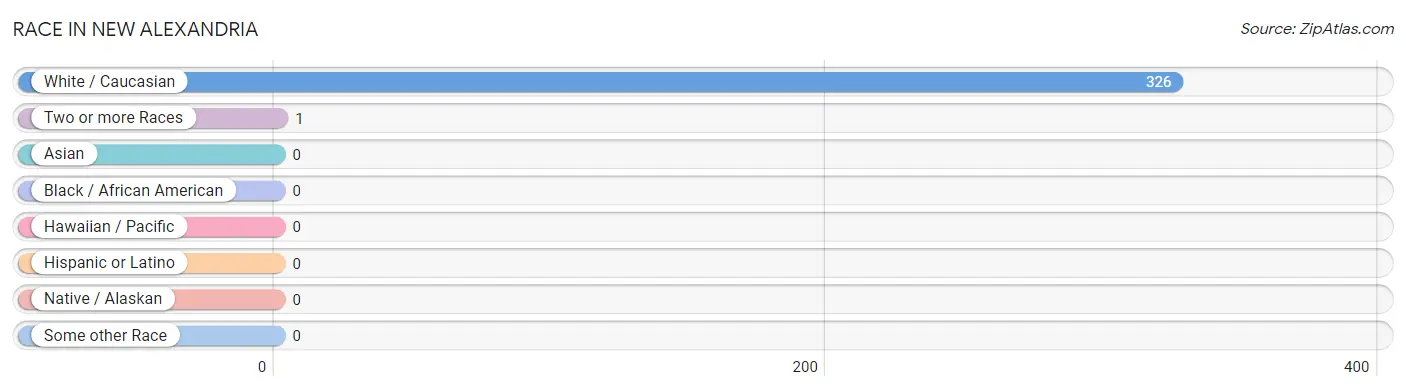
| Race | # Population | % Population |
| Asian | 0 | 0.0% |
| Black / African American | 0 | 0.0% |
| Hawaiian / Pacific | 0 | 0.0% |
| Hispanic or Latino | 0 | 0.0% |
| Native / Alaskan | 0 | 0.0% |
| White / Caucasian | 326 | 99.7% |
| Two or more Races | 1 | 0.3% |
| Some other Race | 0 | 0.0% |
| Total | 327 | 100.0% |
Ancestry in New Alexandria
The most populous ancestries reported in New Alexandria are German (70 | 21.4%), Irish (52 | 15.9%), Italian (28 | 8.6%), English (27 | 8.3%), and American (22 | 6.7%), together accounting for 60.9% of all New Alexandria residents.
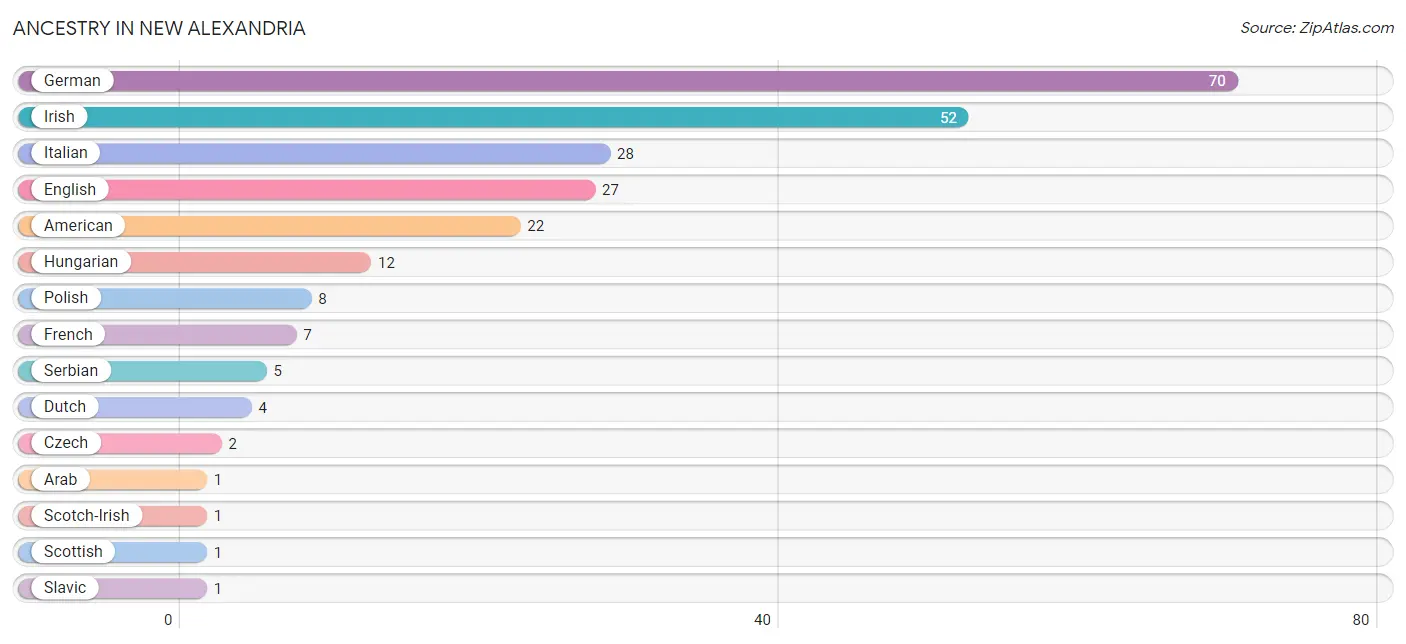
| Ancestry | # Population | % Population |
| American | 22 | 6.7% |
| Arab | 1 | 0.3% |
| Czech | 2 | 0.6% |
| Dutch | 4 | 1.2% |
| English | 27 | 8.3% |
| French | 7 | 2.1% |
| German | 70 | 21.4% |
| Hungarian | 12 | 3.7% |
| Irish | 52 | 15.9% |
| Italian | 28 | 8.6% |
| Polish | 8 | 2.5% |
| Scotch-Irish | 1 | 0.3% |
| Scottish | 1 | 0.3% |
| Serbian | 5 | 1.5% |
| Slavic | 1 | 0.3% |
| Syrian | 1 | 0.3% | View All 16 Rows |
Immigrants in New Alexandria

| Immigration Origin | # Population | % Population | View All 0 Rows |
Sex and Age in New Alexandria
Sex and Age in New Alexandria
The most populous age groups in New Alexandria are 15 to 19 Years (30 | 17.1%) for men and 65 to 69 Years (20 | 13.3%) for women.
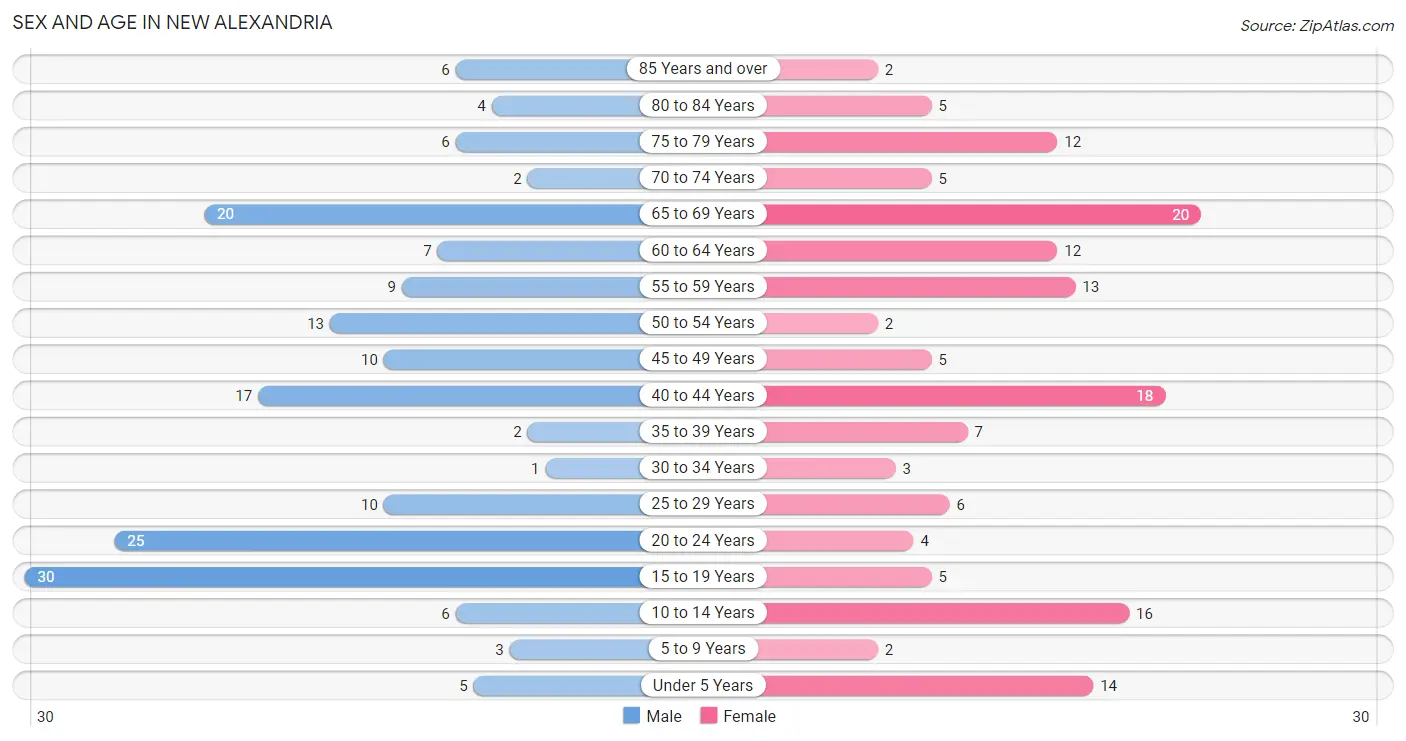
| Age Bracket | Male | Female |
| Under 5 Years | 5 (2.8%) | 14 (9.3%) |
| 5 to 9 Years | 3 (1.7%) | 2 (1.3%) |
| 10 to 14 Years | 6 (3.4%) | 16 (10.6%) |
| 15 to 19 Years | 30 (17.1%) | 5 (3.3%) |
| 20 to 24 Years | 25 (14.2%) | 4 (2.6%) |
| 25 to 29 Years | 10 (5.7%) | 6 (4.0%) |
| 30 to 34 Years | 1 (0.6%) | 3 (2.0%) |
| 35 to 39 Years | 2 (1.1%) | 7 (4.6%) |
| 40 to 44 Years | 17 (9.7%) | 18 (11.9%) |
| 45 to 49 Years | 10 (5.7%) | 5 (3.3%) |
| 50 to 54 Years | 13 (7.4%) | 2 (1.3%) |
| 55 to 59 Years | 9 (5.1%) | 13 (8.6%) |
| 60 to 64 Years | 7 (4.0%) | 12 (8.0%) |
| 65 to 69 Years | 20 (11.4%) | 20 (13.3%) |
| 70 to 74 Years | 2 (1.1%) | 5 (3.3%) |
| 75 to 79 Years | 6 (3.4%) | 12 (8.0%) |
| 80 to 84 Years | 4 (2.3%) | 5 (3.3%) |
| 85 Years and over | 6 (3.4%) | 2 (1.3%) |
| Total | 176 (100.0%) | 151 (100.0%) |
Families and Households in New Alexandria
Median Family Size in New Alexandria
The median family size in New Alexandria is 3.16 persons per family, with single female/mother families (14 | 14.7%) accounting for the largest median family size of 3.36 persons per family. On the other hand, single male/father families (7 | 7.4%) represent the smallest median family size with 2.86 persons per family.
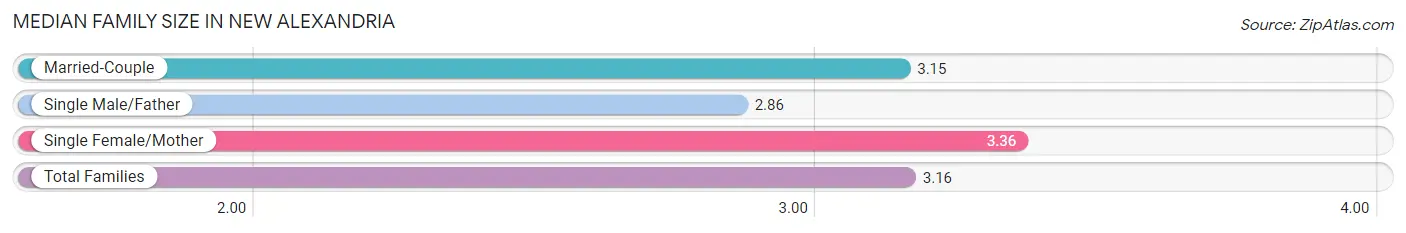
| Family Type | # Families | Family Size |
| Married-Couple | 74 (77.9%) | 3.15 |
| Single Male/Father | 7 (7.4%) | 2.86 |
| Single Female/Mother | 14 (14.7%) | 3.36 |
| Total Families | 95 (100.0%) | 3.16 |
Median Household Size in New Alexandria
The median household size in New Alexandria is 2.95 persons per household, with single female/mother households (14 | 12.6%) accounting for the largest median household size of 3.36 persons per household. non-family households (16 | 14.4%) represent the smallest median household size with 1.56 persons per household.
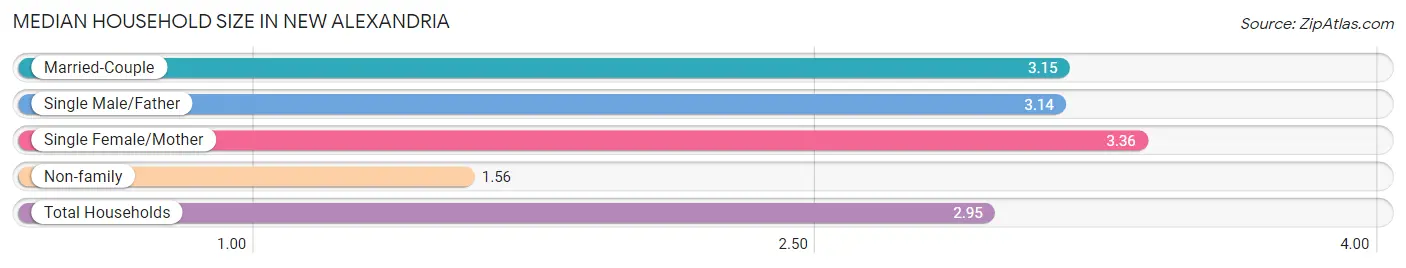
| Household Type | # Households | Household Size |
| Married-Couple | 74 (66.7%) | 3.15 |
| Single Male/Father | 7 (6.3%) | 3.14 |
| Single Female/Mother | 14 (12.6%) | 3.36 |
| Non-family | 16 (14.4%) | 1.56 |
| Total Households | 111 (100.0%) | 2.95 |
Household Size by Marriage Status in New Alexandria
Out of a total of 111 households in New Alexandria, 95 (85.6%) are family households, while 16 (14.4%) are nonfamily households. The most numerous type of family households are 2-person households, comprising 56, and the most common type of nonfamily households are 1-person households, comprising 10.
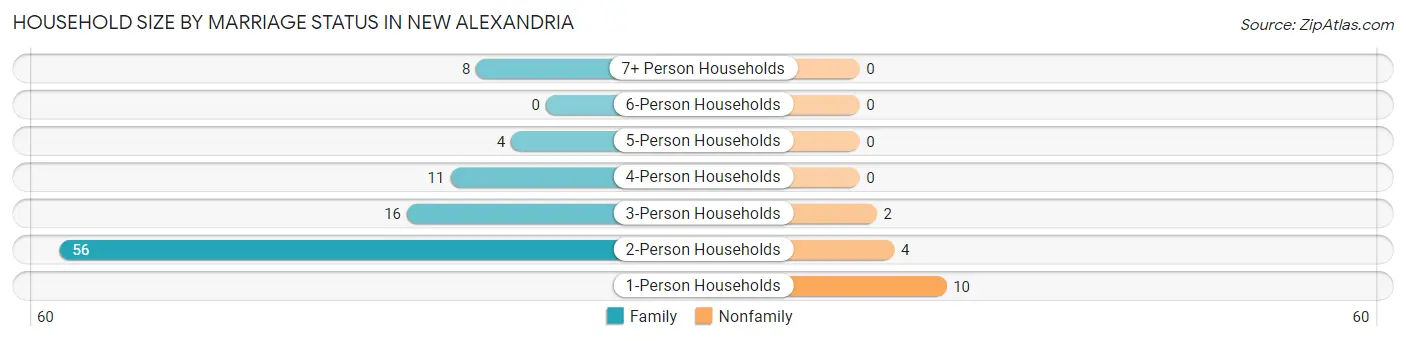
| Household Size | Family Households | Nonfamily Households |
| 1-Person Households | - | 10 (9.0%) |
| 2-Person Households | 56 (50.4%) | 4 (3.6%) |
| 3-Person Households | 16 (14.4%) | 2 (1.8%) |
| 4-Person Households | 11 (9.9%) | 0 (0.0%) |
| 5-Person Households | 4 (3.6%) | 0 (0.0%) |
| 6-Person Households | 0 (0.0%) | 0 (0.0%) |
| 7+ Person Households | 8 (7.2%) | 0 (0.0%) |
| Total | 95 (85.6%) | 16 (14.4%) |
Female Fertility in New Alexandria
Fertility by Age in New Alexandria
Average fertility rate in New Alexandria is 143.0 births per 1,000 women. Women in the age bracket of 20 to 34 years have the highest fertility rate with 308.0 births per 1,000 women. Women in the age bracket of 20 to 34 years acount for 57.1% of all women with births.
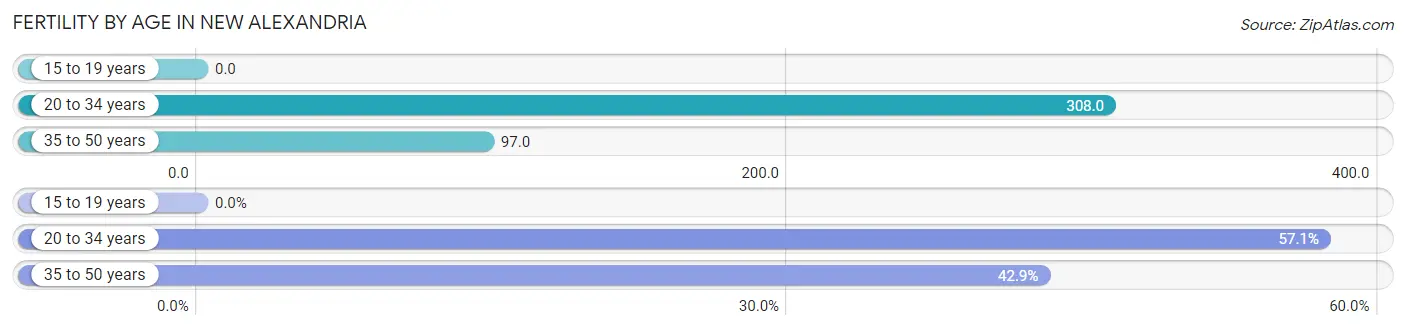
| Age Bracket | Women with Births | Births / 1,000 Women |
| 15 to 19 years | 0 (0.0%) | 0.0 |
| 20 to 34 years | 4 (57.1%) | 308.0 |
| 35 to 50 years | 3 (42.9%) | 97.0 |
| Total | 7 (100.0%) | 143.0 |
Fertility by Age by Marriage Status in New Alexandria
57.1% of women with births (7) in New Alexandria are married. The highest percentage of unmarried women with births falls into 20 to 34 years age bracket with 75.0% of them unmarried at the time of birth, while the lowest percentage of unmarried women with births belong to 35 to 50 years age bracket with 0.0% of them unmarried.
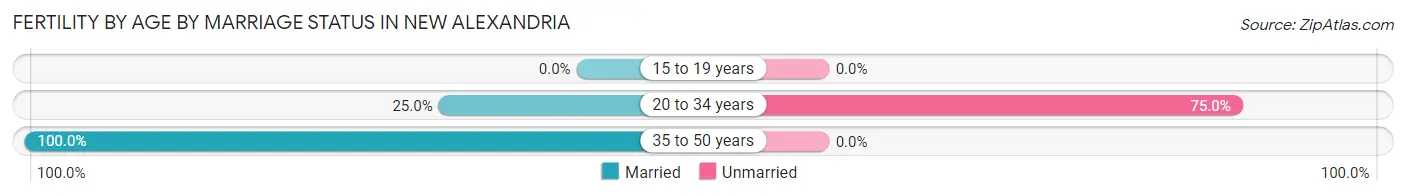
| Age Bracket | Married | Unmarried |
| 15 to 19 years | 0 (0.0%) | 0 (0.0%) |
| 20 to 34 years | 1 (25.0%) | 3 (75.0%) |
| 35 to 50 years | 3 (100.0%) | 0 (0.0%) |
| Total | 4 (57.1%) | 3 (42.9%) |
Fertility by Education in New Alexandria
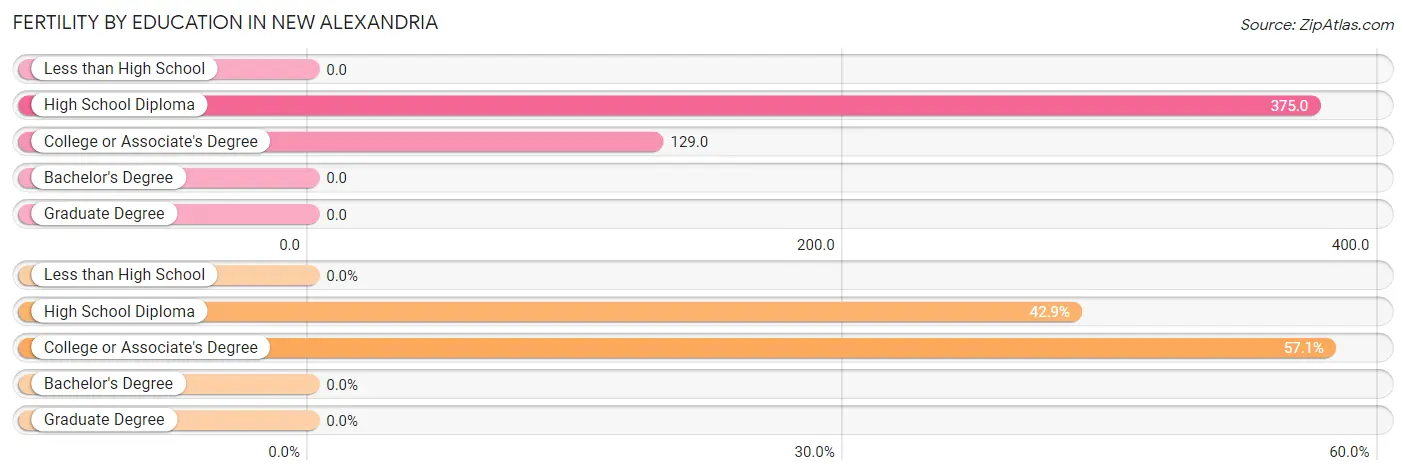
| Educational Attainment | Women with Births | Births / 1,000 Women |
| Less than High School | 0 (0.0%) | 0.0 |
| High School Diploma | 3 (42.9%) | 375.0 |
| College or Associate's Degree | 4 (57.1%) | 129.0 |
| Bachelor's Degree | 0 (0.0%) | 0.0 |
| Graduate Degree | 0 (0.0%) | 0.0 |
| Total | 7 (100.0%) | 143.0 |
Fertility by Education by Marriage Status in New Alexandria
42.9% of women with births in New Alexandria are unmarried. Women with the educational attainment of college or associate's degree are most likely to be married with 100.0% of them married at childbirth, while women with the educational attainment of high school diploma are least likely to be married with 100.0% of them unmarried at childbirth.
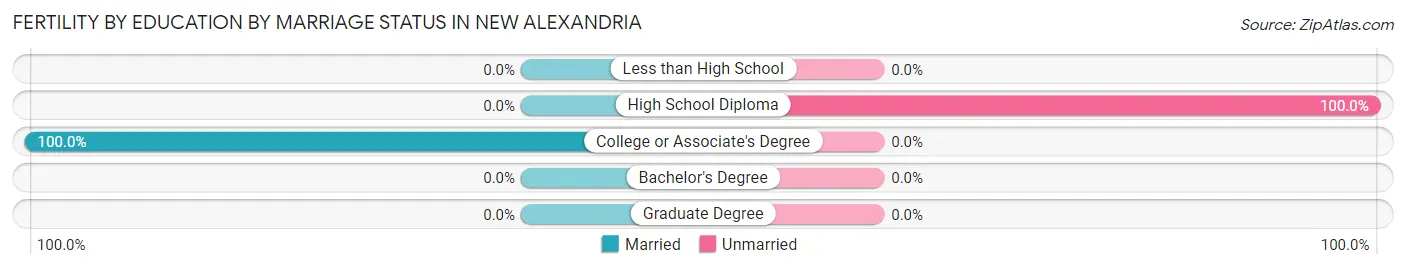
| Educational Attainment | Married | Unmarried |
| Less than High School | 0 (0.0%) | 0 (0.0%) |
| High School Diploma | 0 (0.0%) | 3 (100.0%) |
| College or Associate's Degree | 4 (100.0%) | 0 (0.0%) |
| Bachelor's Degree | 0 (0.0%) | 0 (0.0%) |
| Graduate Degree | 0 (0.0%) | 0 (0.0%) |
| Total | 4 (57.1%) | 3 (42.9%) |
Employment Characteristics in New Alexandria
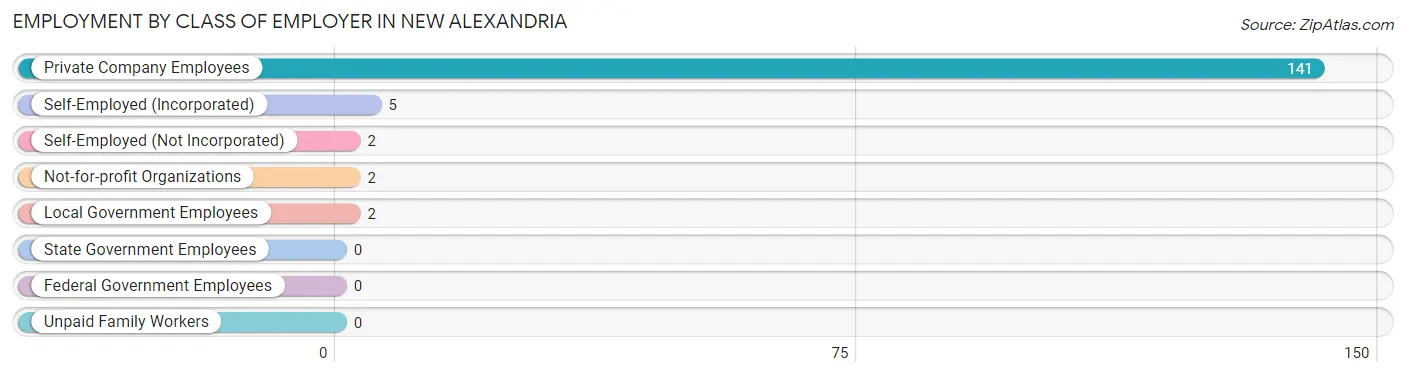
Employment by Class of Employer in New Alexandria
Among the 152 employed individuals in New Alexandria, private company employees (141 | 92.8%), self-employed (incorporated) (5 | 3.3%), and self-employed (not incorporated) (2 | 1.3%) make up the most common classes of employment.
| Employer Class | # Employees | % Employees |
| Private Company Employees | 141 | 92.8% |
| Self-Employed (Incorporated) | 5 | 3.3% |
| Self-Employed (Not Incorporated) | 2 | 1.3% |
| Not-for-profit Organizations | 2 | 1.3% |
| Local Government Employees | 2 | 1.3% |
| State Government Employees | 0 | 0.0% |
| Federal Government Employees | 0 | 0.0% |
| Unpaid Family Workers | 0 | 0.0% |
| Total | 152 | 100.0% |
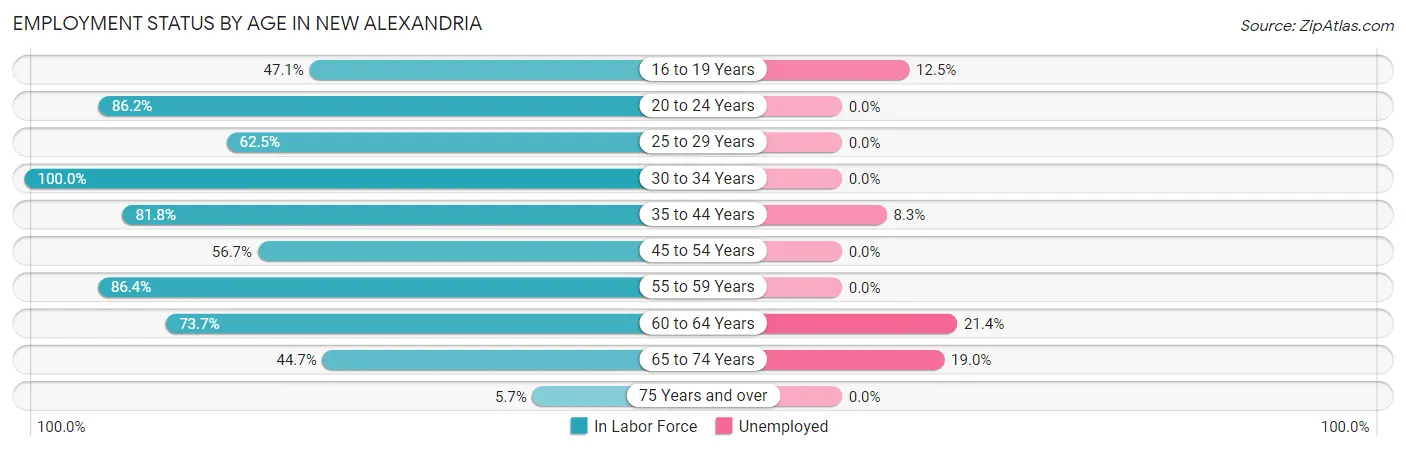
Employment Status by Age in New Alexandria
According to the labor force statistics for New Alexandria, out of the total population over 16 years of age (280), 58.6% or 164 individuals are in the labor force, with 7.3% or 12 of them unemployed. The age group with the highest labor force participation rate is 30 to 34 years, with 100.0% or 4 individuals in the labor force. Within the labor force, the 60 to 64 years age range has the highest percentage of unemployed individuals, with 21.4% or 3 of them being unemployed.
| Age Bracket | In Labor Force | Unemployed |
| 16 to 19 Years | 16 (47.1%) | 2 (12.5%) |
| 20 to 24 Years | 25 (86.2%) | 0 (0.0%) |
| 25 to 29 Years | 10 (62.5%) | 0 (0.0%) |
| 30 to 34 Years | 4 (100.0%) | 0 (0.0%) |
| 35 to 44 Years | 36 (81.8%) | 3 (8.3%) |
| 45 to 54 Years | 17 (56.7%) | 0 (0.0%) |
| 55 to 59 Years | 19 (86.4%) | 0 (0.0%) |
| 60 to 64 Years | 14 (73.7%) | 3 (21.4%) |
| 65 to 74 Years | 21 (44.7%) | 4 (19.0%) |
| 75 Years and over | 2 (5.7%) | 0 (0.0%) |
| Total | 164 (58.6%) | 12 (7.3%) |
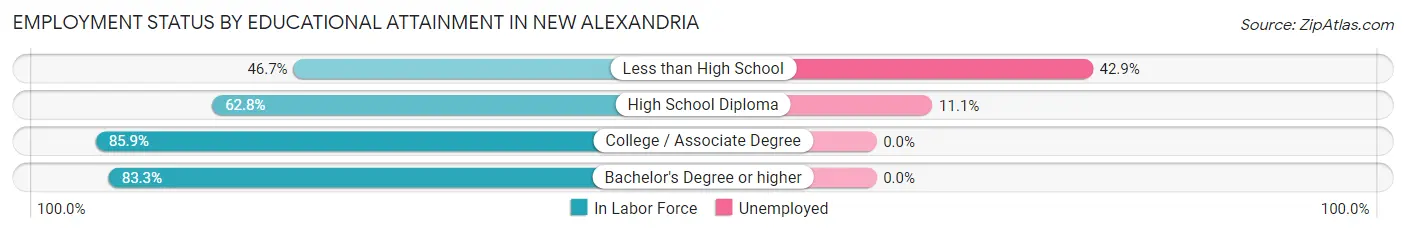
Employment Status by Educational Attainment in New Alexandria
According to labor force statistics for New Alexandria, 74.1% of individuals (100) out of the total population between 25 and 64 years of age (135) are in the labor force, with 6.0% or 6 of them being unemployed. The group with the highest labor force participation rate are those with the educational attainment of college / associate degree, with 85.9% or 61 individuals in the labor force. Within the labor force, individuals with less than high school education have the highest percentage of unemployment, with 42.9% or 3 of them being unemployed.
| Educational Attainment | In Labor Force | Unemployed |
| Less than High School | 7 (46.7%) | 6 (42.9%) |
| High School Diploma | 27 (62.8%) | 5 (11.1%) |
| College / Associate Degree | 61 (85.9%) | 0 (0.0%) |
| Bachelor's Degree or higher | 5 (83.3%) | 0 (0.0%) |
| Total | 100 (74.1%) | 8 (6.0%) |
Employment Occupations by Sex in New Alexandria
Management, Business, Science and Arts Occupations
The most common Management, Business, Science and Arts occupations in New Alexandria are Community & Social Service (9 | 5.9%), Education Instruction & Library (9 | 5.9%), Health Diagnosing & Treating (6 | 4.0%), Health Technologists (6 | 4.0%), and Computers, Engineering & Science (4 | 2.6%).
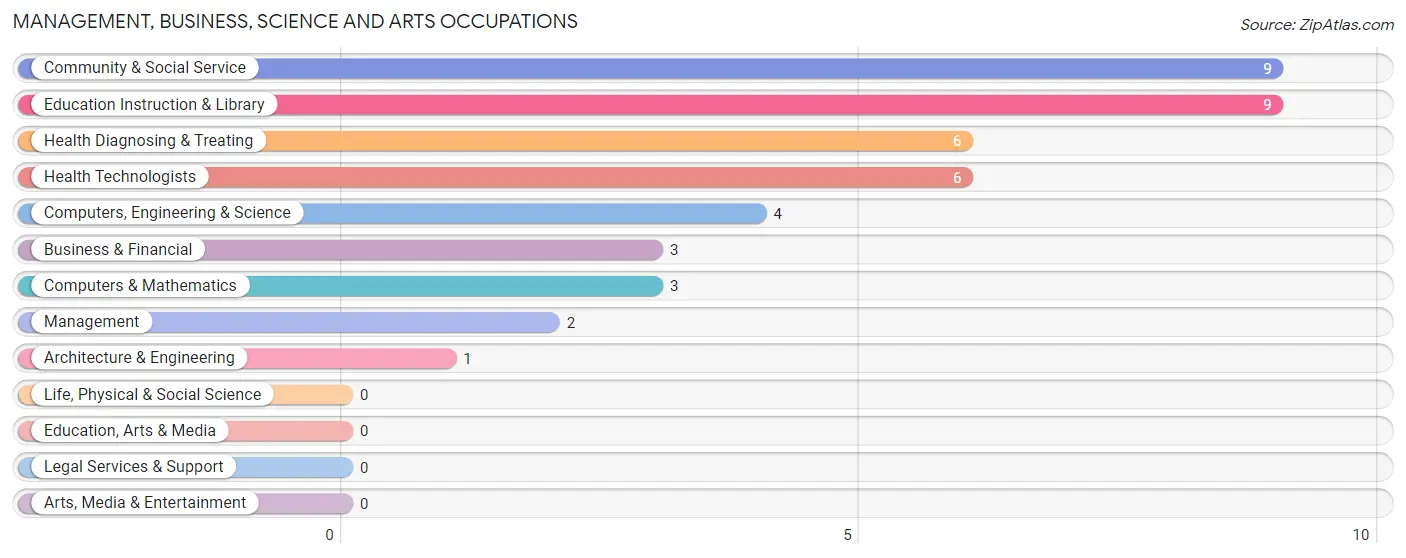
Management, Business, Science and Arts Occupations by Sex
Within the Management, Business, Science and Arts occupations in New Alexandria, the most male-oriented occupations are Computers, Engineering & Science (100.0%), Computers & Mathematics (100.0%), and Architecture & Engineering (100.0%), while the most female-oriented occupations are Management (100.0%), Business & Financial (100.0%), and Community & Social Service (100.0%).
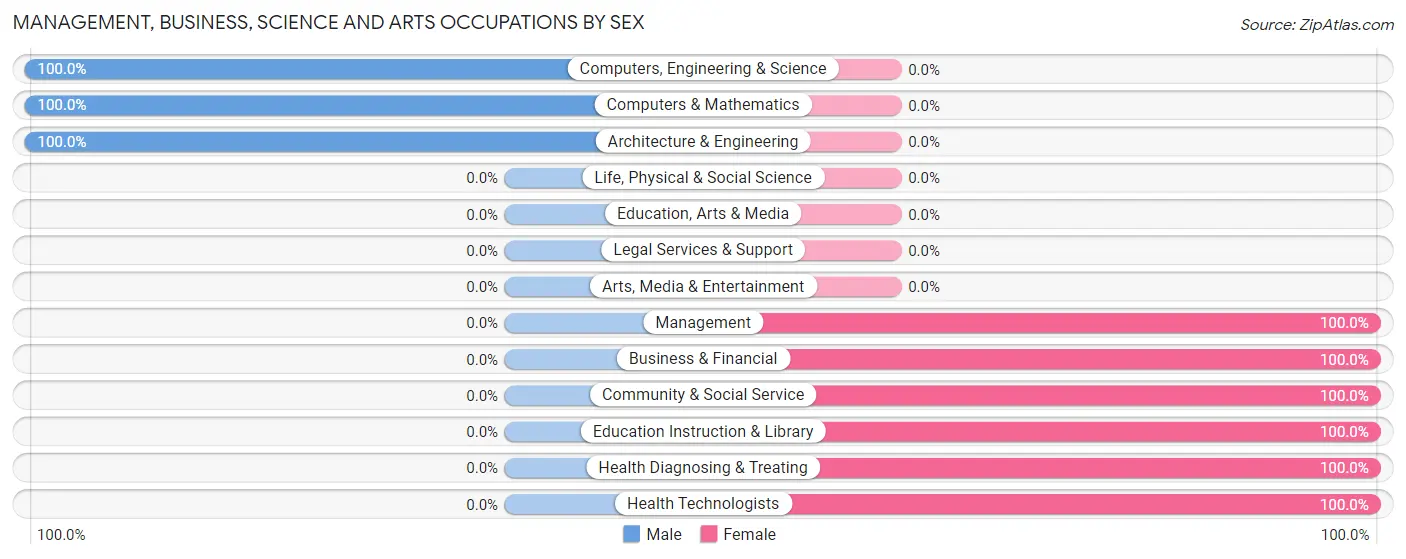
| Occupation | Male | Female |
| Management | 0 (0.0%) | 2 (100.0%) |
| Business & Financial | 0 (0.0%) | 3 (100.0%) |
| Computers, Engineering & Science | 4 (100.0%) | 0 (0.0%) |
| Computers & Mathematics | 3 (100.0%) | 0 (0.0%) |
| Architecture & Engineering | 1 (100.0%) | 0 (0.0%) |
| Life, Physical & Social Science | 0 (0.0%) | 0 (0.0%) |
| Community & Social Service | 0 (0.0%) | 9 (100.0%) |
| Education, Arts & Media | 0 (0.0%) | 0 (0.0%) |
| Legal Services & Support | 0 (0.0%) | 0 (0.0%) |
| Education Instruction & Library | 0 (0.0%) | 9 (100.0%) |
| Arts, Media & Entertainment | 0 (0.0%) | 0 (0.0%) |
| Health Diagnosing & Treating | 0 (0.0%) | 6 (100.0%) |
| Health Technologists | 0 (0.0%) | 6 (100.0%) |
| Total (Category) | 4 (16.7%) | 20 (83.3%) |
| Total (Overall) | 100 (65.8%) | 52 (34.2%) |
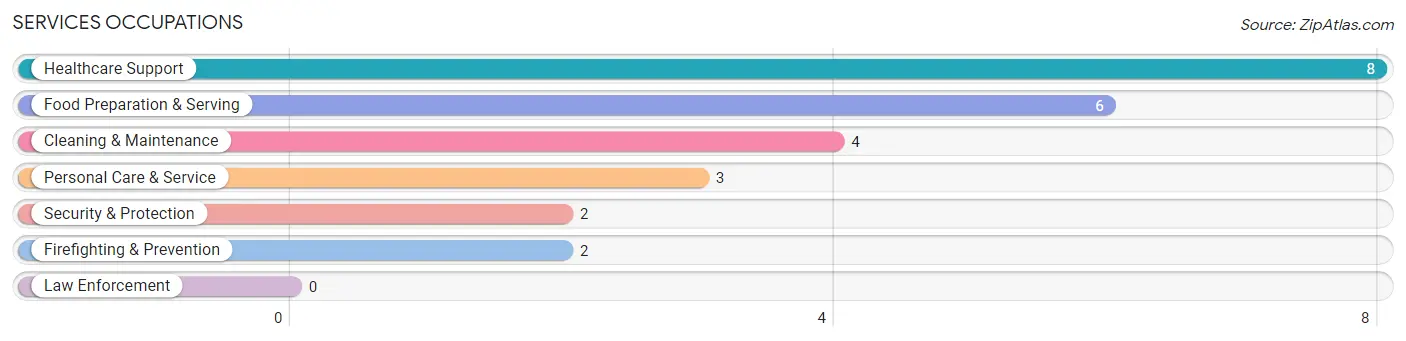
Services Occupations
The most common Services occupations in New Alexandria are Healthcare Support (8 | 5.3%), Food Preparation & Serving (6 | 4.0%), Cleaning & Maintenance (4 | 2.6%), Personal Care & Service (3 | 2.0%), and Security & Protection (2 | 1.3%).
Services Occupations by Sex
Within the Services occupations in New Alexandria, the most male-oriented occupations are Security & Protection (100.0%), Firefighting & Prevention (100.0%), and Cleaning & Maintenance (100.0%), while the most female-oriented occupations are Healthcare Support (100.0%), Personal Care & Service (100.0%), and Food Preparation & Serving (50.0%).
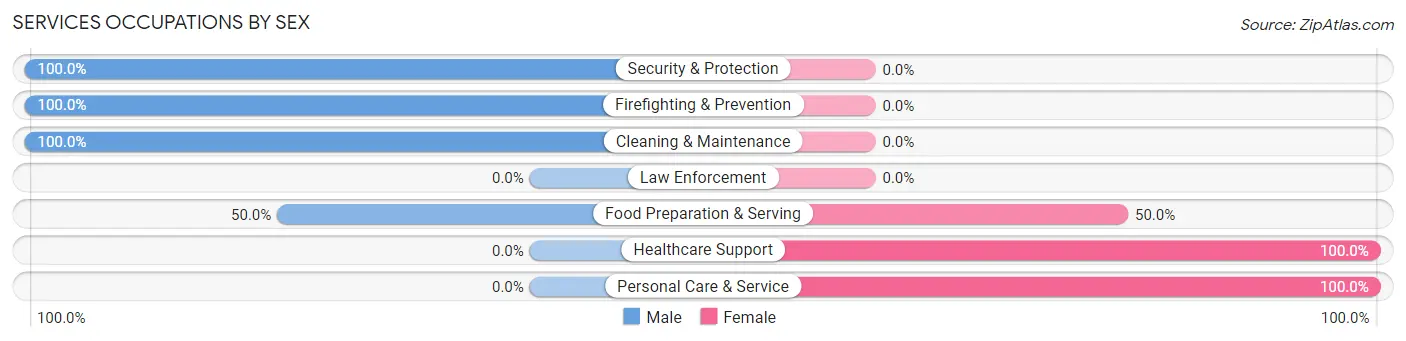
| Occupation | Male | Female |
| Healthcare Support | 0 (0.0%) | 8 (100.0%) |
| Security & Protection | 2 (100.0%) | 0 (0.0%) |
| Firefighting & Prevention | 2 (100.0%) | 0 (0.0%) |
| Law Enforcement | 0 (0.0%) | 0 (0.0%) |
| Food Preparation & Serving | 3 (50.0%) | 3 (50.0%) |
| Cleaning & Maintenance | 4 (100.0%) | 0 (0.0%) |
| Personal Care & Service | 0 (0.0%) | 3 (100.0%) |
| Total (Category) | 9 (39.1%) | 14 (60.9%) |
| Total (Overall) | 100 (65.8%) | 52 (34.2%) |
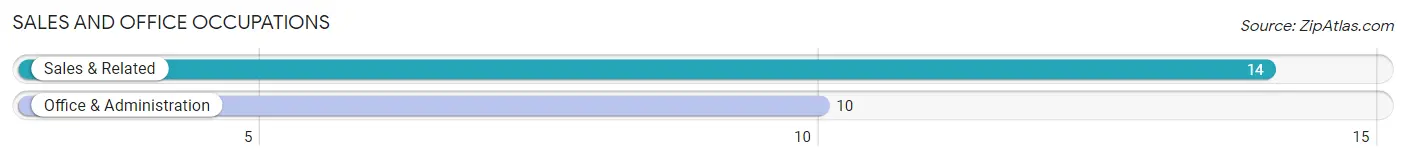
Sales and Office Occupations
The most common Sales and Office occupations in New Alexandria are Sales & Related (14 | 9.2%), and Office & Administration (10 | 6.6%).
Sales and Office Occupations by Sex
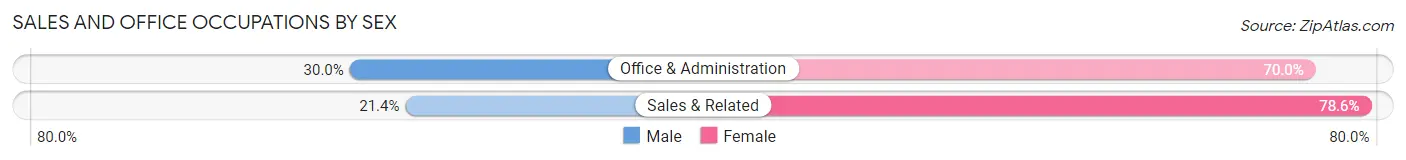
| Occupation | Male | Female |
| Sales & Related | 3 (21.4%) | 11 (78.6%) |
| Office & Administration | 3 (30.0%) | 7 (70.0%) |
| Total (Category) | 6 (25.0%) | 18 (75.0%) |
| Total (Overall) | 100 (65.8%) | 52 (34.2%) |
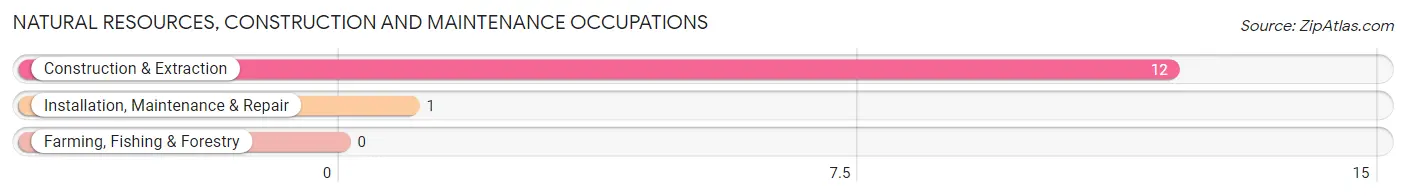
Natural Resources, Construction and Maintenance Occupations
The most common Natural Resources, Construction and Maintenance occupations in New Alexandria are Construction & Extraction (12 | 7.9%), and Installation, Maintenance & Repair (1 | 0.7%).
Natural Resources, Construction and Maintenance Occupations by Sex
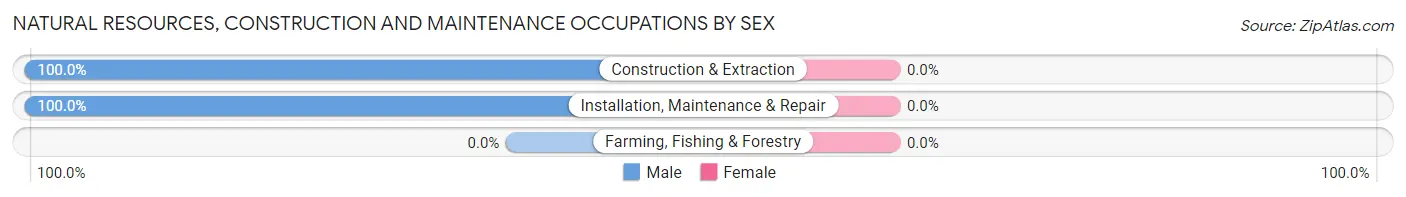
| Occupation | Male | Female |
| Farming, Fishing & Forestry | 0 (0.0%) | 0 (0.0%) |
| Construction & Extraction | 12 (100.0%) | 0 (0.0%) |
| Installation, Maintenance & Repair | 1 (100.0%) | 0 (0.0%) |
| Total (Category) | 13 (100.0%) | 0 (0.0%) |
| Total (Overall) | 100 (65.8%) | 52 (34.2%) |
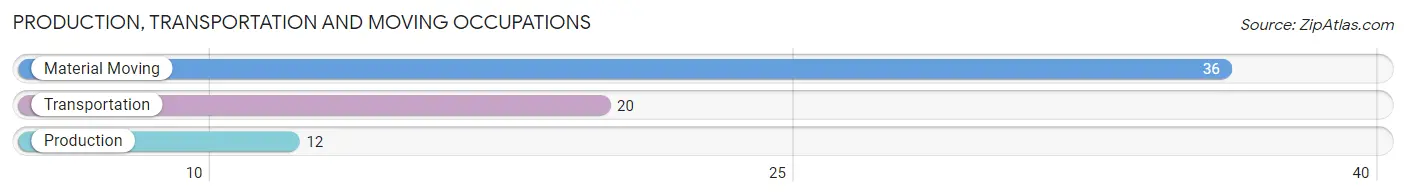
Production, Transportation and Moving Occupations
The most common Production, Transportation and Moving occupations in New Alexandria are Material Moving (36 | 23.7%), Transportation (20 | 13.2%), and Production (12 | 7.9%).
Production, Transportation and Moving Occupations by Sex
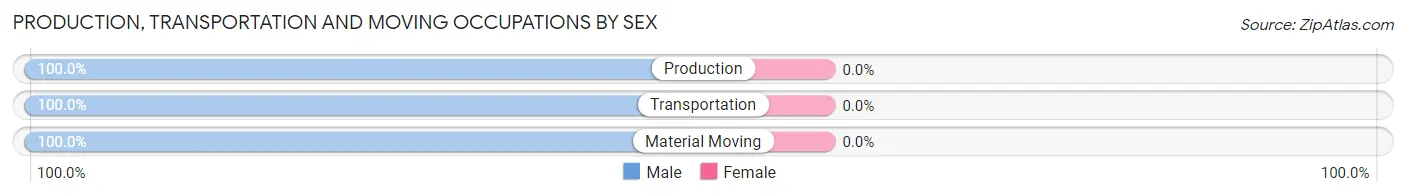
| Occupation | Male | Female |
| Production | 12 (100.0%) | 0 (0.0%) |
| Transportation | 20 (100.0%) | 0 (0.0%) |
| Material Moving | 36 (100.0%) | 0 (0.0%) |
| Total (Category) | 68 (100.0%) | 0 (0.0%) |
| Total (Overall) | 100 (65.8%) | 52 (34.2%) |
Employment Industries by Sex in New Alexandria
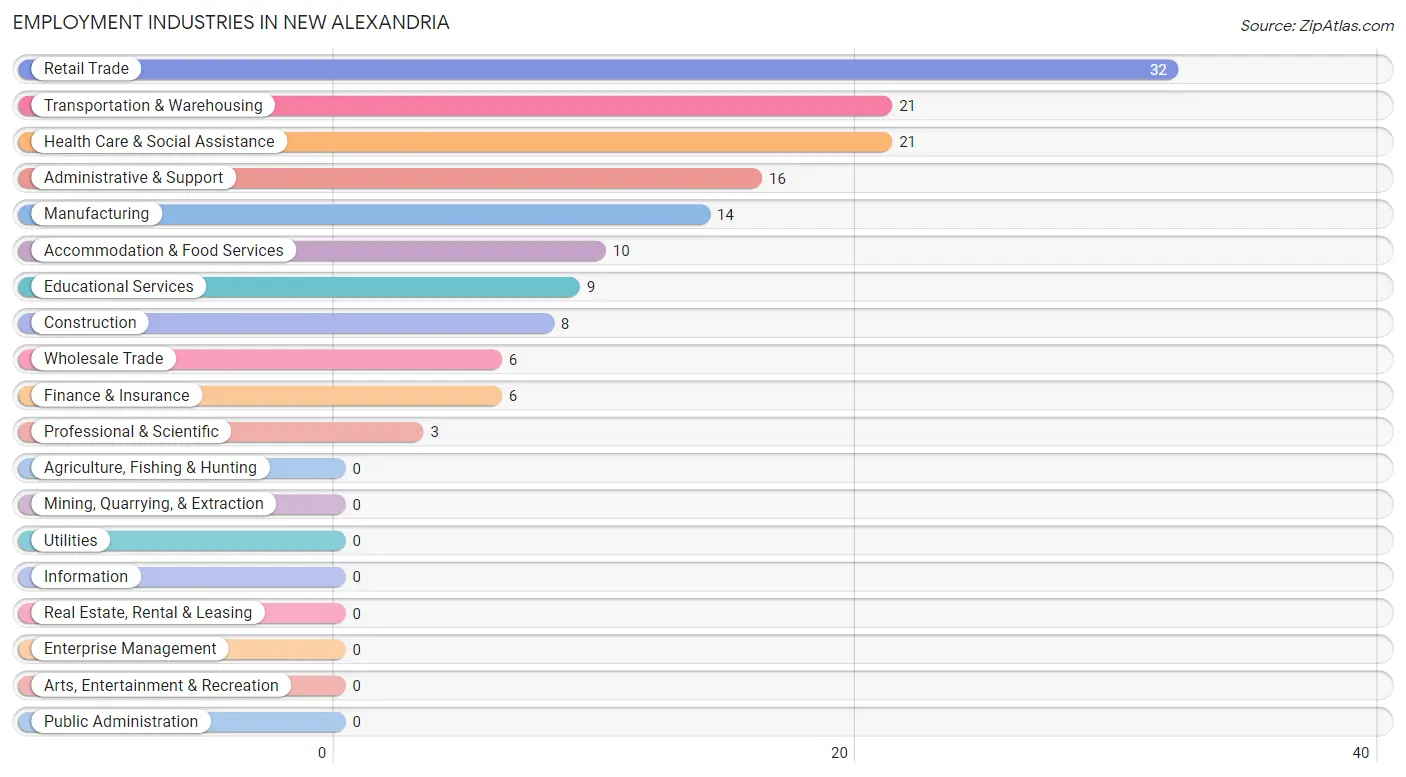
Employment Industries in New Alexandria
The major employment industries in New Alexandria include Retail Trade (32 | 21.0%), Transportation & Warehousing (21 | 13.8%), Health Care & Social Assistance (21 | 13.8%), Administrative & Support (16 | 10.5%), and Manufacturing (14 | 9.2%).
Employment Industries by Sex in New Alexandria
The New Alexandria industries that see more men than women are Wholesale Trade (100.0%), Transportation & Warehousing (100.0%), and Retail Trade (93.8%), whereas the industries that tend to have a higher number of women are Educational Services (100.0%), Health Care & Social Assistance (100.0%), and Finance & Insurance (66.7%).
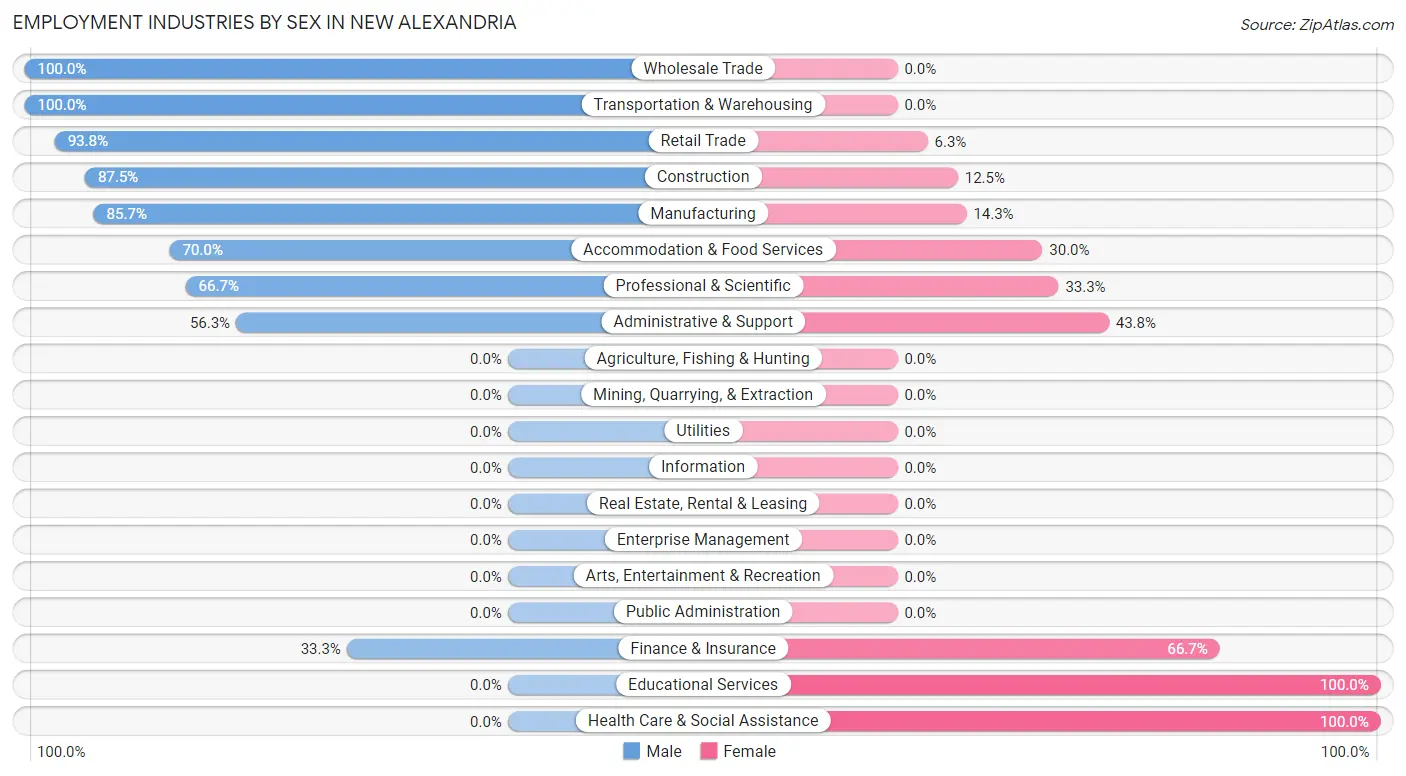
| Industry | Male | Female |
| Agriculture, Fishing & Hunting | 0 (0.0%) | 0 (0.0%) |
| Mining, Quarrying, & Extraction | 0 (0.0%) | 0 (0.0%) |
| Construction | 7 (87.5%) | 1 (12.5%) |
| Manufacturing | 12 (85.7%) | 2 (14.3%) |
| Wholesale Trade | 6 (100.0%) | 0 (0.0%) |
| Retail Trade | 30 (93.8%) | 2 (6.2%) |
| Transportation & Warehousing | 21 (100.0%) | 0 (0.0%) |
| Utilities | 0 (0.0%) | 0 (0.0%) |
| Information | 0 (0.0%) | 0 (0.0%) |
| Finance & Insurance | 2 (33.3%) | 4 (66.7%) |
| Real Estate, Rental & Leasing | 0 (0.0%) | 0 (0.0%) |
| Professional & Scientific | 2 (66.7%) | 1 (33.3%) |
| Enterprise Management | 0 (0.0%) | 0 (0.0%) |
| Administrative & Support | 9 (56.2%) | 7 (43.8%) |
| Educational Services | 0 (0.0%) | 9 (100.0%) |
| Health Care & Social Assistance | 0 (0.0%) | 21 (100.0%) |
| Arts, Entertainment & Recreation | 0 (0.0%) | 0 (0.0%) |
| Accommodation & Food Services | 7 (70.0%) | 3 (30.0%) |
| Public Administration | 0 (0.0%) | 0 (0.0%) |
| Total | 100 (65.8%) | 52 (34.2%) |
Education in New Alexandria
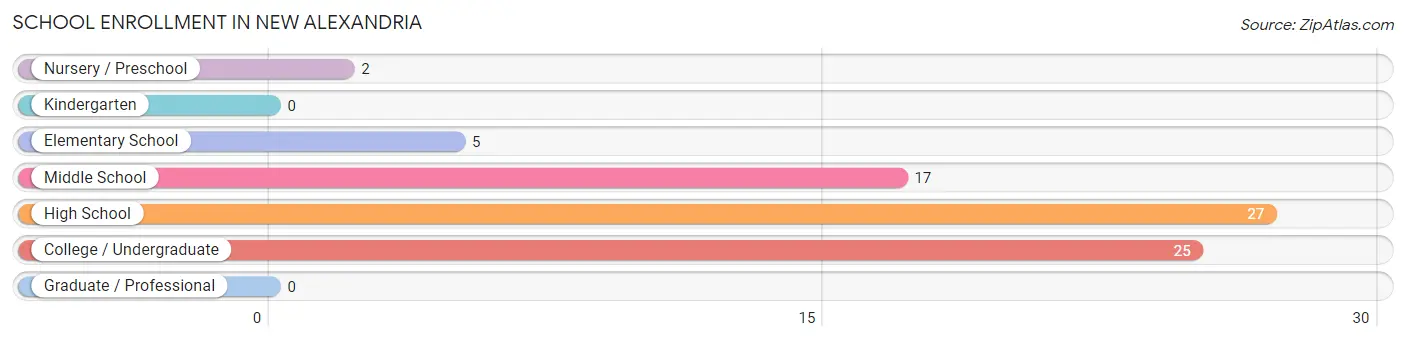
School Enrollment in New Alexandria
The most common levels of schooling among the 76 students in New Alexandria are high school (27 | 35.5%), college / undergraduate (25 | 32.9%), and middle school (17 | 22.4%).
| School Level | # Students | % Students |
| Nursery / Preschool | 2 | 2.6% |
| Kindergarten | 0 | 0.0% |
| Elementary School | 5 | 6.6% |
| Middle School | 17 | 22.4% |
| High School | 27 | 35.5% |
| College / Undergraduate | 25 | 32.9% |
| Graduate / Professional | 0 | 0.0% |
| Total | 76 | 100.0% |
School Enrollment by Age by Funding Source in New Alexandria
Out of a total of 76 students who are enrolled in schools in New Alexandria, 5 (6.6%) attend a private institution, while the remaining 71 (93.4%) are enrolled in public schools. The age group of 3 to 4 year olds has the highest likelihood of being enrolled in private schools, with 2 (100.0% in the age bracket) enrolled. Conversely, the age group of 5 to 9 year old has the lowest likelihood of being enrolled in a private school, with 5 (100.0% in the age bracket) attending a public institution.
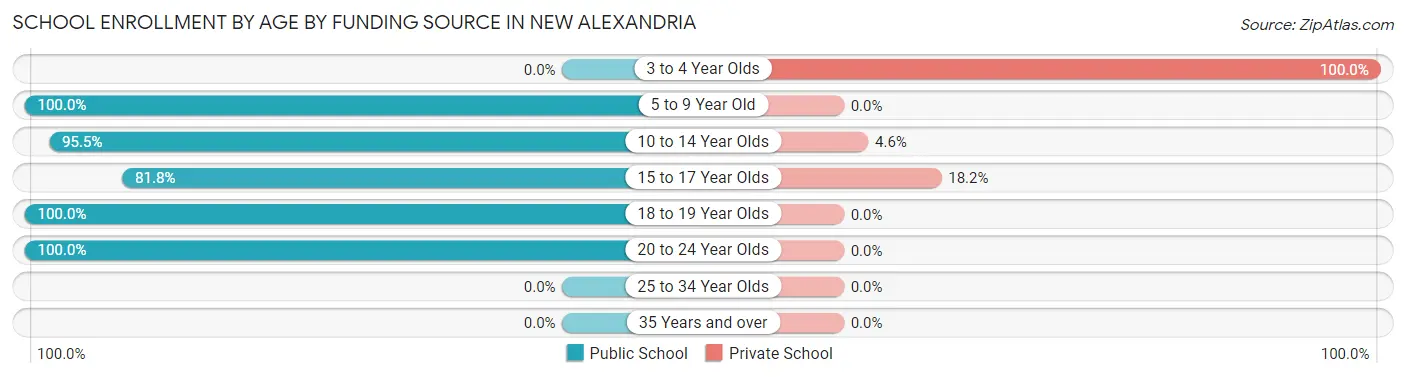
| Age Bracket | Public School | Private School |
| 3 to 4 Year Olds | 0 (0.0%) | 2 (100.0%) |
| 5 to 9 Year Old | 5 (100.0%) | 0 (0.0%) |
| 10 to 14 Year Olds | 21 (95.5%) | 1 (4.5%) |
| 15 to 17 Year Olds | 9 (81.8%) | 2 (18.2%) |
| 18 to 19 Year Olds | 21 (100.0%) | 0 (0.0%) |
| 20 to 24 Year Olds | 15 (100.0%) | 0 (0.0%) |
| 25 to 34 Year Olds | 0 (0.0%) | 0 (0.0%) |
| 35 Years and over | 0 (0.0%) | 0 (0.0%) |
| Total | 71 (93.4%) | 5 (6.6%) |
Educational Attainment by Field of Study in New Alexandria
Bio, nature & agricultural (1 | 16.7%), engineering (1 | 16.7%), science & technology (1 | 16.7%), education (1 | 16.7%), and visual & performing arts (1 | 16.7%) are the most common fields of study among 6 individuals in New Alexandria who have obtained a bachelor's degree or higher.
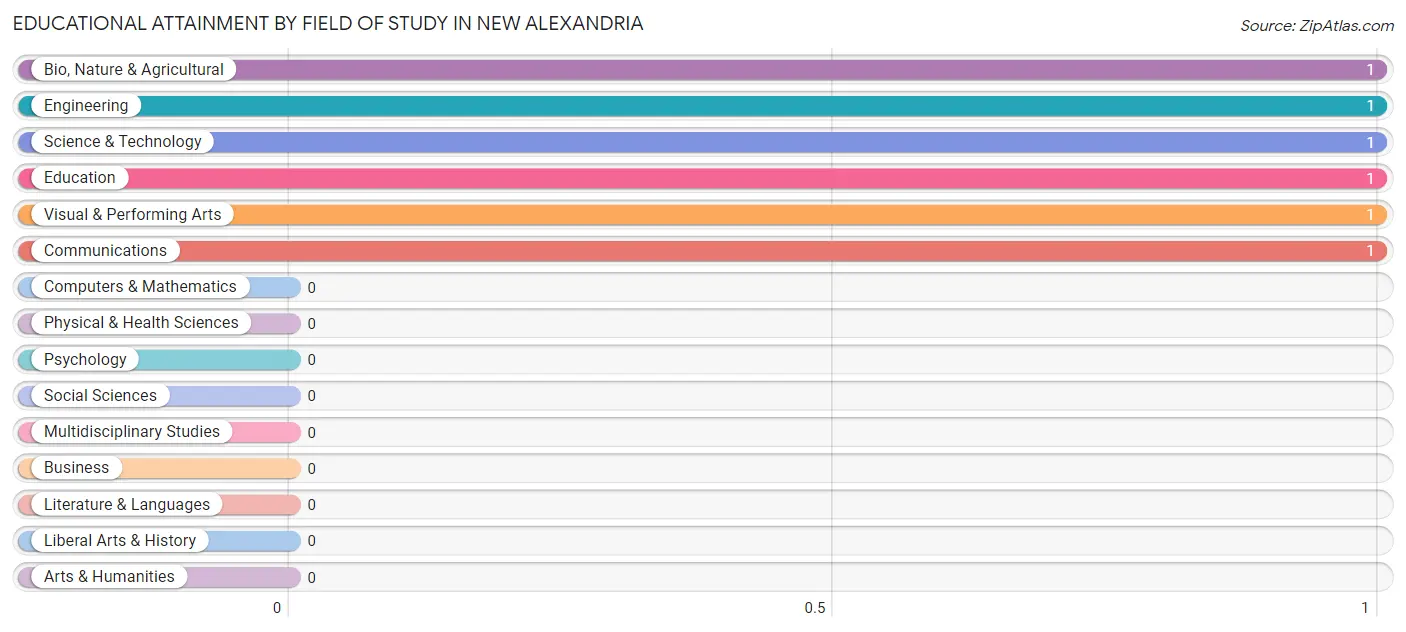
| Field of Study | # Graduates | % Graduates |
| Computers & Mathematics | 0 | 0.0% |
| Bio, Nature & Agricultural | 1 | 16.7% |
| Physical & Health Sciences | 0 | 0.0% |
| Psychology | 0 | 0.0% |
| Social Sciences | 0 | 0.0% |
| Engineering | 1 | 16.7% |
| Multidisciplinary Studies | 0 | 0.0% |
| Science & Technology | 1 | 16.7% |
| Business | 0 | 0.0% |
| Education | 1 | 16.7% |
| Literature & Languages | 0 | 0.0% |
| Liberal Arts & History | 0 | 0.0% |
| Visual & Performing Arts | 1 | 16.7% |
| Communications | 1 | 16.7% |
| Arts & Humanities | 0 | 0.0% |
| Total | 6 | 100.0% |
Transportation & Commute in New Alexandria
Vehicle Availability by Sex in New Alexandria
The most prevalent vehicle ownership categories in New Alexandria are males with 4 vehicles (44, accounting for 44.0%) and females with 4 vehicles (16, making up 84.6%).
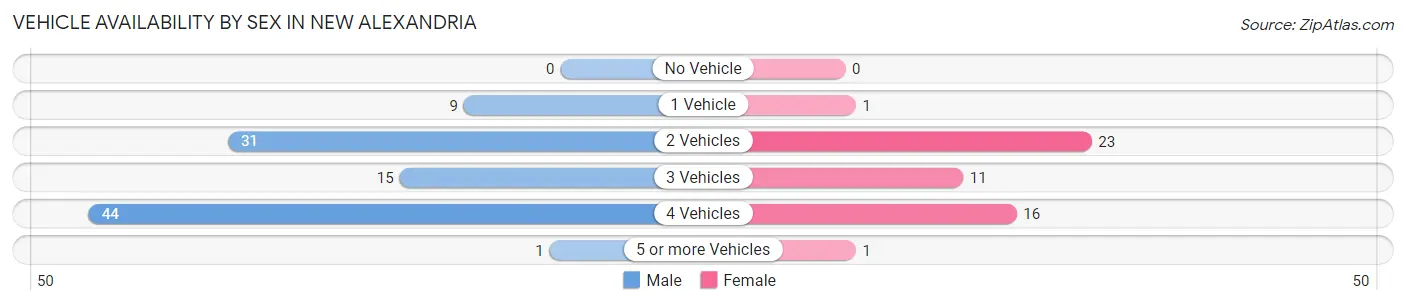
| Vehicles Available | Male | Female |
| No Vehicle | 0 (0.0%) | 0 (0.0%) |
| 1 Vehicle | 9 (9.0%) | 1 (1.9%) |
| 2 Vehicles | 31 (31.0%) | 23 (44.2%) |
| 3 Vehicles | 15 (15.0%) | 11 (21.1%) |
| 4 Vehicles | 44 (44.0%) | 16 (30.8%) |
| 5 or more Vehicles | 1 (1.0%) | 1 (1.9%) |
| Total | 100 (100.0%) | 52 (100.0%) |
Commute Time in New Alexandria
The most frequently occuring commute durations in New Alexandria are 15 to 19 minutes (39 commuters, 27.7%), 20 to 24 minutes (28 commuters, 19.9%), and 25 to 29 minutes (26 commuters, 18.4%).
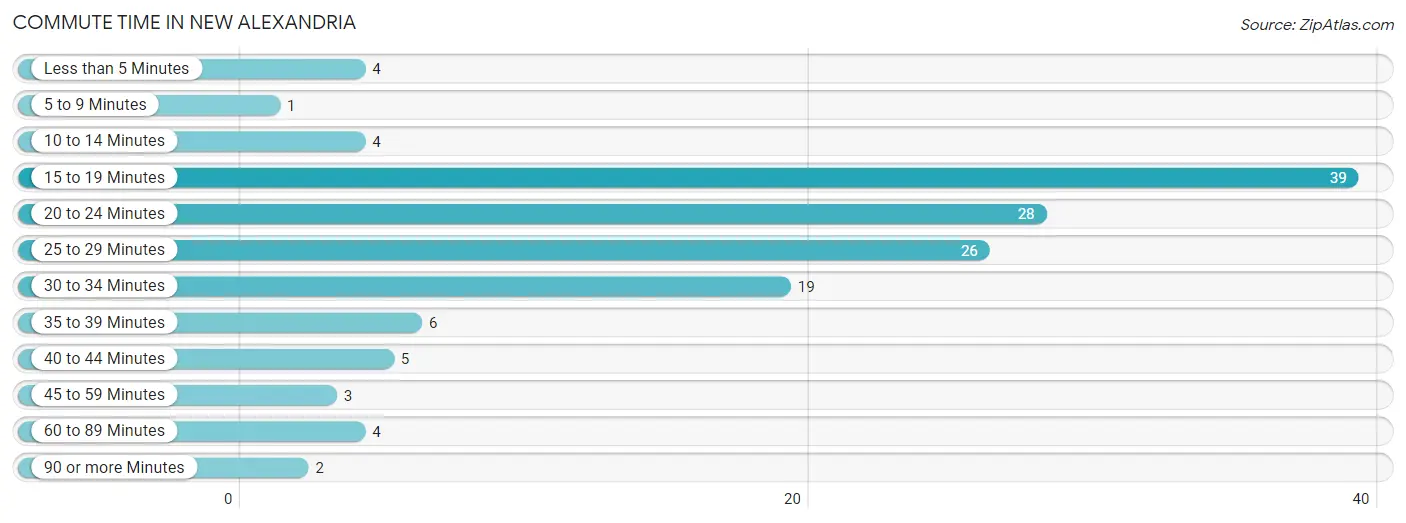
| Commute Time | # Commuters | % Commuters |
| Less than 5 Minutes | 4 | 2.8% |
| 5 to 9 Minutes | 1 | 0.7% |
| 10 to 14 Minutes | 4 | 2.8% |
| 15 to 19 Minutes | 39 | 27.7% |
| 20 to 24 Minutes | 28 | 19.9% |
| 25 to 29 Minutes | 26 | 18.4% |
| 30 to 34 Minutes | 19 | 13.5% |
| 35 to 39 Minutes | 6 | 4.3% |
| 40 to 44 Minutes | 5 | 3.5% |
| 45 to 59 Minutes | 3 | 2.1% |
| 60 to 89 Minutes | 4 | 2.8% |
| 90 or more Minutes | 2 | 1.4% |
Commute Time by Sex in New Alexandria
The most common commute times in New Alexandria are 15 to 19 minutes (35 commuters, 36.1%) for males and 20 to 24 minutes (13 commuters, 29.5%) for females.
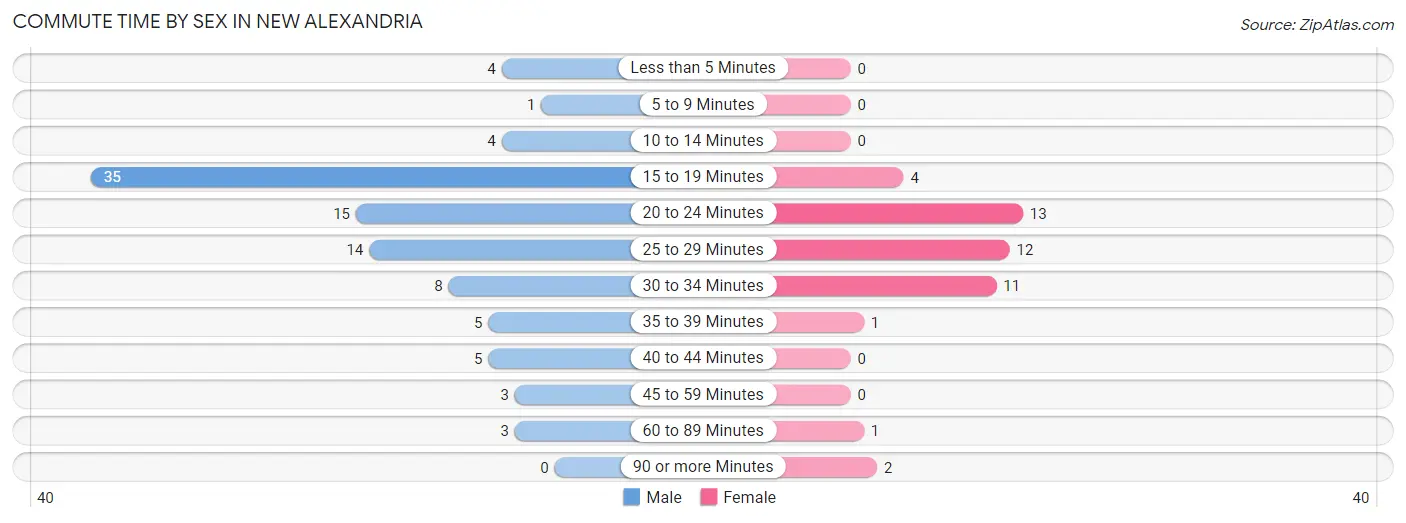
| Commute Time | Male | Female |
| Less than 5 Minutes | 4 (4.1%) | 0 (0.0%) |
| 5 to 9 Minutes | 1 (1.0%) | 0 (0.0%) |
| 10 to 14 Minutes | 4 (4.1%) | 0 (0.0%) |
| 15 to 19 Minutes | 35 (36.1%) | 4 (9.1%) |
| 20 to 24 Minutes | 15 (15.5%) | 13 (29.5%) |
| 25 to 29 Minutes | 14 (14.4%) | 12 (27.3%) |
| 30 to 34 Minutes | 8 (8.3%) | 11 (25.0%) |
| 35 to 39 Minutes | 5 (5.1%) | 1 (2.3%) |
| 40 to 44 Minutes | 5 (5.1%) | 0 (0.0%) |
| 45 to 59 Minutes | 3 (3.1%) | 0 (0.0%) |
| 60 to 89 Minutes | 3 (3.1%) | 1 (2.3%) |
| 90 or more Minutes | 0 (0.0%) | 2 (4.5%) |
Time of Departure to Work by Sex in New Alexandria
The most frequent times of departure to work in New Alexandria are 12:00 PM to 3:59 PM (29, 29.9%) for males and 8:30 AM to 8:59 AM (11, 25.0%) for females.
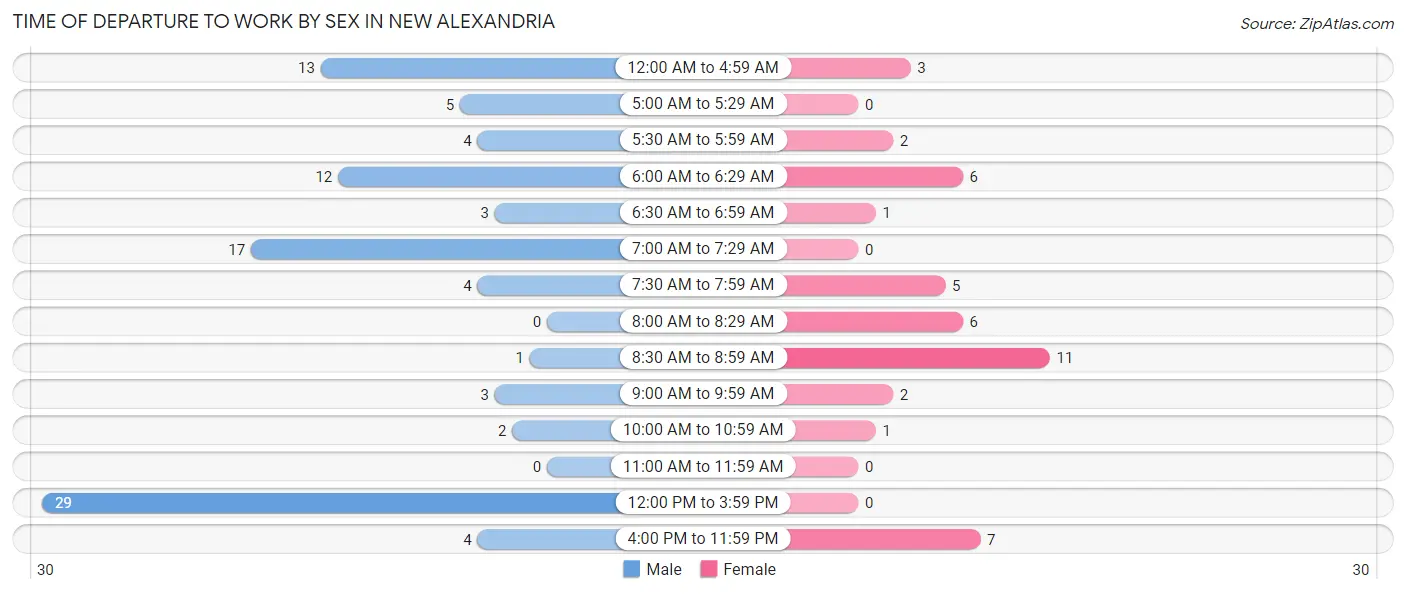
| Time of Departure | Male | Female |
| 12:00 AM to 4:59 AM | 13 (13.4%) | 3 (6.8%) |
| 5:00 AM to 5:29 AM | 5 (5.1%) | 0 (0.0%) |
| 5:30 AM to 5:59 AM | 4 (4.1%) | 2 (4.5%) |
| 6:00 AM to 6:29 AM | 12 (12.4%) | 6 (13.6%) |
| 6:30 AM to 6:59 AM | 3 (3.1%) | 1 (2.3%) |
| 7:00 AM to 7:29 AM | 17 (17.5%) | 0 (0.0%) |
| 7:30 AM to 7:59 AM | 4 (4.1%) | 5 (11.4%) |
| 8:00 AM to 8:29 AM | 0 (0.0%) | 6 (13.6%) |
| 8:30 AM to 8:59 AM | 1 (1.0%) | 11 (25.0%) |
| 9:00 AM to 9:59 AM | 3 (3.1%) | 2 (4.5%) |
| 10:00 AM to 10:59 AM | 2 (2.1%) | 1 (2.3%) |
| 11:00 AM to 11:59 AM | 0 (0.0%) | 0 (0.0%) |
| 12:00 PM to 3:59 PM | 29 (29.9%) | 0 (0.0%) |
| 4:00 PM to 11:59 PM | 4 (4.1%) | 7 (15.9%) |
| Total | 97 (100.0%) | 44 (100.0%) |
Housing Occupancy in New Alexandria
Occupancy by Ownership in New Alexandria
Of the total 111 dwellings in New Alexandria, owner-occupied units account for 103 (92.8%), while renter-occupied units make up 8 (7.2%).
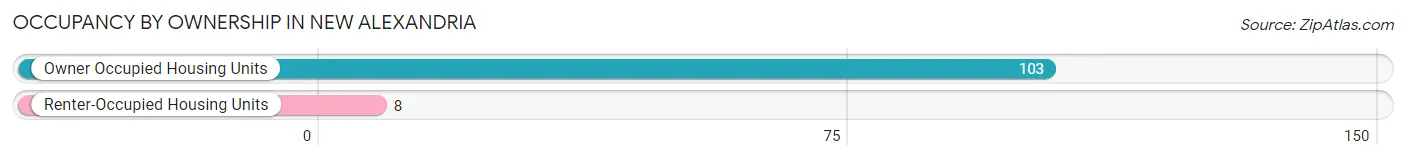
| Occupancy | # Housing Units | % Housing Units |
| Owner Occupied Housing Units | 103 | 92.8% |
| Renter-Occupied Housing Units | 8 | 7.2% |
| Total Occupied Housing Units | 111 | 100.0% |
Occupancy by Household Size in New Alexandria
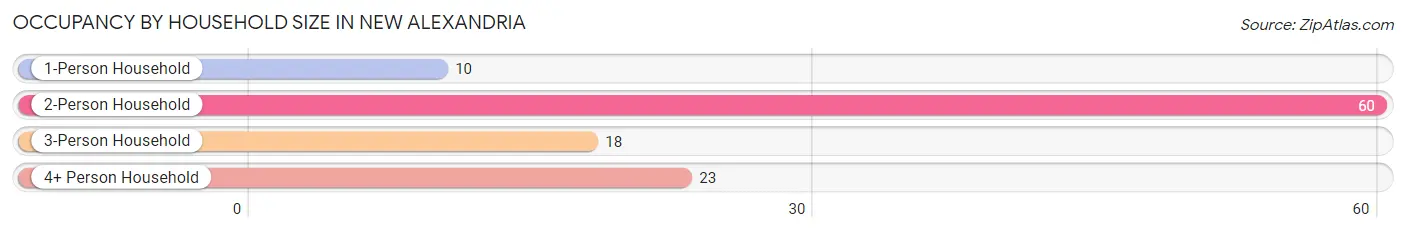
| Household Size | # Housing Units | % Housing Units |
| 1-Person Household | 10 | 9.0% |
| 2-Person Household | 60 | 54.0% |
| 3-Person Household | 18 | 16.2% |
| 4+ Person Household | 23 | 20.7% |
| Total Housing Units | 111 | 100.0% |
Occupancy by Ownership by Household Size in New Alexandria
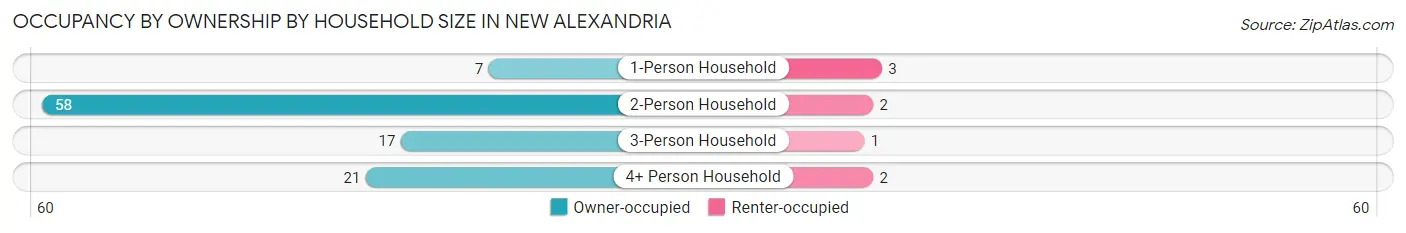
| Household Size | Owner-occupied | Renter-occupied |
| 1-Person Household | 7 (70.0%) | 3 (30.0%) |
| 2-Person Household | 58 (96.7%) | 2 (3.3%) |
| 3-Person Household | 17 (94.4%) | 1 (5.6%) |
| 4+ Person Household | 21 (91.3%) | 2 (8.7%) |
| Total Housing Units | 103 (92.8%) | 8 (7.2%) |
Occupancy by Educational Attainment in New Alexandria
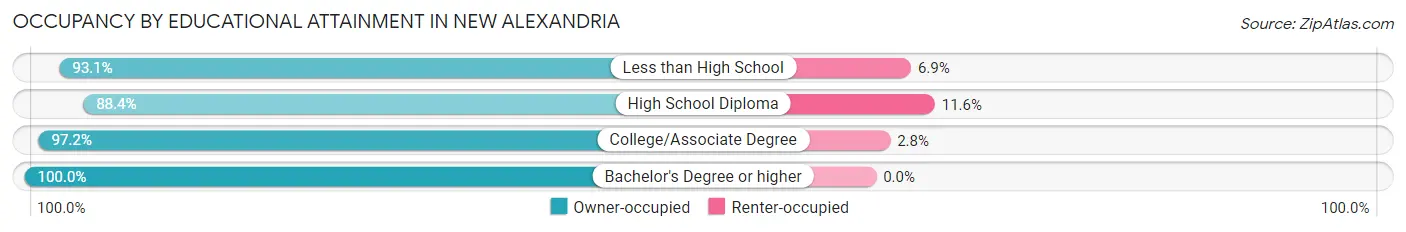
| Household Size | Owner-occupied | Renter-occupied |
| Less than High School | 27 (93.1%) | 2 (6.9%) |
| High School Diploma | 38 (88.4%) | 5 (11.6%) |
| College/Associate Degree | 35 (97.2%) | 1 (2.8%) |
| Bachelor's Degree or higher | 3 (100.0%) | 0 (0.0%) |
Occupancy by Age of Householder in New Alexandria
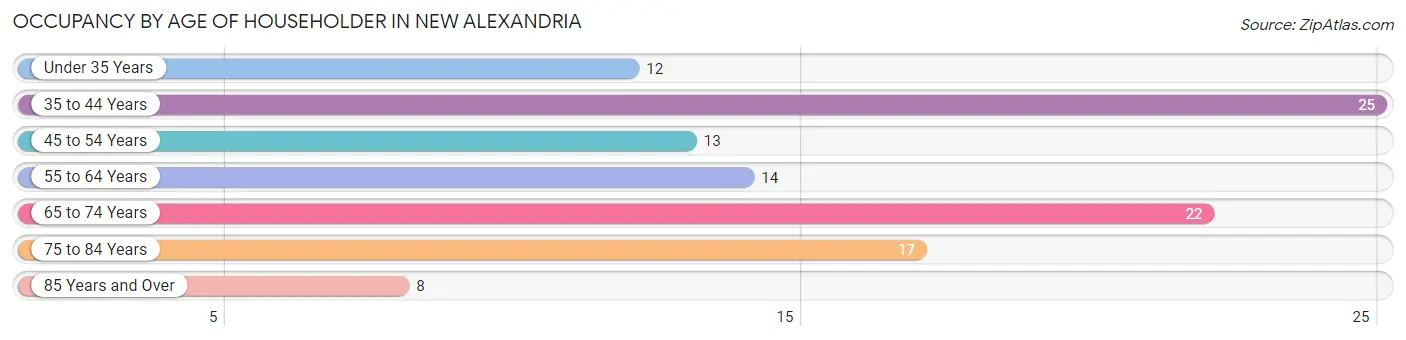
| Age Bracket | # Households | % Households |
| Under 35 Years | 12 | 10.8% |
| 35 to 44 Years | 25 | 22.5% |
| 45 to 54 Years | 13 | 11.7% |
| 55 to 64 Years | 14 | 12.6% |
| 65 to 74 Years | 22 | 19.8% |
| 75 to 84 Years | 17 | 15.3% |
| 85 Years and Over | 8 | 7.2% |
| Total | 111 | 100.0% |
Housing Finances in New Alexandria
Median Income by Occupancy in New Alexandria
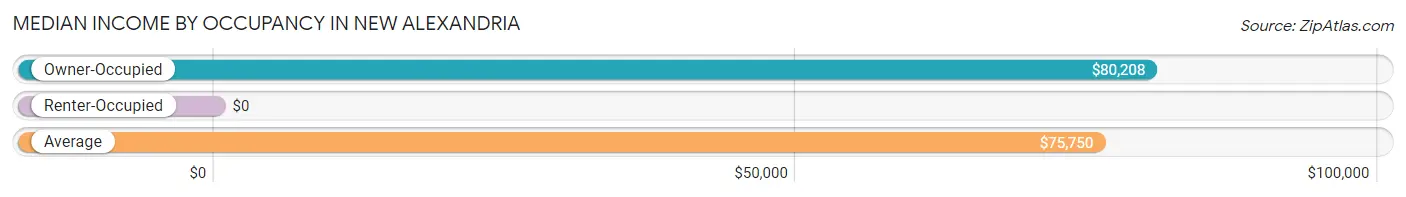
| Occupancy Type | # Households | Median Income |
| Owner-Occupied | 103 (92.8%) | $80,208 |
| Renter-Occupied | 8 (7.2%) | $0 |
| Average | 111 (100.0%) | $75,750 |
Occupancy by Householder Income Bracket in New Alexandria
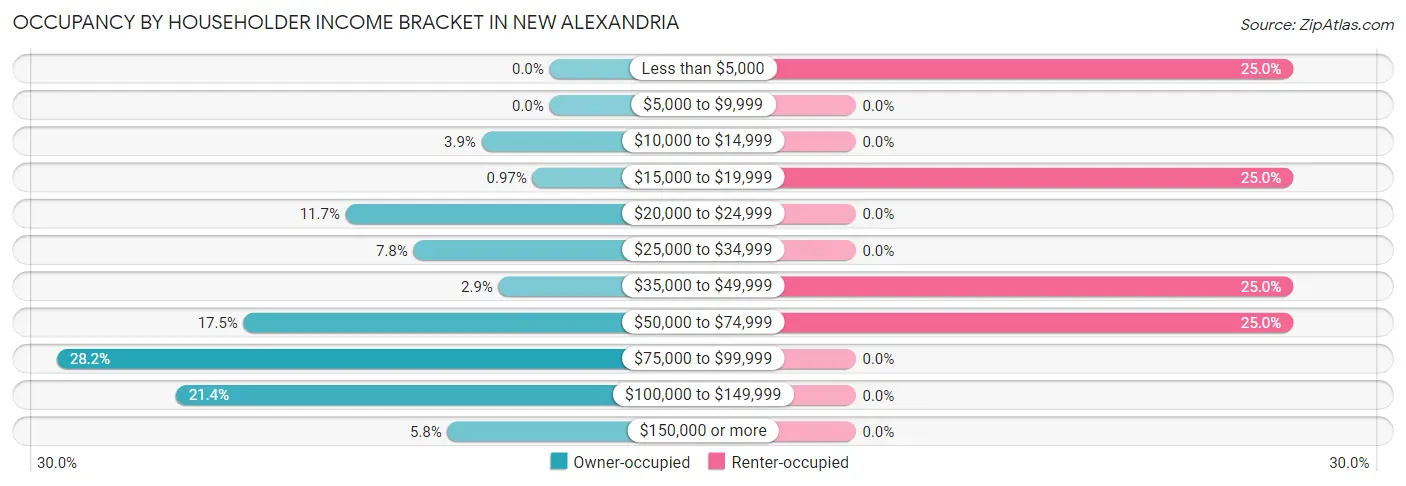
| Income Bracket | Owner-occupied | Renter-occupied |
| Less than $5,000 | 0 (0.0%) | 2 (25.0%) |
| $5,000 to $9,999 | 0 (0.0%) | 0 (0.0%) |
| $10,000 to $14,999 | 4 (3.9%) | 0 (0.0%) |
| $15,000 to $19,999 | 1 (1.0%) | 2 (25.0%) |
| $20,000 to $24,999 | 12 (11.7%) | 0 (0.0%) |
| $25,000 to $34,999 | 8 (7.8%) | 0 (0.0%) |
| $35,000 to $49,999 | 3 (2.9%) | 2 (25.0%) |
| $50,000 to $74,999 | 18 (17.5%) | 2 (25.0%) |
| $75,000 to $99,999 | 29 (28.2%) | 0 (0.0%) |
| $100,000 to $149,999 | 22 (21.4%) | 0 (0.0%) |
| $150,000 or more | 6 (5.8%) | 0 (0.0%) |
| Total | 103 (100.0%) | 8 (100.0%) |
Monthly Housing Cost Tiers in New Alexandria
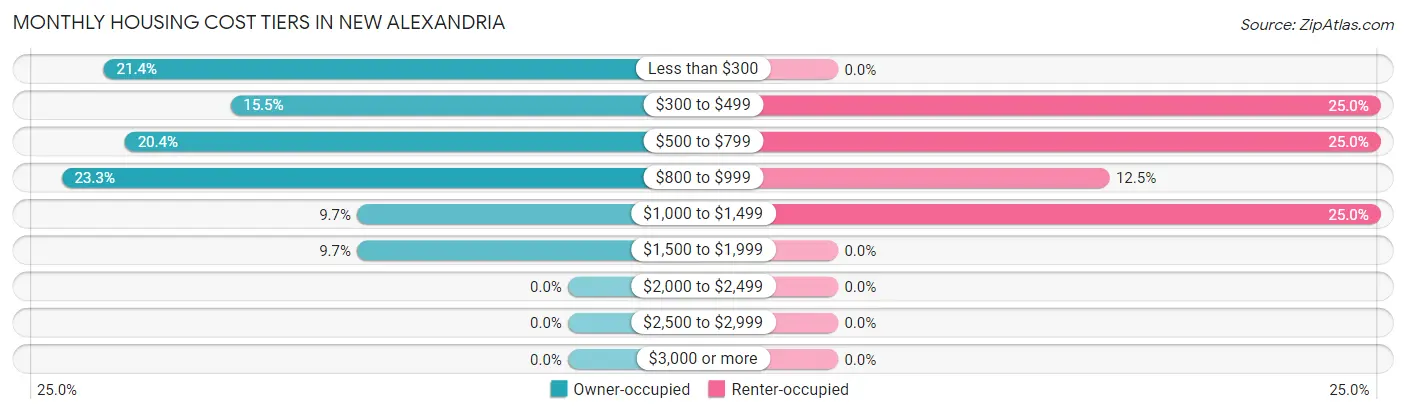
| Monthly Cost | Owner-occupied | Renter-occupied |
| Less than $300 | 22 (21.4%) | 0 (0.0%) |
| $300 to $499 | 16 (15.5%) | 2 (25.0%) |
| $500 to $799 | 21 (20.4%) | 2 (25.0%) |
| $800 to $999 | 24 (23.3%) | 1 (12.5%) |
| $1,000 to $1,499 | 10 (9.7%) | 2 (25.0%) |
| $1,500 to $1,999 | 10 (9.7%) | 0 (0.0%) |
| $2,000 to $2,499 | 0 (0.0%) | 0 (0.0%) |
| $2,500 to $2,999 | 0 (0.0%) | 0 (0.0%) |
| $3,000 or more | 0 (0.0%) | 0 (0.0%) |
| Total | 103 (100.0%) | 8 (100.0%) |
Physical Housing Characteristics in New Alexandria
Housing Structures in New Alexandria
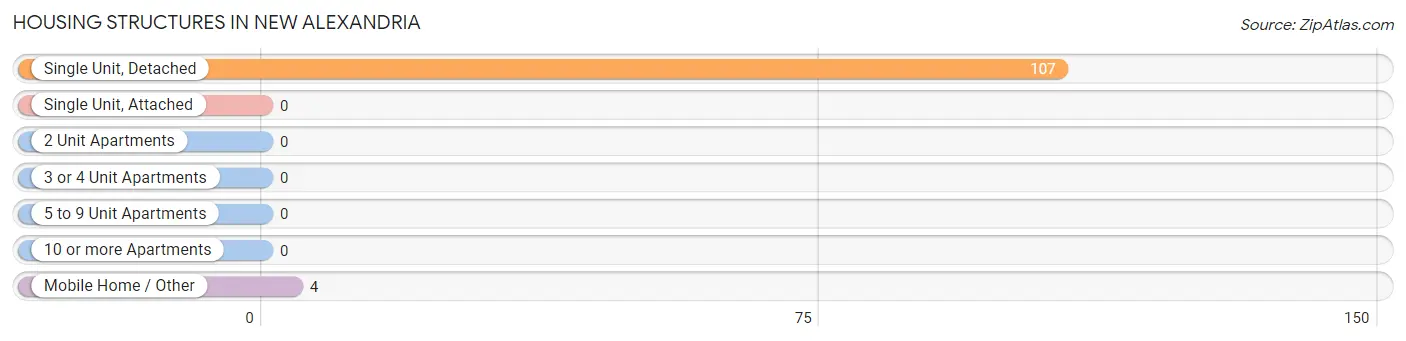
| Structure Type | # Housing Units | % Housing Units |
| Single Unit, Detached | 107 | 96.4% |
| Single Unit, Attached | 0 | 0.0% |
| 2 Unit Apartments | 0 | 0.0% |
| 3 or 4 Unit Apartments | 0 | 0.0% |
| 5 to 9 Unit Apartments | 0 | 0.0% |
| 10 or more Apartments | 0 | 0.0% |
| Mobile Home / Other | 4 | 3.6% |
| Total | 111 | 100.0% |
Housing Structures by Occupancy in New Alexandria
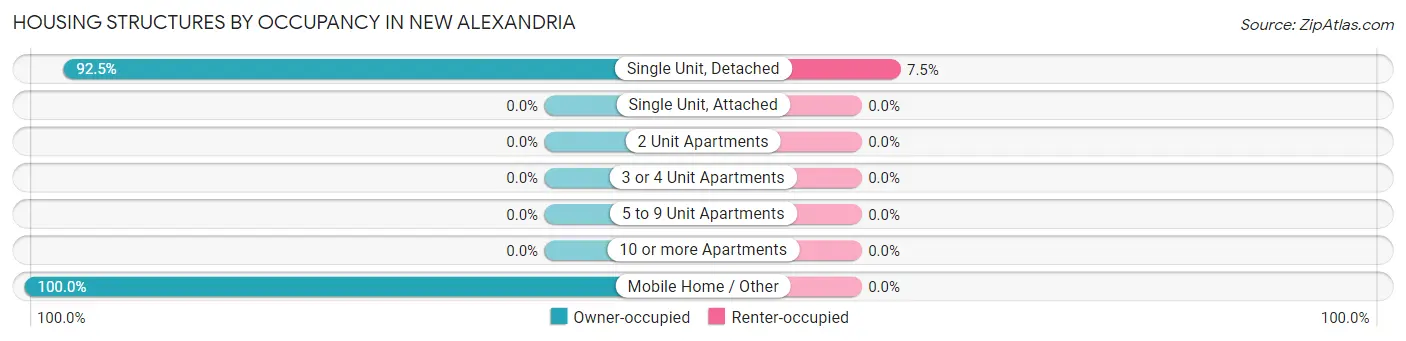
| Structure Type | Owner-occupied | Renter-occupied |
| Single Unit, Detached | 99 (92.5%) | 8 (7.5%) |
| Single Unit, Attached | 0 (0.0%) | 0 (0.0%) |
| 2 Unit Apartments | 0 (0.0%) | 0 (0.0%) |
| 3 or 4 Unit Apartments | 0 (0.0%) | 0 (0.0%) |
| 5 to 9 Unit Apartments | 0 (0.0%) | 0 (0.0%) |
| 10 or more Apartments | 0 (0.0%) | 0 (0.0%) |
| Mobile Home / Other | 4 (100.0%) | 0 (0.0%) |
| Total | 103 (92.8%) | 8 (7.2%) |
Housing Structures by Number of Rooms in New Alexandria
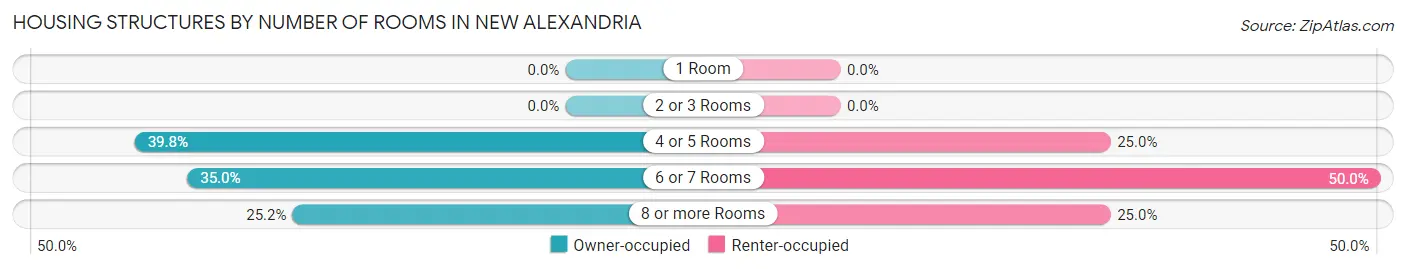
| Number of Rooms | Owner-occupied | Renter-occupied |
| 1 Room | 0 (0.0%) | 0 (0.0%) |
| 2 or 3 Rooms | 0 (0.0%) | 0 (0.0%) |
| 4 or 5 Rooms | 41 (39.8%) | 2 (25.0%) |
| 6 or 7 Rooms | 36 (34.9%) | 4 (50.0%) |
| 8 or more Rooms | 26 (25.2%) | 2 (25.0%) |
| Total | 103 (100.0%) | 8 (100.0%) |
Housing Structure by Heating Type in New Alexandria
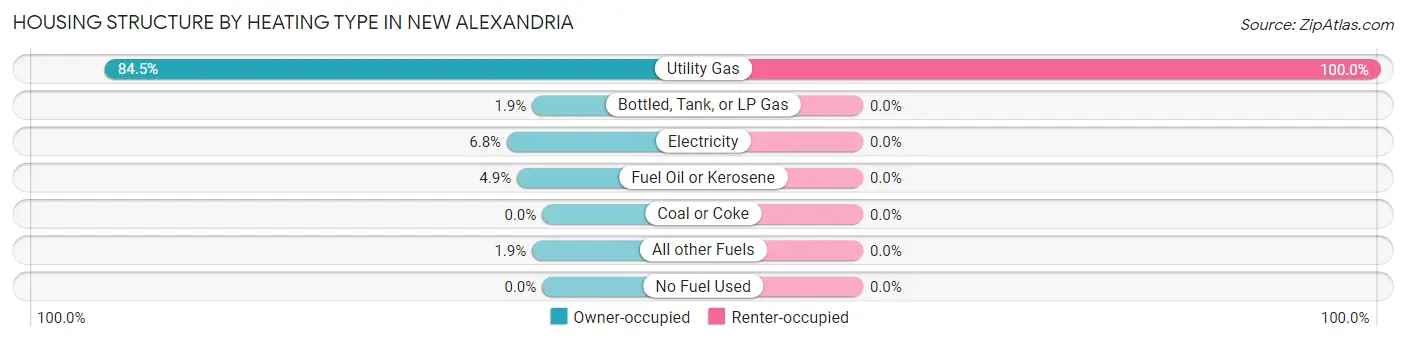
| Heating Type | Owner-occupied | Renter-occupied |
| Utility Gas | 87 (84.5%) | 8 (100.0%) |
| Bottled, Tank, or LP Gas | 2 (1.9%) | 0 (0.0%) |
| Electricity | 7 (6.8%) | 0 (0.0%) |
| Fuel Oil or Kerosene | 5 (4.9%) | 0 (0.0%) |
| Coal or Coke | 0 (0.0%) | 0 (0.0%) |
| All other Fuels | 2 (1.9%) | 0 (0.0%) |
| No Fuel Used | 0 (0.0%) | 0 (0.0%) |
| Total | 103 (100.0%) | 8 (100.0%) |
Household Vehicle Usage in New Alexandria
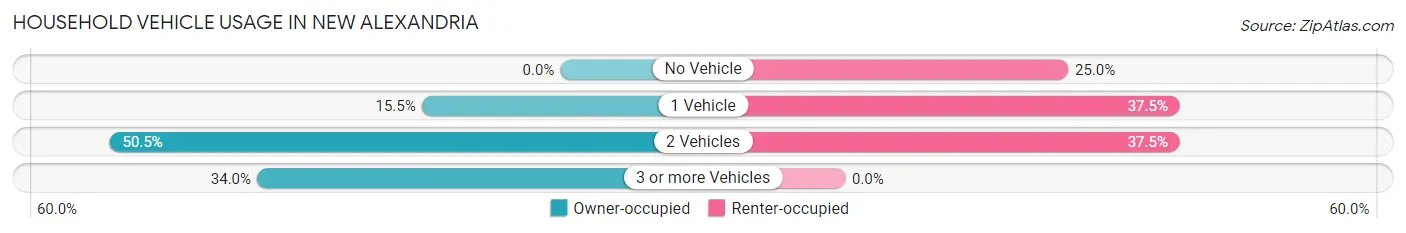
| Vehicles per Household | Owner-occupied | Renter-occupied |
| No Vehicle | 0 (0.0%) | 2 (25.0%) |
| 1 Vehicle | 16 (15.5%) | 3 (37.5%) |
| 2 Vehicles | 52 (50.5%) | 3 (37.5%) |
| 3 or more Vehicles | 35 (34.0%) | 0 (0.0%) |
| Total | 103 (100.0%) | 8 (100.0%) |
Real Estate & Mortgages in New Alexandria
Real Estate and Mortgage Overview in New Alexandria
| Characteristic | Without Mortgage | With Mortgage |
| Housing Units | 49 | 54 |
| Median Property Value | $75,800 | $86,700 |
| Median Household Income | $53,438 | $4 |
| Monthly Housing Costs | $342 | $0 |
| Real Estate Taxes | $456 | $0 |
Property Value by Mortgage Status in New Alexandria
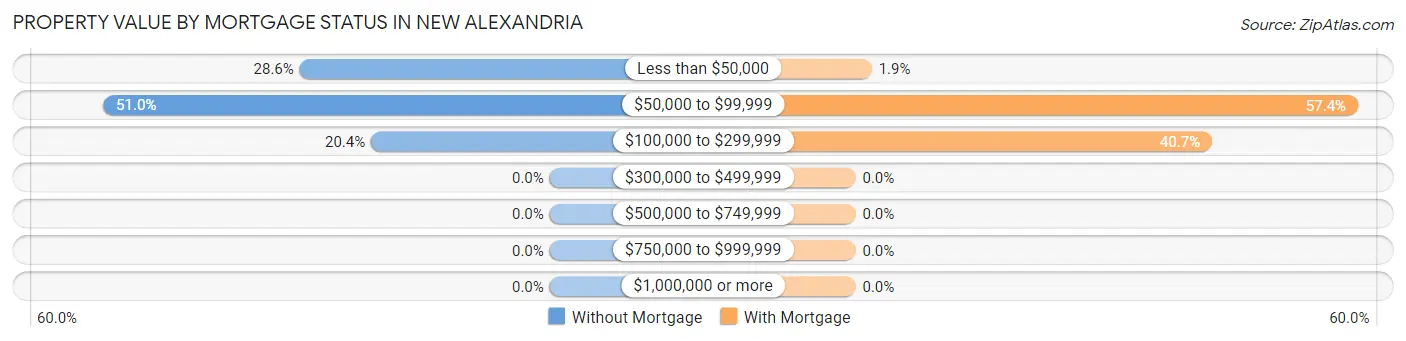
| Property Value | Without Mortgage | With Mortgage |
| Less than $50,000 | 14 (28.6%) | 1 (1.8%) |
| $50,000 to $99,999 | 25 (51.0%) | 31 (57.4%) |
| $100,000 to $299,999 | 10 (20.4%) | 22 (40.7%) |
| $300,000 to $499,999 | 0 (0.0%) | 0 (0.0%) |
| $500,000 to $749,999 | 0 (0.0%) | 0 (0.0%) |
| $750,000 to $999,999 | 0 (0.0%) | 0 (0.0%) |
| $1,000,000 or more | 0 (0.0%) | 0 (0.0%) |
| Total | 49 (100.0%) | 54 (100.0%) |
Household Income by Mortgage Status in New Alexandria
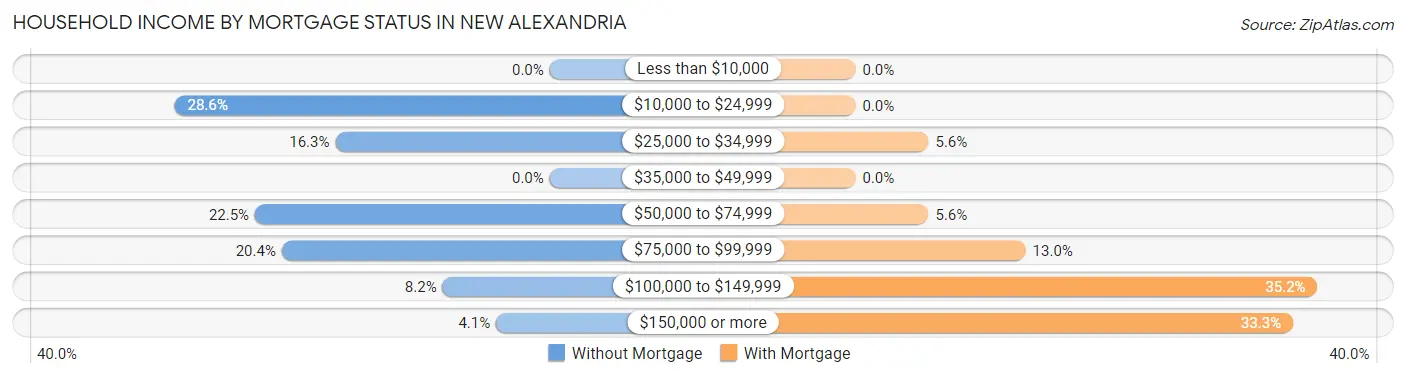
| Household Income | Without Mortgage | With Mortgage |
| Less than $10,000 | 0 (0.0%) | 0 (0.0%) |
| $10,000 to $24,999 | 14 (28.6%) | 0 (0.0%) |
| $25,000 to $34,999 | 8 (16.3%) | 3 (5.6%) |
| $35,000 to $49,999 | 0 (0.0%) | 0 (0.0%) |
| $50,000 to $74,999 | 11 (22.5%) | 3 (5.6%) |
| $75,000 to $99,999 | 10 (20.4%) | 7 (13.0%) |
| $100,000 to $149,999 | 4 (8.2%) | 19 (35.2%) |
| $150,000 or more | 2 (4.1%) | 18 (33.3%) |
| Total | 49 (100.0%) | 54 (100.0%) |
Property Value to Household Income Ratio in New Alexandria
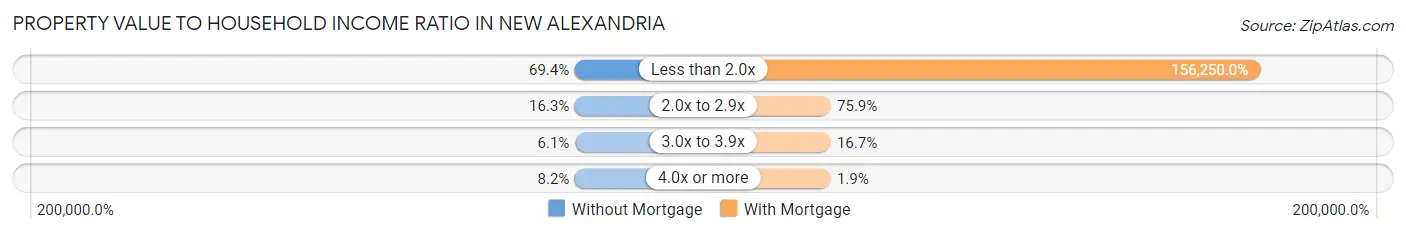
| Value-to-Income Ratio | Without Mortgage | With Mortgage |
| Less than 2.0x | 34 (69.4%) | 84,375 (156,250.0%) |
| 2.0x to 2.9x | 8 (16.3%) | 41 (75.9%) |
| 3.0x to 3.9x | 3 (6.1%) | 9 (16.7%) |
| 4.0x or more | 4 (8.2%) | 1 (1.8%) |
| Total | 49 (100.0%) | 54 (100.0%) |
Real Estate Taxes by Mortgage Status in New Alexandria
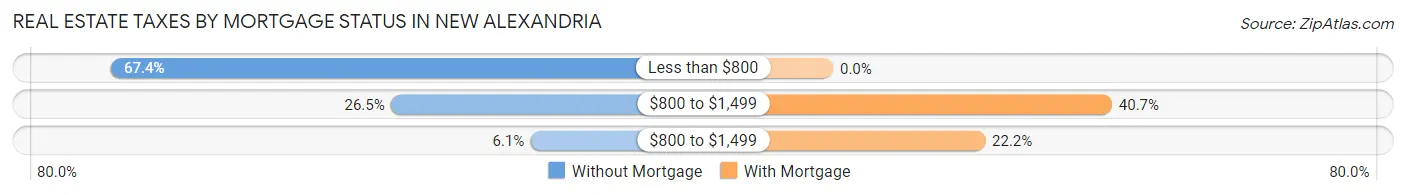
| Property Taxes | Without Mortgage | With Mortgage |
| Less than $800 | 33 (67.3%) | 0 (0.0%) |
| $800 to $1,499 | 13 (26.5%) | 22 (40.7%) |
| $800 to $1,499 | 3 (6.1%) | 12 (22.2%) |
| Total | 49 (100.0%) | 54 (100.0%) |
Health & Disability in New Alexandria
Health Insurance Coverage by Age in New Alexandria
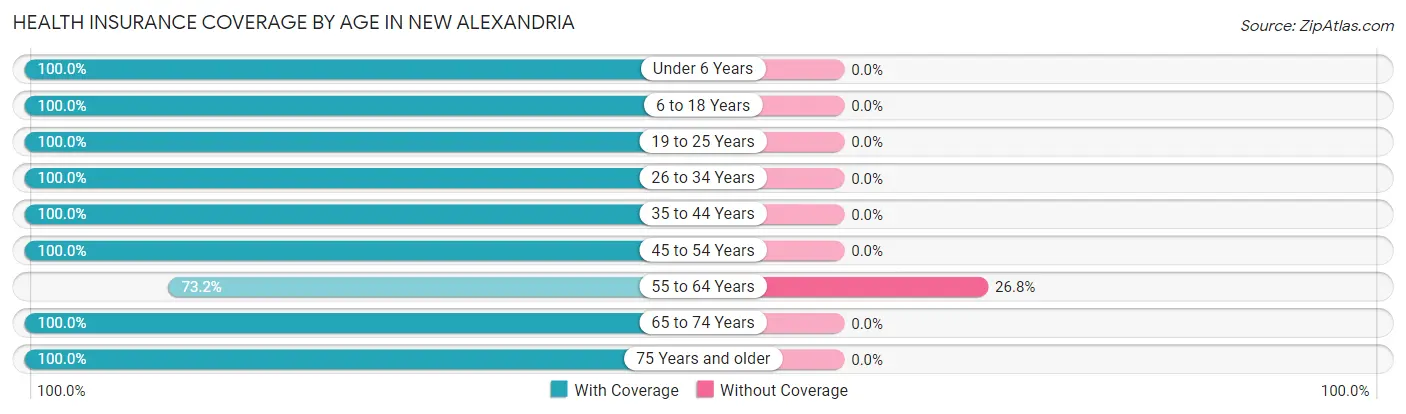
| Age Bracket | With Coverage | Without Coverage |
| Under 6 Years | 19 (100.0%) | 0 (0.0%) |
| 6 to 18 Years | 50 (100.0%) | 0 (0.0%) |
| 19 to 25 Years | 42 (100.0%) | 0 (0.0%) |
| 26 to 34 Years | 19 (100.0%) | 0 (0.0%) |
| 35 to 44 Years | 44 (100.0%) | 0 (0.0%) |
| 45 to 54 Years | 30 (100.0%) | 0 (0.0%) |
| 55 to 64 Years | 30 (73.2%) | 11 (26.8%) |
| 65 to 74 Years | 47 (100.0%) | 0 (0.0%) |
| 75 Years and older | 35 (100.0%) | 0 (0.0%) |
| Total | 316 (96.6%) | 11 (3.4%) |
Health Insurance Coverage by Citizenship Status in New Alexandria
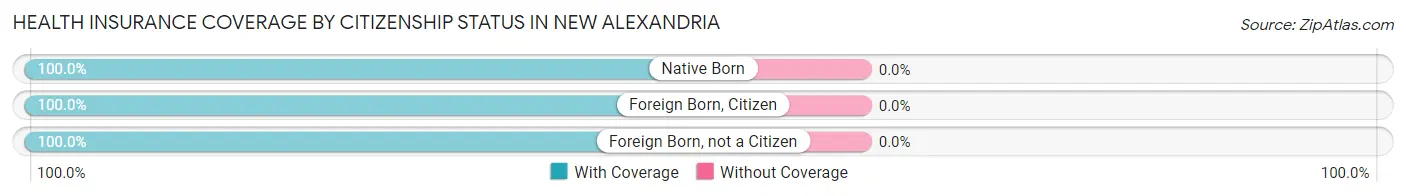
| Citizenship Status | With Coverage | Without Coverage |
| Native Born | 19 (100.0%) | 0 (0.0%) |
| Foreign Born, Citizen | 50 (100.0%) | 0 (0.0%) |
| Foreign Born, not a Citizen | 42 (100.0%) | 0 (0.0%) |
Health Insurance Coverage by Household Income in New Alexandria
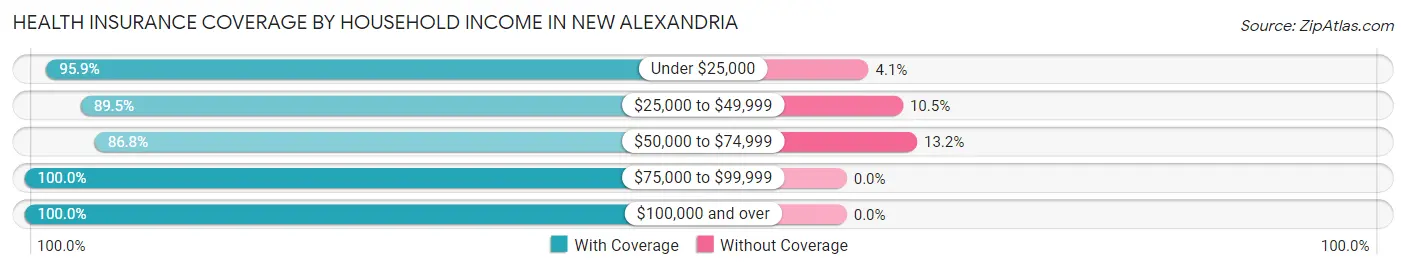
| Household Income | With Coverage | Without Coverage |
| Under $25,000 | 47 (95.9%) | 2 (4.1%) |
| $25,000 to $49,999 | 34 (89.5%) | 4 (10.5%) |
| $50,000 to $74,999 | 33 (86.8%) | 5 (13.2%) |
| $75,000 to $99,999 | 79 (100.0%) | 0 (0.0%) |
| $100,000 and over | 123 (100.0%) | 0 (0.0%) |
Public vs Private Health Insurance Coverage by Age in New Alexandria
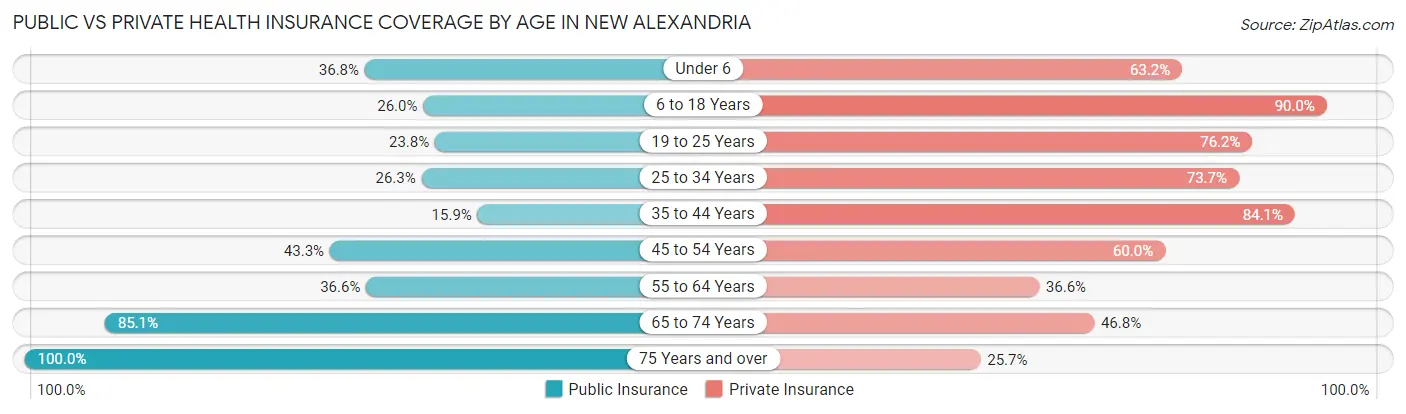
| Age Bracket | Public Insurance | Private Insurance |
| Under 6 | 7 (36.8%) | 12 (63.2%) |
| 6 to 18 Years | 13 (26.0%) | 45 (90.0%) |
| 19 to 25 Years | 10 (23.8%) | 32 (76.2%) |
| 25 to 34 Years | 5 (26.3%) | 14 (73.7%) |
| 35 to 44 Years | 7 (15.9%) | 37 (84.1%) |
| 45 to 54 Years | 13 (43.3%) | 18 (60.0%) |
| 55 to 64 Years | 15 (36.6%) | 15 (36.6%) |
| 65 to 74 Years | 40 (85.1%) | 22 (46.8%) |
| 75 Years and over | 35 (100.0%) | 9 (25.7%) |
| Total | 145 (44.3%) | 204 (62.4%) |
Disability Status by Sex by Age in New Alexandria
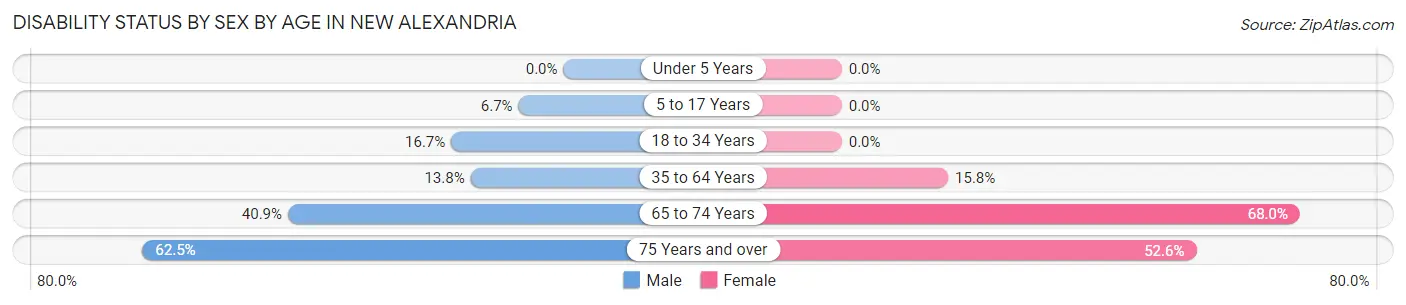
| Age Bracket | Male | Female |
| Under 5 Years | 0 (0.0%) | 0 (0.0%) |
| 5 to 17 Years | 1 (6.7%) | 0 (0.0%) |
| 18 to 34 Years | 10 (16.7%) | 0 (0.0%) |
| 35 to 64 Years | 8 (13.8%) | 9 (15.8%) |
| 65 to 74 Years | 9 (40.9%) | 17 (68.0%) |
| 75 Years and over | 10 (62.5%) | 10 (52.6%) |
Disability Class by Sex by Age in New Alexandria
Disability Class: Hearing Difficulty
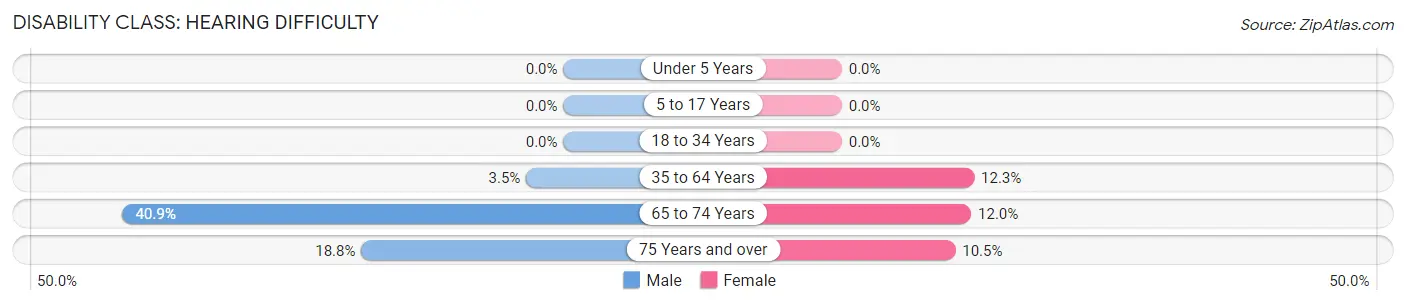
| Age Bracket | Male | Female |
| Under 5 Years | 0 (0.0%) | 0 (0.0%) |
| 5 to 17 Years | 0 (0.0%) | 0 (0.0%) |
| 18 to 34 Years | 0 (0.0%) | 0 (0.0%) |
| 35 to 64 Years | 2 (3.5%) | 7 (12.3%) |
| 65 to 74 Years | 9 (40.9%) | 3 (12.0%) |
| 75 Years and over | 3 (18.8%) | 2 (10.5%) |
Disability Class: Vision Difficulty
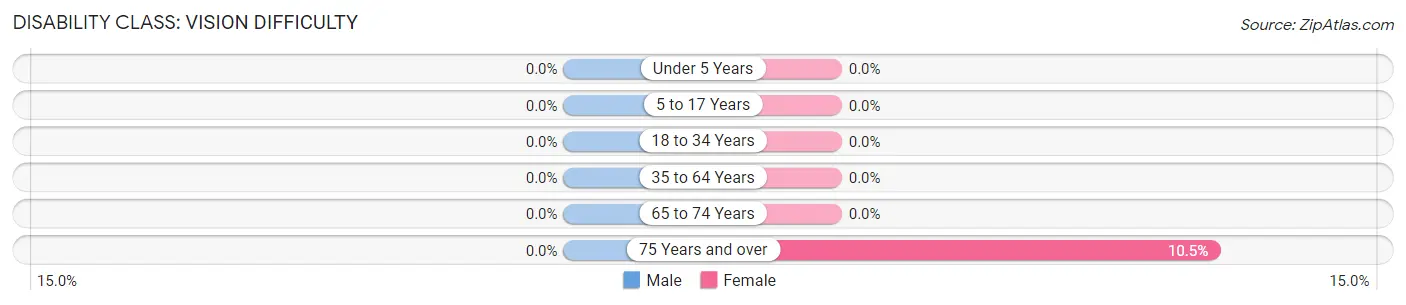
| Age Bracket | Male | Female |
| Under 5 Years | 0 (0.0%) | 0 (0.0%) |
| 5 to 17 Years | 0 (0.0%) | 0 (0.0%) |
| 18 to 34 Years | 0 (0.0%) | 0 (0.0%) |
| 35 to 64 Years | 0 (0.0%) | 0 (0.0%) |
| 65 to 74 Years | 0 (0.0%) | 0 (0.0%) |
| 75 Years and over | 0 (0.0%) | 2 (10.5%) |
Disability Class: Cognitive Difficulty
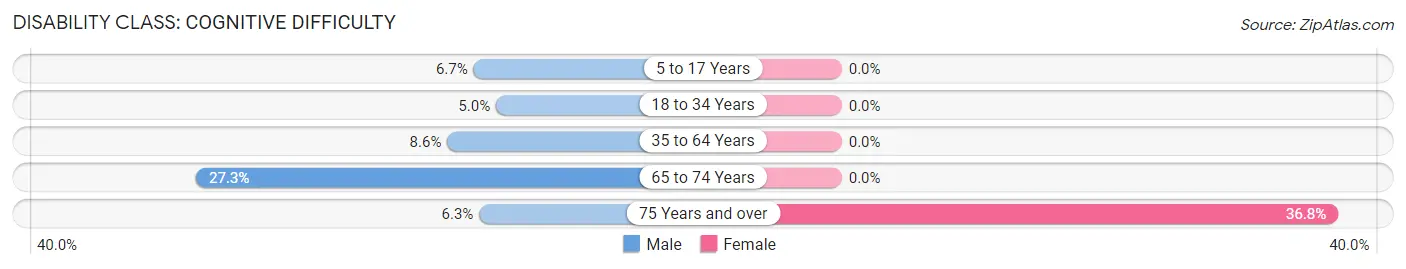
| Age Bracket | Male | Female |
| 5 to 17 Years | 1 (6.7%) | 0 (0.0%) |
| 18 to 34 Years | 3 (5.0%) | 0 (0.0%) |
| 35 to 64 Years | 5 (8.6%) | 0 (0.0%) |
| 65 to 74 Years | 6 (27.3%) | 0 (0.0%) |
| 75 Years and over | 1 (6.2%) | 7 (36.8%) |
Disability Class: Ambulatory Difficulty
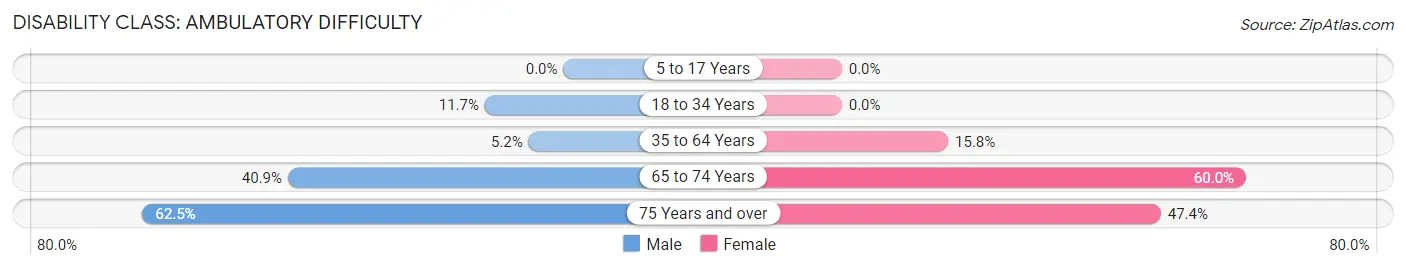
| Age Bracket | Male | Female |
| 5 to 17 Years | 0 (0.0%) | 0 (0.0%) |
| 18 to 34 Years | 7 (11.7%) | 0 (0.0%) |
| 35 to 64 Years | 3 (5.2%) | 9 (15.8%) |
| 65 to 74 Years | 9 (40.9%) | 15 (60.0%) |
| 75 Years and over | 10 (62.5%) | 9 (47.4%) |
Disability Class: Self-Care Difficulty
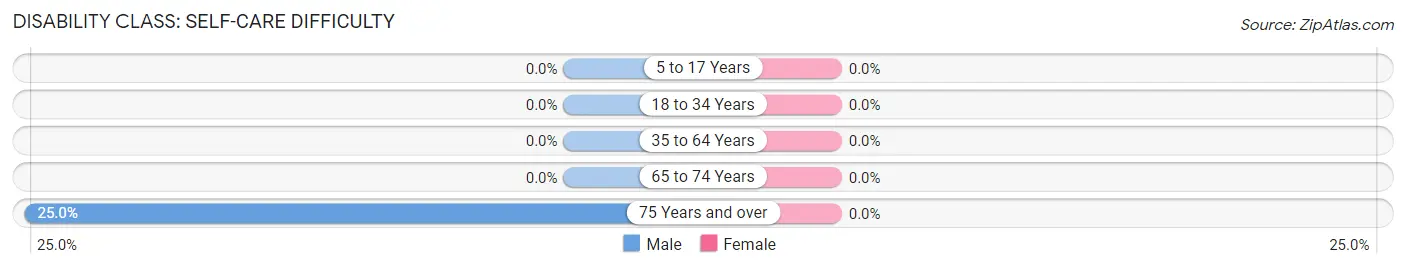
| Age Bracket | Male | Female |
| 5 to 17 Years | 0 (0.0%) | 0 (0.0%) |
| 18 to 34 Years | 0 (0.0%) | 0 (0.0%) |
| 35 to 64 Years | 0 (0.0%) | 0 (0.0%) |
| 65 to 74 Years | 0 (0.0%) | 0 (0.0%) |
| 75 Years and over | 4 (25.0%) | 0 (0.0%) |
Technology Access in New Alexandria
Computing Device Access in New Alexandria
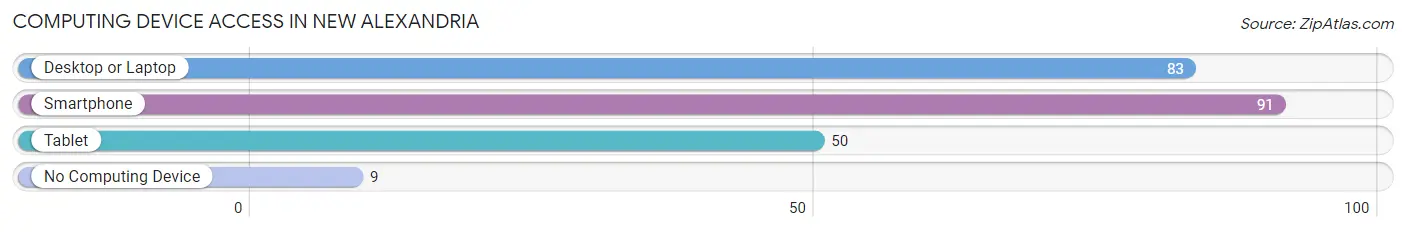
| Device Type | # Households | % Households |
| Desktop or Laptop | 83 | 74.8% |
| Smartphone | 91 | 82.0% |
| Tablet | 50 | 45.1% |
| No Computing Device | 9 | 8.1% |
| Total | 111 | 100.0% |
Internet Access in New Alexandria
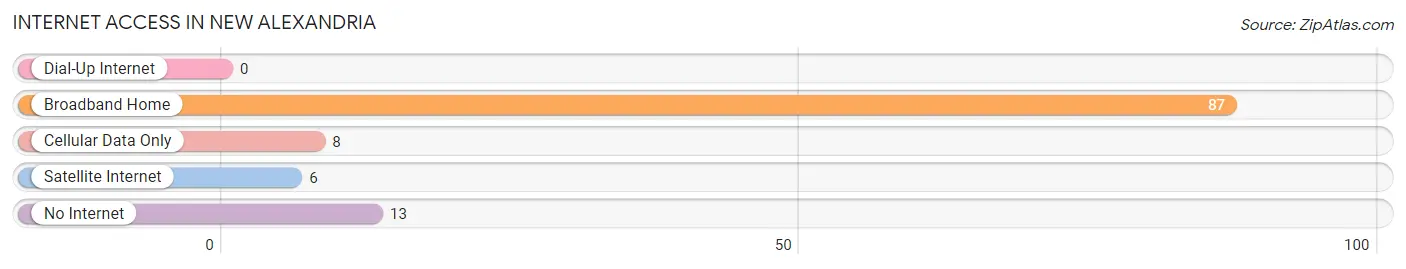
| Internet Type | # Households | % Households |
| Dial-Up Internet | 0 | 0.0% |
| Broadband Home | 87 | 78.4% |
| Cellular Data Only | 8 | 7.2% |
| Satellite Internet | 6 | 5.4% |
| No Internet | 13 | 11.7% |
| Total | 111 | 100.0% |
New Alexandria Summary
New Alexandria is a small village located in the state of Ohio, in the United States. It is situated in the southeastern part of the state, in the Appalachian region, and is part of the larger metropolitan area of Columbus. The village has a population of approximately 1,000 people, and is known for its rural charm and small-town atmosphere.
History
New Alexandria was founded in 1817 by a group of settlers from Pennsylvania. The village was originally known as “New Alexandria” due to its proximity to the city of Alexandria, which was located in the same county. The village was incorporated in 1820, and the first post office was established in 1821.
The village grew slowly over the years, and by the late 19th century, it had become a popular destination for tourists. The village was known for its scenic beauty, and it was home to several resorts and hotels.
In the early 20th century, the village began to decline in population as people moved away to larger cities. However, the village was able to maintain its rural charm and small-town atmosphere.
Geography
New Alexandria is located in the Appalachian region of Ohio, in the southeastern part of the state. The village is situated in the Scioto River Valley, and is surrounded by rolling hills and forests. The village is located approximately 30 miles south of Columbus, and is part of the larger metropolitan area.
The village is located at an elevation of 890 feet above sea level, and has a total area of 0.7 square miles. The village is located in a humid continental climate zone, and experiences hot summers and cold winters.
Economy
The economy of New Alexandria is largely based on agriculture and tourism. The village is home to several farms, and the surrounding area is known for its production of corn, soybeans, and other crops. The village is also home to several small businesses, including restaurants, shops, and other services.
Tourism is also an important part of the local economy. The village is home to several resorts and hotels, and is a popular destination for outdoor activities such as fishing, hunting, and camping.
Demographics
As of the 2010 census, the population of New Alexandria was 1,000 people. The village is predominantly white, with approximately 95% of the population identifying as Caucasian. The median household income is $45,000, and the median age is 40 years old.
Conclusion
New Alexandria is a small village located in the Appalachian region of Ohio. The village has a population of approximately 1,000 people, and is known for its rural charm and small-town atmosphere. The economy of the village is largely based on agriculture and tourism, and the village is home to several farms and small businesses. The village is predominantly white, with a median household income of $45,000 and a median age of 40 years old.
Common Questions
What is Per Capita Income in New Alexandria?
Per Capita income in New Alexandria is $26,051.
What is the Median Family Income in New Alexandria?
Median Family Income in New Alexandria is $81,875.
What is the Median Household income in New Alexandria?
Median Household Income in New Alexandria is $75,750.
What is Inequality or Gini Index in New Alexandria?
Inequality or Gini Index in New Alexandria is 0.33.
What is the Total Population of New Alexandria?
Total Population of New Alexandria is 327.
What is the Total Male Population of New Alexandria?
Total Male Population of New Alexandria is 176.
What is the Total Female Population of New Alexandria?
Total Female Population of New Alexandria is 151.
What is the Ratio of Males per 100 Females in New Alexandria?
There are 116.56 Males per 100 Females in New Alexandria.
What is the Ratio of Females per 100 Males in New Alexandria?
There are 85.80 Females per 100 Males in New Alexandria.
What is the Median Population Age in New Alexandria?
Median Population Age in New Alexandria is 44.3 Years.
What is the Average Family Size in New Alexandria
Average Family Size in New Alexandria is 3.2 People.
What is the Average Household Size in New Alexandria
Average Household Size in New Alexandria is 3.0 People.
How Large is the Labor Force in New Alexandria?
There are 164 People in the Labor Forcein in New Alexandria.
What is the Percentage of People in the Labor Force in New Alexandria?
58.6% of People are in the Labor Force in New Alexandria.
What is the Unemployment Rate in New Alexandria?
Unemployment Rate in New Alexandria is 7.3%.