Melrose, OH Map & Demographics
Melrose Map
Melrose Overview
$21,294
PER CAPITA INCOME
$71,250
AVG FAMILY INCOME
$72,375
AVG HOUSEHOLD INCOME
3.8%
WAGE / INCOME GAP [ % ]
96.2¢/ $1
WAGE / INCOME GAP [ $ ]
0.33
INEQUALITY / GINI INDEX
388
TOTAL POPULATION
210
MALE POPULATION
178
FEMALE POPULATION
117.98
MALES / 100 FEMALES
84.76
FEMALES / 100 MALES
31.2
MEDIAN AGE
3.5
AVG FAMILY SIZE
2.9
AVG HOUSEHOLD SIZE
166
LABOR FORCE [ PEOPLE ]
57.0%
PERCENT IN LABOR FORCE
24.1%
UNEMPLOYMENT RATE
Melrose Zip Codes
Melrose Area Codes
Income in Melrose
Income Overview in Melrose
Per Capita Income in Melrose is $21,294, while median incomes of families and households are $71,250 and $72,375 respectively.
| Characteristic | Number | Measure |
| Per Capita Income | 388 | $21,294 |
| Median Family Income | 84 | $71,250 |
| Mean Family Income | 84 | $78,939 |
| Median Household Income | 133 | $72,375 |
| Mean Household Income | 133 | $67,986 |
| Income Deficit | 84 | $0 |
| Wage / Income Gap (%) | 388 | 3.78% |
| Wage / Income Gap ($) | 388 | 96.22¢ per $1 |
| Gini / Inequality Index | 388 | 0.33 |
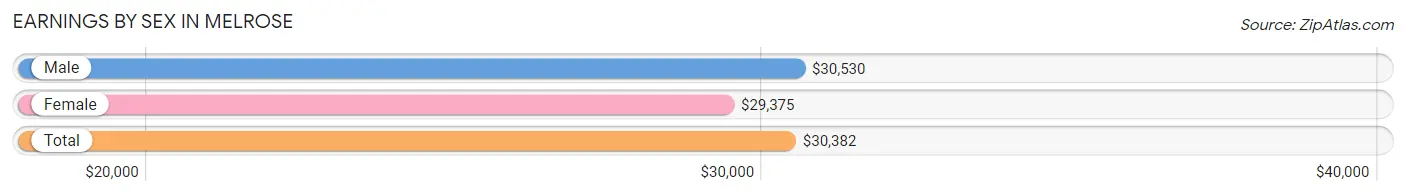
Earnings by Sex in Melrose
Average Earnings in Melrose are $30,382, $30,530 for men and $29,375 for women, a difference of 3.8%.
| Sex | Number | Average Earnings |
| Male | 122 (57.8%) | $30,530 |
| Female | 89 (42.2%) | $29,375 |
| Total | 211 (100.0%) | $30,382 |
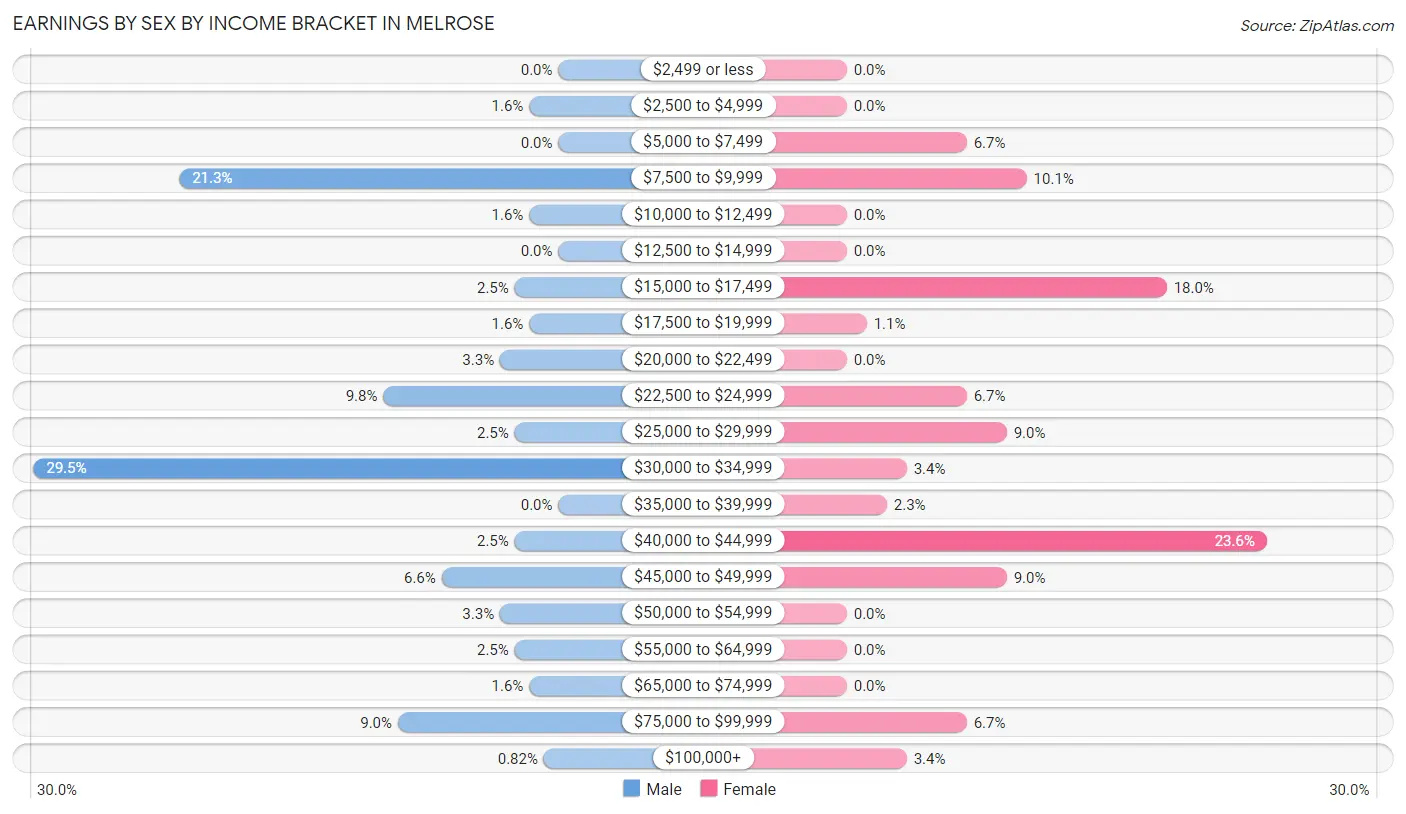
Earnings by Sex by Income Bracket in Melrose
The most common earnings brackets in Melrose are $30,000 to $34,999 for men (36 | 29.5%) and $40,000 to $44,999 for women (21 | 23.6%).
| Income | Male | Female |
| $2,499 or less | 0 (0.0%) | 0 (0.0%) |
| $2,500 to $4,999 | 2 (1.6%) | 0 (0.0%) |
| $5,000 to $7,499 | 0 (0.0%) | 6 (6.7%) |
| $7,500 to $9,999 | 26 (21.3%) | 9 (10.1%) |
| $10,000 to $12,499 | 2 (1.6%) | 0 (0.0%) |
| $12,500 to $14,999 | 0 (0.0%) | 0 (0.0%) |
| $15,000 to $17,499 | 3 (2.5%) | 16 (18.0%) |
| $17,500 to $19,999 | 2 (1.6%) | 1 (1.1%) |
| $20,000 to $22,499 | 4 (3.3%) | 0 (0.0%) |
| $22,500 to $24,999 | 12 (9.8%) | 6 (6.7%) |
| $25,000 to $29,999 | 3 (2.5%) | 8 (9.0%) |
| $30,000 to $34,999 | 36 (29.5%) | 3 (3.4%) |
| $35,000 to $39,999 | 0 (0.0%) | 2 (2.2%) |
| $40,000 to $44,999 | 3 (2.5%) | 21 (23.6%) |
| $45,000 to $49,999 | 8 (6.6%) | 8 (9.0%) |
| $50,000 to $54,999 | 4 (3.3%) | 0 (0.0%) |
| $55,000 to $64,999 | 3 (2.5%) | 0 (0.0%) |
| $65,000 to $74,999 | 2 (1.6%) | 0 (0.0%) |
| $75,000 to $99,999 | 11 (9.0%) | 6 (6.7%) |
| $100,000+ | 1 (0.8%) | 3 (3.4%) |
| Total | 122 (100.0%) | 89 (100.0%) |
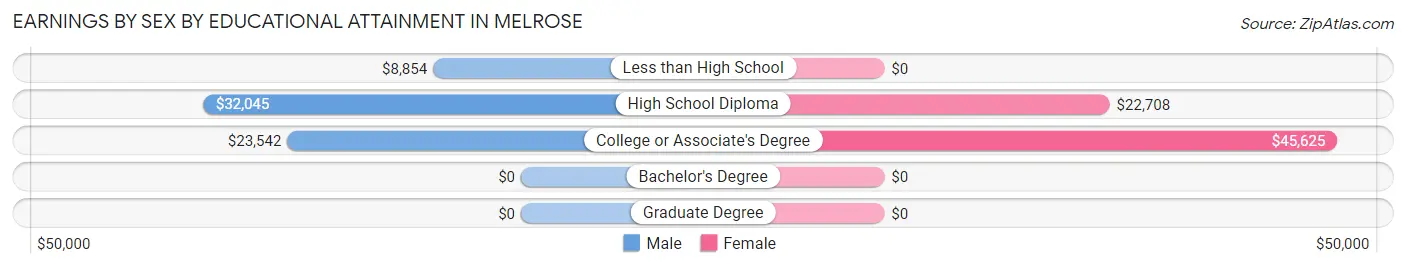
Earnings by Sex by Educational Attainment in Melrose
Average earnings in Melrose are $31,098 for men and $31,250 for women, a difference of 0.5%. Men with an educational attainment of high school diploma enjoy the highest average annual earnings of $32,045, while those with less than high school education earn the least with $8,854. Women with an educational attainment of college or associate's degree earn the most with the average annual earnings of $45,625, while those with high school diploma education have the smallest earnings of $22,708.
| Educational Attainment | Male Income | Female Income |
| Less than High School | $8,854 | $0 |
| High School Diploma | $32,045 | $22,708 |
| College or Associate's Degree | $23,542 | $45,625 |
| Bachelor's Degree | - | - |
| Graduate Degree | - | - |
| Total | $31,098 | $31,250 |
Family Income in Melrose
Family Income Brackets in Melrose
According to the Melrose family income data, there are 35 families falling into the $50,000 to $74,999 income range, which is the most common income bracket and makes up 41.7% of all families.
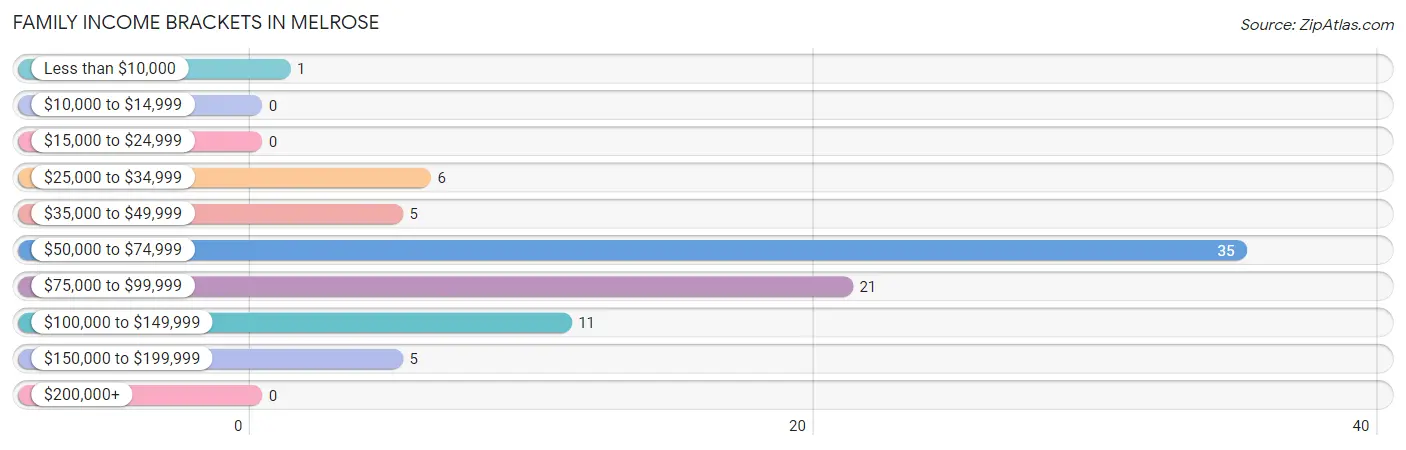
| Income Bracket | # Families | % Families |
| Less than $10,000 | 1 | 1.2% |
| $10,000 to $14,999 | 0 | 0.0% |
| $15,000 to $24,999 | 0 | 0.0% |
| $25,000 to $34,999 | 6 | 7.1% |
| $35,000 to $49,999 | 5 | 6.0% |
| $50,000 to $74,999 | 35 | 41.7% |
| $75,000 to $99,999 | 21 | 25.0% |
| $100,000 to $149,999 | 11 | 13.1% |
| $150,000 to $199,999 | 5 | 6.0% |
| $200,000+ | 0 | 0.0% |
Family Income by Famaliy Size in Melrose
2-person families (41 | 48.8%) account for the highest median family income in Melrose with $86,118 per family, while 2-person families (41 | 48.8%) have the highest median income of $43,059 per family member.
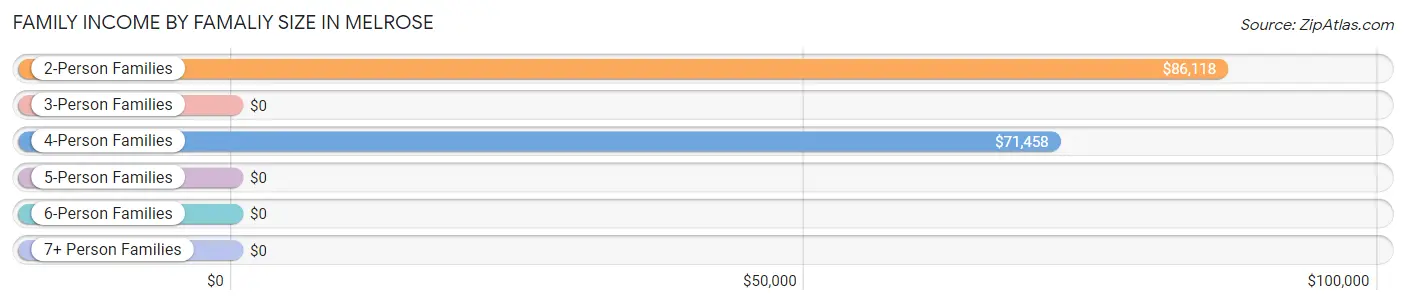
| Income Bracket | # Families | Median Income |
| 2-Person Families | 41 (48.8%) | $86,118 |
| 3-Person Families | 8 (9.5%) | $0 |
| 4-Person Families | 9 (10.7%) | $71,458 |
| 5-Person Families | 2 (2.4%) | $0 |
| 6-Person Families | 8 (9.5%) | $0 |
| 7+ Person Families | 16 (19.1%) | $0 |
| Total | 84 (100.0%) | $71,250 |
Family Income by Number of Earners in Melrose
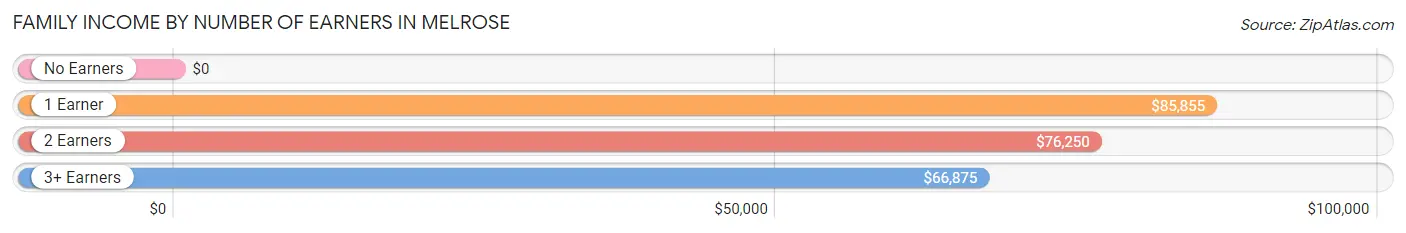
| Number of Earners | # Families | Median Income |
| No Earners | 5 (5.9%) | $0 |
| 1 Earner | 31 (36.9%) | $85,855 |
| 2 Earners | 24 (28.6%) | $76,250 |
| 3+ Earners | 24 (28.6%) | $66,875 |
| Total | 84 (100.0%) | $71,250 |
Household Income in Melrose
Household Income Brackets in Melrose
With 50 households falling in the category, the $75,000 to $99,999 income range is the most frequent in Melrose, accounting for 37.6% of all households.
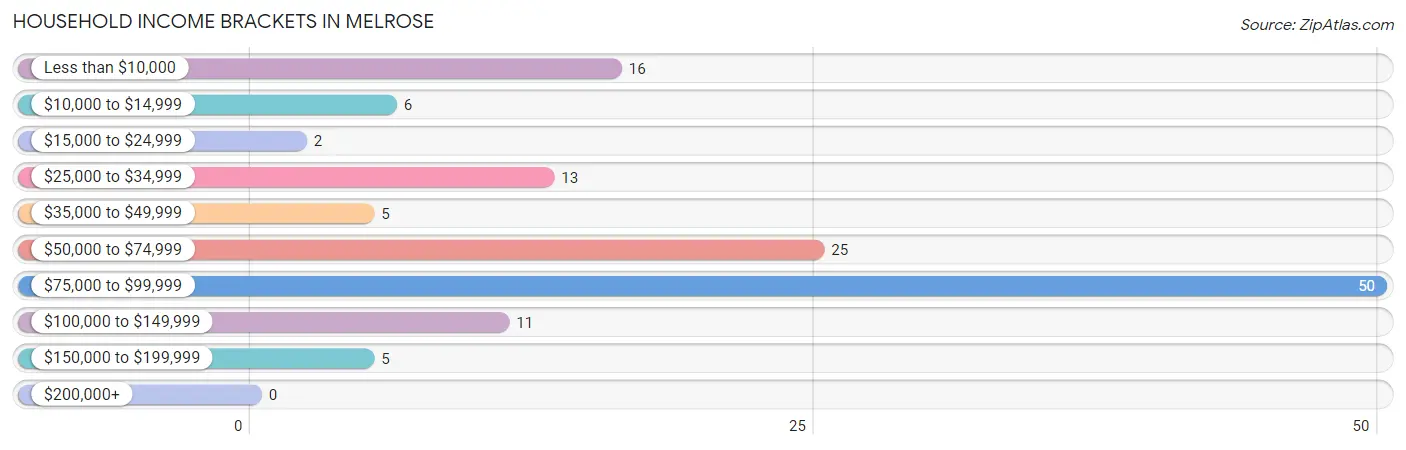
| Income Bracket | # Households | % Households |
| Less than $10,000 | 16 | 12.0% |
| $10,000 to $14,999 | 6 | 4.5% |
| $15,000 to $24,999 | 2 | 1.5% |
| $25,000 to $34,999 | 13 | 9.8% |
| $35,000 to $49,999 | 5 | 3.8% |
| $50,000 to $74,999 | 25 | 18.8% |
| $75,000 to $99,999 | 50 | 37.6% |
| $100,000 to $149,999 | 11 | 8.3% |
| $150,000 to $199,999 | 5 | 3.8% |
| $200,000+ | 0 | 0.0% |
Household Income by Householder Age in Melrose
The median household income in Melrose is $72,375, with the highest median household income of $86,513 found in the 45 to 64 years age bracket for the primary householder. A total of 73 households (54.9%) fall into this category. Meanwhile, the 15 to 24 years age bracket for the primary householder has the lowest median household income of $0, with 6 households (4.5%) in this group.
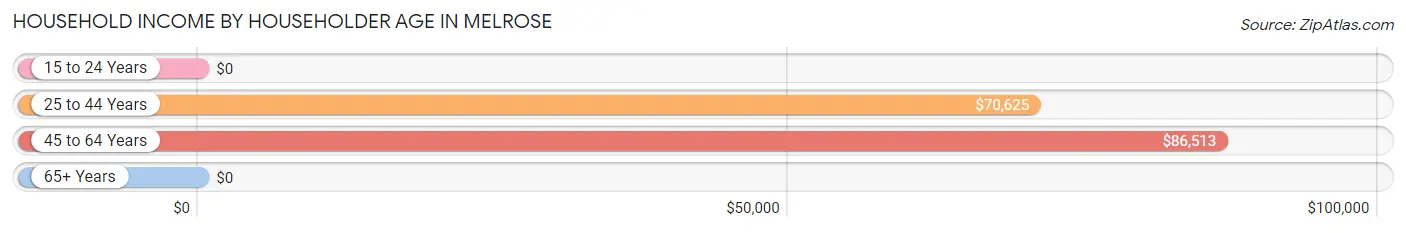
| Income Bracket | # Households | Median Income |
| 15 to 24 Years | 6 (4.5%) | $0 |
| 25 to 44 Years | 21 (15.8%) | $70,625 |
| 45 to 64 Years | 73 (54.9%) | $86,513 |
| 65+ Years | 33 (24.8%) | $0 |
| Total | 133 (100.0%) | $72,375 |
Poverty in Melrose
Income Below Poverty by Sex and Age in Melrose
With 5.7% poverty level for males and 22.5% for females among the residents of Melrose, 15 year old males and 75 year old and over females are the most vulnerable to poverty, with 2 males (100.0%) and 15 females (83.3%) in their respective age groups living below the poverty level.
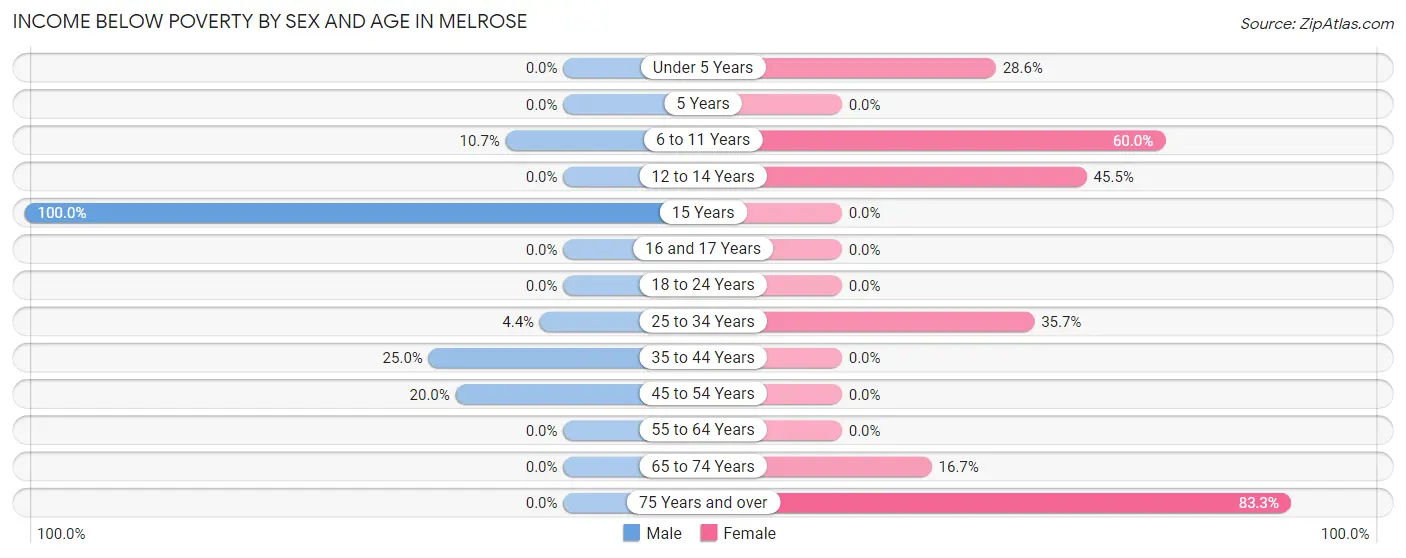
| Age Bracket | Male | Female |
| Under 5 Years | 0 (0.0%) | 2 (28.6%) |
| 5 Years | 0 (0.0%) | 0 (0.0%) |
| 6 to 11 Years | 3 (10.7%) | 6 (60.0%) |
| 12 to 14 Years | 0 (0.0%) | 5 (45.5%) |
| 15 Years | 2 (100.0%) | 0 (0.0%) |
| 16 and 17 Years | 0 (0.0%) | 0 (0.0%) |
| 18 to 24 Years | 0 (0.0%) | 0 (0.0%) |
| 25 to 34 Years | 3 (4.3%) | 10 (35.7%) |
| 35 to 44 Years | 2 (25.0%) | 0 (0.0%) |
| 45 to 54 Years | 2 (20.0%) | 0 (0.0%) |
| 55 to 64 Years | 0 (0.0%) | 0 (0.0%) |
| 65 to 74 Years | 0 (0.0%) | 2 (16.7%) |
| 75 Years and over | 0 (0.0%) | 15 (83.3%) |
| Total | 12 (5.7%) | 40 (22.5%) |
Income Above Poverty by Sex and Age in Melrose
According to the poverty statistics in Melrose, males aged under 5 years and females aged 16 and 17 years are the age groups that are most secure financially, with 100.0% of males and 100.0% of females in these age groups living above the poverty line.
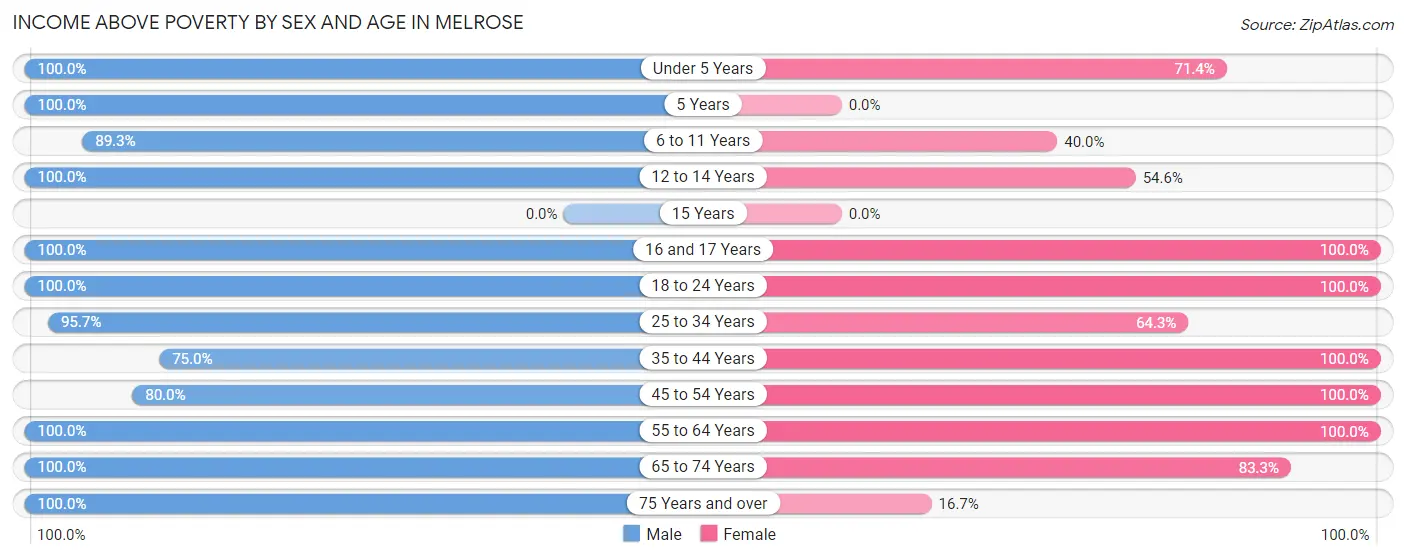
| Age Bracket | Male | Female |
| Under 5 Years | 24 (100.0%) | 5 (71.4%) |
| 5 Years | 10 (100.0%) | 0 (0.0%) |
| 6 to 11 Years | 25 (89.3%) | 4 (40.0%) |
| 12 to 14 Years | 5 (100.0%) | 6 (54.5%) |
| 15 Years | 0 (0.0%) | 0 (0.0%) |
| 16 and 17 Years | 8 (100.0%) | 2 (100.0%) |
| 18 to 24 Years | 15 (100.0%) | 6 (100.0%) |
| 25 to 34 Years | 66 (95.7%) | 18 (64.3%) |
| 35 to 44 Years | 6 (75.0%) | 16 (100.0%) |
| 45 to 54 Years | 8 (80.0%) | 29 (100.0%) |
| 55 to 64 Years | 23 (100.0%) | 39 (100.0%) |
| 65 to 74 Years | 6 (100.0%) | 10 (83.3%) |
| 75 Years and over | 2 (100.0%) | 3 (16.7%) |
| Total | 198 (94.3%) | 138 (77.5%) |
Income Below Poverty Among Married-Couple Families in Melrose
The poverty statistics for married-couple families in Melrose show that 5.8% or 3 of the total 52 families live below the poverty line. Families with 3 or 4 children have the highest poverty rate of 30.0%, comprising of 3 families. On the other hand, families with no children have the lowest poverty rate of 0.0%, which includes 0 families.
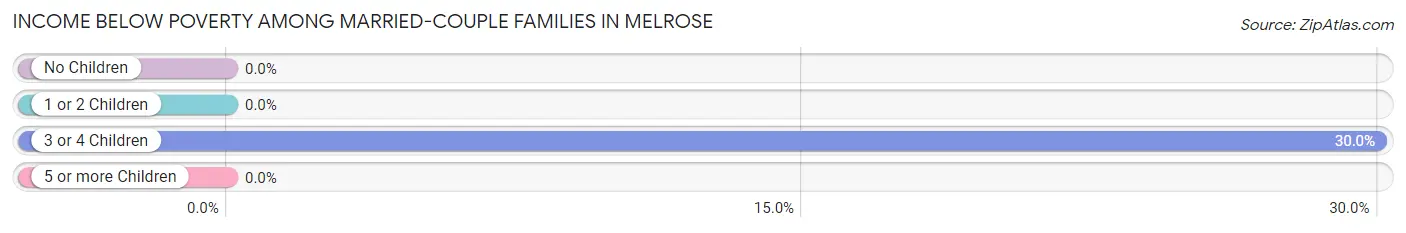
| Children | Above Poverty | Below Poverty |
| No Children | 40 (100.0%) | 0 (0.0%) |
| 1 or 2 Children | 2 (100.0%) | 0 (0.0%) |
| 3 or 4 Children | 7 (70.0%) | 3 (30.0%) |
| 5 or more Children | 0 (0.0%) | 0 (0.0%) |
| Total | 49 (94.2%) | 3 (5.8%) |
Income Below Poverty Among Single-Parent Households in Melrose
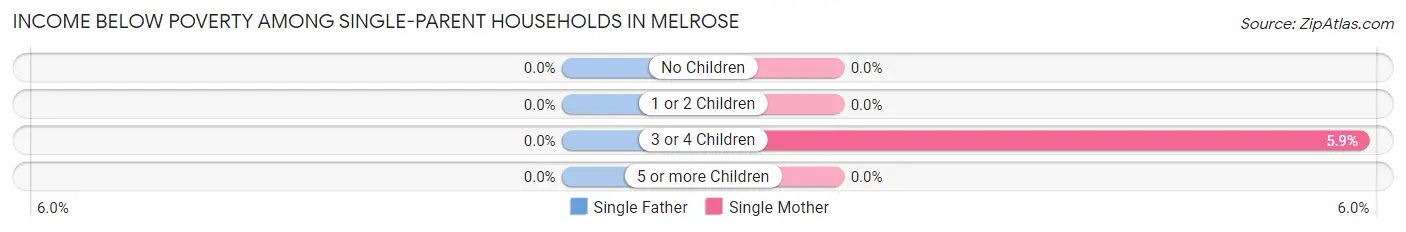
| Children | Single Father | Single Mother |
| No Children | 0 (0.0%) | 0 (0.0%) |
| 1 or 2 Children | 0 (0.0%) | 0 (0.0%) |
| 3 or 4 Children | 0 (0.0%) | 1 (5.9%) |
| 5 or more Children | 0 (0.0%) | 0 (0.0%) |
| Total | 0 (0.0%) | 1 (3.1%) |
Income Below Poverty Among Married-Couple vs Single-Parent Households in Melrose
The poverty data for Melrose shows that 3 of the married-couple family households (5.8%) and 1 of the single-parent households (3.1%) are living below the poverty level. Within the married-couple family households, those with 3 or 4 children have the highest poverty rate, with 3 households (30.0%) falling below the poverty line. Among the single-parent households, those with 3 or 4 children have the highest poverty rate, with 1 household (5.9%) living below poverty.
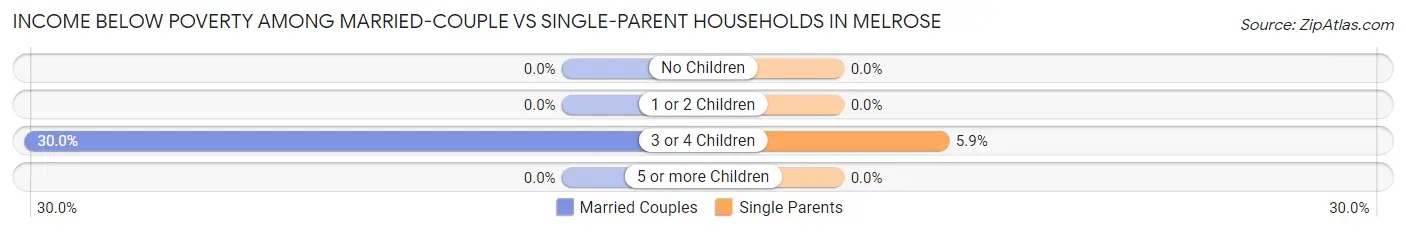
| Children | Married-Couple Families | Single-Parent Households |
| No Children | 0 (0.0%) | 0 (0.0%) |
| 1 or 2 Children | 0 (0.0%) | 0 (0.0%) |
| 3 or 4 Children | 3 (30.0%) | 1 (5.9%) |
| 5 or more Children | 0 (0.0%) | 0 (0.0%) |
| Total | 3 (5.8%) | 1 (3.1%) |
Race in Melrose
The most populous races in Melrose are White / Caucasian (354 | 91.2%), Asian (19 | 4.9%), and Black / African American (9 | 2.3%).
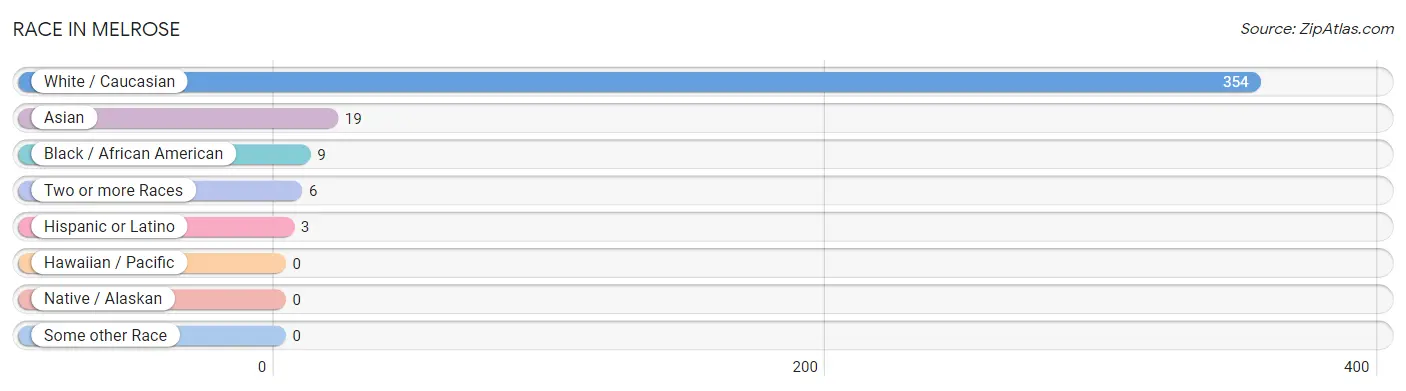
| Race | # Population | % Population |
| Asian | 19 | 4.9% |
| Black / African American | 9 | 2.3% |
| Hawaiian / Pacific | 0 | 0.0% |
| Hispanic or Latino | 3 | 0.8% |
| Native / Alaskan | 0 | 0.0% |
| White / Caucasian | 354 | 91.2% |
| Two or more Races | 6 | 1.5% |
| Some other Race | 0 | 0.0% |
| Total | 388 | 100.0% |
Ancestry in Melrose
The most populous ancestries reported in Melrose are American (144 | 37.1%), German (43 | 11.1%), Irish (33 | 8.5%), Burmese (19 | 4.9%), and English (16 | 4.1%), together accounting for 65.7% of all Melrose residents.
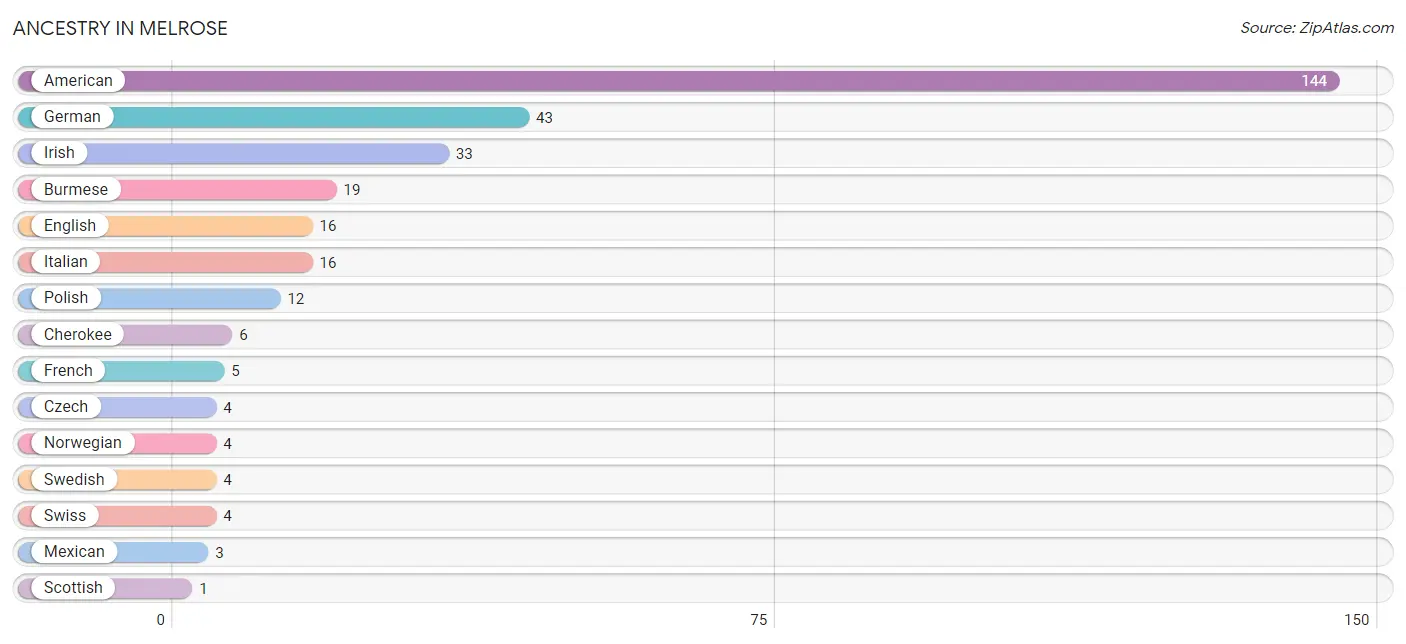
| Ancestry | # Population | % Population |
| American | 144 | 37.1% |
| Burmese | 19 | 4.9% |
| Cherokee | 6 | 1.5% |
| Czech | 4 | 1.0% |
| English | 16 | 4.1% |
| French | 5 | 1.3% |
| German | 43 | 11.1% |
| Irish | 33 | 8.5% |
| Italian | 16 | 4.1% |
| Mexican | 3 | 0.8% |
| Norwegian | 4 | 1.0% |
| Polish | 12 | 3.1% |
| Scottish | 1 | 0.3% |
| Swedish | 4 | 1.0% |
| Swiss | 4 | 1.0% | View All 15 Rows |
Immigrants in Melrose
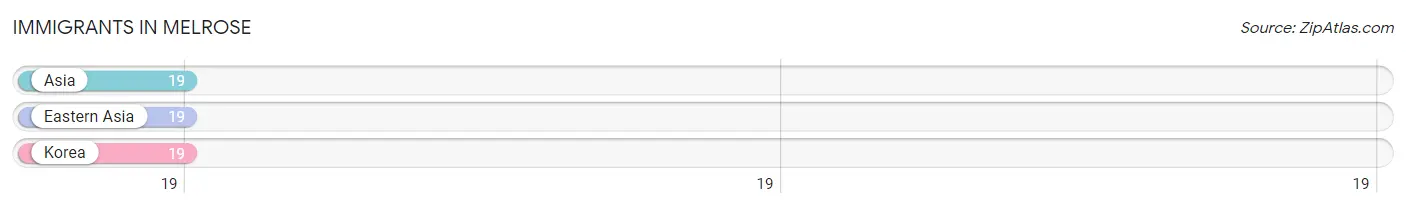
The most numerous immigrant groups reported in Melrose came from Asia (19 | 4.9%), Eastern Asia (19 | 4.9%), and Korea (19 | 4.9%), together accounting for 14.7% of all Melrose residents.
| Immigration Origin | # Population | % Population |
| Asia | 19 | 4.9% |
| Eastern Asia | 19 | 4.9% |
| Korea | 19 | 4.9% | View All 3 Rows |
Sex and Age in Melrose
Sex and Age in Melrose
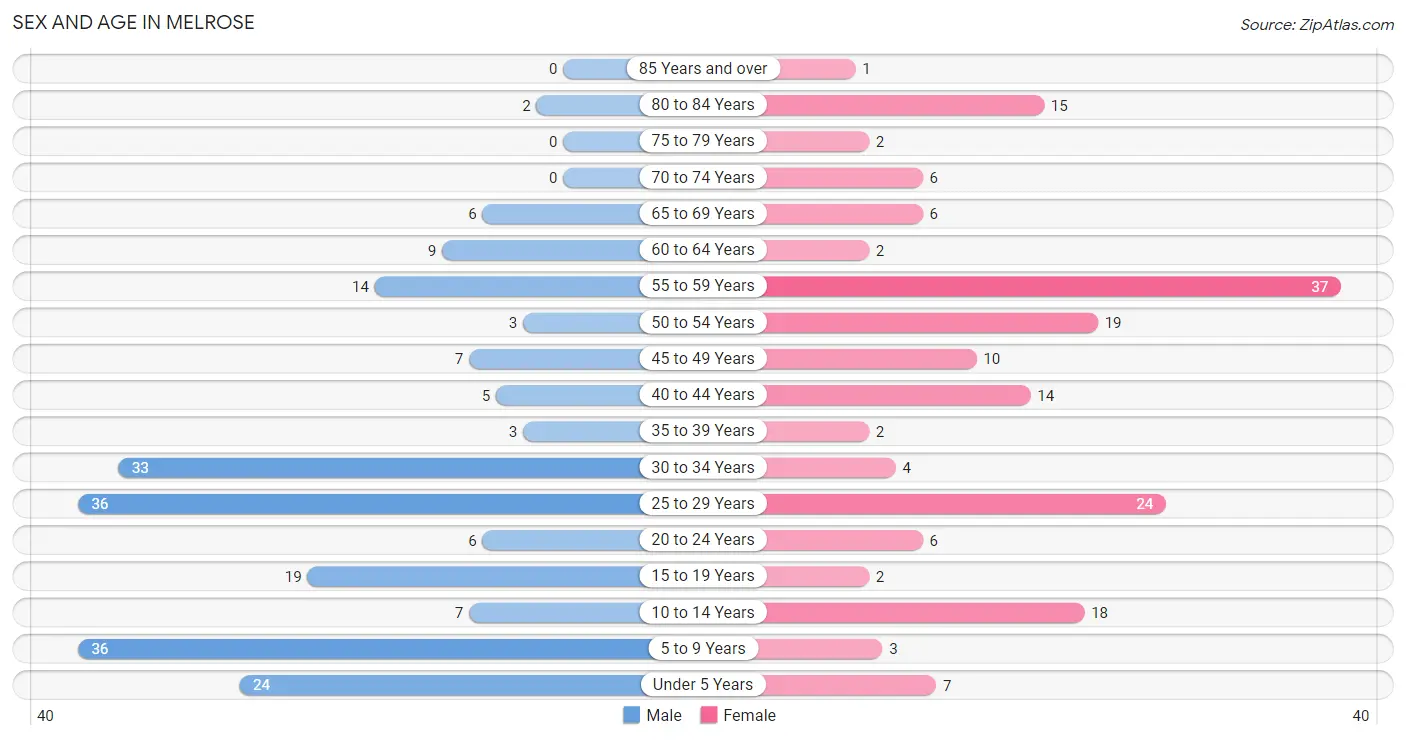
The most populous age groups in Melrose are 5 to 9 Years (36 | 17.1%) for men and 55 to 59 Years (37 | 20.8%) for women.
| Age Bracket | Male | Female |
| Under 5 Years | 24 (11.4%) | 7 (3.9%) |
| 5 to 9 Years | 36 (17.1%) | 3 (1.7%) |
| 10 to 14 Years | 7 (3.3%) | 18 (10.1%) |
| 15 to 19 Years | 19 (9.0%) | 2 (1.1%) |
| 20 to 24 Years | 6 (2.9%) | 6 (3.4%) |
| 25 to 29 Years | 36 (17.1%) | 24 (13.5%) |
| 30 to 34 Years | 33 (15.7%) | 4 (2.2%) |
| 35 to 39 Years | 3 (1.4%) | 2 (1.1%) |
| 40 to 44 Years | 5 (2.4%) | 14 (7.9%) |
| 45 to 49 Years | 7 (3.3%) | 10 (5.6%) |
| 50 to 54 Years | 3 (1.4%) | 19 (10.7%) |
| 55 to 59 Years | 14 (6.7%) | 37 (20.8%) |
| 60 to 64 Years | 9 (4.3%) | 2 (1.1%) |
| 65 to 69 Years | 6 (2.9%) | 6 (3.4%) |
| 70 to 74 Years | 0 (0.0%) | 6 (3.4%) |
| 75 to 79 Years | 0 (0.0%) | 2 (1.1%) |
| 80 to 84 Years | 2 (0.9%) | 15 (8.4%) |
| 85 Years and over | 0 (0.0%) | 1 (0.6%) |
| Total | 210 (100.0%) | 178 (100.0%) |
Families and Households in Melrose
Median Family Size in Melrose
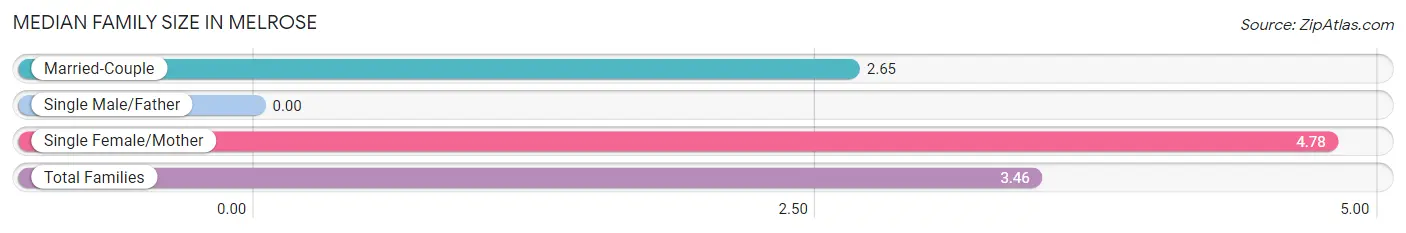
| Family Type | # Families | Family Size |
| Married-Couple | 52 (61.9%) | 2.65 |
| Single Male/Father | 0 (0.0%) | - |
| Single Female/Mother | 32 (38.1%) | 4.78 |
| Total Families | 84 (100.0%) | 3.46 |
Median Household Size in Melrose
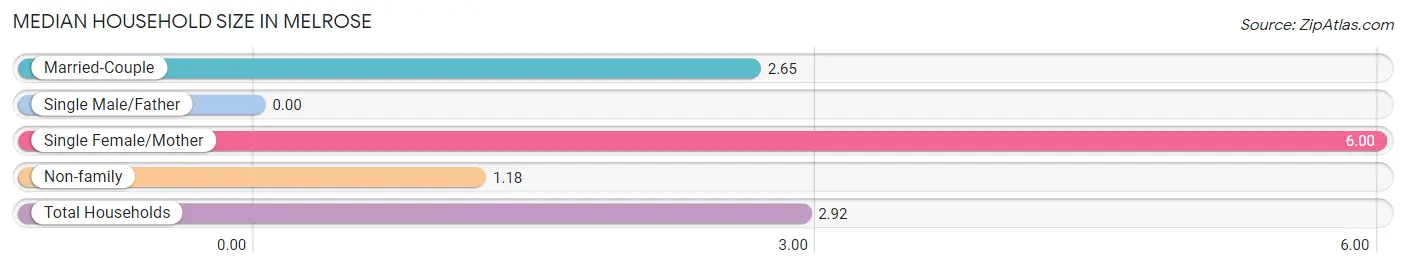
| Household Type | # Households | Household Size |
| Married-Couple | 52 (39.1%) | 2.65 |
| Single Male/Father | 0 (0.0%) | - |
| Single Female/Mother | 32 (24.1%) | 6.00 |
| Non-family | 49 (36.8%) | 1.18 |
| Total Households | 133 (100.0%) | 2.92 |
Household Size by Marriage Status in Melrose
Out of a total of 133 households in Melrose, 84 (63.2%) are family households, while 49 (36.8%) are nonfamily households. The most numerous type of family households are 2-person households, comprising 41, and the most common type of nonfamily households are 1-person households, comprising 41.
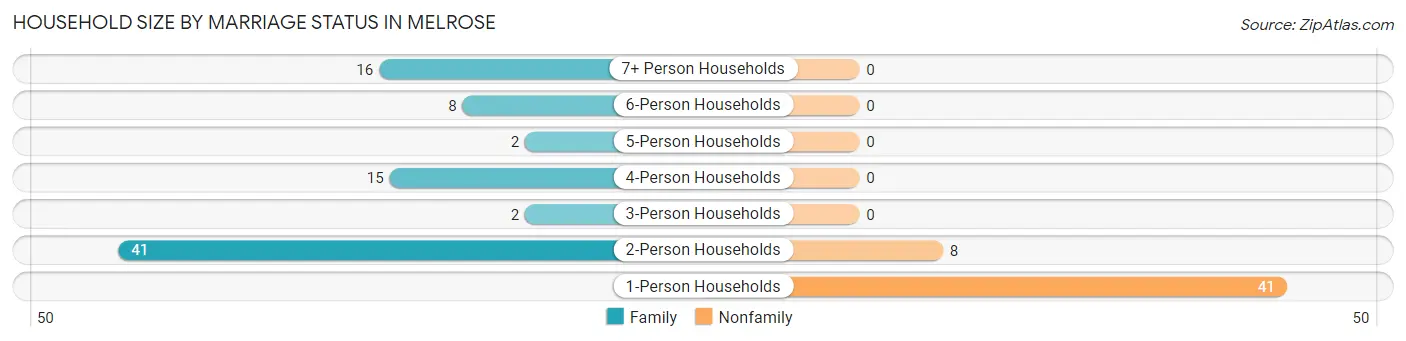
| Household Size | Family Households | Nonfamily Households |
| 1-Person Households | - | 41 (30.8%) |
| 2-Person Households | 41 (30.8%) | 8 (6.0%) |
| 3-Person Households | 2 (1.5%) | 0 (0.0%) |
| 4-Person Households | 15 (11.3%) | 0 (0.0%) |
| 5-Person Households | 2 (1.5%) | 0 (0.0%) |
| 6-Person Households | 8 (6.0%) | 0 (0.0%) |
| 7+ Person Households | 16 (12.0%) | 0 (0.0%) |
| Total | 84 (63.2%) | 49 (36.8%) |
Female Fertility in Melrose
Fertility by Age in Melrose
Average fertility rate in Melrose is 48.0 births per 1,000 women. Women in the age bracket of 35 to 50 years have the highest fertility rate with 115.0 births per 1,000 women. Women in the age bracket of 35 to 50 years acount for 100.0% of all women with births.
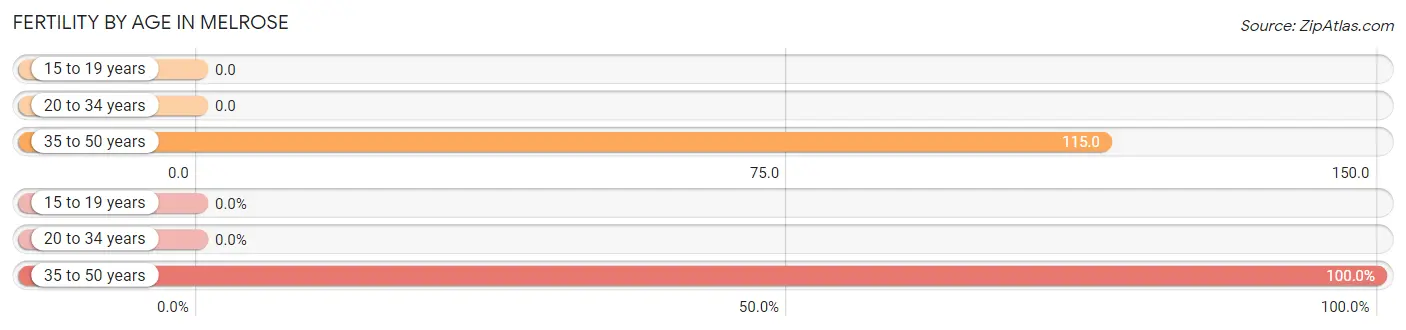
| Age Bracket | Women with Births | Births / 1,000 Women |
| 15 to 19 years | 0 (0.0%) | 0.0 |
| 20 to 34 years | 0 (0.0%) | 0.0 |
| 35 to 50 years | 3 (100.0%) | 115.0 |
| Total | 3 (100.0%) | 48.0 |
Fertility by Age by Marriage Status in Melrose
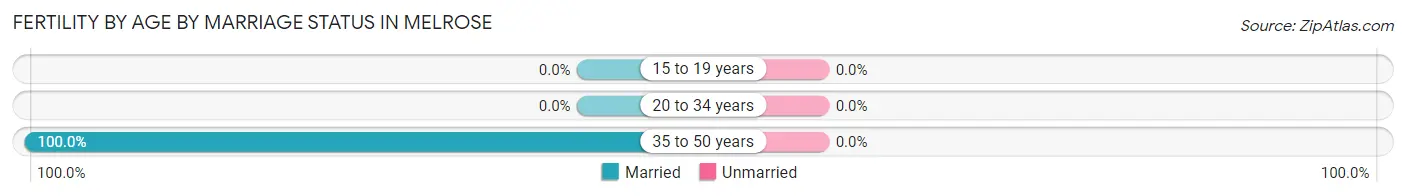
| Age Bracket | Married | Unmarried |
| 15 to 19 years | 0 (0.0%) | 0 (0.0%) |
| 20 to 34 years | 0 (0.0%) | 0 (0.0%) |
| 35 to 50 years | 3 (100.0%) | 0 (0.0%) |
| Total | 3 (100.0%) | 0 (0.0%) |
Fertility by Education in Melrose
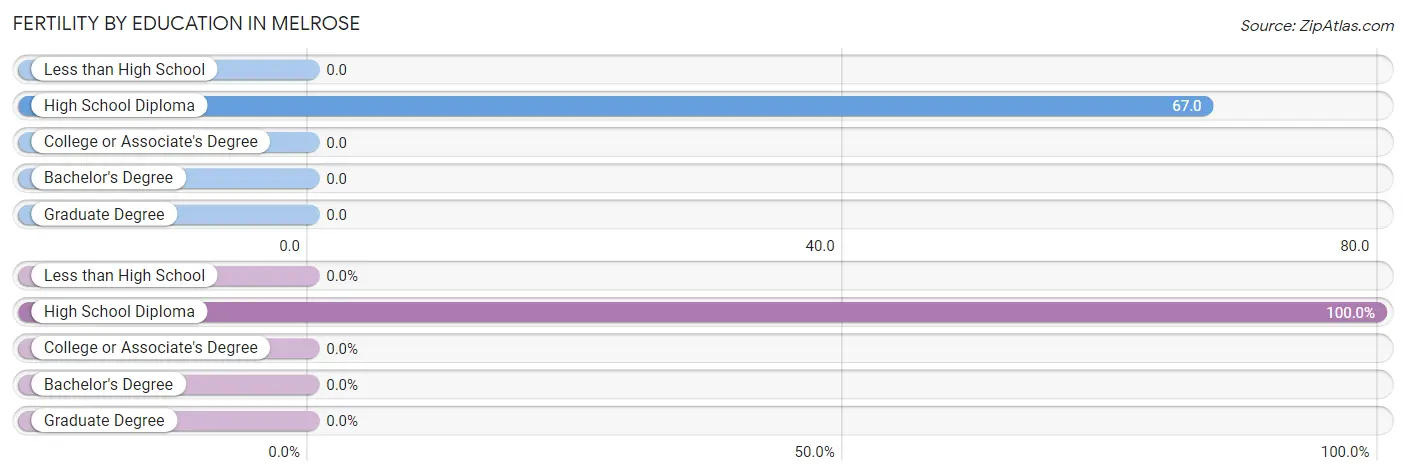
| Educational Attainment | Women with Births | Births / 1,000 Women |
| Less than High School | 0 (0.0%) | 0.0 |
| High School Diploma | 3 (100.0%) | 67.0 |
| College or Associate's Degree | 0 (0.0%) | 0.0 |
| Bachelor's Degree | 0 (0.0%) | 0.0 |
| Graduate Degree | 0 (0.0%) | 0.0 |
| Total | 3 (100.0%) | 48.0 |
Fertility by Education by Marriage Status in Melrose
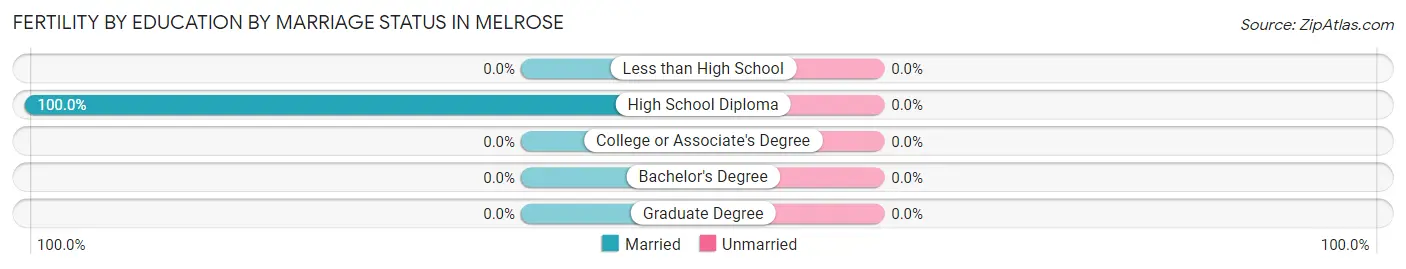
| Educational Attainment | Married | Unmarried |
| Less than High School | 0 (0.0%) | 0 (0.0%) |
| High School Diploma | 3 (100.0%) | 0 (0.0%) |
| College or Associate's Degree | 0 (0.0%) | 0 (0.0%) |
| Bachelor's Degree | 0 (0.0%) | 0 (0.0%) |
| Graduate Degree | 0 (0.0%) | 0 (0.0%) |
| Total | 3 (100.0%) | 0 (0.0%) |
Employment Characteristics in Melrose
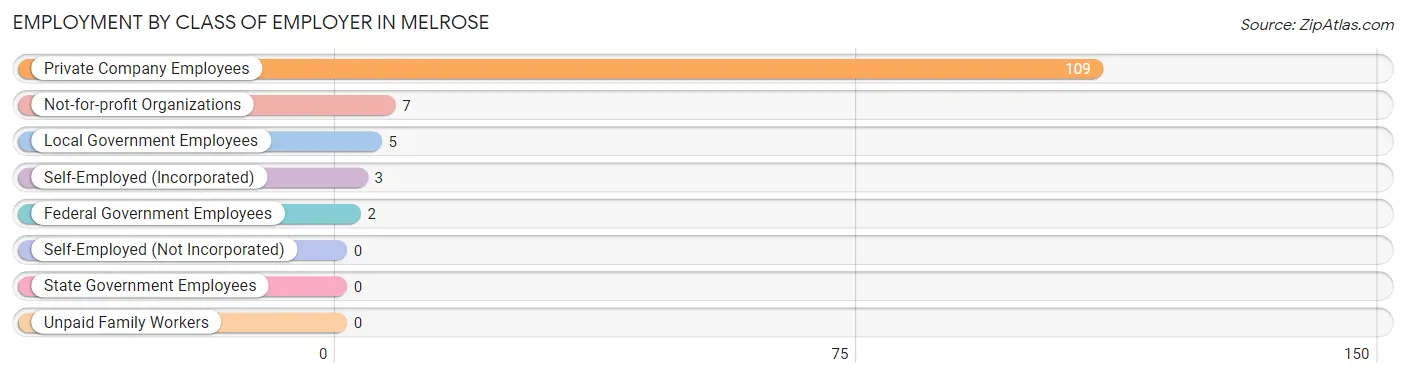
Employment by Class of Employer in Melrose
Among the 126 employed individuals in Melrose, private company employees (109 | 86.5%), not-for-profit organizations (7 | 5.6%), and local government employees (5 | 4.0%) make up the most common classes of employment.
| Employer Class | # Employees | % Employees |
| Private Company Employees | 109 | 86.5% |
| Self-Employed (Incorporated) | 3 | 2.4% |
| Self-Employed (Not Incorporated) | 0 | 0.0% |
| Not-for-profit Organizations | 7 | 5.6% |
| Local Government Employees | 5 | 4.0% |
| State Government Employees | 0 | 0.0% |
| Federal Government Employees | 2 | 1.6% |
| Unpaid Family Workers | 0 | 0.0% |
| Total | 126 | 100.0% |
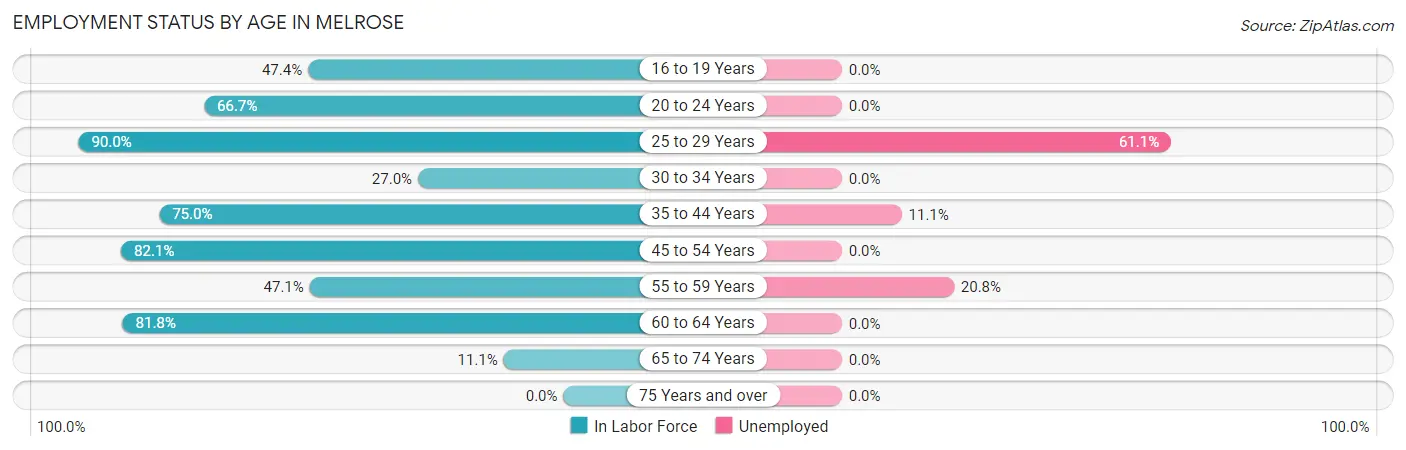
Employment Status by Age in Melrose
According to the labor force statistics for Melrose, out of the total population over 16 years of age (291), 57.0% or 166 individuals are in the labor force, with 24.1% or 40 of them unemployed. The age group with the highest labor force participation rate is 25 to 29 years, with 90.0% or 54 individuals in the labor force. Within the labor force, the 25 to 29 years age range has the highest percentage of unemployed individuals, with 61.1% or 33 of them being unemployed.
| Age Bracket | In Labor Force | Unemployed |
| 16 to 19 Years | 9 (47.4%) | 0 (0.0%) |
| 20 to 24 Years | 8 (66.7%) | 0 (0.0%) |
| 25 to 29 Years | 54 (90.0%) | 33 (61.1%) |
| 30 to 34 Years | 10 (27.0%) | 0 (0.0%) |
| 35 to 44 Years | 18 (75.0%) | 2 (11.1%) |
| 45 to 54 Years | 32 (82.1%) | 0 (0.0%) |
| 55 to 59 Years | 24 (47.1%) | 5 (20.8%) |
| 60 to 64 Years | 9 (81.8%) | 0 (0.0%) |
| 65 to 74 Years | 2 (11.1%) | 0 (0.0%) |
| 75 Years and over | 0 (0.0%) | 0 (0.0%) |
| Total | 166 (57.0%) | 40 (24.1%) |
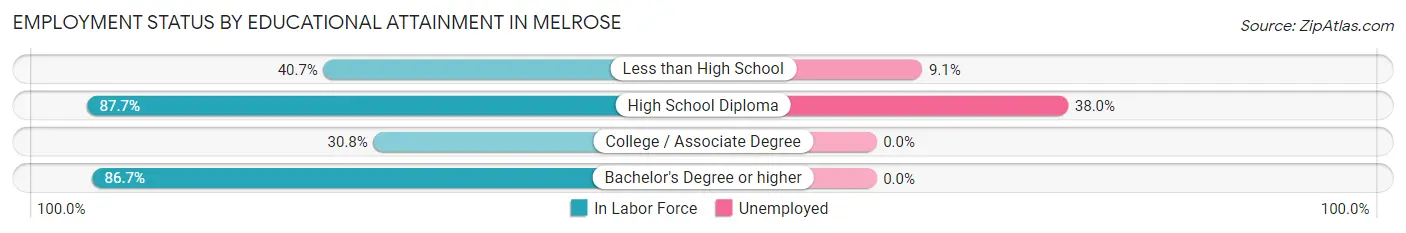
Employment Status by Educational Attainment in Melrose
According to labor force statistics for Melrose, 66.2% of individuals (147) out of the total population between 25 and 64 years of age (222) are in the labor force, with 27.2% or 40 of them being unemployed. The group with the highest labor force participation rate are those with the educational attainment of high school diploma, with 87.7% or 100 individuals in the labor force. Within the labor force, individuals with high school diploma education have the highest percentage of unemployment, with 38.0% or 38 of them being unemployed.
| Educational Attainment | In Labor Force | Unemployed |
| Less than High School | 22 (40.7%) | 5 (9.1%) |
| High School Diploma | 100 (87.7%) | 43 (38.0%) |
| College / Associate Degree | 12 (30.8%) | 0 (0.0%) |
| Bachelor's Degree or higher | 13 (86.7%) | 0 (0.0%) |
| Total | 147 (66.2%) | 60 (27.2%) |
Employment Occupations by Sex in Melrose
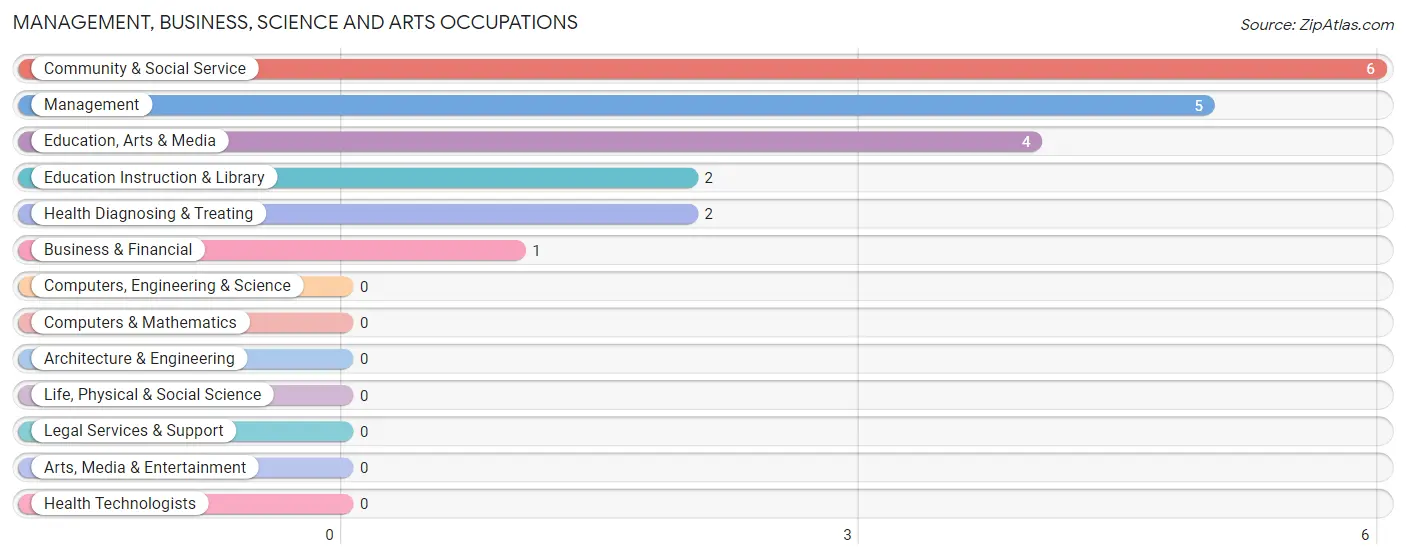
Management, Business, Science and Arts Occupations
The most common Management, Business, Science and Arts occupations in Melrose are Community & Social Service (6 | 4.8%), Management (5 | 4.0%), Education, Arts & Media (4 | 3.2%), Education Instruction & Library (2 | 1.6%), and Health Diagnosing & Treating (2 | 1.6%).
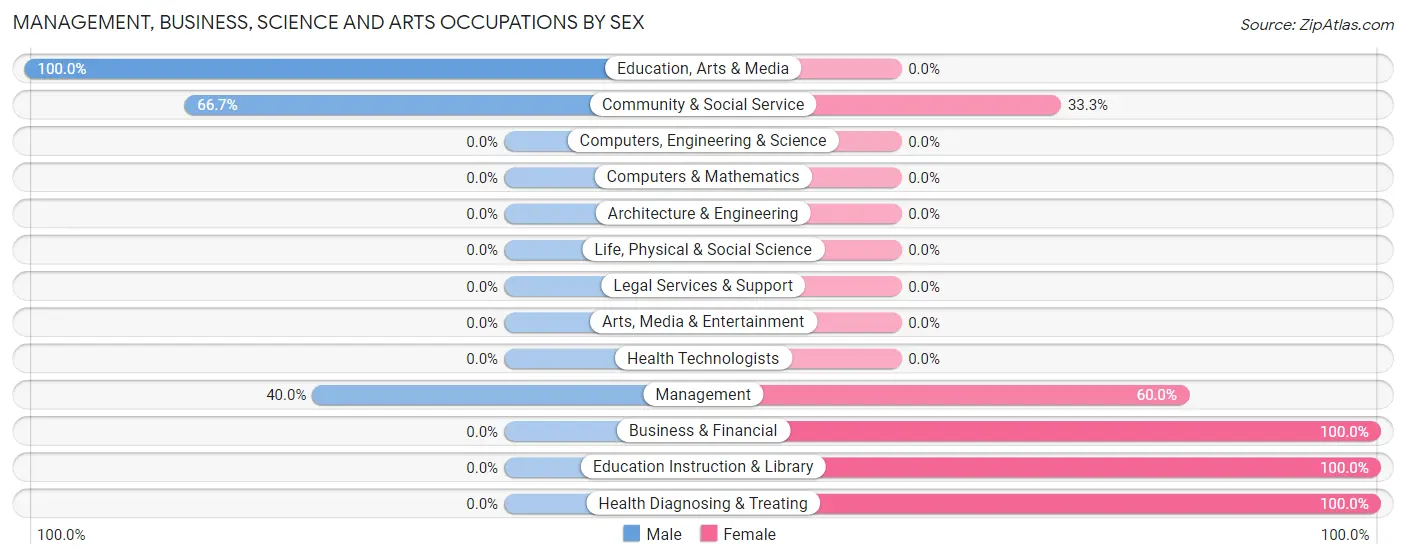
Management, Business, Science and Arts Occupations by Sex
Within the Management, Business, Science and Arts occupations in Melrose, the most male-oriented occupations are Education, Arts & Media (100.0%), Community & Social Service (66.7%), and Management (40.0%), while the most female-oriented occupations are Business & Financial (100.0%), Education Instruction & Library (100.0%), and Health Diagnosing & Treating (100.0%).
| Occupation | Male | Female |
| Management | 2 (40.0%) | 3 (60.0%) |
| Business & Financial | 0 (0.0%) | 1 (100.0%) |
| Computers, Engineering & Science | 0 (0.0%) | 0 (0.0%) |
| Computers & Mathematics | 0 (0.0%) | 0 (0.0%) |
| Architecture & Engineering | 0 (0.0%) | 0 (0.0%) |
| Life, Physical & Social Science | 0 (0.0%) | 0 (0.0%) |
| Community & Social Service | 4 (66.7%) | 2 (33.3%) |
| Education, Arts & Media | 4 (100.0%) | 0 (0.0%) |
| Legal Services & Support | 0 (0.0%) | 0 (0.0%) |
| Education Instruction & Library | 0 (0.0%) | 2 (100.0%) |
| Arts, Media & Entertainment | 0 (0.0%) | 0 (0.0%) |
| Health Diagnosing & Treating | 0 (0.0%) | 2 (100.0%) |
| Health Technologists | 0 (0.0%) | 0 (0.0%) |
| Total (Category) | 6 (42.9%) | 8 (57.1%) |
| Total (Overall) | 54 (42.9%) | 72 (57.1%) |
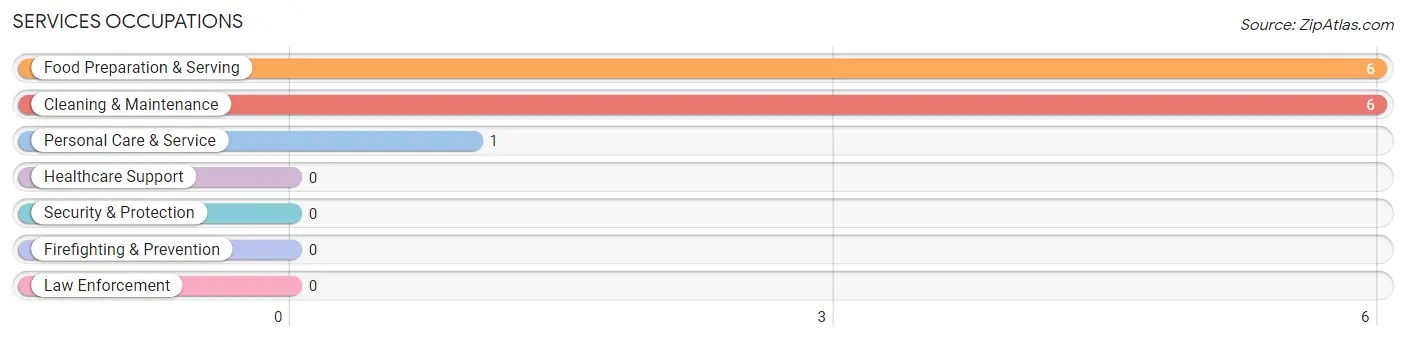
Services Occupations
The most common Services occupations in Melrose are Food Preparation & Serving (6 | 4.8%), Cleaning & Maintenance (6 | 4.8%), and Personal Care & Service (1 | 0.8%).
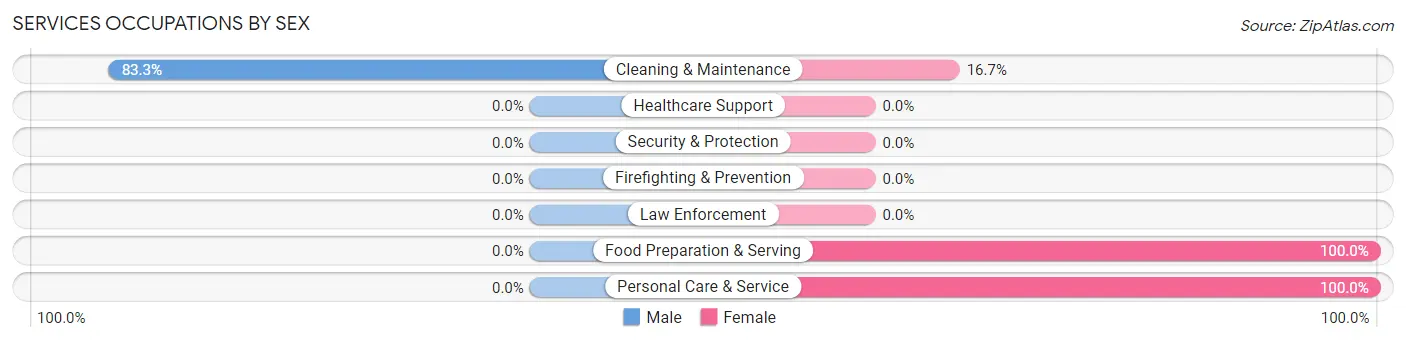
Services Occupations by Sex
| Occupation | Male | Female |
| Healthcare Support | 0 (0.0%) | 0 (0.0%) |
| Security & Protection | 0 (0.0%) | 0 (0.0%) |
| Firefighting & Prevention | 0 (0.0%) | 0 (0.0%) |
| Law Enforcement | 0 (0.0%) | 0 (0.0%) |
| Food Preparation & Serving | 0 (0.0%) | 6 (100.0%) |
| Cleaning & Maintenance | 5 (83.3%) | 1 (16.7%) |
| Personal Care & Service | 0 (0.0%) | 1 (100.0%) |
| Total (Category) | 5 (38.5%) | 8 (61.5%) |
| Total (Overall) | 54 (42.9%) | 72 (57.1%) |
Sales and Office Occupations
The most common Sales and Office occupations in Melrose are Sales & Related (5 | 4.0%), and Office & Administration (4 | 3.2%).
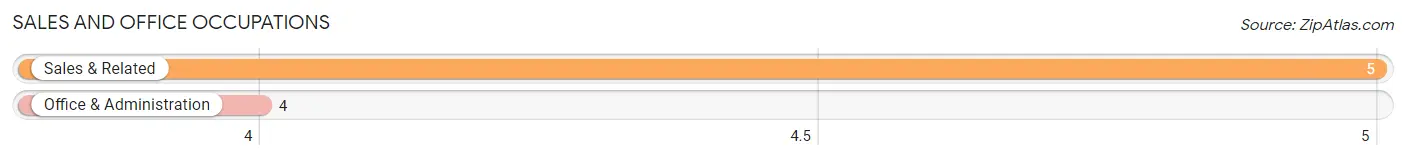
Sales and Office Occupations by Sex

| Occupation | Male | Female |
| Sales & Related | 2 (40.0%) | 3 (60.0%) |
| Office & Administration | 0 (0.0%) | 4 (100.0%) |
| Total (Category) | 2 (22.2%) | 7 (77.8%) |
| Total (Overall) | 54 (42.9%) | 72 (57.1%) |
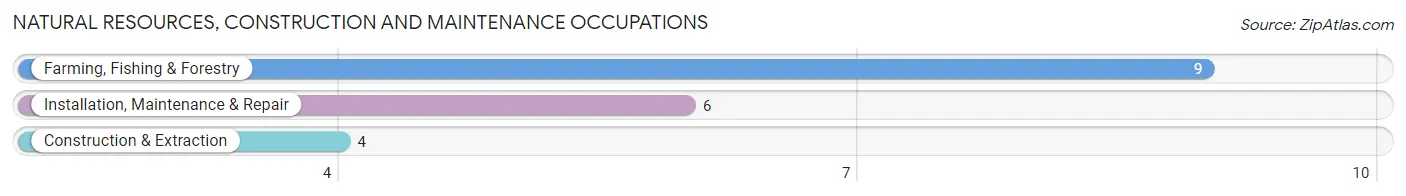
Natural Resources, Construction and Maintenance Occupations
The most common Natural Resources, Construction and Maintenance occupations in Melrose are Farming, Fishing & Forestry (9 | 7.1%), Installation, Maintenance & Repair (6 | 4.8%), and Construction & Extraction (4 | 3.2%).
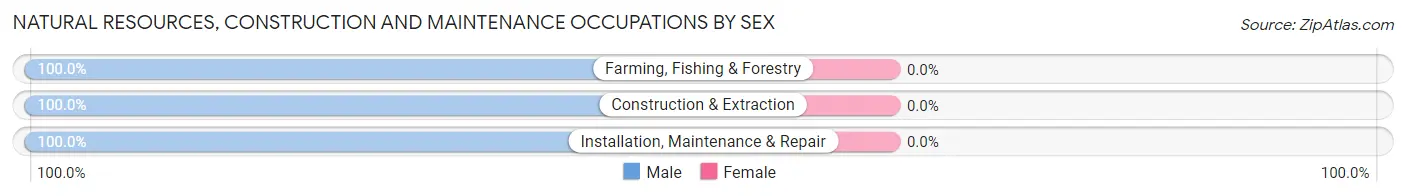
Natural Resources, Construction and Maintenance Occupations by Sex
| Occupation | Male | Female |
| Farming, Fishing & Forestry | 9 (100.0%) | 0 (0.0%) |
| Construction & Extraction | 4 (100.0%) | 0 (0.0%) |
| Installation, Maintenance & Repair | 6 (100.0%) | 0 (0.0%) |
| Total (Category) | 19 (100.0%) | 0 (0.0%) |
| Total (Overall) | 54 (42.9%) | 72 (57.1%) |
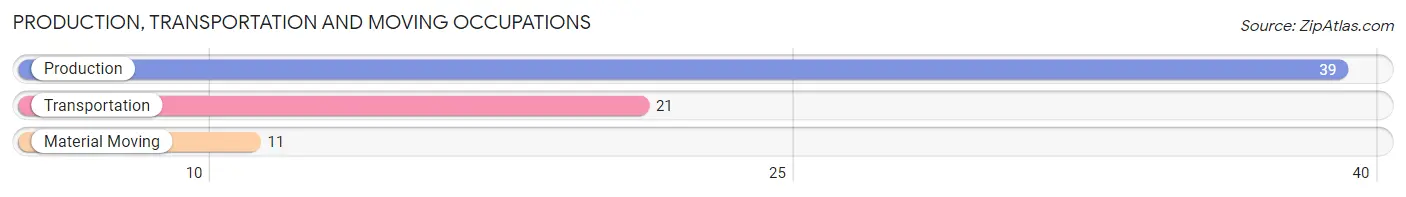
Production, Transportation and Moving Occupations
The most common Production, Transportation and Moving occupations in Melrose are Production (39 | 30.9%), Transportation (21 | 16.7%), and Material Moving (11 | 8.7%).
Production, Transportation and Moving Occupations by Sex
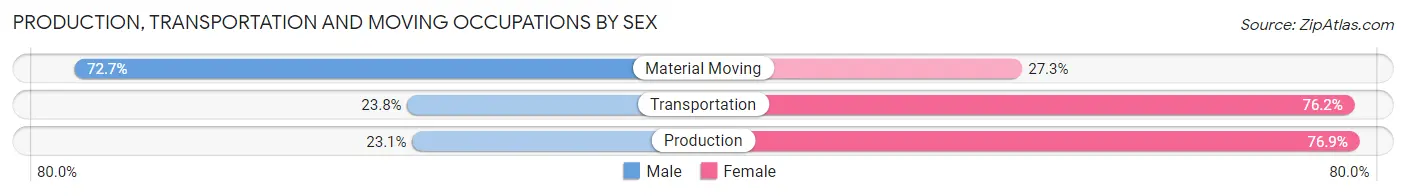
| Occupation | Male | Female |
| Production | 9 (23.1%) | 30 (76.9%) |
| Transportation | 5 (23.8%) | 16 (76.2%) |
| Material Moving | 8 (72.7%) | 3 (27.3%) |
| Total (Category) | 22 (31.0%) | 49 (69.0%) |
| Total (Overall) | 54 (42.9%) | 72 (57.1%) |
Employment Industries by Sex in Melrose
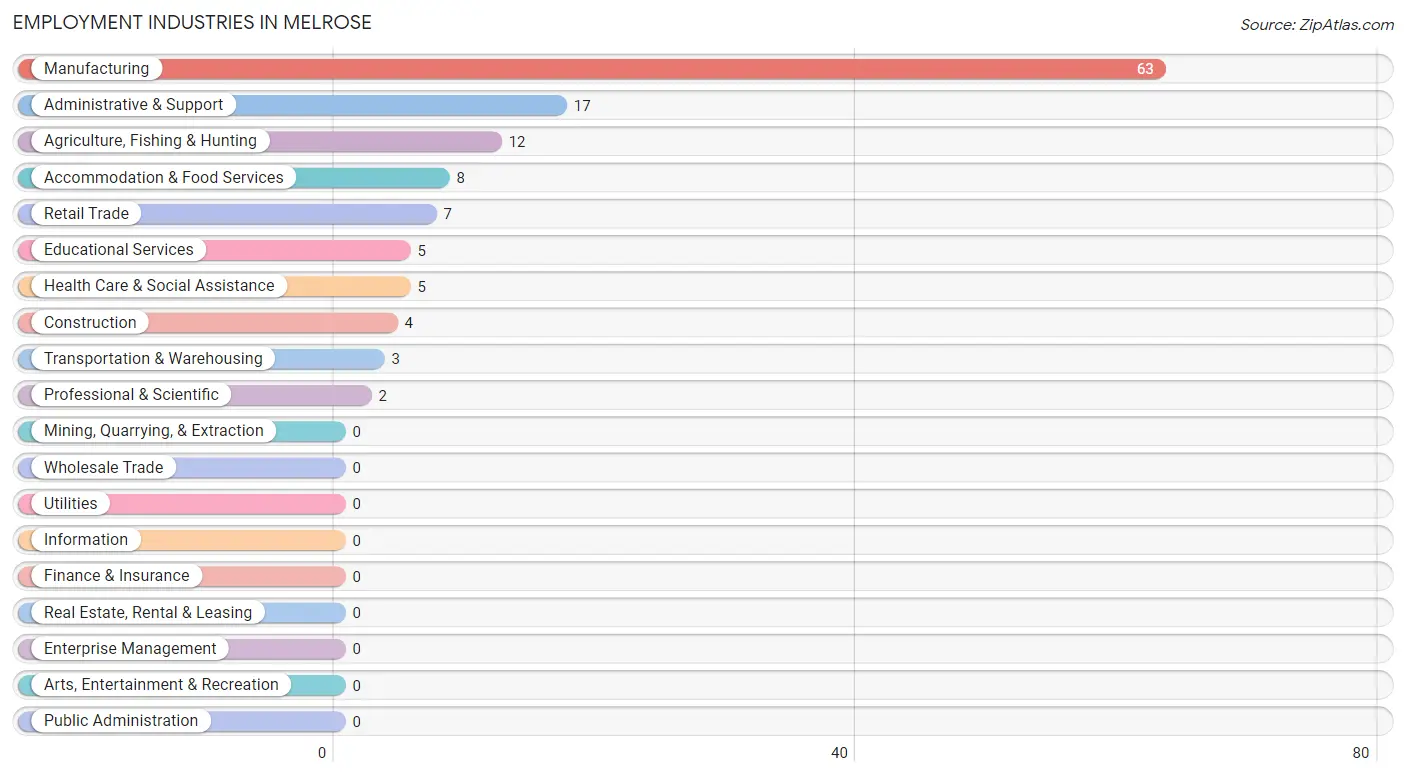
Employment Industries in Melrose
The major employment industries in Melrose include Manufacturing (63 | 50.0%), Administrative & Support (17 | 13.5%), Agriculture, Fishing & Hunting (12 | 9.5%), Accommodation & Food Services (8 | 6.4%), and Retail Trade (7 | 5.6%).
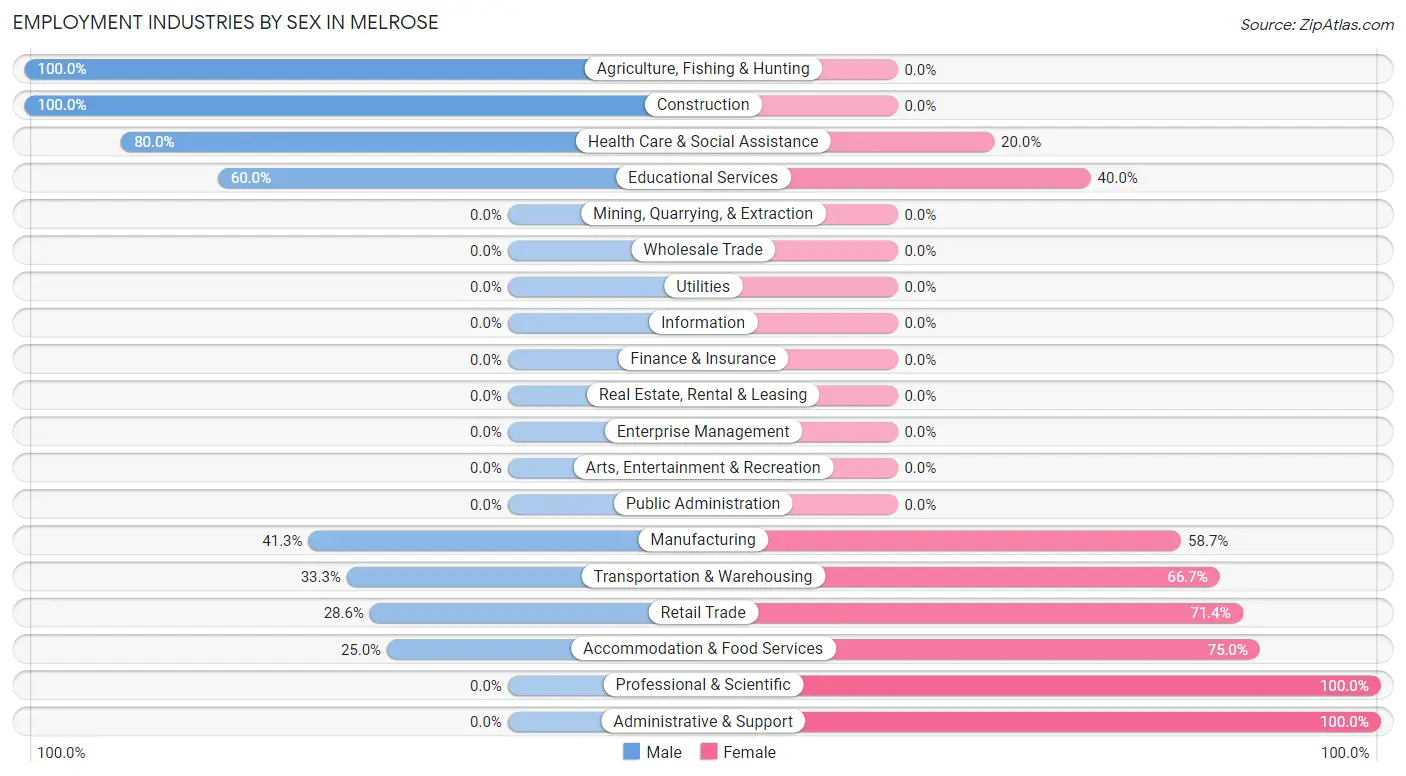
Employment Industries by Sex in Melrose
The Melrose industries that see more men than women are Agriculture, Fishing & Hunting (100.0%), Construction (100.0%), and Health Care & Social Assistance (80.0%), whereas the industries that tend to have a higher number of women are Professional & Scientific (100.0%), Administrative & Support (100.0%), and Accommodation & Food Services (75.0%).
| Industry | Male | Female |
| Agriculture, Fishing & Hunting | 12 (100.0%) | 0 (0.0%) |
| Mining, Quarrying, & Extraction | 0 (0.0%) | 0 (0.0%) |
| Construction | 4 (100.0%) | 0 (0.0%) |
| Manufacturing | 26 (41.3%) | 37 (58.7%) |
| Wholesale Trade | 0 (0.0%) | 0 (0.0%) |
| Retail Trade | 2 (28.6%) | 5 (71.4%) |
| Transportation & Warehousing | 1 (33.3%) | 2 (66.7%) |
| Utilities | 0 (0.0%) | 0 (0.0%) |
| Information | 0 (0.0%) | 0 (0.0%) |
| Finance & Insurance | 0 (0.0%) | 0 (0.0%) |
| Real Estate, Rental & Leasing | 0 (0.0%) | 0 (0.0%) |
| Professional & Scientific | 0 (0.0%) | 2 (100.0%) |
| Enterprise Management | 0 (0.0%) | 0 (0.0%) |
| Administrative & Support | 0 (0.0%) | 17 (100.0%) |
| Educational Services | 3 (60.0%) | 2 (40.0%) |
| Health Care & Social Assistance | 4 (80.0%) | 1 (20.0%) |
| Arts, Entertainment & Recreation | 0 (0.0%) | 0 (0.0%) |
| Accommodation & Food Services | 2 (25.0%) | 6 (75.0%) |
| Public Administration | 0 (0.0%) | 0 (0.0%) |
| Total | 54 (42.9%) | 72 (57.1%) |
Education in Melrose
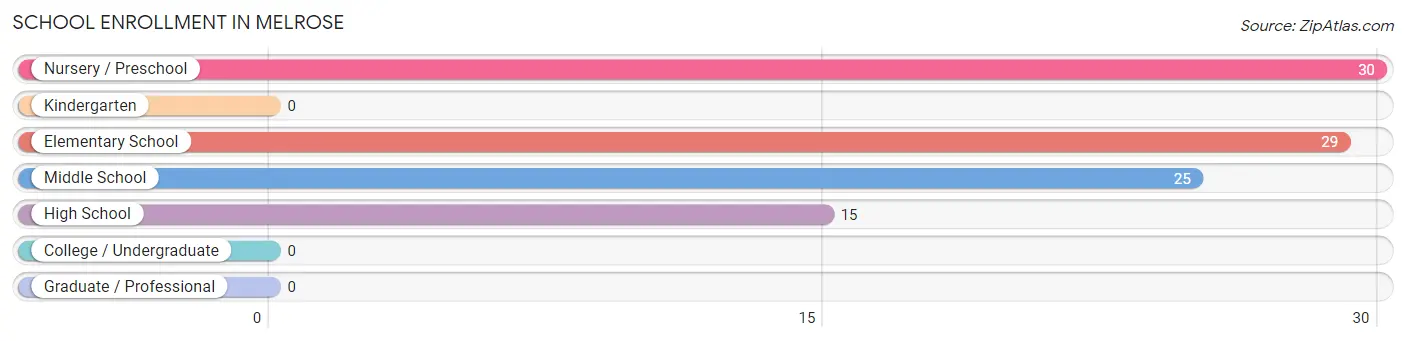
School Enrollment in Melrose
The most common levels of schooling among the 99 students in Melrose are nursery / preschool (30 | 30.3%), elementary school (29 | 29.3%), and middle school (25 | 25.3%).
| School Level | # Students | % Students |
| Nursery / Preschool | 30 | 30.3% |
| Kindergarten | 0 | 0.0% |
| Elementary School | 29 | 29.3% |
| Middle School | 25 | 25.3% |
| High School | 15 | 15.1% |
| College / Undergraduate | 0 | 0.0% |
| Graduate / Professional | 0 | 0.0% |
| Total | 99 | 100.0% |
School Enrollment by Age by Funding Source in Melrose
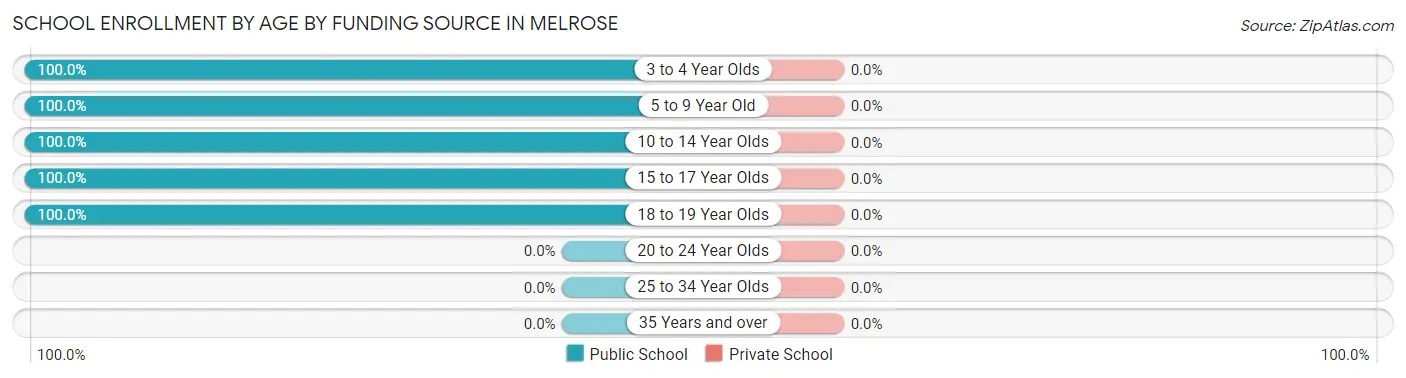
| Age Bracket | Public School | Private School |
| 3 to 4 Year Olds | 20 (100.0%) | 0 (0.0%) |
| 5 to 9 Year Old | 39 (100.0%) | 0 (0.0%) |
| 10 to 14 Year Olds | 25 (100.0%) | 0 (0.0%) |
| 15 to 17 Year Olds | 12 (100.0%) | 0 (0.0%) |
| 18 to 19 Year Olds | 3 (100.0%) | 0 (0.0%) |
| 20 to 24 Year Olds | 0 (0.0%) | 0 (0.0%) |
| 25 to 34 Year Olds | 0 (0.0%) | 0 (0.0%) |
| 35 Years and over | 0 (0.0%) | 0 (0.0%) |
| Total | 99 (100.0%) | 0 (0.0%) |
Educational Attainment by Field of Study in Melrose
Business (7 | 46.7%), arts & humanities (4 | 26.7%), education (2 | 13.3%), and visual & performing arts (2 | 13.3%) are the most common fields of study among 15 individuals in Melrose who have obtained a bachelor's degree or higher.
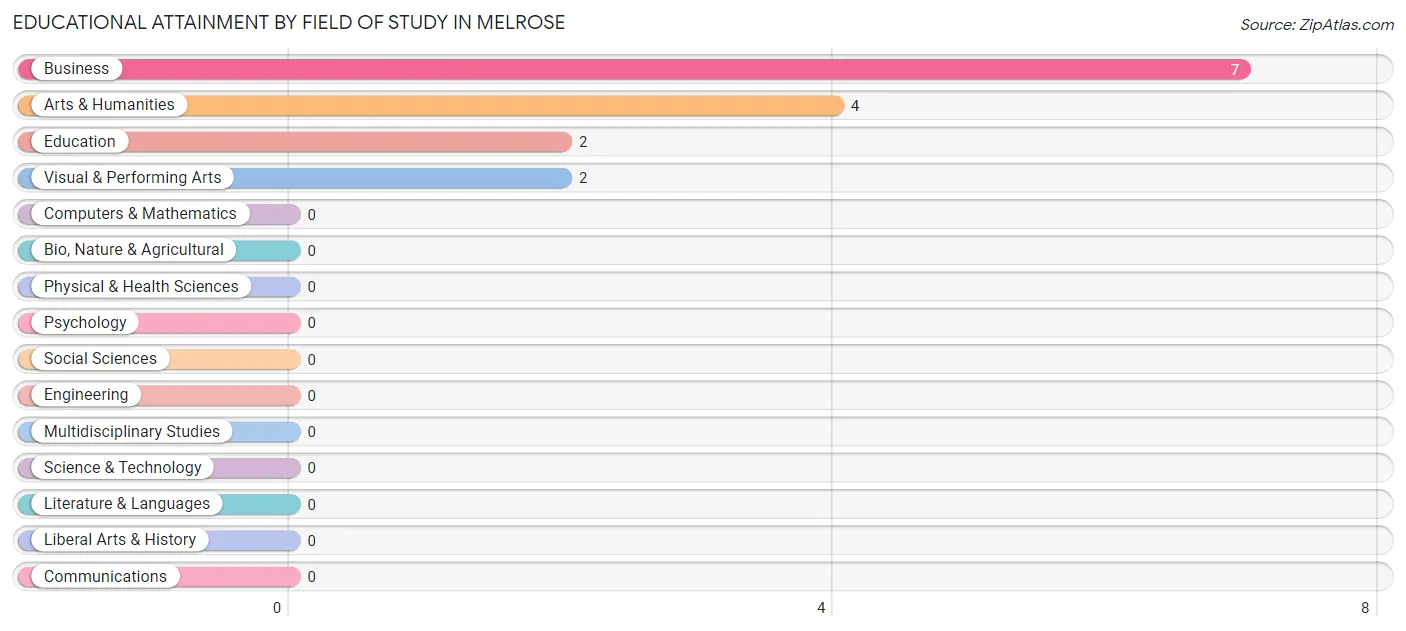
| Field of Study | # Graduates | % Graduates |
| Computers & Mathematics | 0 | 0.0% |
| Bio, Nature & Agricultural | 0 | 0.0% |
| Physical & Health Sciences | 0 | 0.0% |
| Psychology | 0 | 0.0% |
| Social Sciences | 0 | 0.0% |
| Engineering | 0 | 0.0% |
| Multidisciplinary Studies | 0 | 0.0% |
| Science & Technology | 0 | 0.0% |
| Business | 7 | 46.7% |
| Education | 2 | 13.3% |
| Literature & Languages | 0 | 0.0% |
| Liberal Arts & History | 0 | 0.0% |
| Visual & Performing Arts | 2 | 13.3% |
| Communications | 0 | 0.0% |
| Arts & Humanities | 4 | 26.7% |
| Total | 15 | 100.0% |
Transportation & Commute in Melrose
Vehicle Availability by Sex in Melrose
The most prevalent vehicle ownership categories in Melrose are males with 2 vehicles (16, accounting for 29.6%) and females with 2 vehicles (11, making up 22.2%).
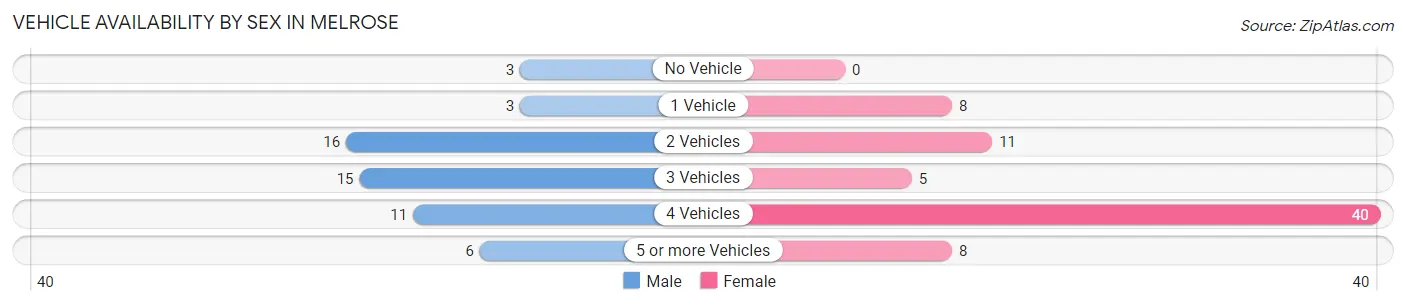
| Vehicles Available | Male | Female |
| No Vehicle | 3 (5.6%) | 0 (0.0%) |
| 1 Vehicle | 3 (5.6%) | 8 (11.1%) |
| 2 Vehicles | 16 (29.6%) | 11 (15.3%) |
| 3 Vehicles | 15 (27.8%) | 5 (6.9%) |
| 4 Vehicles | 11 (20.4%) | 40 (55.6%) |
| 5 or more Vehicles | 6 (11.1%) | 8 (11.1%) |
| Total | 54 (100.0%) | 72 (100.0%) |
Commute Time in Melrose
The most frequently occuring commute durations in Melrose are 15 to 19 minutes (30 commuters, 23.8%), 20 to 24 minutes (20 commuters, 15.9%), and less than 5 minutes (16 commuters, 12.7%).
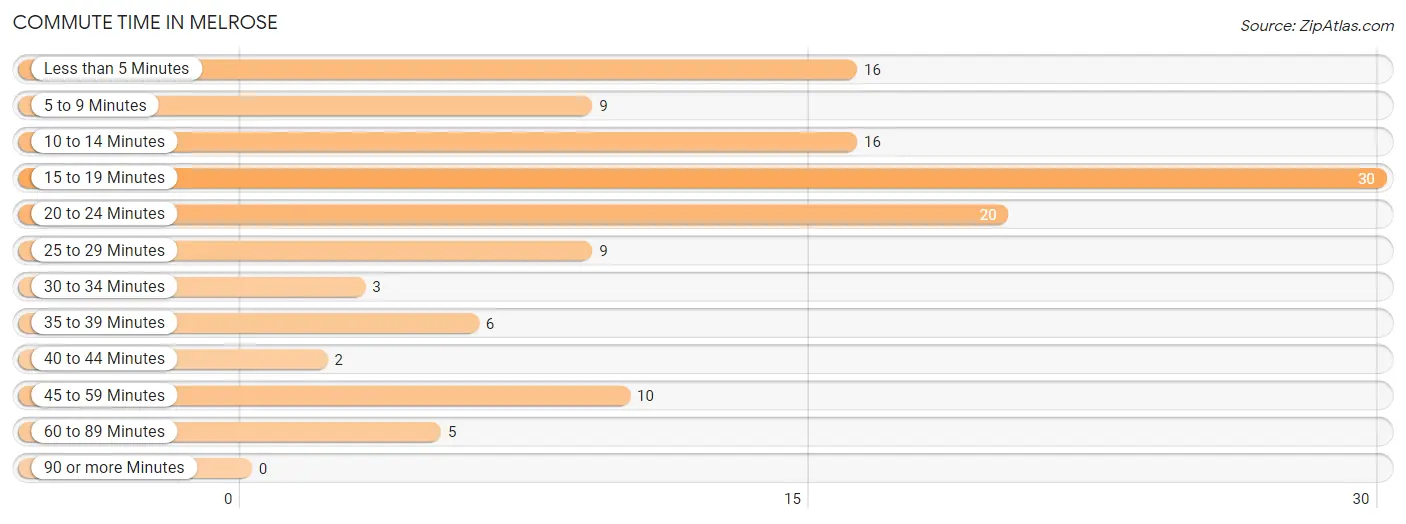
| Commute Time | # Commuters | % Commuters |
| Less than 5 Minutes | 16 | 12.7% |
| 5 to 9 Minutes | 9 | 7.1% |
| 10 to 14 Minutes | 16 | 12.7% |
| 15 to 19 Minutes | 30 | 23.8% |
| 20 to 24 Minutes | 20 | 15.9% |
| 25 to 29 Minutes | 9 | 7.1% |
| 30 to 34 Minutes | 3 | 2.4% |
| 35 to 39 Minutes | 6 | 4.8% |
| 40 to 44 Minutes | 2 | 1.6% |
| 45 to 59 Minutes | 10 | 7.9% |
| 60 to 89 Minutes | 5 | 4.0% |
| 90 or more Minutes | 0 | 0.0% |
Commute Time by Sex in Melrose
The most common commute times in Melrose are 15 to 19 minutes (12 commuters, 22.2%) for males and 15 to 19 minutes (18 commuters, 25.0%) for females.
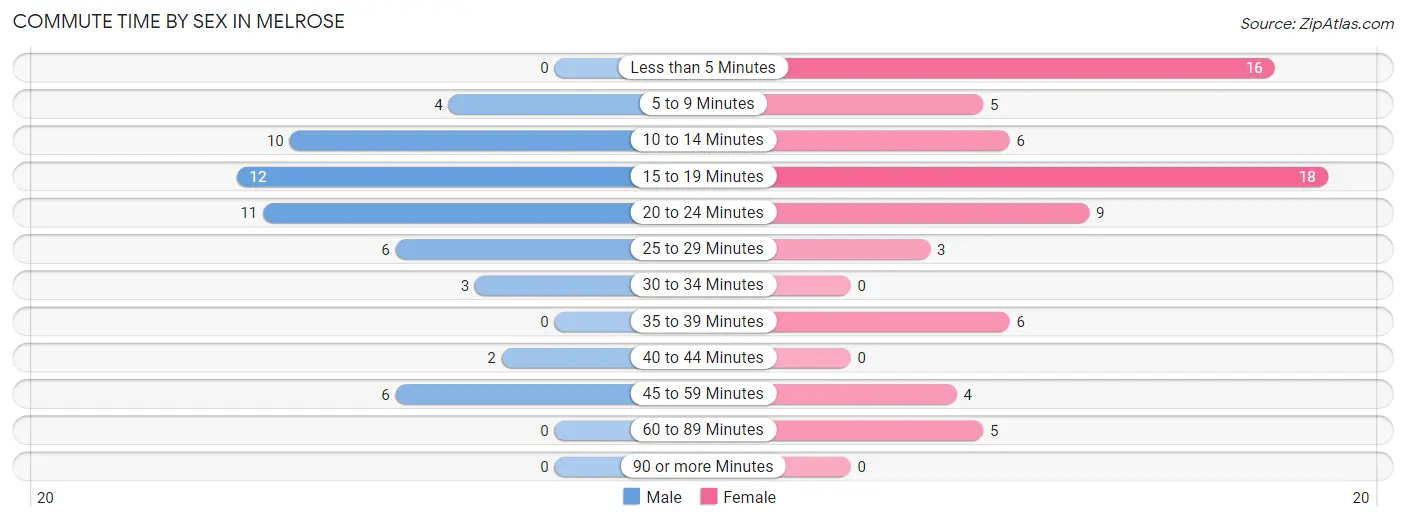
| Commute Time | Male | Female |
| Less than 5 Minutes | 0 (0.0%) | 16 (22.2%) |
| 5 to 9 Minutes | 4 (7.4%) | 5 (6.9%) |
| 10 to 14 Minutes | 10 (18.5%) | 6 (8.3%) |
| 15 to 19 Minutes | 12 (22.2%) | 18 (25.0%) |
| 20 to 24 Minutes | 11 (20.4%) | 9 (12.5%) |
| 25 to 29 Minutes | 6 (11.1%) | 3 (4.2%) |
| 30 to 34 Minutes | 3 (5.6%) | 0 (0.0%) |
| 35 to 39 Minutes | 0 (0.0%) | 6 (8.3%) |
| 40 to 44 Minutes | 2 (3.7%) | 0 (0.0%) |
| 45 to 59 Minutes | 6 (11.1%) | 4 (5.6%) |
| 60 to 89 Minutes | 0 (0.0%) | 5 (6.9%) |
| 90 or more Minutes | 0 (0.0%) | 0 (0.0%) |
Time of Departure to Work by Sex in Melrose
The most frequent times of departure to work in Melrose are 12:00 AM to 4:59 AM (18, 33.3%) for males and 5:30 AM to 5:59 AM (32, 44.4%) for females.
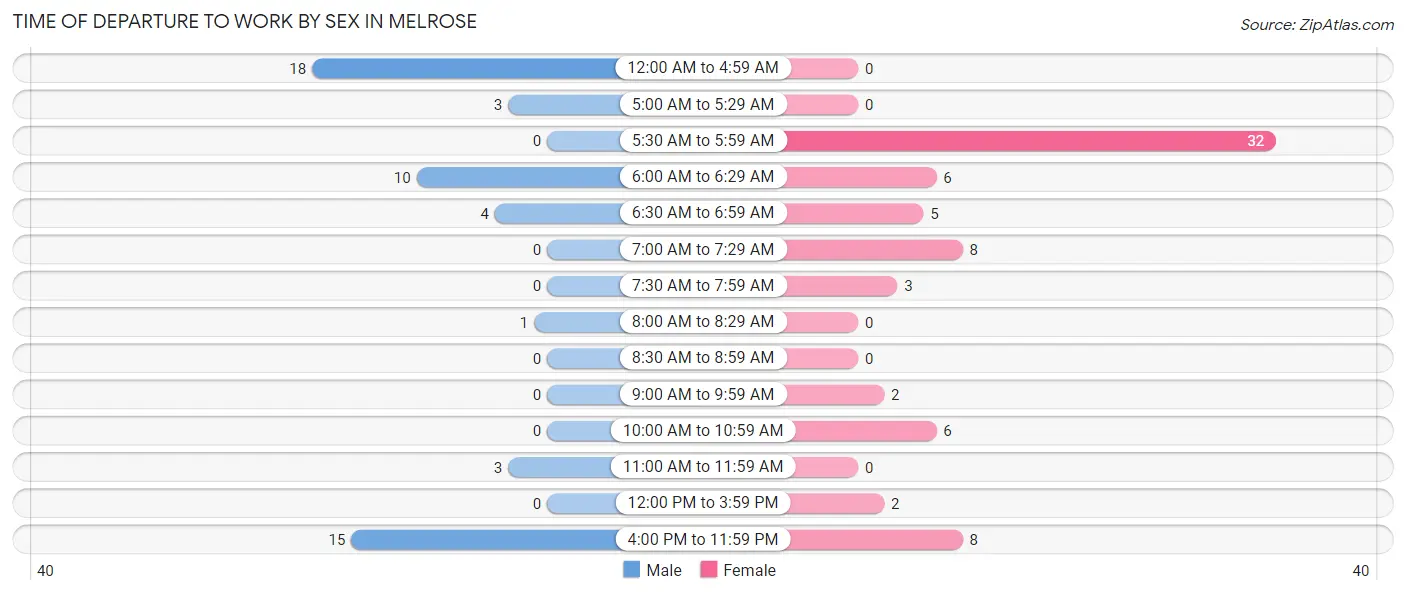
| Time of Departure | Male | Female |
| 12:00 AM to 4:59 AM | 18 (33.3%) | 0 (0.0%) |
| 5:00 AM to 5:29 AM | 3 (5.6%) | 0 (0.0%) |
| 5:30 AM to 5:59 AM | 0 (0.0%) | 32 (44.4%) |
| 6:00 AM to 6:29 AM | 10 (18.5%) | 6 (8.3%) |
| 6:30 AM to 6:59 AM | 4 (7.4%) | 5 (6.9%) |
| 7:00 AM to 7:29 AM | 0 (0.0%) | 8 (11.1%) |
| 7:30 AM to 7:59 AM | 0 (0.0%) | 3 (4.2%) |
| 8:00 AM to 8:29 AM | 1 (1.8%) | 0 (0.0%) |
| 8:30 AM to 8:59 AM | 0 (0.0%) | 0 (0.0%) |
| 9:00 AM to 9:59 AM | 0 (0.0%) | 2 (2.8%) |
| 10:00 AM to 10:59 AM | 0 (0.0%) | 6 (8.3%) |
| 11:00 AM to 11:59 AM | 3 (5.6%) | 0 (0.0%) |
| 12:00 PM to 3:59 PM | 0 (0.0%) | 2 (2.8%) |
| 4:00 PM to 11:59 PM | 15 (27.8%) | 8 (11.1%) |
| Total | 54 (100.0%) | 72 (100.0%) |
Housing Occupancy in Melrose
Occupancy by Ownership in Melrose
Of the total 133 dwellings in Melrose, owner-occupied units account for 125 (94.0%), while renter-occupied units make up 8 (6.0%).
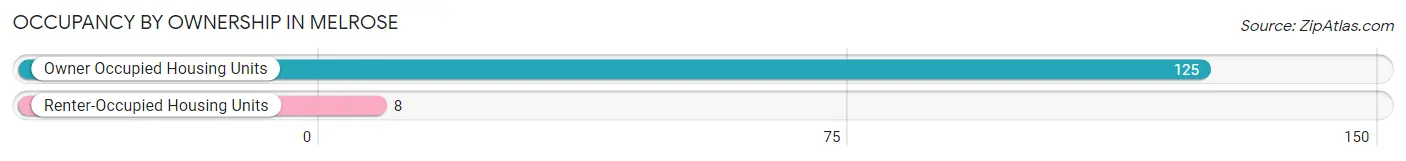
| Occupancy | # Housing Units | % Housing Units |
| Owner Occupied Housing Units | 125 | 94.0% |
| Renter-Occupied Housing Units | 8 | 6.0% |
| Total Occupied Housing Units | 133 | 100.0% |
Occupancy by Household Size in Melrose
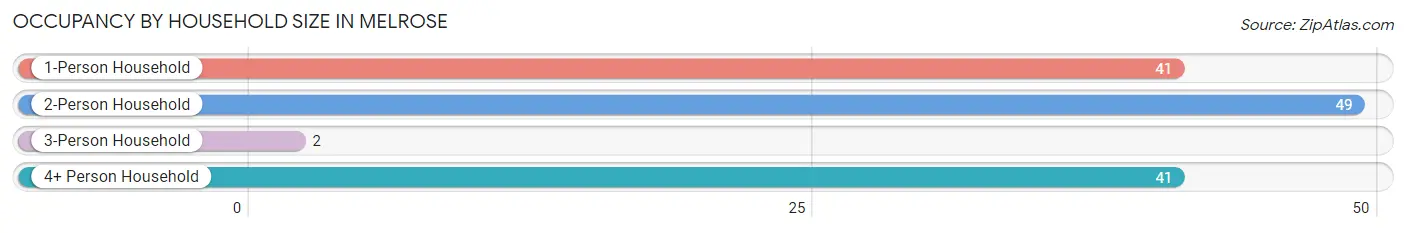
| Household Size | # Housing Units | % Housing Units |
| 1-Person Household | 41 | 30.8% |
| 2-Person Household | 49 | 36.8% |
| 3-Person Household | 2 | 1.5% |
| 4+ Person Household | 41 | 30.8% |
| Total Housing Units | 133 | 100.0% |
Occupancy by Ownership by Household Size in Melrose
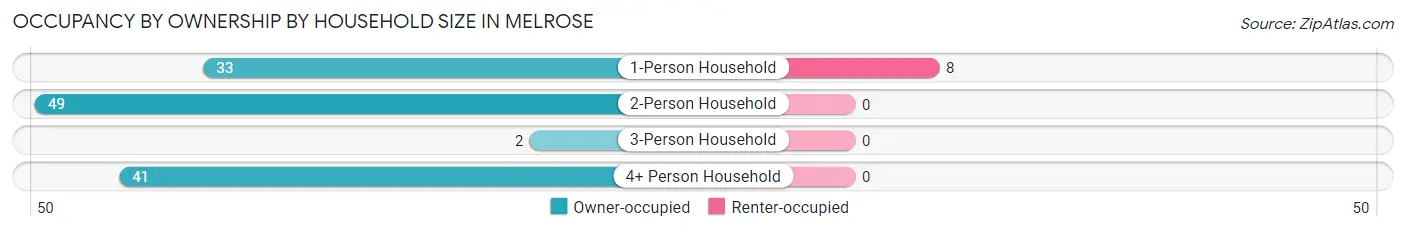
| Household Size | Owner-occupied | Renter-occupied |
| 1-Person Household | 33 (80.5%) | 8 (19.5%) |
| 2-Person Household | 49 (100.0%) | 0 (0.0%) |
| 3-Person Household | 2 (100.0%) | 0 (0.0%) |
| 4+ Person Household | 41 (100.0%) | 0 (0.0%) |
| Total Housing Units | 125 (94.0%) | 8 (6.0%) |
Occupancy by Educational Attainment in Melrose
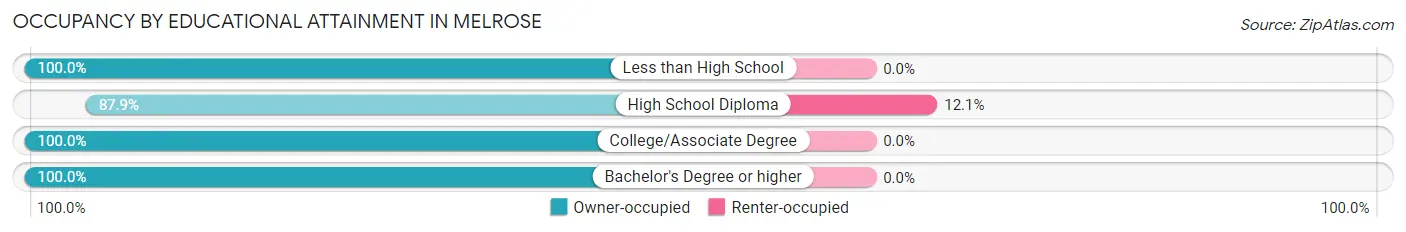
| Household Size | Owner-occupied | Renter-occupied |
| Less than High School | 31 (100.0%) | 0 (0.0%) |
| High School Diploma | 58 (87.9%) | 8 (12.1%) |
| College/Associate Degree | 28 (100.0%) | 0 (0.0%) |
| Bachelor's Degree or higher | 8 (100.0%) | 0 (0.0%) |
Occupancy by Age of Householder in Melrose
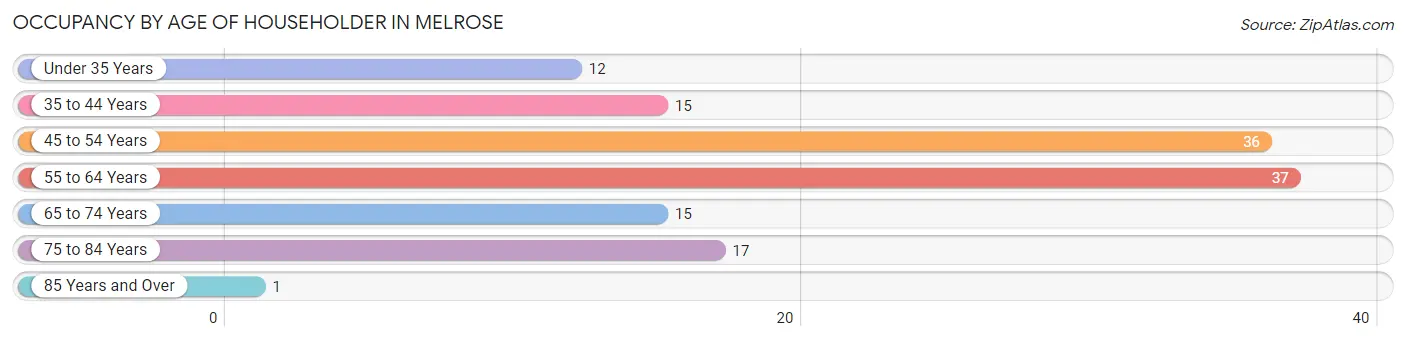
| Age Bracket | # Households | % Households |
| Under 35 Years | 12 | 9.0% |
| 35 to 44 Years | 15 | 11.3% |
| 45 to 54 Years | 36 | 27.1% |
| 55 to 64 Years | 37 | 27.8% |
| 65 to 74 Years | 15 | 11.3% |
| 75 to 84 Years | 17 | 12.8% |
| 85 Years and Over | 1 | 0.7% |
| Total | 133 | 100.0% |
Housing Finances in Melrose
Median Income by Occupancy in Melrose
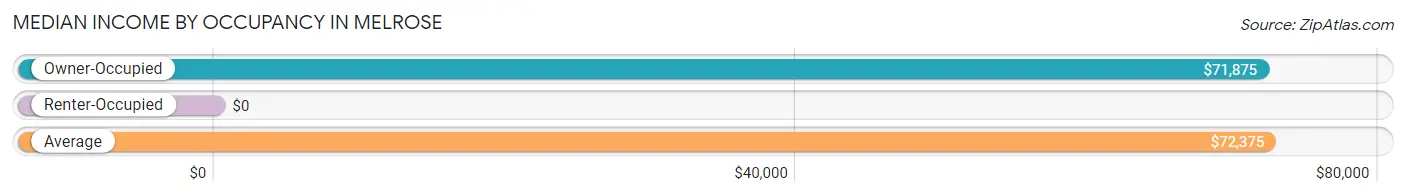
| Occupancy Type | # Households | Median Income |
| Owner-Occupied | 125 (94.0%) | $71,875 |
| Renter-Occupied | 8 (6.0%) | $0 |
| Average | 133 (100.0%) | $72,375 |
Occupancy by Householder Income Bracket in Melrose
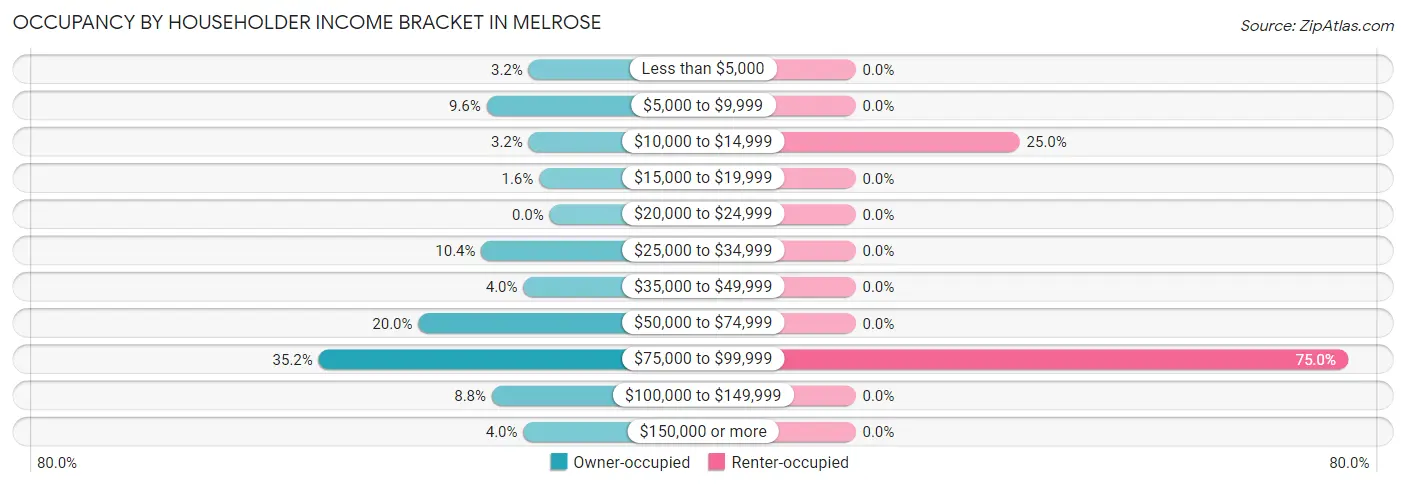
| Income Bracket | Owner-occupied | Renter-occupied |
| Less than $5,000 | 4 (3.2%) | 0 (0.0%) |
| $5,000 to $9,999 | 12 (9.6%) | 0 (0.0%) |
| $10,000 to $14,999 | 4 (3.2%) | 2 (25.0%) |
| $15,000 to $19,999 | 2 (1.6%) | 0 (0.0%) |
| $20,000 to $24,999 | 0 (0.0%) | 0 (0.0%) |
| $25,000 to $34,999 | 13 (10.4%) | 0 (0.0%) |
| $35,000 to $49,999 | 5 (4.0%) | 0 (0.0%) |
| $50,000 to $74,999 | 25 (20.0%) | 0 (0.0%) |
| $75,000 to $99,999 | 44 (35.2%) | 6 (75.0%) |
| $100,000 to $149,999 | 11 (8.8%) | 0 (0.0%) |
| $150,000 or more | 5 (4.0%) | 0 (0.0%) |
| Total | 125 (100.0%) | 8 (100.0%) |
Monthly Housing Cost Tiers in Melrose
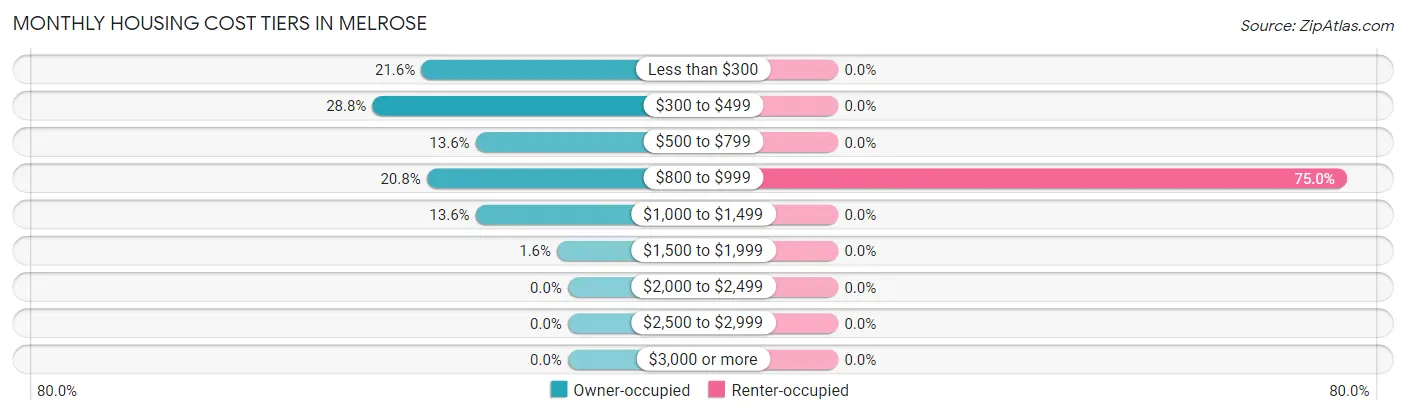
| Monthly Cost | Owner-occupied | Renter-occupied |
| Less than $300 | 27 (21.6%) | 0 (0.0%) |
| $300 to $499 | 36 (28.8%) | 0 (0.0%) |
| $500 to $799 | 17 (13.6%) | 0 (0.0%) |
| $800 to $999 | 26 (20.8%) | 6 (75.0%) |
| $1,000 to $1,499 | 17 (13.6%) | 0 (0.0%) |
| $1,500 to $1,999 | 2 (1.6%) | 0 (0.0%) |
| $2,000 to $2,499 | 0 (0.0%) | 0 (0.0%) |
| $2,500 to $2,999 | 0 (0.0%) | 0 (0.0%) |
| $3,000 or more | 0 (0.0%) | 0 (0.0%) |
| Total | 125 (100.0%) | 8 (100.0%) |
Physical Housing Characteristics in Melrose
Housing Structures in Melrose
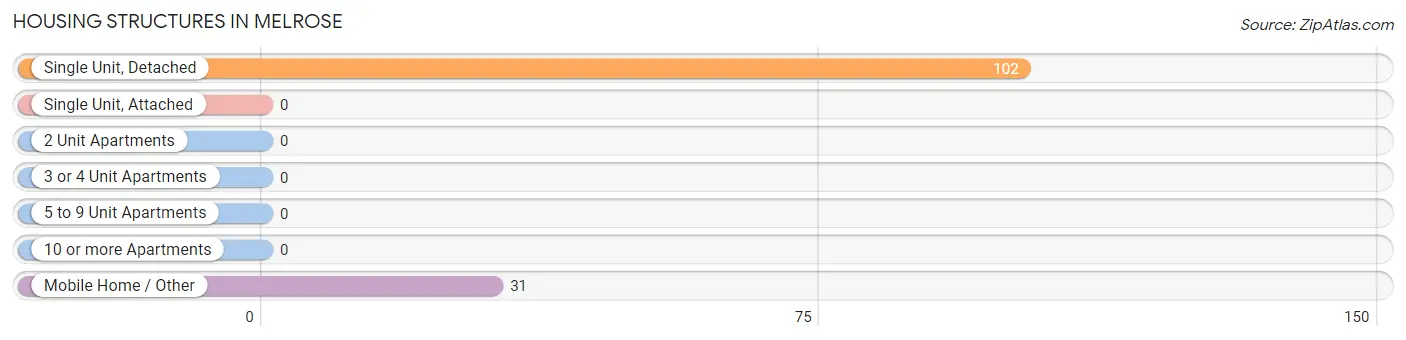
| Structure Type | # Housing Units | % Housing Units |
| Single Unit, Detached | 102 | 76.7% |
| Single Unit, Attached | 0 | 0.0% |
| 2 Unit Apartments | 0 | 0.0% |
| 3 or 4 Unit Apartments | 0 | 0.0% |
| 5 to 9 Unit Apartments | 0 | 0.0% |
| 10 or more Apartments | 0 | 0.0% |
| Mobile Home / Other | 31 | 23.3% |
| Total | 133 | 100.0% |
Housing Structures by Occupancy in Melrose
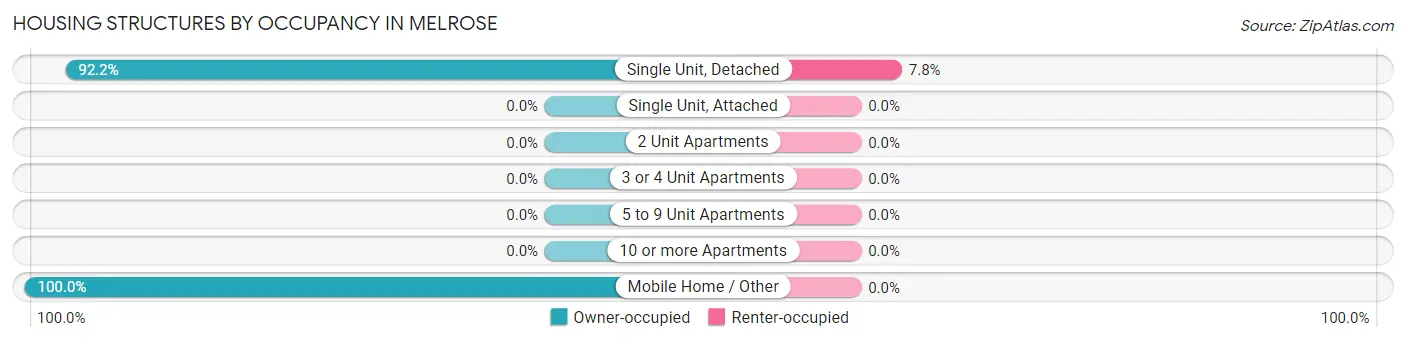
| Structure Type | Owner-occupied | Renter-occupied |
| Single Unit, Detached | 94 (92.2%) | 8 (7.8%) |
| Single Unit, Attached | 0 (0.0%) | 0 (0.0%) |
| 2 Unit Apartments | 0 (0.0%) | 0 (0.0%) |
| 3 or 4 Unit Apartments | 0 (0.0%) | 0 (0.0%) |
| 5 to 9 Unit Apartments | 0 (0.0%) | 0 (0.0%) |
| 10 or more Apartments | 0 (0.0%) | 0 (0.0%) |
| Mobile Home / Other | 31 (100.0%) | 0 (0.0%) |
| Total | 125 (94.0%) | 8 (6.0%) |
Housing Structures by Number of Rooms in Melrose
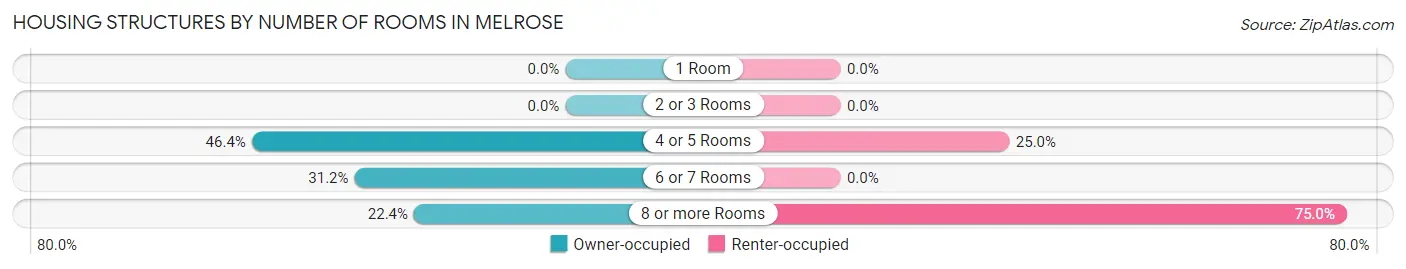
| Number of Rooms | Owner-occupied | Renter-occupied |
| 1 Room | 0 (0.0%) | 0 (0.0%) |
| 2 or 3 Rooms | 0 (0.0%) | 0 (0.0%) |
| 4 or 5 Rooms | 58 (46.4%) | 2 (25.0%) |
| 6 or 7 Rooms | 39 (31.2%) | 0 (0.0%) |
| 8 or more Rooms | 28 (22.4%) | 6 (75.0%) |
| Total | 125 (100.0%) | 8 (100.0%) |
Housing Structure by Heating Type in Melrose
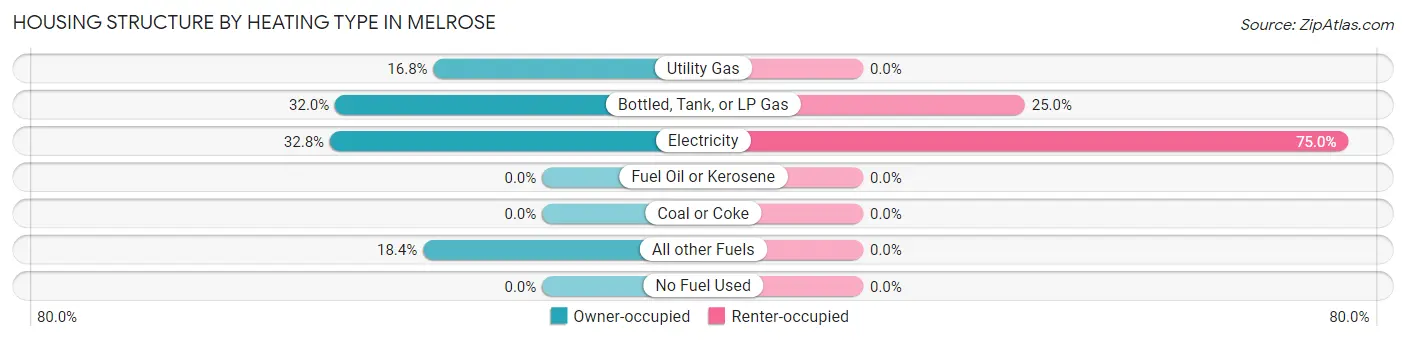
| Heating Type | Owner-occupied | Renter-occupied |
| Utility Gas | 21 (16.8%) | 0 (0.0%) |
| Bottled, Tank, or LP Gas | 40 (32.0%) | 2 (25.0%) |
| Electricity | 41 (32.8%) | 6 (75.0%) |
| Fuel Oil or Kerosene | 0 (0.0%) | 0 (0.0%) |
| Coal or Coke | 0 (0.0%) | 0 (0.0%) |
| All other Fuels | 23 (18.4%) | 0 (0.0%) |
| No Fuel Used | 0 (0.0%) | 0 (0.0%) |
| Total | 125 (100.0%) | 8 (100.0%) |
Household Vehicle Usage in Melrose
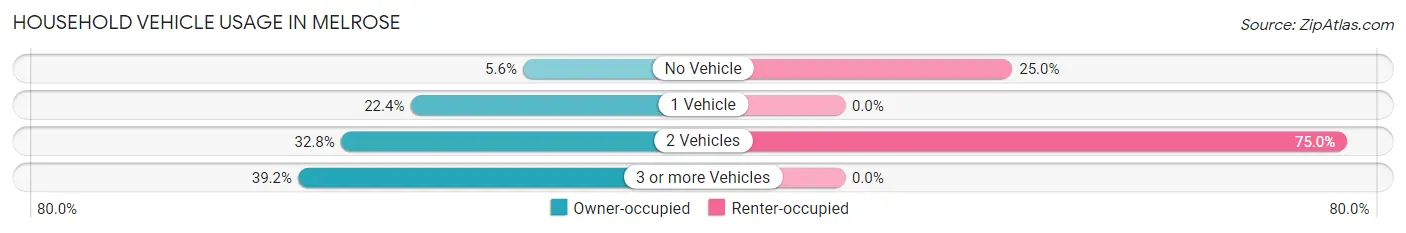
| Vehicles per Household | Owner-occupied | Renter-occupied |
| No Vehicle | 7 (5.6%) | 2 (25.0%) |
| 1 Vehicle | 28 (22.4%) | 0 (0.0%) |
| 2 Vehicles | 41 (32.8%) | 6 (75.0%) |
| 3 or more Vehicles | 49 (39.2%) | 0 (0.0%) |
| Total | 125 (100.0%) | 8 (100.0%) |
Real Estate & Mortgages in Melrose
Real Estate and Mortgage Overview in Melrose
| Characteristic | Without Mortgage | With Mortgage |
| Housing Units | 87 | 38 |
| Median Property Value | $61,700 | $130,000 |
| Median Household Income | $71,563 | $5 |
| Monthly Housing Costs | $420 | $0 |
| Real Estate Taxes | $571 | $0 |
Property Value by Mortgage Status in Melrose
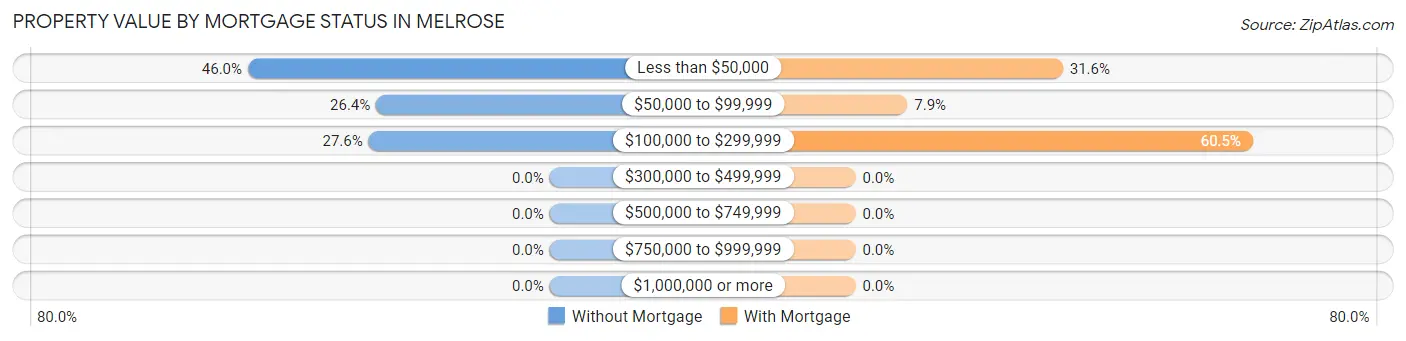
| Property Value | Without Mortgage | With Mortgage |
| Less than $50,000 | 40 (46.0%) | 12 (31.6%) |
| $50,000 to $99,999 | 23 (26.4%) | 3 (7.9%) |
| $100,000 to $299,999 | 24 (27.6%) | 23 (60.5%) |
| $300,000 to $499,999 | 0 (0.0%) | 0 (0.0%) |
| $500,000 to $749,999 | 0 (0.0%) | 0 (0.0%) |
| $750,000 to $999,999 | 0 (0.0%) | 0 (0.0%) |
| $1,000,000 or more | 0 (0.0%) | 0 (0.0%) |
| Total | 87 (100.0%) | 38 (100.0%) |
Household Income by Mortgage Status in Melrose
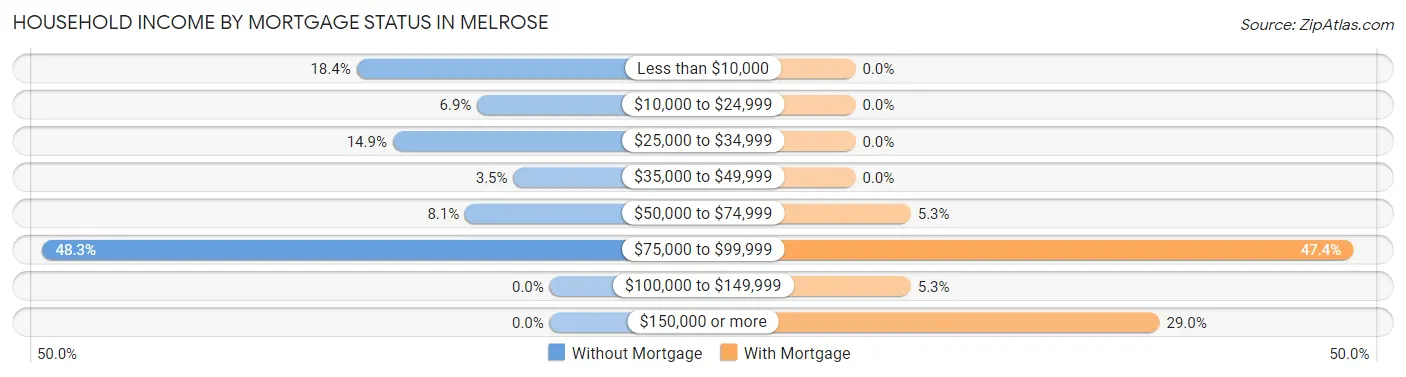
| Household Income | Without Mortgage | With Mortgage |
| Less than $10,000 | 16 (18.4%) | 0 (0.0%) |
| $10,000 to $24,999 | 6 (6.9%) | 0 (0.0%) |
| $25,000 to $34,999 | 13 (14.9%) | 0 (0.0%) |
| $35,000 to $49,999 | 3 (3.5%) | 0 (0.0%) |
| $50,000 to $74,999 | 7 (8.1%) | 2 (5.3%) |
| $75,000 to $99,999 | 42 (48.3%) | 18 (47.4%) |
| $100,000 to $149,999 | 0 (0.0%) | 2 (5.3%) |
| $150,000 or more | 0 (0.0%) | 11 (28.9%) |
| Total | 87 (100.0%) | 38 (100.0%) |
Property Value to Household Income Ratio in Melrose
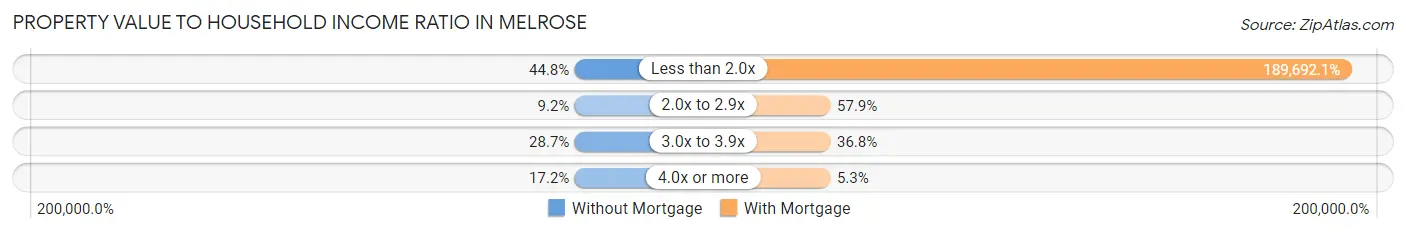
| Value-to-Income Ratio | Without Mortgage | With Mortgage |
| Less than 2.0x | 39 (44.8%) | 72,083 (189,692.1%) |
| 2.0x to 2.9x | 8 (9.2%) | 22 (57.9%) |
| 3.0x to 3.9x | 25 (28.7%) | 14 (36.8%) |
| 4.0x or more | 15 (17.2%) | 2 (5.3%) |
| Total | 87 (100.0%) | 38 (100.0%) |
Real Estate Taxes by Mortgage Status in Melrose
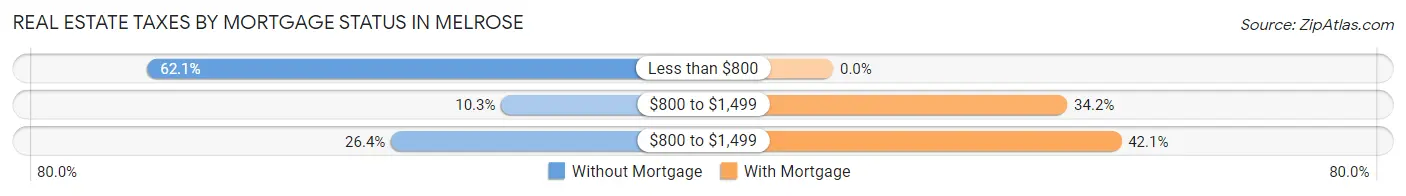
| Property Taxes | Without Mortgage | With Mortgage |
| Less than $800 | 54 (62.1%) | 0 (0.0%) |
| $800 to $1,499 | 9 (10.3%) | 13 (34.2%) |
| $800 to $1,499 | 23 (26.4%) | 16 (42.1%) |
| Total | 87 (100.0%) | 38 (100.0%) |
Health & Disability in Melrose
Health Insurance Coverage by Age in Melrose
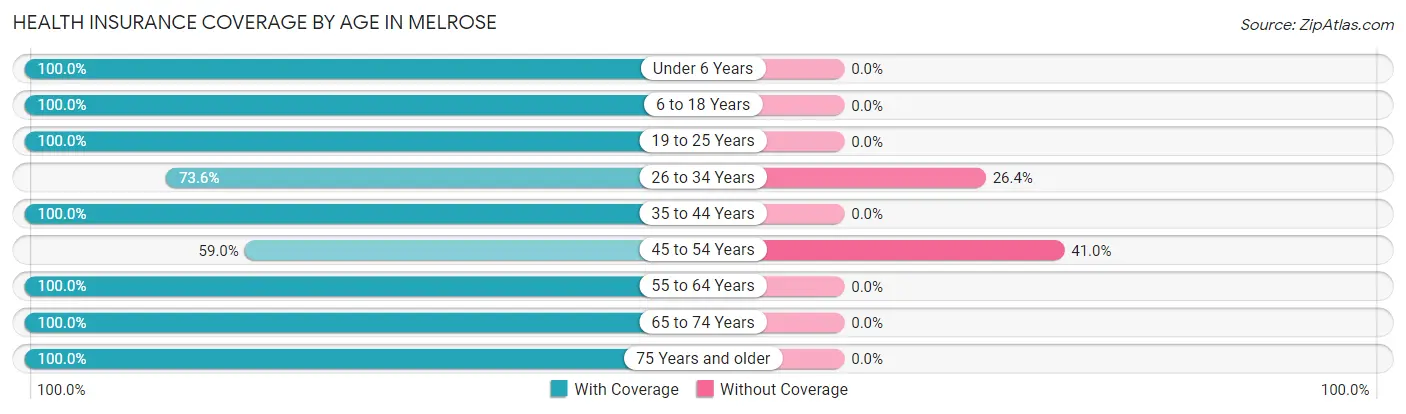
| Age Bracket | With Coverage | Without Coverage |
| Under 6 Years | 41 (100.0%) | 0 (0.0%) |
| 6 to 18 Years | 75 (100.0%) | 0 (0.0%) |
| 19 to 25 Years | 18 (100.0%) | 0 (0.0%) |
| 26 to 34 Years | 67 (73.6%) | 24 (26.4%) |
| 35 to 44 Years | 24 (100.0%) | 0 (0.0%) |
| 45 to 54 Years | 23 (59.0%) | 16 (41.0%) |
| 55 to 64 Years | 62 (100.0%) | 0 (0.0%) |
| 65 to 74 Years | 18 (100.0%) | 0 (0.0%) |
| 75 Years and older | 20 (100.0%) | 0 (0.0%) |
| Total | 348 (89.7%) | 40 (10.3%) |
Health Insurance Coverage by Citizenship Status in Melrose

| Citizenship Status | With Coverage | Without Coverage |
| Native Born | 41 (100.0%) | 0 (0.0%) |
| Foreign Born, Citizen | 75 (100.0%) | 0 (0.0%) |
| Foreign Born, not a Citizen | 18 (100.0%) | 0 (0.0%) |
Health Insurance Coverage by Household Income in Melrose
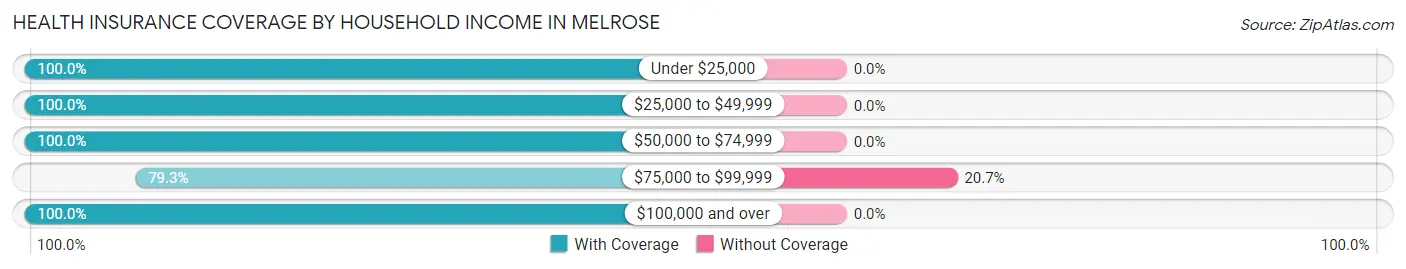
| Household Income | With Coverage | Without Coverage |
| Under $25,000 | 30 (100.0%) | 0 (0.0%) |
| $25,000 to $49,999 | 54 (100.0%) | 0 (0.0%) |
| $50,000 to $74,999 | 57 (100.0%) | 0 (0.0%) |
| $75,000 to $99,999 | 153 (79.3%) | 40 (20.7%) |
| $100,000 and over | 54 (100.0%) | 0 (0.0%) |
Public vs Private Health Insurance Coverage by Age in Melrose
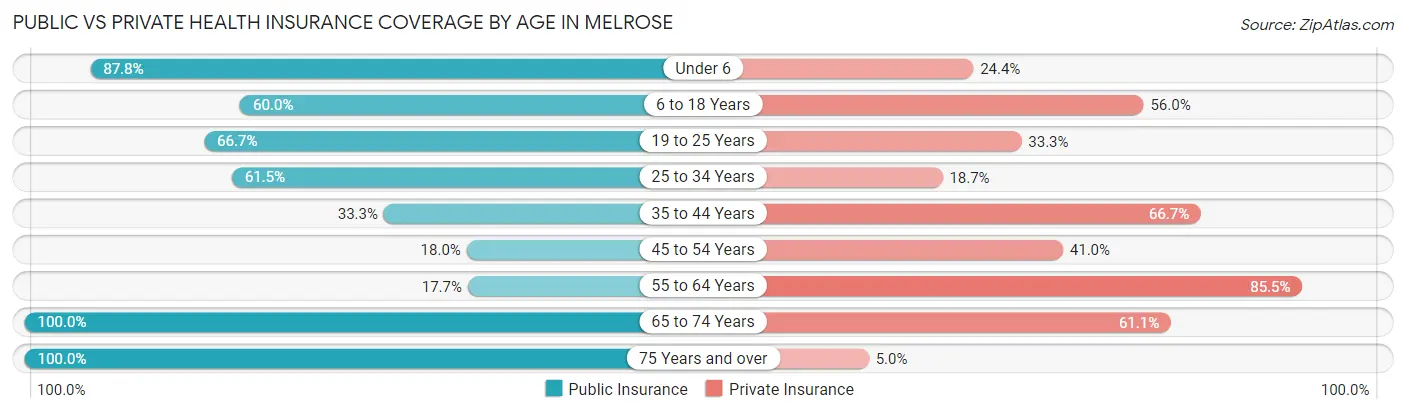
| Age Bracket | Public Insurance | Private Insurance |
| Under 6 | 36 (87.8%) | 10 (24.4%) |
| 6 to 18 Years | 45 (60.0%) | 42 (56.0%) |
| 19 to 25 Years | 12 (66.7%) | 6 (33.3%) |
| 25 to 34 Years | 56 (61.5%) | 17 (18.7%) |
| 35 to 44 Years | 8 (33.3%) | 16 (66.7%) |
| 45 to 54 Years | 7 (17.9%) | 16 (41.0%) |
| 55 to 64 Years | 11 (17.7%) | 53 (85.5%) |
| 65 to 74 Years | 18 (100.0%) | 11 (61.1%) |
| 75 Years and over | 20 (100.0%) | 1 (5.0%) |
| Total | 213 (54.9%) | 172 (44.3%) |
Disability Status by Sex by Age in Melrose
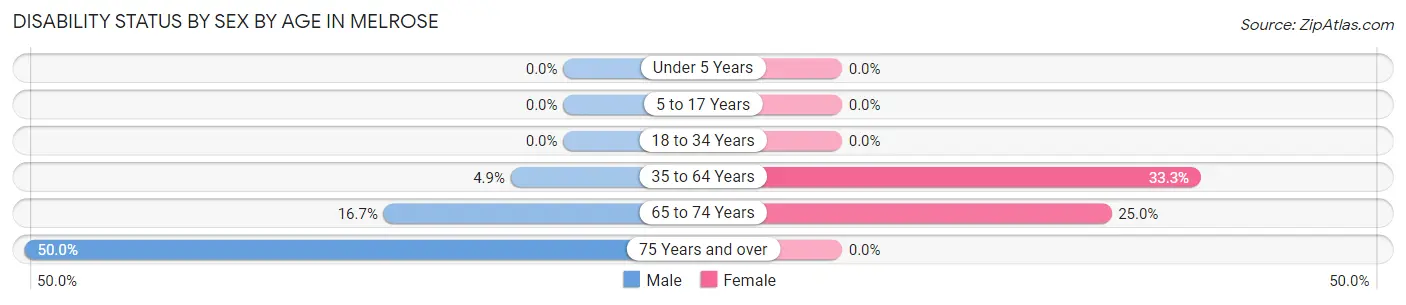
| Age Bracket | Male | Female |
| Under 5 Years | 0 (0.0%) | 0 (0.0%) |
| 5 to 17 Years | 0 (0.0%) | 0 (0.0%) |
| 18 to 34 Years | 0 (0.0%) | 0 (0.0%) |
| 35 to 64 Years | 2 (4.9%) | 28 (33.3%) |
| 65 to 74 Years | 1 (16.7%) | 3 (25.0%) |
| 75 Years and over | 1 (50.0%) | 0 (0.0%) |
Disability Class by Sex by Age in Melrose
Disability Class: Hearing Difficulty
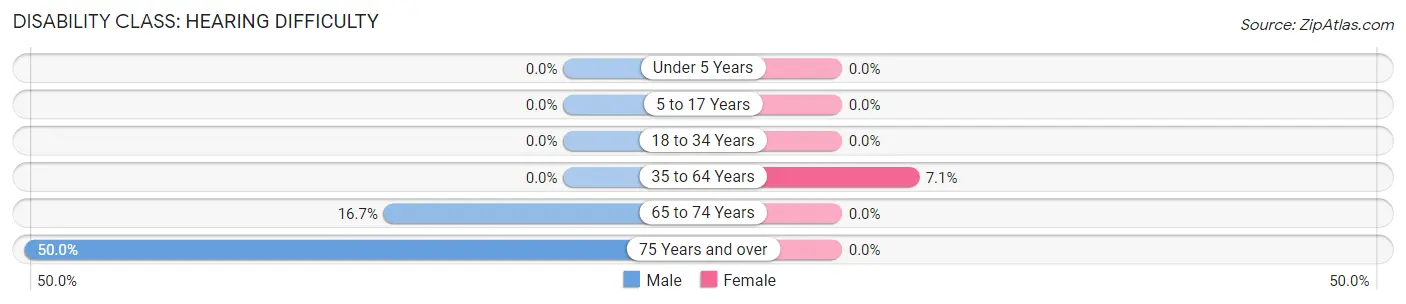
| Age Bracket | Male | Female |
| Under 5 Years | 0 (0.0%) | 0 (0.0%) |
| 5 to 17 Years | 0 (0.0%) | 0 (0.0%) |
| 18 to 34 Years | 0 (0.0%) | 0 (0.0%) |
| 35 to 64 Years | 0 (0.0%) | 6 (7.1%) |
| 65 to 74 Years | 1 (16.7%) | 0 (0.0%) |
| 75 Years and over | 1 (50.0%) | 0 (0.0%) |
Disability Class: Vision Difficulty
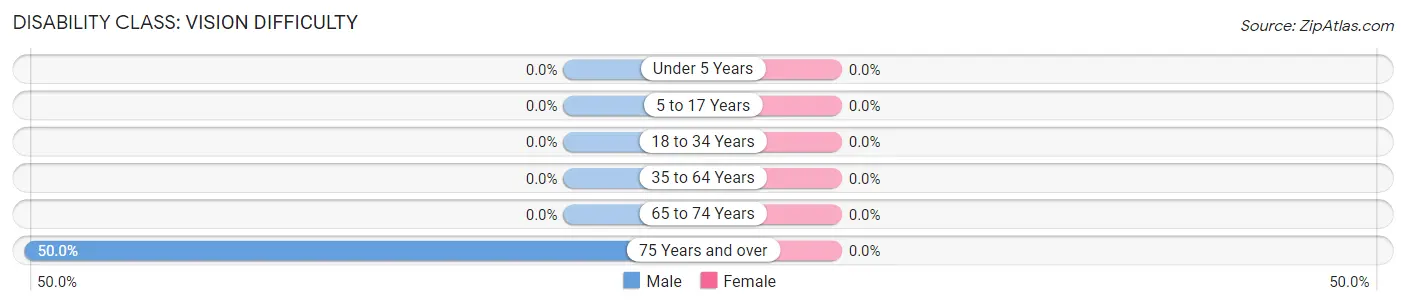
| Age Bracket | Male | Female |
| Under 5 Years | 0 (0.0%) | 0 (0.0%) |
| 5 to 17 Years | 0 (0.0%) | 0 (0.0%) |
| 18 to 34 Years | 0 (0.0%) | 0 (0.0%) |
| 35 to 64 Years | 0 (0.0%) | 0 (0.0%) |
| 65 to 74 Years | 0 (0.0%) | 0 (0.0%) |
| 75 Years and over | 1 (50.0%) | 0 (0.0%) |
Disability Class: Cognitive Difficulty
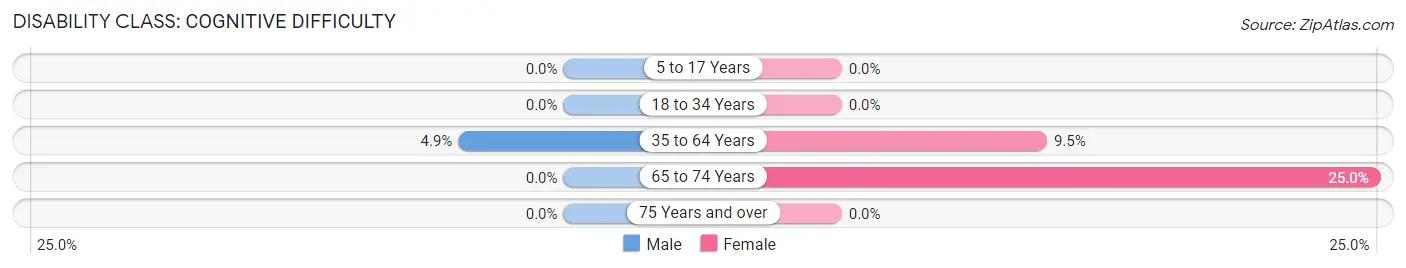
| Age Bracket | Male | Female |
| 5 to 17 Years | 0 (0.0%) | 0 (0.0%) |
| 18 to 34 Years | 0 (0.0%) | 0 (0.0%) |
| 35 to 64 Years | 2 (4.9%) | 8 (9.5%) |
| 65 to 74 Years | 0 (0.0%) | 3 (25.0%) |
| 75 Years and over | 0 (0.0%) | 0 (0.0%) |
Disability Class: Ambulatory Difficulty
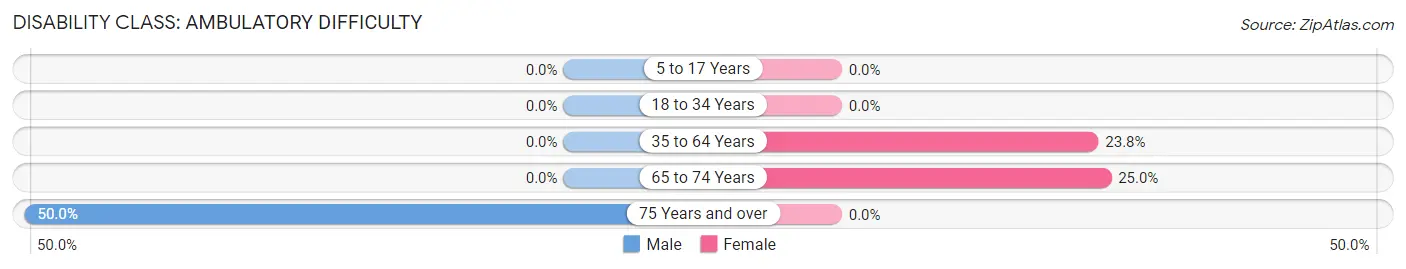
| Age Bracket | Male | Female |
| 5 to 17 Years | 0 (0.0%) | 0 (0.0%) |
| 18 to 34 Years | 0 (0.0%) | 0 (0.0%) |
| 35 to 64 Years | 0 (0.0%) | 20 (23.8%) |
| 65 to 74 Years | 0 (0.0%) | 3 (25.0%) |
| 75 Years and over | 1 (50.0%) | 0 (0.0%) |
Disability Class: Self-Care Difficulty
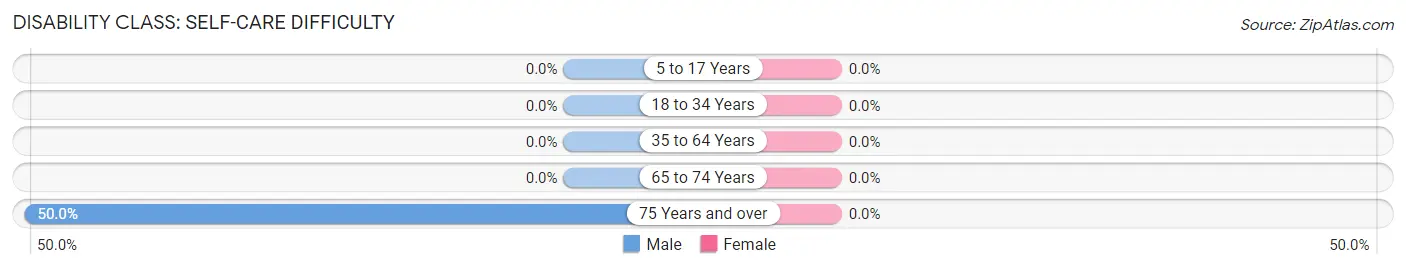
| Age Bracket | Male | Female |
| 5 to 17 Years | 0 (0.0%) | 0 (0.0%) |
| 18 to 34 Years | 0 (0.0%) | 0 (0.0%) |
| 35 to 64 Years | 0 (0.0%) | 0 (0.0%) |
| 65 to 74 Years | 0 (0.0%) | 0 (0.0%) |
| 75 Years and over | 1 (50.0%) | 0 (0.0%) |
Technology Access in Melrose
Computing Device Access in Melrose
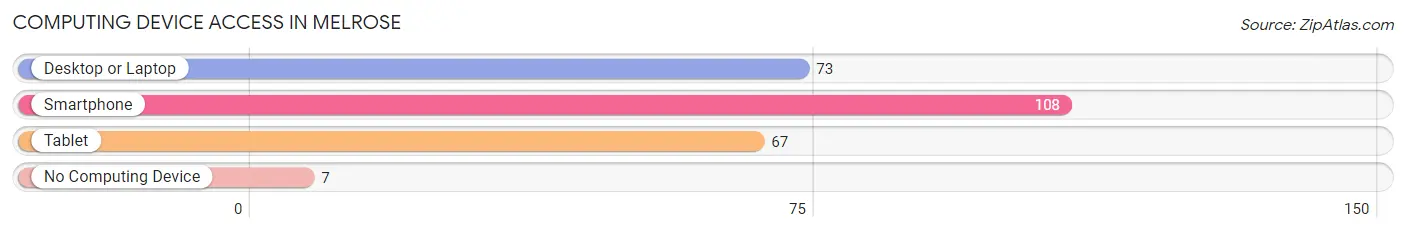
| Device Type | # Households | % Households |
| Desktop or Laptop | 73 | 54.9% |
| Smartphone | 108 | 81.2% |
| Tablet | 67 | 50.4% |
| No Computing Device | 7 | 5.3% |
| Total | 133 | 100.0% |
Internet Access in Melrose
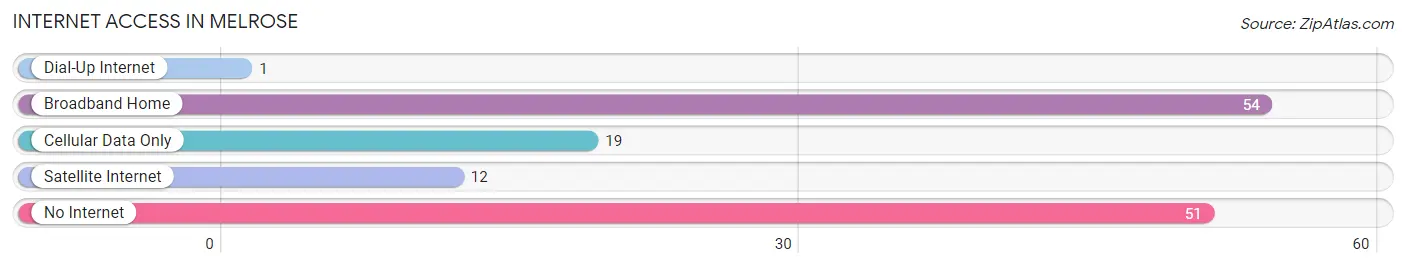
| Internet Type | # Households | % Households |
| Dial-Up Internet | 1 | 0.7% |
| Broadband Home | 54 | 40.6% |
| Cellular Data Only | 19 | 14.3% |
| Satellite Internet | 12 | 9.0% |
| No Internet | 51 | 38.4% |
| Total | 133 | 100.0% |
Melrose Summary
History
Melrose, Ohio is a small village located in the southeastern corner of Brown County, Ohio. It was founded in 1817 by a group of settlers from Pennsylvania and Virginia. The village was named after Melrose Abbey in Scotland. The first settlers were mostly farmers and the village grew slowly over the years.
In 1845, the village was incorporated and the first mayor was elected. The village was a small farming community until the late 19th century when the railroad came through. This allowed for the growth of the village and the establishment of several businesses.
The village continued to grow and in the early 20th century, the village was home to several factories, including a furniture factory, a canning factory, and a brick factory. The village also had a bank, a post office, and several stores.
In the 1950s, the village began to decline as many of the factories closed and the population began to decline. The village was able to survive, however, and in the late 20th century, the village began to experience a resurgence. The village was able to attract new businesses and the population began to increase.
Geography
Melrose is located in the southeastern corner of Brown County, Ohio. It is situated on the banks of the Little Miami River and is surrounded by rolling hills and farmland. The village is located approximately 25 miles east of Cincinnati and is part of the Cincinnati metropolitan area.
The village covers an area of 0.6 square miles and has a population of approximately 1,000 people. The village is served by two major highways, State Route 32 and State Route 125.
Economy
The economy of Melrose is largely based on agriculture and tourism. The village is home to several farms, which produce a variety of crops, including corn, soybeans, and wheat. The village also has several small businesses, including a grocery store, a hardware store, and a restaurant.
The village is also home to several tourist attractions, including the Little Miami Scenic Trail, which is a popular destination for hikers and bikers. The village also has several parks and recreational areas, including a public swimming pool and a golf course.
Demographics
As of the 2010 census, the population of Melrose was 1,000 people. The racial makeup of the village was 97.2% White, 0.7% African American, 0.3% Native American, 0.3% Asian, and 1.5% from other races. The median household income was $41,250 and the median family income was $50,000.
The village is served by the Brown County School District, which includes two elementary schools, one middle school, and one high school. The village also has several churches, including the First Presbyterian Church, the First United Methodist Church, and the Church of the Nazarene.
Conclusion
Melrose, Ohio is a small village located in the southeastern corner of Brown County, Ohio. It was founded in 1817 and has a population of approximately 1,000 people. The village is largely based on agriculture and tourism and is home to several farms, businesses, and tourist attractions. The village is served by the Brown County School District and has several churches. The village has experienced a resurgence in recent years and is a popular destination for hikers and bikers.
Common Questions
What is Per Capita Income in Melrose?
Per Capita income in Melrose is $21,294.
What is the Median Family Income in Melrose?
Median Family Income in Melrose is $71,250.
What is the Median Household income in Melrose?
Median Household Income in Melrose is $72,375.
What is Income or Wage Gap in Melrose?
Income or Wage Gap in Melrose is 3.8%.
Women in Melrose earn 96.2 cents for every dollar earned by a man.
What is Inequality or Gini Index in Melrose?
Inequality or Gini Index in Melrose is 0.33.
What is the Total Population of Melrose?
Total Population of Melrose is 388.
What is the Total Male Population of Melrose?
Total Male Population of Melrose is 210.
What is the Total Female Population of Melrose?
Total Female Population of Melrose is 178.
What is the Ratio of Males per 100 Females in Melrose?
There are 117.98 Males per 100 Females in Melrose.
What is the Ratio of Females per 100 Males in Melrose?
There are 84.76 Females per 100 Males in Melrose.
What is the Median Population Age in Melrose?
Median Population Age in Melrose is 31.2 Years.
What is the Average Family Size in Melrose
Average Family Size in Melrose is 3.5 People.
What is the Average Household Size in Melrose
Average Household Size in Melrose is 2.9 People.
How Large is the Labor Force in Melrose?
There are 166 People in the Labor Forcein in Melrose.
What is the Percentage of People in the Labor Force in Melrose?
57.0% of People are in the Labor Force in Melrose.
What is the Unemployment Rate in Melrose?
Unemployment Rate in Melrose is 24.1%.