Florida, OH Map & Demographics
Florida Map
Florida Overview
$31,209
PER CAPITA INCOME
$60,625
AVG FAMILY INCOME
$60,333
AVG HOUSEHOLD INCOME
33.0%
WAGE / INCOME GAP [ % ]
67.0¢/ $1
WAGE / INCOME GAP [ $ ]
0.28
INEQUALITY / GINI INDEX
258
TOTAL POPULATION
166
MALE POPULATION
92
FEMALE POPULATION
180.43
MALES / 100 FEMALES
55.42
FEMALES / 100 MALES
42.5
MEDIAN AGE
2.8
AVG FAMILY SIZE
2.1
AVG HOUSEHOLD SIZE
131
LABOR FORCE [ PEOPLE ]
58.2%
PERCENT IN LABOR FORCE
Income in Florida
Income Overview in Florida
Per Capita Income in Florida is $31,209, while median incomes of families and households are $60,625 and $60,333 respectively.
| Characteristic | Number | Measure |
| Per Capita Income | 258 | $31,209 |
| Median Family Income | 51 | $60,625 |
| Mean Family Income | 51 | $66,124 |
| Median Household Income | 124 | $60,333 |
| Mean Household Income | 124 | $65,973 |
| Income Deficit | 51 | $0 |
| Wage / Income Gap (%) | 258 | 32.96% |
| Wage / Income Gap ($) | 258 | 67.04¢ per $1 |
| Gini / Inequality Index | 258 | 0.28 |
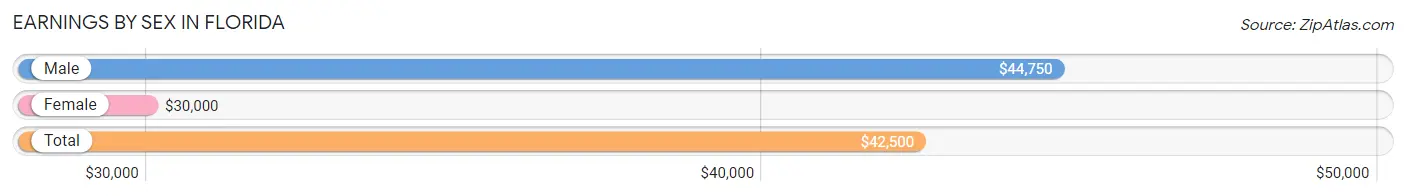
Earnings by Sex in Florida
Average Earnings in Florida are $42,500, $44,750 for men and $30,000 for women, a difference of 33.0%.
| Sex | Number | Average Earnings |
| Male | 96 (72.7%) | $44,750 |
| Female | 36 (27.3%) | $30,000 |
| Total | 132 (100.0%) | $42,500 |
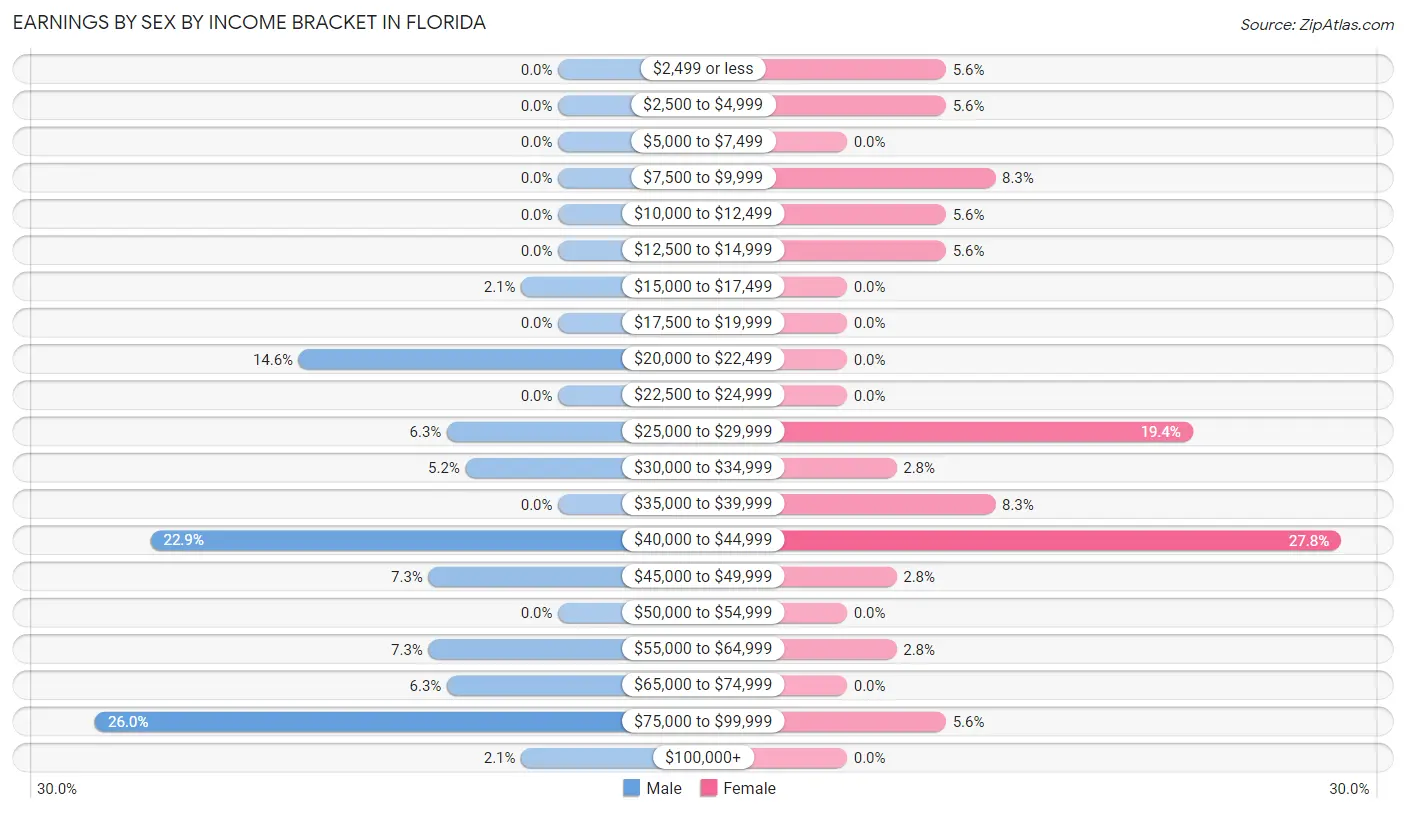
Earnings by Sex by Income Bracket in Florida
The most common earnings brackets in Florida are $75,000 to $99,999 for men (25 | 26.0%) and $40,000 to $44,999 for women (10 | 27.8%).
| Income | Male | Female |
| $2,499 or less | 0 (0.0%) | 2 (5.6%) |
| $2,500 to $4,999 | 0 (0.0%) | 2 (5.6%) |
| $5,000 to $7,499 | 0 (0.0%) | 0 (0.0%) |
| $7,500 to $9,999 | 0 (0.0%) | 3 (8.3%) |
| $10,000 to $12,499 | 0 (0.0%) | 2 (5.6%) |
| $12,500 to $14,999 | 0 (0.0%) | 2 (5.6%) |
| $15,000 to $17,499 | 2 (2.1%) | 0 (0.0%) |
| $17,500 to $19,999 | 0 (0.0%) | 0 (0.0%) |
| $20,000 to $22,499 | 14 (14.6%) | 0 (0.0%) |
| $22,500 to $24,999 | 0 (0.0%) | 0 (0.0%) |
| $25,000 to $29,999 | 6 (6.2%) | 7 (19.4%) |
| $30,000 to $34,999 | 5 (5.2%) | 1 (2.8%) |
| $35,000 to $39,999 | 0 (0.0%) | 3 (8.3%) |
| $40,000 to $44,999 | 22 (22.9%) | 10 (27.8%) |
| $45,000 to $49,999 | 7 (7.3%) | 1 (2.8%) |
| $50,000 to $54,999 | 0 (0.0%) | 0 (0.0%) |
| $55,000 to $64,999 | 7 (7.3%) | 1 (2.8%) |
| $65,000 to $74,999 | 6 (6.2%) | 0 (0.0%) |
| $75,000 to $99,999 | 25 (26.0%) | 2 (5.6%) |
| $100,000+ | 2 (2.1%) | 0 (0.0%) |
| Total | 96 (100.0%) | 36 (100.0%) |
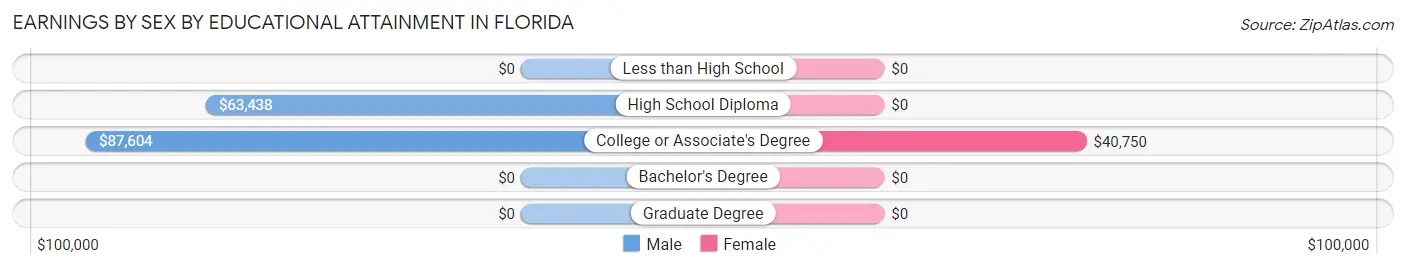
Earnings by Sex by Educational Attainment in Florida
Average earnings in Florida are $64,375 for men and $35,833 for women, a difference of 44.3%. Men with an educational attainment of college or associate's degree enjoy the highest average annual earnings of $87,604, while those with high school diploma education earn the least with $63,438. Women with an educational attainment of college or associate's degree earn the most with the average annual earnings of $40,750, while those with college or associate's degree education have the smallest earnings of $40,750.
| Educational Attainment | Male Income | Female Income |
| Less than High School | - | - |
| High School Diploma | $63,438 | $0 |
| College or Associate's Degree | $87,604 | $40,750 |
| Bachelor's Degree | - | - |
| Graduate Degree | - | - |
| Total | $64,375 | $35,833 |
Family Income in Florida
Family Income Brackets in Florida
According to the Florida family income data, there are 28 families falling into the $50,000 to $74,999 income range, which is the most common income bracket and makes up 54.9% of all families.
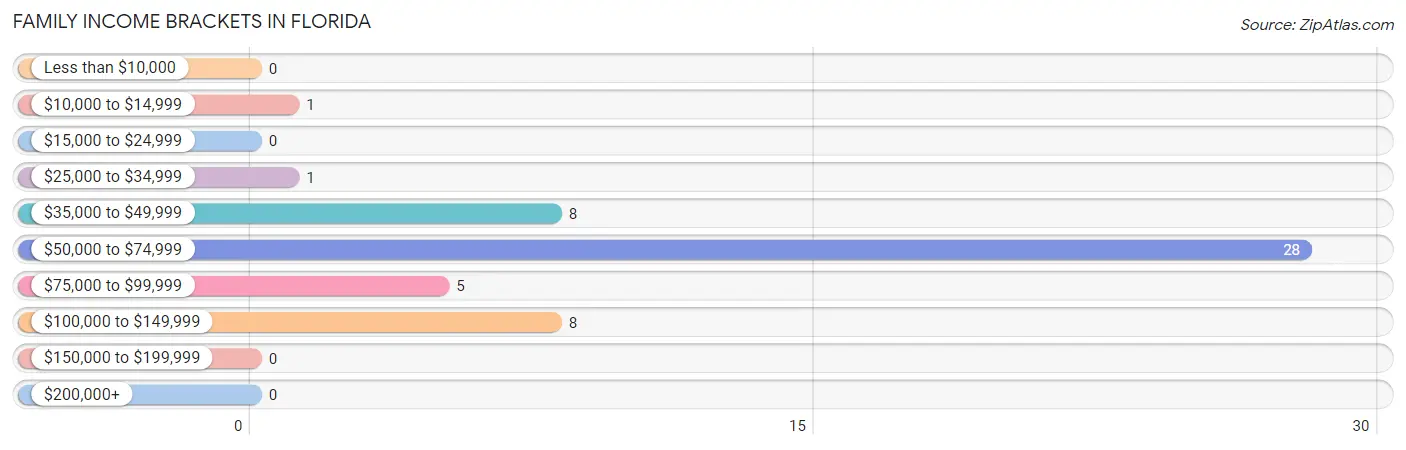
| Income Bracket | # Families | % Families |
| Less than $10,000 | 0 | 0.0% |
| $10,000 to $14,999 | 1 | 2.0% |
| $15,000 to $24,999 | 0 | 0.0% |
| $25,000 to $34,999 | 1 | 2.0% |
| $35,000 to $49,999 | 8 | 15.7% |
| $50,000 to $74,999 | 28 | 54.9% |
| $75,000 to $99,999 | 5 | 9.8% |
| $100,000 to $149,999 | 8 | 15.7% |
| $150,000 to $199,999 | 0 | 0.0% |
| $200,000+ | 0 | 0.0% |
Family Income by Famaliy Size in Florida
4-person families (15 | 29.4%) account for the highest median family income in Florida with $61,563 per family, while 2-person families (24 | 47.1%) have the highest median income of $25,834 per family member.
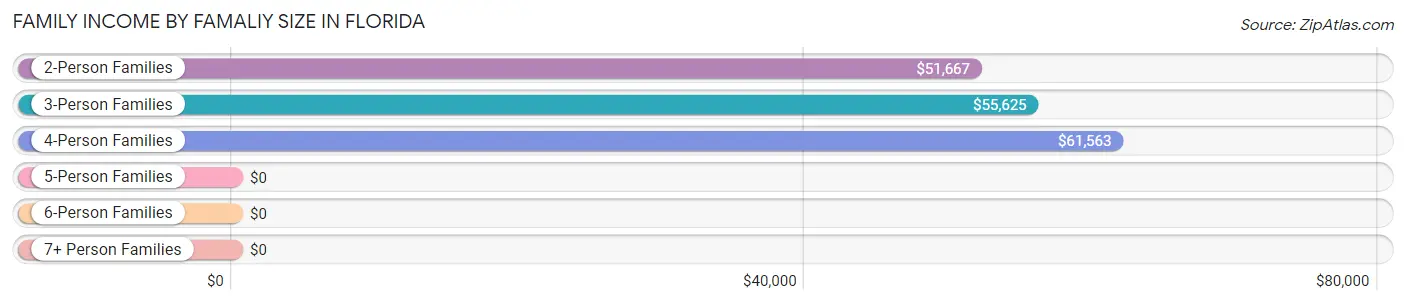
| Income Bracket | # Families | Median Income |
| 2-Person Families | 24 (47.1%) | $51,667 |
| 3-Person Families | 11 (21.6%) | $55,625 |
| 4-Person Families | 15 (29.4%) | $61,563 |
| 5-Person Families | 1 (2.0%) | $0 |
| 6-Person Families | 0 (0.0%) | $0 |
| 7+ Person Families | 0 (0.0%) | $0 |
| Total | 51 (100.0%) | $60,625 |
Family Income by Number of Earners in Florida
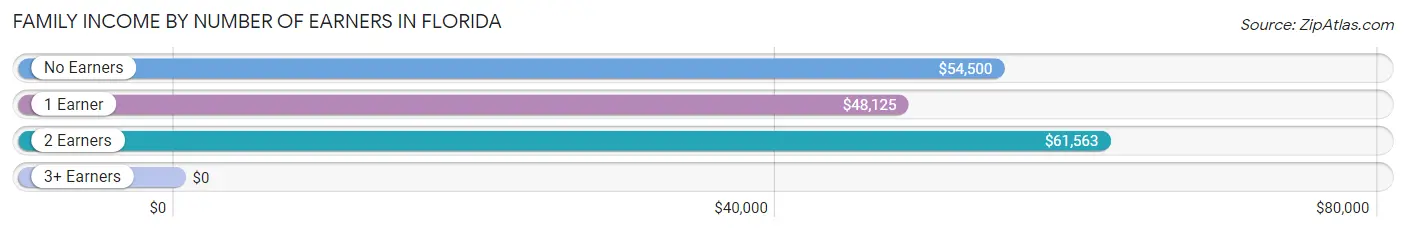
| Number of Earners | # Families | Median Income |
| No Earners | 10 (19.6%) | $54,500 |
| 1 Earner | 15 (29.4%) | $48,125 |
| 2 Earners | 25 (49.0%) | $61,563 |
| 3+ Earners | 1 (2.0%) | $0 |
| Total | 51 (100.0%) | $60,625 |
Household Income in Florida
Household Income Brackets in Florida
With 39 households falling in the category, the $50,000 to $74,999 income range is the most frequent in Florida, accounting for 31.5% of all households.
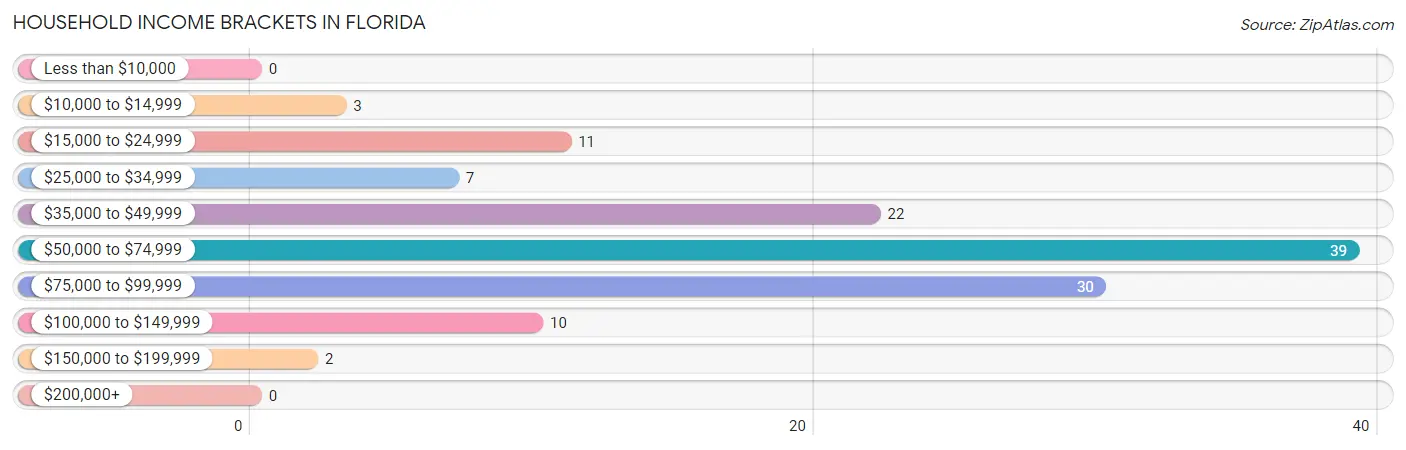
| Income Bracket | # Households | % Households |
| Less than $10,000 | 0 | 0.0% |
| $10,000 to $14,999 | 3 | 2.4% |
| $15,000 to $24,999 | 11 | 8.9% |
| $25,000 to $34,999 | 7 | 5.6% |
| $35,000 to $49,999 | 22 | 17.7% |
| $50,000 to $74,999 | 39 | 31.5% |
| $75,000 to $99,999 | 30 | 24.2% |
| $100,000 to $149,999 | 10 | 8.1% |
| $150,000 to $199,999 | 2 | 1.6% |
| $200,000+ | 0 | 0.0% |
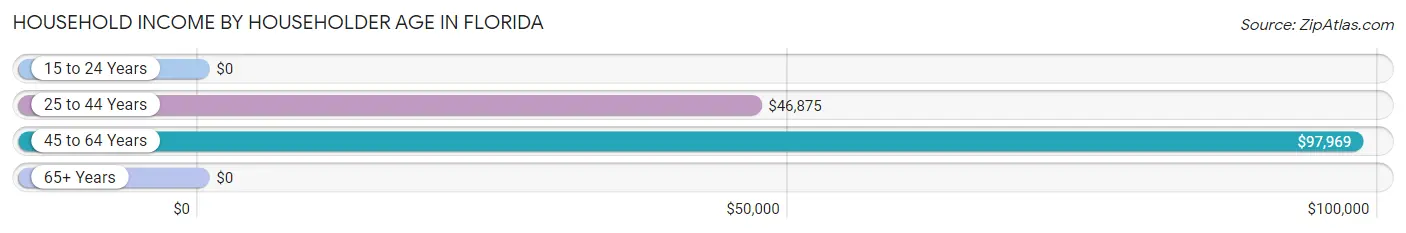
Household Income by Householder Age in Florida
The median household income in Florida is $60,333, with the highest median household income of $97,969 found in the 45 to 64 years age bracket for the primary householder. A total of 63 households (50.8%) fall into this category. Meanwhile, the 15 to 24 years age bracket for the primary householder has the lowest median household income of $0, with 15 households (12.1%) in this group.
| Income Bracket | # Households | Median Income |
| 15 to 24 Years | 15 (12.1%) | $0 |
| 25 to 44 Years | 26 (21.0%) | $46,875 |
| 45 to 64 Years | 63 (50.8%) | $97,969 |
| 65+ Years | 20 (16.1%) | $0 |
| Total | 124 (100.0%) | $60,333 |
Poverty in Florida
Income Below Poverty by Sex and Age in Florida
With 16.9% poverty level for males and 15.2% for females among the residents of Florida, 35 to 44 year old males and 45 to 54 year old females are the most vulnerable to poverty, with 27 males (57.5%) and 2 females (50.0%) in their respective age groups living below the poverty level.
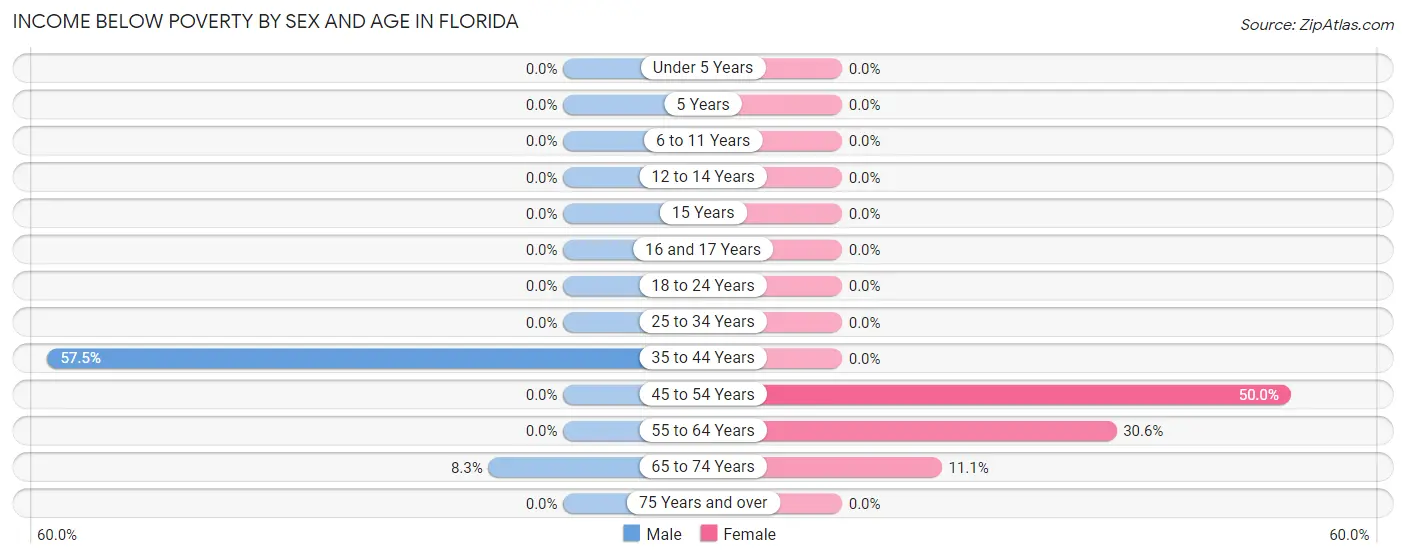
| Age Bracket | Male | Female |
| Under 5 Years | 0 (0.0%) | 0 (0.0%) |
| 5 Years | 0 (0.0%) | 0 (0.0%) |
| 6 to 11 Years | 0 (0.0%) | 0 (0.0%) |
| 12 to 14 Years | 0 (0.0%) | 0 (0.0%) |
| 15 Years | 0 (0.0%) | 0 (0.0%) |
| 16 and 17 Years | 0 (0.0%) | 0 (0.0%) |
| 18 to 24 Years | 0 (0.0%) | 0 (0.0%) |
| 25 to 34 Years | 0 (0.0%) | 0 (0.0%) |
| 35 to 44 Years | 27 (57.5%) | 0 (0.0%) |
| 45 to 54 Years | 0 (0.0%) | 2 (50.0%) |
| 55 to 64 Years | 0 (0.0%) | 11 (30.6%) |
| 65 to 74 Years | 1 (8.3%) | 1 (11.1%) |
| 75 Years and over | 0 (0.0%) | 0 (0.0%) |
| Total | 28 (16.9%) | 14 (15.2%) |
Income Above Poverty by Sex and Age in Florida
According to the poverty statistics in Florida, males aged under 5 years and females aged under 5 years are the age groups that are most secure financially, with 100.0% of males and 100.0% of females in these age groups living above the poverty line.
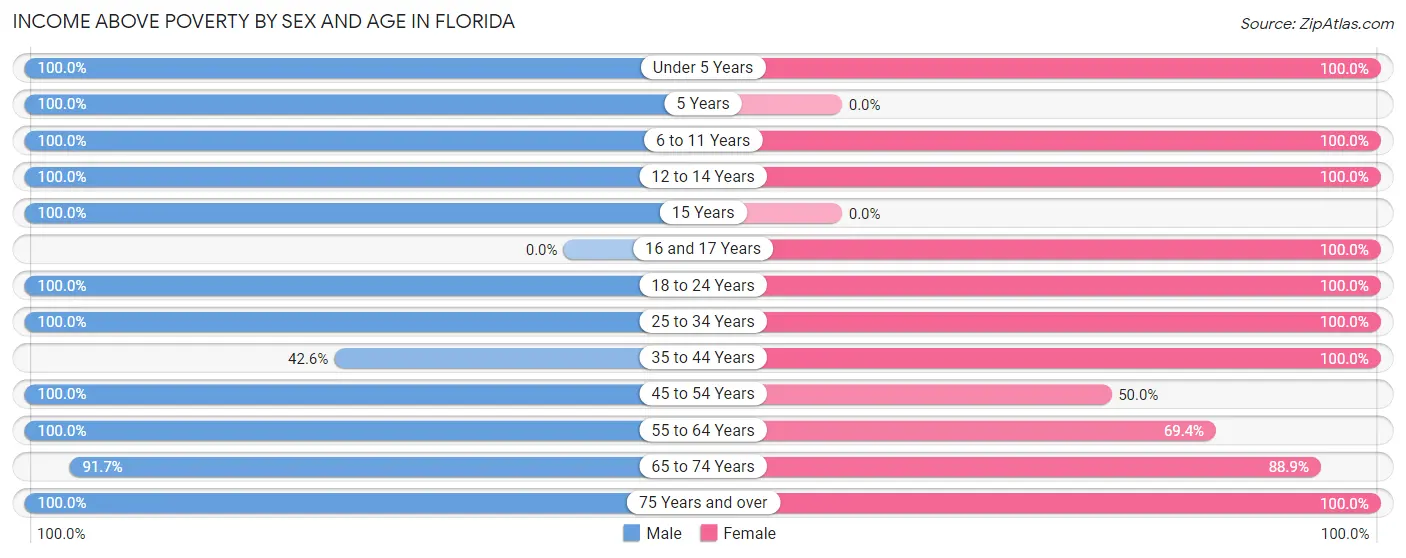
| Age Bracket | Male | Female |
| Under 5 Years | 13 (100.0%) | 1 (100.0%) |
| 5 Years | 2 (100.0%) | 0 (0.0%) |
| 6 to 11 Years | 5 (100.0%) | 6 (100.0%) |
| 12 to 14 Years | 1 (100.0%) | 4 (100.0%) |
| 15 Years | 1 (100.0%) | 0 (0.0%) |
| 16 and 17 Years | 0 (0.0%) | 1 (100.0%) |
| 18 to 24 Years | 28 (100.0%) | 3 (100.0%) |
| 25 to 34 Years | 4 (100.0%) | 7 (100.0%) |
| 35 to 44 Years | 20 (42.5%) | 17 (100.0%) |
| 45 to 54 Years | 6 (100.0%) | 2 (50.0%) |
| 55 to 64 Years | 42 (100.0%) | 25 (69.4%) |
| 65 to 74 Years | 11 (91.7%) | 8 (88.9%) |
| 75 Years and over | 5 (100.0%) | 4 (100.0%) |
| Total | 138 (83.1%) | 78 (84.8%) |
Income Below Poverty Among Married-Couple Families in Florida
The poverty statistics for married-couple families in Florida show that 3.5% or 1 of the total 29 families live below the poverty line. Families with no children have the highest poverty rate of 5.6%, comprising of 1 families. On the other hand, families with 1 or 2 children have the lowest poverty rate of 0.0%, which includes 0 families.
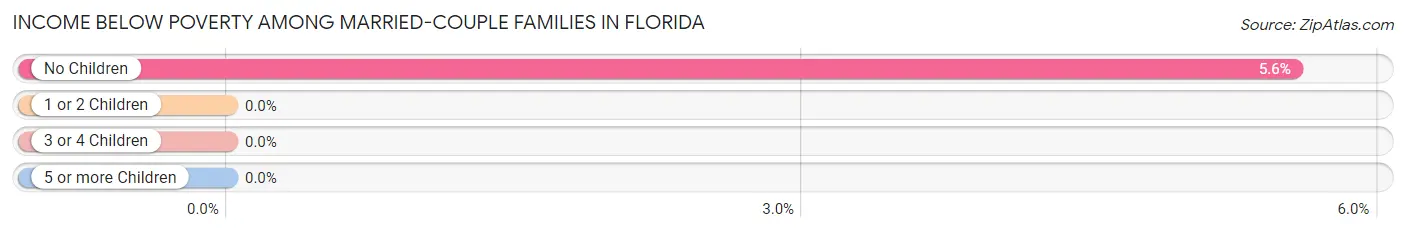
| Children | Above Poverty | Below Poverty |
| No Children | 17 (94.4%) | 1 (5.6%) |
| 1 or 2 Children | 10 (100.0%) | 0 (0.0%) |
| 3 or 4 Children | 1 (100.0%) | 0 (0.0%) |
| 5 or more Children | 0 (0.0%) | 0 (0.0%) |
| Total | 28 (96.6%) | 1 (3.5%) |
Income Below Poverty Among Single-Parent Households in Florida
| Children | Single Father | Single Mother |
| No Children | 0 (0.0%) | 0 (0.0%) |
| 1 or 2 Children | 0 (0.0%) | 0 (0.0%) |
| 3 or 4 Children | 0 (0.0%) | 0 (0.0%) |
| 5 or more Children | 0 (0.0%) | 0 (0.0%) |
| Total | 0 (0.0%) | 0 (0.0%) |
Income Below Poverty Among Married-Couple vs Single-Parent Households in Florida
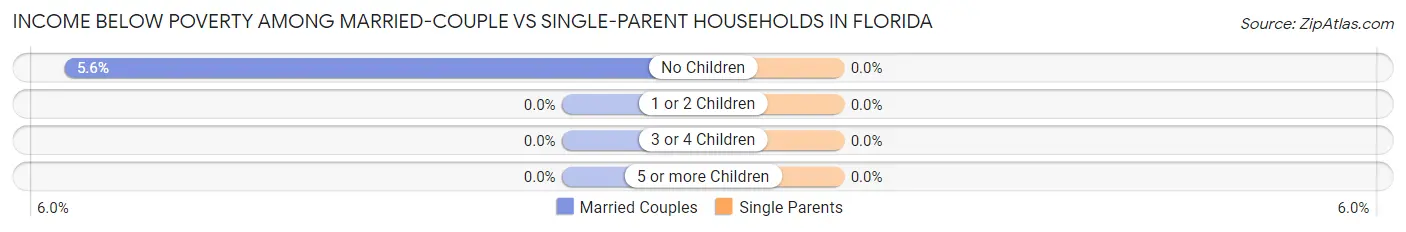
| Children | Married-Couple Families | Single-Parent Households |
| No Children | 1 (5.6%) | 0 (0.0%) |
| 1 or 2 Children | 0 (0.0%) | 0 (0.0%) |
| 3 or 4 Children | 0 (0.0%) | 0 (0.0%) |
| 5 or more Children | 0 (0.0%) | 0 (0.0%) |
| Total | 1 (3.5%) | 0 (0.0%) |
Race in Florida
The most populous races in Florida are White / Caucasian (248 | 96.1%), Hispanic or Latino (13 | 5.0%), and Some other Race (8 | 3.1%).
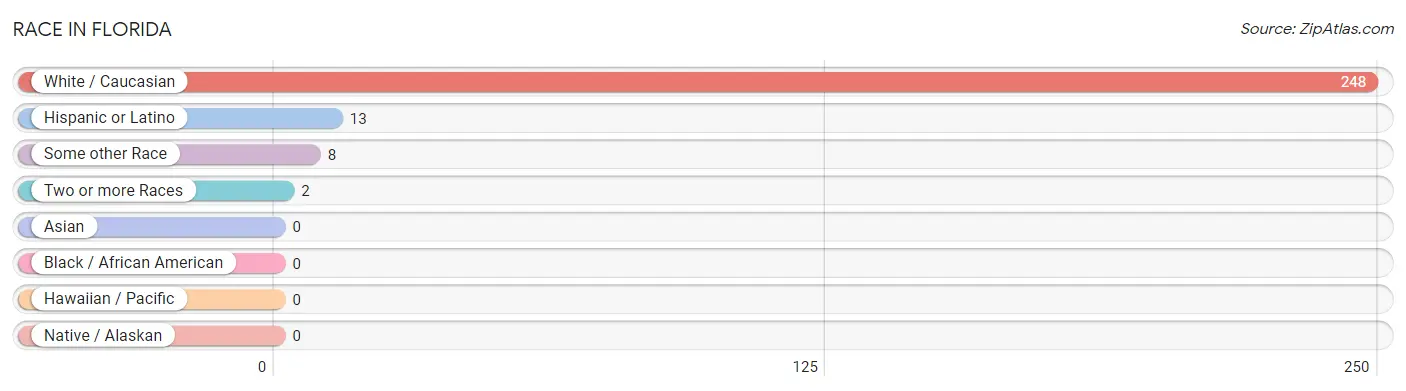
| Race | # Population | % Population |
| Asian | 0 | 0.0% |
| Black / African American | 0 | 0.0% |
| Hawaiian / Pacific | 0 | 0.0% |
| Hispanic or Latino | 13 | 5.0% |
| Native / Alaskan | 0 | 0.0% |
| White / Caucasian | 248 | 96.1% |
| Two or more Races | 2 | 0.8% |
| Some other Race | 8 | 3.1% |
| Total | 258 | 100.0% |
Ancestry in Florida
The most populous ancestries reported in Florida are German (101 | 39.2%), American (68 | 26.4%), Norwegian (27 | 10.5%), English (19 | 7.4%), and Mexican (13 | 5.0%), together accounting for 88.4% of all Florida residents.
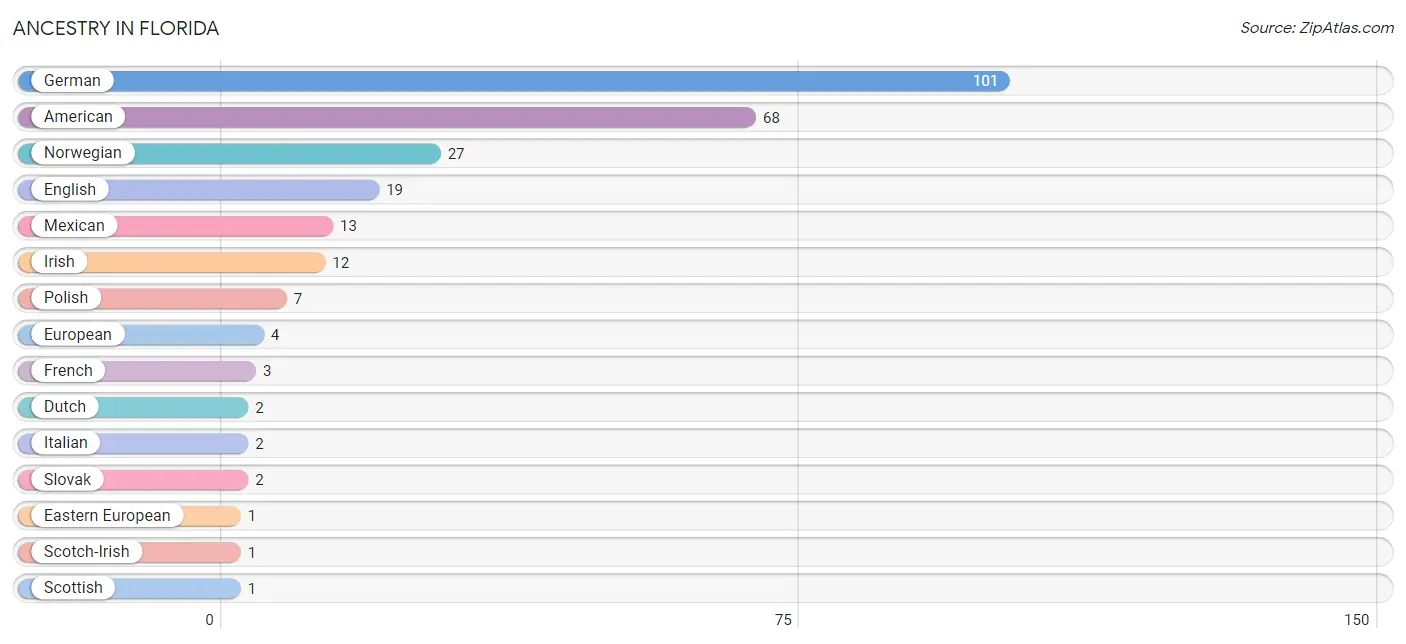
| Ancestry | # Population | % Population |
| American | 68 | 26.4% |
| Dutch | 2 | 0.8% |
| Eastern European | 1 | 0.4% |
| English | 19 | 7.4% |
| European | 4 | 1.5% |
| French | 3 | 1.2% |
| German | 101 | 39.2% |
| Irish | 12 | 4.6% |
| Italian | 2 | 0.8% |
| Mexican | 13 | 5.0% |
| Norwegian | 27 | 10.5% |
| Polish | 7 | 2.7% |
| Scotch-Irish | 1 | 0.4% |
| Scottish | 1 | 0.4% |
| Slovak | 2 | 0.8% |
| Swiss | 1 | 0.4% | View All 16 Rows |
Immigrants in Florida

| Immigration Origin | # Population | % Population | View All 0 Rows |
Sex and Age in Florida
Sex and Age in Florida
The most populous age groups in Florida are 35 to 39 Years (46 | 27.7%) for men and 55 to 59 Years (28 | 30.4%) for women.
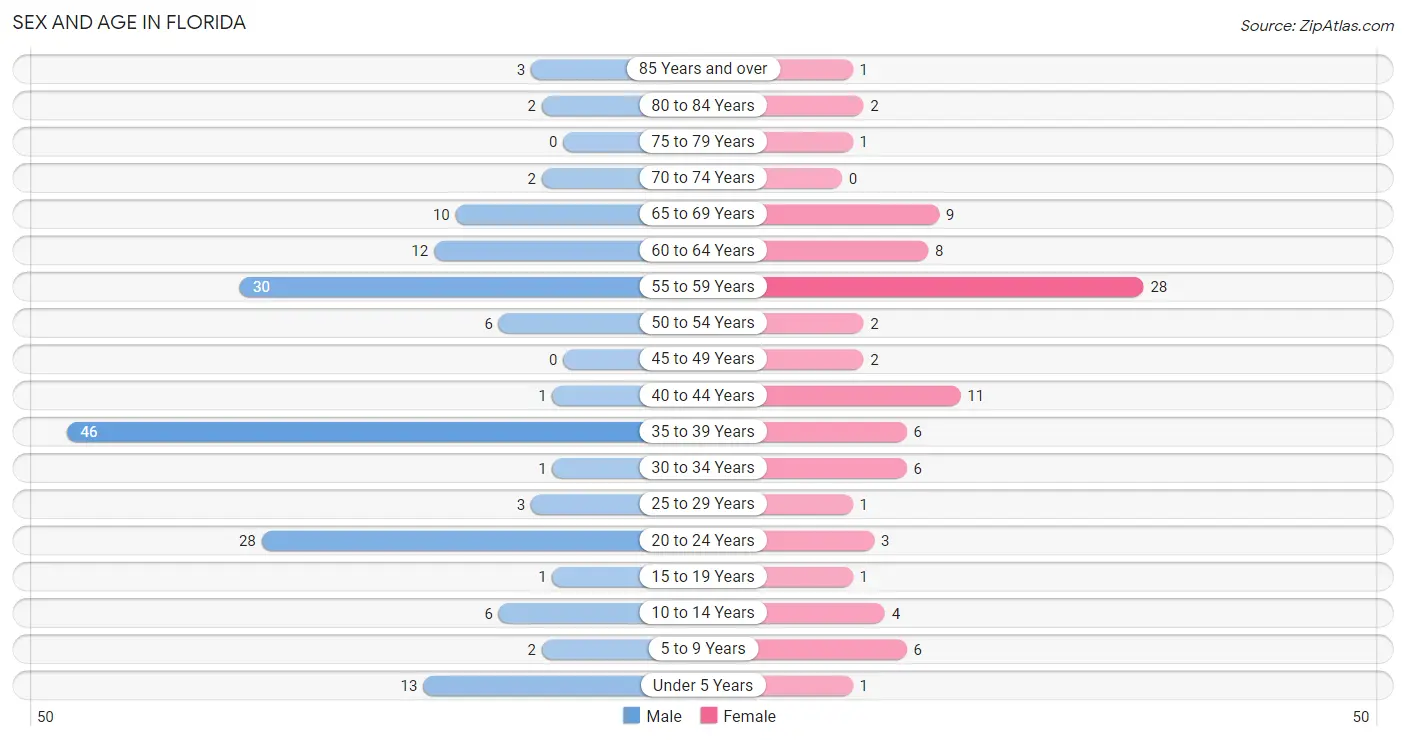
| Age Bracket | Male | Female |
| Under 5 Years | 13 (7.8%) | 1 (1.1%) |
| 5 to 9 Years | 2 (1.2%) | 6 (6.5%) |
| 10 to 14 Years | 6 (3.6%) | 4 (4.3%) |
| 15 to 19 Years | 1 (0.6%) | 1 (1.1%) |
| 20 to 24 Years | 28 (16.9%) | 3 (3.3%) |
| 25 to 29 Years | 3 (1.8%) | 1 (1.1%) |
| 30 to 34 Years | 1 (0.6%) | 6 (6.5%) |
| 35 to 39 Years | 46 (27.7%) | 6 (6.5%) |
| 40 to 44 Years | 1 (0.6%) | 11 (12.0%) |
| 45 to 49 Years | 0 (0.0%) | 2 (2.2%) |
| 50 to 54 Years | 6 (3.6%) | 2 (2.2%) |
| 55 to 59 Years | 30 (18.1%) | 28 (30.4%) |
| 60 to 64 Years | 12 (7.2%) | 8 (8.7%) |
| 65 to 69 Years | 10 (6.0%) | 9 (9.8%) |
| 70 to 74 Years | 2 (1.2%) | 0 (0.0%) |
| 75 to 79 Years | 0 (0.0%) | 1 (1.1%) |
| 80 to 84 Years | 2 (1.2%) | 2 (2.2%) |
| 85 Years and over | 3 (1.8%) | 1 (1.1%) |
| Total | 166 (100.0%) | 92 (100.0%) |
Families and Households in Florida
Median Family Size in Florida
The median family size in Florida is 2.76 persons per family, with single male/father families (14 | 27.5%) accounting for the largest median family size of 3.43 persons per family. On the other hand, single female/mother families (8 | 15.7%) represent the smallest median family size with 1.88 persons per family.
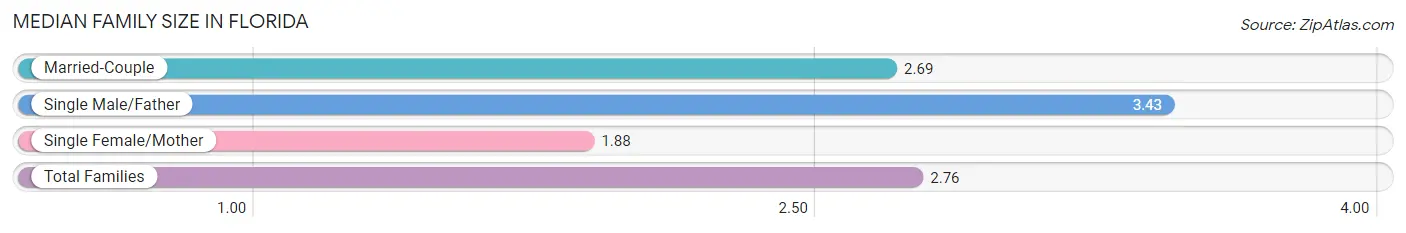
| Family Type | # Families | Family Size |
| Married-Couple | 29 (56.9%) | 2.69 |
| Single Male/Father | 14 (27.5%) | 3.43 |
| Single Female/Mother | 8 (15.7%) | 1.88 |
| Total Families | 51 (100.0%) | 2.76 |
Median Household Size in Florida
The median household size in Florida is 2.08 persons per household, with single male/father households (14 | 11.3%) accounting for the largest median household size of 3.43 persons per household. non-family households (73 | 58.9%) represent the smallest median household size with 1.60 persons per household.
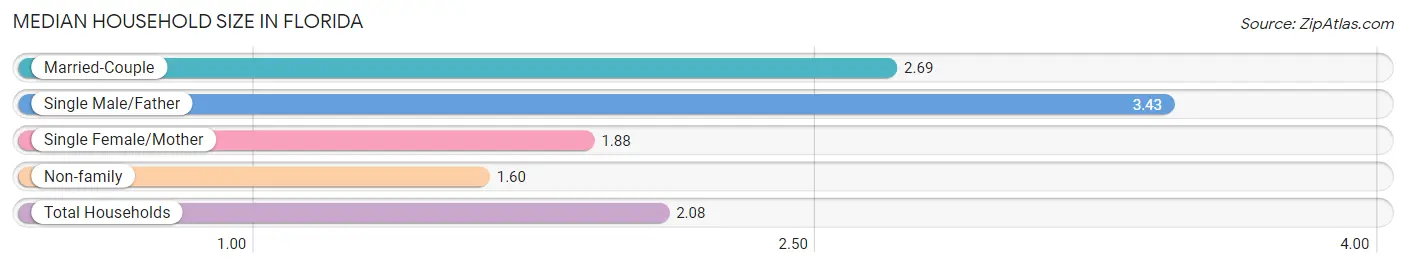
| Household Type | # Households | Household Size |
| Married-Couple | 29 (23.4%) | 2.69 |
| Single Male/Father | 14 (11.3%) | 3.43 |
| Single Female/Mother | 8 (6.5%) | 1.88 |
| Non-family | 73 (58.9%) | 1.60 |
| Total Households | 124 (100.0%) | 2.08 |
Household Size by Marriage Status in Florida
Out of a total of 124 households in Florida, 51 (41.1%) are family households, while 73 (58.9%) are nonfamily households. The most numerous type of family households are 2-person households, comprising 24, and the most common type of nonfamily households are 2-person households, comprising 42.
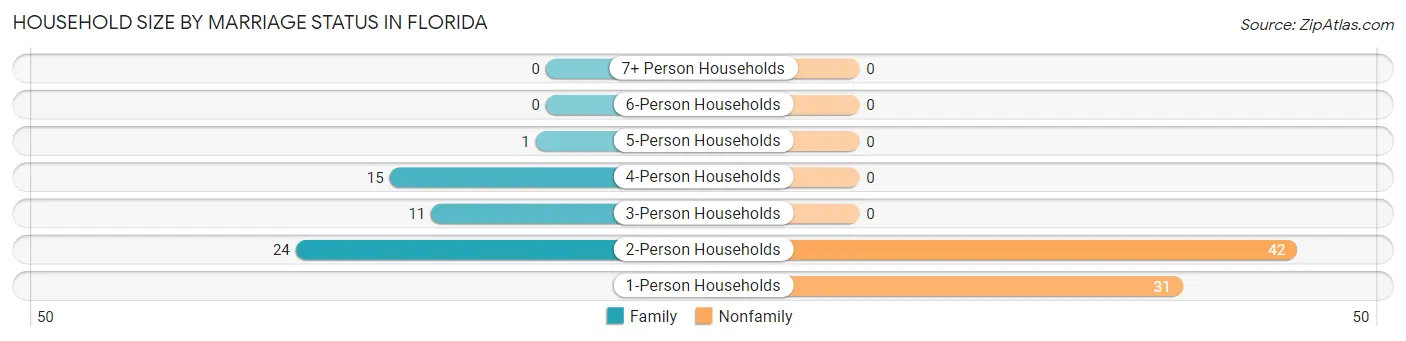
| Household Size | Family Households | Nonfamily Households |
| 1-Person Households | - | 31 (25.0%) |
| 2-Person Households | 24 (19.4%) | 42 (33.9%) |
| 3-Person Households | 11 (8.9%) | 0 (0.0%) |
| 4-Person Households | 15 (12.1%) | 0 (0.0%) |
| 5-Person Households | 1 (0.8%) | 0 (0.0%) |
| 6-Person Households | 0 (0.0%) | 0 (0.0%) |
| 7+ Person Households | 0 (0.0%) | 0 (0.0%) |
| Total | 51 (41.1%) | 73 (58.9%) |
Female Fertility in Florida
Fertility by Age in Florida
Average fertility rate in Florida is 33.0 births per 1,000 women. Women in the age bracket of 20 to 34 years have the highest fertility rate with 100.0 births per 1,000 women. Women in the age bracket of 20 to 34 years acount for 100.0% of all women with births.
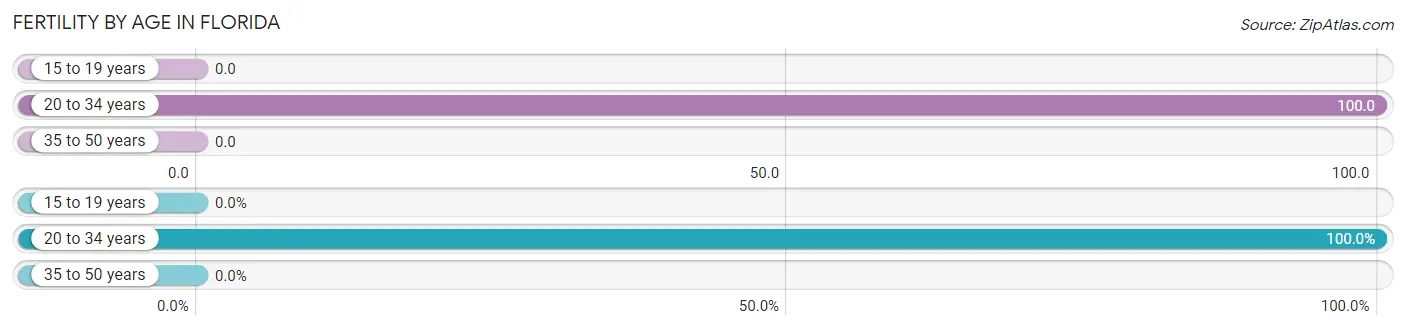
| Age Bracket | Women with Births | Births / 1,000 Women |
| 15 to 19 years | 0 (0.0%) | 0.0 |
| 20 to 34 years | 1 (100.0%) | 100.0 |
| 35 to 50 years | 0 (0.0%) | 0.0 |
| Total | 1 (100.0%) | 33.0 |
Fertility by Age by Marriage Status in Florida
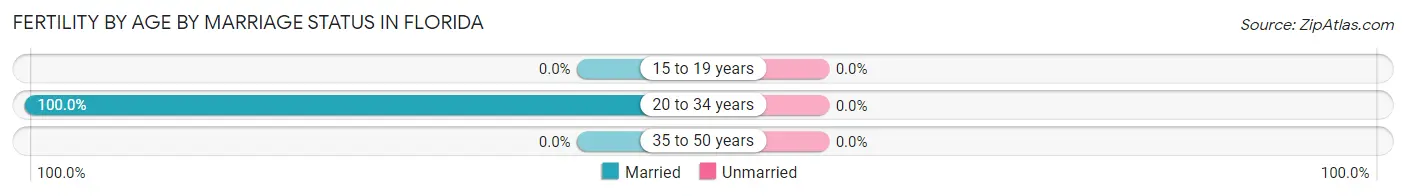
| Age Bracket | Married | Unmarried |
| 15 to 19 years | 0 (0.0%) | 0 (0.0%) |
| 20 to 34 years | 1 (100.0%) | 0 (0.0%) |
| 35 to 50 years | 0 (0.0%) | 0 (0.0%) |
| Total | 1 (100.0%) | 0 (0.0%) |
Fertility by Education in Florida
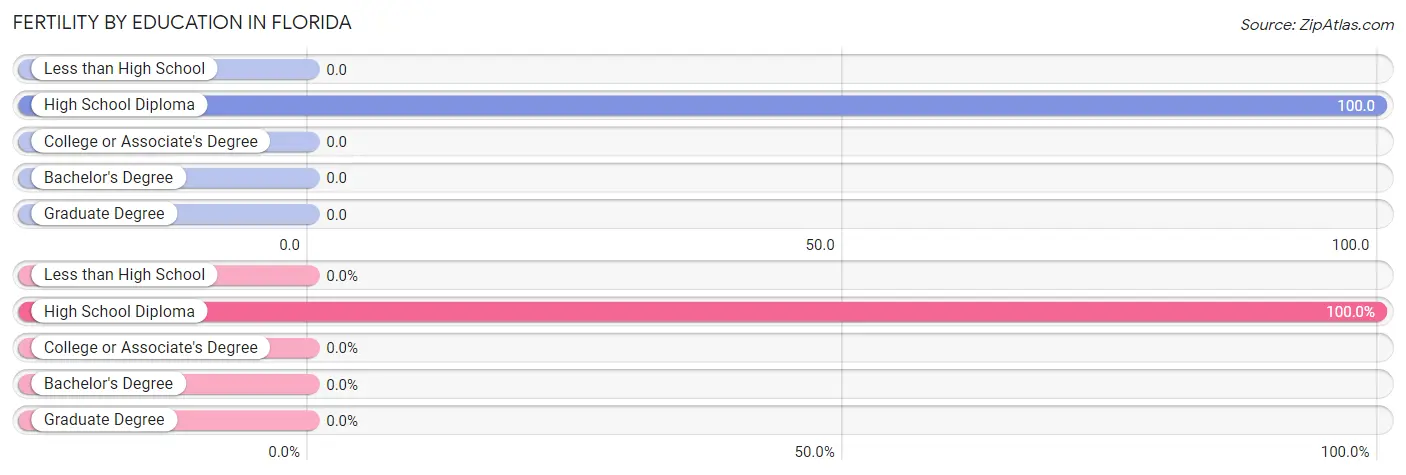
| Educational Attainment | Women with Births | Births / 1,000 Women |
| Less than High School | 0 (0.0%) | 0.0 |
| High School Diploma | 1 (100.0%) | 100.0 |
| College or Associate's Degree | 0 (0.0%) | 0.0 |
| Bachelor's Degree | 0 (0.0%) | 0.0 |
| Graduate Degree | 0 (0.0%) | 0.0 |
| Total | 1 (100.0%) | 33.0 |
Fertility by Education by Marriage Status in Florida
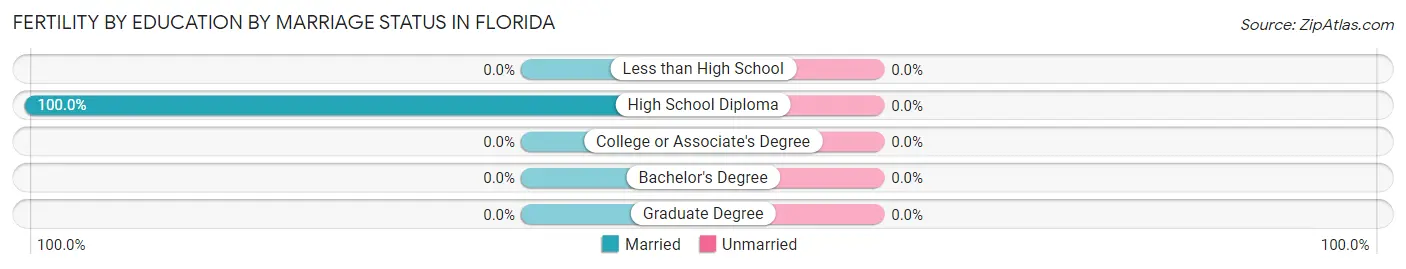
| Educational Attainment | Married | Unmarried |
| Less than High School | 0 (0.0%) | 0 (0.0%) |
| High School Diploma | 1 (100.0%) | 0 (0.0%) |
| College or Associate's Degree | 0 (0.0%) | 0 (0.0%) |
| Bachelor's Degree | 0 (0.0%) | 0 (0.0%) |
| Graduate Degree | 0 (0.0%) | 0 (0.0%) |
| Total | 1 (100.0%) | 0 (0.0%) |
Employment Characteristics in Florida
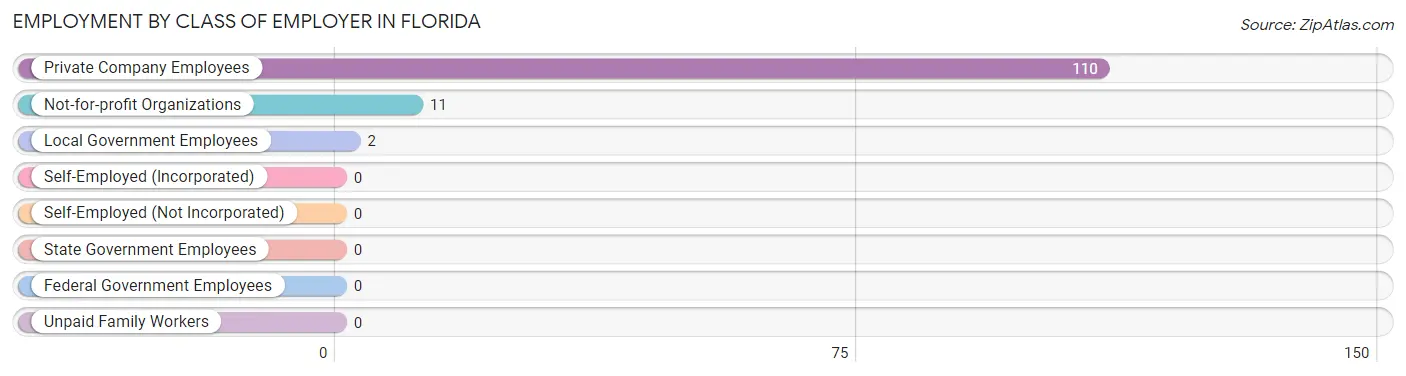
Employment by Class of Employer in Florida
Among the 123 employed individuals in Florida, private company employees (110 | 89.4%), not-for-profit organizations (11 | 8.9%), and local government employees (2 | 1.6%) make up the most common classes of employment.
| Employer Class | # Employees | % Employees |
| Private Company Employees | 110 | 89.4% |
| Self-Employed (Incorporated) | 0 | 0.0% |
| Self-Employed (Not Incorporated) | 0 | 0.0% |
| Not-for-profit Organizations | 11 | 8.9% |
| Local Government Employees | 2 | 1.6% |
| State Government Employees | 0 | 0.0% |
| Federal Government Employees | 0 | 0.0% |
| Unpaid Family Workers | 0 | 0.0% |
| Total | 123 | 100.0% |
Employment Status by Age in Florida
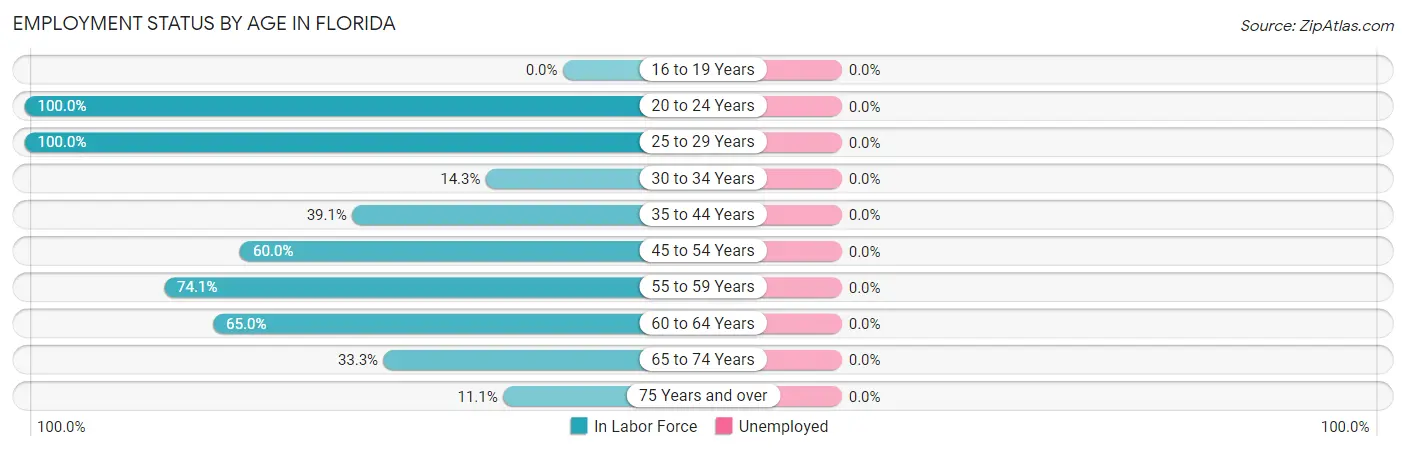
| Age Bracket | In Labor Force | Unemployed |
| 16 to 19 Years | 0 (0.0%) | 0 (0.0%) |
| 20 to 24 Years | 31 (100.0%) | 0 (0.0%) |
| 25 to 29 Years | 4 (100.0%) | 0 (0.0%) |
| 30 to 34 Years | 1 (14.3%) | 0 (0.0%) |
| 35 to 44 Years | 25 (39.1%) | 0 (0.0%) |
| 45 to 54 Years | 6 (60.0%) | 0 (0.0%) |
| 55 to 59 Years | 43 (74.1%) | 0 (0.0%) |
| 60 to 64 Years | 13 (65.0%) | 0 (0.0%) |
| 65 to 74 Years | 7 (33.3%) | 0 (0.0%) |
| 75 Years and over | 1 (11.1%) | 0 (0.0%) |
| Total | 131 (58.2%) | 0 (0.0%) |
Employment Status by Educational Attainment in Florida
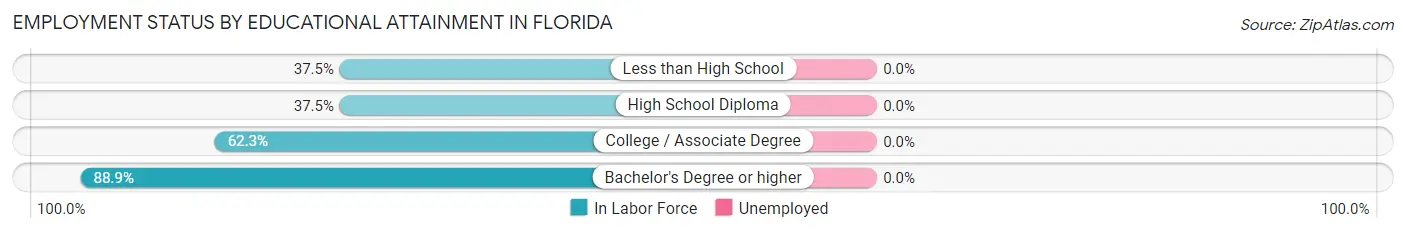
| Educational Attainment | In Labor Force | Unemployed |
| Less than High School | 6 (37.5%) | 0 (0.0%) |
| High School Diploma | 12 (37.5%) | 0 (0.0%) |
| College / Associate Degree | 66 (62.3%) | 0 (0.0%) |
| Bachelor's Degree or higher | 8 (88.9%) | 0 (0.0%) |
| Total | 92 (56.4%) | 0 (0.0%) |
Employment Occupations by Sex in Florida
Management, Business, Science and Arts Occupations
The most common Management, Business, Science and Arts occupations in Florida are Health Diagnosing & Treating (6 | 4.6%), Business & Financial (5 | 3.8%), Health Technologists (2 | 1.5%), Community & Social Service (1 | 0.8%), and Education, Arts & Media (1 | 0.8%).
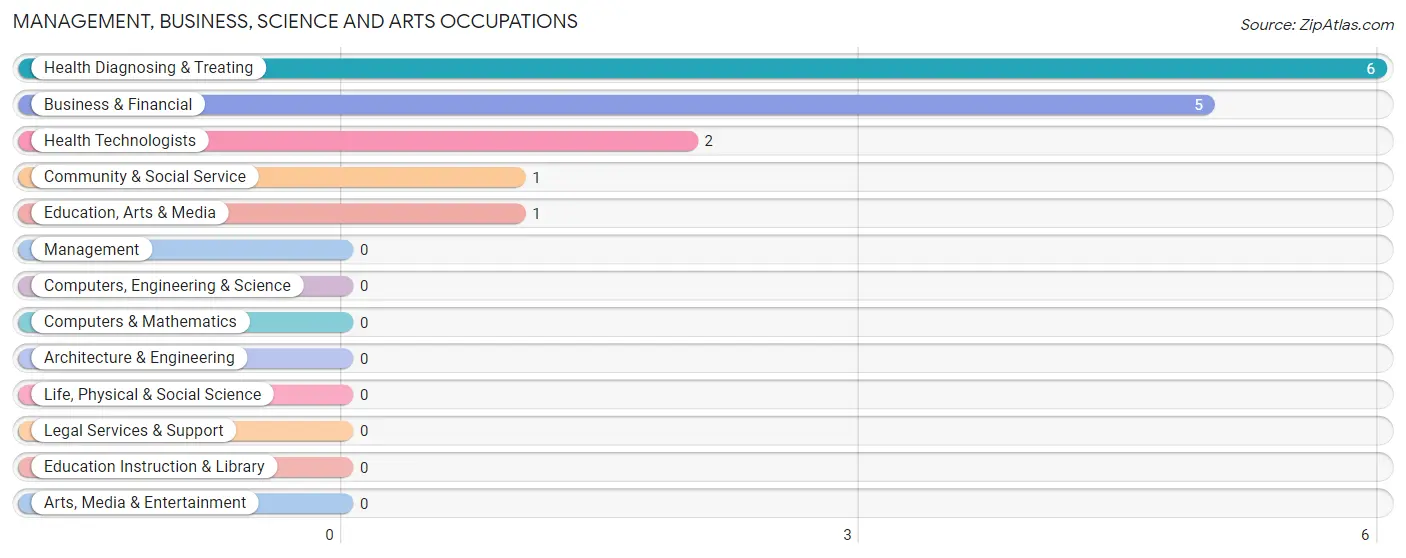
Management, Business, Science and Arts Occupations by Sex
Within the Management, Business, Science and Arts occupations in Florida, the most male-oriented occupations are Community & Social Service (100.0%), and Education, Arts & Media (100.0%), while the most female-oriented occupations are Business & Financial (100.0%), Health Diagnosing & Treating (100.0%), and Health Technologists (100.0%).
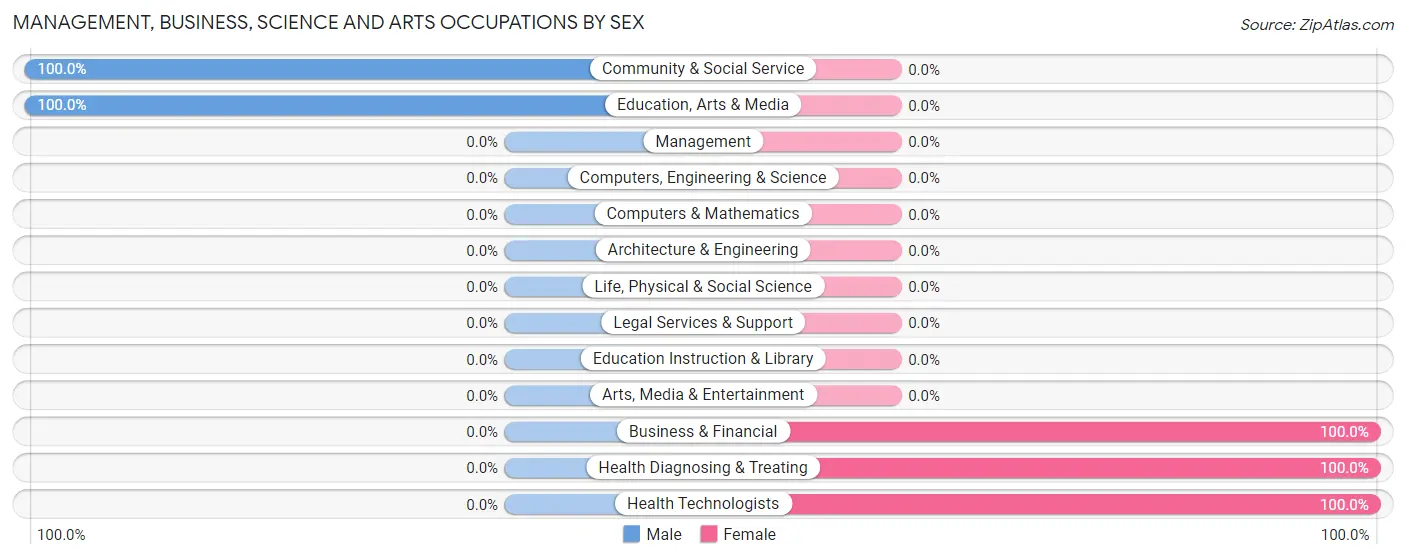
| Occupation | Male | Female |
| Management | 0 (0.0%) | 0 (0.0%) |
| Business & Financial | 0 (0.0%) | 5 (100.0%) |
| Computers, Engineering & Science | 0 (0.0%) | 0 (0.0%) |
| Computers & Mathematics | 0 (0.0%) | 0 (0.0%) |
| Architecture & Engineering | 0 (0.0%) | 0 (0.0%) |
| Life, Physical & Social Science | 0 (0.0%) | 0 (0.0%) |
| Community & Social Service | 1 (100.0%) | 0 (0.0%) |
| Education, Arts & Media | 1 (100.0%) | 0 (0.0%) |
| Legal Services & Support | 0 (0.0%) | 0 (0.0%) |
| Education Instruction & Library | 0 (0.0%) | 0 (0.0%) |
| Arts, Media & Entertainment | 0 (0.0%) | 0 (0.0%) |
| Health Diagnosing & Treating | 0 (0.0%) | 6 (100.0%) |
| Health Technologists | 0 (0.0%) | 2 (100.0%) |
| Total (Category) | 1 (8.3%) | 11 (91.7%) |
| Total (Overall) | 96 (73.3%) | 35 (26.7%) |
Services Occupations
The most common Services occupations in Florida are Food Preparation & Serving (8 | 6.1%), Personal Care & Service (2 | 1.5%), Healthcare Support (1 | 0.8%), Security & Protection (1 | 0.8%), and Law Enforcement (1 | 0.8%).
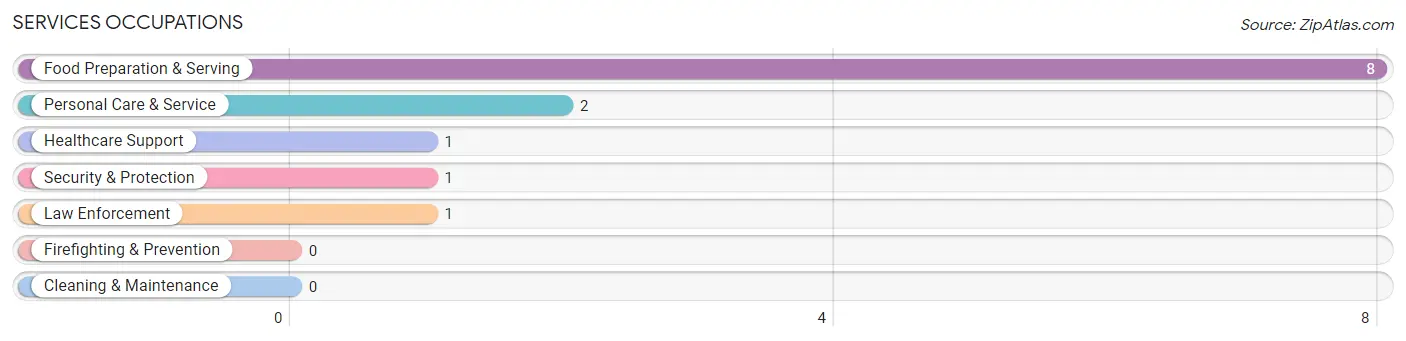
Services Occupations by Sex
Within the Services occupations in Florida, the most male-oriented occupations are Security & Protection (100.0%), and Law Enforcement (100.0%), while the most female-oriented occupations are Healthcare Support (100.0%), Food Preparation & Serving (100.0%), and Personal Care & Service (100.0%).
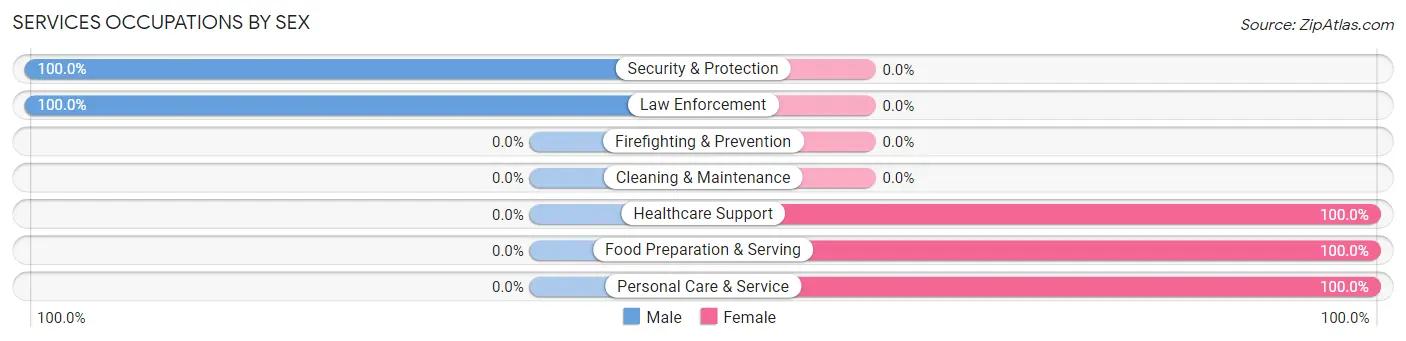
| Occupation | Male | Female |
| Healthcare Support | 0 (0.0%) | 1 (100.0%) |
| Security & Protection | 1 (100.0%) | 0 (0.0%) |
| Firefighting & Prevention | 0 (0.0%) | 0 (0.0%) |
| Law Enforcement | 1 (100.0%) | 0 (0.0%) |
| Food Preparation & Serving | 0 (0.0%) | 8 (100.0%) |
| Cleaning & Maintenance | 0 (0.0%) | 0 (0.0%) |
| Personal Care & Service | 0 (0.0%) | 2 (100.0%) |
| Total (Category) | 1 (8.3%) | 11 (91.7%) |
| Total (Overall) | 96 (73.3%) | 35 (26.7%) |
Sales and Office Occupations
The most common Sales and Office occupations in Florida are Office & Administration (8 | 6.1%), and Sales & Related (2 | 1.5%).
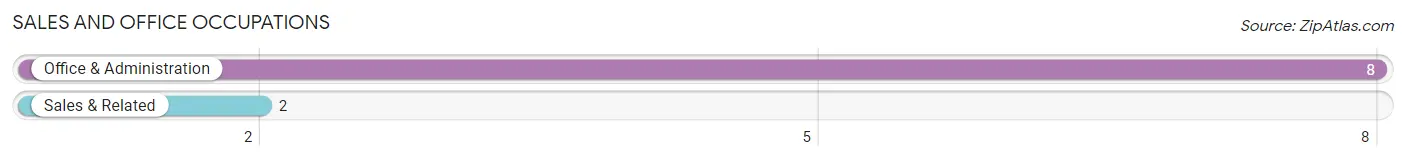
Sales and Office Occupations by Sex
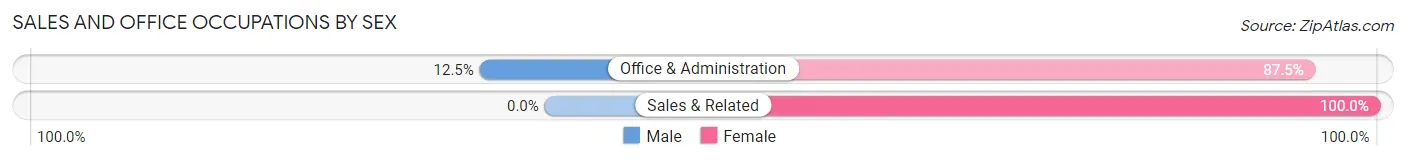
| Occupation | Male | Female |
| Sales & Related | 0 (0.0%) | 2 (100.0%) |
| Office & Administration | 1 (12.5%) | 7 (87.5%) |
| Total (Category) | 1 (10.0%) | 9 (90.0%) |
| Total (Overall) | 96 (73.3%) | 35 (26.7%) |
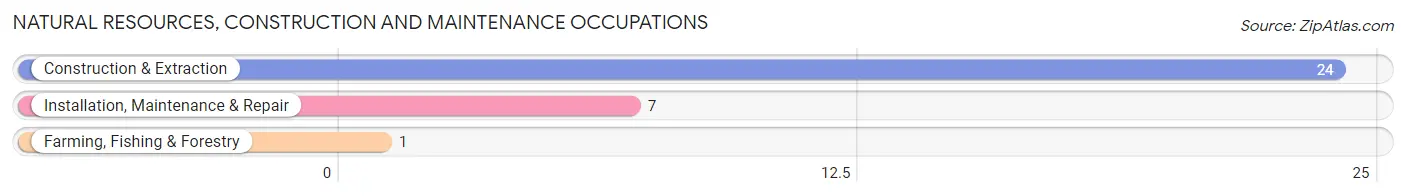
Natural Resources, Construction and Maintenance Occupations
The most common Natural Resources, Construction and Maintenance occupations in Florida are Construction & Extraction (24 | 18.3%), Installation, Maintenance & Repair (7 | 5.3%), and Farming, Fishing & Forestry (1 | 0.8%).
Natural Resources, Construction and Maintenance Occupations by Sex
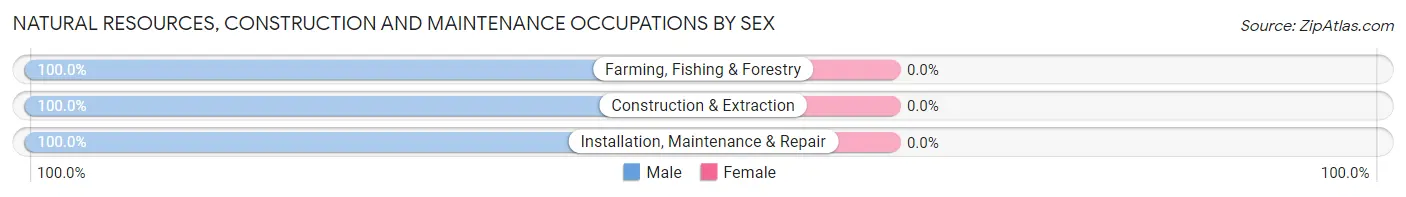
| Occupation | Male | Female |
| Farming, Fishing & Forestry | 1 (100.0%) | 0 (0.0%) |
| Construction & Extraction | 24 (100.0%) | 0 (0.0%) |
| Installation, Maintenance & Repair | 7 (100.0%) | 0 (0.0%) |
| Total (Category) | 32 (100.0%) | 0 (0.0%) |
| Total (Overall) | 96 (73.3%) | 35 (26.7%) |
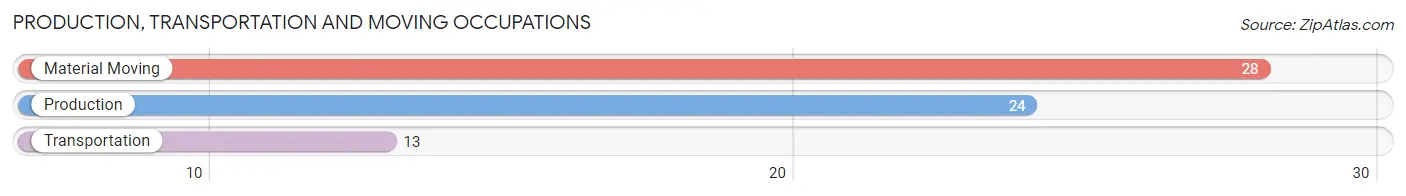
Production, Transportation and Moving Occupations
The most common Production, Transportation and Moving occupations in Florida are Material Moving (28 | 21.4%), Production (24 | 18.3%), and Transportation (13 | 9.9%).
Production, Transportation and Moving Occupations by Sex
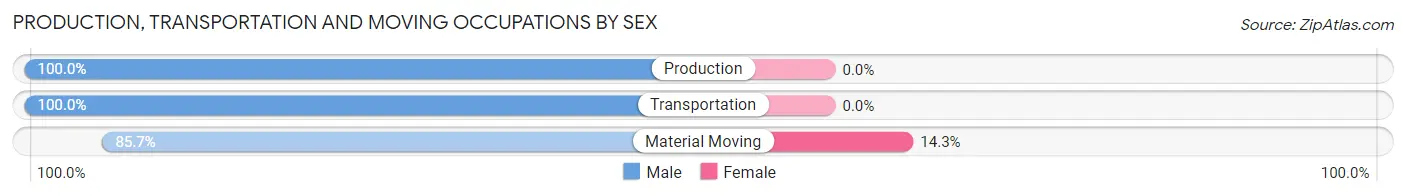
| Occupation | Male | Female |
| Production | 24 (100.0%) | 0 (0.0%) |
| Transportation | 13 (100.0%) | 0 (0.0%) |
| Material Moving | 24 (85.7%) | 4 (14.3%) |
| Total (Category) | 61 (93.9%) | 4 (6.1%) |
| Total (Overall) | 96 (73.3%) | 35 (26.7%) |
Employment Industries by Sex in Florida
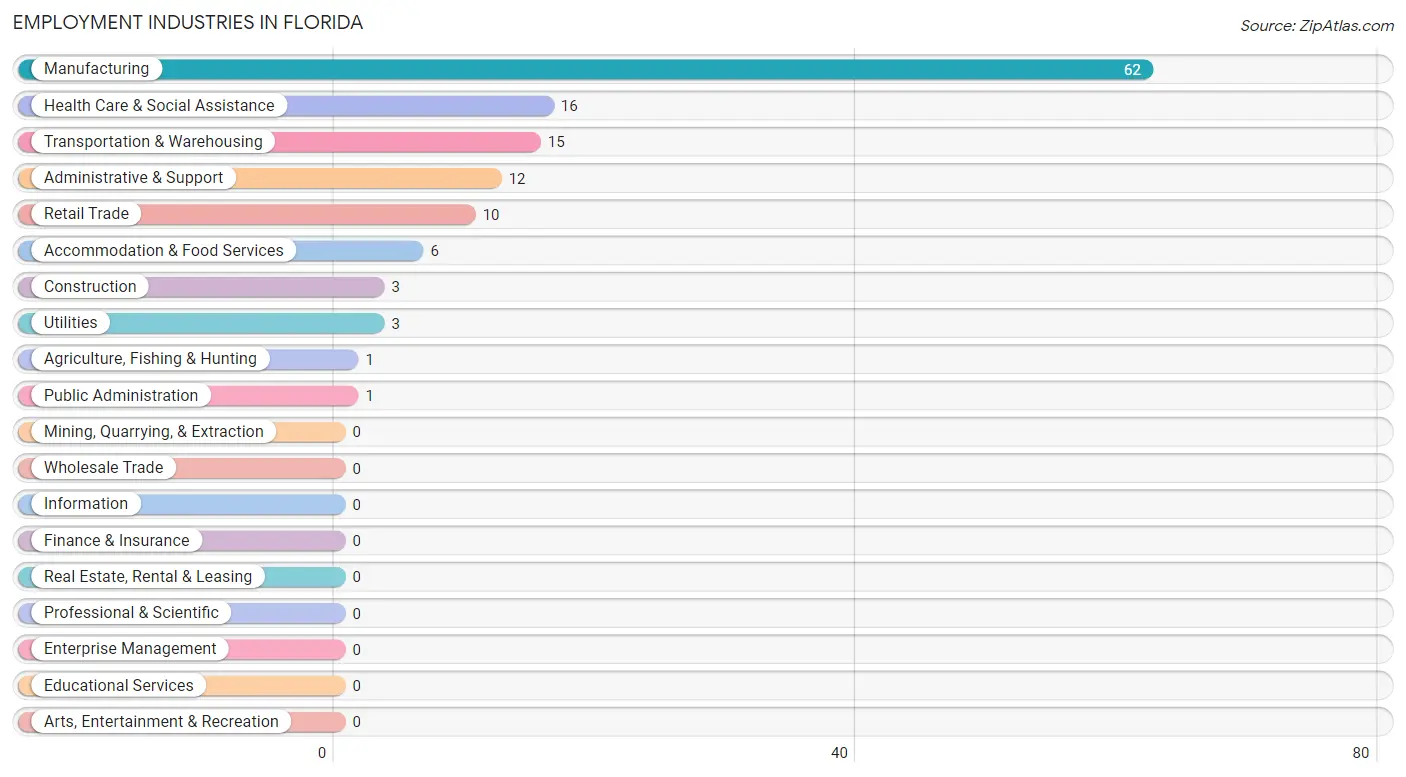
Employment Industries in Florida
The major employment industries in Florida include Manufacturing (62 | 47.3%), Health Care & Social Assistance (16 | 12.2%), Transportation & Warehousing (15 | 11.5%), Administrative & Support (12 | 9.2%), and Retail Trade (10 | 7.6%).
Employment Industries by Sex in Florida
The Florida industries that see more men than women are Agriculture, Fishing & Hunting (100.0%), Construction (100.0%), and Utilities (100.0%), whereas the industries that tend to have a higher number of women are Accommodation & Food Services (100.0%), Health Care & Social Assistance (87.5%), and Retail Trade (40.0%).
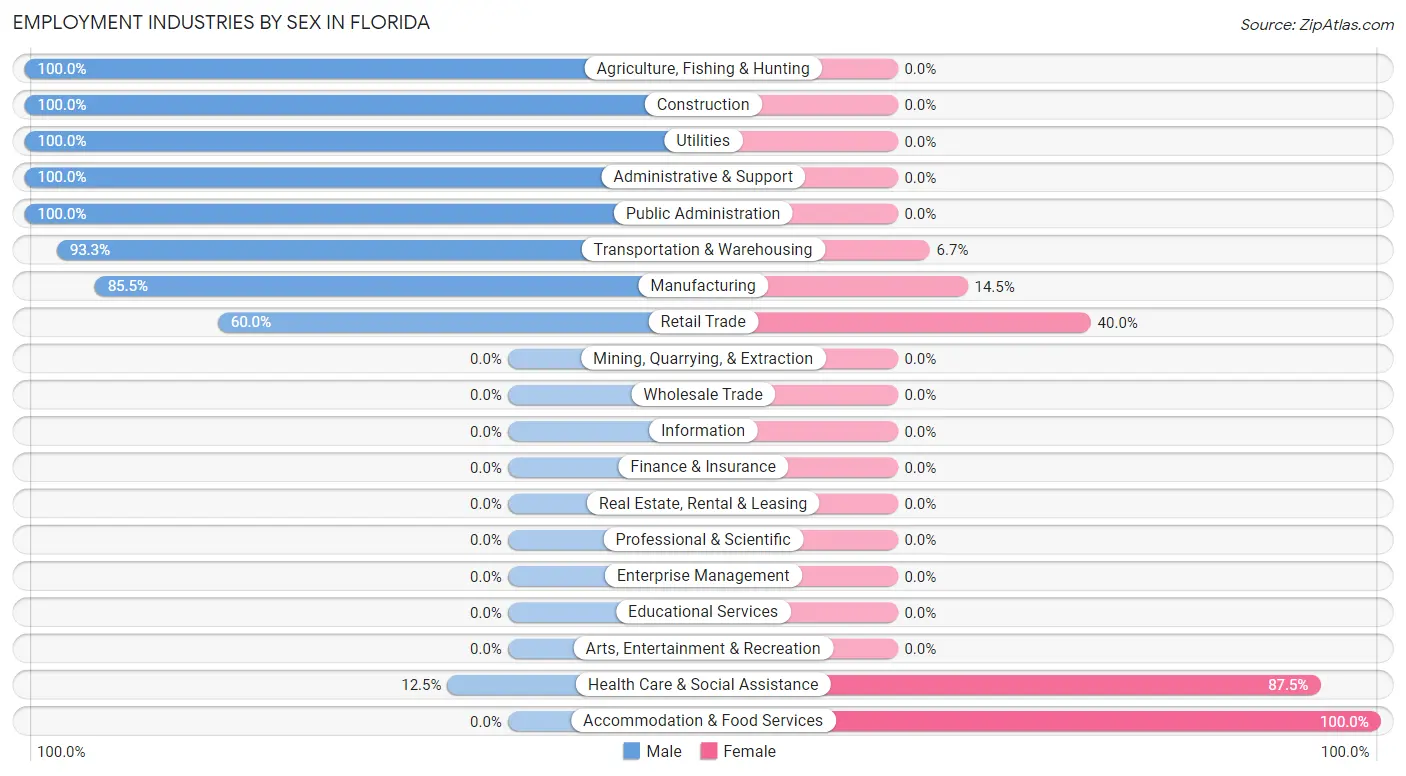
| Industry | Male | Female |
| Agriculture, Fishing & Hunting | 1 (100.0%) | 0 (0.0%) |
| Mining, Quarrying, & Extraction | 0 (0.0%) | 0 (0.0%) |
| Construction | 3 (100.0%) | 0 (0.0%) |
| Manufacturing | 53 (85.5%) | 9 (14.5%) |
| Wholesale Trade | 0 (0.0%) | 0 (0.0%) |
| Retail Trade | 6 (60.0%) | 4 (40.0%) |
| Transportation & Warehousing | 14 (93.3%) | 1 (6.7%) |
| Utilities | 3 (100.0%) | 0 (0.0%) |
| Information | 0 (0.0%) | 0 (0.0%) |
| Finance & Insurance | 0 (0.0%) | 0 (0.0%) |
| Real Estate, Rental & Leasing | 0 (0.0%) | 0 (0.0%) |
| Professional & Scientific | 0 (0.0%) | 0 (0.0%) |
| Enterprise Management | 0 (0.0%) | 0 (0.0%) |
| Administrative & Support | 12 (100.0%) | 0 (0.0%) |
| Educational Services | 0 (0.0%) | 0 (0.0%) |
| Health Care & Social Assistance | 2 (12.5%) | 14 (87.5%) |
| Arts, Entertainment & Recreation | 0 (0.0%) | 0 (0.0%) |
| Accommodation & Food Services | 0 (0.0%) | 6 (100.0%) |
| Public Administration | 1 (100.0%) | 0 (0.0%) |
| Total | 96 (73.3%) | 35 (26.7%) |
Education in Florida
School Enrollment in Florida
The most common levels of schooling among the 21 students in Florida are middle school (8 | 38.1%), elementary school (6 | 28.6%), and high school (4 | 19.1%).
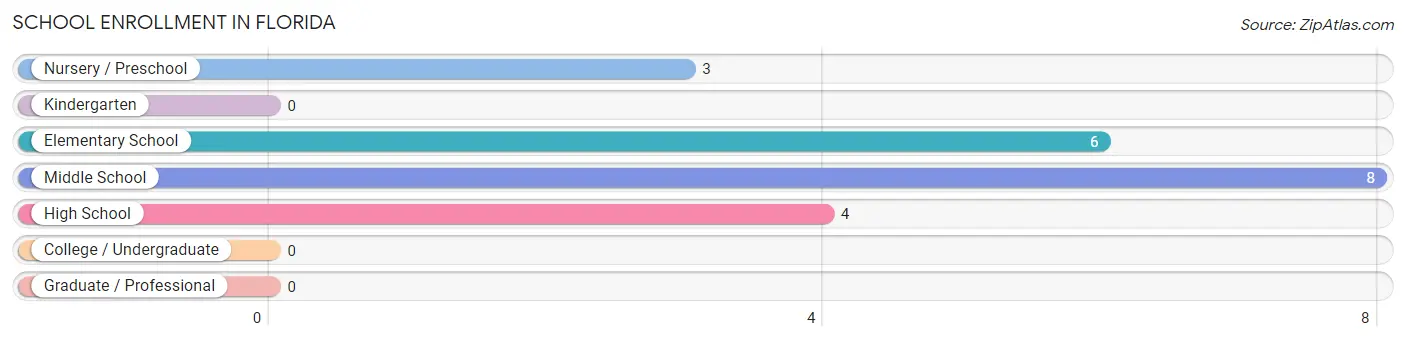
| School Level | # Students | % Students |
| Nursery / Preschool | 3 | 14.3% |
| Kindergarten | 0 | 0.0% |
| Elementary School | 6 | 28.6% |
| Middle School | 8 | 38.1% |
| High School | 4 | 19.1% |
| College / Undergraduate | 0 | 0.0% |
| Graduate / Professional | 0 | 0.0% |
| Total | 21 | 100.0% |
School Enrollment by Age by Funding Source in Florida
Out of a total of 21 students who are enrolled in schools in Florida, 5 (23.8%) attend a private institution, while the remaining 16 (76.2%) are enrolled in public schools. The age group of 3 to 4 year olds has the highest likelihood of being enrolled in private schools, with 1 (100.0% in the age bracket) enrolled. Conversely, the age group of 10 to 14 year olds has the lowest likelihood of being enrolled in a private school, with 9 (90.0% in the age bracket) attending a public institution.
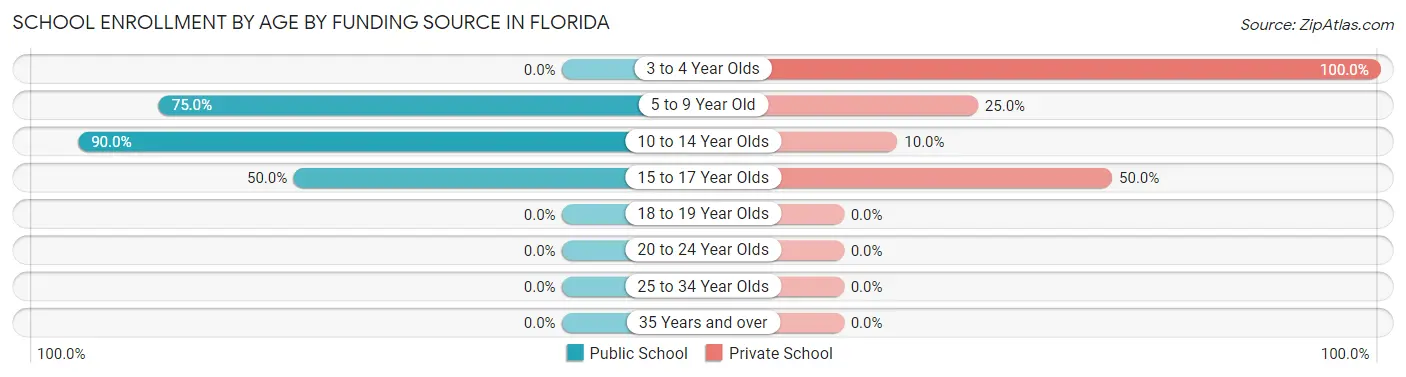
| Age Bracket | Public School | Private School |
| 3 to 4 Year Olds | 0 (0.0%) | 1 (100.0%) |
| 5 to 9 Year Old | 6 (75.0%) | 2 (25.0%) |
| 10 to 14 Year Olds | 9 (90.0%) | 1 (10.0%) |
| 15 to 17 Year Olds | 1 (50.0%) | 1 (50.0%) |
| 18 to 19 Year Olds | 0 (0.0%) | 0 (0.0%) |
| 20 to 24 Year Olds | 0 (0.0%) | 0 (0.0%) |
| 25 to 34 Year Olds | 0 (0.0%) | 0 (0.0%) |
| 35 Years and over | 0 (0.0%) | 0 (0.0%) |
| Total | 16 (76.2%) | 5 (23.8%) |
Educational Attainment by Field of Study in Florida
Education (6 | 50.0%), liberal arts & history (3 | 25.0%), business (2 | 16.7%), and social sciences (1 | 8.3%) are the most common fields of study among 12 individuals in Florida who have obtained a bachelor's degree or higher.
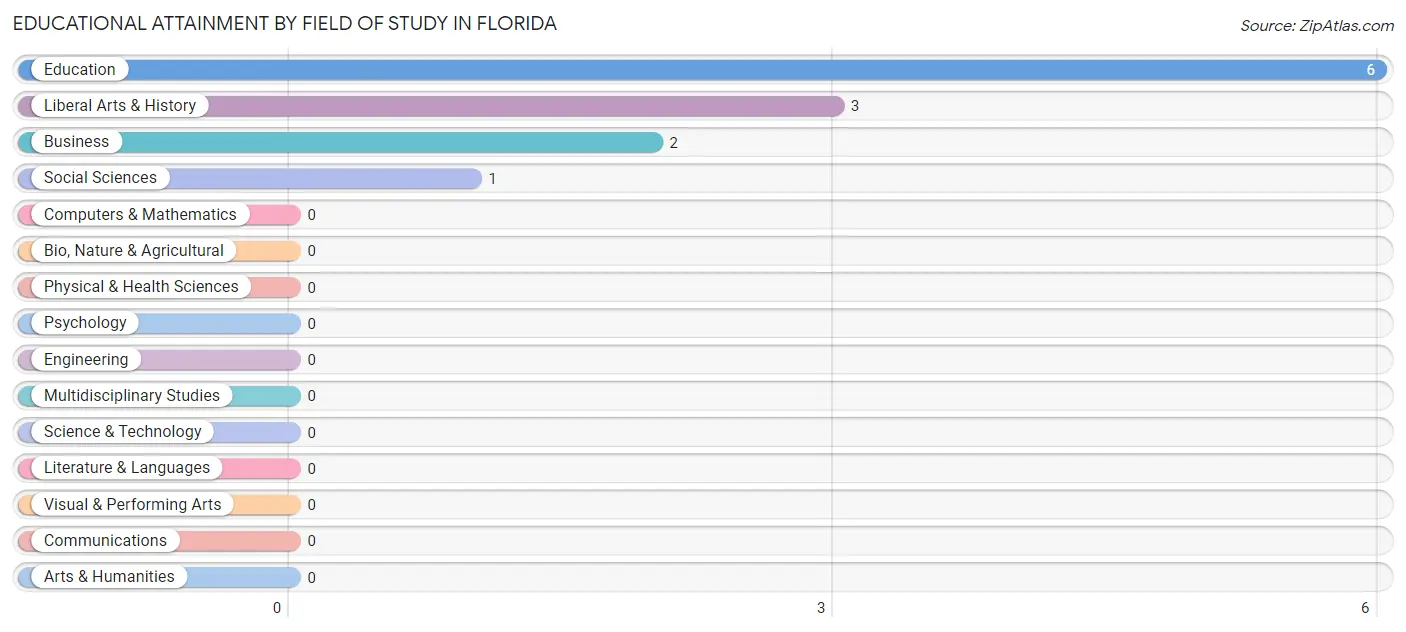
| Field of Study | # Graduates | % Graduates |
| Computers & Mathematics | 0 | 0.0% |
| Bio, Nature & Agricultural | 0 | 0.0% |
| Physical & Health Sciences | 0 | 0.0% |
| Psychology | 0 | 0.0% |
| Social Sciences | 1 | 8.3% |
| Engineering | 0 | 0.0% |
| Multidisciplinary Studies | 0 | 0.0% |
| Science & Technology | 0 | 0.0% |
| Business | 2 | 16.7% |
| Education | 6 | 50.0% |
| Literature & Languages | 0 | 0.0% |
| Liberal Arts & History | 3 | 25.0% |
| Visual & Performing Arts | 0 | 0.0% |
| Communications | 0 | 0.0% |
| Arts & Humanities | 0 | 0.0% |
| Total | 12 | 100.0% |
Transportation & Commute in Florida
Vehicle Availability by Sex in Florida
The most prevalent vehicle ownership categories in Florida are males with 2 vehicles (53, accounting for 55.2%) and females with 2 vehicles (13, making up 196.3%).
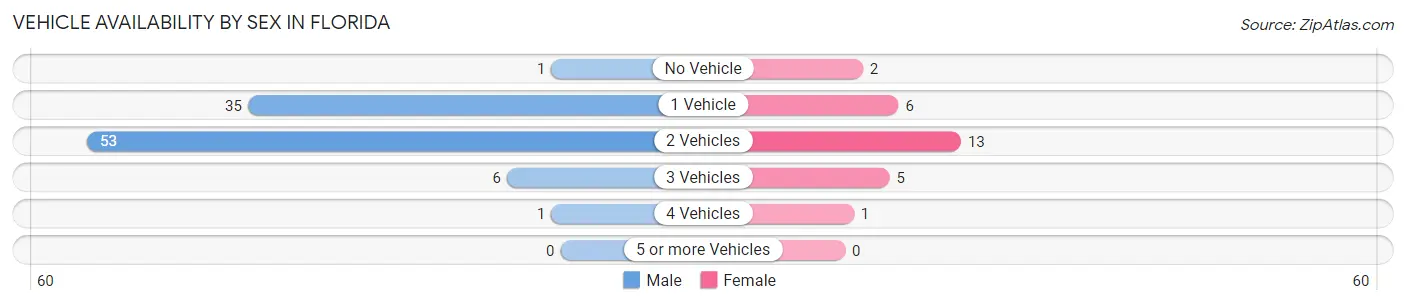
| Vehicles Available | Male | Female |
| No Vehicle | 1 (1.0%) | 2 (7.4%) |
| 1 Vehicle | 35 (36.5%) | 6 (22.2%) |
| 2 Vehicles | 53 (55.2%) | 13 (48.1%) |
| 3 Vehicles | 6 (6.2%) | 5 (18.5%) |
| 4 Vehicles | 1 (1.0%) | 1 (3.7%) |
| 5 or more Vehicles | 0 (0.0%) | 0 (0.0%) |
| Total | 96 (100.0%) | 27 (100.0%) |
Commute Time in Florida
The most frequently occuring commute durations in Florida are 15 to 19 minutes (28 commuters, 24.3%), 10 to 14 minutes (25 commuters, 21.7%), and 45 to 59 minutes (23 commuters, 20.0%).
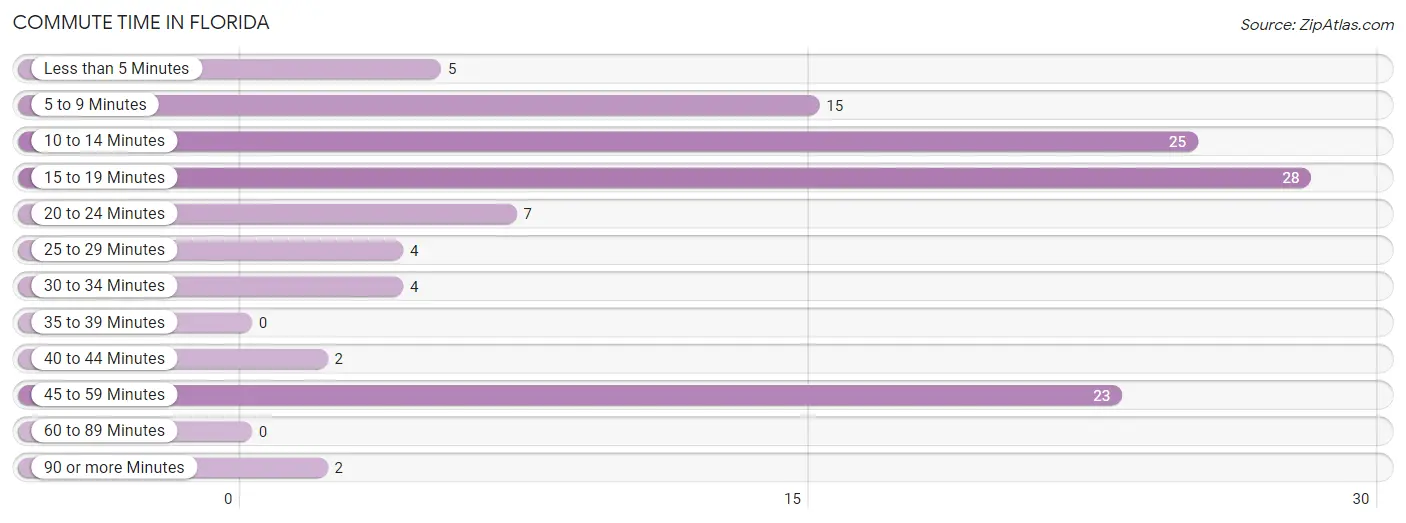
| Commute Time | # Commuters | % Commuters |
| Less than 5 Minutes | 5 | 4.3% |
| 5 to 9 Minutes | 15 | 13.0% |
| 10 to 14 Minutes | 25 | 21.7% |
| 15 to 19 Minutes | 28 | 24.3% |
| 20 to 24 Minutes | 7 | 6.1% |
| 25 to 29 Minutes | 4 | 3.5% |
| 30 to 34 Minutes | 4 | 3.5% |
| 35 to 39 Minutes | 0 | 0.0% |
| 40 to 44 Minutes | 2 | 1.7% |
| 45 to 59 Minutes | 23 | 20.0% |
| 60 to 89 Minutes | 0 | 0.0% |
| 90 or more Minutes | 2 | 1.7% |
Commute Time by Sex in Florida
The most common commute times in Florida are 10 to 14 minutes (25 commuters, 28.4%) for males and 15 to 19 minutes (11 commuters, 40.7%) for females.
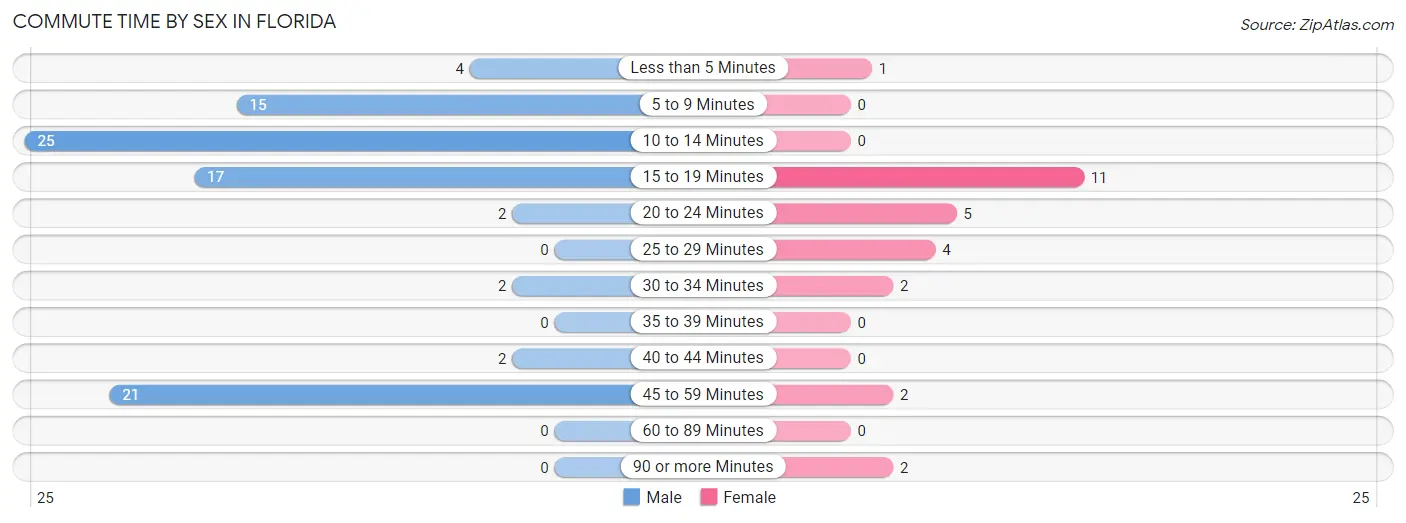
| Commute Time | Male | Female |
| Less than 5 Minutes | 4 (4.5%) | 1 (3.7%) |
| 5 to 9 Minutes | 15 (17.1%) | 0 (0.0%) |
| 10 to 14 Minutes | 25 (28.4%) | 0 (0.0%) |
| 15 to 19 Minutes | 17 (19.3%) | 11 (40.7%) |
| 20 to 24 Minutes | 2 (2.3%) | 5 (18.5%) |
| 25 to 29 Minutes | 0 (0.0%) | 4 (14.8%) |
| 30 to 34 Minutes | 2 (2.3%) | 2 (7.4%) |
| 35 to 39 Minutes | 0 (0.0%) | 0 (0.0%) |
| 40 to 44 Minutes | 2 (2.3%) | 0 (0.0%) |
| 45 to 59 Minutes | 21 (23.9%) | 2 (7.4%) |
| 60 to 89 Minutes | 0 (0.0%) | 0 (0.0%) |
| 90 or more Minutes | 0 (0.0%) | 2 (7.4%) |
Time of Departure to Work by Sex in Florida
The most frequent times of departure to work in Florida are 12:00 PM to 3:59 PM (34, 38.6%) for males and 4:00 PM to 11:59 PM (8, 29.6%) for females.
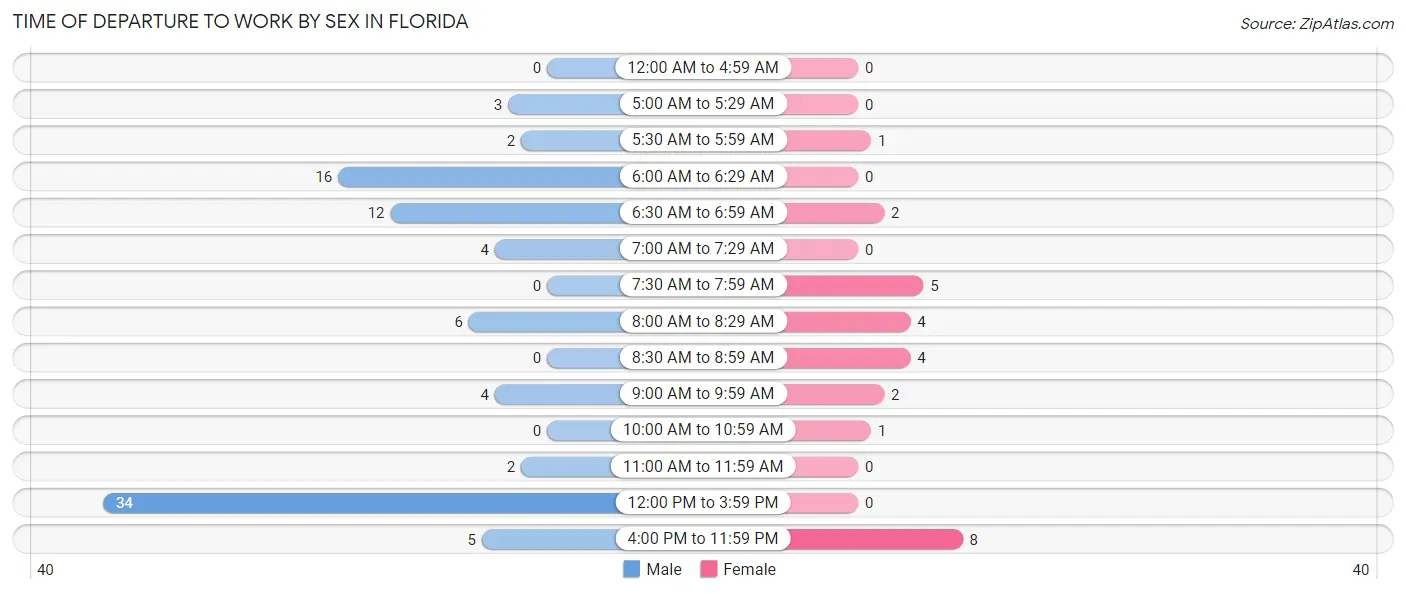
| Time of Departure | Male | Female |
| 12:00 AM to 4:59 AM | 0 (0.0%) | 0 (0.0%) |
| 5:00 AM to 5:29 AM | 3 (3.4%) | 0 (0.0%) |
| 5:30 AM to 5:59 AM | 2 (2.3%) | 1 (3.7%) |
| 6:00 AM to 6:29 AM | 16 (18.2%) | 0 (0.0%) |
| 6:30 AM to 6:59 AM | 12 (13.6%) | 2 (7.4%) |
| 7:00 AM to 7:29 AM | 4 (4.5%) | 0 (0.0%) |
| 7:30 AM to 7:59 AM | 0 (0.0%) | 5 (18.5%) |
| 8:00 AM to 8:29 AM | 6 (6.8%) | 4 (14.8%) |
| 8:30 AM to 8:59 AM | 0 (0.0%) | 4 (14.8%) |
| 9:00 AM to 9:59 AM | 4 (4.5%) | 2 (7.4%) |
| 10:00 AM to 10:59 AM | 0 (0.0%) | 1 (3.7%) |
| 11:00 AM to 11:59 AM | 2 (2.3%) | 0 (0.0%) |
| 12:00 PM to 3:59 PM | 34 (38.6%) | 0 (0.0%) |
| 4:00 PM to 11:59 PM | 5 (5.7%) | 8 (29.6%) |
| Total | 88 (100.0%) | 27 (100.0%) |
Housing Occupancy in Florida
Occupancy by Ownership in Florida
Of the total 124 dwellings in Florida, owner-occupied units account for 84 (67.7%), while renter-occupied units make up 40 (32.3%).
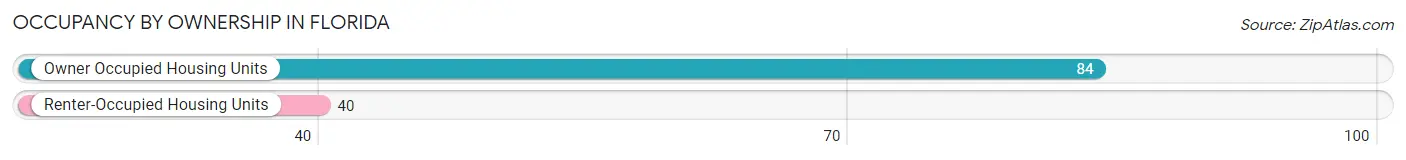
| Occupancy | # Housing Units | % Housing Units |
| Owner Occupied Housing Units | 84 | 67.7% |
| Renter-Occupied Housing Units | 40 | 32.3% |
| Total Occupied Housing Units | 124 | 100.0% |
Occupancy by Household Size in Florida
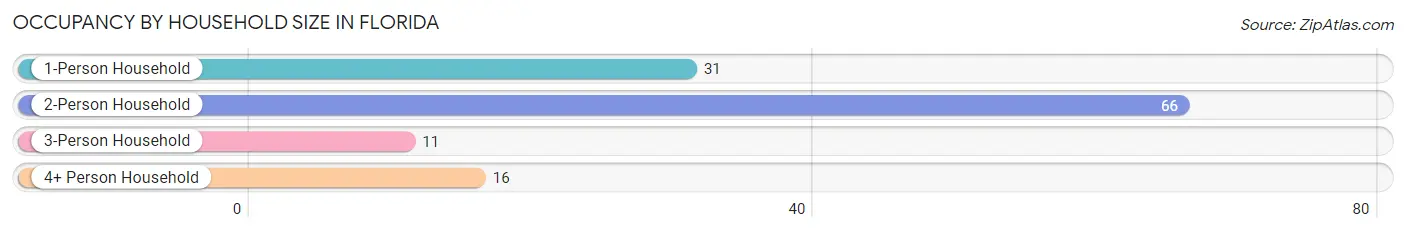
| Household Size | # Housing Units | % Housing Units |
| 1-Person Household | 31 | 25.0% |
| 2-Person Household | 66 | 53.2% |
| 3-Person Household | 11 | 8.9% |
| 4+ Person Household | 16 | 12.9% |
| Total Housing Units | 124 | 100.0% |
Occupancy by Ownership by Household Size in Florida
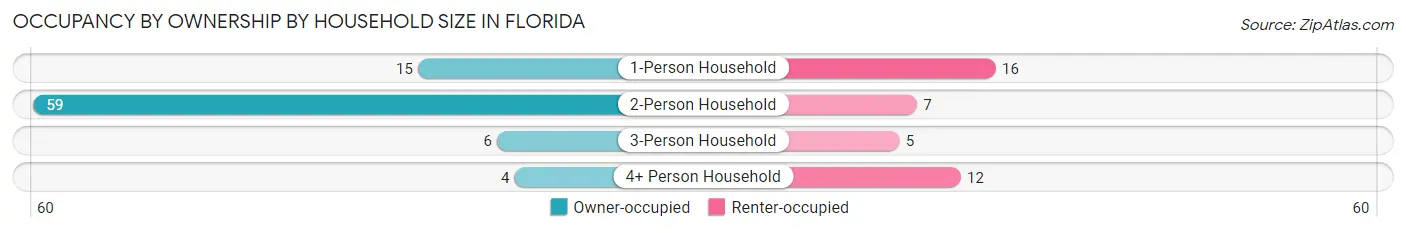
| Household Size | Owner-occupied | Renter-occupied |
| 1-Person Household | 15 (48.4%) | 16 (51.6%) |
| 2-Person Household | 59 (89.4%) | 7 (10.6%) |
| 3-Person Household | 6 (54.5%) | 5 (45.5%) |
| 4+ Person Household | 4 (25.0%) | 12 (75.0%) |
| Total Housing Units | 84 (67.7%) | 40 (32.3%) |
Occupancy by Educational Attainment in Florida
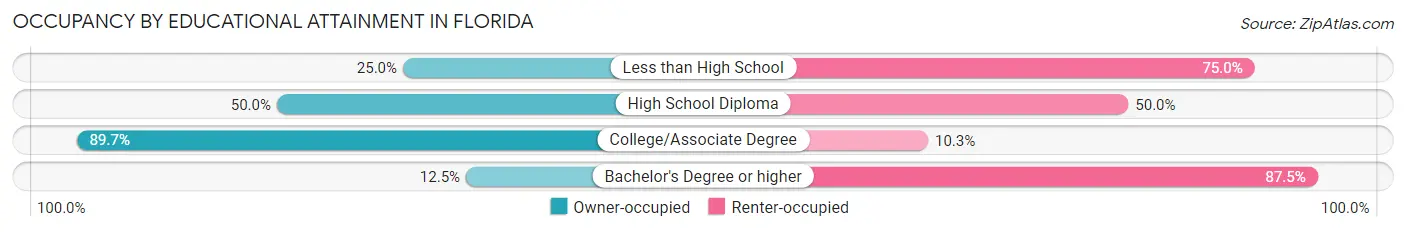
| Household Size | Owner-occupied | Renter-occupied |
| Less than High School | 2 (25.0%) | 6 (75.0%) |
| High School Diploma | 20 (50.0%) | 20 (50.0%) |
| College/Associate Degree | 61 (89.7%) | 7 (10.3%) |
| Bachelor's Degree or higher | 1 (12.5%) | 7 (87.5%) |
Occupancy by Age of Householder in Florida
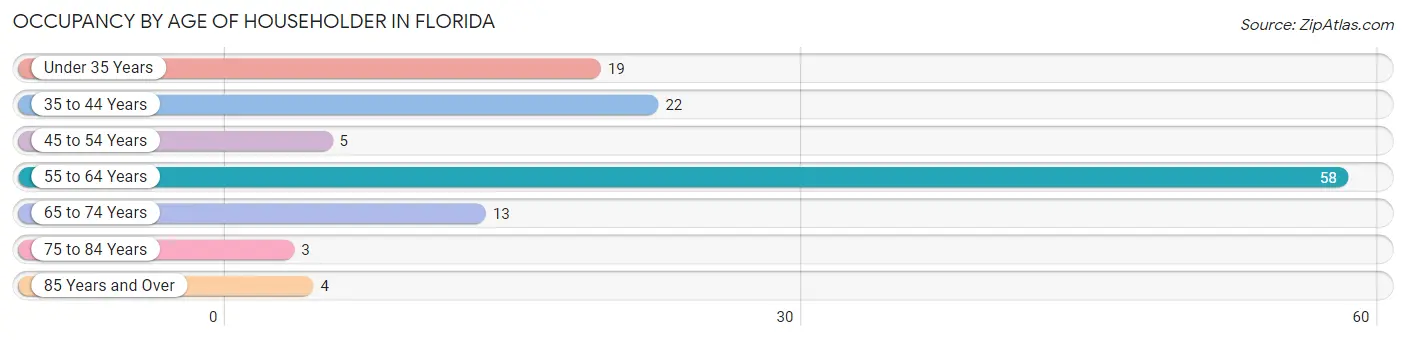
| Age Bracket | # Households | % Households |
| Under 35 Years | 19 | 15.3% |
| 35 to 44 Years | 22 | 17.7% |
| 45 to 54 Years | 5 | 4.0% |
| 55 to 64 Years | 58 | 46.8% |
| 65 to 74 Years | 13 | 10.5% |
| 75 to 84 Years | 3 | 2.4% |
| 85 Years and Over | 4 | 3.2% |
| Total | 124 | 100.0% |
Housing Finances in Florida
Median Income by Occupancy in Florida
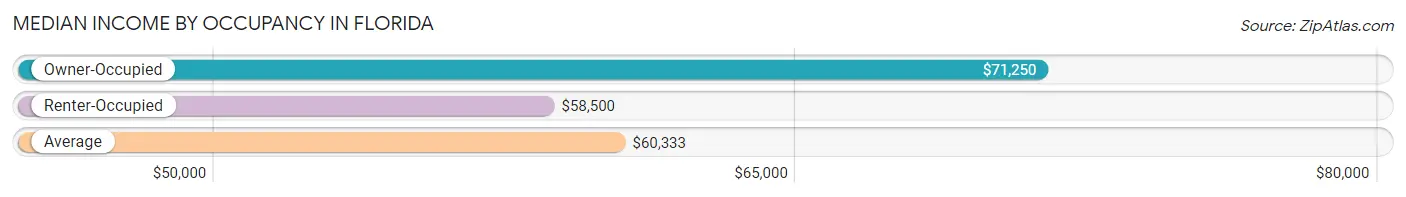
| Occupancy Type | # Households | Median Income |
| Owner-Occupied | 84 (67.7%) | $71,250 |
| Renter-Occupied | 40 (32.3%) | $58,500 |
| Average | 124 (100.0%) | $60,333 |
Occupancy by Householder Income Bracket in Florida
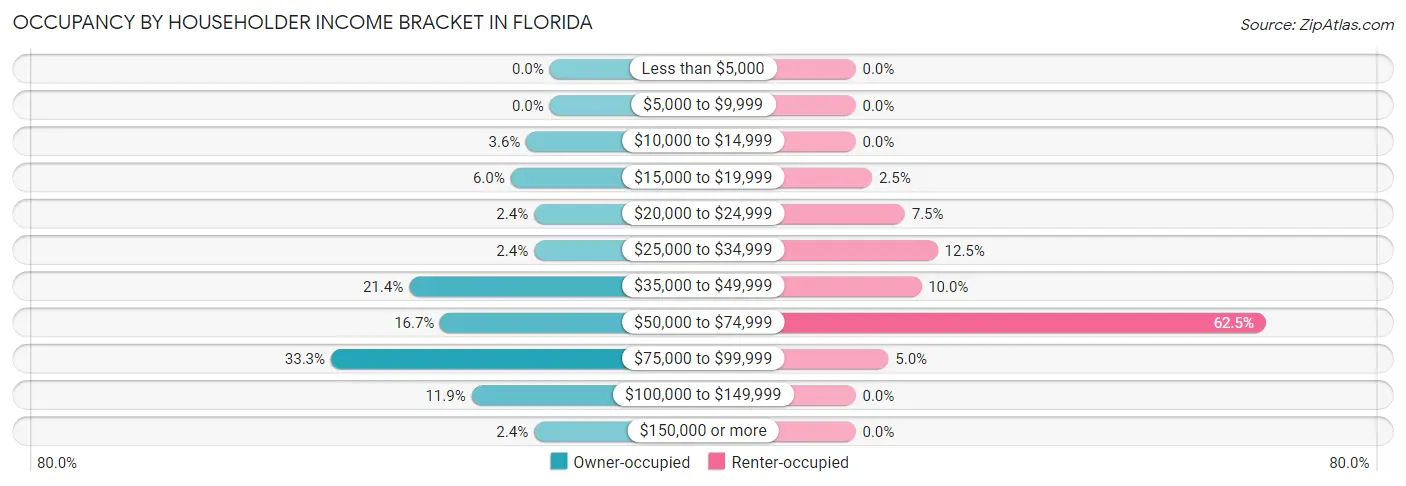
| Income Bracket | Owner-occupied | Renter-occupied |
| Less than $5,000 | 0 (0.0%) | 0 (0.0%) |
| $5,000 to $9,999 | 0 (0.0%) | 0 (0.0%) |
| $10,000 to $14,999 | 3 (3.6%) | 0 (0.0%) |
| $15,000 to $19,999 | 5 (5.9%) | 1 (2.5%) |
| $20,000 to $24,999 | 2 (2.4%) | 3 (7.5%) |
| $25,000 to $34,999 | 2 (2.4%) | 5 (12.5%) |
| $35,000 to $49,999 | 18 (21.4%) | 4 (10.0%) |
| $50,000 to $74,999 | 14 (16.7%) | 25 (62.5%) |
| $75,000 to $99,999 | 28 (33.3%) | 2 (5.0%) |
| $100,000 to $149,999 | 10 (11.9%) | 0 (0.0%) |
| $150,000 or more | 2 (2.4%) | 0 (0.0%) |
| Total | 84 (100.0%) | 40 (100.0%) |
Monthly Housing Cost Tiers in Florida
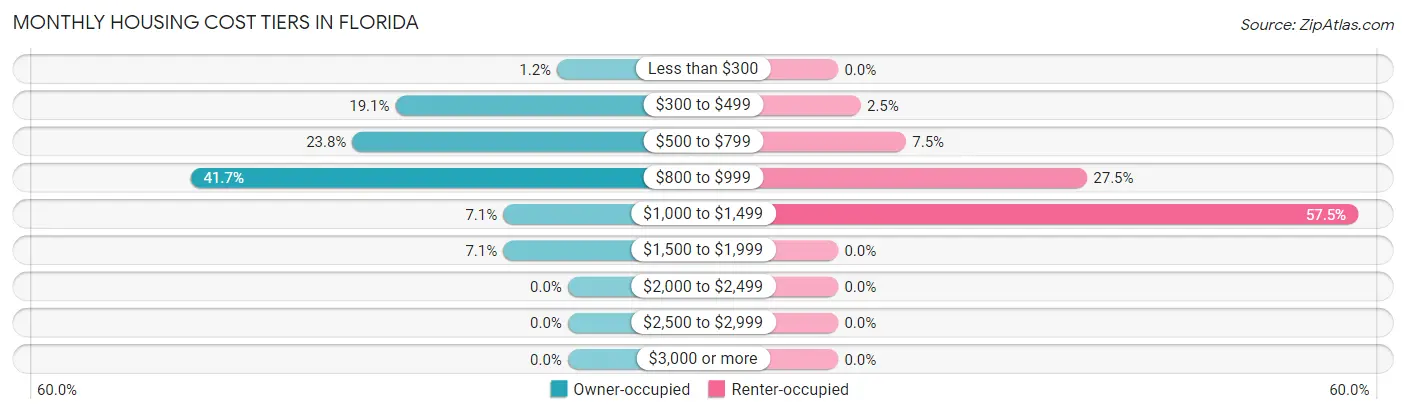
| Monthly Cost | Owner-occupied | Renter-occupied |
| Less than $300 | 1 (1.2%) | 0 (0.0%) |
| $300 to $499 | 16 (19.1%) | 1 (2.5%) |
| $500 to $799 | 20 (23.8%) | 3 (7.5%) |
| $800 to $999 | 35 (41.7%) | 11 (27.5%) |
| $1,000 to $1,499 | 6 (7.1%) | 23 (57.5%) |
| $1,500 to $1,999 | 6 (7.1%) | 0 (0.0%) |
| $2,000 to $2,499 | 0 (0.0%) | 0 (0.0%) |
| $2,500 to $2,999 | 0 (0.0%) | 0 (0.0%) |
| $3,000 or more | 0 (0.0%) | 0 (0.0%) |
| Total | 84 (100.0%) | 40 (100.0%) |
Physical Housing Characteristics in Florida
Housing Structures in Florida
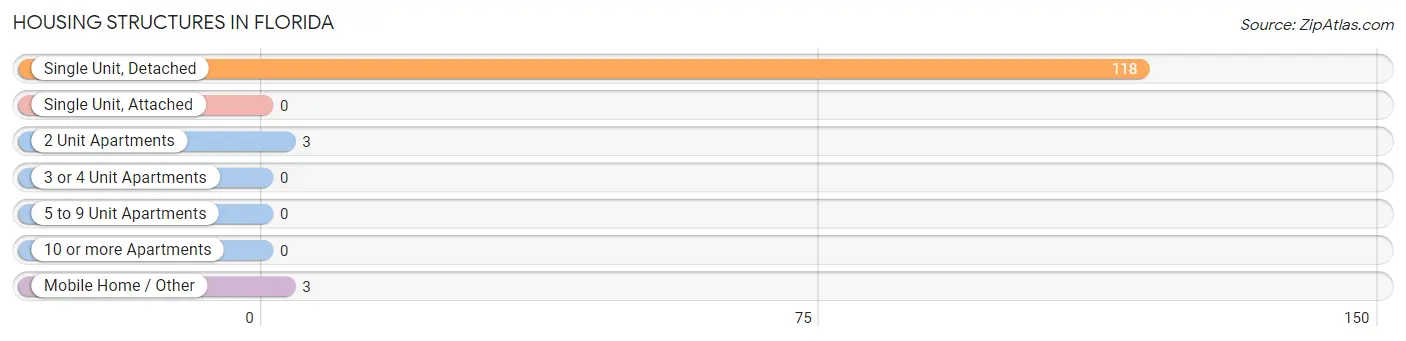
| Structure Type | # Housing Units | % Housing Units |
| Single Unit, Detached | 118 | 95.2% |
| Single Unit, Attached | 0 | 0.0% |
| 2 Unit Apartments | 3 | 2.4% |
| 3 or 4 Unit Apartments | 0 | 0.0% |
| 5 to 9 Unit Apartments | 0 | 0.0% |
| 10 or more Apartments | 0 | 0.0% |
| Mobile Home / Other | 3 | 2.4% |
| Total | 124 | 100.0% |
Housing Structures by Occupancy in Florida
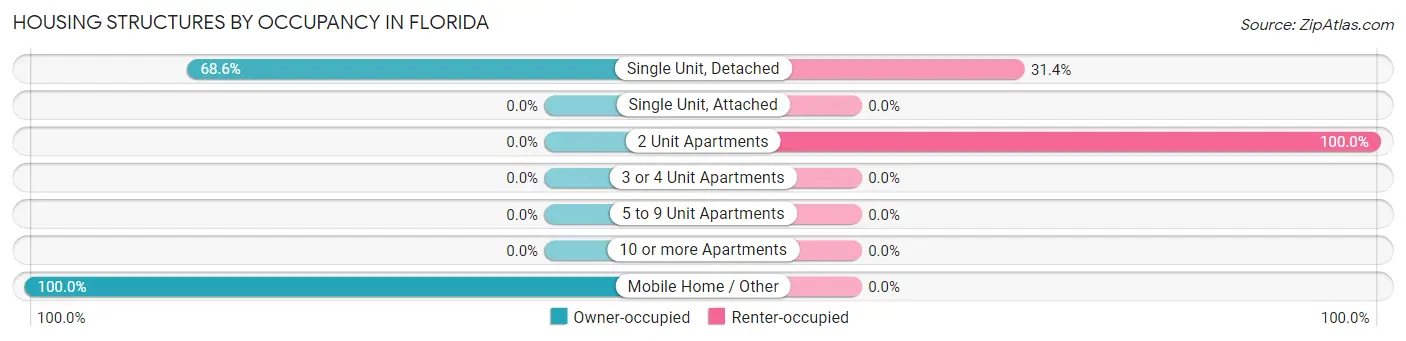
| Structure Type | Owner-occupied | Renter-occupied |
| Single Unit, Detached | 81 (68.6%) | 37 (31.4%) |
| Single Unit, Attached | 0 (0.0%) | 0 (0.0%) |
| 2 Unit Apartments | 0 (0.0%) | 3 (100.0%) |
| 3 or 4 Unit Apartments | 0 (0.0%) | 0 (0.0%) |
| 5 to 9 Unit Apartments | 0 (0.0%) | 0 (0.0%) |
| 10 or more Apartments | 0 (0.0%) | 0 (0.0%) |
| Mobile Home / Other | 3 (100.0%) | 0 (0.0%) |
| Total | 84 (67.7%) | 40 (32.3%) |
Housing Structures by Number of Rooms in Florida
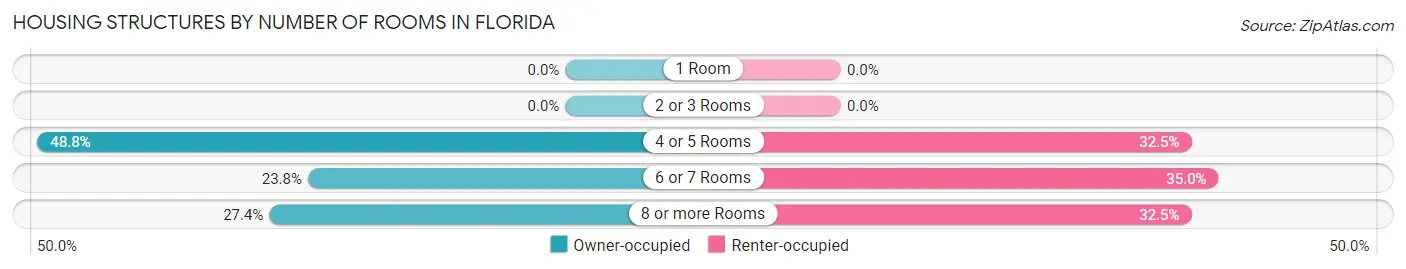
| Number of Rooms | Owner-occupied | Renter-occupied |
| 1 Room | 0 (0.0%) | 0 (0.0%) |
| 2 or 3 Rooms | 0 (0.0%) | 0 (0.0%) |
| 4 or 5 Rooms | 41 (48.8%) | 13 (32.5%) |
| 6 or 7 Rooms | 20 (23.8%) | 14 (35.0%) |
| 8 or more Rooms | 23 (27.4%) | 13 (32.5%) |
| Total | 84 (100.0%) | 40 (100.0%) |
Housing Structure by Heating Type in Florida
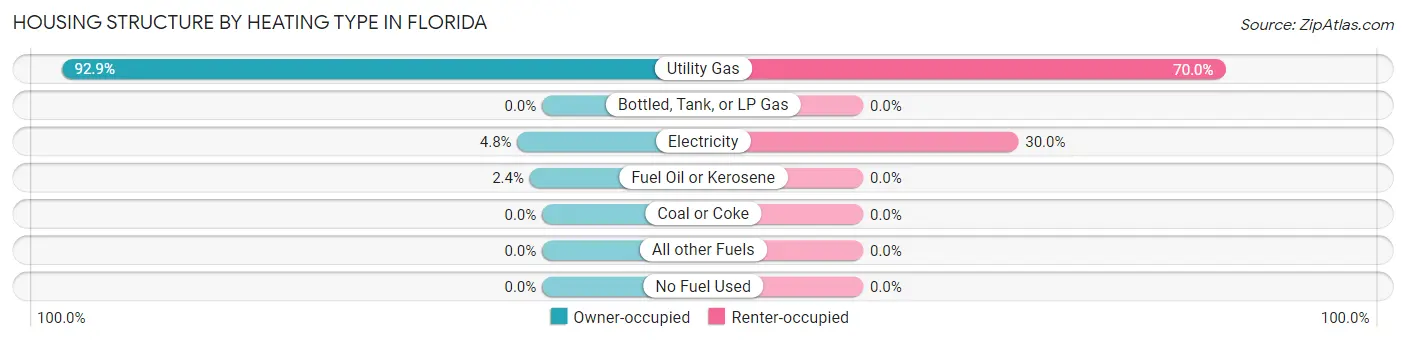
| Heating Type | Owner-occupied | Renter-occupied |
| Utility Gas | 78 (92.9%) | 28 (70.0%) |
| Bottled, Tank, or LP Gas | 0 (0.0%) | 0 (0.0%) |
| Electricity | 4 (4.8%) | 12 (30.0%) |
| Fuel Oil or Kerosene | 2 (2.4%) | 0 (0.0%) |
| Coal or Coke | 0 (0.0%) | 0 (0.0%) |
| All other Fuels | 0 (0.0%) | 0 (0.0%) |
| No Fuel Used | 0 (0.0%) | 0 (0.0%) |
| Total | 84 (100.0%) | 40 (100.0%) |
Household Vehicle Usage in Florida
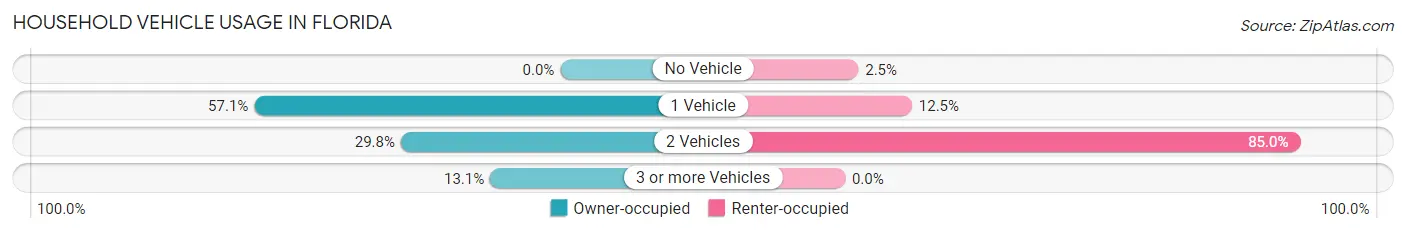
| Vehicles per Household | Owner-occupied | Renter-occupied |
| No Vehicle | 0 (0.0%) | 1 (2.5%) |
| 1 Vehicle | 48 (57.1%) | 5 (12.5%) |
| 2 Vehicles | 25 (29.8%) | 34 (85.0%) |
| 3 or more Vehicles | 11 (13.1%) | 0 (0.0%) |
| Total | 84 (100.0%) | 40 (100.0%) |
Real Estate & Mortgages in Florida
Real Estate and Mortgage Overview in Florida
| Characteristic | Without Mortgage | With Mortgage |
| Housing Units | 22 | 62 |
| Median Property Value | $97,500 | $63,800 |
| Median Household Income | $56,250 | $2 |
| Monthly Housing Costs | $560 | $0 |
| Real Estate Taxes | $1,667 | $0 |
Property Value by Mortgage Status in Florida
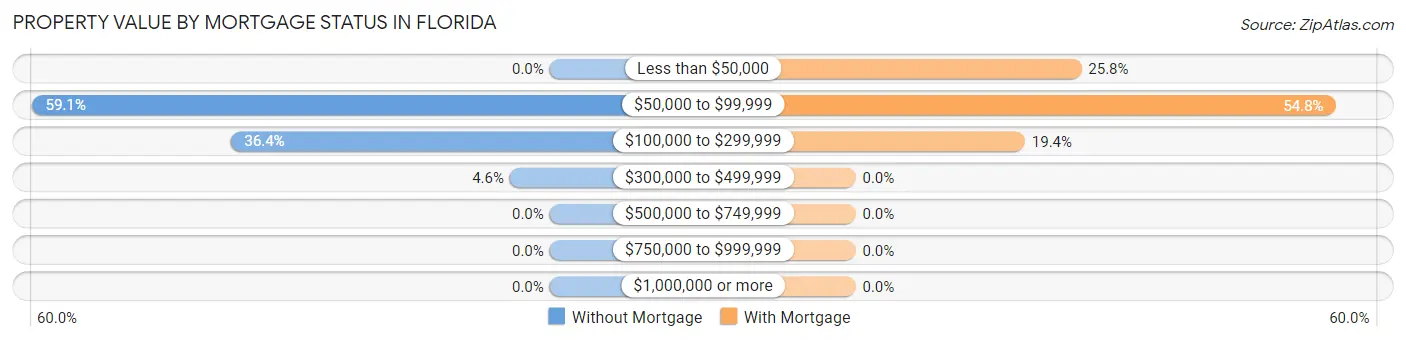
| Property Value | Without Mortgage | With Mortgage |
| Less than $50,000 | 0 (0.0%) | 16 (25.8%) |
| $50,000 to $99,999 | 13 (59.1%) | 34 (54.8%) |
| $100,000 to $299,999 | 8 (36.4%) | 12 (19.4%) |
| $300,000 to $499,999 | 1 (4.5%) | 0 (0.0%) |
| $500,000 to $749,999 | 0 (0.0%) | 0 (0.0%) |
| $750,000 to $999,999 | 0 (0.0%) | 0 (0.0%) |
| $1,000,000 or more | 0 (0.0%) | 0 (0.0%) |
| Total | 22 (100.0%) | 62 (100.0%) |
Household Income by Mortgage Status in Florida
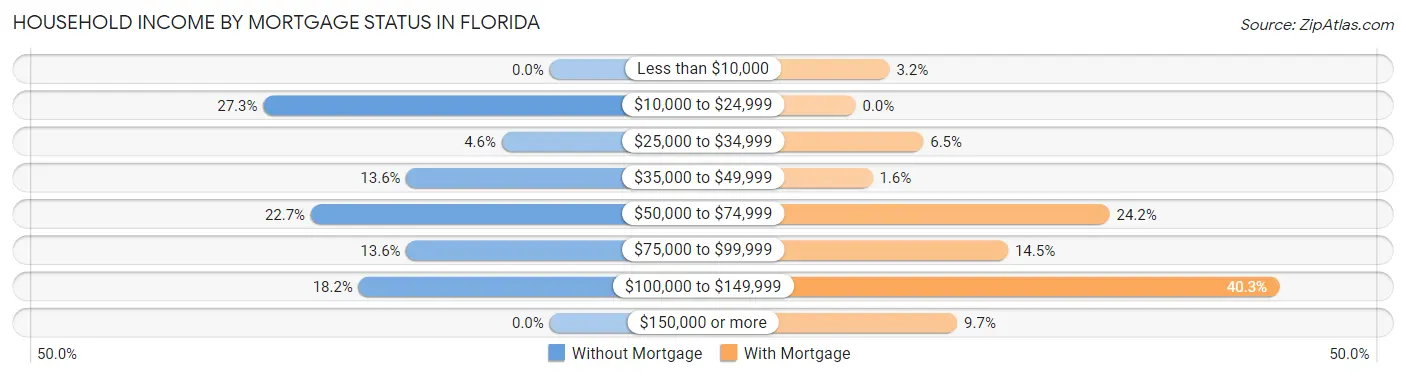
| Household Income | Without Mortgage | With Mortgage |
| Less than $10,000 | 0 (0.0%) | 2 (3.2%) |
| $10,000 to $24,999 | 6 (27.3%) | 0 (0.0%) |
| $25,000 to $34,999 | 1 (4.5%) | 4 (6.5%) |
| $35,000 to $49,999 | 3 (13.6%) | 1 (1.6%) |
| $50,000 to $74,999 | 5 (22.7%) | 15 (24.2%) |
| $75,000 to $99,999 | 3 (13.6%) | 9 (14.5%) |
| $100,000 to $149,999 | 4 (18.2%) | 25 (40.3%) |
| $150,000 or more | 0 (0.0%) | 6 (9.7%) |
| Total | 22 (100.0%) | 62 (100.0%) |
Property Value to Household Income Ratio in Florida
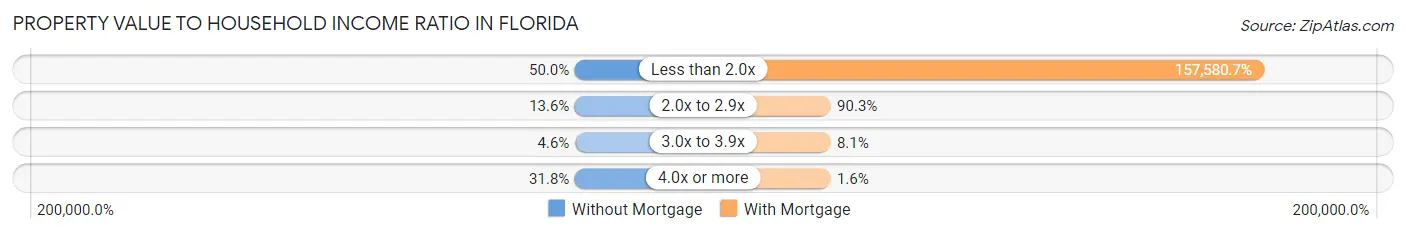
| Value-to-Income Ratio | Without Mortgage | With Mortgage |
| Less than 2.0x | 11 (50.0%) | 97,700 (157,580.6%) |
| 2.0x to 2.9x | 3 (13.6%) | 56 (90.3%) |
| 3.0x to 3.9x | 1 (4.5%) | 5 (8.1%) |
| 4.0x or more | 7 (31.8%) | 1 (1.6%) |
| Total | 22 (100.0%) | 62 (100.0%) |
Real Estate Taxes by Mortgage Status in Florida
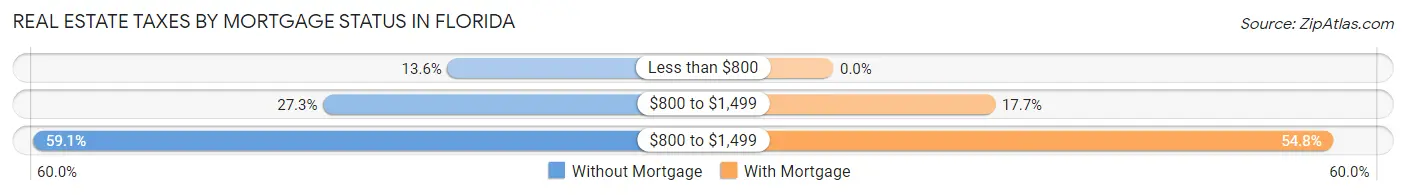
| Property Taxes | Without Mortgage | With Mortgage |
| Less than $800 | 3 (13.6%) | 0 (0.0%) |
| $800 to $1,499 | 6 (27.3%) | 11 (17.7%) |
| $800 to $1,499 | 13 (59.1%) | 34 (54.8%) |
| Total | 22 (100.0%) | 62 (100.0%) |
Health & Disability in Florida
Health Insurance Coverage by Age in Florida
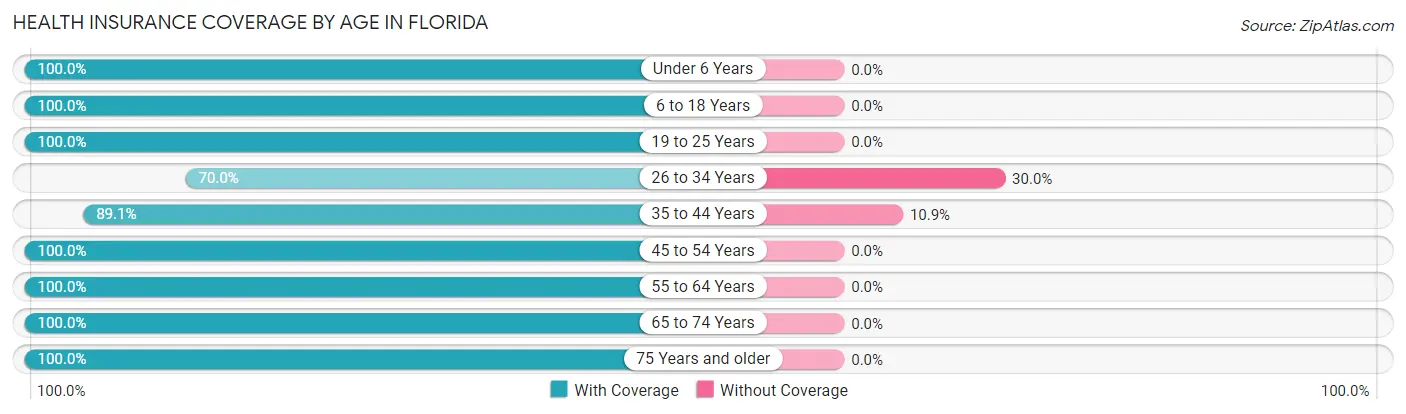
| Age Bracket | With Coverage | Without Coverage |
| Under 6 Years | 16 (100.0%) | 0 (0.0%) |
| 6 to 18 Years | 18 (100.0%) | 0 (0.0%) |
| 19 to 25 Years | 32 (100.0%) | 0 (0.0%) |
| 26 to 34 Years | 7 (70.0%) | 3 (30.0%) |
| 35 to 44 Years | 57 (89.1%) | 7 (10.9%) |
| 45 to 54 Years | 10 (100.0%) | 0 (0.0%) |
| 55 to 64 Years | 78 (100.0%) | 0 (0.0%) |
| 65 to 74 Years | 21 (100.0%) | 0 (0.0%) |
| 75 Years and older | 9 (100.0%) | 0 (0.0%) |
| Total | 248 (96.1%) | 10 (3.9%) |
Health Insurance Coverage by Citizenship Status in Florida
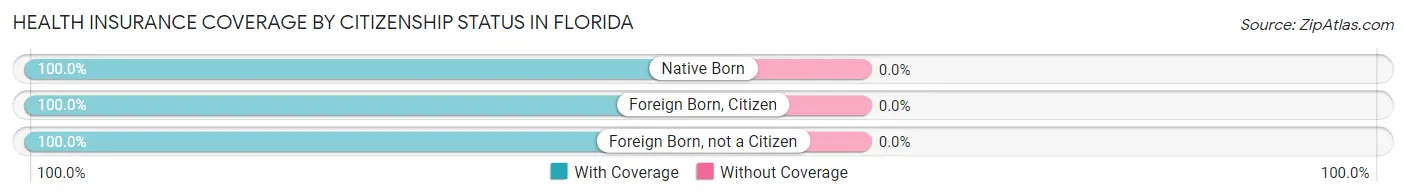
| Citizenship Status | With Coverage | Without Coverage |
| Native Born | 16 (100.0%) | 0 (0.0%) |
| Foreign Born, Citizen | 18 (100.0%) | 0 (0.0%) |
| Foreign Born, not a Citizen | 32 (100.0%) | 0 (0.0%) |
Health Insurance Coverage by Household Income in Florida
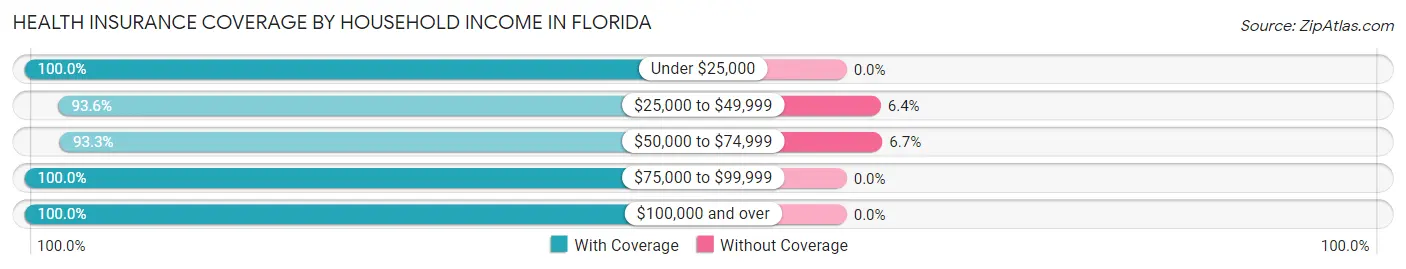
| Household Income | With Coverage | Without Coverage |
| Under $25,000 | 15 (100.0%) | 0 (0.0%) |
| $25,000 to $49,999 | 44 (93.6%) | 3 (6.4%) |
| $50,000 to $74,999 | 98 (93.3%) | 7 (6.7%) |
| $75,000 to $99,999 | 68 (100.0%) | 0 (0.0%) |
| $100,000 and over | 23 (100.0%) | 0 (0.0%) |
Public vs Private Health Insurance Coverage by Age in Florida
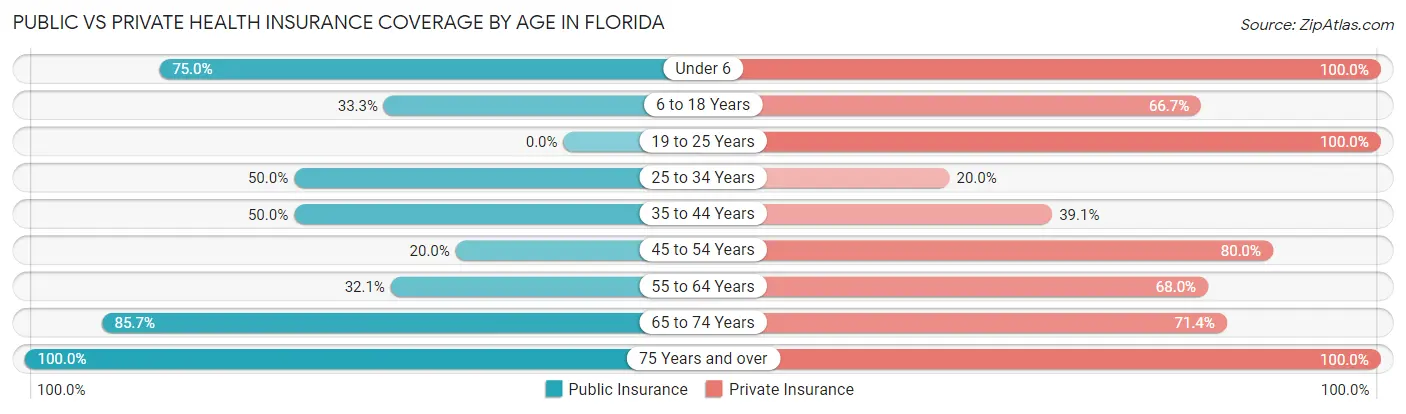
| Age Bracket | Public Insurance | Private Insurance |
| Under 6 | 12 (75.0%) | 16 (100.0%) |
| 6 to 18 Years | 6 (33.3%) | 12 (66.7%) |
| 19 to 25 Years | 0 (0.0%) | 32 (100.0%) |
| 25 to 34 Years | 5 (50.0%) | 2 (20.0%) |
| 35 to 44 Years | 32 (50.0%) | 25 (39.1%) |
| 45 to 54 Years | 2 (20.0%) | 8 (80.0%) |
| 55 to 64 Years | 25 (32.1%) | 53 (67.9%) |
| 65 to 74 Years | 18 (85.7%) | 15 (71.4%) |
| 75 Years and over | 9 (100.0%) | 9 (100.0%) |
| Total | 109 (42.2%) | 172 (66.7%) |
Disability Status by Sex by Age in Florida
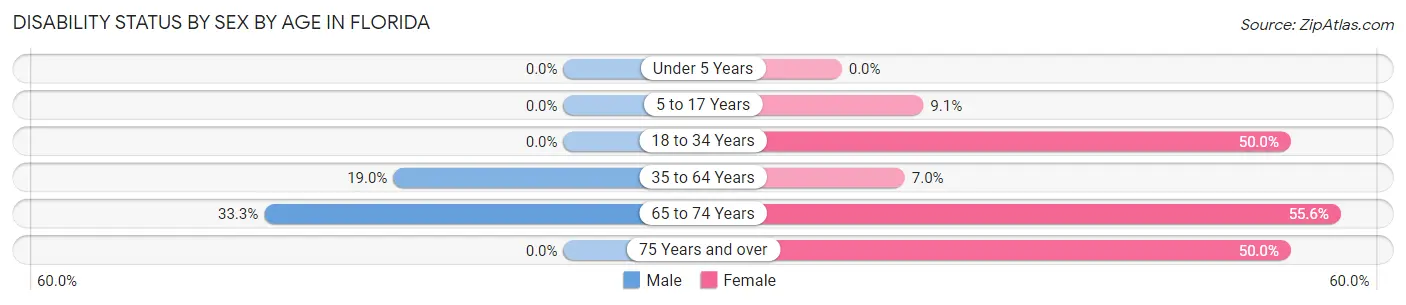
| Age Bracket | Male | Female |
| Under 5 Years | 0 (0.0%) | 0 (0.0%) |
| 5 to 17 Years | 0 (0.0%) | 1 (9.1%) |
| 18 to 34 Years | 0 (0.0%) | 5 (50.0%) |
| 35 to 64 Years | 18 (19.0%) | 4 (7.0%) |
| 65 to 74 Years | 4 (33.3%) | 5 (55.6%) |
| 75 Years and over | 0 (0.0%) | 2 (50.0%) |
Disability Class by Sex by Age in Florida
Disability Class: Hearing Difficulty
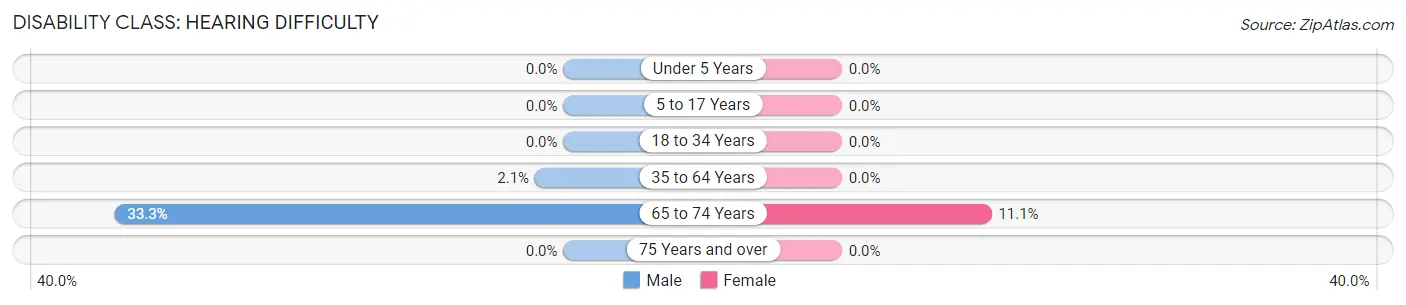
| Age Bracket | Male | Female |
| Under 5 Years | 0 (0.0%) | 0 (0.0%) |
| 5 to 17 Years | 0 (0.0%) | 0 (0.0%) |
| 18 to 34 Years | 0 (0.0%) | 0 (0.0%) |
| 35 to 64 Years | 2 (2.1%) | 0 (0.0%) |
| 65 to 74 Years | 4 (33.3%) | 1 (11.1%) |
| 75 Years and over | 0 (0.0%) | 0 (0.0%) |
Disability Class: Vision Difficulty
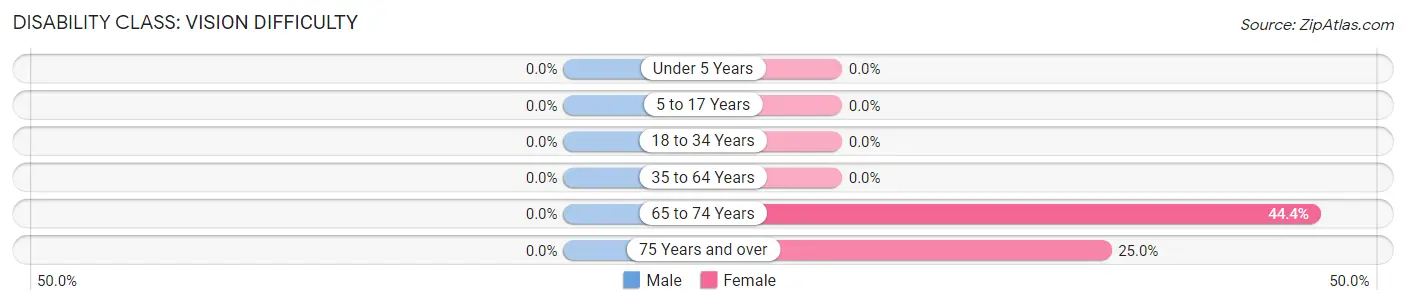
| Age Bracket | Male | Female |
| Under 5 Years | 0 (0.0%) | 0 (0.0%) |
| 5 to 17 Years | 0 (0.0%) | 0 (0.0%) |
| 18 to 34 Years | 0 (0.0%) | 0 (0.0%) |
| 35 to 64 Years | 0 (0.0%) | 0 (0.0%) |
| 65 to 74 Years | 0 (0.0%) | 4 (44.4%) |
| 75 Years and over | 0 (0.0%) | 1 (25.0%) |
Disability Class: Cognitive Difficulty
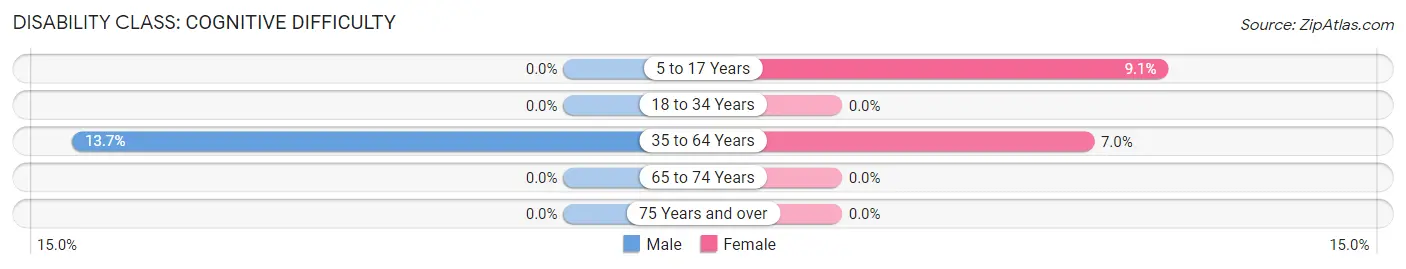
| Age Bracket | Male | Female |
| 5 to 17 Years | 0 (0.0%) | 1 (9.1%) |
| 18 to 34 Years | 0 (0.0%) | 0 (0.0%) |
| 35 to 64 Years | 13 (13.7%) | 4 (7.0%) |
| 65 to 74 Years | 0 (0.0%) | 0 (0.0%) |
| 75 Years and over | 0 (0.0%) | 0 (0.0%) |
Disability Class: Ambulatory Difficulty
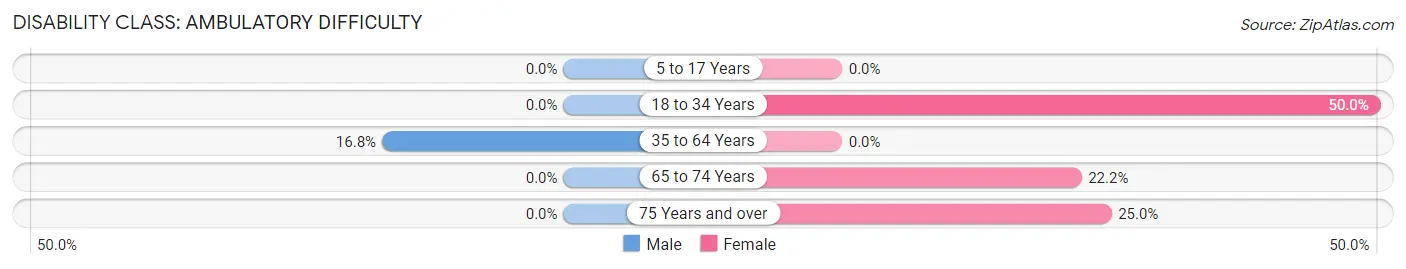
| Age Bracket | Male | Female |
| 5 to 17 Years | 0 (0.0%) | 0 (0.0%) |
| 18 to 34 Years | 0 (0.0%) | 5 (50.0%) |
| 35 to 64 Years | 16 (16.8%) | 0 (0.0%) |
| 65 to 74 Years | 0 (0.0%) | 2 (22.2%) |
| 75 Years and over | 0 (0.0%) | 1 (25.0%) |
Disability Class: Self-Care Difficulty
| Age Bracket | Male | Female |
| 5 to 17 Years | 0 (0.0%) | 0 (0.0%) |
| 18 to 34 Years | 0 (0.0%) | 0 (0.0%) |
| 35 to 64 Years | 0 (0.0%) | 0 (0.0%) |
| 65 to 74 Years | 0 (0.0%) | 0 (0.0%) |
| 75 Years and over | 0 (0.0%) | 0 (0.0%) |
Technology Access in Florida
Computing Device Access in Florida
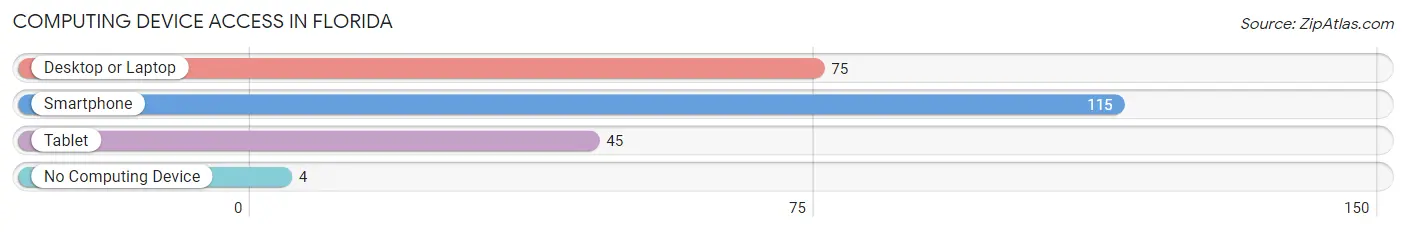
| Device Type | # Households | % Households |
| Desktop or Laptop | 75 | 60.5% |
| Smartphone | 115 | 92.7% |
| Tablet | 45 | 36.3% |
| No Computing Device | 4 | 3.2% |
| Total | 124 | 100.0% |
Internet Access in Florida
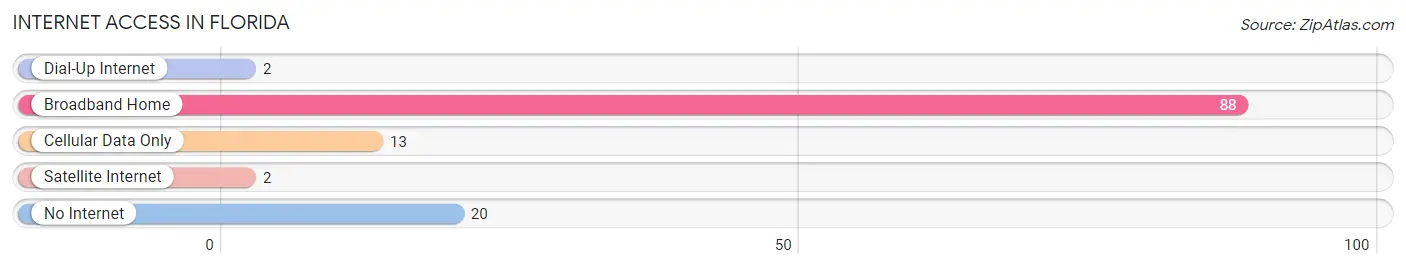
| Internet Type | # Households | % Households |
| Dial-Up Internet | 2 | 1.6% |
| Broadband Home | 88 | 71.0% |
| Cellular Data Only | 13 | 10.5% |
| Satellite Internet | 2 | 1.6% |
| No Internet | 20 | 16.1% |
| Total | 124 | 100.0% |
Florida Summary
Florida is a state located in the southeastern region of the United States. It is bordered by Alabama to the northwest, Georgia to the north, and the Gulf of Mexico to the south and west. Florida is the 22nd most populous state in the United States, with a population of over 21 million people as of 2019.
History
The first known inhabitants of Florida were the Paleo-Indians, who arrived in the region around 12,000 years ago. The first Europeans to explore the area were Spanish explorers, who arrived in the early 16th century. The Spanish established several settlements in the region, including St. Augustine, which is the oldest continuously inhabited European settlement in the United States.
In 1821, Florida became a United States territory, and in 1845 it was admitted as the 27th state. During the American Civil War, Florida seceded from the Union and joined the Confederate States of America. After the war, Florida experienced a period of rapid growth and development, becoming a major tourist destination and a hub for the citrus industry.
Geography
Florida is the 22nd largest state in the United States, covering an area of 65,755 square miles. It is the only state in the United States that borders both the Atlantic Ocean and the Gulf of Mexico. The state is divided into 67 counties, and its capital is Tallahassee.
Florida is home to a variety of landscapes, including beaches, swamps, forests, and wetlands. The highest point in the state is Britton Hill, which stands at 345 feet above sea level. The state is also home to several major rivers, including the St. Johns, the Suwannee, and the Apalachicola.
Economy
Florida has a diverse and growing economy. The state’s major industries include tourism, agriculture, manufacturing, and finance. Florida is the third-largest state in terms of gross domestic product, with a GDP of over $1 trillion.
Tourism is a major contributor to the state’s economy, with over 112 million visitors in 2019. The state is home to several major theme parks, including Walt Disney World, Universal Studios, and SeaWorld. Agriculture is also an important part of the state’s economy, with crops such as oranges, tomatoes, and sugarcane being grown in the state.
Demographics
As of 2019, the population of Florida was over 21 million people. The state is home to a diverse population, with the largest ethnic groups being White (64.5%), Hispanic or Latino (25.7%), and Black or African American (15.5%). The state’s largest cities are Jacksonville, Miami, Tampa, and Orlando.
The median household income in Florida is $53,267, and the median home value is $219,000. The state’s poverty rate is 13.7%, and the unemployment rate is 3.3%. The state’s largest industries are tourism, agriculture, and manufacturing.
Common Questions
What is Per Capita Income in Florida?
Per Capita income in Florida is $31,209.
What is the Median Family Income in Florida?
Median Family Income in Florida is $60,625.
What is the Median Household income in Florida?
Median Household Income in Florida is $60,333.
What is Income or Wage Gap in Florida?
Income or Wage Gap in Florida is 33.0%.
Women in Florida earn 67.0 cents for every dollar earned by a man.
What is Inequality or Gini Index in Florida?
Inequality or Gini Index in Florida is 0.28.
What is the Total Population of Florida?
Total Population of Florida is 258.
What is the Total Male Population of Florida?
Total Male Population of Florida is 166.
What is the Total Female Population of Florida?
Total Female Population of Florida is 92.
What is the Ratio of Males per 100 Females in Florida?
There are 180.43 Males per 100 Females in Florida.
What is the Ratio of Females per 100 Males in Florida?
There are 55.42 Females per 100 Males in Florida.
What is the Median Population Age in Florida?
Median Population Age in Florida is 42.5 Years.
What is the Average Family Size in Florida
Average Family Size in Florida is 2.8 People.
What is the Average Household Size in Florida
Average Household Size in Florida is 2.1 People.
How Large is the Labor Force in Florida?
There are 131 People in the Labor Forcein in Florida.
What is the Percentage of People in the Labor Force in Florida?
58.2% of People are in the Labor Force in Florida.