Chestnut Ridge, NY Map & Demographics
Chestnut Ridge Map
Chestnut Ridge Overview
$41,748
PER CAPITA INCOME
$129,760
AVG FAMILY INCOME
$106,918
AVG HOUSEHOLD INCOME
45.7%
WAGE / INCOME GAP [ % ]
54.3¢/ $1
WAGE / INCOME GAP [ $ ]
0.45
INEQUALITY / GINI INDEX
10,339
TOTAL POPULATION
5,357
MALE POPULATION
4,982
FEMALE POPULATION
107.53
MALES / 100 FEMALES
93.00
FEMALES / 100 MALES
29.2
MEDIAN AGE
4.3
AVG FAMILY SIZE
3.7
AVG HOUSEHOLD SIZE
3,803
LABOR FORCE [ PEOPLE ]
58.2%
PERCENT IN LABOR FORCE
5.6%
UNEMPLOYMENT RATE
Income in Chestnut Ridge
Income Overview in Chestnut Ridge
Per Capita Income in Chestnut Ridge is $41,748, while median incomes of families and households are $129,760 and $106,918 respectively.
| Characteristic | Number | Measure |
| Per Capita Income | 10,339 | $41,748 |
| Median Family Income | 2,115 | $129,760 |
| Mean Family Income | 2,115 | $177,131 |
| Median Household Income | 2,742 | $106,918 |
| Mean Household Income | 2,742 | $152,300 |
| Income Deficit | 2,115 | $0 |
| Wage / Income Gap (%) | 10,339 | 45.73% |
| Wage / Income Gap ($) | 10,339 | 54.27¢ per $1 |
| Gini / Inequality Index | 10,339 | 0.45 |
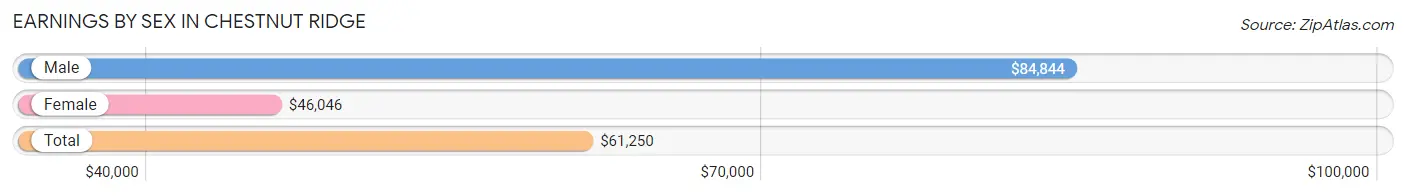
Earnings by Sex in Chestnut Ridge
Average Earnings in Chestnut Ridge are $61,250, $84,844 for men and $46,046 for women, a difference of 45.7%.
| Sex | Number | Average Earnings |
| Male | 2,135 (55.0%) | $84,844 |
| Female | 1,747 (45.0%) | $46,046 |
| Total | 3,882 (100.0%) | $61,250 |
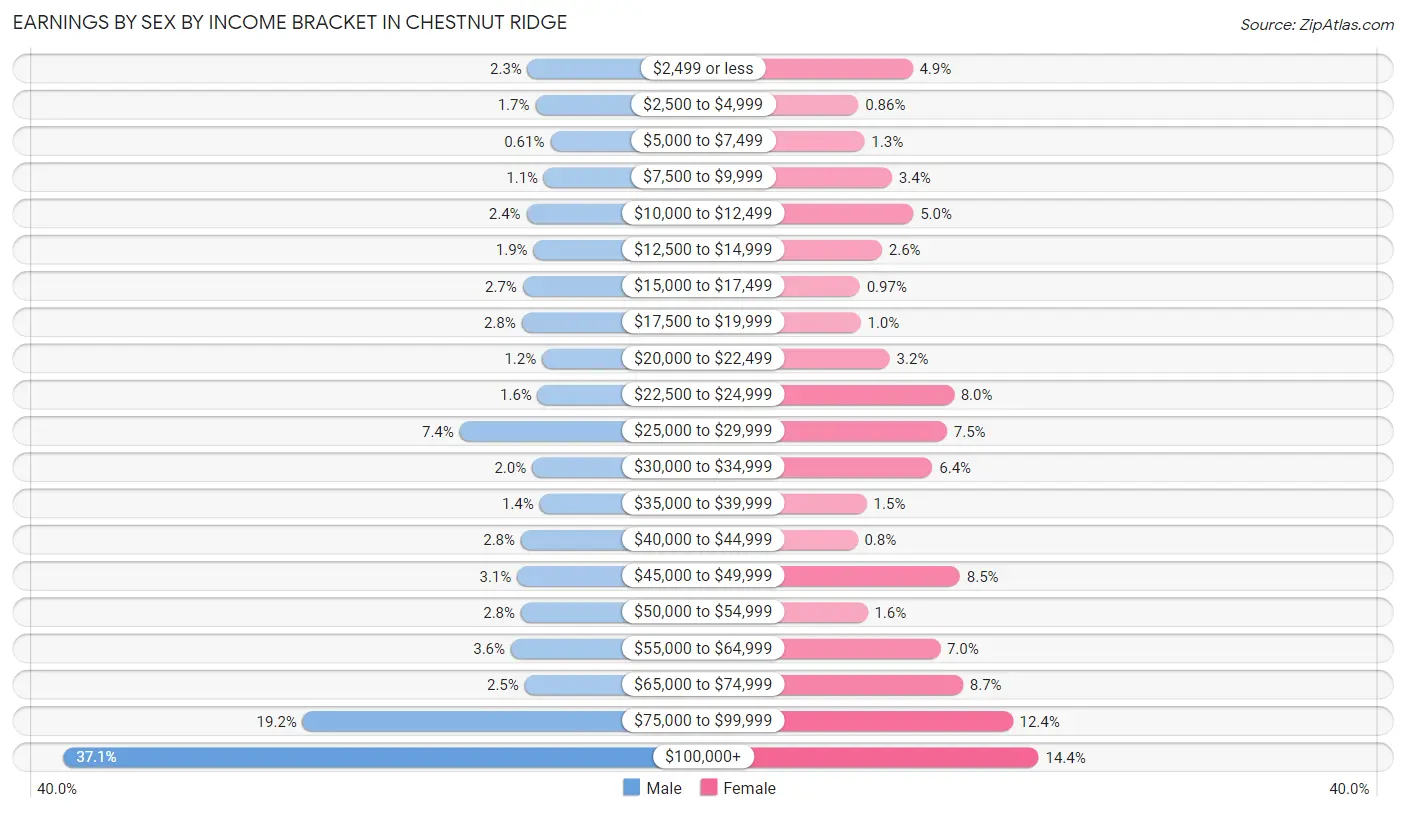
Earnings by Sex by Income Bracket in Chestnut Ridge
The most common earnings brackets in Chestnut Ridge are $100,000+ for men (792 | 37.1%) and $100,000+ for women (251 | 14.4%).
| Income | Male | Female |
| $2,499 or less | 49 (2.3%) | 86 (4.9%) |
| $2,500 to $4,999 | 37 (1.7%) | 15 (0.9%) |
| $5,000 to $7,499 | 13 (0.6%) | 23 (1.3%) |
| $7,500 to $9,999 | 23 (1.1%) | 59 (3.4%) |
| $10,000 to $12,499 | 51 (2.4%) | 87 (5.0%) |
| $12,500 to $14,999 | 40 (1.9%) | 46 (2.6%) |
| $15,000 to $17,499 | 57 (2.7%) | 17 (1.0%) |
| $17,500 to $19,999 | 59 (2.8%) | 18 (1.0%) |
| $20,000 to $22,499 | 26 (1.2%) | 56 (3.2%) |
| $22,500 to $24,999 | 33 (1.5%) | 140 (8.0%) |
| $25,000 to $29,999 | 158 (7.4%) | 131 (7.5%) |
| $30,000 to $34,999 | 42 (2.0%) | 112 (6.4%) |
| $35,000 to $39,999 | 30 (1.4%) | 26 (1.5%) |
| $40,000 to $44,999 | 60 (2.8%) | 14 (0.8%) |
| $45,000 to $49,999 | 66 (3.1%) | 148 (8.5%) |
| $50,000 to $54,999 | 60 (2.8%) | 27 (1.5%) |
| $55,000 to $64,999 | 76 (3.6%) | 122 (7.0%) |
| $65,000 to $74,999 | 54 (2.5%) | 152 (8.7%) |
| $75,000 to $99,999 | 409 (19.2%) | 217 (12.4%) |
| $100,000+ | 792 (37.1%) | 251 (14.4%) |
| Total | 2,135 (100.0%) | 1,747 (100.0%) |
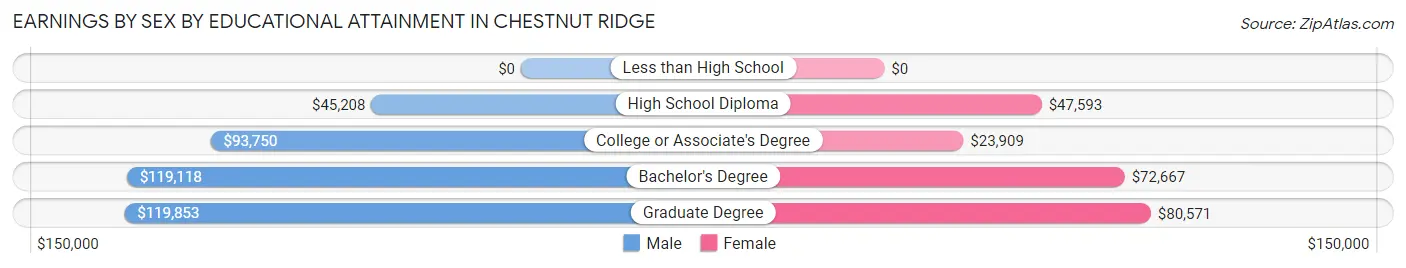
Earnings by Sex by Educational Attainment in Chestnut Ridge
Average earnings in Chestnut Ridge are $86,014 for men and $56,458 for women, a difference of 34.4%. Men with an educational attainment of graduate degree enjoy the highest average annual earnings of $119,853, while those with high school diploma education earn the least with $45,208. Women with an educational attainment of graduate degree earn the most with the average annual earnings of $80,571, while those with college or associate's degree education have the smallest earnings of $23,909.
| Educational Attainment | Male Income | Female Income |
| Less than High School | - | - |
| High School Diploma | $45,208 | $47,593 |
| College or Associate's Degree | $93,750 | $23,909 |
| Bachelor's Degree | $119,118 | $72,667 |
| Graduate Degree | $119,853 | $80,571 |
| Total | $86,014 | $56,458 |
Family Income in Chestnut Ridge
Family Income Brackets in Chestnut Ridge
According to the Chestnut Ridge family income data, there are 592 families falling into the $200,000+ income range, which is the most common income bracket and makes up 28.0% of all families. Conversely, the $10,000 to $14,999 income bracket is the least frequent group with only 8 families (0.4%) belonging to this category.
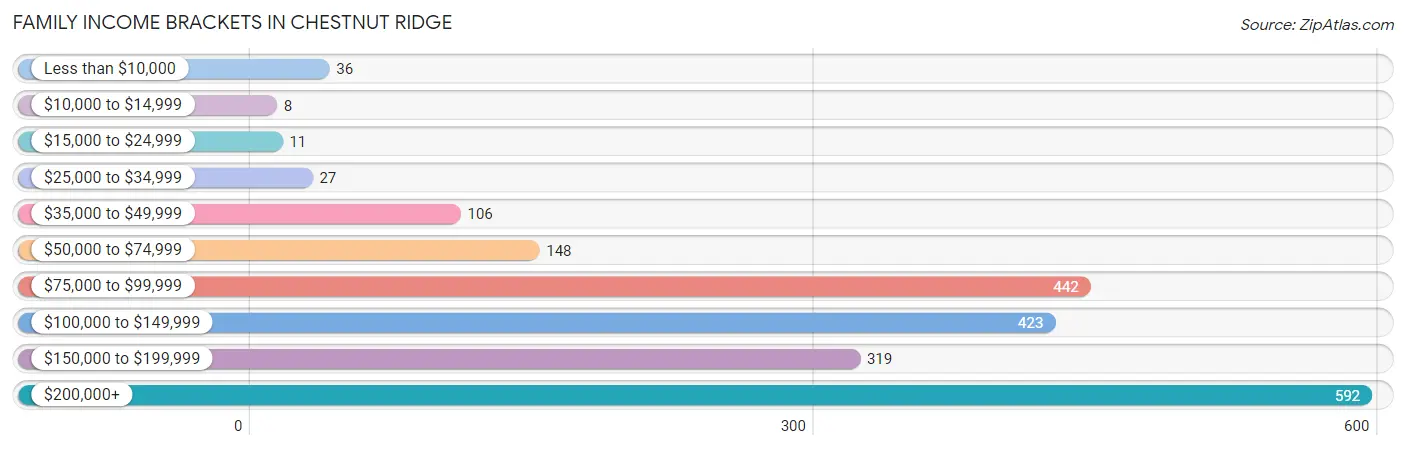
| Income Bracket | # Families | % Families |
| Less than $10,000 | 36 | 1.7% |
| $10,000 to $14,999 | 8 | 0.4% |
| $15,000 to $24,999 | 11 | 0.5% |
| $25,000 to $34,999 | 27 | 1.3% |
| $35,000 to $49,999 | 106 | 5.0% |
| $50,000 to $74,999 | 148 | 7.0% |
| $75,000 to $99,999 | 442 | 20.9% |
| $100,000 to $149,999 | 423 | 20.0% |
| $150,000 to $199,999 | 319 | 15.1% |
| $200,000+ | 592 | 28.0% |
Family Income by Famaliy Size in Chestnut Ridge
6-person families (208 | 9.8%) account for the highest median family income in Chestnut Ridge with $168,421 per family, while 2-person families (700 | 33.1%) have the highest median income of $69,010 per family member.
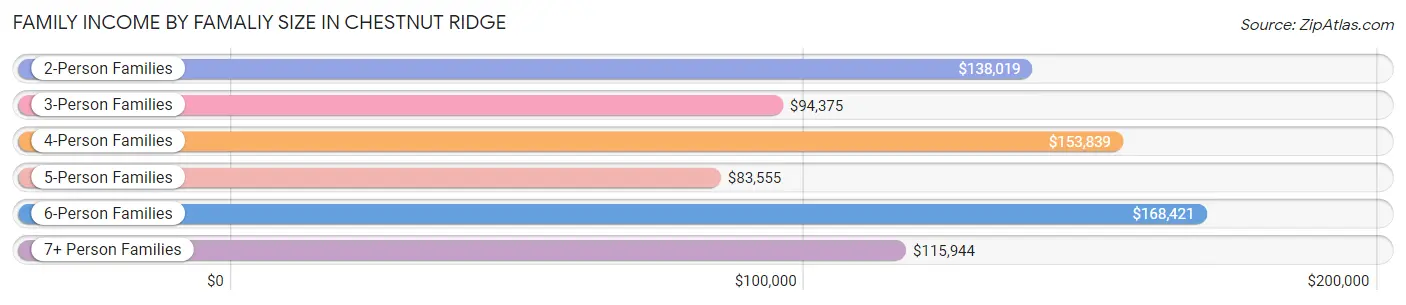
| Income Bracket | # Families | Median Income |
| 2-Person Families | 700 (33.1%) | $138,019 |
| 3-Person Families | 157 (7.4%) | $94,375 |
| 4-Person Families | 539 (25.5%) | $153,839 |
| 5-Person Families | 111 (5.2%) | $83,555 |
| 6-Person Families | 208 (9.8%) | $168,421 |
| 7+ Person Families | 400 (18.9%) | $115,944 |
| Total | 2,115 (100.0%) | $129,760 |
Family Income by Number of Earners in Chestnut Ridge
The median family income in Chestnut Ridge is $129,760, with families comprising 3+ earners (178) having the highest median family income of $223,409, while families with no earners (187) have the lowest median family income of $105,313, accounting for 8.4% and 8.8% of families, respectively.
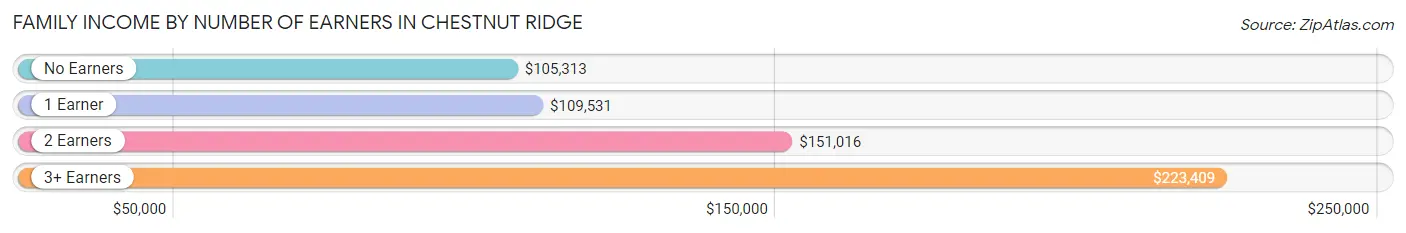
| Number of Earners | # Families | Median Income |
| No Earners | 187 (8.8%) | $105,313 |
| 1 Earner | 745 (35.2%) | $109,531 |
| 2 Earners | 1,005 (47.5%) | $151,016 |
| 3+ Earners | 178 (8.4%) | $223,409 |
| Total | 2,115 (100.0%) | $129,760 |
Household Income in Chestnut Ridge
Household Income Brackets in Chestnut Ridge
With 625 households falling in the category, the $200,000+ income range is the most frequent in Chestnut Ridge, accounting for 22.8% of all households. In contrast, only 60 households (2.2%) fall into the $10,000 to $14,999 income bracket, making it the least populous group.
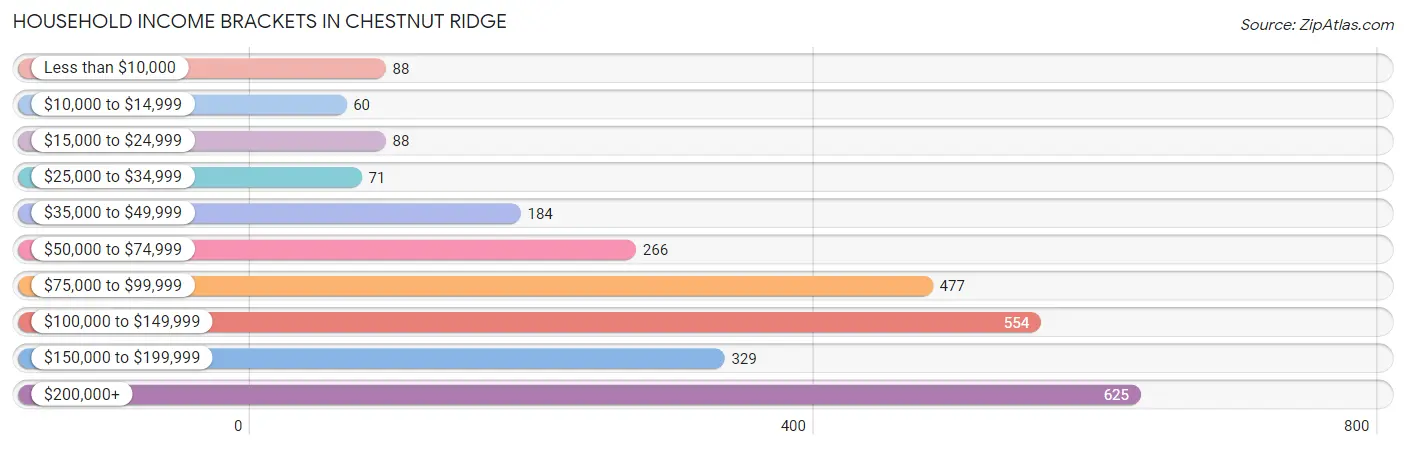
| Income Bracket | # Households | % Households |
| Less than $10,000 | 88 | 3.2% |
| $10,000 to $14,999 | 60 | 2.2% |
| $15,000 to $24,999 | 88 | 3.2% |
| $25,000 to $34,999 | 71 | 2.6% |
| $35,000 to $49,999 | 184 | 6.7% |
| $50,000 to $74,999 | 266 | 9.7% |
| $75,000 to $99,999 | 477 | 17.4% |
| $100,000 to $149,999 | 554 | 20.2% |
| $150,000 to $199,999 | 329 | 12.0% |
| $200,000+ | 625 | 22.8% |
Household Income by Householder Age in Chestnut Ridge
The median household income in Chestnut Ridge is $106,918, with the highest median household income of $155,893 found in the 45 to 64 years age bracket for the primary householder. A total of 818 households (29.8%) fall into this category.
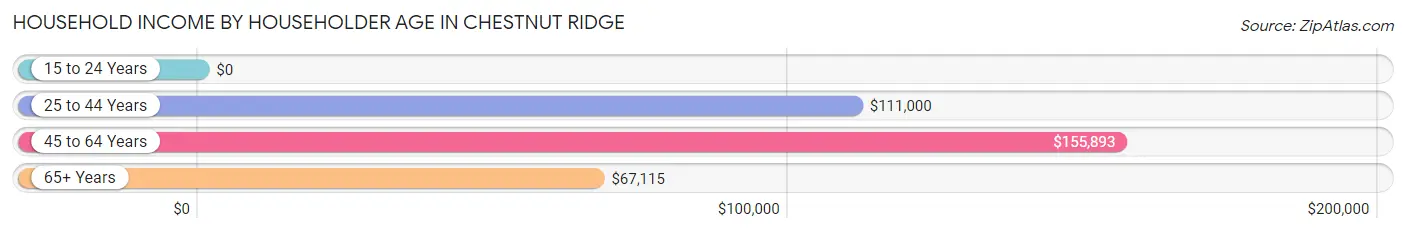
| Income Bracket | # Households | Median Income |
| 15 to 24 Years | 0 (0.0%) | $0 |
| 25 to 44 Years | 998 (36.4%) | $111,000 |
| 45 to 64 Years | 818 (29.8%) | $155,893 |
| 65+ Years | 926 (33.8%) | $67,115 |
| Total | 2,742 (100.0%) | $106,918 |
Poverty in Chestnut Ridge
Income Below Poverty by Sex and Age in Chestnut Ridge
With 14.8% poverty level for males and 16.0% for females among the residents of Chestnut Ridge, 12 to 14 year old males and under 5 year old females are the most vulnerable to poverty, with 88 males (41.5%) and 214 females (42.0%) in their respective age groups living below the poverty level.
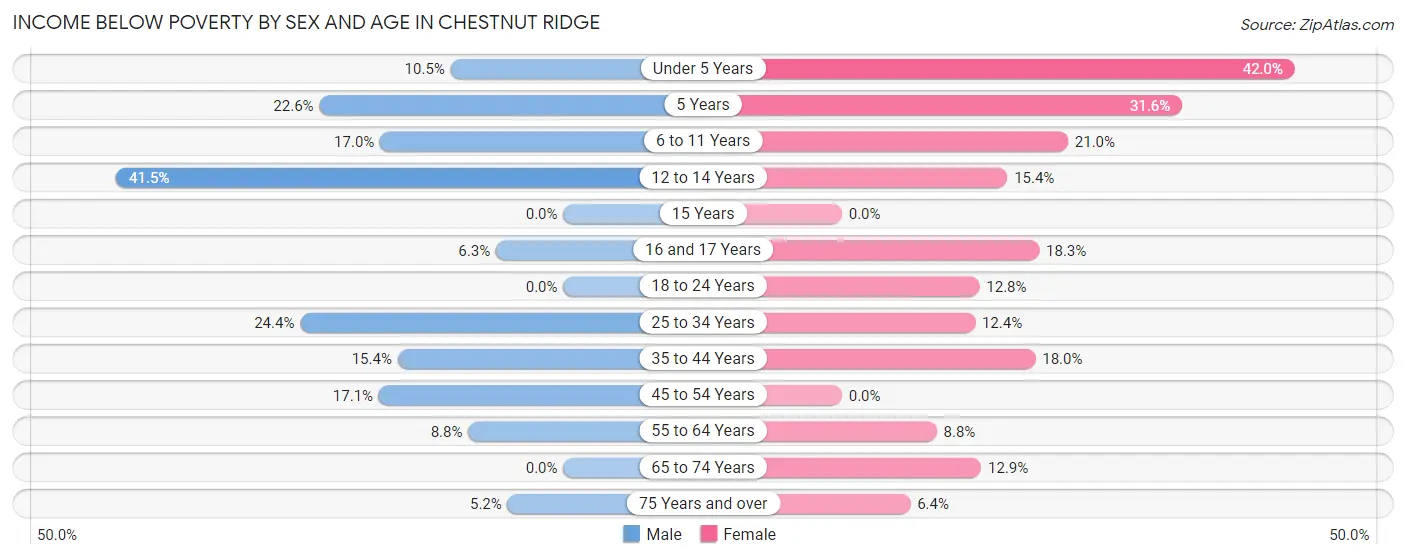
| Age Bracket | Male | Female |
| Under 5 Years | 101 (10.5%) | 214 (42.0%) |
| 5 Years | 24 (22.6%) | 36 (31.6%) |
| 6 to 11 Years | 127 (17.0%) | 172 (21.0%) |
| 12 to 14 Years | 88 (41.5%) | 31 (15.3%) |
| 15 Years | 0 (0.0%) | 0 (0.0%) |
| 16 and 17 Years | 8 (6.2%) | 13 (18.3%) |
| 18 to 24 Years | 0 (0.0%) | 36 (12.8%) |
| 25 to 34 Years | 221 (24.4%) | 99 (12.4%) |
| 35 to 44 Years | 71 (15.4%) | 72 (18.0%) |
| 45 to 54 Years | 88 (17.1%) | 0 (0.0%) |
| 55 to 64 Years | 47 (8.8%) | 36 (8.8%) |
| 65 to 74 Years | 0 (0.0%) | 57 (12.9%) |
| 75 Years and over | 17 (5.2%) | 29 (6.4%) |
| Total | 792 (14.8%) | 795 (16.0%) |
Income Above Poverty by Sex and Age in Chestnut Ridge
According to the poverty statistics in Chestnut Ridge, males aged 15 years and females aged 15 years are the age groups that are most secure financially, with 100.0% of males and 100.0% of females in these age groups living above the poverty line.
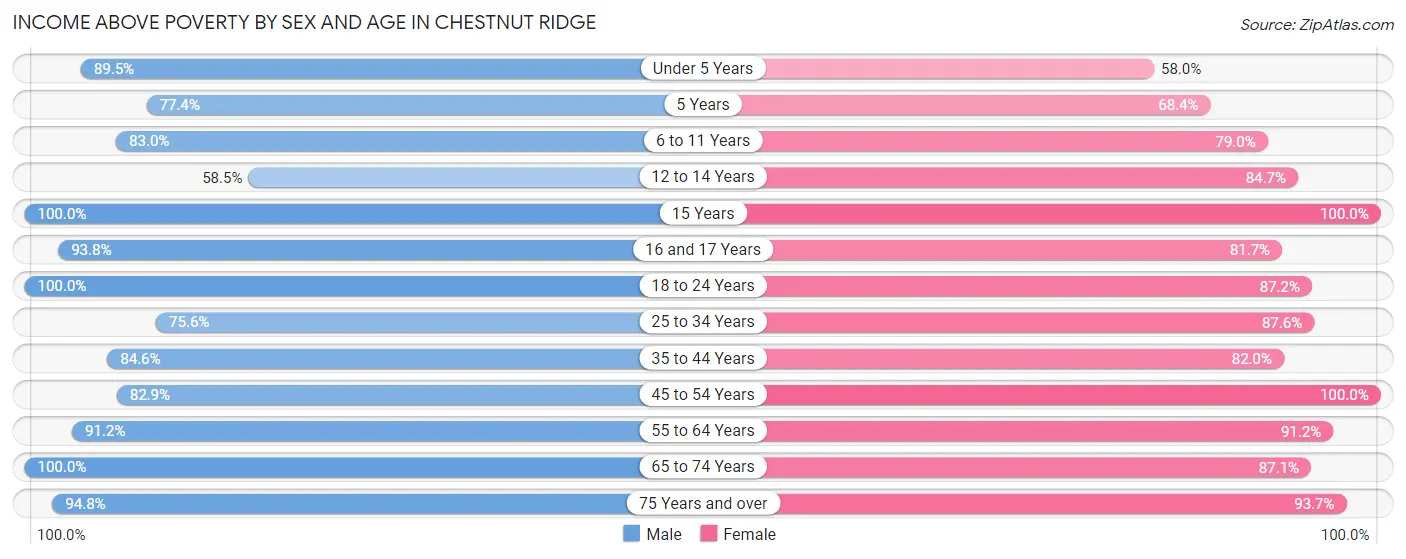
| Age Bracket | Male | Female |
| Under 5 Years | 865 (89.5%) | 295 (58.0%) |
| 5 Years | 82 (77.4%) | 78 (68.4%) |
| 6 to 11 Years | 620 (83.0%) | 648 (79.0%) |
| 12 to 14 Years | 124 (58.5%) | 171 (84.7%) |
| 15 Years | 30 (100.0%) | 98 (100.0%) |
| 16 and 17 Years | 120 (93.8%) | 58 (81.7%) |
| 18 to 24 Years | 156 (100.0%) | 246 (87.2%) |
| 25 to 34 Years | 684 (75.6%) | 702 (87.6%) |
| 35 to 44 Years | 391 (84.6%) | 329 (82.0%) |
| 45 to 54 Years | 426 (82.9%) | 355 (100.0%) |
| 55 to 64 Years | 486 (91.2%) | 373 (91.2%) |
| 65 to 74 Years | 269 (100.0%) | 384 (87.1%) |
| 75 Years and over | 312 (94.8%) | 428 (93.6%) |
| Total | 4,565 (85.2%) | 4,165 (84.0%) |
Income Below Poverty Among Married-Couple Families in Chestnut Ridge
The poverty statistics for married-couple families in Chestnut Ridge show that 7.0% or 127 of the total 1,820 families live below the poverty line. Families with 5 or more children have the highest poverty rate of 27.3%, comprising of 105 families. On the other hand, families with no children have the lowest poverty rate of 0.0%, which includes 0 families.
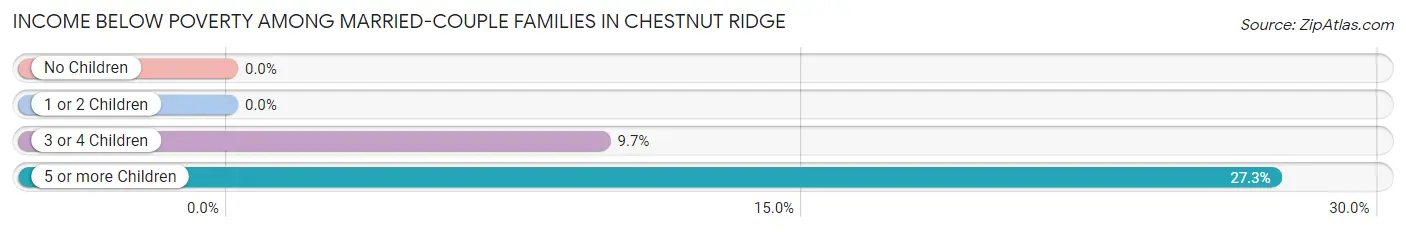
| Children | Above Poverty | Below Poverty |
| No Children | 751 (100.0%) | 0 (0.0%) |
| 1 or 2 Children | 458 (100.0%) | 0 (0.0%) |
| 3 or 4 Children | 204 (90.3%) | 22 (9.7%) |
| 5 or more Children | 280 (72.7%) | 105 (27.3%) |
| Total | 1,693 (93.0%) | 127 (7.0%) |
Income Below Poverty Among Single-Parent Households in Chestnut Ridge
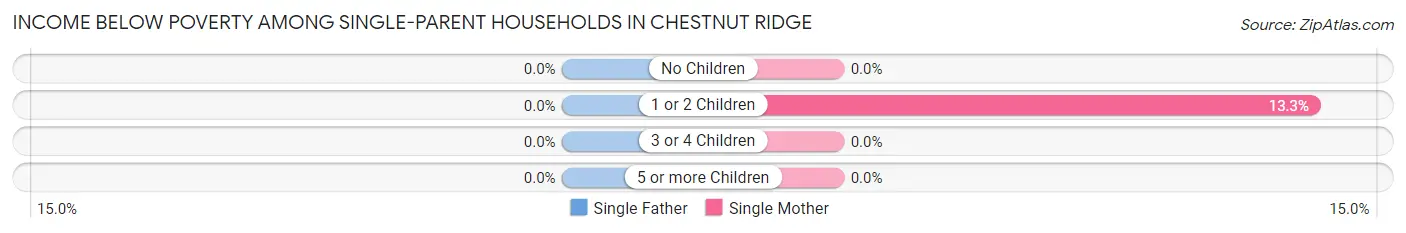
| Children | Single Father | Single Mother |
| No Children | 0 (0.0%) | 0 (0.0%) |
| 1 or 2 Children | 0 (0.0%) | 8 (13.3%) |
| 3 or 4 Children | 0 (0.0%) | 0 (0.0%) |
| 5 or more Children | 0 (0.0%) | 0 (0.0%) |
| Total | 0 (0.0%) | 8 (3.9%) |
Income Below Poverty Among Married-Couple vs Single-Parent Households in Chestnut Ridge
The poverty data for Chestnut Ridge shows that 127 of the married-couple family households (7.0%) and 8 of the single-parent households (2.7%) are living below the poverty level. Within the married-couple family households, those with 5 or more children have the highest poverty rate, with 105 households (27.3%) falling below the poverty line. Among the single-parent households, those with 1 or 2 children have the highest poverty rate, with 8 household (8.8%) living below poverty.
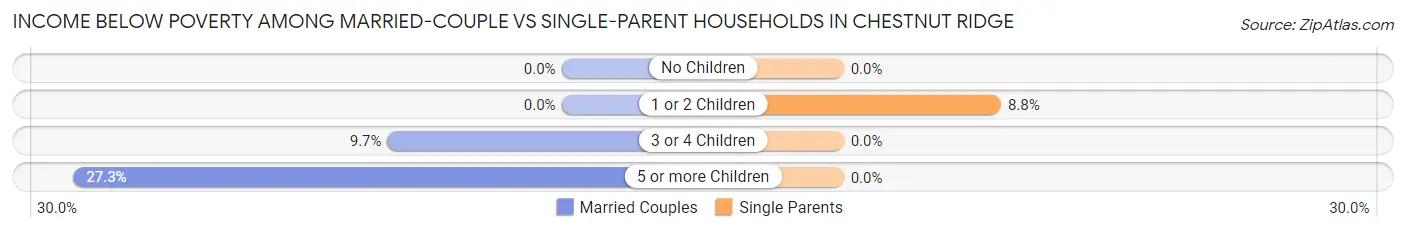
| Children | Married-Couple Families | Single-Parent Households |
| No Children | 0 (0.0%) | 0 (0.0%) |
| 1 or 2 Children | 0 (0.0%) | 8 (8.8%) |
| 3 or 4 Children | 22 (9.7%) | 0 (0.0%) |
| 5 or more Children | 105 (27.3%) | 0 (0.0%) |
| Total | 127 (7.0%) | 8 (2.7%) |
Race in Chestnut Ridge
The most populous races in Chestnut Ridge are White / Caucasian (7,952 | 76.9%), Black / African American (1,299 | 12.6%), and Hispanic or Latino (852 | 8.2%).
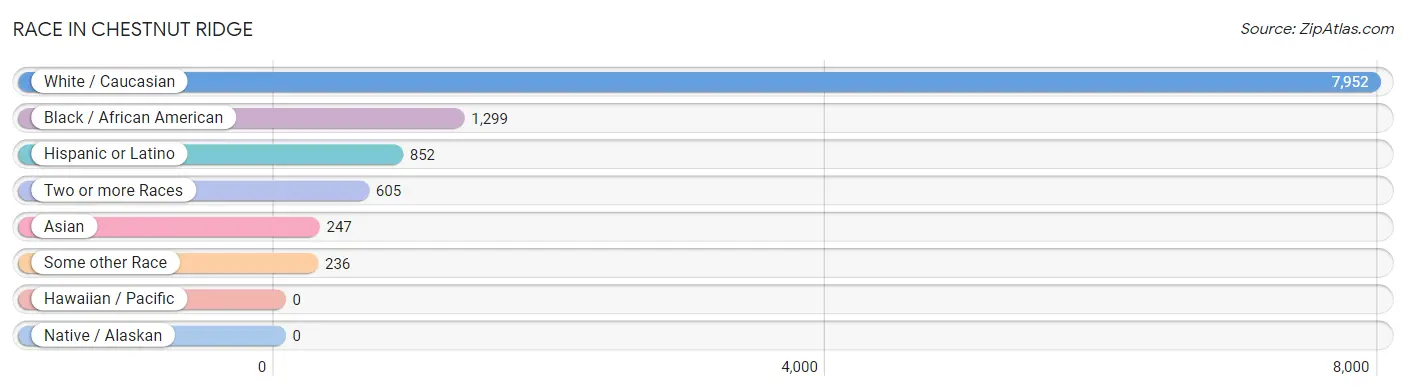
| Race | # Population | % Population |
| Asian | 247 | 2.4% |
| Black / African American | 1,299 | 12.6% |
| Hawaiian / Pacific | 0 | 0.0% |
| Hispanic or Latino | 852 | 8.2% |
| Native / Alaskan | 0 | 0.0% |
| White / Caucasian | 7,952 | 76.9% |
| Two or more Races | 605 | 5.9% |
| Some other Race | 236 | 2.3% |
| Total | 10,339 | 100.0% |
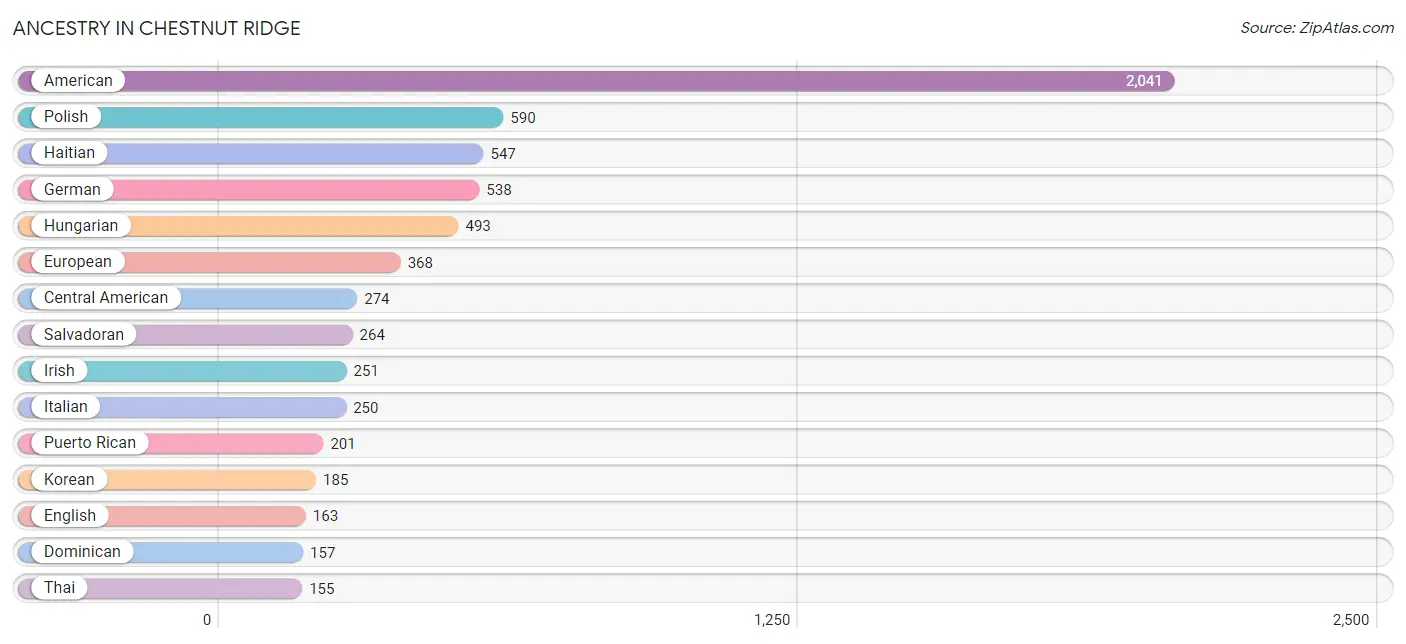
Ancestry in Chestnut Ridge
The most populous ancestries reported in Chestnut Ridge are American (2,041 | 19.7%), Polish (590 | 5.7%), Haitian (547 | 5.3%), German (538 | 5.2%), and Hungarian (493 | 4.8%), together accounting for 40.7% of all Chestnut Ridge residents.
| Ancestry | # Population | % Population |
| African | 22 | 0.2% |
| American | 2,041 | 19.7% |
| Arab | 24 | 0.2% |
| Argentinean | 32 | 0.3% |
| Armenian | 116 | 1.1% |
| Belgian | 9 | 0.1% |
| Bhutanese | 12 | 0.1% |
| Brazilian | 6 | 0.1% |
| British | 51 | 0.5% |
| Burmese | 28 | 0.3% |
| Canadian | 8 | 0.1% |
| Central American | 274 | 2.6% |
| Cherokee | 18 | 0.2% |
| Colombian | 14 | 0.1% |
| Cuban | 40 | 0.4% |
| Czech | 13 | 0.1% |
| Czechoslovakian | 11 | 0.1% |
| Danish | 10 | 0.1% |
| Dominican | 157 | 1.5% |
| Dutch | 45 | 0.4% |
| Eastern European | 92 | 0.9% |
| Ecuadorian | 63 | 0.6% |
| English | 163 | 1.6% |
| European | 368 | 3.6% |
| French Canadian | 61 | 0.6% |
| German | 538 | 5.2% |
| Ghanaian | 15 | 0.2% |
| Greek | 10 | 0.1% |
| Haitian | 547 | 5.3% |
| Hungarian | 493 | 4.8% |
| Indian (Asian) | 9 | 0.1% |
| Irish | 251 | 2.4% |
| Israeli | 50 | 0.5% |
| Italian | 250 | 2.4% |
| Jamaican | 3 | 0.0% |
| Korean | 185 | 1.8% |
| Latvian | 87 | 0.8% |
| Lithuanian | 82 | 0.8% |
| Mexican | 9 | 0.1% |
| Moroccan | 24 | 0.2% |
| Nigerian | 70 | 0.7% |
| Northern European | 12 | 0.1% |
| Norwegian | 21 | 0.2% |
| Pakistani | 13 | 0.1% |
| Panamanian | 10 | 0.1% |
| Peruvian | 8 | 0.1% |
| Polish | 590 | 5.7% |
| Portuguese | 46 | 0.4% |
| Puerto Rican | 201 | 1.9% |
| Romanian | 64 | 0.6% |
| Russian | 151 | 1.5% |
| Salvadoran | 264 | 2.5% |
| Scandinavian | 8 | 0.1% |
| Scottish | 64 | 0.6% |
| South American | 117 | 1.1% |
| Sri Lankan | 8 | 0.1% |
| Subsaharan African | 107 | 1.0% |
| Thai | 155 | 1.5% |
| Trinidadian and Tobagonian | 10 | 0.1% |
| Turkish | 40 | 0.4% |
| Ukrainian | 40 | 0.4% |
| Welsh | 15 | 0.2% | View All 62 Rows |
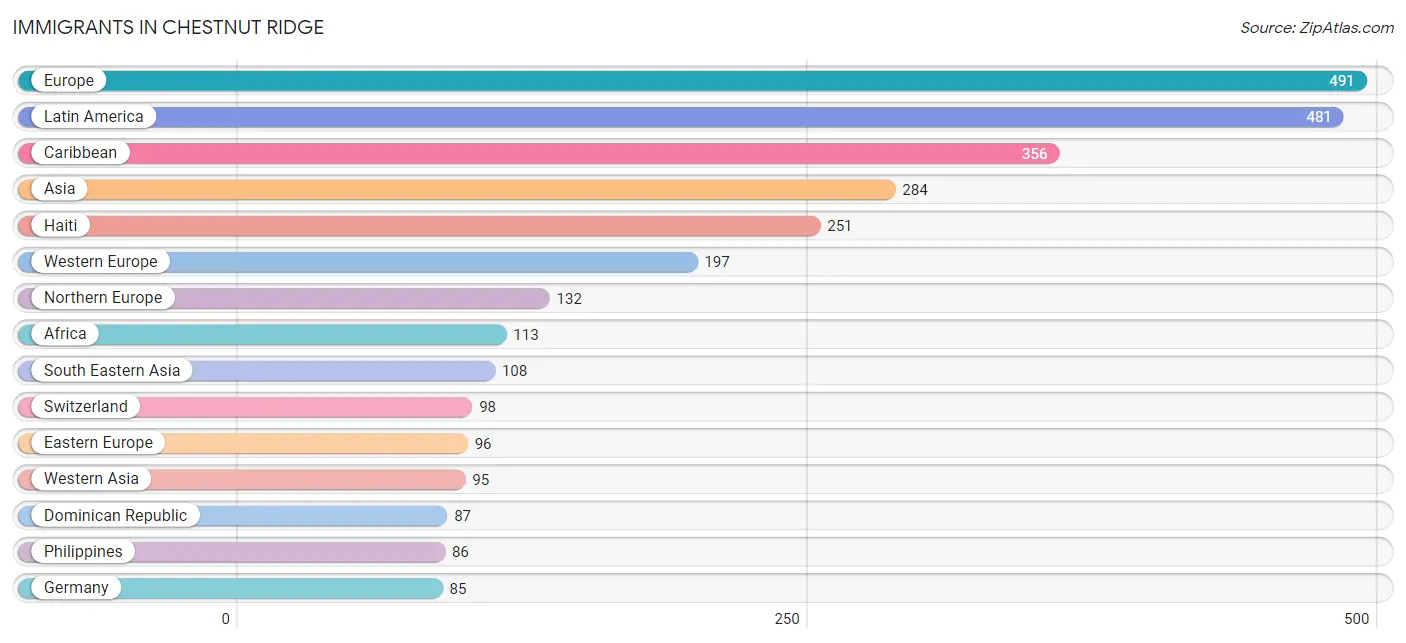
Immigrants in Chestnut Ridge
The most numerous immigrant groups reported in Chestnut Ridge came from Europe (491 | 4.8%), Latin America (481 | 4.6%), Caribbean (356 | 3.4%), Asia (284 | 2.8%), and Haiti (251 | 2.4%), together accounting for 18.0% of all Chestnut Ridge residents.
| Immigration Origin | # Population | % Population |
| Africa | 113 | 1.1% |
| Argentina | 57 | 0.5% |
| Asia | 284 | 2.8% |
| Austria | 14 | 0.1% |
| Belarus | 4 | 0.0% |
| Canada | 24 | 0.2% |
| Caribbean | 356 | 3.4% |
| Central America | 68 | 0.7% |
| China | 9 | 0.1% |
| Cuba | 18 | 0.2% |
| Dominican Republic | 87 | 0.8% |
| Eastern Asia | 21 | 0.2% |
| Eastern Europe | 96 | 0.9% |
| El Salvador | 67 | 0.6% |
| England | 35 | 0.3% |
| Europe | 491 | 4.8% |
| Germany | 85 | 0.8% |
| Ghana | 15 | 0.2% |
| Haiti | 251 | 2.4% |
| India | 45 | 0.4% |
| Israel | 16 | 0.2% |
| Italy | 24 | 0.2% |
| Japan | 12 | 0.1% |
| Latin America | 481 | 4.6% |
| Liberia | 17 | 0.2% |
| Moldova | 7 | 0.1% |
| Morocco | 29 | 0.3% |
| Nigeria | 52 | 0.5% |
| Northern Africa | 29 | 0.3% |
| Northern Europe | 132 | 1.3% |
| Oceania | 22 | 0.2% |
| Pakistan | 15 | 0.2% |
| Panama | 1 | 0.0% |
| Philippines | 86 | 0.8% |
| Poland | 22 | 0.2% |
| Portugal | 42 | 0.4% |
| Russia | 21 | 0.2% |
| South America | 57 | 0.5% |
| South Central Asia | 60 | 0.6% |
| South Eastern Asia | 108 | 1.0% |
| Southern Europe | 66 | 0.6% |
| Switzerland | 98 | 0.9% |
| Thailand | 13 | 0.1% |
| Turkey | 72 | 0.7% |
| Ukraine | 42 | 0.4% |
| Vietnam | 9 | 0.1% |
| Western Africa | 84 | 0.8% |
| Western Asia | 95 | 0.9% |
| Western Europe | 197 | 1.9% | View All 49 Rows |
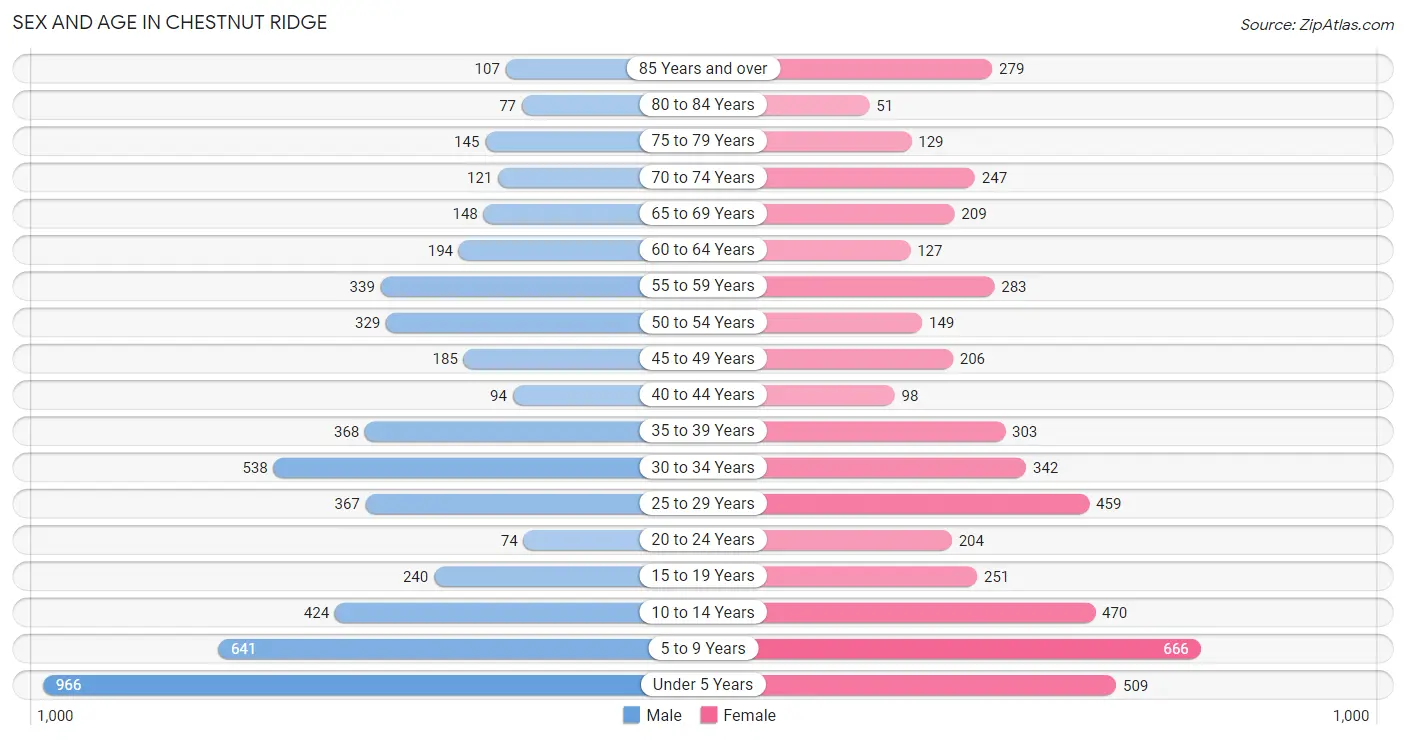
Sex and Age in Chestnut Ridge
Sex and Age in Chestnut Ridge
The most populous age groups in Chestnut Ridge are Under 5 Years (966 | 18.0%) for men and 5 to 9 Years (666 | 13.4%) for women.
| Age Bracket | Male | Female |
| Under 5 Years | 966 (18.0%) | 509 (10.2%) |
| 5 to 9 Years | 641 (12.0%) | 666 (13.4%) |
| 10 to 14 Years | 424 (7.9%) | 470 (9.4%) |
| 15 to 19 Years | 240 (4.5%) | 251 (5.0%) |
| 20 to 24 Years | 74 (1.4%) | 204 (4.1%) |
| 25 to 29 Years | 367 (6.9%) | 459 (9.2%) |
| 30 to 34 Years | 538 (10.0%) | 342 (6.9%) |
| 35 to 39 Years | 368 (6.9%) | 303 (6.1%) |
| 40 to 44 Years | 94 (1.8%) | 98 (2.0%) |
| 45 to 49 Years | 185 (3.5%) | 206 (4.1%) |
| 50 to 54 Years | 329 (6.1%) | 149 (3.0%) |
| 55 to 59 Years | 339 (6.3%) | 283 (5.7%) |
| 60 to 64 Years | 194 (3.6%) | 127 (2.5%) |
| 65 to 69 Years | 148 (2.8%) | 209 (4.2%) |
| 70 to 74 Years | 121 (2.3%) | 247 (5.0%) |
| 75 to 79 Years | 145 (2.7%) | 129 (2.6%) |
| 80 to 84 Years | 77 (1.4%) | 51 (1.0%) |
| 85 Years and over | 107 (2.0%) | 279 (5.6%) |
| Total | 5,357 (100.0%) | 4,982 (100.0%) |
Families and Households in Chestnut Ridge
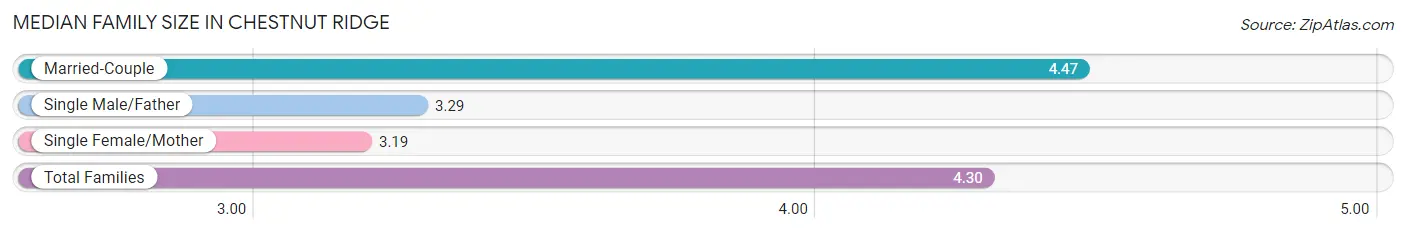
Median Family Size in Chestnut Ridge
The median family size in Chestnut Ridge is 4.30 persons per family, with married-couple families (1,820 | 86.1%) accounting for the largest median family size of 4.47 persons per family. On the other hand, single female/mother families (206 | 9.7%) represent the smallest median family size with 3.19 persons per family.
| Family Type | # Families | Family Size |
| Married-Couple | 1,820 (86.1%) | 4.47 |
| Single Male/Father | 89 (4.2%) | 3.29 |
| Single Female/Mother | 206 (9.7%) | 3.19 |
| Total Families | 2,115 (100.0%) | 4.30 |
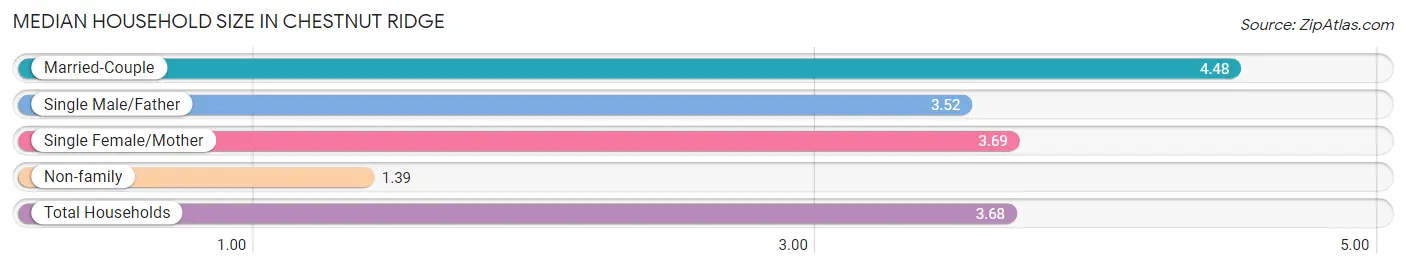
Median Household Size in Chestnut Ridge
The median household size in Chestnut Ridge is 3.68 persons per household, with married-couple households (1,820 | 66.4%) accounting for the largest median household size of 4.48 persons per household. non-family households (627 | 22.9%) represent the smallest median household size with 1.39 persons per household.
| Household Type | # Households | Household Size |
| Married-Couple | 1,820 (66.4%) | 4.48 |
| Single Male/Father | 89 (3.3%) | 3.52 |
| Single Female/Mother | 206 (7.5%) | 3.69 |
| Non-family | 627 (22.9%) | 1.39 |
| Total Households | 2,742 (100.0%) | 3.68 |
Household Size by Marriage Status in Chestnut Ridge
Out of a total of 2,742 households in Chestnut Ridge, 2,115 (77.1%) are family households, while 627 (22.9%) are nonfamily households. The most numerous type of family households are 2-person households, comprising 650, and the most common type of nonfamily households are 1-person households, comprising 543.
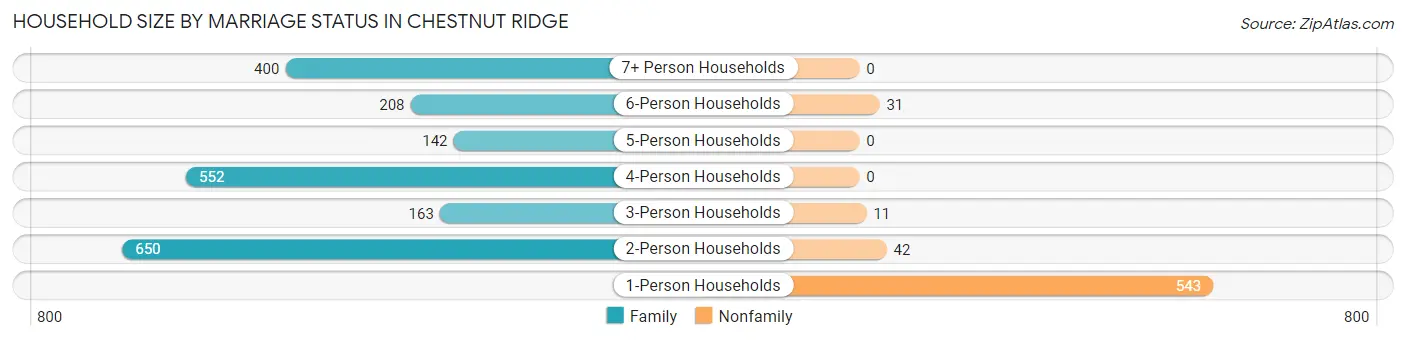
| Household Size | Family Households | Nonfamily Households |
| 1-Person Households | - | 543 (19.8%) |
| 2-Person Households | 650 (23.7%) | 42 (1.5%) |
| 3-Person Households | 163 (5.9%) | 11 (0.4%) |
| 4-Person Households | 552 (20.1%) | 0 (0.0%) |
| 5-Person Households | 142 (5.2%) | 0 (0.0%) |
| 6-Person Households | 208 (7.6%) | 31 (1.1%) |
| 7+ Person Households | 400 (14.6%) | 0 (0.0%) |
| Total | 2,115 (77.1%) | 627 (22.9%) |
Female Fertility in Chestnut Ridge
Fertility by Age in Chestnut Ridge
Average fertility rate in Chestnut Ridge is 150.0 births per 1,000 women. Women in the age bracket of 35 to 50 years have the highest fertility rate with 179.0 births per 1,000 women. Women in the age bracket of 20 to 34 years acount for 60.5% of all women with births.
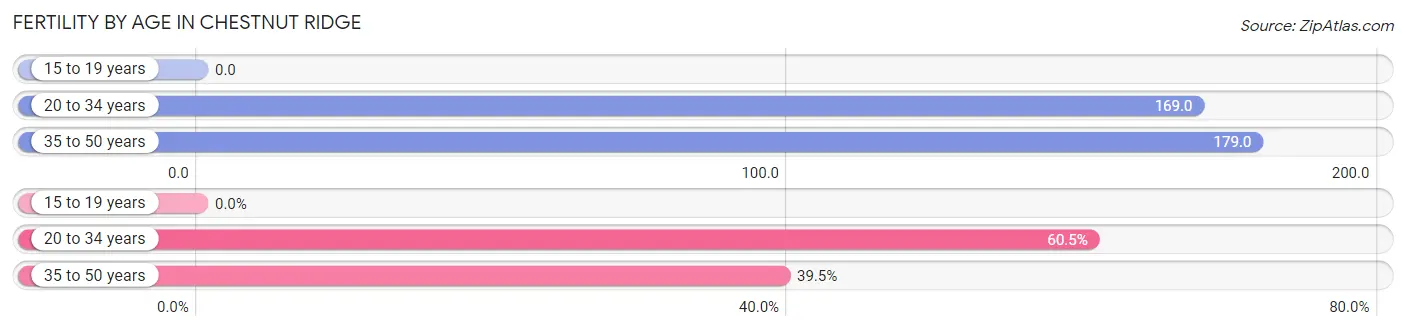
| Age Bracket | Women with Births | Births / 1,000 Women |
| 15 to 19 years | 0 (0.0%) | 0.0 |
| 20 to 34 years | 170 (60.5%) | 169.0 |
| 35 to 50 years | 111 (39.5%) | 179.0 |
| Total | 281 (100.0%) | 150.0 |
Fertility by Age by Marriage Status in Chestnut Ridge
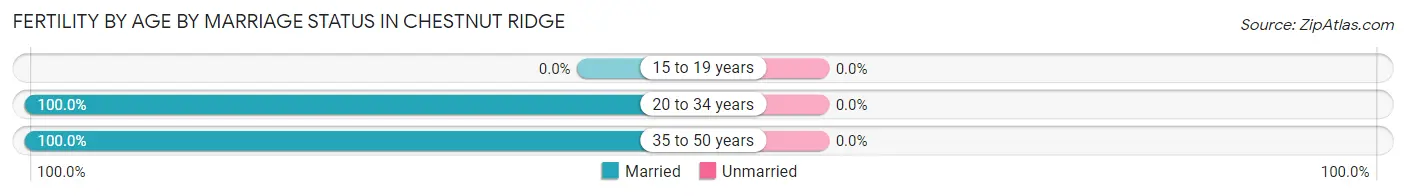
| Age Bracket | Married | Unmarried |
| 15 to 19 years | 0 (0.0%) | 0 (0.0%) |
| 20 to 34 years | 170 (100.0%) | 0 (0.0%) |
| 35 to 50 years | 111 (100.0%) | 0 (0.0%) |
| Total | 281 (100.0%) | 0 (0.0%) |
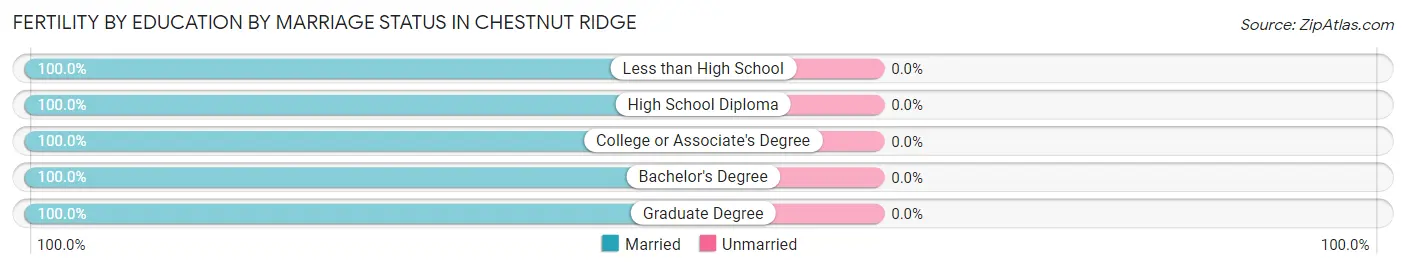
Fertility by Education in Chestnut Ridge
Average fertility rate in Chestnut Ridge is 150.0 births per 1,000 women. Women with the education attainment of graduate degree have the highest fertility rate of 421.0 births per 1,000 women, while women with the education attainment of college or associate's degree have the lowest fertility at 32.0 births per 1,000 women. Women with the education attainment of high school diploma represent 44.5% of all women with births.
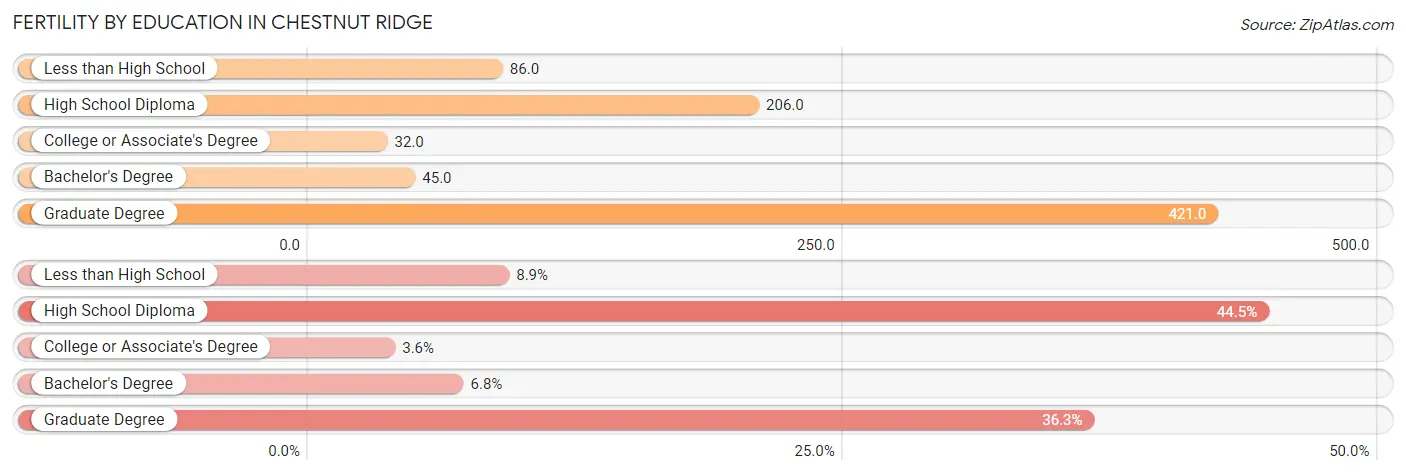
| Educational Attainment | Women with Births | Births / 1,000 Women |
| Less than High School | 25 (8.9%) | 86.0 |
| High School Diploma | 125 (44.5%) | 206.0 |
| College or Associate's Degree | 10 (3.6%) | 32.0 |
| Bachelor's Degree | 19 (6.8%) | 45.0 |
| Graduate Degree | 102 (36.3%) | 421.0 |
| Total | 281 (100.0%) | 150.0 |
Fertility by Education by Marriage Status in Chestnut Ridge
| Educational Attainment | Married | Unmarried |
| Less than High School | 25 (100.0%) | 0 (0.0%) |
| High School Diploma | 125 (100.0%) | 0 (0.0%) |
| College or Associate's Degree | 10 (100.0%) | 0 (0.0%) |
| Bachelor's Degree | 19 (100.0%) | 0 (0.0%) |
| Graduate Degree | 102 (100.0%) | 0 (0.0%) |
| Total | 281 (100.0%) | 0 (0.0%) |
Employment Characteristics in Chestnut Ridge
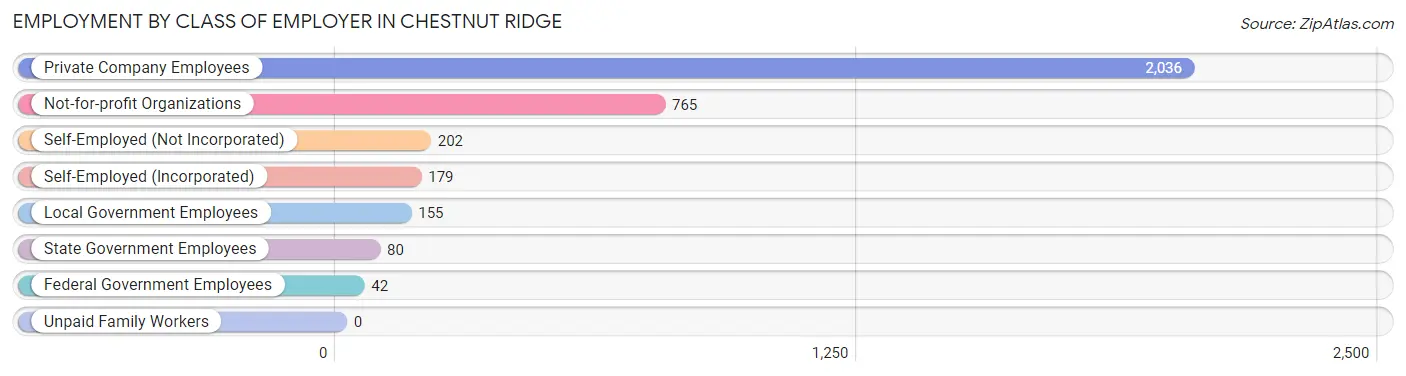
Employment by Class of Employer in Chestnut Ridge
Among the 3,459 employed individuals in Chestnut Ridge, private company employees (2,036 | 58.9%), not-for-profit organizations (765 | 22.1%), and self-employed (not incorporated) (202 | 5.8%) make up the most common classes of employment.
| Employer Class | # Employees | % Employees |
| Private Company Employees | 2,036 | 58.9% |
| Self-Employed (Incorporated) | 179 | 5.2% |
| Self-Employed (Not Incorporated) | 202 | 5.8% |
| Not-for-profit Organizations | 765 | 22.1% |
| Local Government Employees | 155 | 4.5% |
| State Government Employees | 80 | 2.3% |
| Federal Government Employees | 42 | 1.2% |
| Unpaid Family Workers | 0 | 0.0% |
| Total | 3,459 | 100.0% |
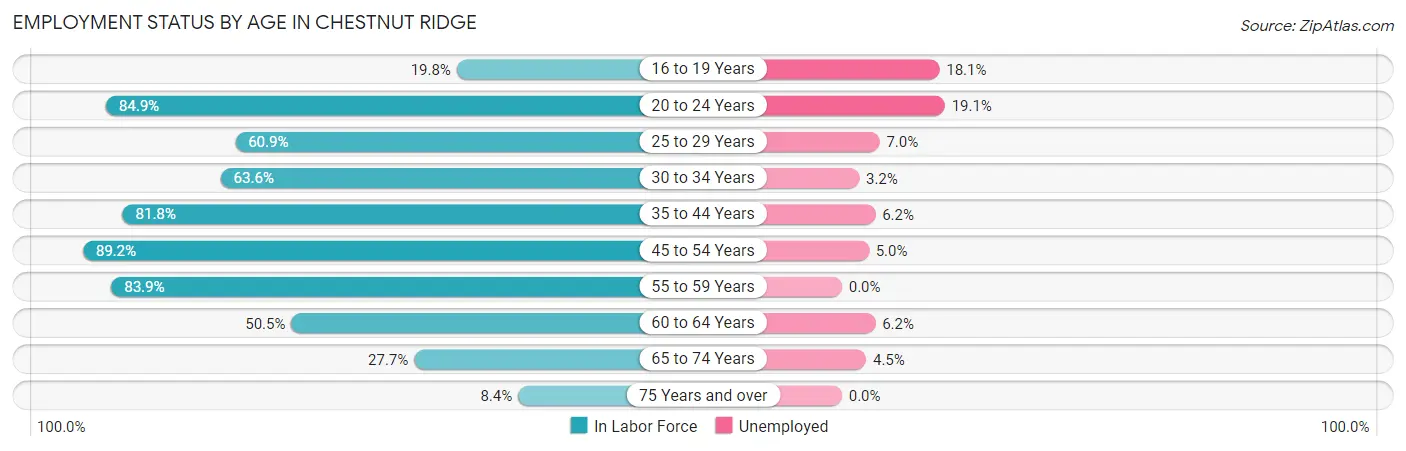
Employment Status by Age in Chestnut Ridge
According to the labor force statistics for Chestnut Ridge, out of the total population over 16 years of age (6,535), 58.2% or 3,803 individuals are in the labor force, with 5.6% or 213 of them unemployed. The age group with the highest labor force participation rate is 45 to 54 years, with 89.2% or 775 individuals in the labor force. Within the labor force, the 20 to 24 years age range has the highest percentage of unemployed individuals, with 19.1% or 45 of them being unemployed.
| Age Bracket | In Labor Force | Unemployed |
| 16 to 19 Years | 72 (19.8%) | 13 (18.1%) |
| 20 to 24 Years | 236 (84.9%) | 45 (19.1%) |
| 25 to 29 Years | 503 (60.9%) | 35 (7.0%) |
| 30 to 34 Years | 560 (63.6%) | 18 (3.2%) |
| 35 to 44 Years | 706 (81.8%) | 44 (6.2%) |
| 45 to 54 Years | 775 (89.2%) | 39 (5.0%) |
| 55 to 59 Years | 522 (83.9%) | 0 (0.0%) |
| 60 to 64 Years | 162 (50.5%) | 10 (6.2%) |
| 65 to 74 Years | 201 (27.7%) | 9 (4.5%) |
| 75 Years and over | 66 (8.4%) | 0 (0.0%) |
| Total | 3,803 (58.2%) | 213 (5.6%) |
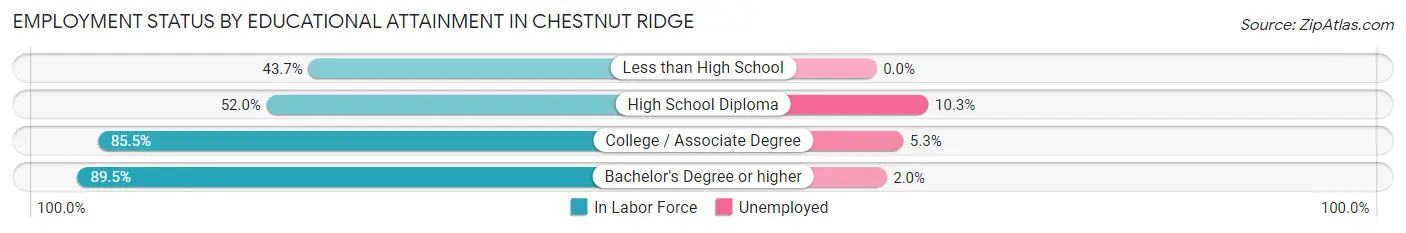
Employment Status by Educational Attainment in Chestnut Ridge
According to labor force statistics for Chestnut Ridge, 73.7% of individuals (3,229) out of the total population between 25 and 64 years of age (4,381) are in the labor force, with 4.5% or 145 of them being unemployed. The group with the highest labor force participation rate are those with the educational attainment of bachelor's degree or higher, with 89.5% or 1,566 individuals in the labor force. Within the labor force, individuals with high school diploma education have the highest percentage of unemployment, with 10.3% or 72 of them being unemployed.
| Educational Attainment | In Labor Force | Unemployed |
| Less than High School | 146 (43.7%) | 0 (0.0%) |
| High School Diploma | 696 (52.0%) | 138 (10.3%) |
| College / Associate Degree | 819 (85.5%) | 51 (5.3%) |
| Bachelor's Degree or higher | 1,566 (89.5%) | 35 (2.0%) |
| Total | 3,229 (73.7%) | 197 (4.5%) |
Employment Occupations by Sex in Chestnut Ridge
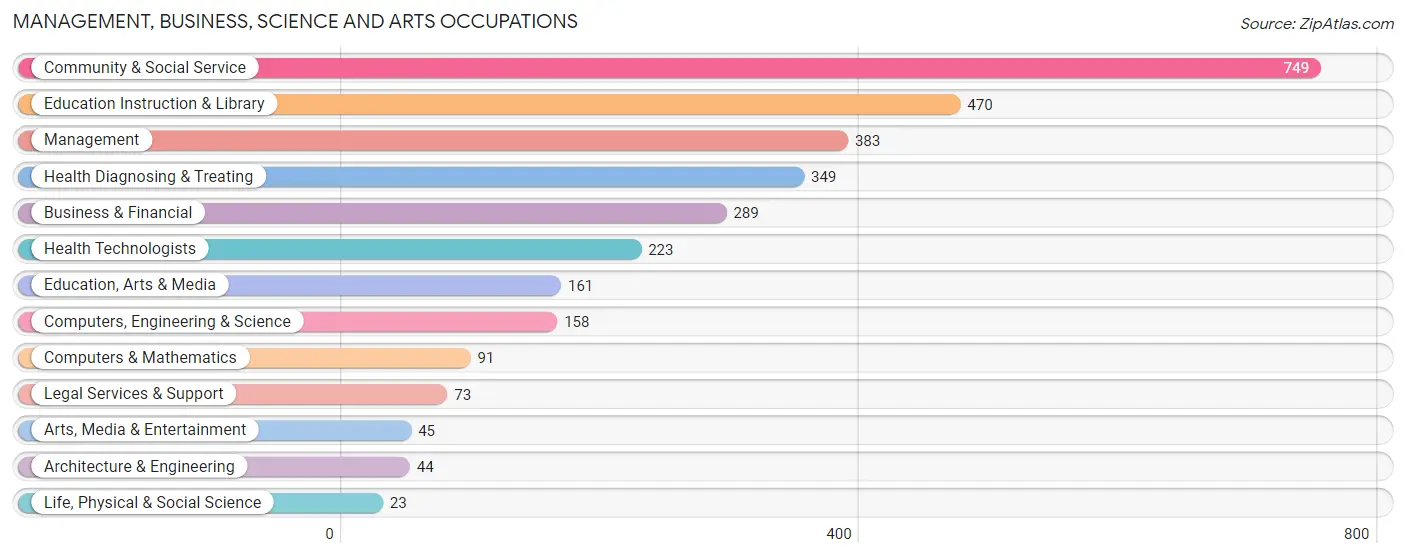
Management, Business, Science and Arts Occupations
The most common Management, Business, Science and Arts occupations in Chestnut Ridge are Community & Social Service (749 | 20.9%), Education Instruction & Library (470 | 13.1%), Management (383 | 10.7%), Health Diagnosing & Treating (349 | 9.7%), and Business & Financial (289 | 8.1%).
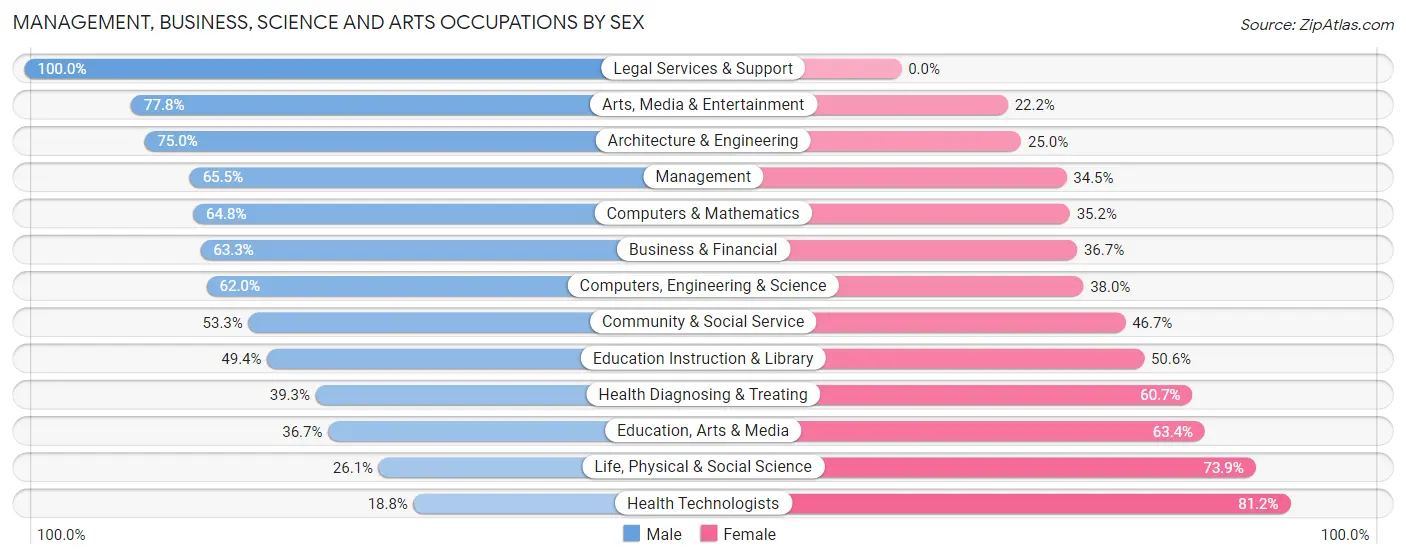
Management, Business, Science and Arts Occupations by Sex
Within the Management, Business, Science and Arts occupations in Chestnut Ridge, the most male-oriented occupations are Legal Services & Support (100.0%), Arts, Media & Entertainment (77.8%), and Architecture & Engineering (75.0%), while the most female-oriented occupations are Health Technologists (81.2%), Life, Physical & Social Science (73.9%), and Education, Arts & Media (63.3%).
| Occupation | Male | Female |
| Management | 251 (65.5%) | 132 (34.5%) |
| Business & Financial | 183 (63.3%) | 106 (36.7%) |
| Computers, Engineering & Science | 98 (62.0%) | 60 (38.0%) |
| Computers & Mathematics | 59 (64.8%) | 32 (35.2%) |
| Architecture & Engineering | 33 (75.0%) | 11 (25.0%) |
| Life, Physical & Social Science | 6 (26.1%) | 17 (73.9%) |
| Community & Social Service | 399 (53.3%) | 350 (46.7%) |
| Education, Arts & Media | 59 (36.6%) | 102 (63.3%) |
| Legal Services & Support | 73 (100.0%) | 0 (0.0%) |
| Education Instruction & Library | 232 (49.4%) | 238 (50.6%) |
| Arts, Media & Entertainment | 35 (77.8%) | 10 (22.2%) |
| Health Diagnosing & Treating | 137 (39.3%) | 212 (60.7%) |
| Health Technologists | 42 (18.8%) | 181 (81.2%) |
| Total (Category) | 1,068 (55.4%) | 860 (44.6%) |
| Total (Overall) | 2,026 (56.4%) | 1,564 (43.6%) |
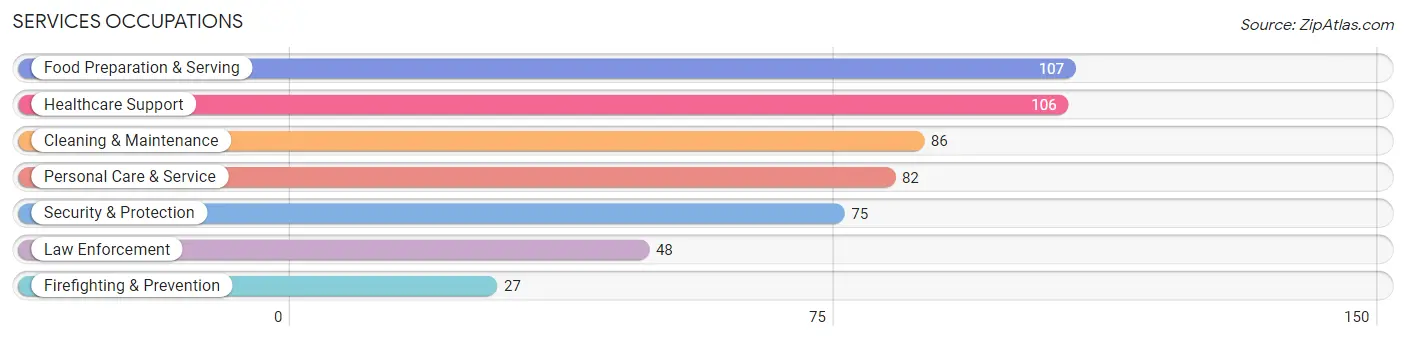
Services Occupations
The most common Services occupations in Chestnut Ridge are Food Preparation & Serving (107 | 3.0%), Healthcare Support (106 | 2.9%), Cleaning & Maintenance (86 | 2.4%), Personal Care & Service (82 | 2.3%), and Security & Protection (75 | 2.1%).
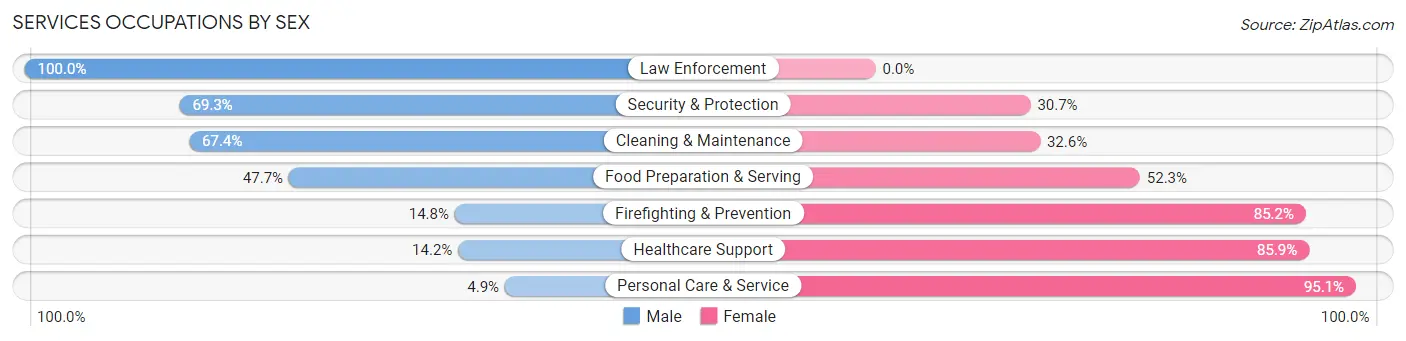
Services Occupations by Sex
Within the Services occupations in Chestnut Ridge, the most male-oriented occupations are Law Enforcement (100.0%), Security & Protection (69.3%), and Cleaning & Maintenance (67.4%), while the most female-oriented occupations are Personal Care & Service (95.1%), Healthcare Support (85.9%), and Firefighting & Prevention (85.2%).
| Occupation | Male | Female |
| Healthcare Support | 15 (14.1%) | 91 (85.9%) |
| Security & Protection | 52 (69.3%) | 23 (30.7%) |
| Firefighting & Prevention | 4 (14.8%) | 23 (85.2%) |
| Law Enforcement | 48 (100.0%) | 0 (0.0%) |
| Food Preparation & Serving | 51 (47.7%) | 56 (52.3%) |
| Cleaning & Maintenance | 58 (67.4%) | 28 (32.6%) |
| Personal Care & Service | 4 (4.9%) | 78 (95.1%) |
| Total (Category) | 180 (39.5%) | 276 (60.5%) |
| Total (Overall) | 2,026 (56.4%) | 1,564 (43.6%) |
Sales and Office Occupations
The most common Sales and Office occupations in Chestnut Ridge are Sales & Related (397 | 11.1%), and Office & Administration (333 | 9.3%).
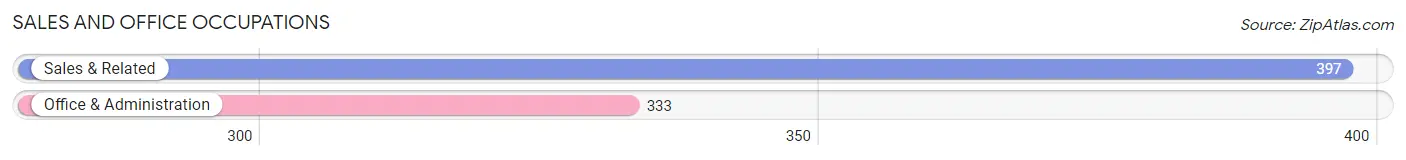
Sales and Office Occupations by Sex
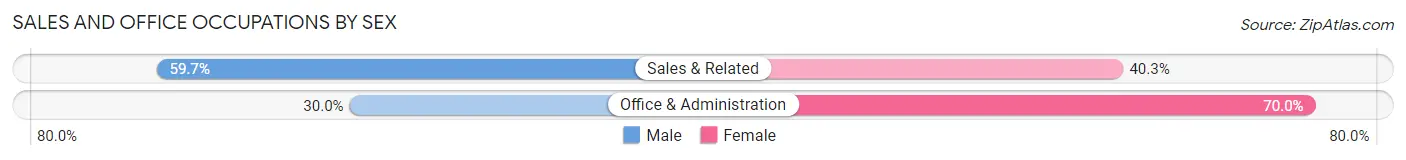
| Occupation | Male | Female |
| Sales & Related | 237 (59.7%) | 160 (40.3%) |
| Office & Administration | 100 (30.0%) | 233 (70.0%) |
| Total (Category) | 337 (46.2%) | 393 (53.8%) |
| Total (Overall) | 2,026 (56.4%) | 1,564 (43.6%) |
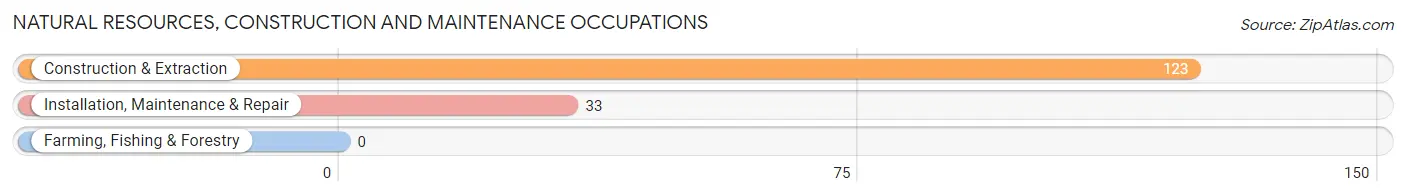
Natural Resources, Construction and Maintenance Occupations
The most common Natural Resources, Construction and Maintenance occupations in Chestnut Ridge are Construction & Extraction (123 | 3.4%), and Installation, Maintenance & Repair (33 | 0.9%).
Natural Resources, Construction and Maintenance Occupations by Sex
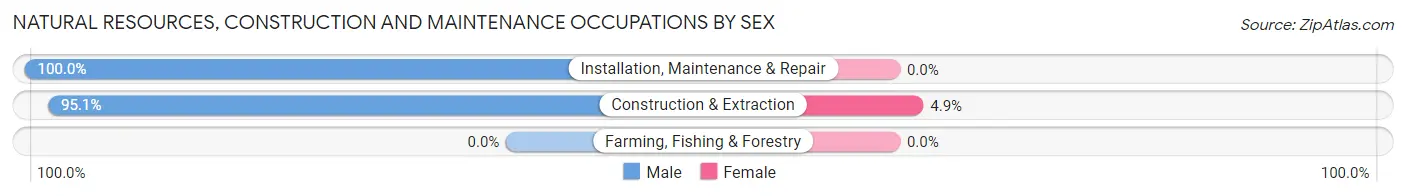
| Occupation | Male | Female |
| Farming, Fishing & Forestry | 0 (0.0%) | 0 (0.0%) |
| Construction & Extraction | 117 (95.1%) | 6 (4.9%) |
| Installation, Maintenance & Repair | 33 (100.0%) | 0 (0.0%) |
| Total (Category) | 150 (96.2%) | 6 (3.8%) |
| Total (Overall) | 2,026 (56.4%) | 1,564 (43.6%) |
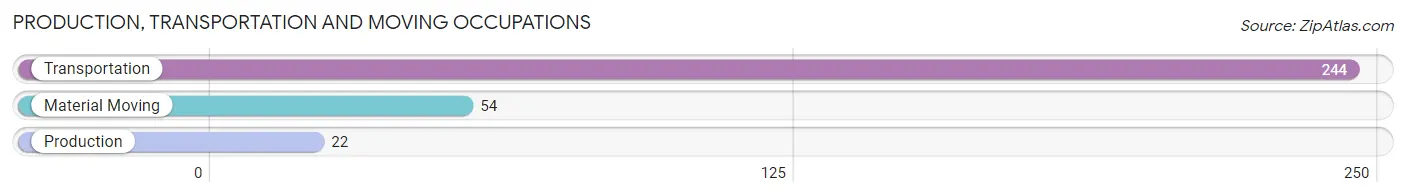
Production, Transportation and Moving Occupations
The most common Production, Transportation and Moving occupations in Chestnut Ridge are Transportation (244 | 6.8%), Material Moving (54 | 1.5%), and Production (22 | 0.6%).
Production, Transportation and Moving Occupations by Sex
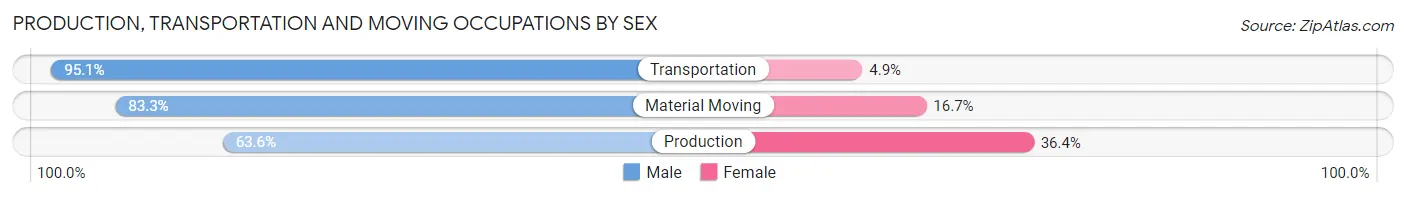
| Occupation | Male | Female |
| Production | 14 (63.6%) | 8 (36.4%) |
| Transportation | 232 (95.1%) | 12 (4.9%) |
| Material Moving | 45 (83.3%) | 9 (16.7%) |
| Total (Category) | 291 (90.9%) | 29 (9.1%) |
| Total (Overall) | 2,026 (56.4%) | 1,564 (43.6%) |
Employment Industries by Sex in Chestnut Ridge
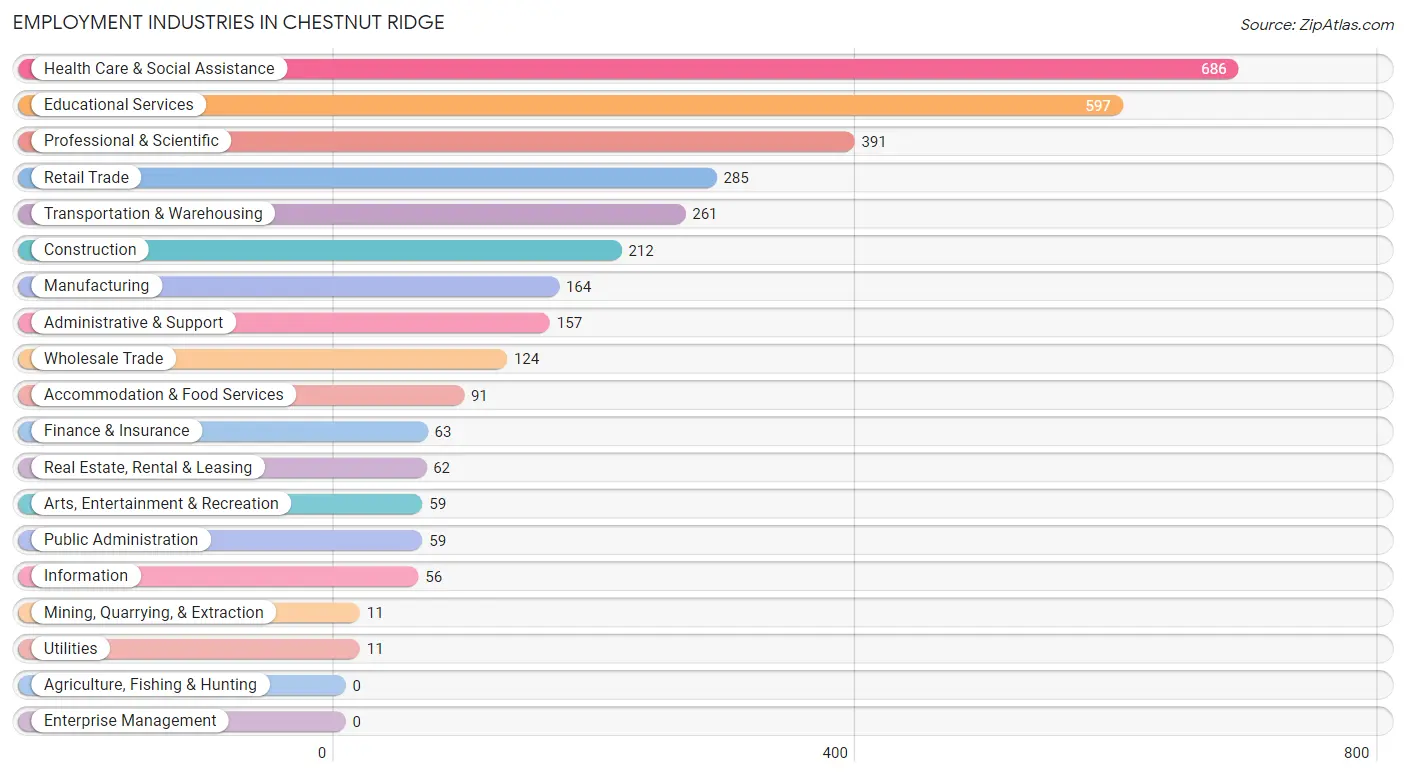
Employment Industries in Chestnut Ridge
The major employment industries in Chestnut Ridge include Health Care & Social Assistance (686 | 19.1%), Educational Services (597 | 16.6%), Professional & Scientific (391 | 10.9%), Retail Trade (285 | 7.9%), and Transportation & Warehousing (261 | 7.3%).
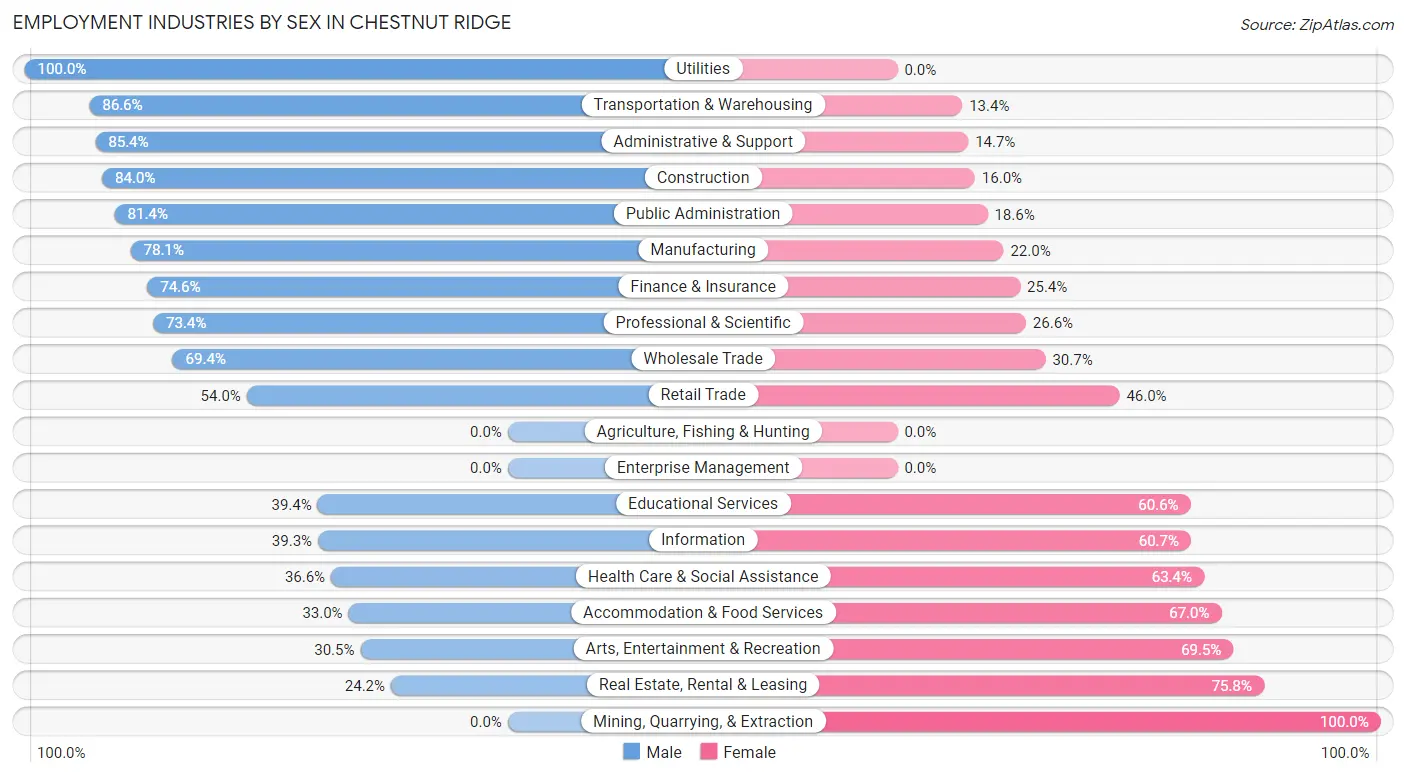
Employment Industries by Sex in Chestnut Ridge
The Chestnut Ridge industries that see more men than women are Utilities (100.0%), Transportation & Warehousing (86.6%), and Administrative & Support (85.4%), whereas the industries that tend to have a higher number of women are Mining, Quarrying, & Extraction (100.0%), Real Estate, Rental & Leasing (75.8%), and Arts, Entertainment & Recreation (69.5%).
| Industry | Male | Female |
| Agriculture, Fishing & Hunting | 0 (0.0%) | 0 (0.0%) |
| Mining, Quarrying, & Extraction | 0 (0.0%) | 11 (100.0%) |
| Construction | 178 (84.0%) | 34 (16.0%) |
| Manufacturing | 128 (78.0%) | 36 (22.0%) |
| Wholesale Trade | 86 (69.4%) | 38 (30.6%) |
| Retail Trade | 154 (54.0%) | 131 (46.0%) |
| Transportation & Warehousing | 226 (86.6%) | 35 (13.4%) |
| Utilities | 11 (100.0%) | 0 (0.0%) |
| Information | 22 (39.3%) | 34 (60.7%) |
| Finance & Insurance | 47 (74.6%) | 16 (25.4%) |
| Real Estate, Rental & Leasing | 15 (24.2%) | 47 (75.8%) |
| Professional & Scientific | 287 (73.4%) | 104 (26.6%) |
| Enterprise Management | 0 (0.0%) | 0 (0.0%) |
| Administrative & Support | 134 (85.4%) | 23 (14.6%) |
| Educational Services | 235 (39.4%) | 362 (60.6%) |
| Health Care & Social Assistance | 251 (36.6%) | 435 (63.4%) |
| Arts, Entertainment & Recreation | 18 (30.5%) | 41 (69.5%) |
| Accommodation & Food Services | 30 (33.0%) | 61 (67.0%) |
| Public Administration | 48 (81.4%) | 11 (18.6%) |
| Total | 2,026 (56.4%) | 1,564 (43.6%) |
Education in Chestnut Ridge
School Enrollment in Chestnut Ridge
The most common levels of schooling among the 3,512 students in Chestnut Ridge are elementary school (1,095 | 31.2%), middle school (786 | 22.4%), and kindergarten (516 | 14.7%).
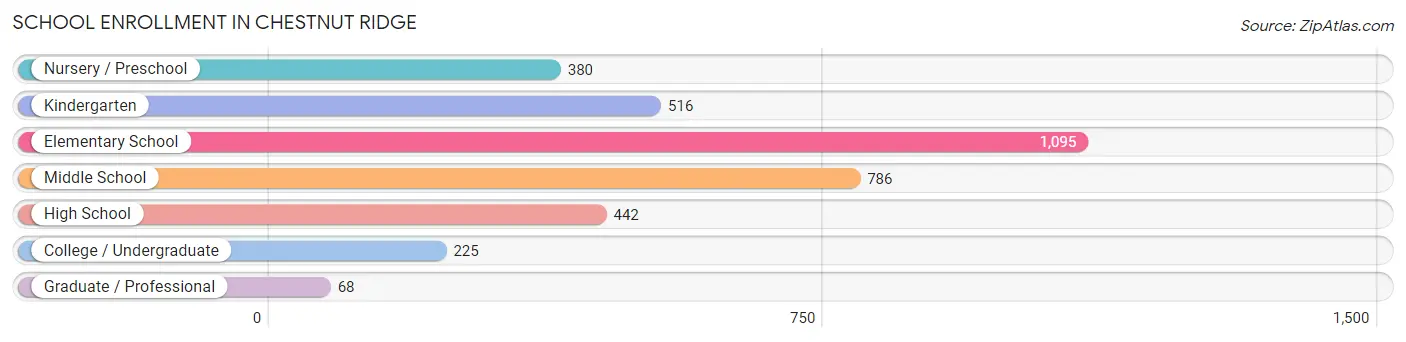
| School Level | # Students | % Students |
| Nursery / Preschool | 380 | 10.8% |
| Kindergarten | 516 | 14.7% |
| Elementary School | 1,095 | 31.2% |
| Middle School | 786 | 22.4% |
| High School | 442 | 12.6% |
| College / Undergraduate | 225 | 6.4% |
| Graduate / Professional | 68 | 1.9% |
| Total | 3,512 | 100.0% |
School Enrollment by Age by Funding Source in Chestnut Ridge
Out of a total of 3,512 students who are enrolled in schools in Chestnut Ridge, 3,024 (86.1%) attend a private institution, while the remaining 488 (13.9%) are enrolled in public schools. The age group of 3 to 4 year olds has the highest likelihood of being enrolled in private schools, with 661 (97.5% in the age bracket) enrolled. Conversely, the age group of 35 years and over has the lowest likelihood of being enrolled in a private school, with 29 (72.5% in the age bracket) attending a public institution.
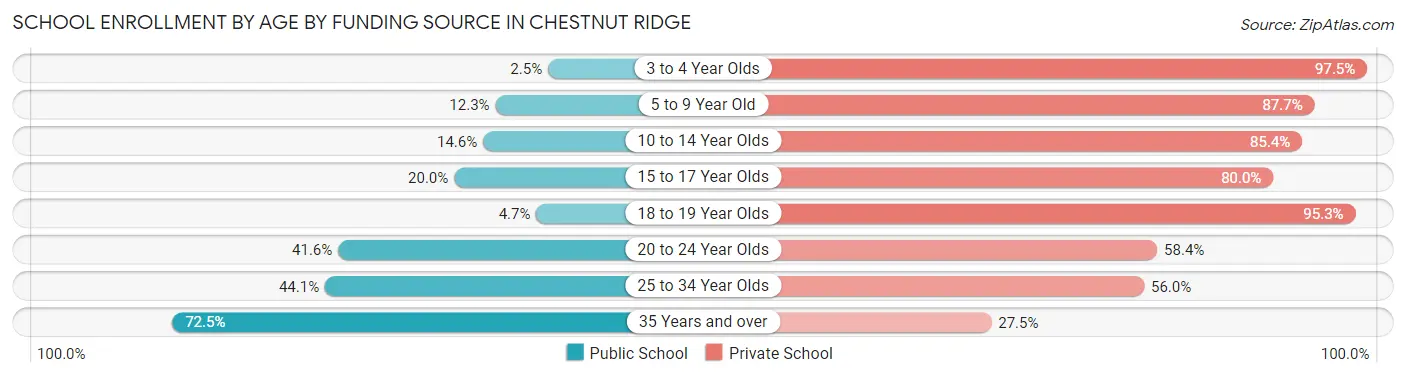
| Age Bracket | Public School | Private School |
| 3 to 4 Year Olds | 17 (2.5%) | 661 (97.5%) |
| 5 to 9 Year Old | 157 (12.3%) | 1,118 (87.7%) |
| 10 to 14 Year Olds | 130 (14.6%) | 760 (85.4%) |
| 15 to 17 Year Olds | 56 (20.0%) | 224 (80.0%) |
| 18 to 19 Year Olds | 6 (4.7%) | 122 (95.3%) |
| 20 to 24 Year Olds | 57 (41.6%) | 80 (58.4%) |
| 25 to 34 Year Olds | 37 (44.1%) | 47 (55.9%) |
| 35 Years and over | 29 (72.5%) | 11 (27.5%) |
| Total | 488 (13.9%) | 3,024 (86.1%) |
Educational Attainment by Field of Study in Chestnut Ridge
Liberal arts & history (463 | 18.8%), education (359 | 14.6%), business (319 | 13.0%), science & technology (247 | 10.0%), and psychology (199 | 8.1%) are the most common fields of study among 2,462 individuals in Chestnut Ridge who have obtained a bachelor's degree or higher.
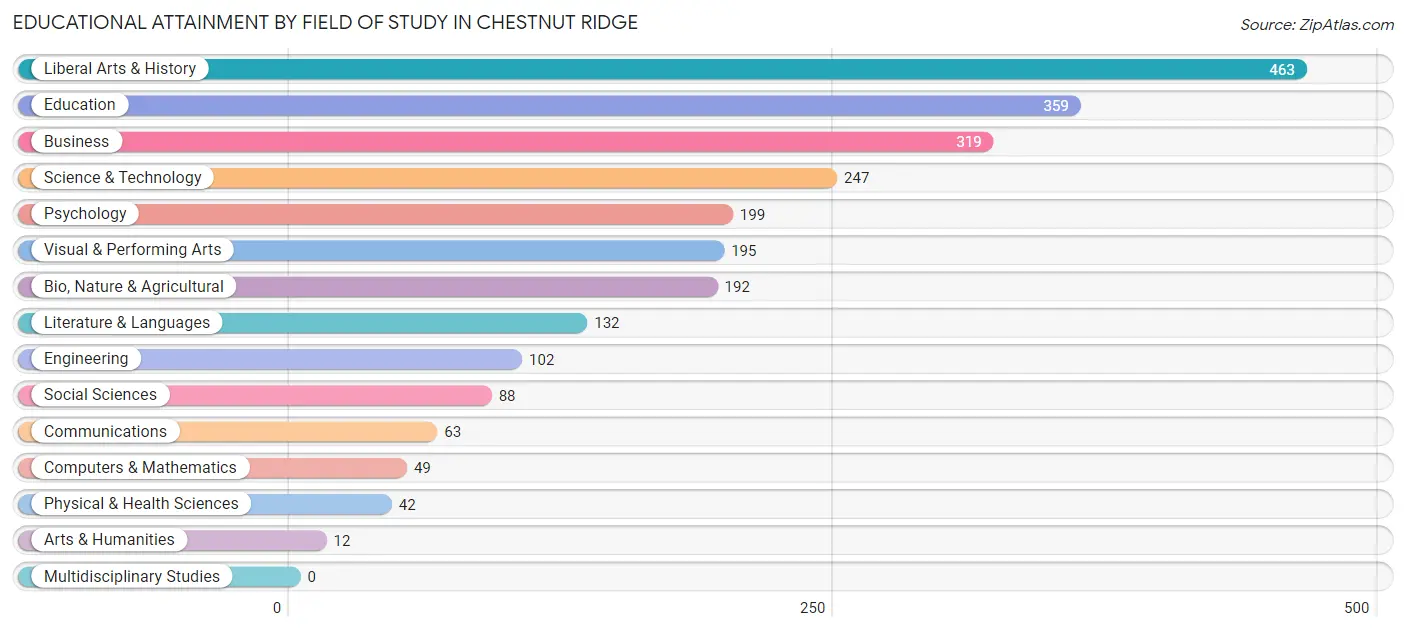
| Field of Study | # Graduates | % Graduates |
| Computers & Mathematics | 49 | 2.0% |
| Bio, Nature & Agricultural | 192 | 7.8% |
| Physical & Health Sciences | 42 | 1.7% |
| Psychology | 199 | 8.1% |
| Social Sciences | 88 | 3.6% |
| Engineering | 102 | 4.1% |
| Multidisciplinary Studies | 0 | 0.0% |
| Science & Technology | 247 | 10.0% |
| Business | 319 | 13.0% |
| Education | 359 | 14.6% |
| Literature & Languages | 132 | 5.4% |
| Liberal Arts & History | 463 | 18.8% |
| Visual & Performing Arts | 195 | 7.9% |
| Communications | 63 | 2.6% |
| Arts & Humanities | 12 | 0.5% |
| Total | 2,462 | 100.0% |
Transportation & Commute in Chestnut Ridge
Vehicle Availability by Sex in Chestnut Ridge
The most prevalent vehicle ownership categories in Chestnut Ridge are males with 2 vehicles (997, accounting for 51.3%) and females with 2 vehicles (1,003, making up 68.0%).
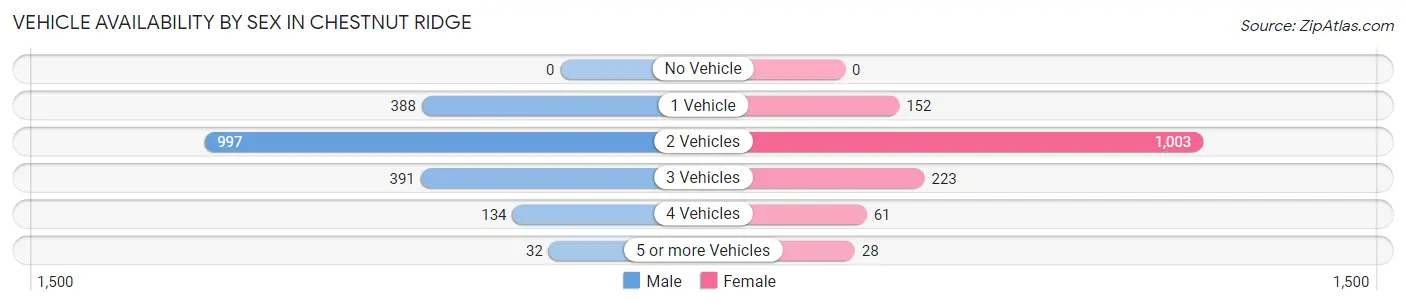
| Vehicles Available | Male | Female |
| No Vehicle | 0 (0.0%) | 0 (0.0%) |
| 1 Vehicle | 388 (20.0%) | 152 (10.4%) |
| 2 Vehicles | 997 (51.3%) | 1,003 (68.4%) |
| 3 Vehicles | 391 (20.1%) | 223 (15.2%) |
| 4 Vehicles | 134 (6.9%) | 61 (4.2%) |
| 5 or more Vehicles | 32 (1.7%) | 28 (1.9%) |
| Total | 1,942 (100.0%) | 1,467 (100.0%) |
Commute Time in Chestnut Ridge
The most frequently occuring commute durations in Chestnut Ridge are 20 to 24 minutes (474 commuters, 15.9%), 10 to 14 minutes (432 commuters, 14.5%), and 60 to 89 minutes (398 commuters, 13.4%).
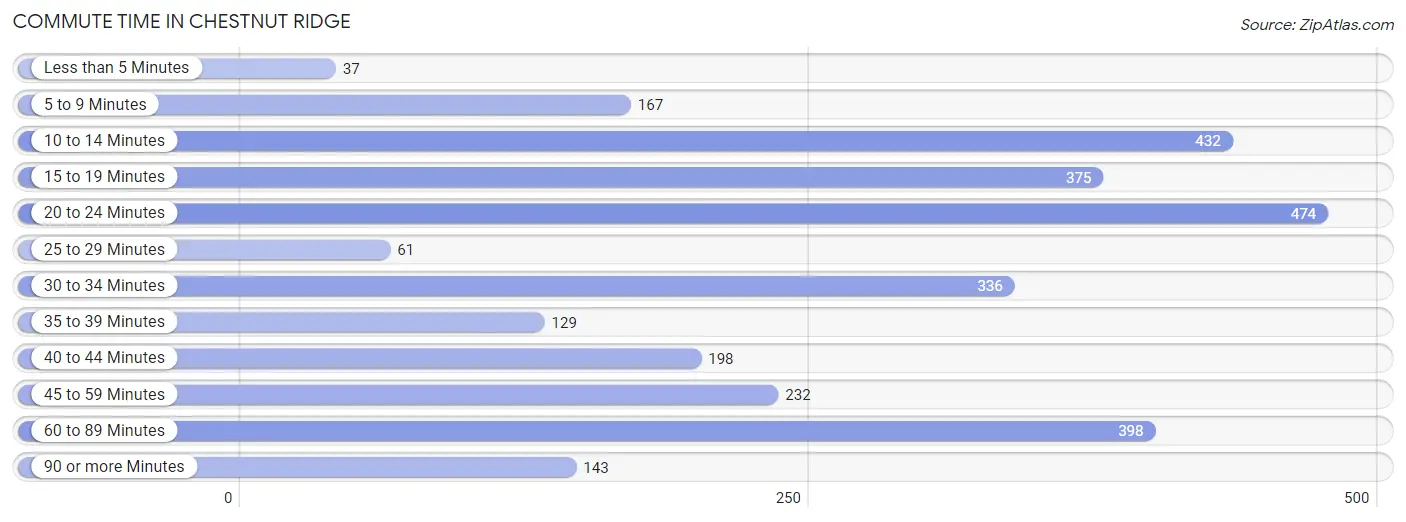
| Commute Time | # Commuters | % Commuters |
| Less than 5 Minutes | 37 | 1.2% |
| 5 to 9 Minutes | 167 | 5.6% |
| 10 to 14 Minutes | 432 | 14.5% |
| 15 to 19 Minutes | 375 | 12.6% |
| 20 to 24 Minutes | 474 | 15.9% |
| 25 to 29 Minutes | 61 | 2.1% |
| 30 to 34 Minutes | 336 | 11.3% |
| 35 to 39 Minutes | 129 | 4.3% |
| 40 to 44 Minutes | 198 | 6.6% |
| 45 to 59 Minutes | 232 | 7.8% |
| 60 to 89 Minutes | 398 | 13.4% |
| 90 or more Minutes | 143 | 4.8% |
Commute Time by Sex in Chestnut Ridge
The most common commute times in Chestnut Ridge are 20 to 24 minutes (315 commuters, 18.0%) for males and 10 to 14 minutes (268 commuters, 21.8%) for females.
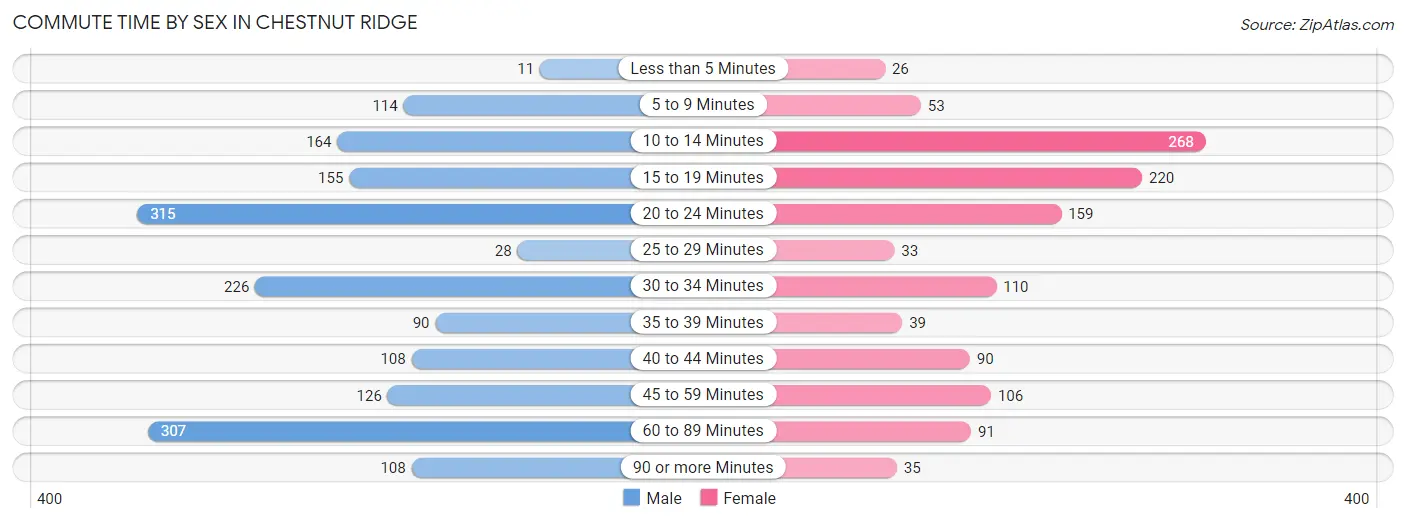
| Commute Time | Male | Female |
| Less than 5 Minutes | 11 (0.6%) | 26 (2.1%) |
| 5 to 9 Minutes | 114 (6.5%) | 53 (4.3%) |
| 10 to 14 Minutes | 164 (9.4%) | 268 (21.8%) |
| 15 to 19 Minutes | 155 (8.8%) | 220 (17.9%) |
| 20 to 24 Minutes | 315 (18.0%) | 159 (12.9%) |
| 25 to 29 Minutes | 28 (1.6%) | 33 (2.7%) |
| 30 to 34 Minutes | 226 (12.9%) | 110 (8.9%) |
| 35 to 39 Minutes | 90 (5.1%) | 39 (3.2%) |
| 40 to 44 Minutes | 108 (6.2%) | 90 (7.3%) |
| 45 to 59 Minutes | 126 (7.2%) | 106 (8.6%) |
| 60 to 89 Minutes | 307 (17.5%) | 91 (7.4%) |
| 90 or more Minutes | 108 (6.2%) | 35 (2.9%) |
Time of Departure to Work by Sex in Chestnut Ridge
The most frequent times of departure to work in Chestnut Ridge are 7:00 AM to 7:29 AM (260, 14.8%) for males and 8:00 AM to 8:29 AM (317, 25.8%) for females.
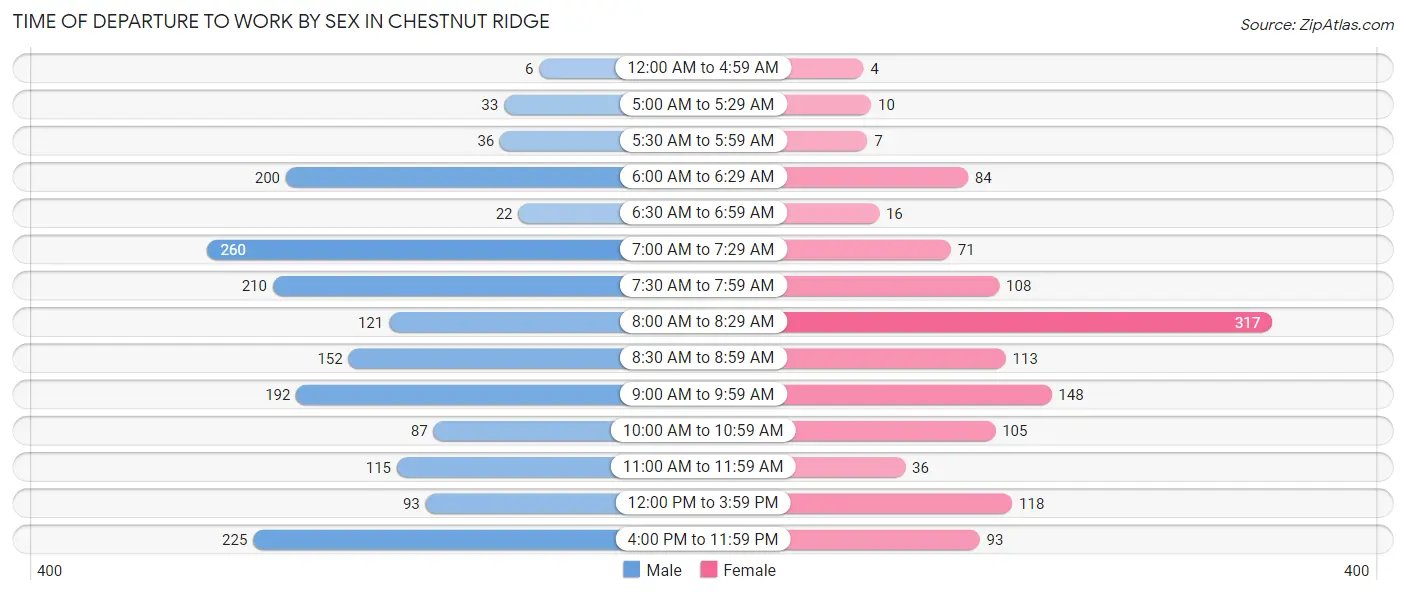
| Time of Departure | Male | Female |
| 12:00 AM to 4:59 AM | 6 (0.3%) | 4 (0.3%) |
| 5:00 AM to 5:29 AM | 33 (1.9%) | 10 (0.8%) |
| 5:30 AM to 5:59 AM | 36 (2.1%) | 7 (0.6%) |
| 6:00 AM to 6:29 AM | 200 (11.4%) | 84 (6.8%) |
| 6:30 AM to 6:59 AM | 22 (1.3%) | 16 (1.3%) |
| 7:00 AM to 7:29 AM | 260 (14.8%) | 71 (5.8%) |
| 7:30 AM to 7:59 AM | 210 (12.0%) | 108 (8.8%) |
| 8:00 AM to 8:29 AM | 121 (6.9%) | 317 (25.8%) |
| 8:30 AM to 8:59 AM | 152 (8.7%) | 113 (9.2%) |
| 9:00 AM to 9:59 AM | 192 (11.0%) | 148 (12.0%) |
| 10:00 AM to 10:59 AM | 87 (5.0%) | 105 (8.5%) |
| 11:00 AM to 11:59 AM | 115 (6.6%) | 36 (2.9%) |
| 12:00 PM to 3:59 PM | 93 (5.3%) | 118 (9.6%) |
| 4:00 PM to 11:59 PM | 225 (12.8%) | 93 (7.6%) |
| Total | 1,752 (100.0%) | 1,230 (100.0%) |
Housing Occupancy in Chestnut Ridge
Occupancy by Ownership in Chestnut Ridge
Of the total 2,742 dwellings in Chestnut Ridge, owner-occupied units account for 2,111 (77.0%), while renter-occupied units make up 631 (23.0%).
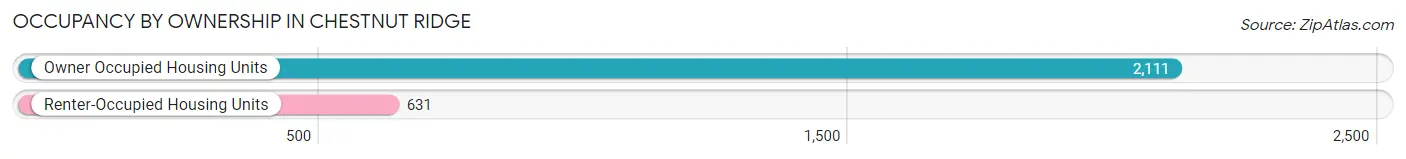
| Occupancy | # Housing Units | % Housing Units |
| Owner Occupied Housing Units | 2,111 | 77.0% |
| Renter-Occupied Housing Units | 631 | 23.0% |
| Total Occupied Housing Units | 2,742 | 100.0% |
Occupancy by Household Size in Chestnut Ridge
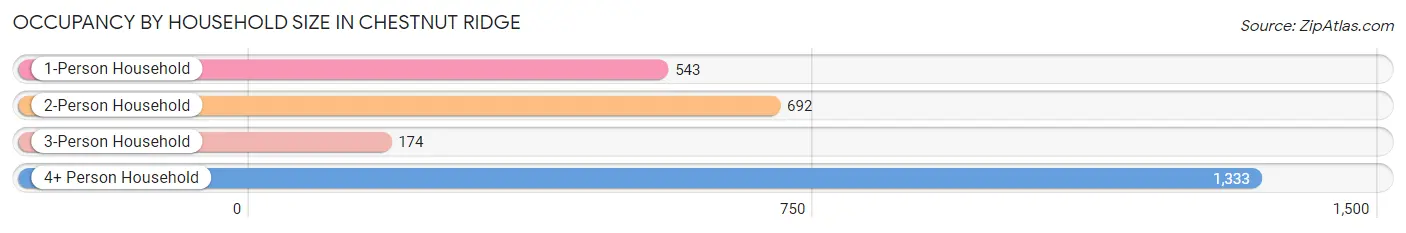
| Household Size | # Housing Units | % Housing Units |
| 1-Person Household | 543 | 19.8% |
| 2-Person Household | 692 | 25.2% |
| 3-Person Household | 174 | 6.4% |
| 4+ Person Household | 1,333 | 48.6% |
| Total Housing Units | 2,742 | 100.0% |
Occupancy by Ownership by Household Size in Chestnut Ridge
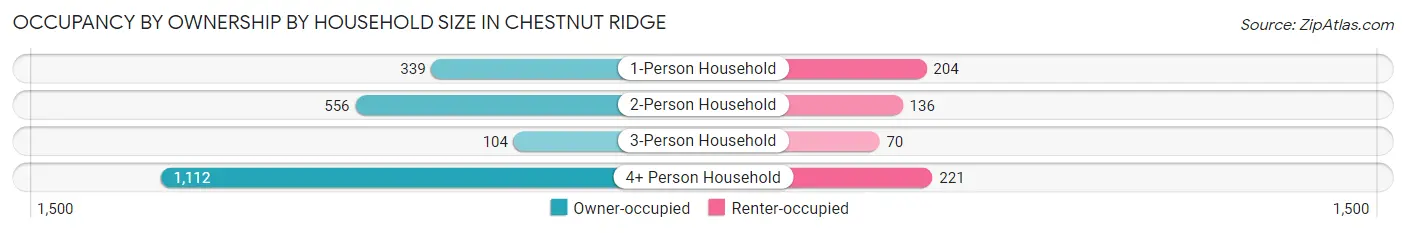
| Household Size | Owner-occupied | Renter-occupied |
| 1-Person Household | 339 (62.4%) | 204 (37.6%) |
| 2-Person Household | 556 (80.3%) | 136 (19.7%) |
| 3-Person Household | 104 (59.8%) | 70 (40.2%) |
| 4+ Person Household | 1,112 (83.4%) | 221 (16.6%) |
| Total Housing Units | 2,111 (77.0%) | 631 (23.0%) |
Occupancy by Educational Attainment in Chestnut Ridge
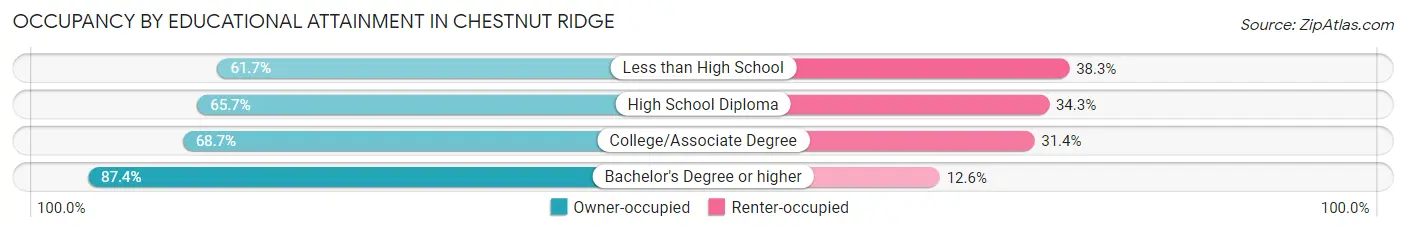
| Household Size | Owner-occupied | Renter-occupied |
| Less than High School | 100 (61.7%) | 62 (38.3%) |
| High School Diploma | 261 (65.7%) | 136 (34.3%) |
| College/Associate Degree | 578 (68.6%) | 264 (31.4%) |
| Bachelor's Degree or higher | 1,172 (87.4%) | 169 (12.6%) |
Occupancy by Age of Householder in Chestnut Ridge
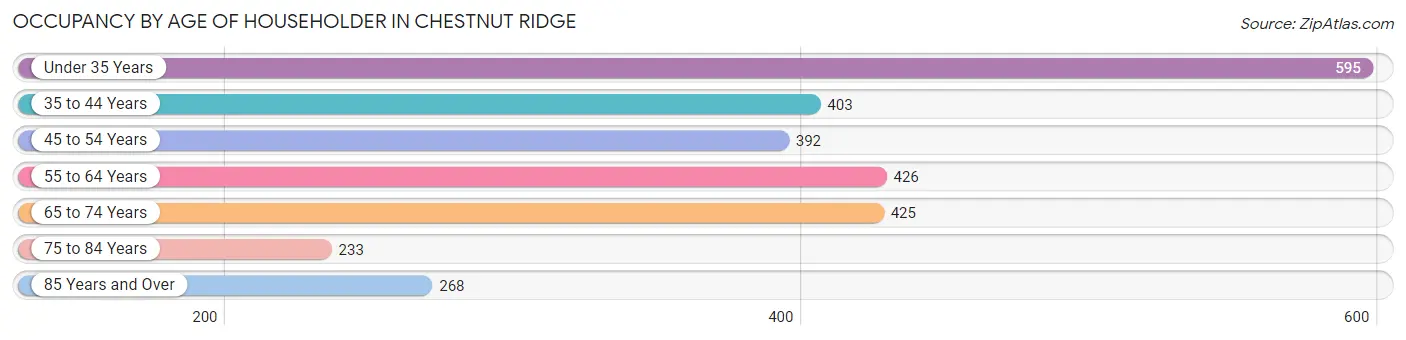
| Age Bracket | # Households | % Households |
| Under 35 Years | 595 | 21.7% |
| 35 to 44 Years | 403 | 14.7% |
| 45 to 54 Years | 392 | 14.3% |
| 55 to 64 Years | 426 | 15.5% |
| 65 to 74 Years | 425 | 15.5% |
| 75 to 84 Years | 233 | 8.5% |
| 85 Years and Over | 268 | 9.8% |
| Total | 2,742 | 100.0% |
Housing Finances in Chestnut Ridge
Median Income by Occupancy in Chestnut Ridge
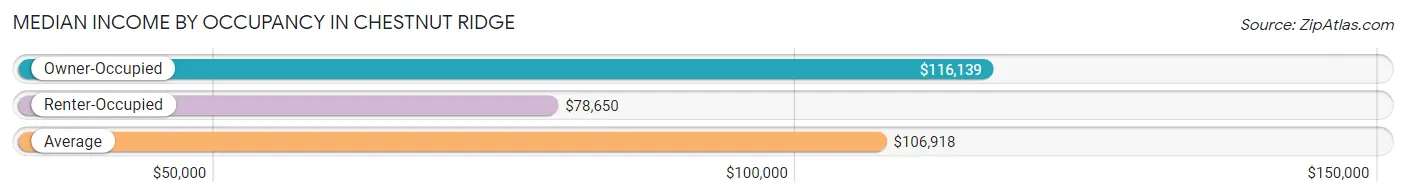
| Occupancy Type | # Households | Median Income |
| Owner-Occupied | 2,111 (77.0%) | $116,139 |
| Renter-Occupied | 631 (23.0%) | $78,650 |
| Average | 2,742 (100.0%) | $106,918 |
Occupancy by Householder Income Bracket in Chestnut Ridge
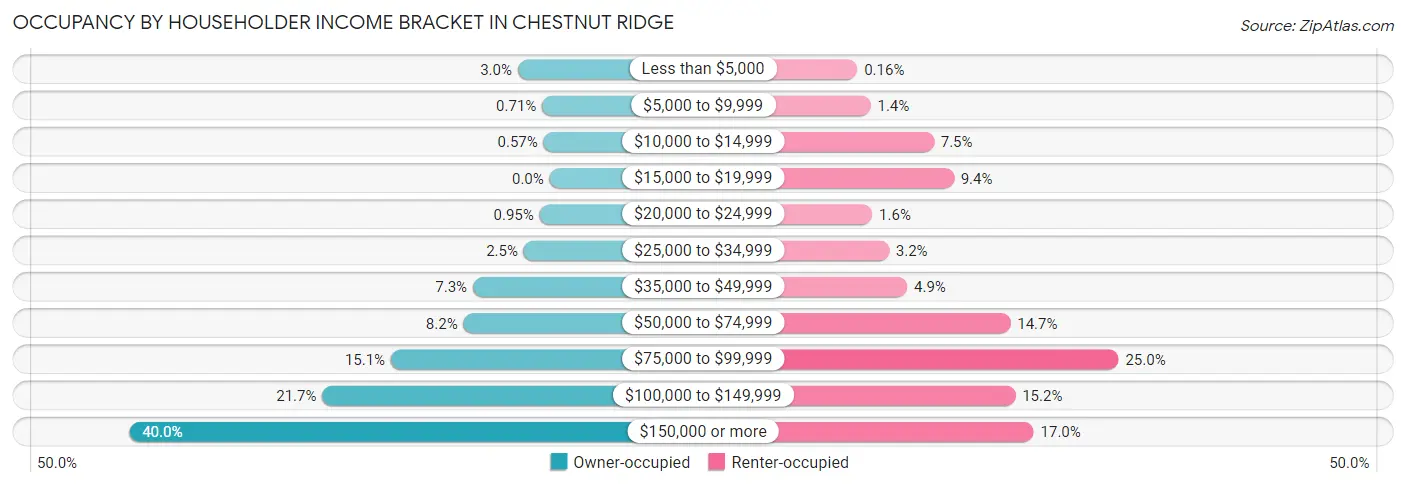
| Income Bracket | Owner-occupied | Renter-occupied |
| Less than $5,000 | 64 (3.0%) | 1 (0.2%) |
| $5,000 to $9,999 | 15 (0.7%) | 9 (1.4%) |
| $10,000 to $14,999 | 12 (0.6%) | 47 (7.4%) |
| $15,000 to $19,999 | 0 (0.0%) | 59 (9.3%) |
| $20,000 to $24,999 | 20 (0.9%) | 10 (1.6%) |
| $25,000 to $34,999 | 52 (2.5%) | 20 (3.2%) |
| $35,000 to $49,999 | 154 (7.3%) | 31 (4.9%) |
| $50,000 to $74,999 | 173 (8.2%) | 93 (14.7%) |
| $75,000 to $99,999 | 319 (15.1%) | 158 (25.0%) |
| $100,000 to $149,999 | 457 (21.6%) | 96 (15.2%) |
| $150,000 or more | 845 (40.0%) | 107 (17.0%) |
| Total | 2,111 (100.0%) | 631 (100.0%) |
Monthly Housing Cost Tiers in Chestnut Ridge
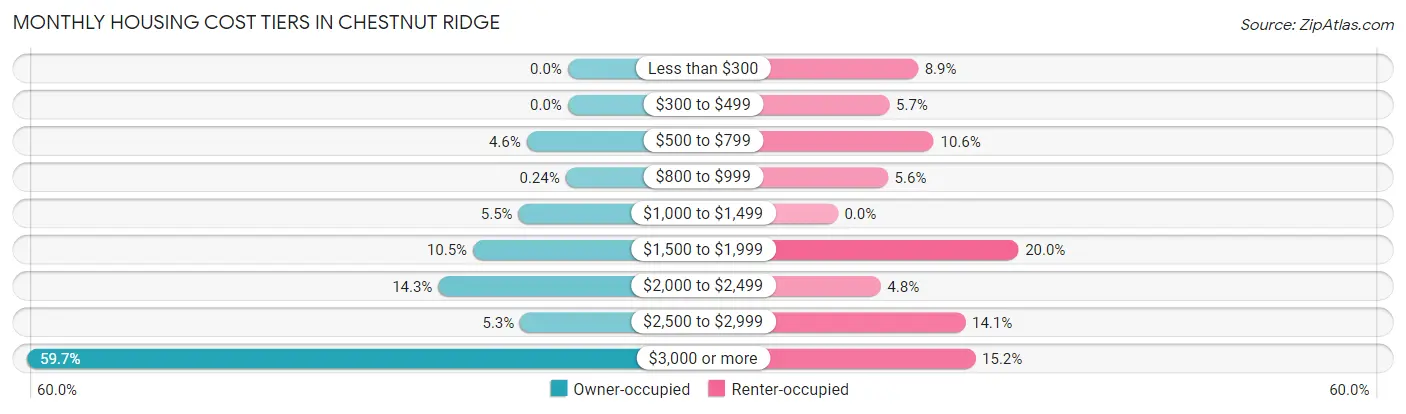
| Monthly Cost | Owner-occupied | Renter-occupied |
| Less than $300 | 0 (0.0%) | 56 (8.9%) |
| $300 to $499 | 0 (0.0%) | 36 (5.7%) |
| $500 to $799 | 96 (4.5%) | 67 (10.6%) |
| $800 to $999 | 5 (0.2%) | 35 (5.6%) |
| $1,000 to $1,499 | 115 (5.4%) | 0 (0.0%) |
| $1,500 to $1,999 | 221 (10.5%) | 126 (20.0%) |
| $2,000 to $2,499 | 302 (14.3%) | 30 (4.8%) |
| $2,500 to $2,999 | 111 (5.3%) | 89 (14.1%) |
| $3,000 or more | 1,261 (59.7%) | 96 (15.2%) |
| Total | 2,111 (100.0%) | 631 (100.0%) |
Physical Housing Characteristics in Chestnut Ridge
Housing Structures in Chestnut Ridge
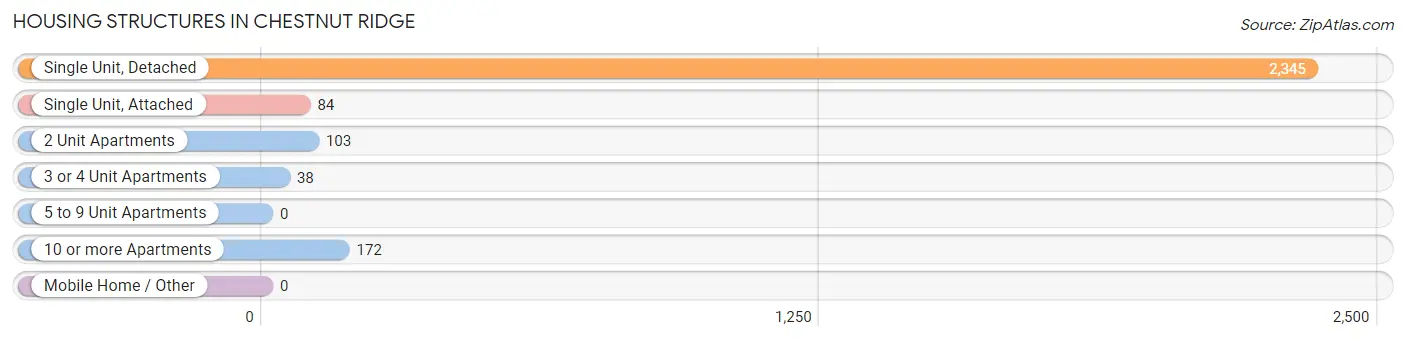
| Structure Type | # Housing Units | % Housing Units |
| Single Unit, Detached | 2,345 | 85.5% |
| Single Unit, Attached | 84 | 3.1% |
| 2 Unit Apartments | 103 | 3.8% |
| 3 or 4 Unit Apartments | 38 | 1.4% |
| 5 to 9 Unit Apartments | 0 | 0.0% |
| 10 or more Apartments | 172 | 6.3% |
| Mobile Home / Other | 0 | 0.0% |
| Total | 2,742 | 100.0% |
Housing Structures by Occupancy in Chestnut Ridge
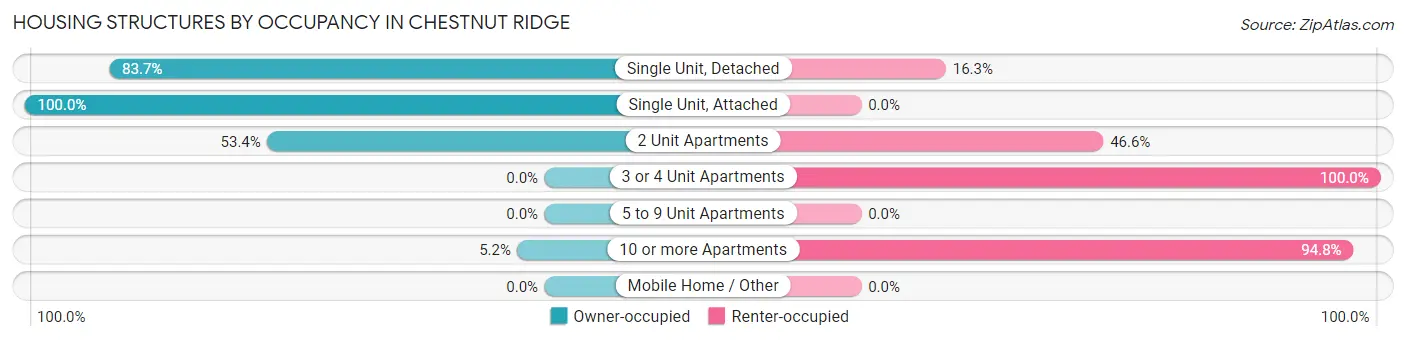
| Structure Type | Owner-occupied | Renter-occupied |
| Single Unit, Detached | 1,963 (83.7%) | 382 (16.3%) |
| Single Unit, Attached | 84 (100.0%) | 0 (0.0%) |
| 2 Unit Apartments | 55 (53.4%) | 48 (46.6%) |
| 3 or 4 Unit Apartments | 0 (0.0%) | 38 (100.0%) |
| 5 to 9 Unit Apartments | 0 (0.0%) | 0 (0.0%) |
| 10 or more Apartments | 9 (5.2%) | 163 (94.8%) |
| Mobile Home / Other | 0 (0.0%) | 0 (0.0%) |
| Total | 2,111 (77.0%) | 631 (23.0%) |
Housing Structures by Number of Rooms in Chestnut Ridge
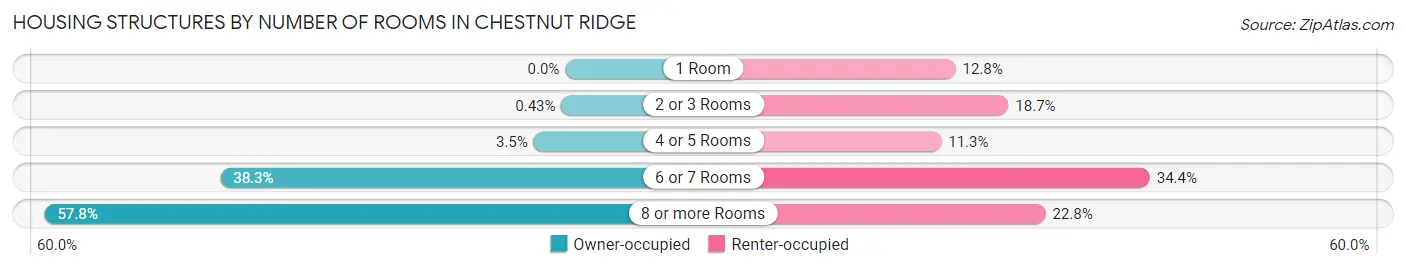
| Number of Rooms | Owner-occupied | Renter-occupied |
| 1 Room | 0 (0.0%) | 81 (12.8%) |
| 2 or 3 Rooms | 9 (0.4%) | 118 (18.7%) |
| 4 or 5 Rooms | 74 (3.5%) | 71 (11.3%) |
| 6 or 7 Rooms | 808 (38.3%) | 217 (34.4%) |
| 8 or more Rooms | 1,220 (57.8%) | 144 (22.8%) |
| Total | 2,111 (100.0%) | 631 (100.0%) |
Housing Structure by Heating Type in Chestnut Ridge
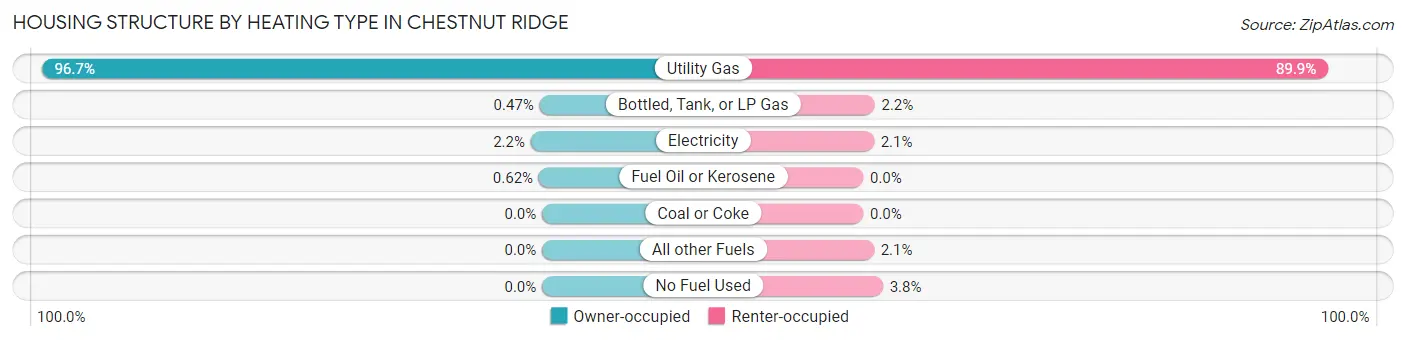
| Heating Type | Owner-occupied | Renter-occupied |
| Utility Gas | 2,042 (96.7%) | 567 (89.9%) |
| Bottled, Tank, or LP Gas | 10 (0.5%) | 14 (2.2%) |
| Electricity | 46 (2.2%) | 13 (2.1%) |
| Fuel Oil or Kerosene | 13 (0.6%) | 0 (0.0%) |
| Coal or Coke | 0 (0.0%) | 0 (0.0%) |
| All other Fuels | 0 (0.0%) | 13 (2.1%) |
| No Fuel Used | 0 (0.0%) | 24 (3.8%) |
| Total | 2,111 (100.0%) | 631 (100.0%) |
Household Vehicle Usage in Chestnut Ridge
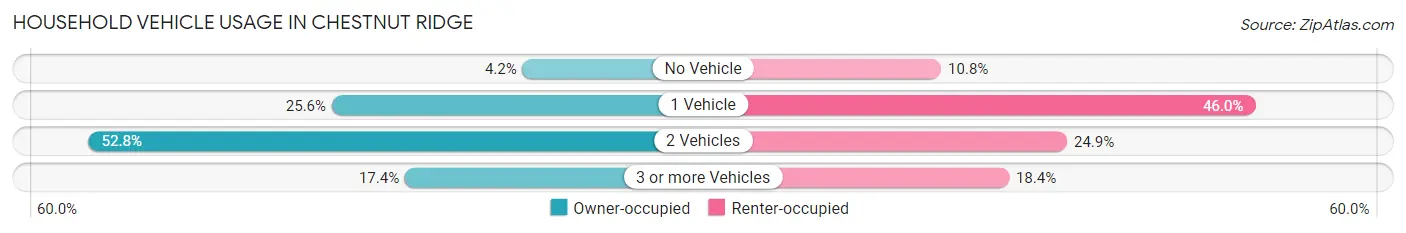
| Vehicles per Household | Owner-occupied | Renter-occupied |
| No Vehicle | 89 (4.2%) | 68 (10.8%) |
| 1 Vehicle | 540 (25.6%) | 290 (46.0%) |
| 2 Vehicles | 1,115 (52.8%) | 157 (24.9%) |
| 3 or more Vehicles | 367 (17.4%) | 116 (18.4%) |
| Total | 2,111 (100.0%) | 631 (100.0%) |
Real Estate & Mortgages in Chestnut Ridge
Real Estate and Mortgage Overview in Chestnut Ridge
| Characteristic | Without Mortgage | With Mortgage |
| Housing Units | 631 | 1,480 |
| Median Property Value | $594,300 | $634,400 |
| Median Household Income | $105,163 | $638 |
| Monthly Housing Costs | $1,501 | $1,250 |
| Real Estate Taxes | $10,001 | $24 |
Property Value by Mortgage Status in Chestnut Ridge
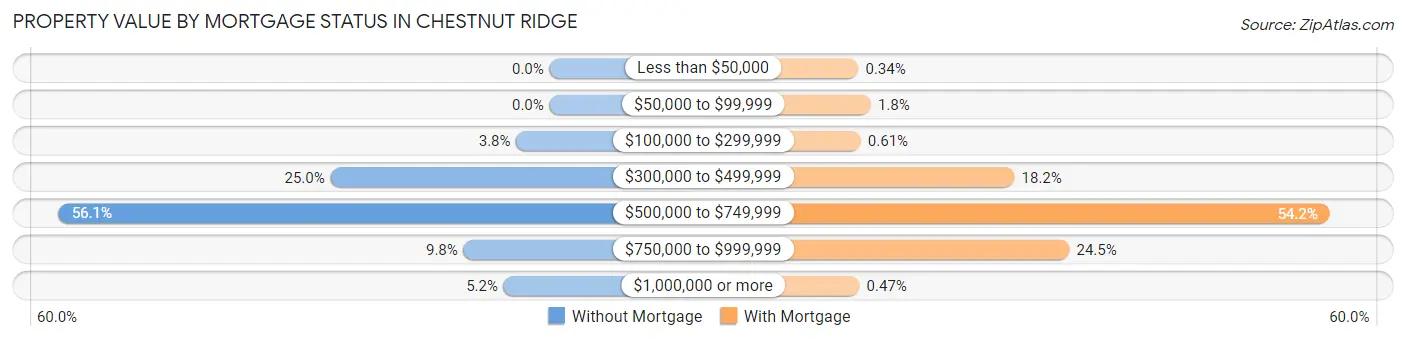
| Property Value | Without Mortgage | With Mortgage |
| Less than $50,000 | 0 (0.0%) | 5 (0.3%) |
| $50,000 to $99,999 | 0 (0.0%) | 26 (1.8%) |
| $100,000 to $299,999 | 24 (3.8%) | 9 (0.6%) |
| $300,000 to $499,999 | 158 (25.0%) | 269 (18.2%) |
| $500,000 to $749,999 | 354 (56.1%) | 802 (54.2%) |
| $750,000 to $999,999 | 62 (9.8%) | 362 (24.5%) |
| $1,000,000 or more | 33 (5.2%) | 7 (0.5%) |
| Total | 631 (100.0%) | 1,480 (100.0%) |
Household Income by Mortgage Status in Chestnut Ridge
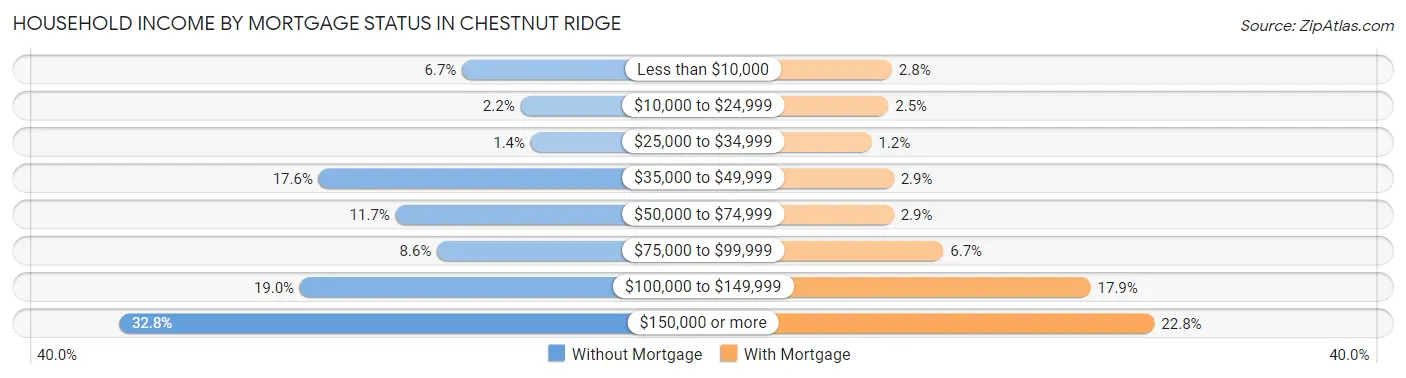
| Household Income | Without Mortgage | With Mortgage |
| Less than $10,000 | 42 (6.7%) | 41 (2.8%) |
| $10,000 to $24,999 | 14 (2.2%) | 37 (2.5%) |
| $25,000 to $34,999 | 9 (1.4%) | 18 (1.2%) |
| $35,000 to $49,999 | 111 (17.6%) | 43 (2.9%) |
| $50,000 to $74,999 | 74 (11.7%) | 43 (2.9%) |
| $75,000 to $99,999 | 54 (8.6%) | 99 (6.7%) |
| $100,000 to $149,999 | 120 (19.0%) | 265 (17.9%) |
| $150,000 or more | 207 (32.8%) | 337 (22.8%) |
| Total | 631 (100.0%) | 1,480 (100.0%) |
Property Value to Household Income Ratio in Chestnut Ridge
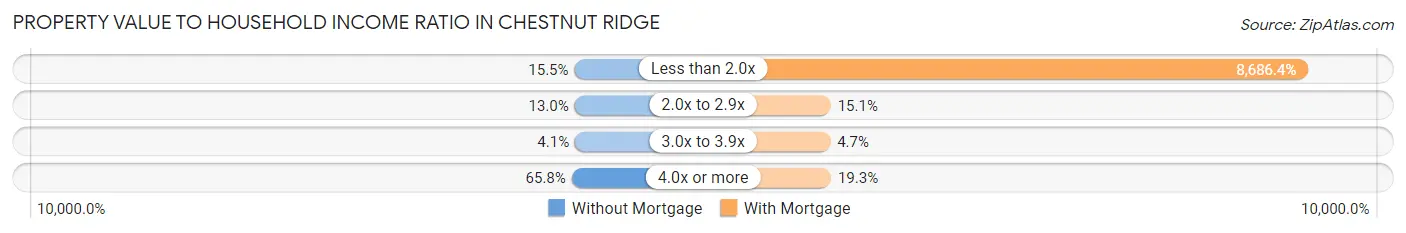
| Value-to-Income Ratio | Without Mortgage | With Mortgage |
| Less than 2.0x | 98 (15.5%) | 128,558 (8,686.4%) |
| 2.0x to 2.9x | 82 (13.0%) | 224 (15.1%) |
| 3.0x to 3.9x | 26 (4.1%) | 69 (4.7%) |
| 4.0x or more | 415 (65.8%) | 285 (19.3%) |
| Total | 631 (100.0%) | 1,480 (100.0%) |
Real Estate Taxes by Mortgage Status in Chestnut Ridge
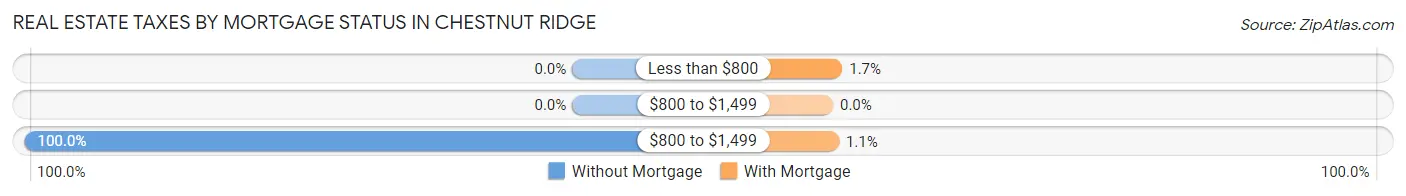
| Property Taxes | Without Mortgage | With Mortgage |
| Less than $800 | 0 (0.0%) | 25 (1.7%) |
| $800 to $1,499 | 0 (0.0%) | 0 (0.0%) |
| $800 to $1,499 | 631 (100.0%) | 16 (1.1%) |
| Total | 631 (100.0%) | 1,480 (100.0%) |
Health & Disability in Chestnut Ridge
Health Insurance Coverage by Age in Chestnut Ridge
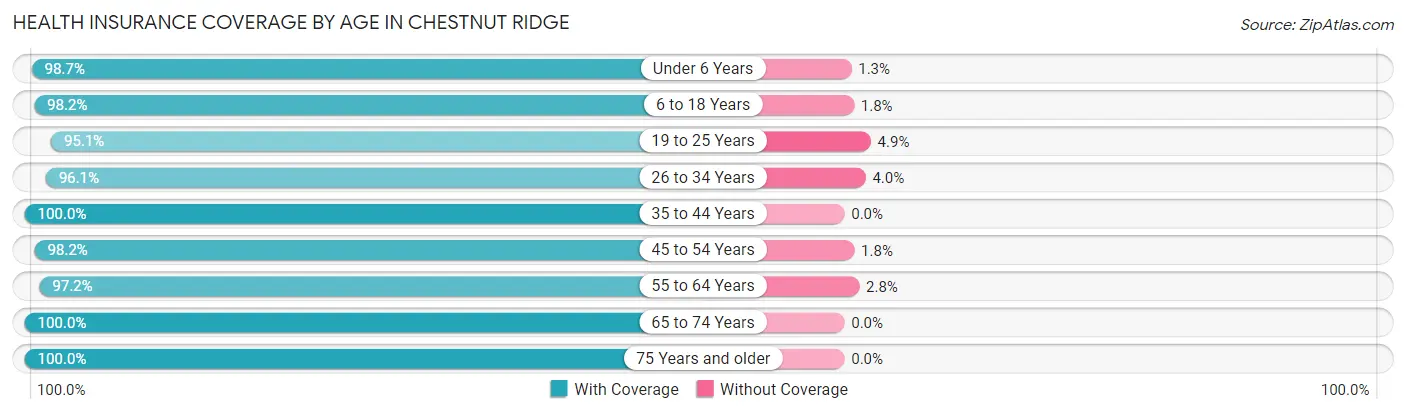
| Age Bracket | With Coverage | Without Coverage |
| Under 6 Years | 1,673 (98.7%) | 22 (1.3%) |
| 6 to 18 Years | 2,370 (98.2%) | 43 (1.8%) |
| 19 to 25 Years | 522 (95.1%) | 27 (4.9%) |
| 26 to 34 Years | 1,435 (96.1%) | 59 (4.0%) |
| 35 to 44 Years | 863 (100.0%) | 0 (0.0%) |
| 45 to 54 Years | 853 (98.2%) | 16 (1.8%) |
| 55 to 64 Years | 916 (97.2%) | 26 (2.8%) |
| 65 to 74 Years | 710 (100.0%) | 0 (0.0%) |
| 75 Years and older | 786 (100.0%) | 0 (0.0%) |
| Total | 10,128 (98.1%) | 193 (1.9%) |
Health Insurance Coverage by Citizenship Status in Chestnut Ridge
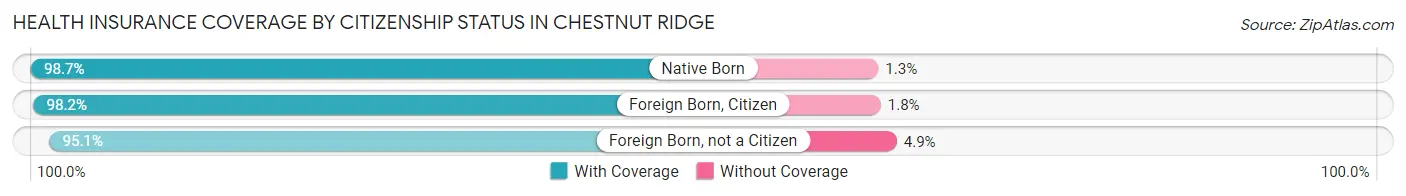
| Citizenship Status | With Coverage | Without Coverage |
| Native Born | 1,673 (98.7%) | 22 (1.3%) |
| Foreign Born, Citizen | 2,370 (98.2%) | 43 (1.8%) |
| Foreign Born, not a Citizen | 522 (95.1%) | 27 (4.9%) |
Health Insurance Coverage by Household Income in Chestnut Ridge
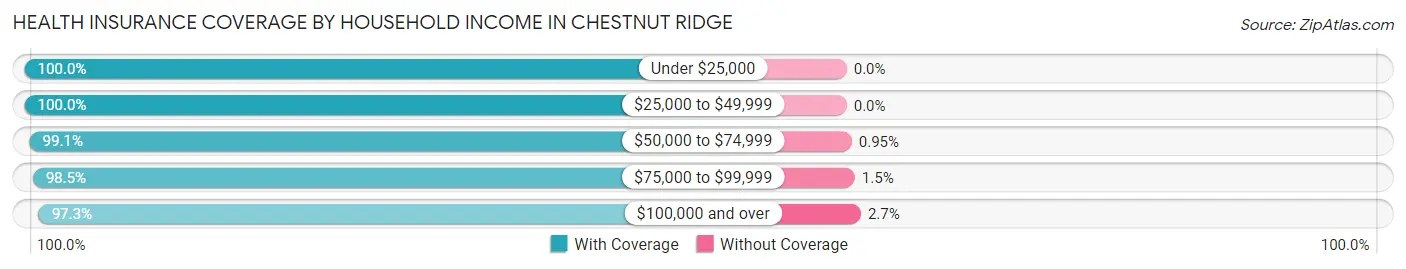
| Household Income | With Coverage | Without Coverage |
| Under $25,000 | 637 (100.0%) | 0 (0.0%) |
| $25,000 to $49,999 | 892 (100.0%) | 0 (0.0%) |
| $50,000 to $74,999 | 942 (99.1%) | 9 (0.9%) |
| $75,000 to $99,999 | 1,624 (98.5%) | 25 (1.5%) |
| $100,000 and over | 5,812 (97.3%) | 159 (2.7%) |
Public vs Private Health Insurance Coverage by Age in Chestnut Ridge
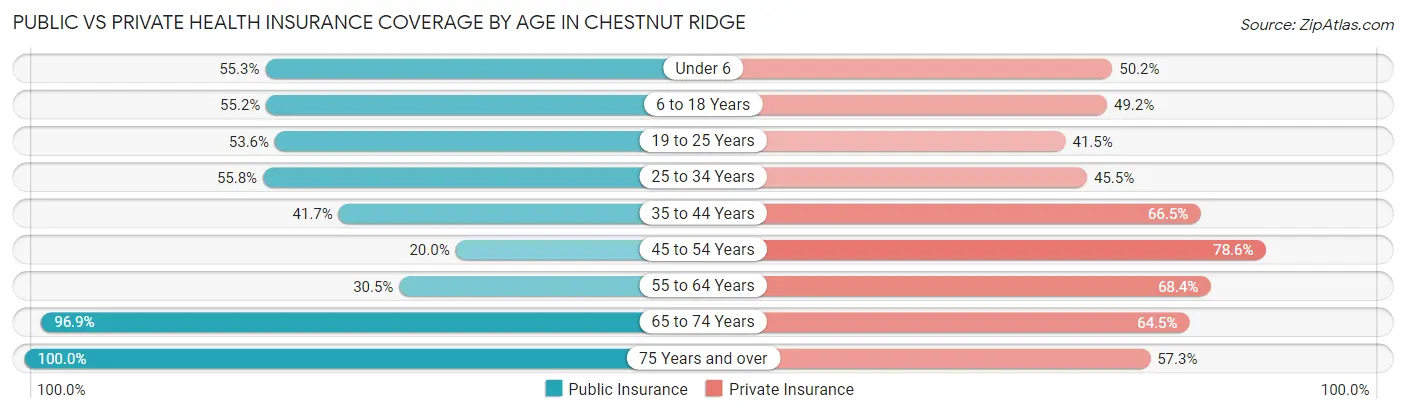
| Age Bracket | Public Insurance | Private Insurance |
| Under 6 | 938 (55.3%) | 851 (50.2%) |
| 6 to 18 Years | 1,331 (55.2%) | 1,188 (49.2%) |
| 19 to 25 Years | 294 (53.5%) | 228 (41.5%) |
| 25 to 34 Years | 833 (55.8%) | 680 (45.5%) |
| 35 to 44 Years | 360 (41.7%) | 574 (66.5%) |
| 45 to 54 Years | 174 (20.0%) | 683 (78.6%) |
| 55 to 64 Years | 287 (30.5%) | 644 (68.4%) |
| 65 to 74 Years | 688 (96.9%) | 458 (64.5%) |
| 75 Years and over | 786 (100.0%) | 450 (57.3%) |
| Total | 5,691 (55.1%) | 5,756 (55.8%) |
Disability Status by Sex by Age in Chestnut Ridge
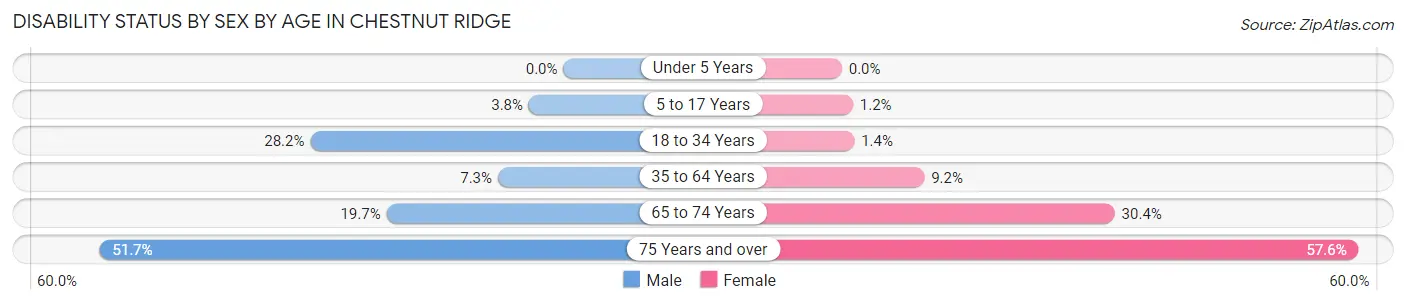
| Age Bracket | Male | Female |
| Under 5 Years | 0 (0.0%) | 0 (0.0%) |
| 5 to 17 Years | 47 (3.8%) | 16 (1.2%) |
| 18 to 34 Years | 299 (28.2%) | 15 (1.4%) |
| 35 to 64 Years | 110 (7.3%) | 107 (9.2%) |
| 65 to 74 Years | 53 (19.7%) | 134 (30.4%) |
| 75 Years and over | 170 (51.7%) | 263 (57.6%) |
Disability Class by Sex by Age in Chestnut Ridge
Disability Class: Hearing Difficulty
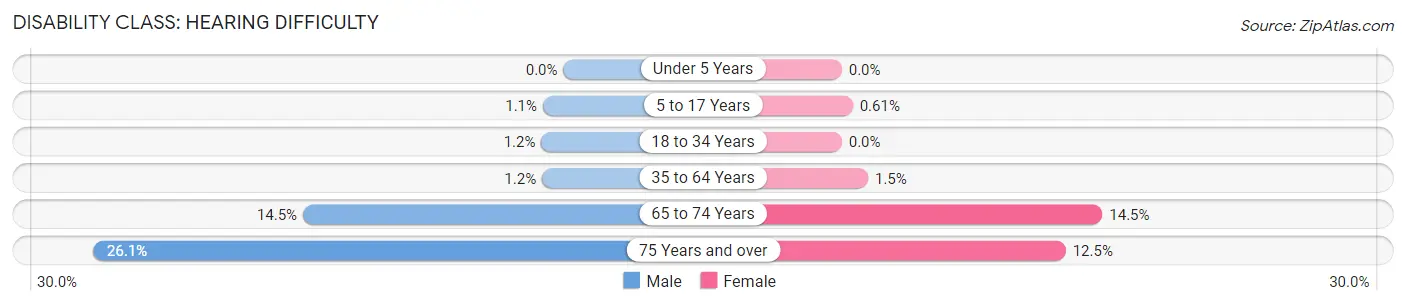
| Age Bracket | Male | Female |
| Under 5 Years | 0 (0.0%) | 0 (0.0%) |
| 5 to 17 Years | 14 (1.1%) | 8 (0.6%) |
| 18 to 34 Years | 13 (1.2%) | 0 (0.0%) |
| 35 to 64 Years | 18 (1.2%) | 17 (1.5%) |
| 65 to 74 Years | 39 (14.5%) | 64 (14.5%) |
| 75 Years and over | 86 (26.1%) | 57 (12.5%) |
Disability Class: Vision Difficulty
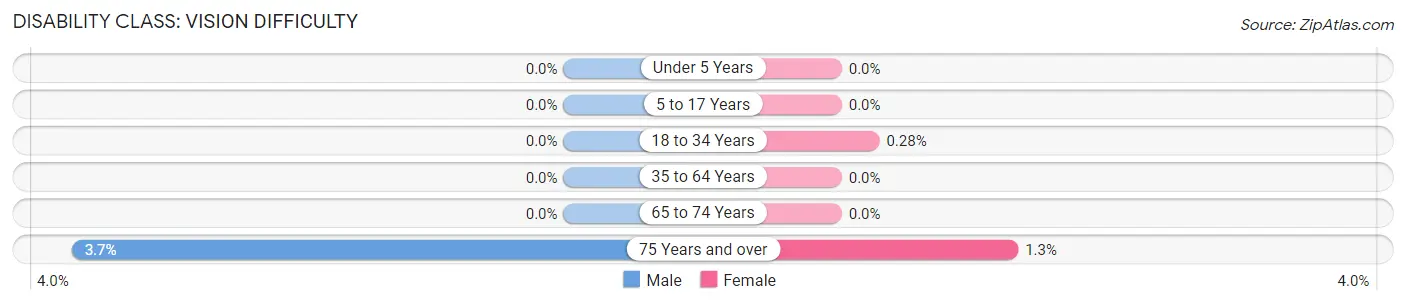
| Age Bracket | Male | Female |
| Under 5 Years | 0 (0.0%) | 0 (0.0%) |
| 5 to 17 Years | 0 (0.0%) | 0 (0.0%) |
| 18 to 34 Years | 0 (0.0%) | 3 (0.3%) |
| 35 to 64 Years | 0 (0.0%) | 0 (0.0%) |
| 65 to 74 Years | 0 (0.0%) | 0 (0.0%) |
| 75 Years and over | 12 (3.6%) | 6 (1.3%) |
Disability Class: Cognitive Difficulty
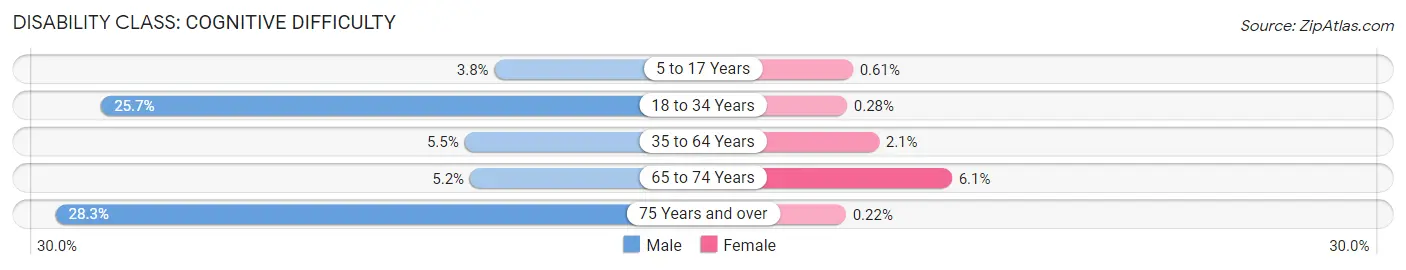
| Age Bracket | Male | Female |
| 5 to 17 Years | 47 (3.8%) | 8 (0.6%) |
| 18 to 34 Years | 273 (25.7%) | 3 (0.3%) |
| 35 to 64 Years | 83 (5.5%) | 24 (2.1%) |
| 65 to 74 Years | 14 (5.2%) | 27 (6.1%) |
| 75 Years and over | 93 (28.3%) | 1 (0.2%) |
Disability Class: Ambulatory Difficulty
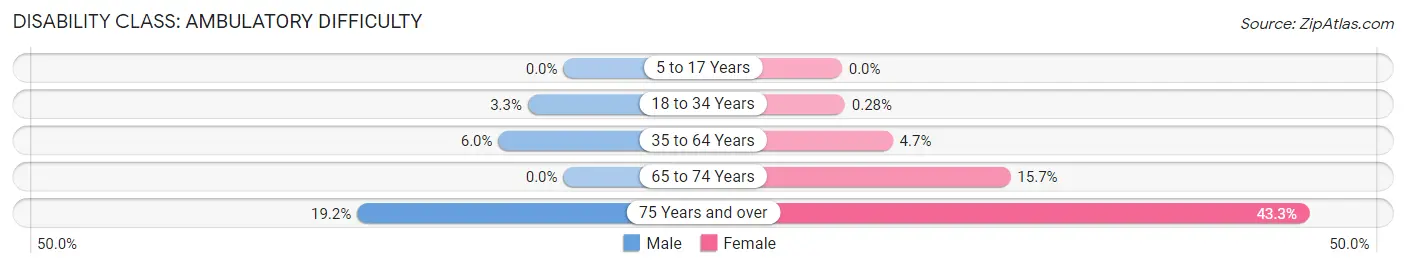
| Age Bracket | Male | Female |
| 5 to 17 Years | 0 (0.0%) | 0 (0.0%) |
| 18 to 34 Years | 35 (3.3%) | 3 (0.3%) |
| 35 to 64 Years | 91 (6.0%) | 55 (4.7%) |
| 65 to 74 Years | 0 (0.0%) | 69 (15.7%) |
| 75 Years and over | 63 (19.2%) | 198 (43.3%) |
Disability Class: Self-Care Difficulty
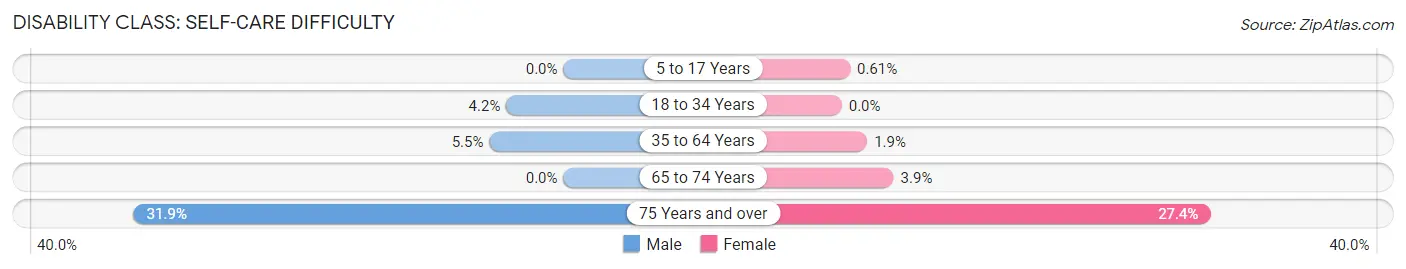
| Age Bracket | Male | Female |
| 5 to 17 Years | 0 (0.0%) | 8 (0.6%) |
| 18 to 34 Years | 45 (4.2%) | 0 (0.0%) |
| 35 to 64 Years | 83 (5.5%) | 22 (1.9%) |
| 65 to 74 Years | 0 (0.0%) | 17 (3.8%) |
| 75 Years and over | 105 (31.9%) | 125 (27.4%) |
Technology Access in Chestnut Ridge
Computing Device Access in Chestnut Ridge
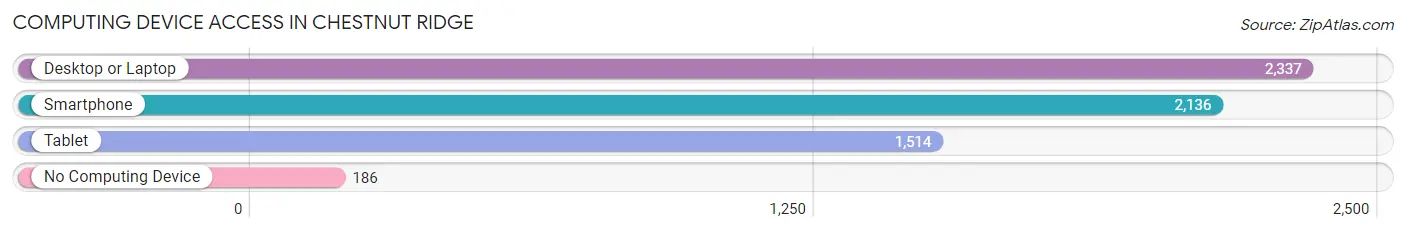
| Device Type | # Households | % Households |
| Desktop or Laptop | 2,337 | 85.2% |
| Smartphone | 2,136 | 77.9% |
| Tablet | 1,514 | 55.2% |
| No Computing Device | 186 | 6.8% |
| Total | 2,742 | 100.0% |
Internet Access in Chestnut Ridge
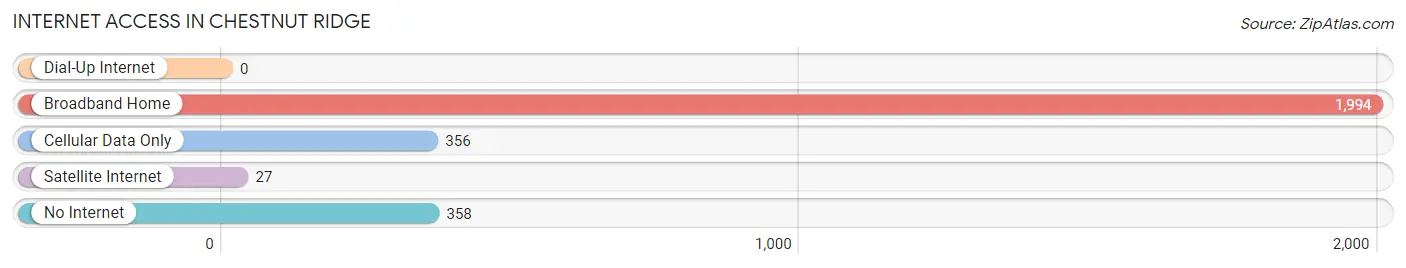
| Internet Type | # Households | % Households |
| Dial-Up Internet | 0 | 0.0% |
| Broadband Home | 1,994 | 72.7% |
| Cellular Data Only | 356 | 13.0% |
| Satellite Internet | 27 | 1.0% |
| No Internet | 358 | 13.1% |
| Total | 2,742 | 100.0% |
Chestnut Ridge Summary
History
The town of Chestnut Ridge is located in Rockland County, New York, and is part of the New York metropolitan area. The town was originally part of the Ramapo Township, which was established in 1791. The town was officially incorporated in 1986, and is now home to a population of over 8,000 people.
The town of Chestnut Ridge has a long and rich history. The area was originally inhabited by the Lenape Native Americans, who were later displaced by Dutch settlers in the 17th century. The area was then part of the Ramapo Township, which was established in 1791. The town was officially incorporated in 1986, and is now home to a population of over 8,000 people.
The town of Chestnut Ridge is named after the chestnut trees that were once abundant in the area. The town was also home to a large number of farms, which were the main source of income for the town’s residents. The town was also home to a number of resorts, which attracted visitors from all over the region.
Geography
The town of Chestnut Ridge is located in Rockland County, New York, and is part of the New York metropolitan area. The town is situated in the foothills of the Ramapo Mountains, and is bordered by the towns of Ramapo, Clarkstown, and Orangetown. The town covers an area of 8.2 square miles, and is home to a population of over 8,000 people.
The town of Chestnut Ridge is located in a hilly region, and is home to a number of small lakes and streams. The town is also home to a number of parks, including the Chestnut Ridge Park, which is a popular destination for outdoor activities. The town is also home to a number of historic sites, including the Chestnut Ridge Historic District, which is listed on the National Register of Historic Places.
Economy
The town of Chestnut Ridge has a diverse economy, with a number of different industries represented. The town is home to a number of small businesses, including retail stores, restaurants, and professional services. The town is also home to a number of larger employers, including the Palisades Center Mall, which is one of the largest shopping malls in the region.
The town of Chestnut Ridge is also home to a number of manufacturing companies, including the Rockland Bakery, which produces a variety of baked goods. The town is also home to a number of technology companies, including the software company, Oracle. The town is also home to a number of healthcare providers, including the Good Samaritan Hospital.
Demographics
The town of Chestnut Ridge has a population of over 8,000 people, according to the 2010 census. The town has a diverse population, with a variety of ethnic and racial backgrounds represented. The town has a median household income of $77,000, and a median home value of $400,000. The town is also home to a number of educational institutions, including the Chestnut Ridge Middle School and the Chestnut Ridge High School.
Common Questions
What is Per Capita Income in Chestnut Ridge?
Per Capita income in Chestnut Ridge is $41,748.
What is the Median Family Income in Chestnut Ridge?
Median Family Income in Chestnut Ridge is $129,760.
What is the Median Household income in Chestnut Ridge?
Median Household Income in Chestnut Ridge is $106,918.
What is Income or Wage Gap in Chestnut Ridge?
Income or Wage Gap in Chestnut Ridge is 45.7%.
Women in Chestnut Ridge earn 54.3 cents for every dollar earned by a man.
What is Inequality or Gini Index in Chestnut Ridge?
Inequality or Gini Index in Chestnut Ridge is 0.45.
What is the Total Population of Chestnut Ridge?
Total Population of Chestnut Ridge is 10,339.
What is the Total Male Population of Chestnut Ridge?
Total Male Population of Chestnut Ridge is 5,357.
What is the Total Female Population of Chestnut Ridge?
Total Female Population of Chestnut Ridge is 4,982.
What is the Ratio of Males per 100 Females in Chestnut Ridge?
There are 107.53 Males per 100 Females in Chestnut Ridge.
What is the Ratio of Females per 100 Males in Chestnut Ridge?
There are 93.00 Females per 100 Males in Chestnut Ridge.
What is the Median Population Age in Chestnut Ridge?
Median Population Age in Chestnut Ridge is 29.2 Years.
What is the Average Family Size in Chestnut Ridge
Average Family Size in Chestnut Ridge is 4.3 People.
What is the Average Household Size in Chestnut Ridge
Average Household Size in Chestnut Ridge is 3.7 People.
How Large is the Labor Force in Chestnut Ridge?
There are 3,803 People in the Labor Forcein in Chestnut Ridge.
What is the Percentage of People in the Labor Force in Chestnut Ridge?
58.2% of People are in the Labor Force in Chestnut Ridge.
What is the Unemployment Rate in Chestnut Ridge?
Unemployment Rate in Chestnut Ridge is 5.6%.