Palmyra, NY Map & Demographics
Palmyra Map
Palmyra Overview
$54,938
PER CAPITA INCOME
$90,769
AVG FAMILY INCOME
$72,976
AVG HOUSEHOLD INCOME
19.1%
WAGE / INCOME GAP [ % ]
80.9¢/ $1
WAGE / INCOME GAP [ $ ]
0.59
INEQUALITY / GINI INDEX
3,326
TOTAL POPULATION
1,732
MALE POPULATION
1,594
FEMALE POPULATION
108.66
MALES / 100 FEMALES
92.03
FEMALES / 100 MALES
40.9
MEDIAN AGE
2.7
AVG FAMILY SIZE
2.1
AVG HOUSEHOLD SIZE
1,954
LABOR FORCE [ PEOPLE ]
69.4%
PERCENT IN LABOR FORCE
0.5%
UNEMPLOYMENT RATE
Palmyra Zip Codes
Palmyra Area Codes
Income in Palmyra
Income Overview in Palmyra
Per Capita Income in Palmyra is $54,938, while median incomes of families and households are $90,769 and $72,976 respectively.
| Characteristic | Number | Measure |
| Per Capita Income | 3,326 | $54,938 |
| Median Family Income | 928 | $90,769 |
| Mean Family Income | 928 | $141,774 |
| Median Household Income | 1,538 | $72,976 |
| Mean Household Income | 1,538 | $119,077 |
| Income Deficit | 928 | $0 |
| Wage / Income Gap (%) | 3,326 | 19.14% |
| Wage / Income Gap ($) | 3,326 | 80.86¢ per $1 |
| Gini / Inequality Index | 3,326 | 0.59 |
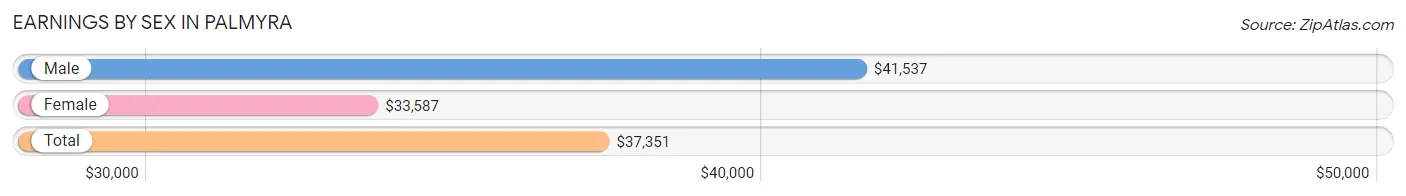
Earnings by Sex in Palmyra
Average Earnings in Palmyra are $37,351, $41,537 for men and $33,587 for women, a difference of 19.1%.
| Sex | Number | Average Earnings |
| Male | 1,037 (50.8%) | $41,537 |
| Female | 1,006 (49.2%) | $33,587 |
| Total | 2,043 (100.0%) | $37,351 |
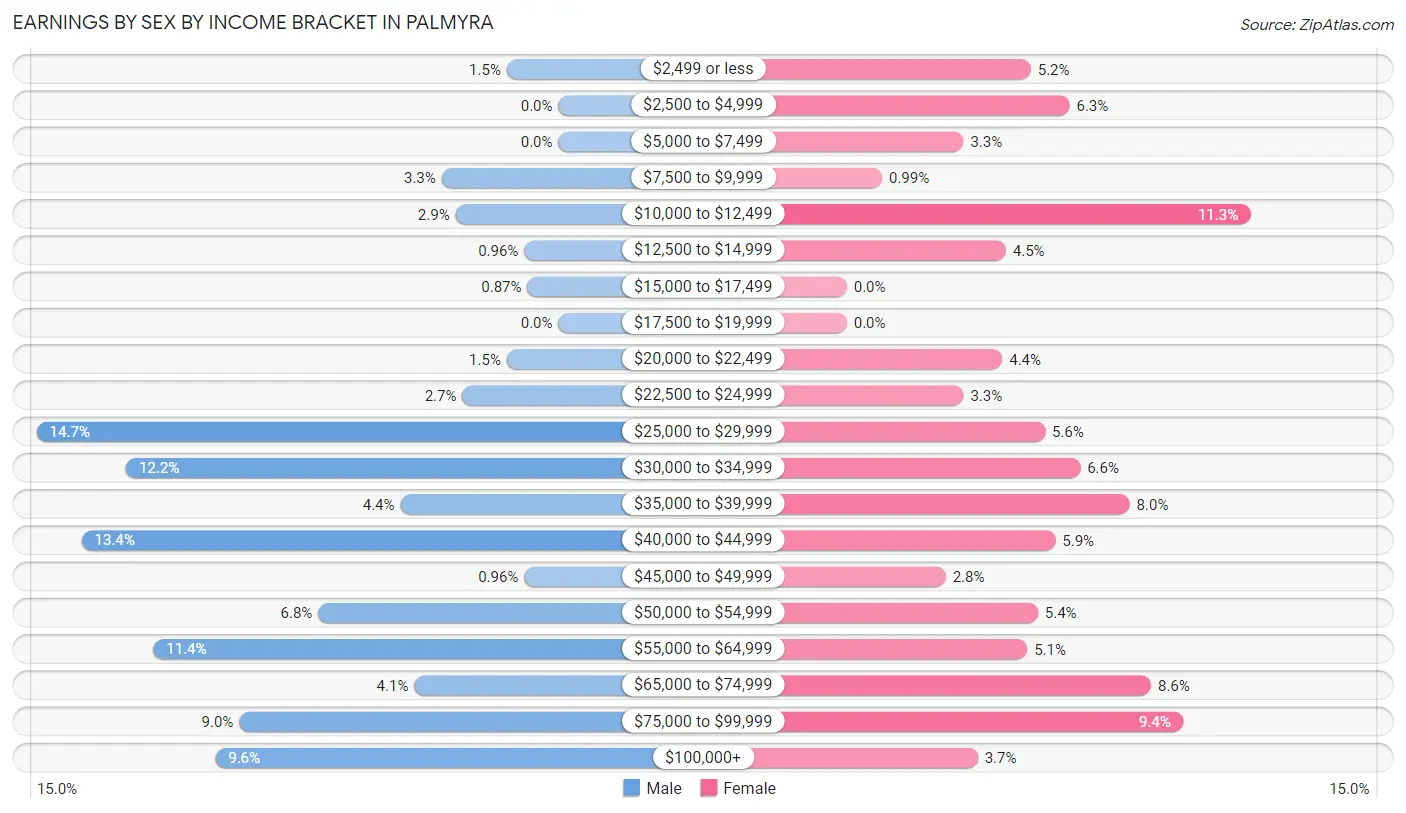
Earnings by Sex by Income Bracket in Palmyra
The most common earnings brackets in Palmyra are $25,000 to $29,999 for men (152 | 14.7%) and $10,000 to $12,499 for women (114 | 11.3%).
| Income | Male | Female |
| $2,499 or less | 15 (1.5%) | 52 (5.2%) |
| $2,500 to $4,999 | 0 (0.0%) | 63 (6.3%) |
| $5,000 to $7,499 | 0 (0.0%) | 33 (3.3%) |
| $7,500 to $9,999 | 34 (3.3%) | 10 (1.0%) |
| $10,000 to $12,499 | 30 (2.9%) | 114 (11.3%) |
| $12,500 to $14,999 | 10 (1.0%) | 45 (4.5%) |
| $15,000 to $17,499 | 9 (0.9%) | 0 (0.0%) |
| $17,500 to $19,999 | 0 (0.0%) | 0 (0.0%) |
| $20,000 to $22,499 | 15 (1.5%) | 44 (4.4%) |
| $22,500 to $24,999 | 28 (2.7%) | 33 (3.3%) |
| $25,000 to $29,999 | 152 (14.7%) | 56 (5.6%) |
| $30,000 to $34,999 | 126 (12.1%) | 66 (6.6%) |
| $35,000 to $39,999 | 46 (4.4%) | 80 (8.0%) |
| $40,000 to $44,999 | 139 (13.4%) | 59 (5.9%) |
| $45,000 to $49,999 | 10 (1.0%) | 28 (2.8%) |
| $50,000 to $54,999 | 70 (6.8%) | 54 (5.4%) |
| $55,000 to $64,999 | 118 (11.4%) | 51 (5.1%) |
| $65,000 to $74,999 | 42 (4.1%) | 86 (8.6%) |
| $75,000 to $99,999 | 93 (9.0%) | 95 (9.4%) |
| $100,000+ | 100 (9.6%) | 37 (3.7%) |
| Total | 1,037 (100.0%) | 1,006 (100.0%) |
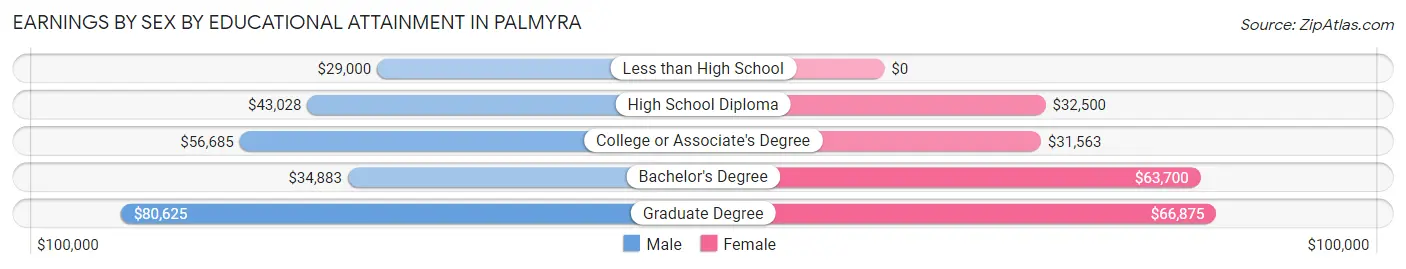
Earnings by Sex by Educational Attainment in Palmyra
Average earnings in Palmyra are $44,543 for men and $38,889 for women, a difference of 12.7%. Men with an educational attainment of graduate degree enjoy the highest average annual earnings of $80,625, while those with less than high school education earn the least with $29,000. Women with an educational attainment of graduate degree earn the most with the average annual earnings of $66,875, while those with college or associate's degree education have the smallest earnings of $31,563.
| Educational Attainment | Male Income | Female Income |
| Less than High School | $29,000 | $0 |
| High School Diploma | $43,028 | $32,500 |
| College or Associate's Degree | $56,685 | $31,563 |
| Bachelor's Degree | $34,883 | $63,700 |
| Graduate Degree | $80,625 | $66,875 |
| Total | $44,543 | $38,889 |
Family Income in Palmyra
Family Income Brackets in Palmyra
According to the Palmyra family income data, there are 257 families falling into the $75,000 to $99,999 income range, which is the most common income bracket and makes up 27.7% of all families. Conversely, the $15,000 to $24,999 income bracket is the least frequent group with only 9 families (1.0%) belonging to this category.
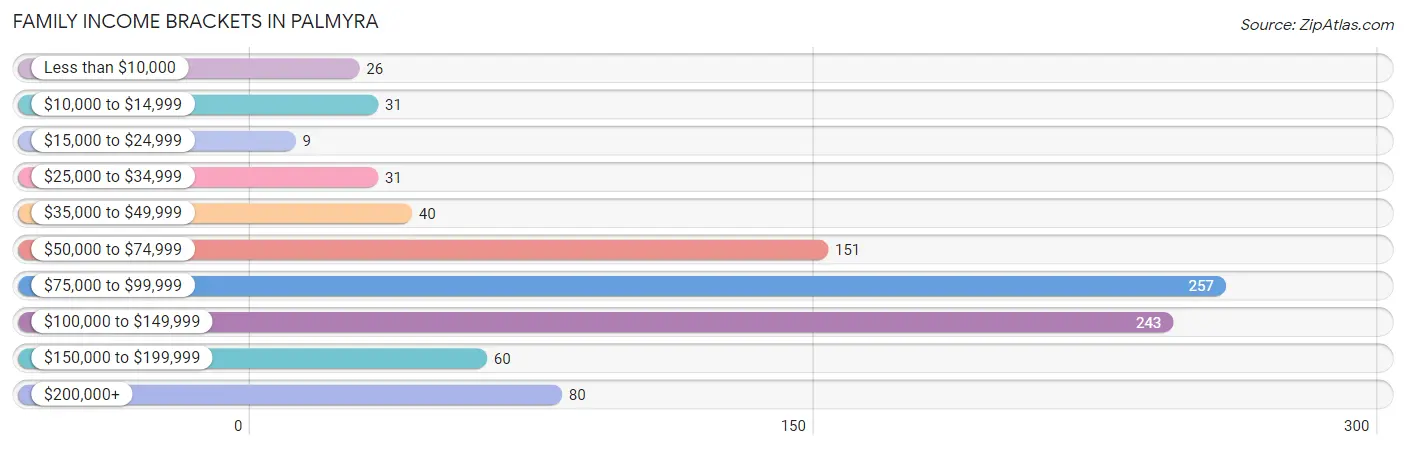
| Income Bracket | # Families | % Families |
| Less than $10,000 | 26 | 2.8% |
| $10,000 to $14,999 | 31 | 3.3% |
| $15,000 to $24,999 | 9 | 1.0% |
| $25,000 to $34,999 | 31 | 3.3% |
| $35,000 to $49,999 | 40 | 4.3% |
| $50,000 to $74,999 | 151 | 16.3% |
| $75,000 to $99,999 | 257 | 27.7% |
| $100,000 to $149,999 | 243 | 26.2% |
| $150,000 to $199,999 | 60 | 6.5% |
| $200,000+ | 80 | 8.6% |
Family Income by Famaliy Size in Palmyra
5-person families (31 | 3.3%) account for the highest median family income in Palmyra with $148,854 per family, while 2-person families (536 | 57.8%) have the highest median income of $44,239 per family member.
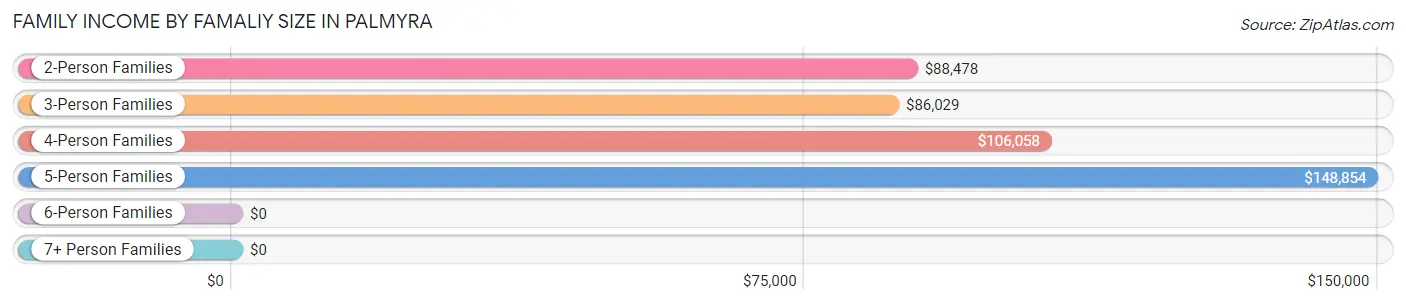
| Income Bracket | # Families | Median Income |
| 2-Person Families | 536 (57.8%) | $88,478 |
| 3-Person Families | 194 (20.9%) | $86,029 |
| 4-Person Families | 146 (15.7%) | $106,058 |
| 5-Person Families | 31 (3.3%) | $148,854 |
| 6-Person Families | 21 (2.3%) | $0 |
| 7+ Person Families | 0 (0.0%) | $0 |
| Total | 928 (100.0%) | $90,769 |
Family Income by Number of Earners in Palmyra
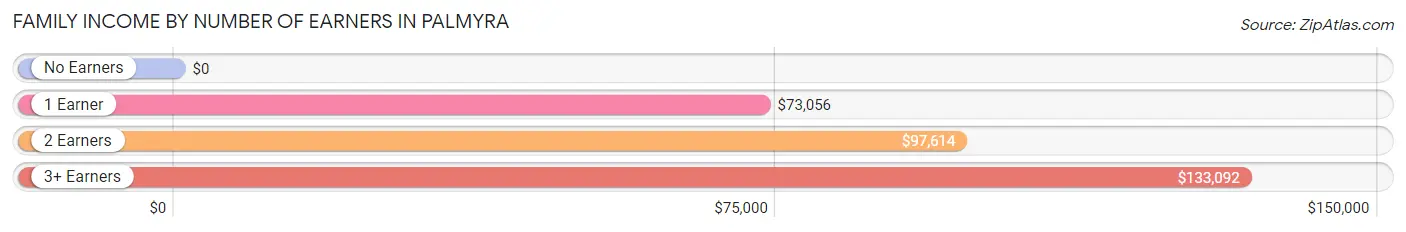
| Number of Earners | # Families | Median Income |
| No Earners | 95 (10.2%) | $0 |
| 1 Earner | 242 (26.1%) | $73,056 |
| 2 Earners | 504 (54.3%) | $97,614 |
| 3+ Earners | 87 (9.4%) | $133,092 |
| Total | 928 (100.0%) | $90,769 |
Household Income in Palmyra
Household Income Brackets in Palmyra
With 274 households falling in the category, the $100,000 to $149,999 income range is the most frequent in Palmyra, accounting for 17.8% of all households. In contrast, only 66 households (4.3%) fall into the $15,000 to $24,999 income bracket, making it the least populous group.
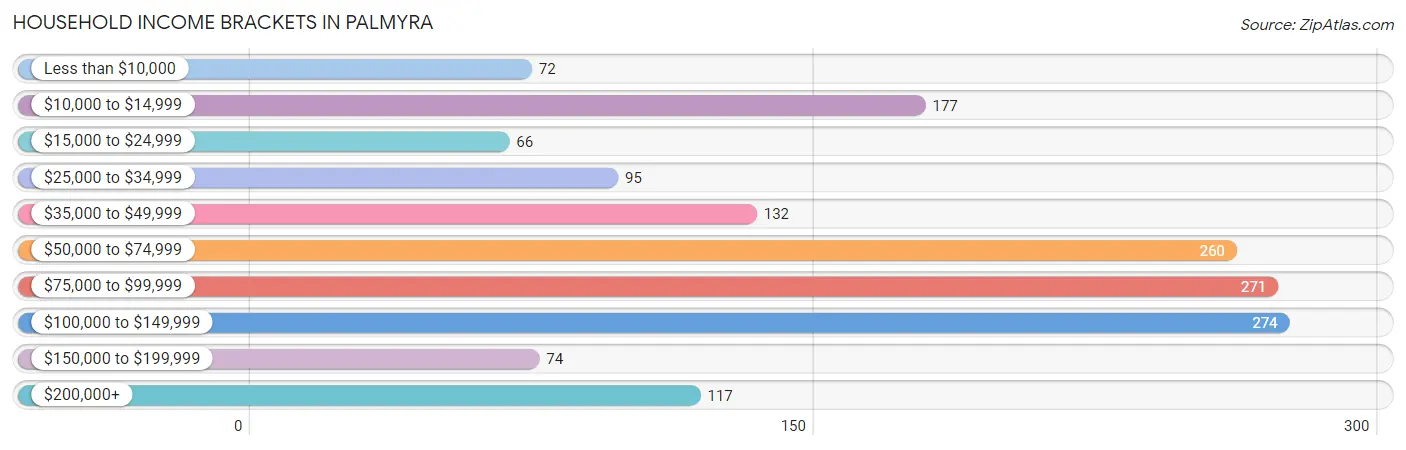
| Income Bracket | # Households | % Households |
| Less than $10,000 | 72 | 4.7% |
| $10,000 to $14,999 | 177 | 11.5% |
| $15,000 to $24,999 | 66 | 4.3% |
| $25,000 to $34,999 | 95 | 6.2% |
| $35,000 to $49,999 | 132 | 8.6% |
| $50,000 to $74,999 | 260 | 16.9% |
| $75,000 to $99,999 | 271 | 17.6% |
| $100,000 to $149,999 | 274 | 17.8% |
| $150,000 to $199,999 | 74 | 4.8% |
| $200,000+ | 117 | 7.6% |
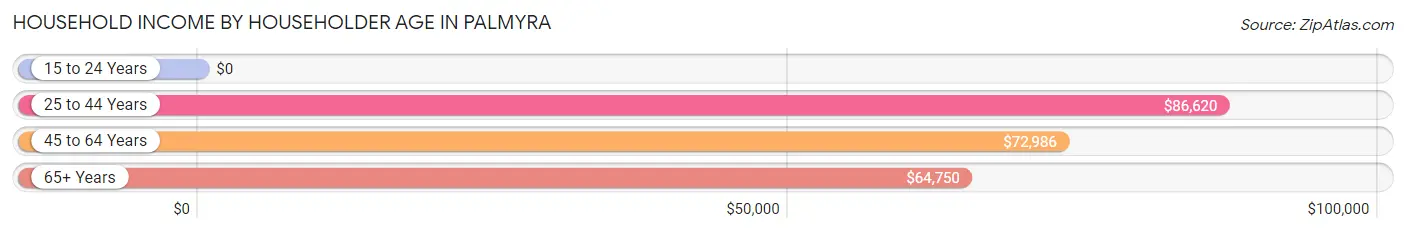
Household Income by Householder Age in Palmyra
The median household income in Palmyra is $72,976, with the highest median household income of $86,620 found in the 25 to 44 years age bracket for the primary householder. A total of 457 households (29.7%) fall into this category. Meanwhile, the 15 to 24 years age bracket for the primary householder has the lowest median household income of $0, with 200 households (13.0%) in this group.
| Income Bracket | # Households | Median Income |
| 15 to 24 Years | 200 (13.0%) | $0 |
| 25 to 44 Years | 457 (29.7%) | $86,620 |
| 45 to 64 Years | 573 (37.3%) | $72,986 |
| 65+ Years | 308 (20.0%) | $64,750 |
| Total | 1,538 (100.0%) | $72,976 |
Poverty in Palmyra
Income Below Poverty by Sex and Age in Palmyra
With 8.7% poverty level for males and 14.3% for females among the residents of Palmyra, 6 to 11 year old males and 18 to 24 year old females are the most vulnerable to poverty, with 25 males (22.9%) and 100 females (37.6%) in their respective age groups living below the poverty level.
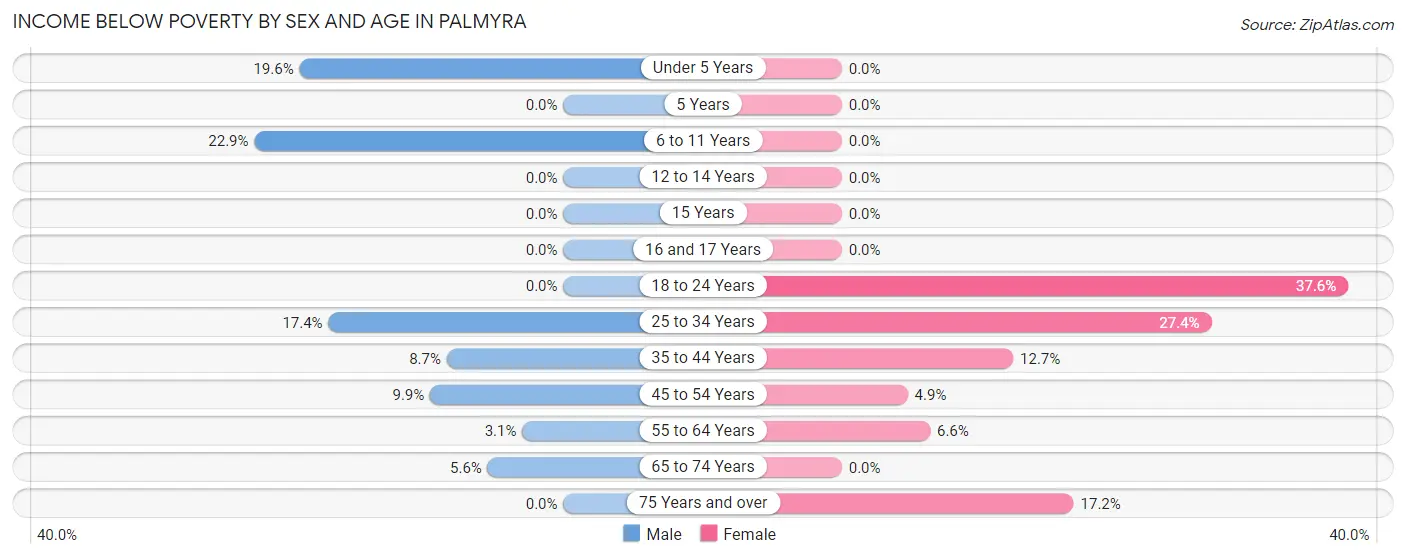
| Age Bracket | Male | Female |
| Under 5 Years | 29 (19.6%) | 0 (0.0%) |
| 5 Years | 0 (0.0%) | 0 (0.0%) |
| 6 to 11 Years | 25 (22.9%) | 0 (0.0%) |
| 12 to 14 Years | 0 (0.0%) | 0 (0.0%) |
| 15 Years | 0 (0.0%) | 0 (0.0%) |
| 16 and 17 Years | 0 (0.0%) | 0 (0.0%) |
| 18 to 24 Years | 0 (0.0%) | 100 (37.6%) |
| 25 to 34 Years | 34 (17.4%) | 59 (27.4%) |
| 35 to 44 Years | 18 (8.6%) | 22 (12.7%) |
| 45 to 54 Years | 26 (9.9%) | 11 (4.9%) |
| 55 to 64 Years | 8 (3.0%) | 15 (6.6%) |
| 65 to 74 Years | 10 (5.6%) | 0 (0.0%) |
| 75 Years and over | 0 (0.0%) | 21 (17.2%) |
| Total | 150 (8.7%) | 228 (14.3%) |
Income Above Poverty by Sex and Age in Palmyra
According to the poverty statistics in Palmyra, males aged 5 years and females aged under 5 years are the age groups that are most secure financially, with 100.0% of males and 100.0% of females in these age groups living above the poverty line.
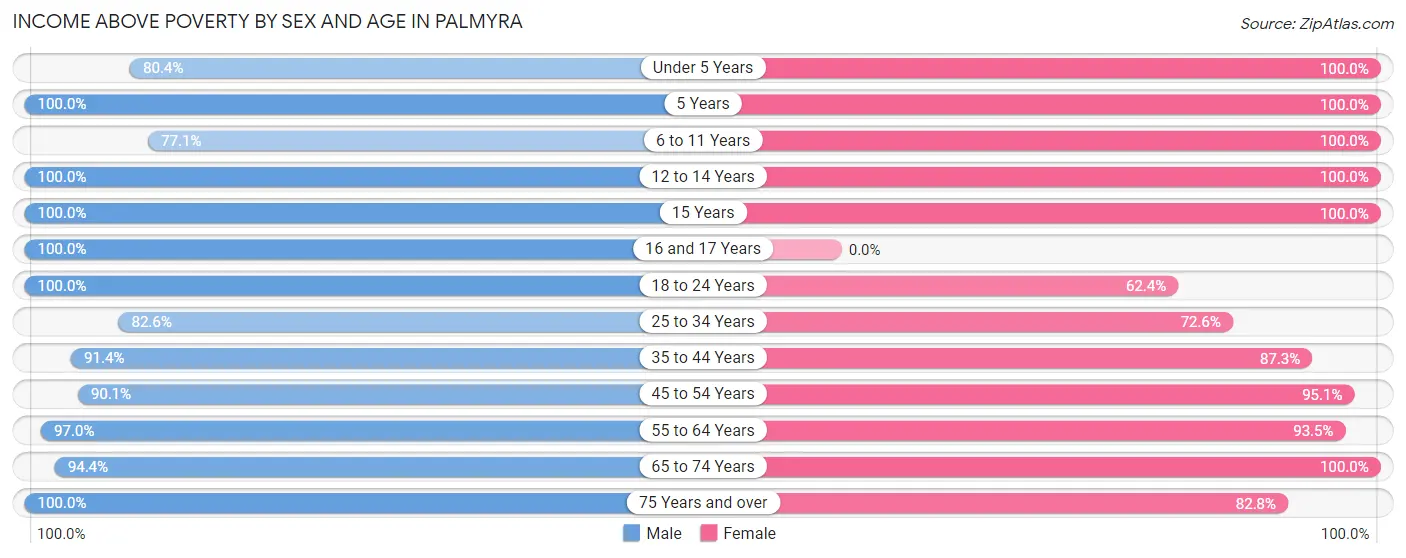
| Age Bracket | Male | Female |
| Under 5 Years | 119 (80.4%) | 57 (100.0%) |
| 5 Years | 19 (100.0%) | 11 (100.0%) |
| 6 to 11 Years | 84 (77.1%) | 107 (100.0%) |
| 12 to 14 Years | 27 (100.0%) | 21 (100.0%) |
| 15 Years | 4 (100.0%) | 8 (100.0%) |
| 16 and 17 Years | 30 (100.0%) | 0 (0.0%) |
| 18 to 24 Years | 201 (100.0%) | 166 (62.4%) |
| 25 to 34 Years | 161 (82.6%) | 156 (72.6%) |
| 35 to 44 Years | 190 (91.3%) | 151 (87.3%) |
| 45 to 54 Years | 237 (90.1%) | 214 (95.1%) |
| 55 to 64 Years | 254 (97.0%) | 214 (93.4%) |
| 65 to 74 Years | 168 (94.4%) | 160 (100.0%) |
| 75 Years and over | 88 (100.0%) | 101 (82.8%) |
| Total | 1,582 (91.3%) | 1,366 (85.7%) |
Income Below Poverty Among Married-Couple Families in Palmyra
The poverty statistics for married-couple families in Palmyra show that 4.6% or 31 of the total 667 families live below the poverty line. Families with 1 or 2 children have the highest poverty rate of 14.4%, comprising of 31 families. On the other hand, families with no children have the lowest poverty rate of 0.0%, which includes 0 families.
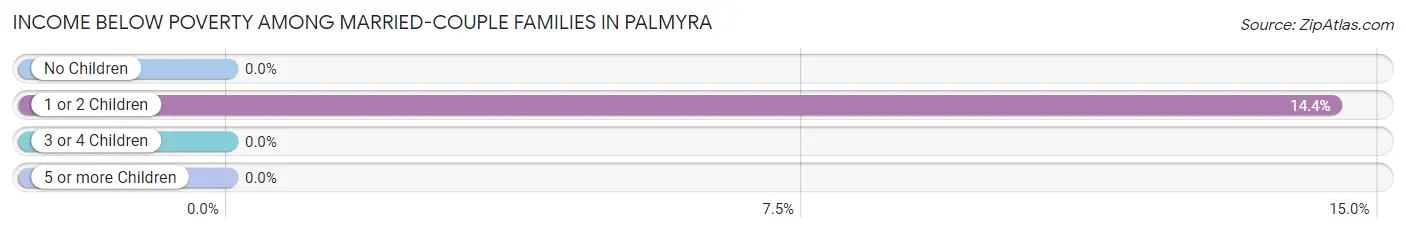
| Children | Above Poverty | Below Poverty |
| No Children | 416 (100.0%) | 0 (0.0%) |
| 1 or 2 Children | 184 (85.6%) | 31 (14.4%) |
| 3 or 4 Children | 36 (100.0%) | 0 (0.0%) |
| 5 or more Children | 0 (0.0%) | 0 (0.0%) |
| Total | 636 (95.4%) | 31 (4.6%) |
Income Below Poverty Among Single-Parent Households in Palmyra
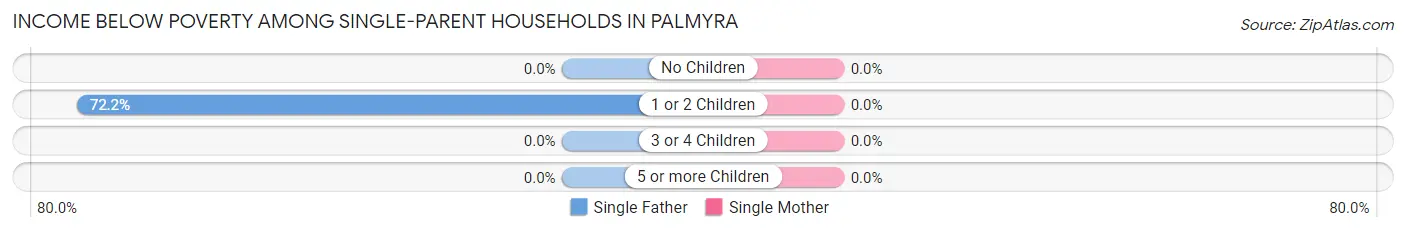
| Children | Single Father | Single Mother |
| No Children | 0 (0.0%) | 0 (0.0%) |
| 1 or 2 Children | 26 (72.2%) | 0 (0.0%) |
| 3 or 4 Children | 0 (0.0%) | 0 (0.0%) |
| 5 or more Children | 0 (0.0%) | 0 (0.0%) |
| Total | 26 (17.8%) | 0 (0.0%) |
Income Below Poverty Among Married-Couple vs Single-Parent Households in Palmyra
The poverty data for Palmyra shows that 31 of the married-couple family households (4.6%) and 26 of the single-parent households (10.0%) are living below the poverty level. Within the married-couple family households, those with 1 or 2 children have the highest poverty rate, with 31 households (14.4%) falling below the poverty line. Among the single-parent households, those with 1 or 2 children have the highest poverty rate, with 26 household (29.9%) living below poverty.
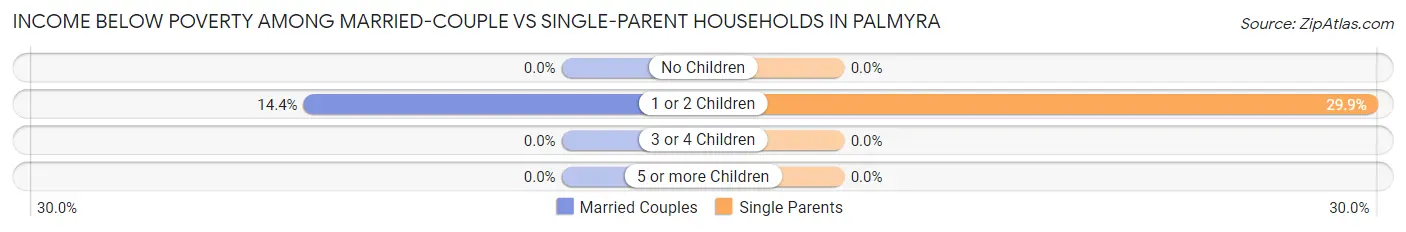
| Children | Married-Couple Families | Single-Parent Households |
| No Children | 0 (0.0%) | 0 (0.0%) |
| 1 or 2 Children | 31 (14.4%) | 26 (29.9%) |
| 3 or 4 Children | 0 (0.0%) | 0 (0.0%) |
| 5 or more Children | 0 (0.0%) | 0 (0.0%) |
| Total | 31 (4.6%) | 26 (10.0%) |
Race in Palmyra
The most populous races in Palmyra are White / Caucasian (3,195 | 96.1%), Hispanic or Latino (123 | 3.7%), and Two or more Races (93 | 2.8%).
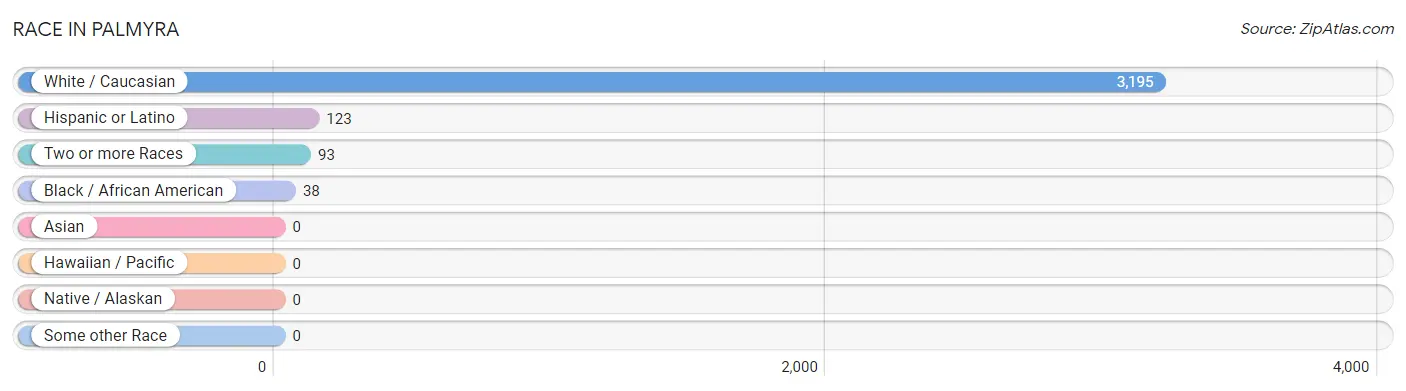
| Race | # Population | % Population |
| Asian | 0 | 0.0% |
| Black / African American | 38 | 1.1% |
| Hawaiian / Pacific | 0 | 0.0% |
| Hispanic or Latino | 123 | 3.7% |
| Native / Alaskan | 0 | 0.0% |
| White / Caucasian | 3,195 | 96.1% |
| Two or more Races | 93 | 2.8% |
| Some other Race | 0 | 0.0% |
| Total | 3,326 | 100.0% |
Ancestry in Palmyra
The most populous ancestries reported in Palmyra are German (929 | 27.9%), Irish (734 | 22.1%), English (718 | 21.6%), Italian (366 | 11.0%), and Dutch (292 | 8.8%), together accounting for 91.4% of all Palmyra residents.
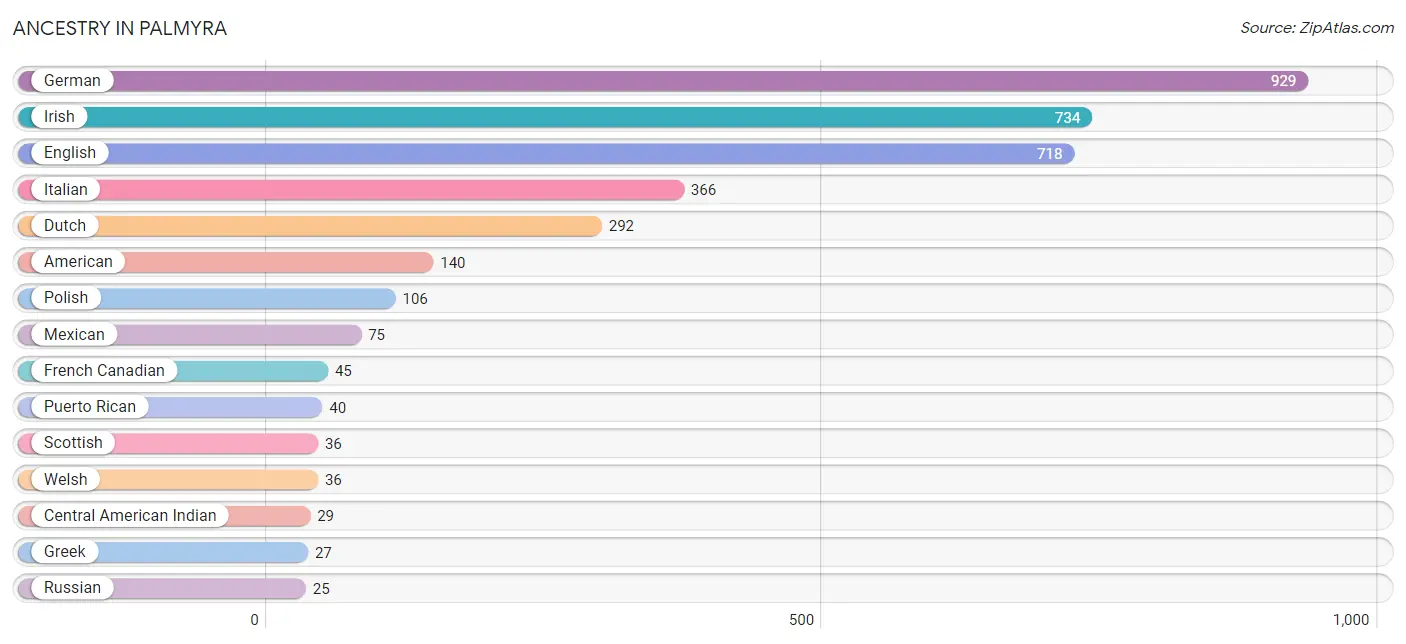
| Ancestry | # Population | % Population |
| American | 140 | 4.2% |
| Arab | 16 | 0.5% |
| Austrian | 6 | 0.2% |
| Belgian | 20 | 0.6% |
| Central American | 8 | 0.2% |
| Central American Indian | 29 | 0.9% |
| Czech | 12 | 0.4% |
| Dutch | 292 | 8.8% |
| English | 718 | 21.6% |
| French | 13 | 0.4% |
| French Canadian | 45 | 1.3% |
| German | 929 | 27.9% |
| Greek | 27 | 0.8% |
| Irish | 734 | 22.1% |
| Italian | 366 | 11.0% |
| Jamaican | 10 | 0.3% |
| Mexican | 75 | 2.2% |
| Polish | 106 | 3.2% |
| Puerto Rican | 40 | 1.2% |
| Russian | 25 | 0.7% |
| Salvadoran | 8 | 0.2% |
| Scottish | 36 | 1.1% |
| Slavic | 8 | 0.2% |
| Swedish | 11 | 0.3% |
| Ukrainian | 17 | 0.5% |
| Welsh | 36 | 1.1% | View All 26 Rows |
Immigrants in Palmyra
The most numerous immigrant groups reported in Palmyra came from Europe (23 | 0.7%), Africa (16 | 0.5%), Northern Africa (16 | 0.5%), England (11 | 0.3%), and Northern Europe (11 | 0.3%), together accounting for 2.3% of all Palmyra residents.
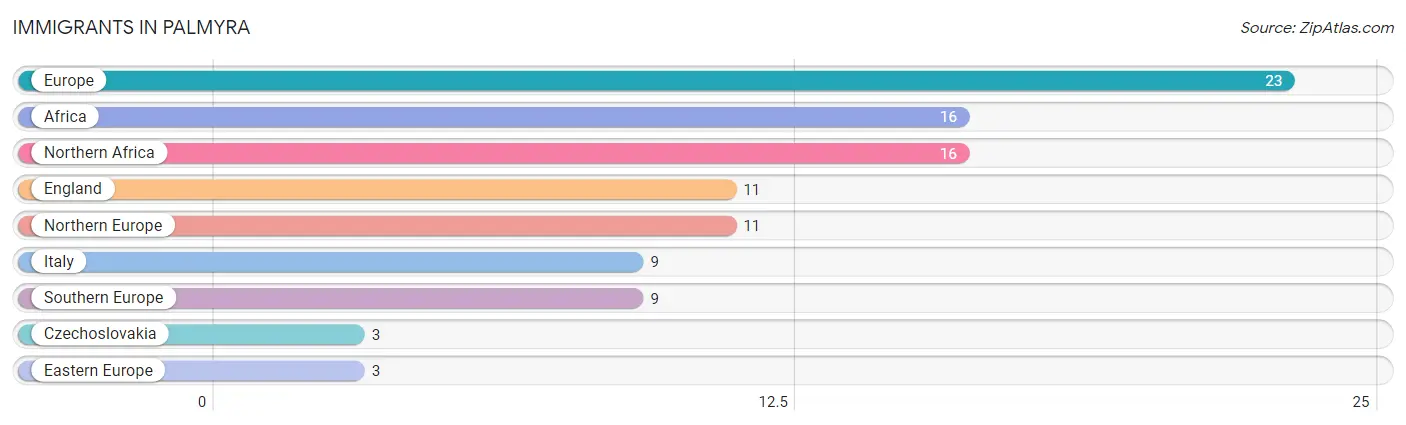
| Immigration Origin | # Population | % Population |
| Africa | 16 | 0.5% |
| Czechoslovakia | 3 | 0.1% |
| Eastern Europe | 3 | 0.1% |
| England | 11 | 0.3% |
| Europe | 23 | 0.7% |
| Italy | 9 | 0.3% |
| Northern Africa | 16 | 0.5% |
| Northern Europe | 11 | 0.3% |
| Southern Europe | 9 | 0.3% | View All 9 Rows |
Sex and Age in Palmyra
Sex and Age in Palmyra
The most populous age groups in Palmyra are 20 to 24 Years (156 | 9.0%) for men and 20 to 24 Years (241 | 15.1%) for women.
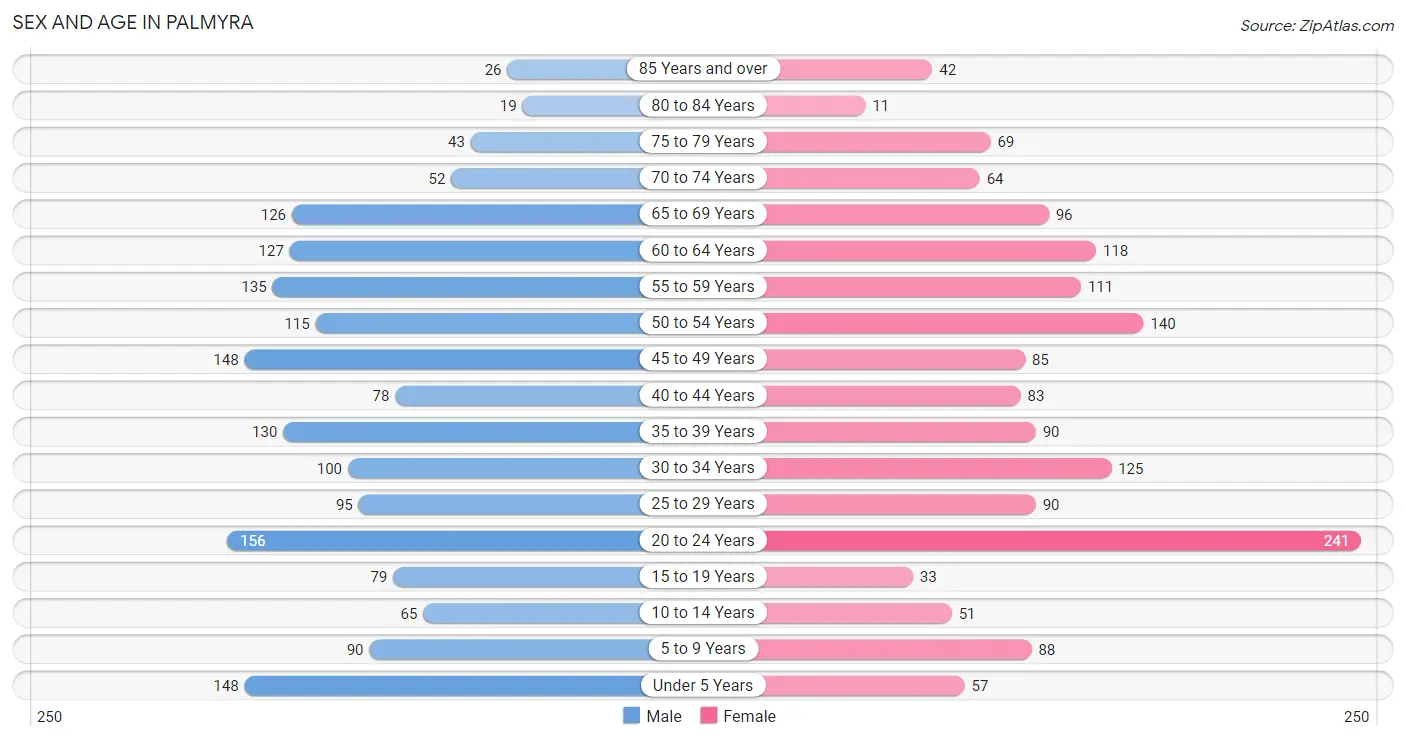
| Age Bracket | Male | Female |
| Under 5 Years | 148 (8.6%) | 57 (3.6%) |
| 5 to 9 Years | 90 (5.2%) | 88 (5.5%) |
| 10 to 14 Years | 65 (3.7%) | 51 (3.2%) |
| 15 to 19 Years | 79 (4.6%) | 33 (2.1%) |
| 20 to 24 Years | 156 (9.0%) | 241 (15.1%) |
| 25 to 29 Years | 95 (5.5%) | 90 (5.7%) |
| 30 to 34 Years | 100 (5.8%) | 125 (7.8%) |
| 35 to 39 Years | 130 (7.5%) | 90 (5.7%) |
| 40 to 44 Years | 78 (4.5%) | 83 (5.2%) |
| 45 to 49 Years | 148 (8.6%) | 85 (5.3%) |
| 50 to 54 Years | 115 (6.6%) | 140 (8.8%) |
| 55 to 59 Years | 135 (7.8%) | 111 (7.0%) |
| 60 to 64 Years | 127 (7.3%) | 118 (7.4%) |
| 65 to 69 Years | 126 (7.3%) | 96 (6.0%) |
| 70 to 74 Years | 52 (3.0%) | 64 (4.0%) |
| 75 to 79 Years | 43 (2.5%) | 69 (4.3%) |
| 80 to 84 Years | 19 (1.1%) | 11 (0.7%) |
| 85 Years and over | 26 (1.5%) | 42 (2.6%) |
| Total | 1,732 (100.0%) | 1,594 (100.0%) |
Families and Households in Palmyra
Median Family Size in Palmyra
The median family size in Palmyra is 2.68 persons per family, with married-couple families (667 | 71.9%) accounting for the largest median family size of 2.85 persons per family. On the other hand, single male/father families (146 | 15.7%) represent the smallest median family size with 1.94 persons per family.
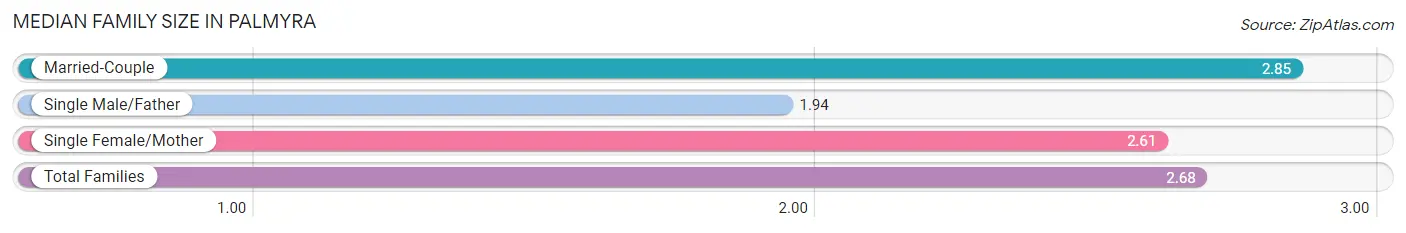
| Family Type | # Families | Family Size |
| Married-Couple | 667 (71.9%) | 2.85 |
| Single Male/Father | 146 (15.7%) | 1.94 |
| Single Female/Mother | 115 (12.4%) | 2.61 |
| Total Families | 928 (100.0%) | 2.68 |
Median Household Size in Palmyra
The median household size in Palmyra is 2.14 persons per household, with married-couple households (667 | 43.4%) accounting for the largest median household size of 2.87 persons per household. non-family households (610 | 39.7%) represent the smallest median household size with 1.24 persons per household.
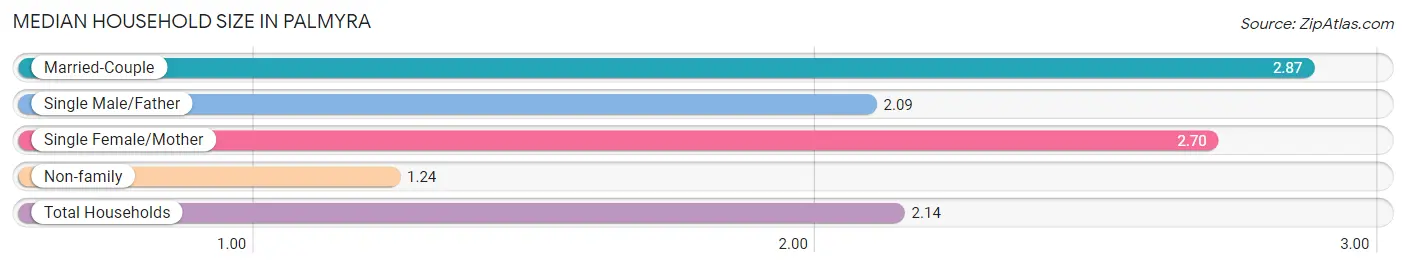
| Household Type | # Households | Household Size |
| Married-Couple | 667 (43.4%) | 2.87 |
| Single Male/Father | 146 (9.5%) | 2.09 |
| Single Female/Mother | 115 (7.5%) | 2.70 |
| Non-family | 610 (39.7%) | 1.24 |
| Total Households | 1,538 (100.0%) | 2.14 |
Household Size by Marriage Status in Palmyra
Out of a total of 1,538 households in Palmyra, 928 (60.3%) are family households, while 610 (39.7%) are nonfamily households. The most numerous type of family households are 2-person households, comprising 500, and the most common type of nonfamily households are 1-person households, comprising 463.
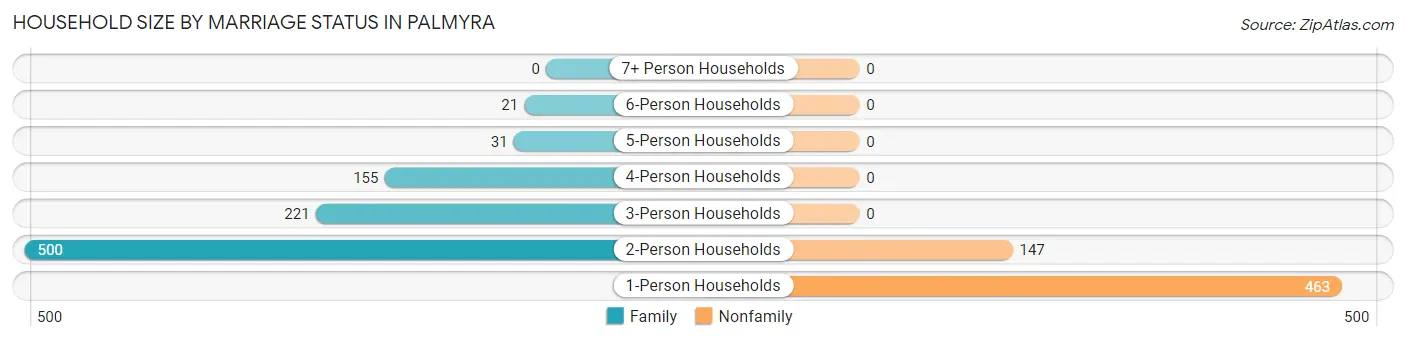
| Household Size | Family Households | Nonfamily Households |
| 1-Person Households | - | 463 (30.1%) |
| 2-Person Households | 500 (32.5%) | 147 (9.6%) |
| 3-Person Households | 221 (14.4%) | 0 (0.0%) |
| 4-Person Households | 155 (10.1%) | 0 (0.0%) |
| 5-Person Households | 31 (2.0%) | 0 (0.0%) |
| 6-Person Households | 21 (1.4%) | 0 (0.0%) |
| 7+ Person Households | 0 (0.0%) | 0 (0.0%) |
| Total | 928 (60.3%) | 610 (39.7%) |
Female Fertility in Palmyra
Fertility by Age in Palmyra
Average fertility rate in Palmyra is 71.0 births per 1,000 women. Women in the age bracket of 20 to 34 years have the highest fertility rate with 96.0 births per 1,000 women. Women in the age bracket of 20 to 34 years acount for 80.0% of all women with births.
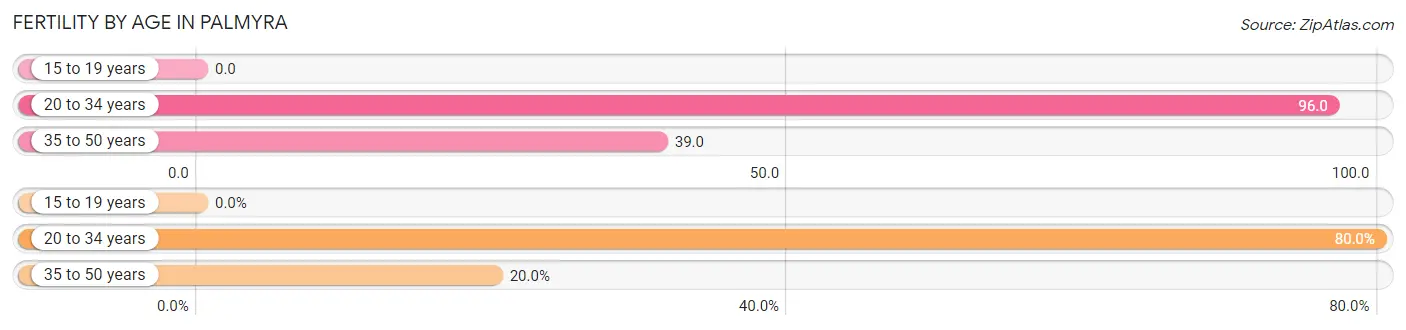
| Age Bracket | Women with Births | Births / 1,000 Women |
| 15 to 19 years | 0 (0.0%) | 0.0 |
| 20 to 34 years | 44 (80.0%) | 96.0 |
| 35 to 50 years | 11 (20.0%) | 39.0 |
| Total | 55 (100.0%) | 71.0 |
Fertility by Age by Marriage Status in Palmyra
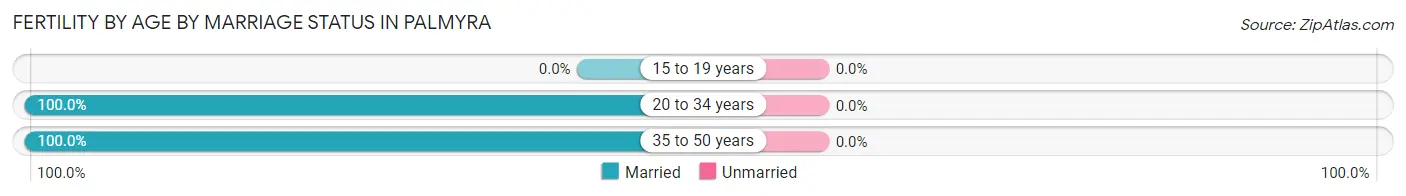
| Age Bracket | Married | Unmarried |
| 15 to 19 years | 0 (0.0%) | 0 (0.0%) |
| 20 to 34 years | 44 (100.0%) | 0 (0.0%) |
| 35 to 50 years | 11 (100.0%) | 0 (0.0%) |
| Total | 55 (100.0%) | 0 (0.0%) |
Fertility by Education in Palmyra
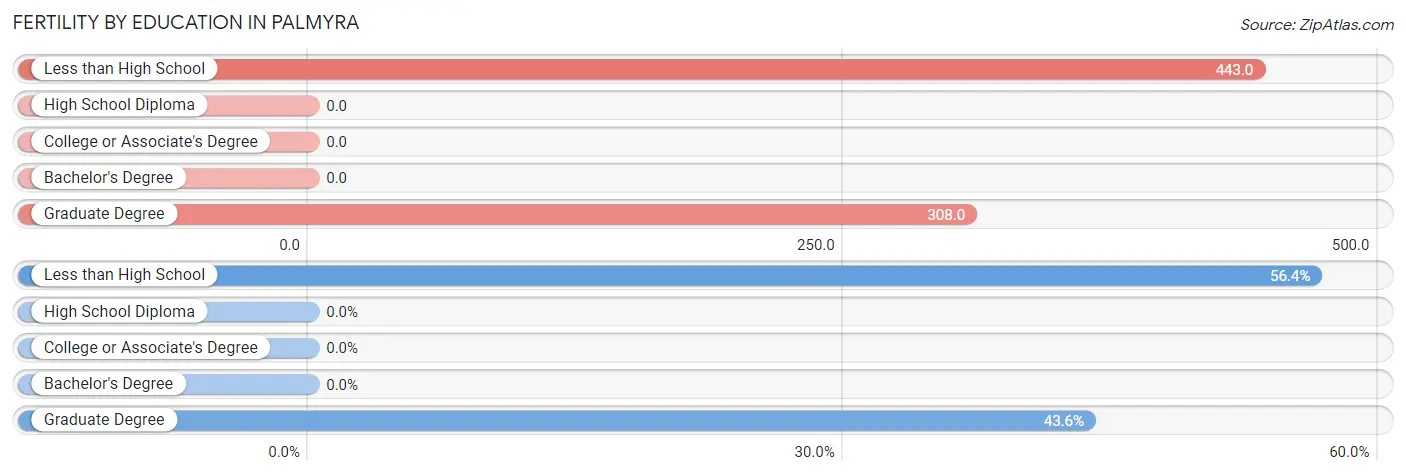
| Educational Attainment | Women with Births | Births / 1,000 Women |
| Less than High School | 31 (56.4%) | 443.0 |
| High School Diploma | 0 (0.0%) | 0.0 |
| College or Associate's Degree | 0 (0.0%) | 0.0 |
| Bachelor's Degree | 0 (0.0%) | 0.0 |
| Graduate Degree | 24 (43.6%) | 308.0 |
| Total | 55 (100.0%) | 71.0 |
Fertility by Education by Marriage Status in Palmyra
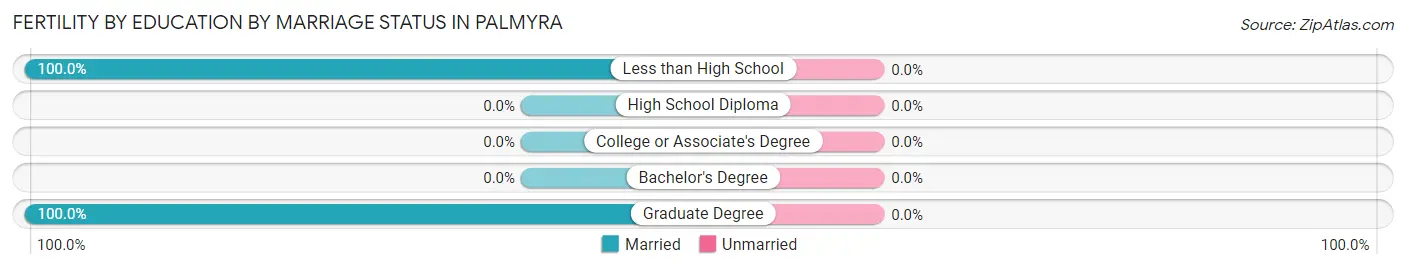
| Educational Attainment | Married | Unmarried |
| Less than High School | 31 (100.0%) | 0 (0.0%) |
| High School Diploma | 0 (0.0%) | 0 (0.0%) |
| College or Associate's Degree | 0 (0.0%) | 0 (0.0%) |
| Bachelor's Degree | 0 (0.0%) | 0 (0.0%) |
| Graduate Degree | 24 (100.0%) | 0 (0.0%) |
| Total | 55 (100.0%) | 0 (0.0%) |
Employment Characteristics in Palmyra
Employment by Class of Employer in Palmyra
Among the 1,843 employed individuals in Palmyra, private company employees (1,274 | 69.1%), not-for-profit organizations (257 | 13.9%), and local government employees (134 | 7.3%) make up the most common classes of employment.
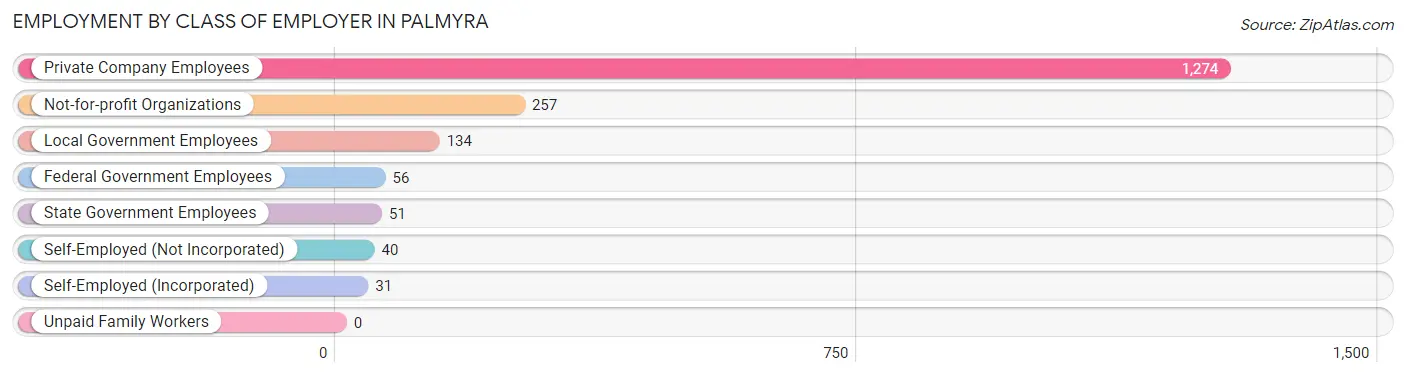
| Employer Class | # Employees | % Employees |
| Private Company Employees | 1,274 | 69.1% |
| Self-Employed (Incorporated) | 31 | 1.7% |
| Self-Employed (Not Incorporated) | 40 | 2.2% |
| Not-for-profit Organizations | 257 | 13.9% |
| Local Government Employees | 134 | 7.3% |
| State Government Employees | 51 | 2.8% |
| Federal Government Employees | 56 | 3.0% |
| Unpaid Family Workers | 0 | 0.0% |
| Total | 1,843 | 100.0% |
Employment Status by Age in Palmyra
According to the labor force statistics for Palmyra, out of the total population over 16 years of age (2,815), 69.4% or 1,954 individuals are in the labor force, with 0.5% or 10 of them unemployed. The age group with the highest labor force participation rate is 20 to 24 years, with 90.9% or 361 individuals in the labor force. Within the labor force, the 30 to 34 years age range has the highest percentage of unemployed individuals, with 6.3% or 10 of them being unemployed.
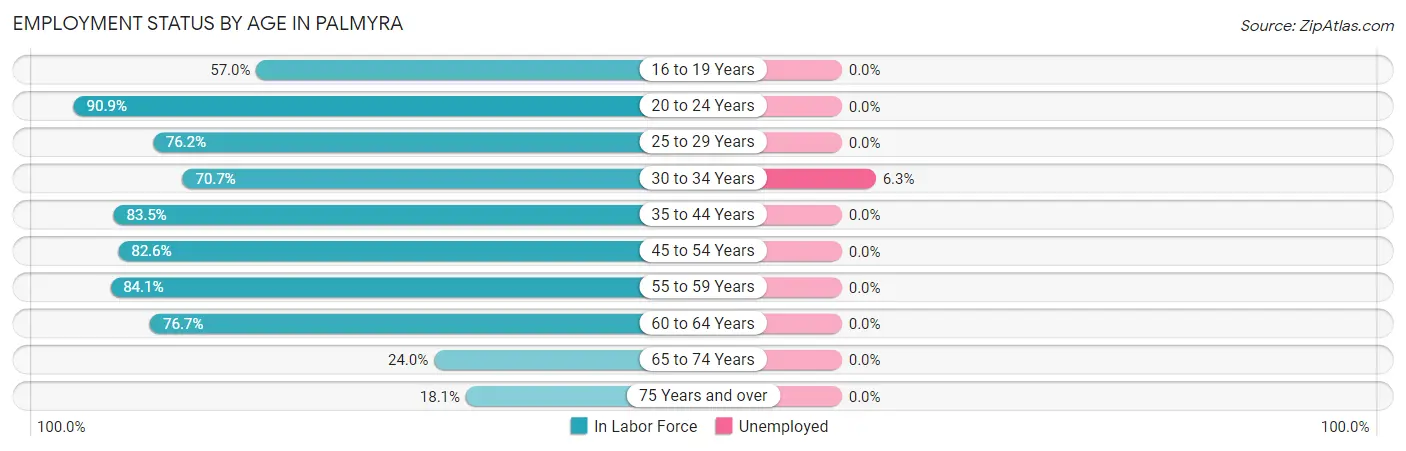
| Age Bracket | In Labor Force | Unemployed |
| 16 to 19 Years | 57 (57.0%) | 0 (0.0%) |
| 20 to 24 Years | 361 (90.9%) | 0 (0.0%) |
| 25 to 29 Years | 141 (76.2%) | 0 (0.0%) |
| 30 to 34 Years | 159 (70.7%) | 10 (6.3%) |
| 35 to 44 Years | 318 (83.5%) | 0 (0.0%) |
| 45 to 54 Years | 403 (82.6%) | 0 (0.0%) |
| 55 to 59 Years | 207 (84.1%) | 0 (0.0%) |
| 60 to 64 Years | 188 (76.7%) | 0 (0.0%) |
| 65 to 74 Years | 81 (24.0%) | 0 (0.0%) |
| 75 Years and over | 38 (18.1%) | 0 (0.0%) |
| Total | 1,954 (69.4%) | 10 (0.5%) |
Employment Status by Educational Attainment in Palmyra
According to labor force statistics for Palmyra, 80.0% of individuals (1,416) out of the total population between 25 and 64 years of age (1,770) are in the labor force, with 0.7% or 10 of them being unemployed. The group with the highest labor force participation rate are those with the educational attainment of college / associate degree, with 88.8% or 556 individuals in the labor force. Within the labor force, individuals with college / associate degree education have the highest percentage of unemployment, with 1.8% or 10 of them being unemployed.
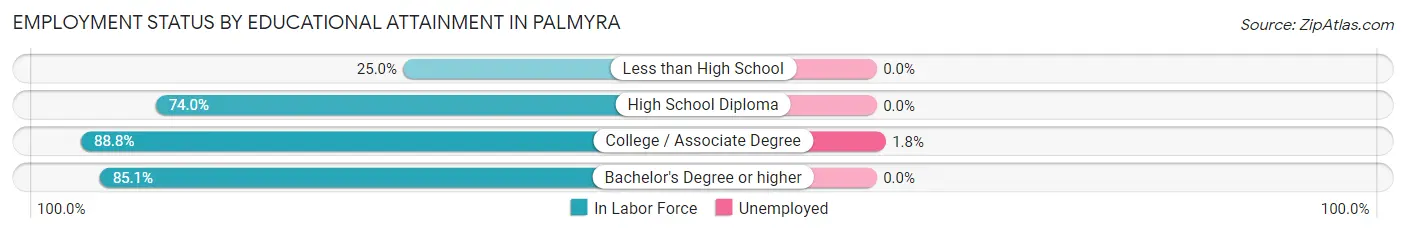
| Educational Attainment | In Labor Force | Unemployed |
| Less than High School | 19 (25.0%) | 0 (0.0%) |
| High School Diploma | 453 (74.0%) | 0 (0.0%) |
| College / Associate Degree | 556 (88.8%) | 11 (1.8%) |
| Bachelor's Degree or higher | 388 (85.1%) | 0 (0.0%) |
| Total | 1,416 (80.0%) | 12 (0.7%) |
Employment Occupations by Sex in Palmyra
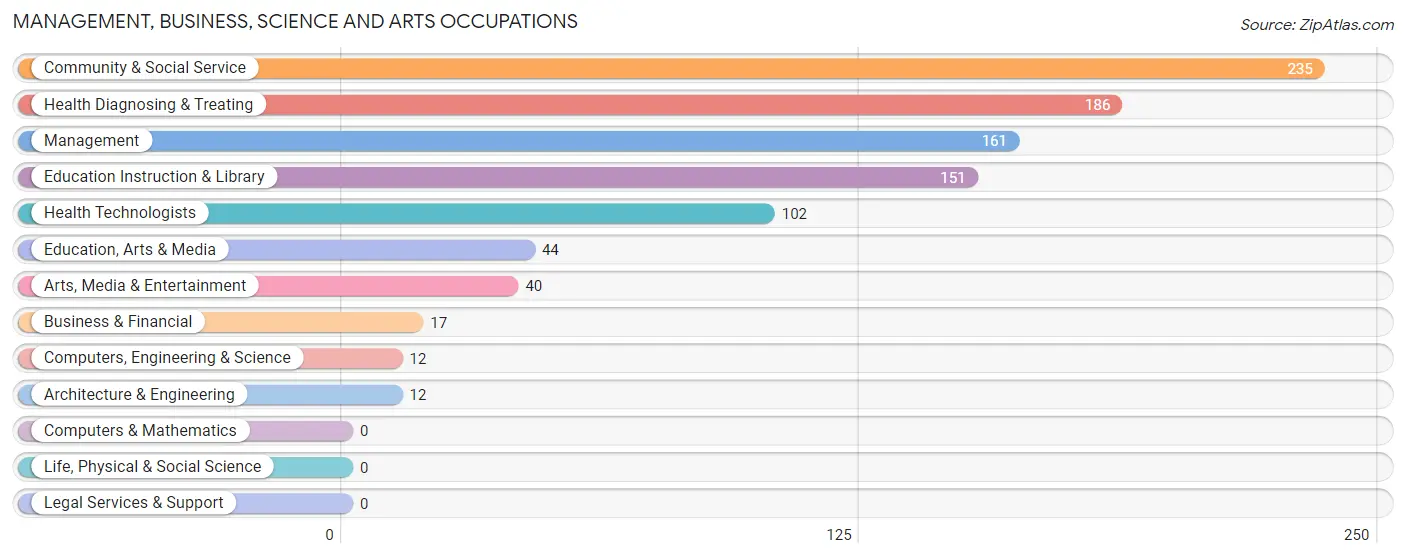
Management, Business, Science and Arts Occupations
The most common Management, Business, Science and Arts occupations in Palmyra are Community & Social Service (235 | 12.1%), Health Diagnosing & Treating (186 | 9.6%), Management (161 | 8.3%), Education Instruction & Library (151 | 7.8%), and Health Technologists (102 | 5.2%).
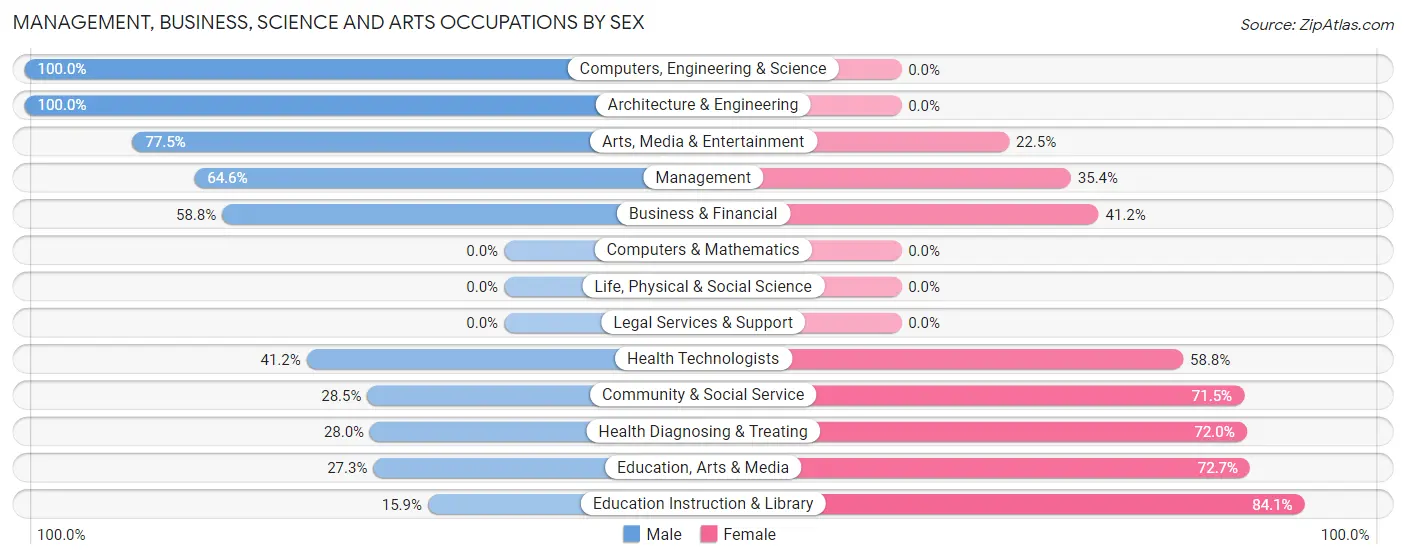
Management, Business, Science and Arts Occupations by Sex
Within the Management, Business, Science and Arts occupations in Palmyra, the most male-oriented occupations are Computers, Engineering & Science (100.0%), Architecture & Engineering (100.0%), and Arts, Media & Entertainment (77.5%), while the most female-oriented occupations are Education Instruction & Library (84.1%), Education, Arts & Media (72.7%), and Health Diagnosing & Treating (72.0%).
| Occupation | Male | Female |
| Management | 104 (64.6%) | 57 (35.4%) |
| Business & Financial | 10 (58.8%) | 7 (41.2%) |
| Computers, Engineering & Science | 12 (100.0%) | 0 (0.0%) |
| Computers & Mathematics | 0 (0.0%) | 0 (0.0%) |
| Architecture & Engineering | 12 (100.0%) | 0 (0.0%) |
| Life, Physical & Social Science | 0 (0.0%) | 0 (0.0%) |
| Community & Social Service | 67 (28.5%) | 168 (71.5%) |
| Education, Arts & Media | 12 (27.3%) | 32 (72.7%) |
| Legal Services & Support | 0 (0.0%) | 0 (0.0%) |
| Education Instruction & Library | 24 (15.9%) | 127 (84.1%) |
| Arts, Media & Entertainment | 31 (77.5%) | 9 (22.5%) |
| Health Diagnosing & Treating | 52 (28.0%) | 134 (72.0%) |
| Health Technologists | 42 (41.2%) | 60 (58.8%) |
| Total (Category) | 245 (40.1%) | 366 (59.9%) |
| Total (Overall) | 1,005 (51.7%) | 938 (48.3%) |
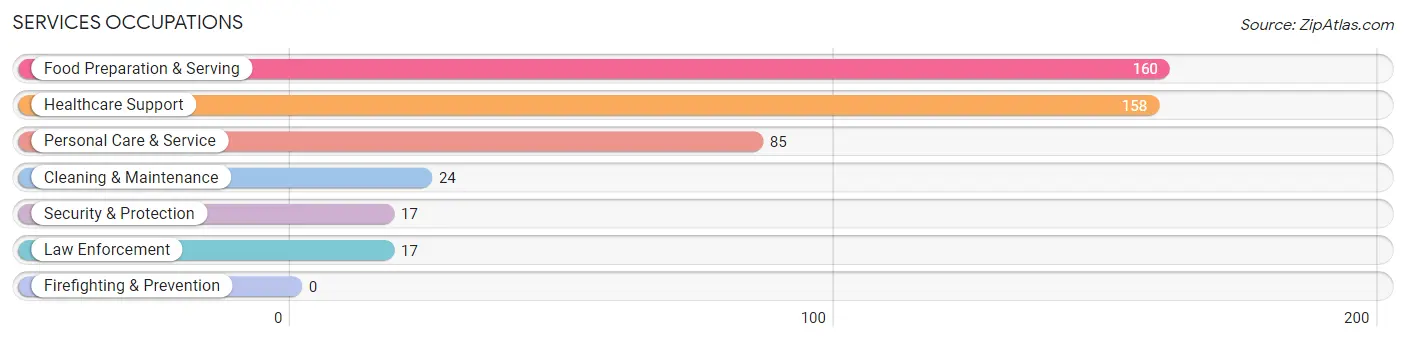
Services Occupations
The most common Services occupations in Palmyra are Food Preparation & Serving (160 | 8.2%), Healthcare Support (158 | 8.1%), Personal Care & Service (85 | 4.4%), Cleaning & Maintenance (24 | 1.2%), and Security & Protection (17 | 0.9%).
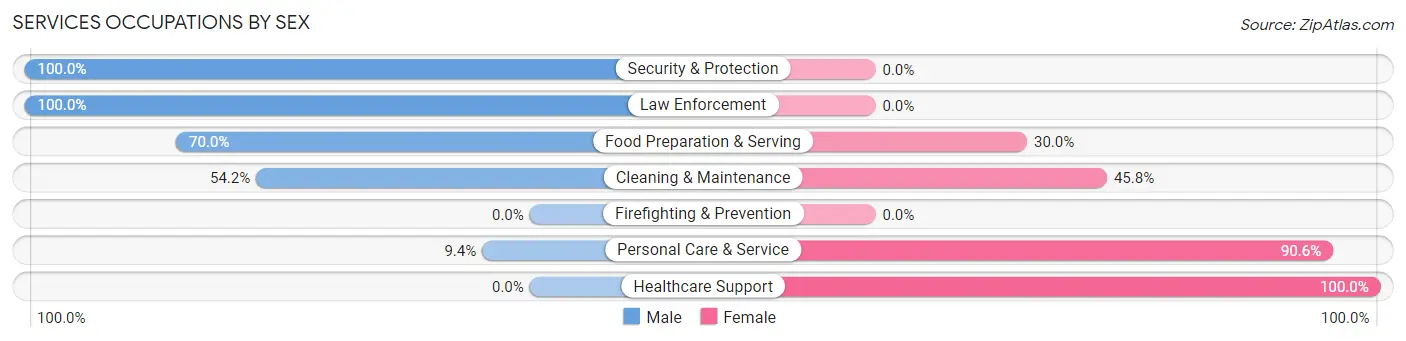
Services Occupations by Sex
Within the Services occupations in Palmyra, the most male-oriented occupations are Security & Protection (100.0%), Law Enforcement (100.0%), and Food Preparation & Serving (70.0%), while the most female-oriented occupations are Healthcare Support (100.0%), Personal Care & Service (90.6%), and Cleaning & Maintenance (45.8%).
| Occupation | Male | Female |
| Healthcare Support | 0 (0.0%) | 158 (100.0%) |
| Security & Protection | 17 (100.0%) | 0 (0.0%) |
| Firefighting & Prevention | 0 (0.0%) | 0 (0.0%) |
| Law Enforcement | 17 (100.0%) | 0 (0.0%) |
| Food Preparation & Serving | 112 (70.0%) | 48 (30.0%) |
| Cleaning & Maintenance | 13 (54.2%) | 11 (45.8%) |
| Personal Care & Service | 8 (9.4%) | 77 (90.6%) |
| Total (Category) | 150 (33.8%) | 294 (66.2%) |
| Total (Overall) | 1,005 (51.7%) | 938 (48.3%) |
Sales and Office Occupations
The most common Sales and Office occupations in Palmyra are Office & Administration (254 | 13.1%), and Sales & Related (158 | 8.1%).

Sales and Office Occupations by Sex

| Occupation | Male | Female |
| Sales & Related | 77 (48.7%) | 81 (51.3%) |
| Office & Administration | 103 (40.6%) | 151 (59.5%) |
| Total (Category) | 180 (43.7%) | 232 (56.3%) |
| Total (Overall) | 1,005 (51.7%) | 938 (48.3%) |
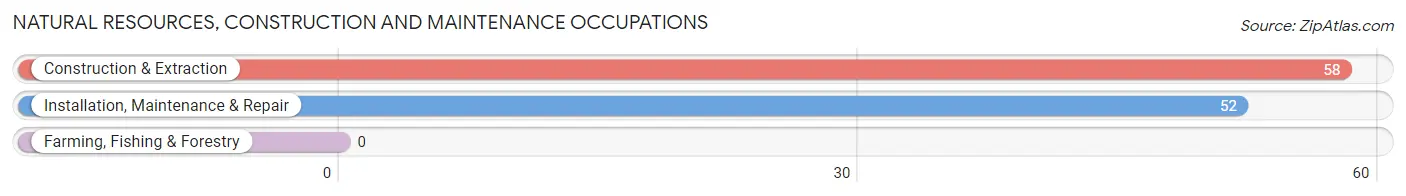
Natural Resources, Construction and Maintenance Occupations
The most common Natural Resources, Construction and Maintenance occupations in Palmyra are Construction & Extraction (58 | 3.0%), and Installation, Maintenance & Repair (52 | 2.7%).
Natural Resources, Construction and Maintenance Occupations by Sex
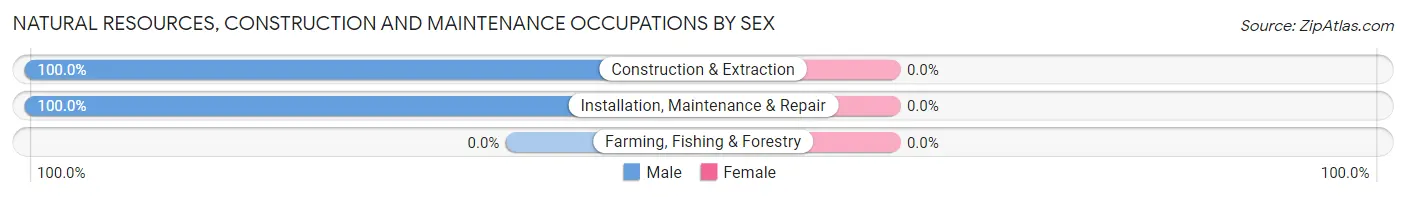
| Occupation | Male | Female |
| Farming, Fishing & Forestry | 0 (0.0%) | 0 (0.0%) |
| Construction & Extraction | 58 (100.0%) | 0 (0.0%) |
| Installation, Maintenance & Repair | 52 (100.0%) | 0 (0.0%) |
| Total (Category) | 110 (100.0%) | 0 (0.0%) |
| Total (Overall) | 1,005 (51.7%) | 938 (48.3%) |
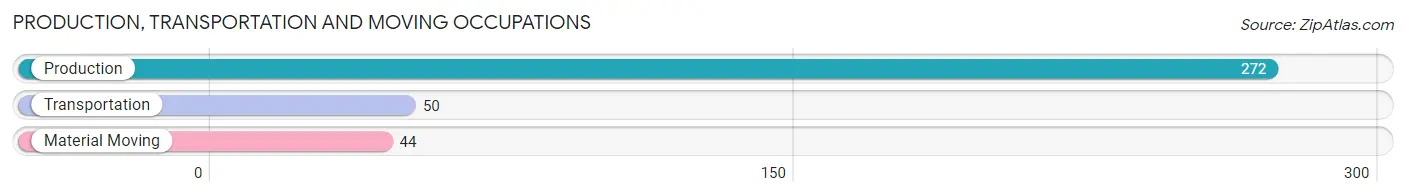
Production, Transportation and Moving Occupations
The most common Production, Transportation and Moving occupations in Palmyra are Production (272 | 14.0%), Transportation (50 | 2.6%), and Material Moving (44 | 2.3%).
Production, Transportation and Moving Occupations by Sex
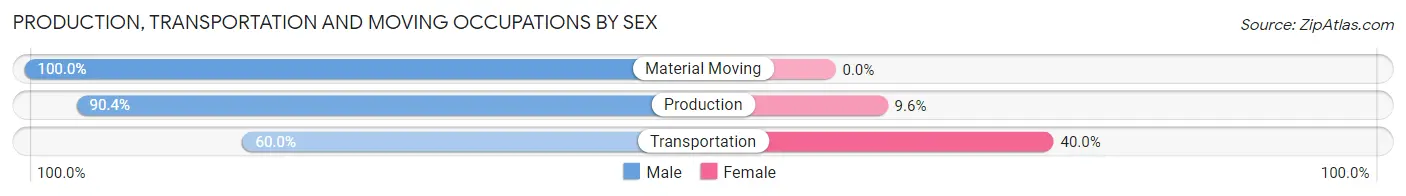
| Occupation | Male | Female |
| Production | 246 (90.4%) | 26 (9.6%) |
| Transportation | 30 (60.0%) | 20 (40.0%) |
| Material Moving | 44 (100.0%) | 0 (0.0%) |
| Total (Category) | 320 (87.4%) | 46 (12.6%) |
| Total (Overall) | 1,005 (51.7%) | 938 (48.3%) |
Employment Industries by Sex in Palmyra
Employment Industries in Palmyra
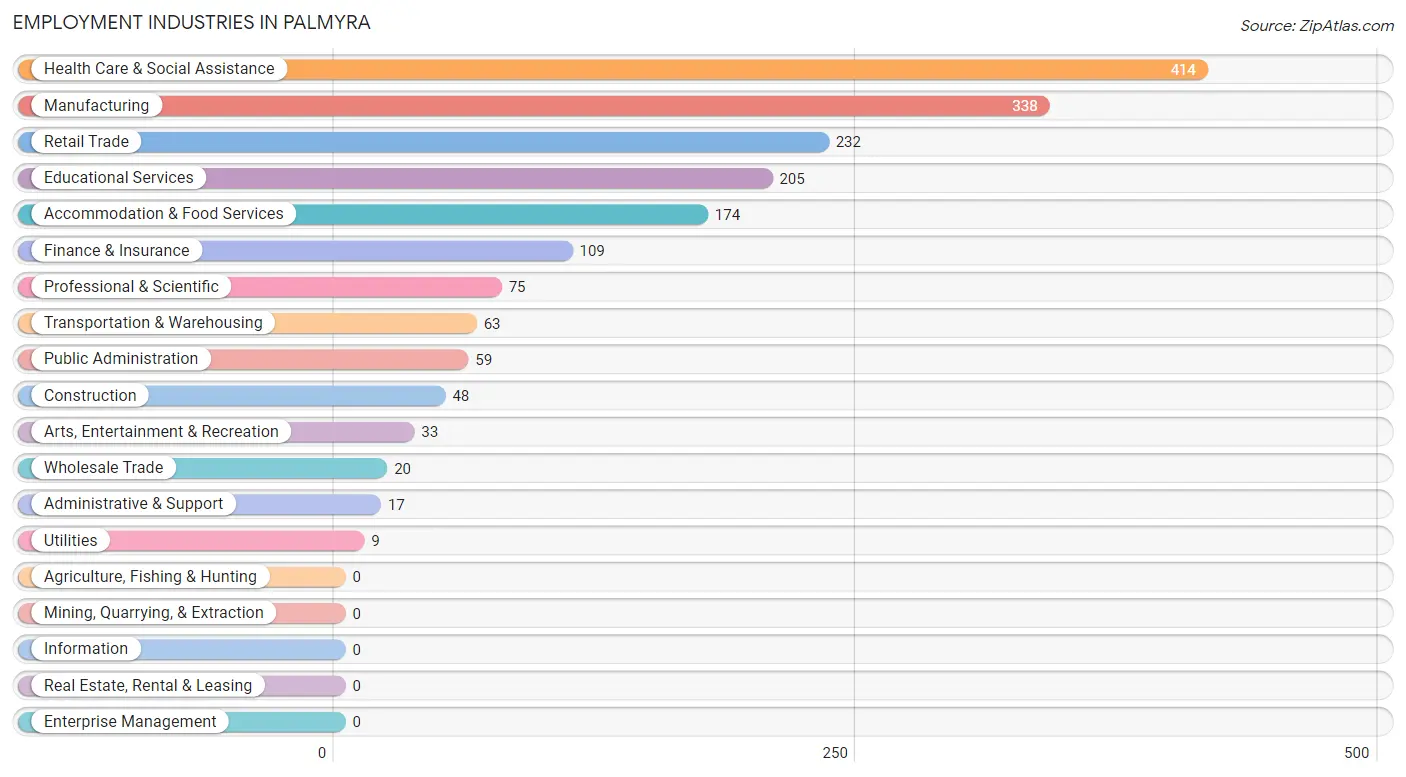
The major employment industries in Palmyra include Health Care & Social Assistance (414 | 21.3%), Manufacturing (338 | 17.4%), Retail Trade (232 | 11.9%), Educational Services (205 | 10.5%), and Accommodation & Food Services (174 | 9.0%).
Employment Industries by Sex in Palmyra
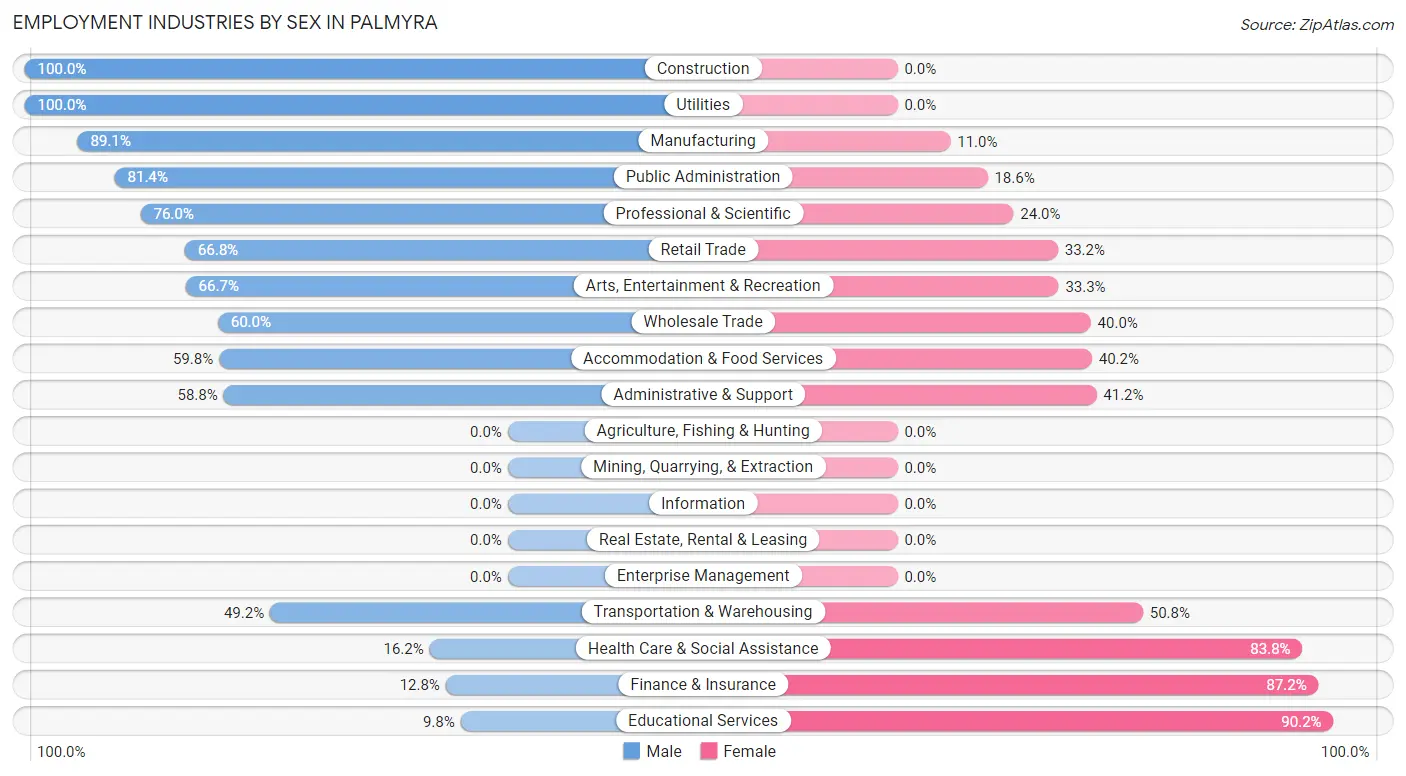
The Palmyra industries that see more men than women are Construction (100.0%), Utilities (100.0%), and Manufacturing (89.0%), whereas the industries that tend to have a higher number of women are Educational Services (90.2%), Finance & Insurance (87.2%), and Health Care & Social Assistance (83.8%).
| Industry | Male | Female |
| Agriculture, Fishing & Hunting | 0 (0.0%) | 0 (0.0%) |
| Mining, Quarrying, & Extraction | 0 (0.0%) | 0 (0.0%) |
| Construction | 48 (100.0%) | 0 (0.0%) |
| Manufacturing | 301 (89.0%) | 37 (11.0%) |
| Wholesale Trade | 12 (60.0%) | 8 (40.0%) |
| Retail Trade | 155 (66.8%) | 77 (33.2%) |
| Transportation & Warehousing | 31 (49.2%) | 32 (50.8%) |
| Utilities | 9 (100.0%) | 0 (0.0%) |
| Information | 0 (0.0%) | 0 (0.0%) |
| Finance & Insurance | 14 (12.8%) | 95 (87.2%) |
| Real Estate, Rental & Leasing | 0 (0.0%) | 0 (0.0%) |
| Professional & Scientific | 57 (76.0%) | 18 (24.0%) |
| Enterprise Management | 0 (0.0%) | 0 (0.0%) |
| Administrative & Support | 10 (58.8%) | 7 (41.2%) |
| Educational Services | 20 (9.8%) | 185 (90.2%) |
| Health Care & Social Assistance | 67 (16.2%) | 347 (83.8%) |
| Arts, Entertainment & Recreation | 22 (66.7%) | 11 (33.3%) |
| Accommodation & Food Services | 104 (59.8%) | 70 (40.2%) |
| Public Administration | 48 (81.4%) | 11 (18.6%) |
| Total | 1,005 (51.7%) | 938 (48.3%) |
Education in Palmyra
School Enrollment in Palmyra
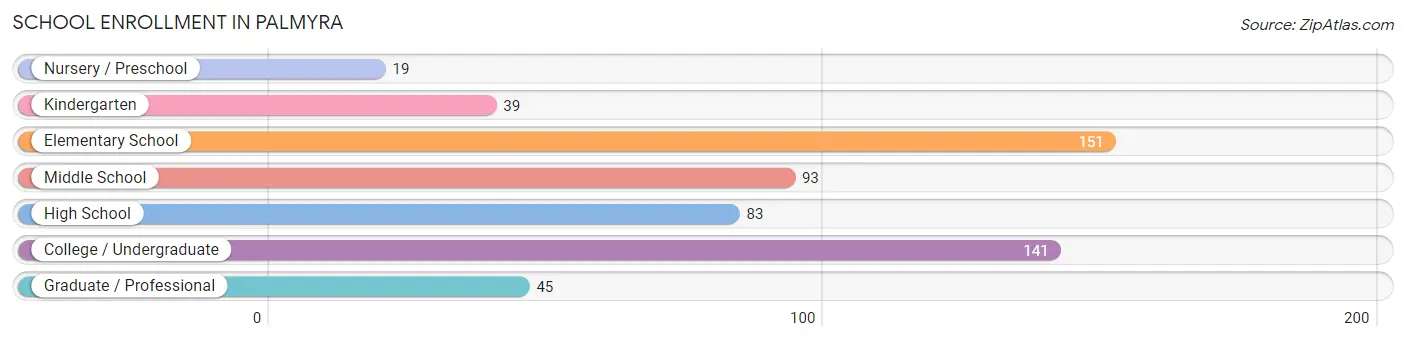
The most common levels of schooling among the 571 students in Palmyra are elementary school (151 | 26.4%), college / undergraduate (141 | 24.7%), and middle school (93 | 16.3%).
| School Level | # Students | % Students |
| Nursery / Preschool | 19 | 3.3% |
| Kindergarten | 39 | 6.8% |
| Elementary School | 151 | 26.4% |
| Middle School | 93 | 16.3% |
| High School | 83 | 14.5% |
| College / Undergraduate | 141 | 24.7% |
| Graduate / Professional | 45 | 7.9% |
| Total | 571 | 100.0% |
School Enrollment by Age by Funding Source in Palmyra
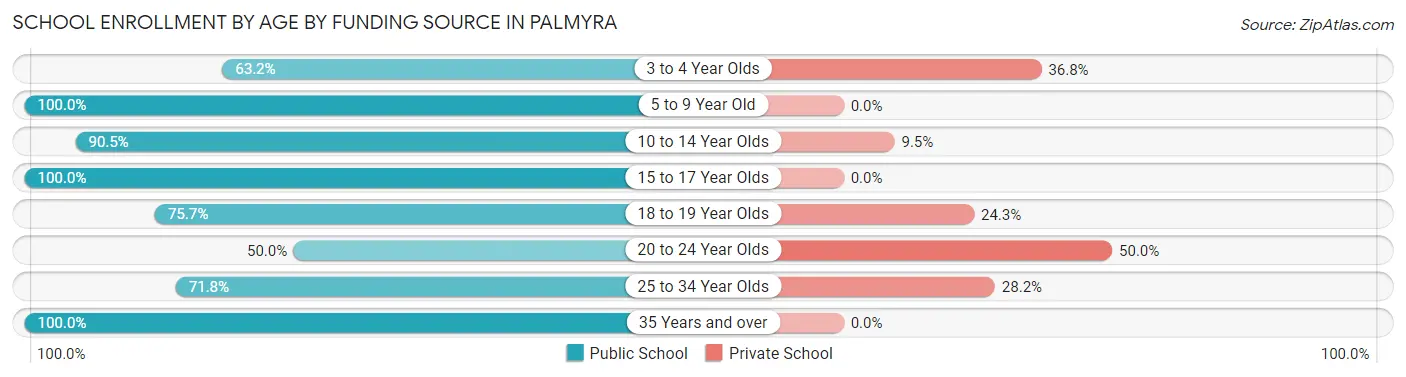
Out of a total of 571 students who are enrolled in schools in Palmyra, 87 (15.2%) attend a private institution, while the remaining 484 (84.8%) are enrolled in public schools. The age group of 20 to 24 year olds has the highest likelihood of being enrolled in private schools, with 32 (50.0% in the age bracket) enrolled. Conversely, the age group of 5 to 9 year old has the lowest likelihood of being enrolled in a private school, with 178 (100.0% in the age bracket) attending a public institution.
| Age Bracket | Public School | Private School |
| 3 to 4 Year Olds | 12 (63.2%) | 7 (36.8%) |
| 5 to 9 Year Old | 178 (100.0%) | 0 (0.0%) |
| 10 to 14 Year Olds | 105 (90.5%) | 11 (9.5%) |
| 15 to 17 Year Olds | 42 (100.0%) | 0 (0.0%) |
| 18 to 19 Year Olds | 53 (75.7%) | 17 (24.3%) |
| 20 to 24 Year Olds | 32 (50.0%) | 32 (50.0%) |
| 25 to 34 Year Olds | 51 (71.8%) | 20 (28.2%) |
| 35 Years and over | 11 (100.0%) | 0 (0.0%) |
| Total | 484 (84.8%) | 87 (15.2%) |
Educational Attainment by Field of Study in Palmyra
Business (187 | 26.2%), science & technology (129 | 18.1%), education (96 | 13.5%), visual & performing arts (69 | 9.7%), and psychology (64 | 9.0%) are the most common fields of study among 714 individuals in Palmyra who have obtained a bachelor's degree or higher.
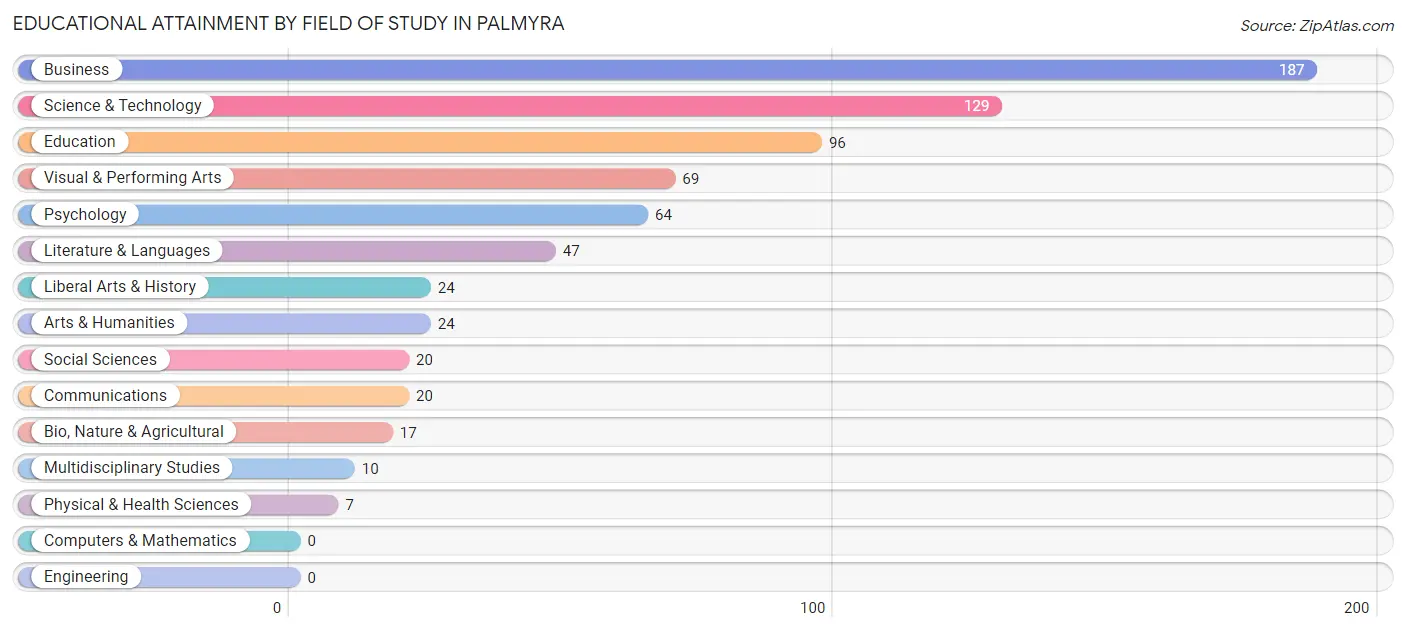
| Field of Study | # Graduates | % Graduates |
| Computers & Mathematics | 0 | 0.0% |
| Bio, Nature & Agricultural | 17 | 2.4% |
| Physical & Health Sciences | 7 | 1.0% |
| Psychology | 64 | 9.0% |
| Social Sciences | 20 | 2.8% |
| Engineering | 0 | 0.0% |
| Multidisciplinary Studies | 10 | 1.4% |
| Science & Technology | 129 | 18.1% |
| Business | 187 | 26.2% |
| Education | 96 | 13.5% |
| Literature & Languages | 47 | 6.6% |
| Liberal Arts & History | 24 | 3.4% |
| Visual & Performing Arts | 69 | 9.7% |
| Communications | 20 | 2.8% |
| Arts & Humanities | 24 | 3.4% |
| Total | 714 | 100.0% |
Transportation & Commute in Palmyra
Vehicle Availability by Sex in Palmyra
The most prevalent vehicle ownership categories in Palmyra are males with 2 vehicles (614, accounting for 61.1%) and females with 2 vehicles (342, making up 73.3%).
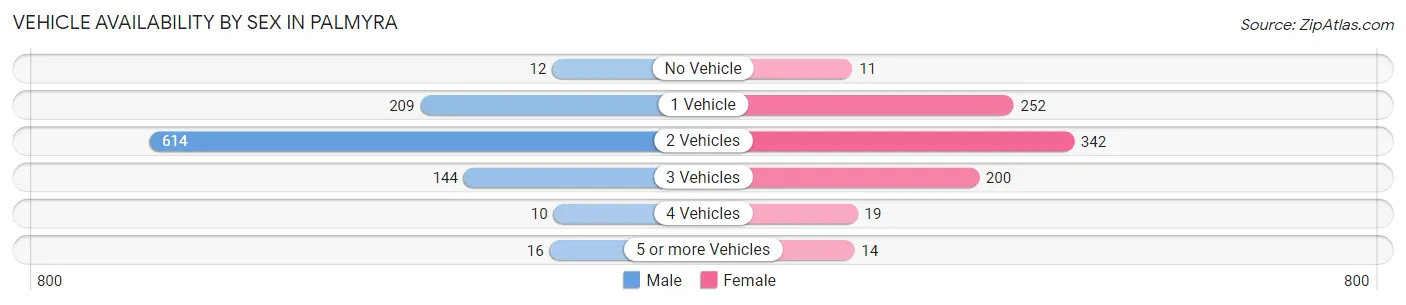
| Vehicles Available | Male | Female |
| No Vehicle | 12 (1.2%) | 11 (1.3%) |
| 1 Vehicle | 209 (20.8%) | 252 (30.1%) |
| 2 Vehicles | 614 (61.1%) | 342 (40.8%) |
| 3 Vehicles | 144 (14.3%) | 200 (23.9%) |
| 4 Vehicles | 10 (1.0%) | 19 (2.3%) |
| 5 or more Vehicles | 16 (1.6%) | 14 (1.7%) |
| Total | 1,005 (100.0%) | 838 (100.0%) |
Commute Time in Palmyra
The most frequently occuring commute durations in Palmyra are 10 to 14 minutes (301 commuters, 16.8%), 30 to 34 minutes (279 commuters, 15.6%), and 20 to 24 minutes (266 commuters, 14.9%).
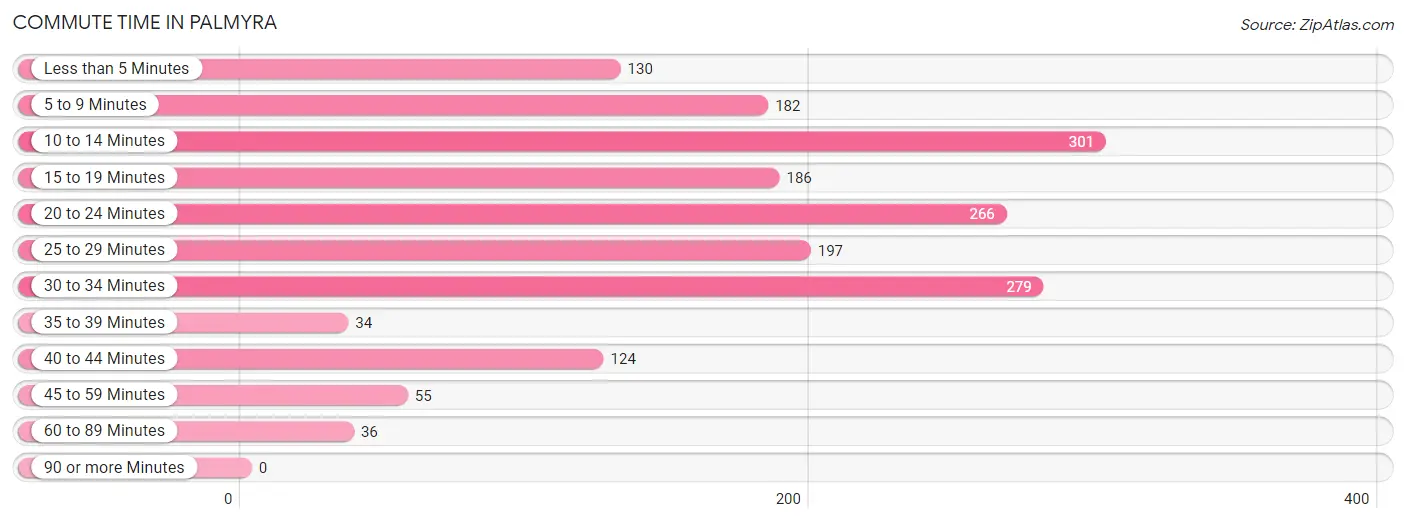
| Commute Time | # Commuters | % Commuters |
| Less than 5 Minutes | 130 | 7.3% |
| 5 to 9 Minutes | 182 | 10.2% |
| 10 to 14 Minutes | 301 | 16.8% |
| 15 to 19 Minutes | 186 | 10.4% |
| 20 to 24 Minutes | 266 | 14.9% |
| 25 to 29 Minutes | 197 | 11.0% |
| 30 to 34 Minutes | 279 | 15.6% |
| 35 to 39 Minutes | 34 | 1.9% |
| 40 to 44 Minutes | 124 | 6.9% |
| 45 to 59 Minutes | 55 | 3.1% |
| 60 to 89 Minutes | 36 | 2.0% |
| 90 or more Minutes | 0 | 0.0% |
Commute Time by Sex in Palmyra
The most common commute times in Palmyra are 10 to 14 minutes (227 commuters, 23.1%) for males and 20 to 24 minutes (150 commuters, 18.6%) for females.
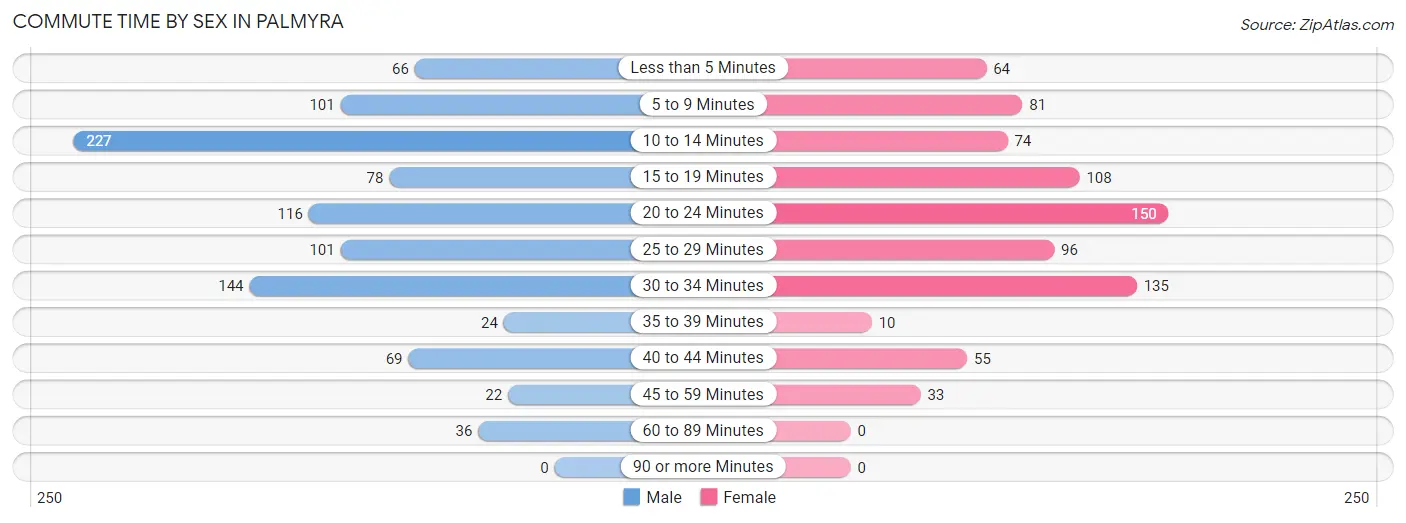
| Commute Time | Male | Female |
| Less than 5 Minutes | 66 (6.7%) | 64 (7.9%) |
| 5 to 9 Minutes | 101 (10.3%) | 81 (10.1%) |
| 10 to 14 Minutes | 227 (23.1%) | 74 (9.2%) |
| 15 to 19 Minutes | 78 (7.9%) | 108 (13.4%) |
| 20 to 24 Minutes | 116 (11.8%) | 150 (18.6%) |
| 25 to 29 Minutes | 101 (10.3%) | 96 (11.9%) |
| 30 to 34 Minutes | 144 (14.6%) | 135 (16.8%) |
| 35 to 39 Minutes | 24 (2.4%) | 10 (1.2%) |
| 40 to 44 Minutes | 69 (7.0%) | 55 (6.8%) |
| 45 to 59 Minutes | 22 (2.2%) | 33 (4.1%) |
| 60 to 89 Minutes | 36 (3.7%) | 0 (0.0%) |
| 90 or more Minutes | 0 (0.0%) | 0 (0.0%) |
Time of Departure to Work by Sex in Palmyra
The most frequent times of departure to work in Palmyra are 5:30 AM to 5:59 AM (117, 11.9%) for males and 7:30 AM to 7:59 AM (170, 21.1%) for females.
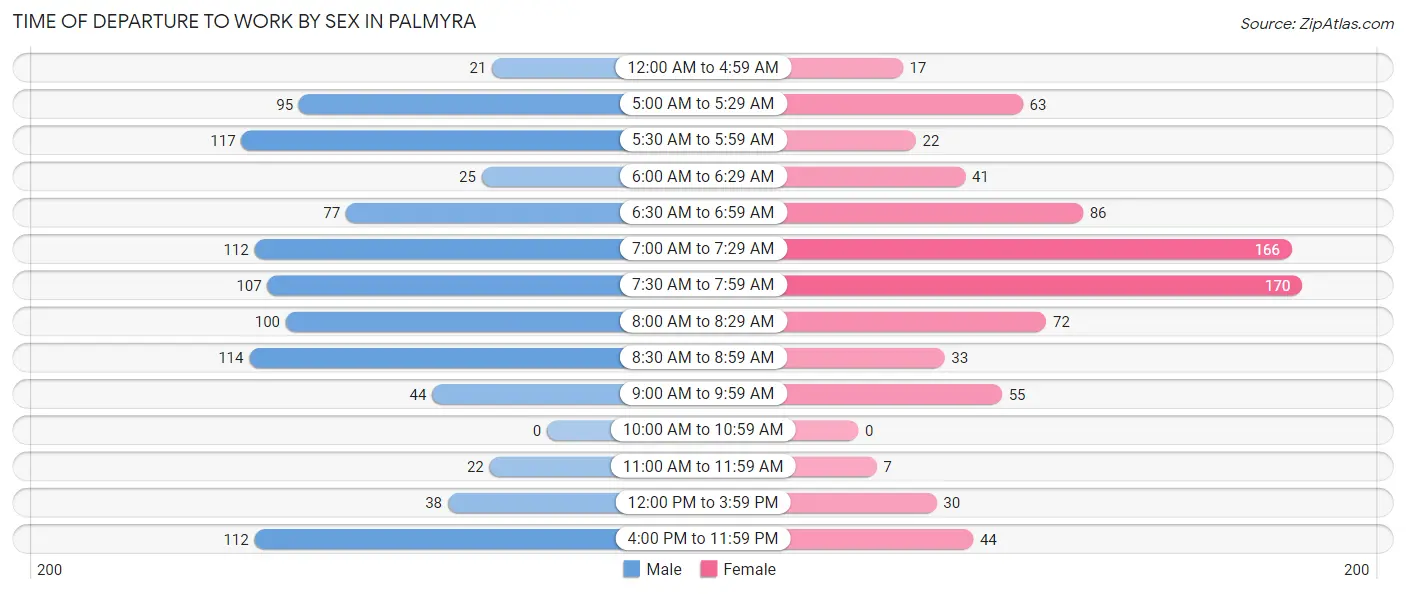
| Time of Departure | Male | Female |
| 12:00 AM to 4:59 AM | 21 (2.1%) | 17 (2.1%) |
| 5:00 AM to 5:29 AM | 95 (9.7%) | 63 (7.8%) |
| 5:30 AM to 5:59 AM | 117 (11.9%) | 22 (2.7%) |
| 6:00 AM to 6:29 AM | 25 (2.5%) | 41 (5.1%) |
| 6:30 AM to 6:59 AM | 77 (7.8%) | 86 (10.7%) |
| 7:00 AM to 7:29 AM | 112 (11.4%) | 166 (20.6%) |
| 7:30 AM to 7:59 AM | 107 (10.9%) | 170 (21.1%) |
| 8:00 AM to 8:29 AM | 100 (10.2%) | 72 (8.9%) |
| 8:30 AM to 8:59 AM | 114 (11.6%) | 33 (4.1%) |
| 9:00 AM to 9:59 AM | 44 (4.5%) | 55 (6.8%) |
| 10:00 AM to 10:59 AM | 0 (0.0%) | 0 (0.0%) |
| 11:00 AM to 11:59 AM | 22 (2.2%) | 7 (0.9%) |
| 12:00 PM to 3:59 PM | 38 (3.9%) | 30 (3.7%) |
| 4:00 PM to 11:59 PM | 112 (11.4%) | 44 (5.5%) |
| Total | 984 (100.0%) | 806 (100.0%) |
Housing Occupancy in Palmyra
Occupancy by Ownership in Palmyra
Of the total 1,538 dwellings in Palmyra, owner-occupied units account for 849 (55.2%), while renter-occupied units make up 689 (44.8%).
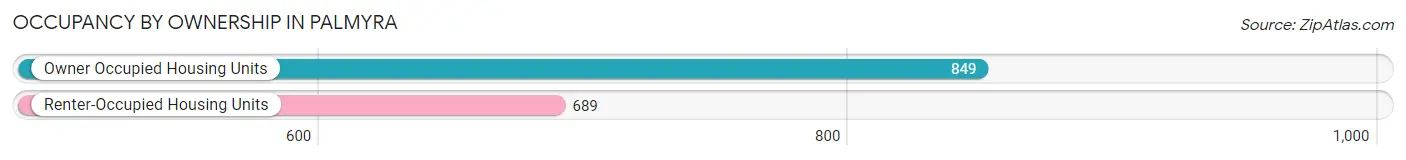
| Occupancy | # Housing Units | % Housing Units |
| Owner Occupied Housing Units | 849 | 55.2% |
| Renter-Occupied Housing Units | 689 | 44.8% |
| Total Occupied Housing Units | 1,538 | 100.0% |
Occupancy by Household Size in Palmyra
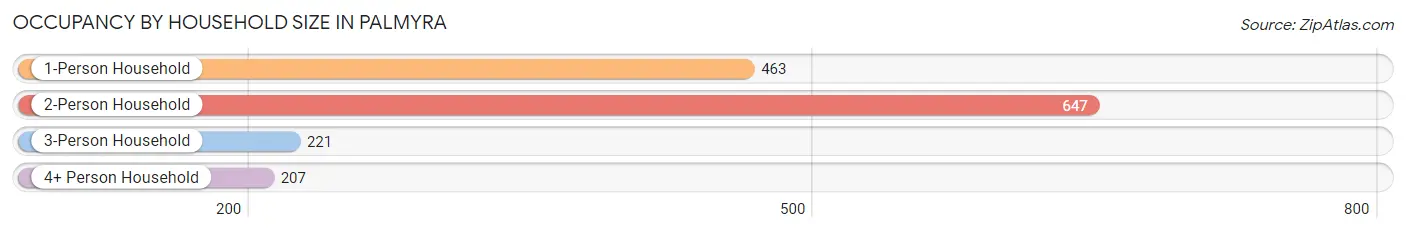
| Household Size | # Housing Units | % Housing Units |
| 1-Person Household | 463 | 30.1% |
| 2-Person Household | 647 | 42.1% |
| 3-Person Household | 221 | 14.4% |
| 4+ Person Household | 207 | 13.5% |
| Total Housing Units | 1,538 | 100.0% |
Occupancy by Ownership by Household Size in Palmyra
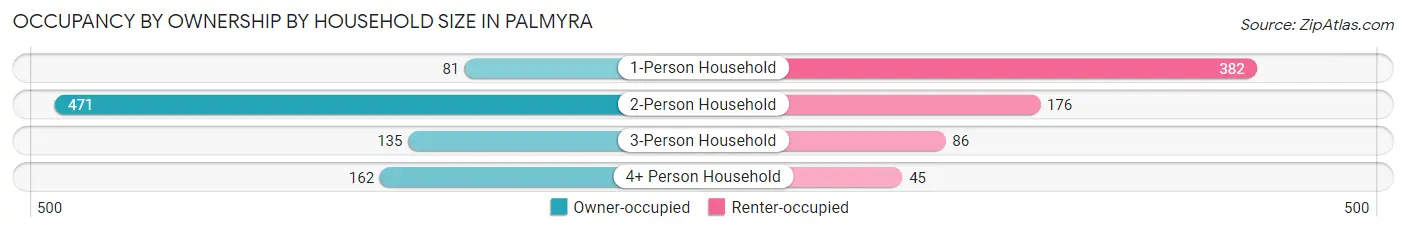
| Household Size | Owner-occupied | Renter-occupied |
| 1-Person Household | 81 (17.5%) | 382 (82.5%) |
| 2-Person Household | 471 (72.8%) | 176 (27.2%) |
| 3-Person Household | 135 (61.1%) | 86 (38.9%) |
| 4+ Person Household | 162 (78.3%) | 45 (21.7%) |
| Total Housing Units | 849 (55.2%) | 689 (44.8%) |
Occupancy by Educational Attainment in Palmyra
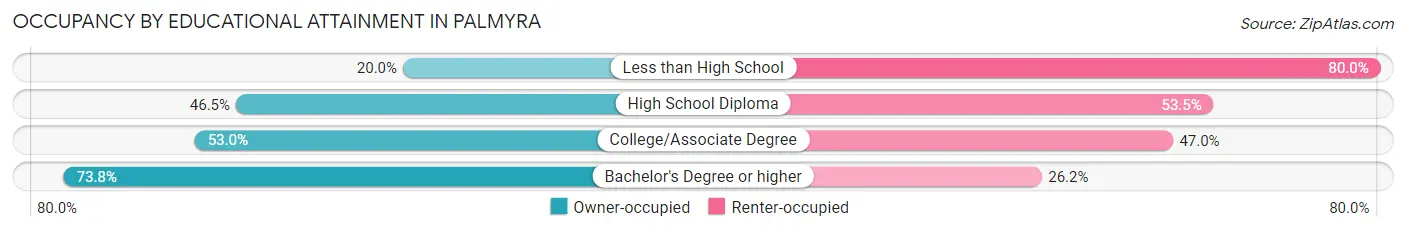
| Household Size | Owner-occupied | Renter-occupied |
| Less than High School | 10 (20.0%) | 40 (80.0%) |
| High School Diploma | 265 (46.5%) | 305 (53.5%) |
| College/Associate Degree | 264 (53.0%) | 234 (47.0%) |
| Bachelor's Degree or higher | 310 (73.8%) | 110 (26.2%) |
Occupancy by Age of Householder in Palmyra
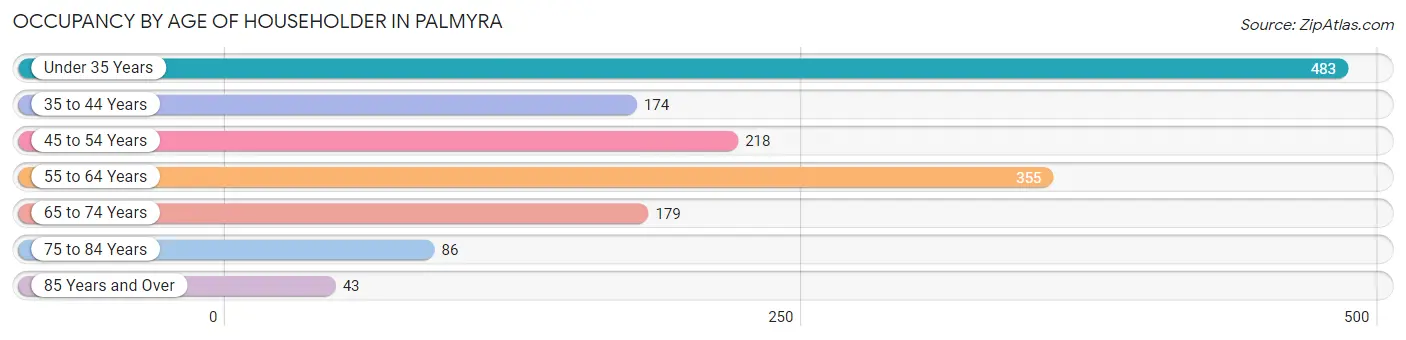
| Age Bracket | # Households | % Households |
| Under 35 Years | 483 | 31.4% |
| 35 to 44 Years | 174 | 11.3% |
| 45 to 54 Years | 218 | 14.2% |
| 55 to 64 Years | 355 | 23.1% |
| 65 to 74 Years | 179 | 11.6% |
| 75 to 84 Years | 86 | 5.6% |
| 85 Years and Over | 43 | 2.8% |
| Total | 1,538 | 100.0% |
Housing Finances in Palmyra
Median Income by Occupancy in Palmyra
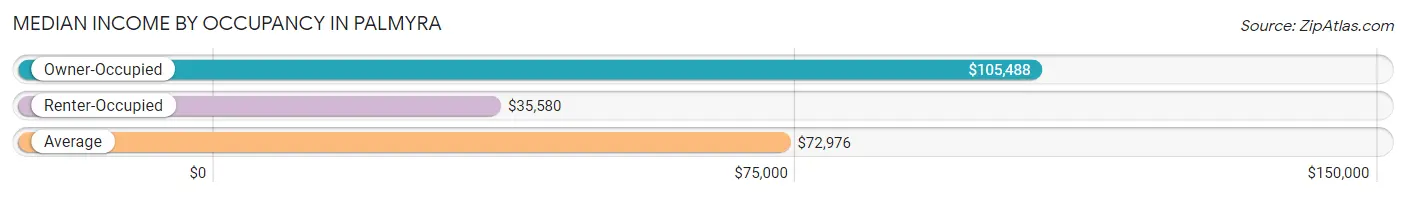
| Occupancy Type | # Households | Median Income |
| Owner-Occupied | 849 (55.2%) | $105,488 |
| Renter-Occupied | 689 (44.8%) | $35,580 |
| Average | 1,538 (100.0%) | $72,976 |
Occupancy by Householder Income Bracket in Palmyra
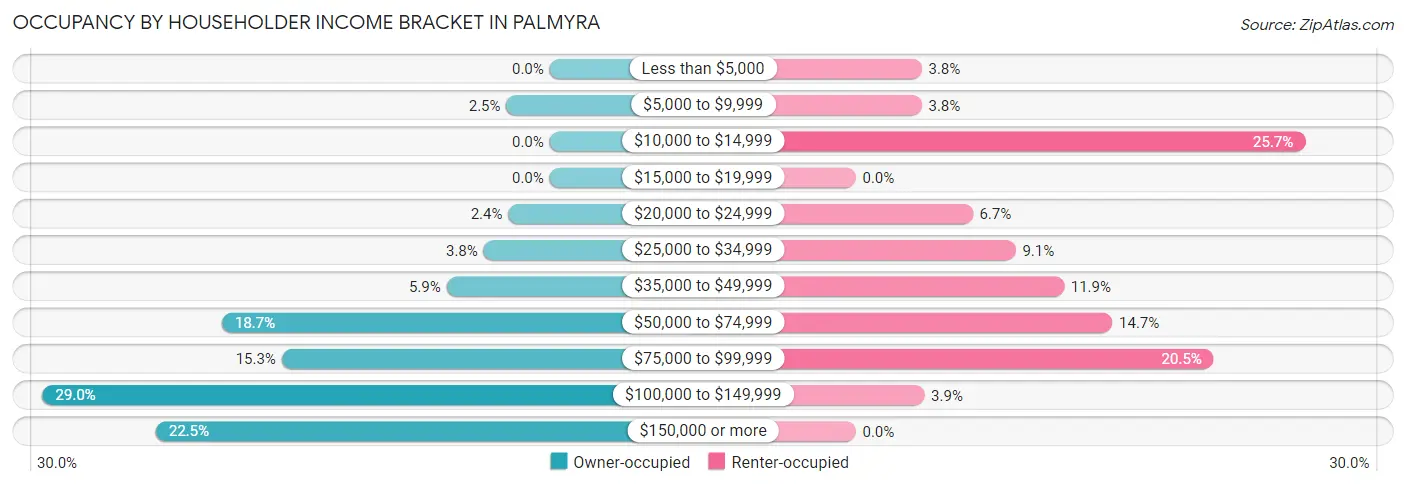
| Income Bracket | Owner-occupied | Renter-occupied |
| Less than $5,000 | 0 (0.0%) | 26 (3.8%) |
| $5,000 to $9,999 | 21 (2.5%) | 26 (3.8%) |
| $10,000 to $14,999 | 0 (0.0%) | 177 (25.7%) |
| $15,000 to $19,999 | 0 (0.0%) | 0 (0.0%) |
| $20,000 to $24,999 | 20 (2.4%) | 46 (6.7%) |
| $25,000 to $34,999 | 32 (3.8%) | 63 (9.1%) |
| $35,000 to $49,999 | 50 (5.9%) | 82 (11.9%) |
| $50,000 to $74,999 | 159 (18.7%) | 101 (14.7%) |
| $75,000 to $99,999 | 130 (15.3%) | 141 (20.5%) |
| $100,000 to $149,999 | 246 (29.0%) | 27 (3.9%) |
| $150,000 or more | 191 (22.5%) | 0 (0.0%) |
| Total | 849 (100.0%) | 689 (100.0%) |
Monthly Housing Cost Tiers in Palmyra
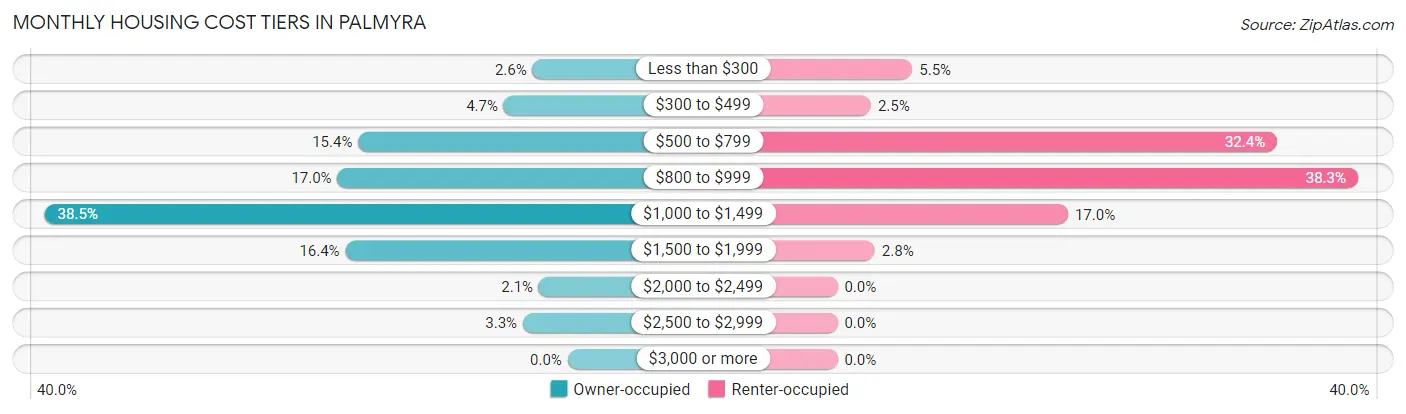
| Monthly Cost | Owner-occupied | Renter-occupied |
| Less than $300 | 22 (2.6%) | 38 (5.5%) |
| $300 to $499 | 40 (4.7%) | 17 (2.5%) |
| $500 to $799 | 131 (15.4%) | 223 (32.4%) |
| $800 to $999 | 144 (17.0%) | 264 (38.3%) |
| $1,000 to $1,499 | 327 (38.5%) | 117 (17.0%) |
| $1,500 to $1,999 | 139 (16.4%) | 19 (2.8%) |
| $2,000 to $2,499 | 18 (2.1%) | 0 (0.0%) |
| $2,500 to $2,999 | 28 (3.3%) | 0 (0.0%) |
| $3,000 or more | 0 (0.0%) | 0 (0.0%) |
| Total | 849 (100.0%) | 689 (100.0%) |
Physical Housing Characteristics in Palmyra
Housing Structures in Palmyra
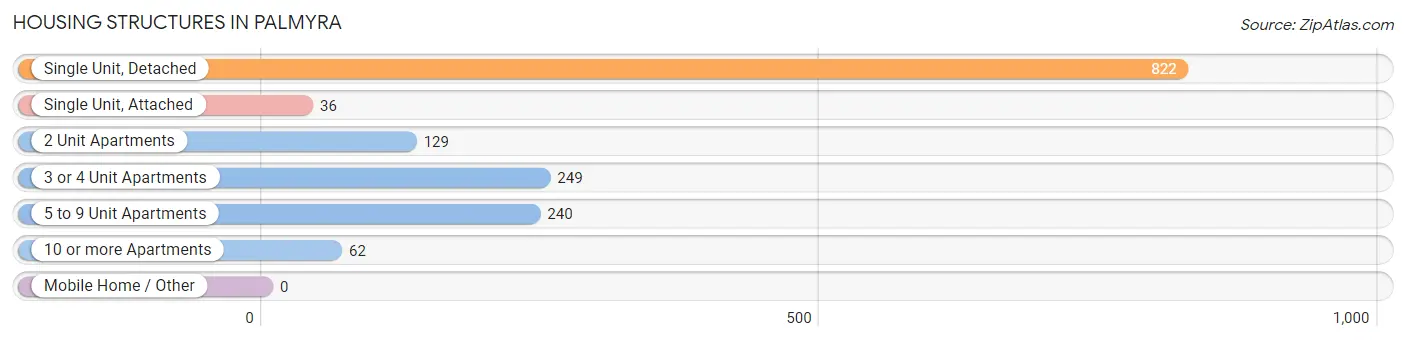
| Structure Type | # Housing Units | % Housing Units |
| Single Unit, Detached | 822 | 53.4% |
| Single Unit, Attached | 36 | 2.3% |
| 2 Unit Apartments | 129 | 8.4% |
| 3 or 4 Unit Apartments | 249 | 16.2% |
| 5 to 9 Unit Apartments | 240 | 15.6% |
| 10 or more Apartments | 62 | 4.0% |
| Mobile Home / Other | 0 | 0.0% |
| Total | 1,538 | 100.0% |
Housing Structures by Occupancy in Palmyra
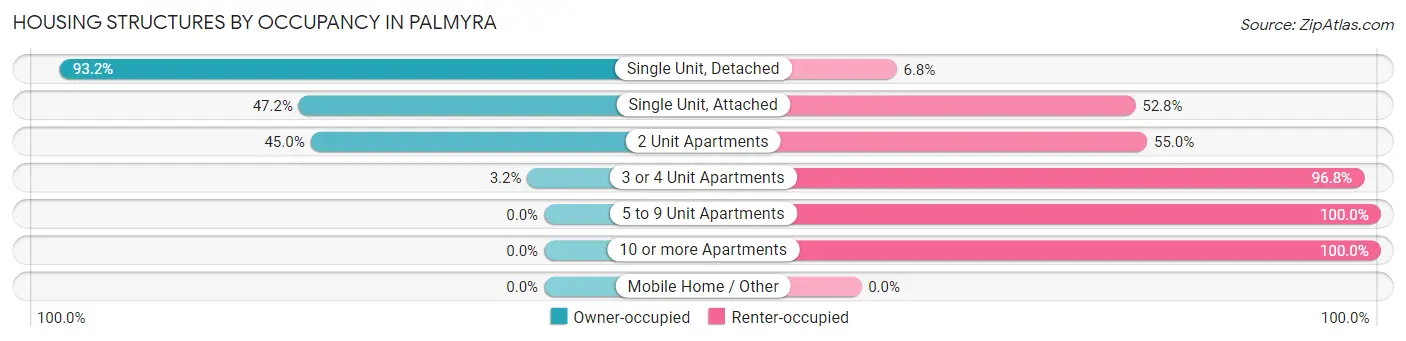
| Structure Type | Owner-occupied | Renter-occupied |
| Single Unit, Detached | 766 (93.2%) | 56 (6.8%) |
| Single Unit, Attached | 17 (47.2%) | 19 (52.8%) |
| 2 Unit Apartments | 58 (45.0%) | 71 (55.0%) |
| 3 or 4 Unit Apartments | 8 (3.2%) | 241 (96.8%) |
| 5 to 9 Unit Apartments | 0 (0.0%) | 240 (100.0%) |
| 10 or more Apartments | 0 (0.0%) | 62 (100.0%) |
| Mobile Home / Other | 0 (0.0%) | 0 (0.0%) |
| Total | 849 (55.2%) | 689 (44.8%) |
Housing Structures by Number of Rooms in Palmyra
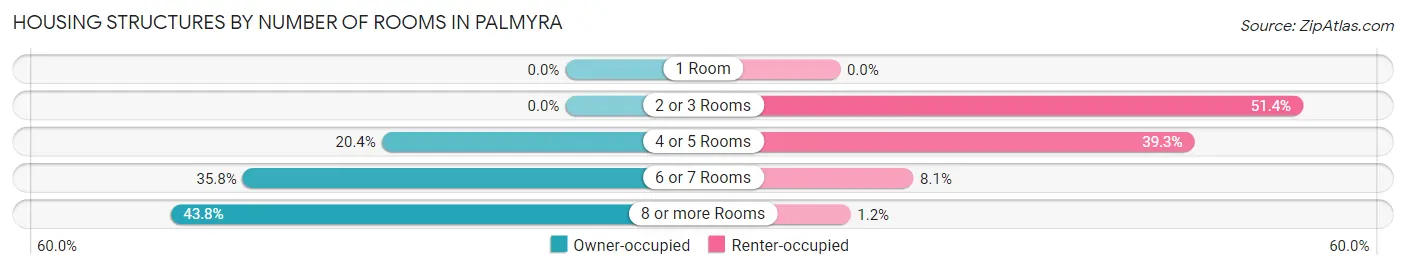
| Number of Rooms | Owner-occupied | Renter-occupied |
| 1 Room | 0 (0.0%) | 0 (0.0%) |
| 2 or 3 Rooms | 0 (0.0%) | 354 (51.4%) |
| 4 or 5 Rooms | 173 (20.4%) | 271 (39.3%) |
| 6 or 7 Rooms | 304 (35.8%) | 56 (8.1%) |
| 8 or more Rooms | 372 (43.8%) | 8 (1.2%) |
| Total | 849 (100.0%) | 689 (100.0%) |
Housing Structure by Heating Type in Palmyra
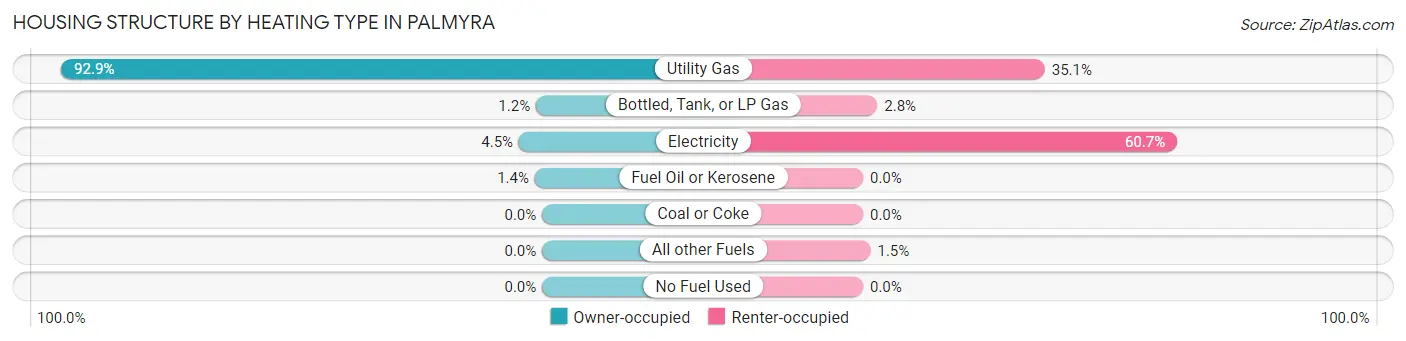
| Heating Type | Owner-occupied | Renter-occupied |
| Utility Gas | 789 (92.9%) | 242 (35.1%) |
| Bottled, Tank, or LP Gas | 10 (1.2%) | 19 (2.8%) |
| Electricity | 38 (4.5%) | 418 (60.7%) |
| Fuel Oil or Kerosene | 12 (1.4%) | 0 (0.0%) |
| Coal or Coke | 0 (0.0%) | 0 (0.0%) |
| All other Fuels | 0 (0.0%) | 10 (1.5%) |
| No Fuel Used | 0 (0.0%) | 0 (0.0%) |
| Total | 849 (100.0%) | 689 (100.0%) |
Household Vehicle Usage in Palmyra
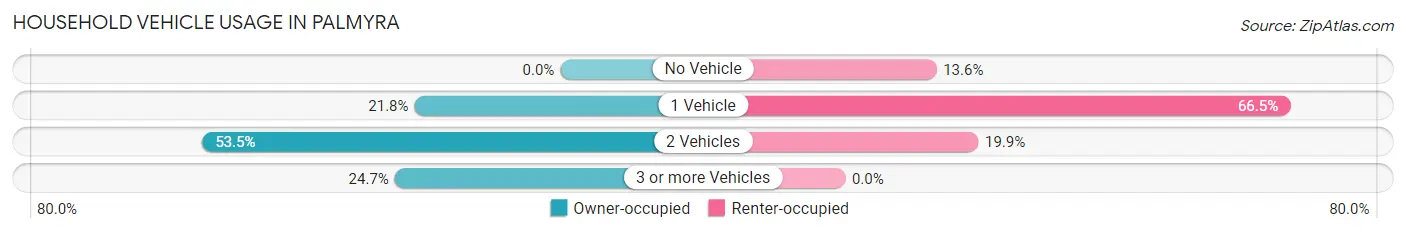
| Vehicles per Household | Owner-occupied | Renter-occupied |
| No Vehicle | 0 (0.0%) | 94 (13.6%) |
| 1 Vehicle | 185 (21.8%) | 458 (66.5%) |
| 2 Vehicles | 454 (53.5%) | 137 (19.9%) |
| 3 or more Vehicles | 210 (24.7%) | 0 (0.0%) |
| Total | 849 (100.0%) | 689 (100.0%) |
Real Estate & Mortgages in Palmyra
Real Estate and Mortgage Overview in Palmyra
| Characteristic | Without Mortgage | With Mortgage |
| Housing Units | 327 | 522 |
| Median Property Value | $143,900 | $113,200 |
| Median Household Income | $126,484 | $85 |
| Monthly Housing Costs | $780 | $0 |
| Real Estate Taxes | $4,940 | $3 |
Property Value by Mortgage Status in Palmyra
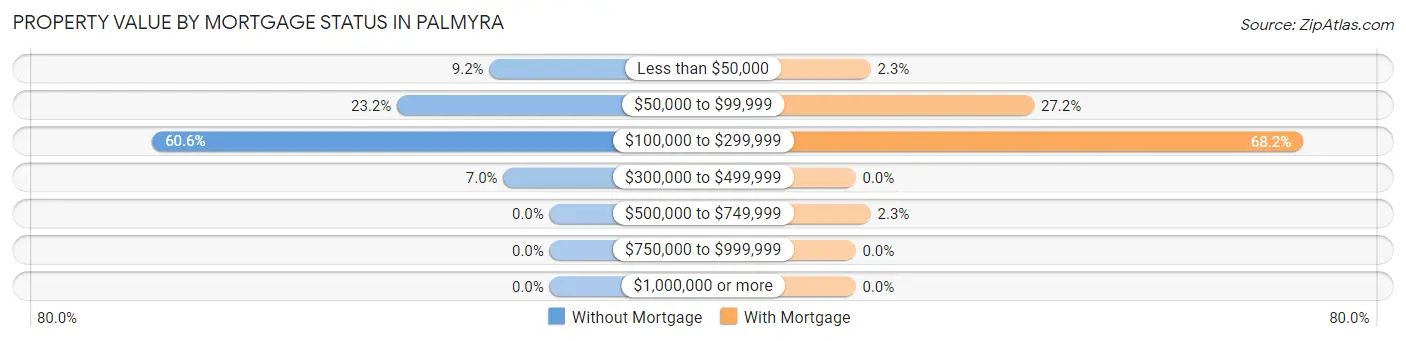
| Property Value | Without Mortgage | With Mortgage |
| Less than $50,000 | 30 (9.2%) | 12 (2.3%) |
| $50,000 to $99,999 | 76 (23.2%) | 142 (27.2%) |
| $100,000 to $299,999 | 198 (60.6%) | 356 (68.2%) |
| $300,000 to $499,999 | 23 (7.0%) | 0 (0.0%) |
| $500,000 to $749,999 | 0 (0.0%) | 12 (2.3%) |
| $750,000 to $999,999 | 0 (0.0%) | 0 (0.0%) |
| $1,000,000 or more | 0 (0.0%) | 0 (0.0%) |
| Total | 327 (100.0%) | 522 (100.0%) |
Household Income by Mortgage Status in Palmyra
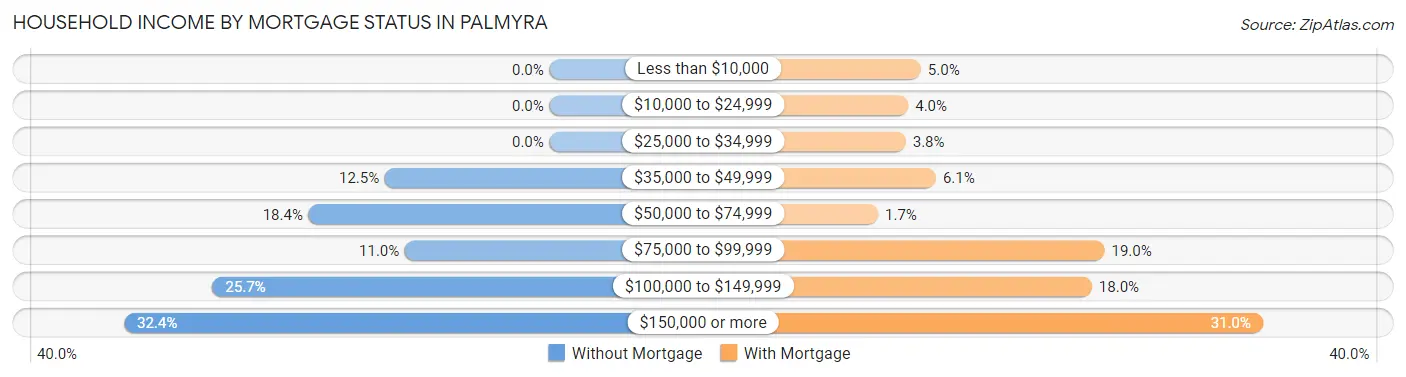
| Household Income | Without Mortgage | With Mortgage |
| Less than $10,000 | 0 (0.0%) | 26 (5.0%) |
| $10,000 to $24,999 | 0 (0.0%) | 21 (4.0%) |
| $25,000 to $34,999 | 0 (0.0%) | 20 (3.8%) |
| $35,000 to $49,999 | 41 (12.5%) | 32 (6.1%) |
| $50,000 to $74,999 | 60 (18.3%) | 9 (1.7%) |
| $75,000 to $99,999 | 36 (11.0%) | 99 (19.0%) |
| $100,000 to $149,999 | 84 (25.7%) | 94 (18.0%) |
| $150,000 or more | 106 (32.4%) | 162 (31.0%) |
| Total | 327 (100.0%) | 522 (100.0%) |
Property Value to Household Income Ratio in Palmyra
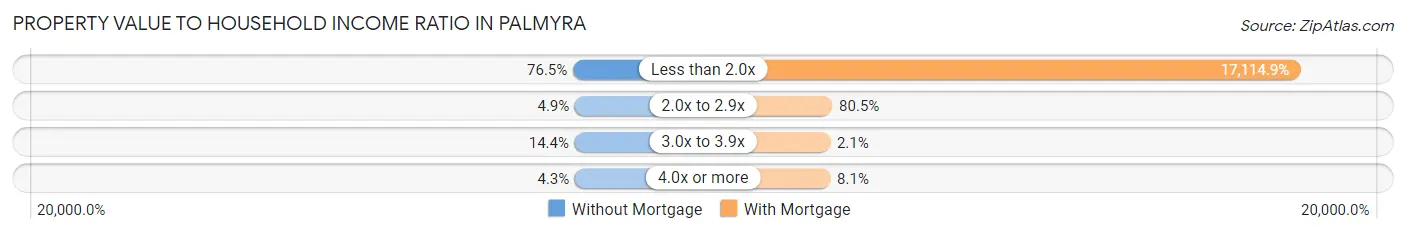
| Value-to-Income Ratio | Without Mortgage | With Mortgage |
| Less than 2.0x | 250 (76.4%) | 89,340 (17,114.9%) |
| 2.0x to 2.9x | 16 (4.9%) | 420 (80.5%) |
| 3.0x to 3.9x | 47 (14.4%) | 11 (2.1%) |
| 4.0x or more | 14 (4.3%) | 42 (8.1%) |
| Total | 327 (100.0%) | 522 (100.0%) |
Real Estate Taxes by Mortgage Status in Palmyra
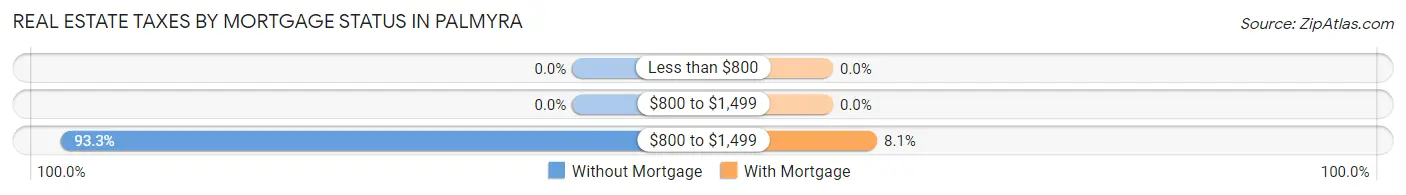
| Property Taxes | Without Mortgage | With Mortgage |
| Less than $800 | 0 (0.0%) | 0 (0.0%) |
| $800 to $1,499 | 0 (0.0%) | 0 (0.0%) |
| $800 to $1,499 | 305 (93.3%) | 42 (8.1%) |
| Total | 327 (100.0%) | 522 (100.0%) |
Health & Disability in Palmyra
Health Insurance Coverage by Age in Palmyra
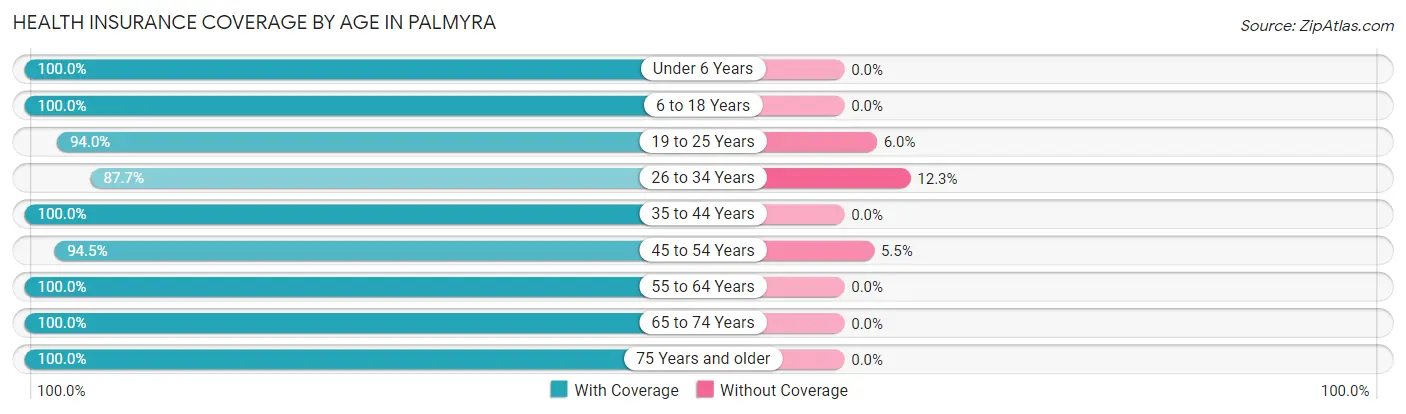
| Age Bracket | With Coverage | Without Coverage |
| Under 6 Years | 235 (100.0%) | 0 (0.0%) |
| 6 to 18 Years | 346 (100.0%) | 0 (0.0%) |
| 19 to 25 Years | 451 (94.0%) | 29 (6.0%) |
| 26 to 34 Years | 313 (87.7%) | 44 (12.3%) |
| 35 to 44 Years | 381 (100.0%) | 0 (0.0%) |
| 45 to 54 Years | 461 (94.5%) | 27 (5.5%) |
| 55 to 64 Years | 491 (100.0%) | 0 (0.0%) |
| 65 to 74 Years | 338 (100.0%) | 0 (0.0%) |
| 75 Years and older | 210 (100.0%) | 0 (0.0%) |
| Total | 3,226 (97.0%) | 100 (3.0%) |
Health Insurance Coverage by Citizenship Status in Palmyra
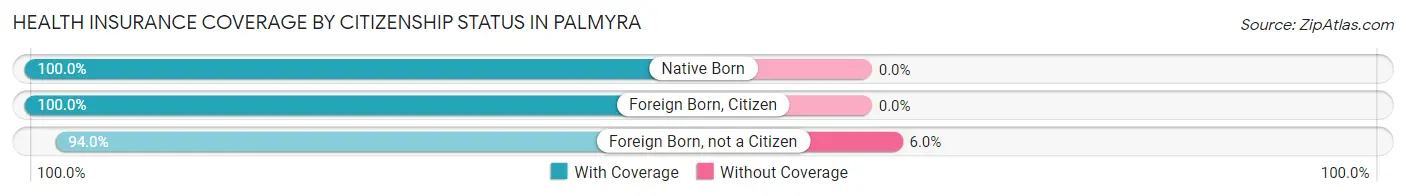
| Citizenship Status | With Coverage | Without Coverage |
| Native Born | 235 (100.0%) | 0 (0.0%) |
| Foreign Born, Citizen | 346 (100.0%) | 0 (0.0%) |
| Foreign Born, not a Citizen | 451 (94.0%) | 29 (6.0%) |
Health Insurance Coverage by Household Income in Palmyra
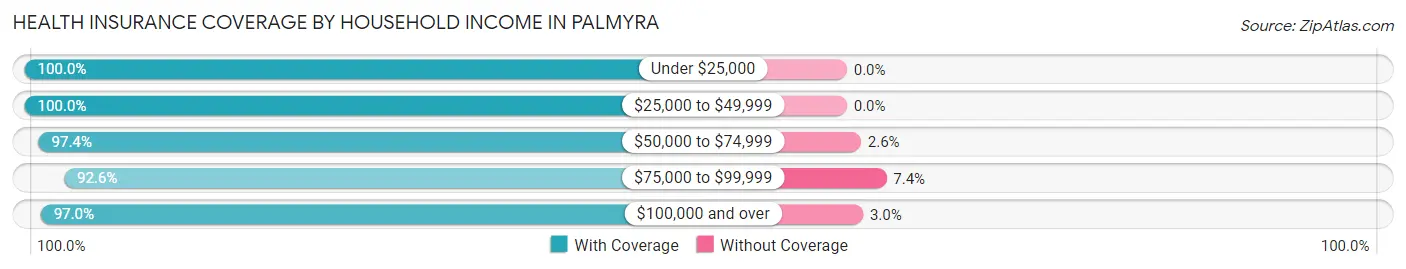
| Household Income | With Coverage | Without Coverage |
| Under $25,000 | 433 (100.0%) | 0 (0.0%) |
| $25,000 to $49,999 | 335 (100.0%) | 0 (0.0%) |
| $50,000 to $74,999 | 556 (97.4%) | 15 (2.6%) |
| $75,000 to $99,999 | 550 (92.6%) | 44 (7.4%) |
| $100,000 and over | 1,310 (97.0%) | 41 (3.0%) |
Public vs Private Health Insurance Coverage by Age in Palmyra
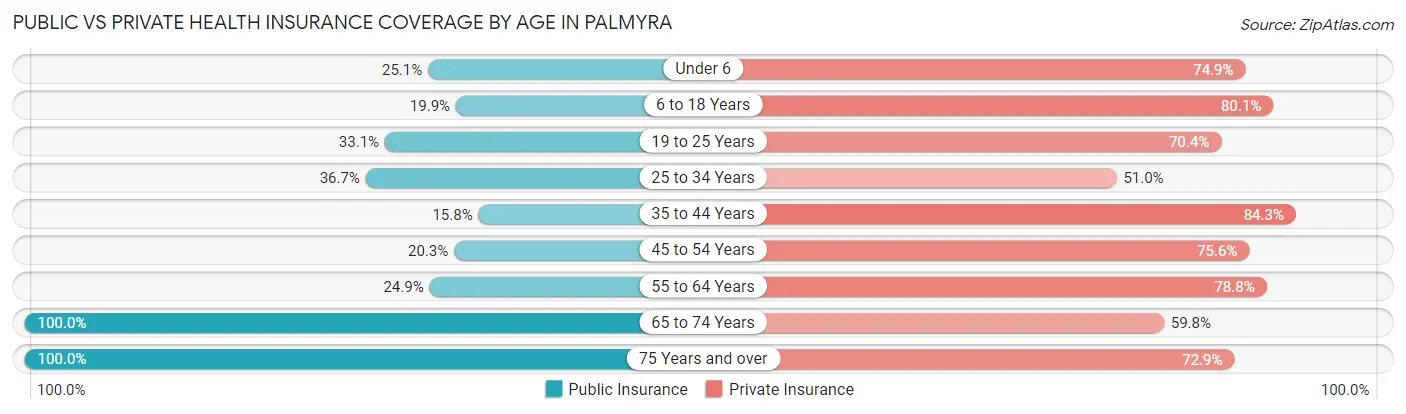
| Age Bracket | Public Insurance | Private Insurance |
| Under 6 | 59 (25.1%) | 176 (74.9%) |
| 6 to 18 Years | 69 (19.9%) | 277 (80.1%) |
| 19 to 25 Years | 159 (33.1%) | 338 (70.4%) |
| 25 to 34 Years | 131 (36.7%) | 182 (51.0%) |
| 35 to 44 Years | 60 (15.8%) | 321 (84.3%) |
| 45 to 54 Years | 99 (20.3%) | 369 (75.6%) |
| 55 to 64 Years | 122 (24.8%) | 387 (78.8%) |
| 65 to 74 Years | 338 (100.0%) | 202 (59.8%) |
| 75 Years and over | 210 (100.0%) | 153 (72.9%) |
| Total | 1,247 (37.5%) | 2,405 (72.3%) |
Disability Status by Sex by Age in Palmyra
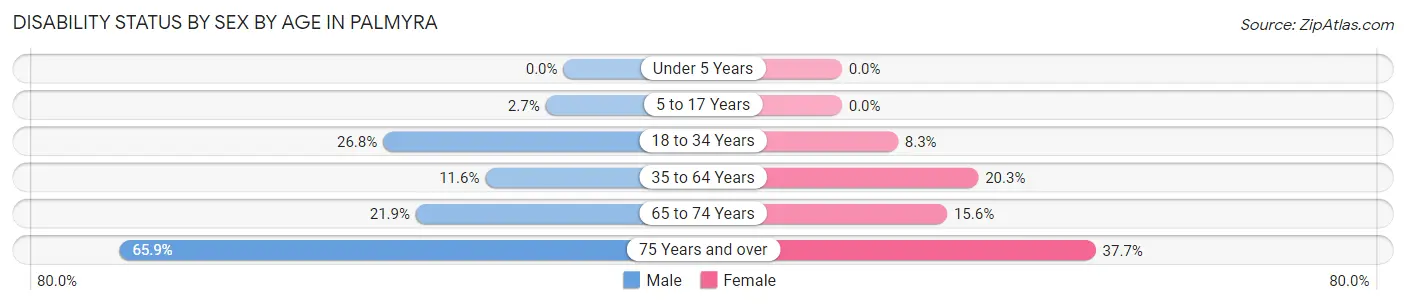
| Age Bracket | Male | Female |
| Under 5 Years | 0 (0.0%) | 0 (0.0%) |
| 5 to 17 Years | 5 (2.6%) | 0 (0.0%) |
| 18 to 34 Years | 106 (26.8%) | 40 (8.3%) |
| 35 to 64 Years | 85 (11.6%) | 127 (20.3%) |
| 65 to 74 Years | 39 (21.9%) | 25 (15.6%) |
| 75 Years and over | 58 (65.9%) | 46 (37.7%) |
Disability Class by Sex by Age in Palmyra
Disability Class: Hearing Difficulty
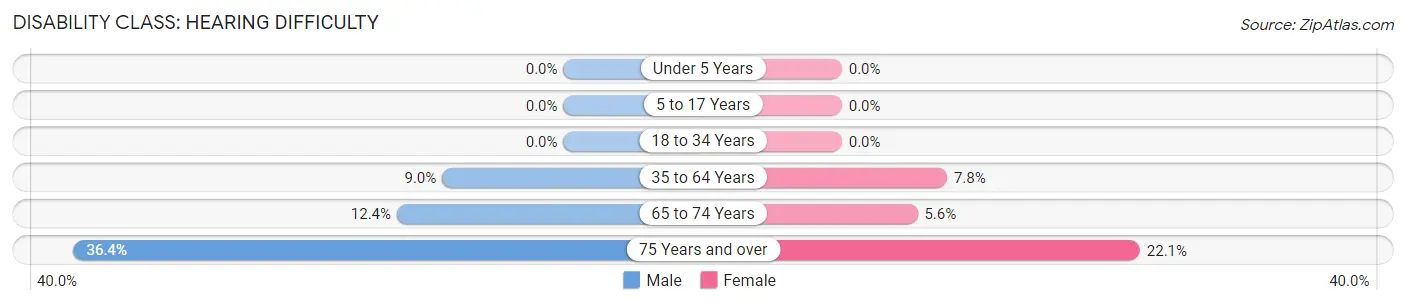
| Age Bracket | Male | Female |
| Under 5 Years | 0 (0.0%) | 0 (0.0%) |
| 5 to 17 Years | 0 (0.0%) | 0 (0.0%) |
| 18 to 34 Years | 0 (0.0%) | 0 (0.0%) |
| 35 to 64 Years | 66 (9.0%) | 49 (7.8%) |
| 65 to 74 Years | 22 (12.4%) | 9 (5.6%) |
| 75 Years and over | 32 (36.4%) | 27 (22.1%) |
Disability Class: Vision Difficulty
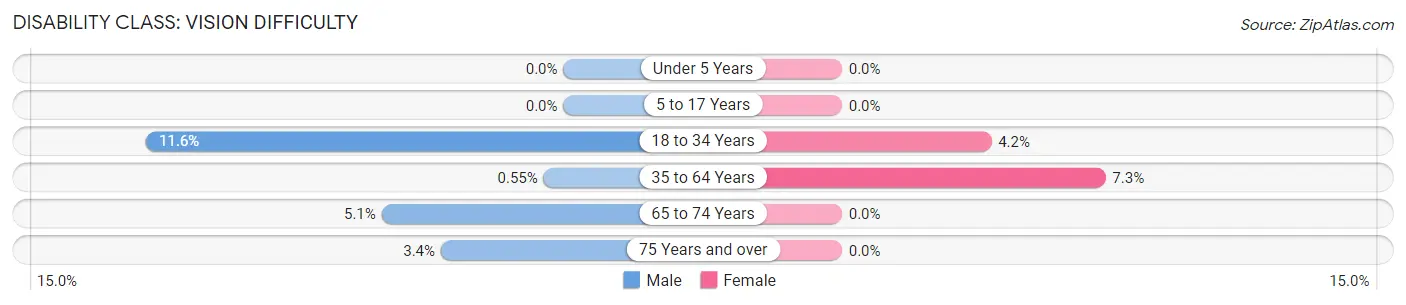
| Age Bracket | Male | Female |
| Under 5 Years | 0 (0.0%) | 0 (0.0%) |
| 5 to 17 Years | 0 (0.0%) | 0 (0.0%) |
| 18 to 34 Years | 46 (11.6%) | 20 (4.2%) |
| 35 to 64 Years | 4 (0.5%) | 46 (7.3%) |
| 65 to 74 Years | 9 (5.1%) | 0 (0.0%) |
| 75 Years and over | 3 (3.4%) | 0 (0.0%) |
Disability Class: Cognitive Difficulty
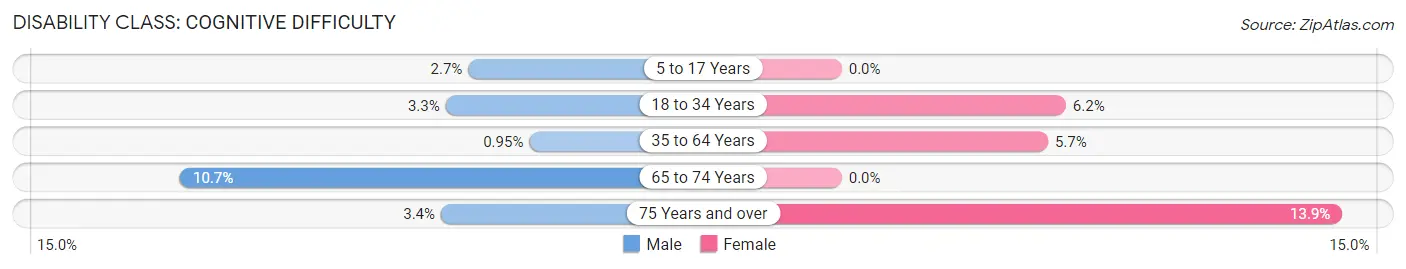
| Age Bracket | Male | Female |
| 5 to 17 Years | 5 (2.6%) | 0 (0.0%) |
| 18 to 34 Years | 13 (3.3%) | 30 (6.2%) |
| 35 to 64 Years | 7 (0.9%) | 36 (5.7%) |
| 65 to 74 Years | 19 (10.7%) | 0 (0.0%) |
| 75 Years and over | 3 (3.4%) | 17 (13.9%) |
Disability Class: Ambulatory Difficulty
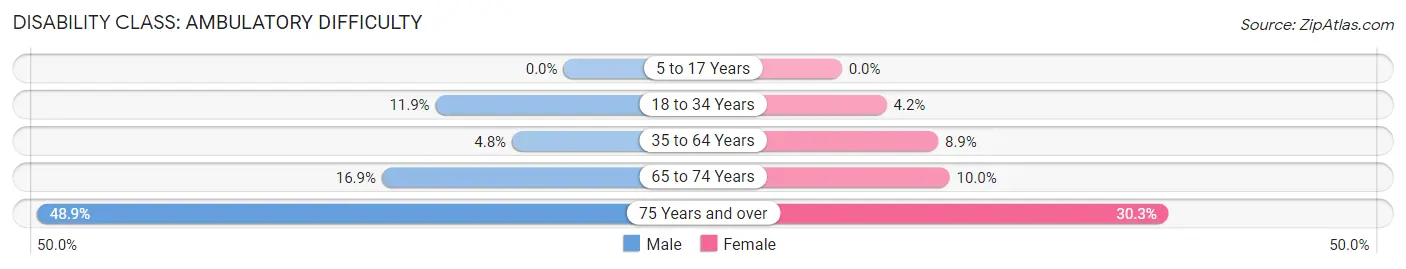
| Age Bracket | Male | Female |
| 5 to 17 Years | 0 (0.0%) | 0 (0.0%) |
| 18 to 34 Years | 47 (11.9%) | 20 (4.2%) |
| 35 to 64 Years | 35 (4.8%) | 56 (8.9%) |
| 65 to 74 Years | 30 (16.9%) | 16 (10.0%) |
| 75 Years and over | 43 (48.9%) | 37 (30.3%) |
Disability Class: Self-Care Difficulty
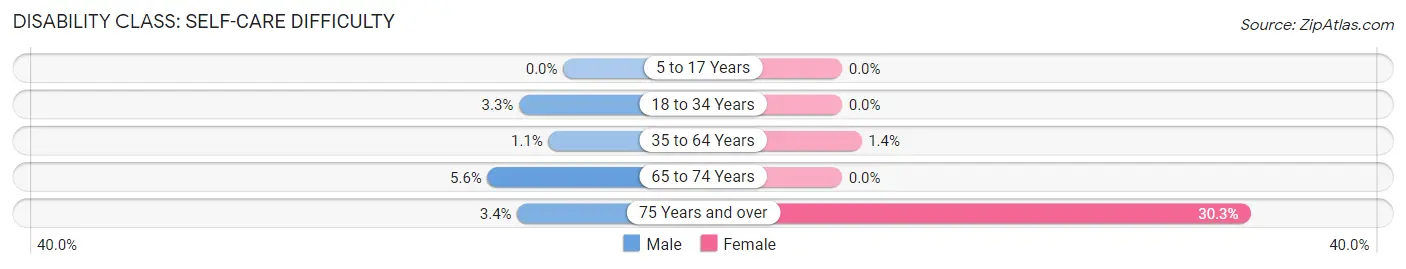
| Age Bracket | Male | Female |
| 5 to 17 Years | 0 (0.0%) | 0 (0.0%) |
| 18 to 34 Years | 13 (3.3%) | 0 (0.0%) |
| 35 to 64 Years | 8 (1.1%) | 9 (1.4%) |
| 65 to 74 Years | 10 (5.6%) | 0 (0.0%) |
| 75 Years and over | 3 (3.4%) | 37 (30.3%) |
Technology Access in Palmyra
Computing Device Access in Palmyra
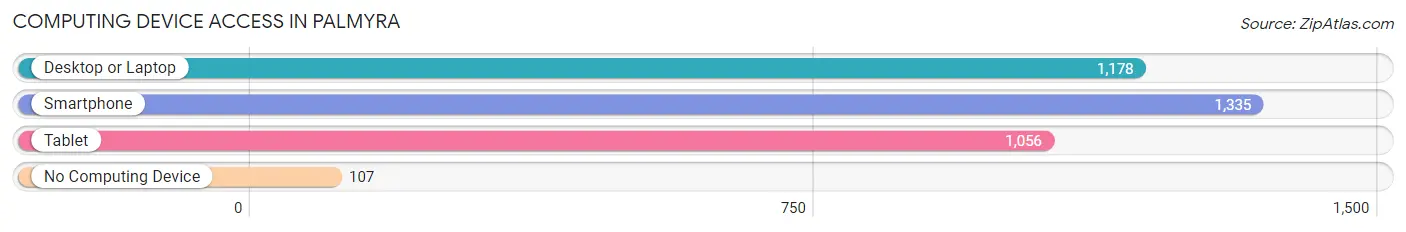
| Device Type | # Households | % Households |
| Desktop or Laptop | 1,178 | 76.6% |
| Smartphone | 1,335 | 86.8% |
| Tablet | 1,056 | 68.7% |
| No Computing Device | 107 | 7.0% |
| Total | 1,538 | 100.0% |
Internet Access in Palmyra
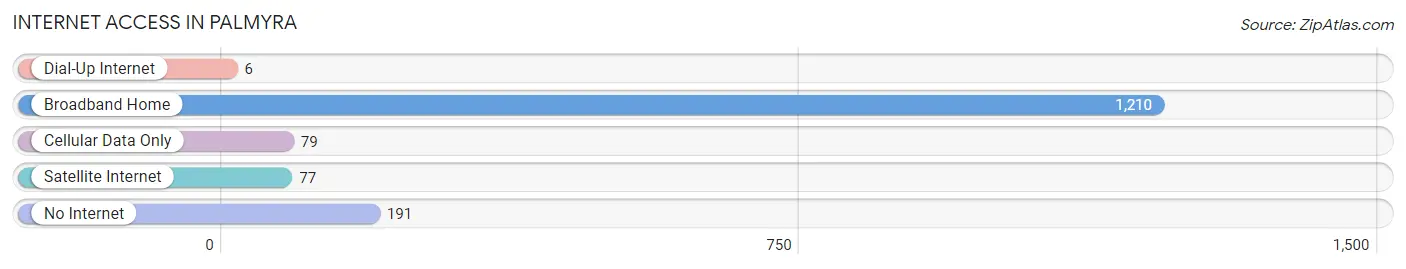
| Internet Type | # Households | % Households |
| Dial-Up Internet | 6 | 0.4% |
| Broadband Home | 1,210 | 78.7% |
| Cellular Data Only | 79 | 5.1% |
| Satellite Internet | 77 | 5.0% |
| No Internet | 191 | 12.4% |
| Total | 1,538 | 100.0% |
Palmyra Summary
Palmyra, NY is a small town located in Wayne County, New York. It is situated on the banks of the Erie Canal and is part of the Finger Lakes region. The town has a population of about 3,000 people and is known for its historic sites, such as the Joseph Smith Historic Site and the Palmyra Village Historic District.
History
The area that is now Palmyra was originally inhabited by the Iroquois and Algonquin tribes. The first European settlers arrived in the area in 1789 and the town was officially established in 1796. The town was named after the ancient city of Palmyra in Syria.
The town was an important stop on the Erie Canal, which was completed in 1825. The canal brought economic prosperity to the area and the town grew rapidly. The town was also an important stop on the Underground Railroad, which helped slaves escape to freedom in Canada.
In 1827, the Church of Jesus Christ of Latter-day Saints was founded in Palmyra. The church's founder, Joseph Smith, lived in Palmyra and the town is home to several important sites related to the church's history.
Geography
Palmyra is located in the Finger Lakes region of New York. It is situated on the banks of the Erie Canal and is bordered by the towns of Macedon, Manchester, and Walworth. The town is located about 25 miles east of Rochester and about 50 miles west of Syracuse.
The terrain of Palmyra is mostly flat, with some rolling hills. The town is located in a temperate climate zone and has four distinct seasons. The average annual temperature is around 50 degrees Fahrenheit.
Economy
The economy of Palmyra is largely based on agriculture and tourism. The town is home to several farms, which produce a variety of crops, including apples, grapes, and corn. The town is also home to several wineries, which produce a variety of wines.
Tourism is an important part of the town's economy. The town is home to several historic sites, such as the Joseph Smith Historic Site and the Palmyra Village Historic District. The town also hosts several festivals throughout the year, including the Palmyra Canal Days Festival and the Palmyra Music Festival.
Demographics
As of the 2010 census, the population of Palmyra was 3,074. The racial makeup of the town was 97.2% White, 0.7% African American, 0.3% Native American, 0.3% Asian, 0.1% Pacific Islander, 0.4% from other races, and 1.0% from two or more races. Hispanic or Latino of any race were 1.3% of the population.
The median household income in Palmyra was $45,938, and the median family income was $54,844. The per capita income for the town was $21,945. About 8.2% of families and 10.3% of the population were below the poverty line, including 14.2% of those under age 18 and 5.2% of those age 65 or over.
Common Questions
What is Per Capita Income in Palmyra?
Per Capita income in Palmyra is $54,938.
What is the Median Family Income in Palmyra?
Median Family Income in Palmyra is $90,769.
What is the Median Household income in Palmyra?
Median Household Income in Palmyra is $72,976.
What is Income or Wage Gap in Palmyra?
Income or Wage Gap in Palmyra is 19.1%.
Women in Palmyra earn 80.9 cents for every dollar earned by a man.
What is Inequality or Gini Index in Palmyra?
Inequality or Gini Index in Palmyra is 0.59.
What is the Total Population of Palmyra?
Total Population of Palmyra is 3,326.
What is the Total Male Population of Palmyra?
Total Male Population of Palmyra is 1,732.
What is the Total Female Population of Palmyra?
Total Female Population of Palmyra is 1,594.
What is the Ratio of Males per 100 Females in Palmyra?
There are 108.66 Males per 100 Females in Palmyra.
What is the Ratio of Females per 100 Males in Palmyra?
There are 92.03 Females per 100 Males in Palmyra.
What is the Median Population Age in Palmyra?
Median Population Age in Palmyra is 40.9 Years.
What is the Average Family Size in Palmyra
Average Family Size in Palmyra is 2.7 People.
What is the Average Household Size in Palmyra
Average Household Size in Palmyra is 2.1 People.
How Large is the Labor Force in Palmyra?
There are 1,954 People in the Labor Forcein in Palmyra.
What is the Percentage of People in the Labor Force in Palmyra?
69.4% of People are in the Labor Force in Palmyra.
What is the Unemployment Rate in Palmyra?
Unemployment Rate in Palmyra is 0.5%.