Lake Grove, NY Map & Demographics
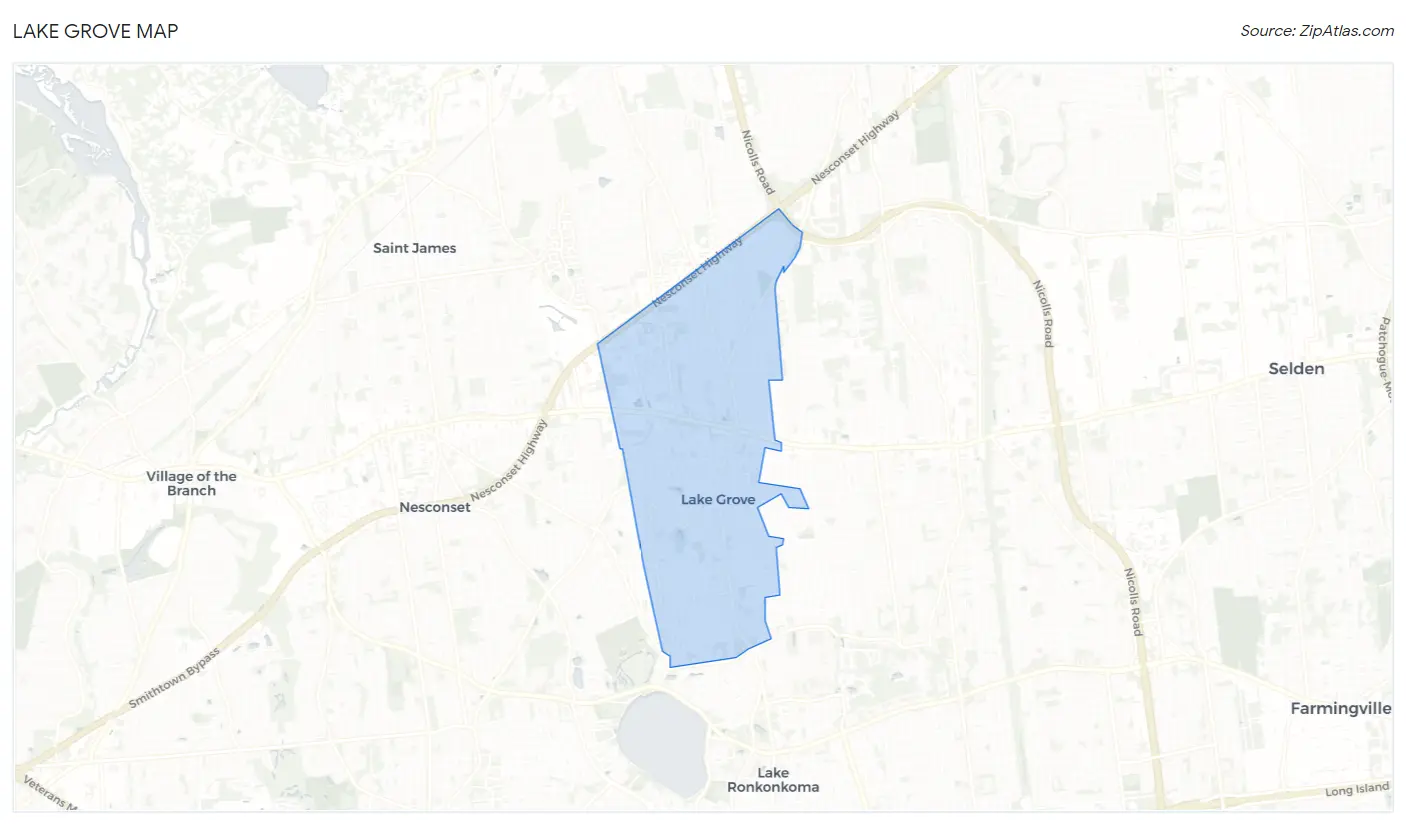
Lake Grove Map
Lake Grove Overview
$49,057
PER CAPITA INCOME
$136,349
AVG FAMILY INCOME
$114,381
AVG HOUSEHOLD INCOME
29.1%
WAGE / INCOME GAP [ % ]
70.9¢/ $1
WAGE / INCOME GAP [ $ ]
0.42
INEQUALITY / GINI INDEX
11,066
TOTAL POPULATION
5,868
MALE POPULATION
5,198
FEMALE POPULATION
112.89
MALES / 100 FEMALES
88.58
FEMALES / 100 MALES
40.6
MEDIAN AGE
3.5
AVG FAMILY SIZE
2.9
AVG HOUSEHOLD SIZE
5,819
LABOR FORCE [ PEOPLE ]
65.3%
PERCENT IN LABOR FORCE
5.2%
UNEMPLOYMENT RATE
Lake Grove Zip Codes
Lake Grove Area Codes
Income in Lake Grove
Income Overview in Lake Grove
Per Capita Income in Lake Grove is $49,057, while median incomes of families and households are $136,349 and $114,381 respectively.
| Characteristic | Number | Measure |
| Per Capita Income | 11,066 | $49,057 |
| Median Family Income | 2,743 | $136,349 |
| Mean Family Income | 2,743 | $159,403 |
| Median Household Income | 3,754 | $114,381 |
| Mean Household Income | 3,754 | $140,166 |
| Income Deficit | 2,743 | $0 |
| Wage / Income Gap (%) | 11,066 | 29.08% |
| Wage / Income Gap ($) | 11,066 | 70.92¢ per $1 |
| Gini / Inequality Index | 11,066 | 0.42 |
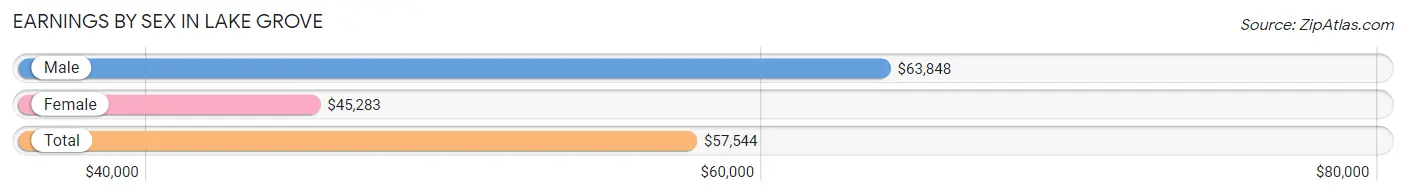
Earnings by Sex in Lake Grove
Average Earnings in Lake Grove are $57,544, $63,848 for men and $45,283 for women, a difference of 29.1%.
| Sex | Number | Average Earnings |
| Male | 3,392 (55.5%) | $63,848 |
| Female | 2,717 (44.5%) | $45,283 |
| Total | 6,109 (100.0%) | $57,544 |
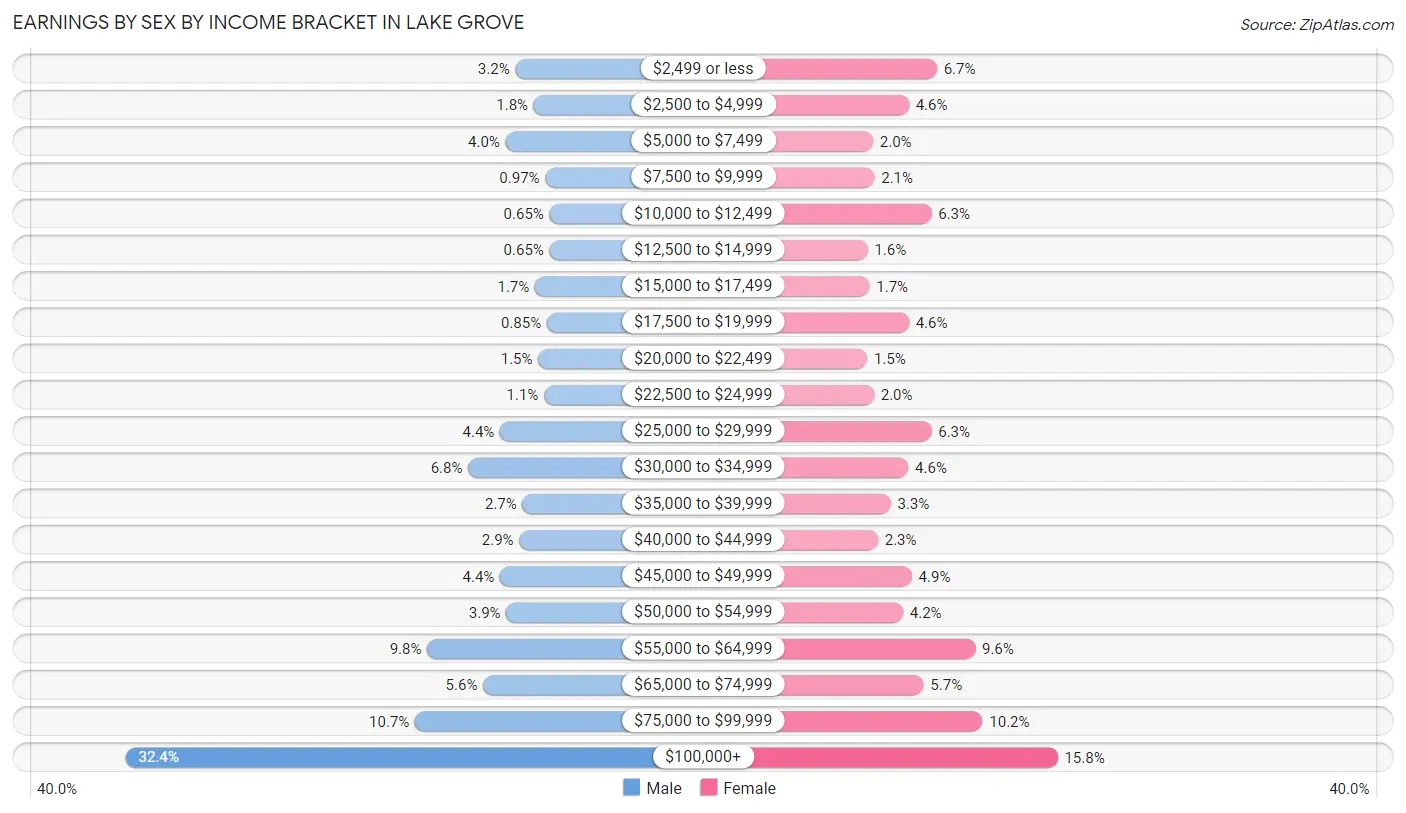
Earnings by Sex by Income Bracket in Lake Grove
The most common earnings brackets in Lake Grove are $100,000+ for men (1,100 | 32.4%) and $100,000+ for women (429 | 15.8%).
| Income | Male | Female |
| $2,499 or less | 109 (3.2%) | 183 (6.7%) |
| $2,500 to $4,999 | 62 (1.8%) | 126 (4.6%) |
| $5,000 to $7,499 | 134 (4.0%) | 53 (1.9%) |
| $7,500 to $9,999 | 33 (1.0%) | 56 (2.1%) |
| $10,000 to $12,499 | 22 (0.6%) | 172 (6.3%) |
| $12,500 to $14,999 | 22 (0.6%) | 42 (1.5%) |
| $15,000 to $17,499 | 59 (1.7%) | 46 (1.7%) |
| $17,500 to $19,999 | 29 (0.9%) | 126 (4.6%) |
| $20,000 to $22,499 | 51 (1.5%) | 41 (1.5%) |
| $22,500 to $24,999 | 36 (1.1%) | 55 (2.0%) |
| $25,000 to $29,999 | 148 (4.4%) | 172 (6.3%) |
| $30,000 to $34,999 | 229 (6.8%) | 125 (4.6%) |
| $35,000 to $39,999 | 91 (2.7%) | 89 (3.3%) |
| $40,000 to $44,999 | 99 (2.9%) | 63 (2.3%) |
| $45,000 to $49,999 | 148 (4.4%) | 132 (4.9%) |
| $50,000 to $54,999 | 132 (3.9%) | 114 (4.2%) |
| $55,000 to $64,999 | 333 (9.8%) | 261 (9.6%) |
| $65,000 to $74,999 | 191 (5.6%) | 156 (5.7%) |
| $75,000 to $99,999 | 364 (10.7%) | 276 (10.2%) |
| $100,000+ | 1,100 (32.4%) | 429 (15.8%) |
| Total | 3,392 (100.0%) | 2,717 (100.0%) |
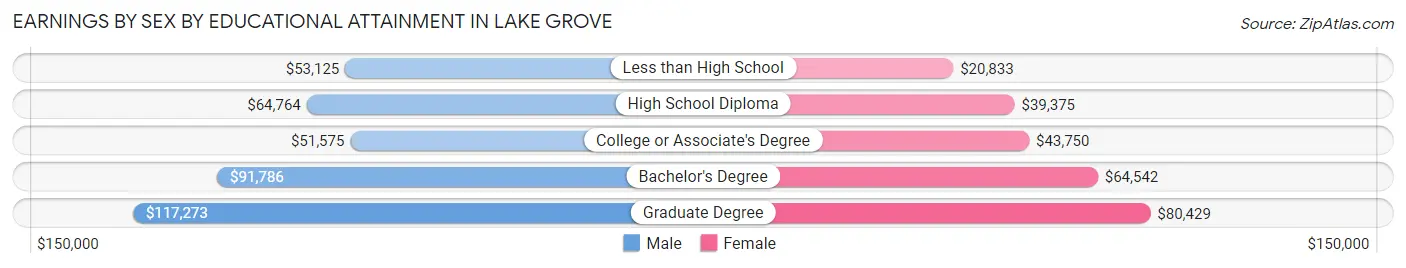
Earnings by Sex by Educational Attainment in Lake Grove
Average earnings in Lake Grove are $72,561 for men and $55,000 for women, a difference of 24.2%. Men with an educational attainment of graduate degree enjoy the highest average annual earnings of $117,273, while those with college or associate's degree education earn the least with $51,575. Women with an educational attainment of graduate degree earn the most with the average annual earnings of $80,429, while those with less than high school education have the smallest earnings of $20,833.
| Educational Attainment | Male Income | Female Income |
| Less than High School | $53,125 | $20,833 |
| High School Diploma | $64,764 | $39,375 |
| College or Associate's Degree | $51,575 | $43,750 |
| Bachelor's Degree | $91,786 | $64,542 |
| Graduate Degree | $117,273 | $80,429 |
| Total | $72,561 | $55,000 |
Family Income in Lake Grove
Family Income Brackets in Lake Grove
According to the Lake Grove family income data, there are 831 families falling into the $200,000+ income range, which is the most common income bracket and makes up 30.3% of all families. Conversely, the $10,000 to $14,999 income bracket is the least frequent group with only 5 families (0.2%) belonging to this category.
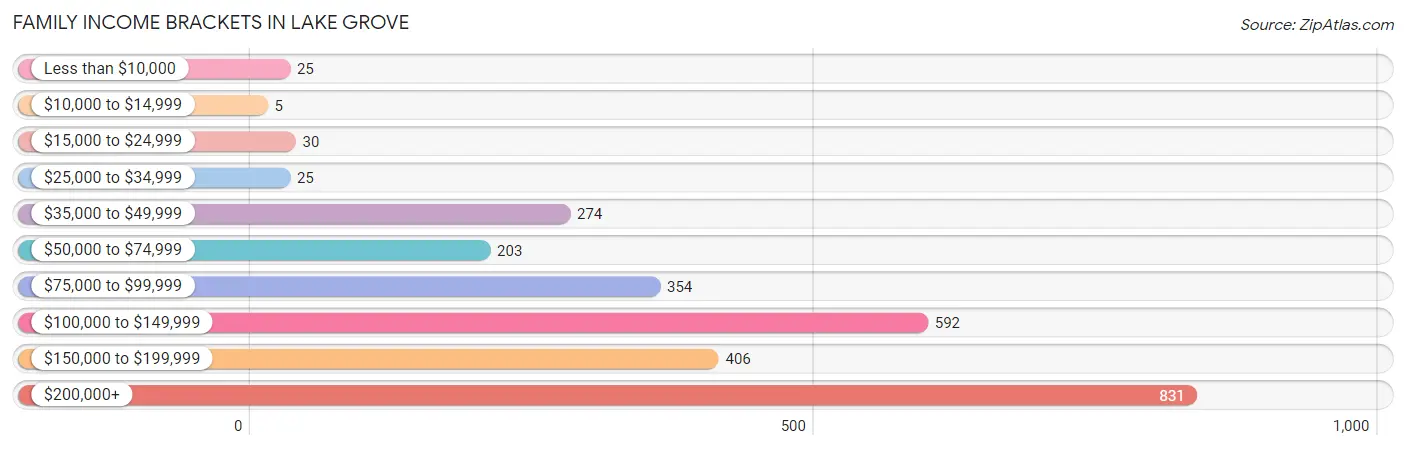
| Income Bracket | # Families | % Families |
| Less than $10,000 | 25 | 0.9% |
| $10,000 to $14,999 | 5 | 0.2% |
| $15,000 to $24,999 | 30 | 1.1% |
| $25,000 to $34,999 | 25 | 0.9% |
| $35,000 to $49,999 | 274 | 10.0% |
| $50,000 to $74,999 | 203 | 7.4% |
| $75,000 to $99,999 | 354 | 12.9% |
| $100,000 to $149,999 | 592 | 21.6% |
| $150,000 to $199,999 | 406 | 14.8% |
| $200,000+ | 831 | 30.3% |
Family Income by Famaliy Size in Lake Grove
7+ person families (17 | 0.6%) account for the highest median family income in Lake Grove with $250,001 per family, while 3-person families (566 | 20.6%) have the highest median income of $53,611 per family member.
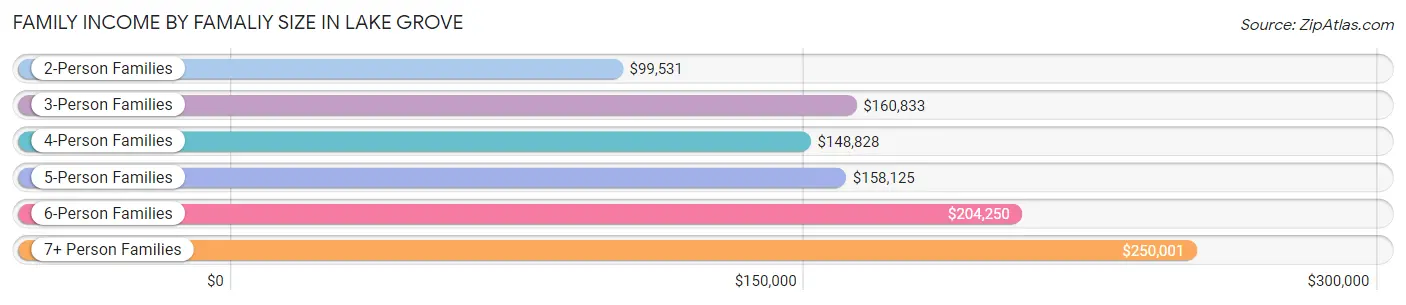
| Income Bracket | # Families | Median Income |
| 2-Person Families | 919 (33.5%) | $99,531 |
| 3-Person Families | 566 (20.6%) | $160,833 |
| 4-Person Families | 795 (29.0%) | $148,828 |
| 5-Person Families | 327 (11.9%) | $158,125 |
| 6-Person Families | 119 (4.3%) | $204,250 |
| 7+ Person Families | 17 (0.6%) | $250,001 |
| Total | 2,743 (100.0%) | $136,349 |
Family Income by Number of Earners in Lake Grove
The median family income in Lake Grove is $136,349, with families comprising 3+ earners (543) having the highest median family income of $210,142, while families with no earners (273) have the lowest median family income of $80,319, accounting for 19.8% and 10.0% of families, respectively.
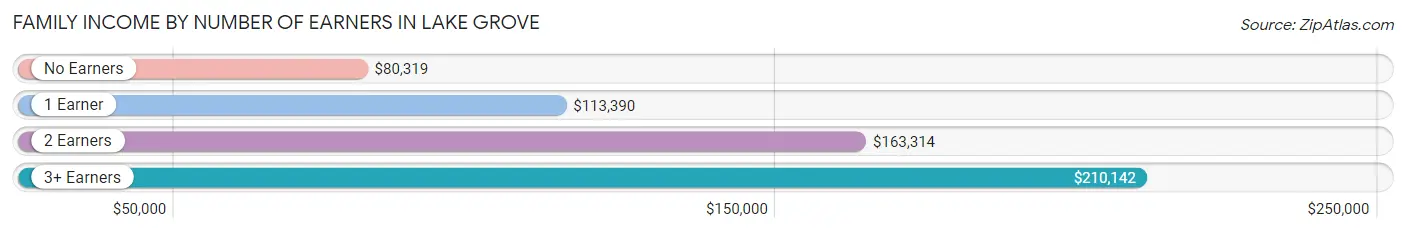
| Number of Earners | # Families | Median Income |
| No Earners | 273 (10.0%) | $80,319 |
| 1 Earner | 725 (26.4%) | $113,390 |
| 2 Earners | 1,202 (43.8%) | $163,314 |
| 3+ Earners | 543 (19.8%) | $210,142 |
| Total | 2,743 (100.0%) | $136,349 |
Household Income in Lake Grove
Household Income Brackets in Lake Grove
With 920 households falling in the category, the $200,000+ income range is the most frequent in Lake Grove, accounting for 24.5% of all households. In contrast, only 68 households (1.8%) fall into the $15,000 to $24,999 income bracket, making it the least populous group.
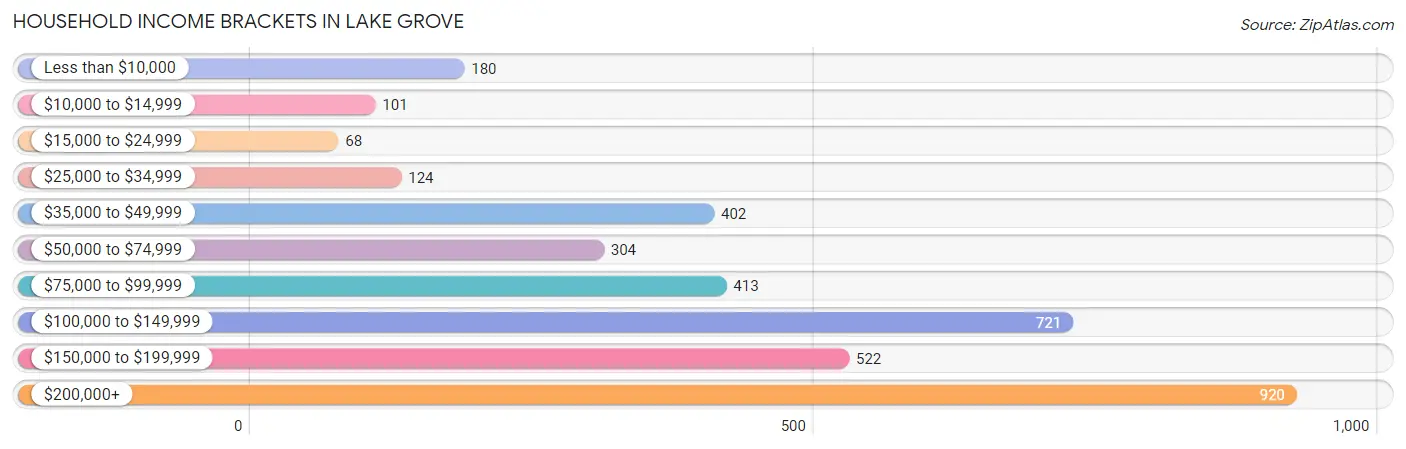
| Income Bracket | # Households | % Households |
| Less than $10,000 | 180 | 4.8% |
| $10,000 to $14,999 | 101 | 2.7% |
| $15,000 to $24,999 | 68 | 1.8% |
| $25,000 to $34,999 | 124 | 3.3% |
| $35,000 to $49,999 | 402 | 10.7% |
| $50,000 to $74,999 | 304 | 8.1% |
| $75,000 to $99,999 | 413 | 11.0% |
| $100,000 to $149,999 | 721 | 19.2% |
| $150,000 to $199,999 | 522 | 13.9% |
| $200,000+ | 920 | 24.5% |
Household Income by Householder Age in Lake Grove
The median household income in Lake Grove is $114,381, with the highest median household income of $144,115 found in the 25 to 44 years age bracket for the primary householder. A total of 951 households (25.3%) fall into this category. Meanwhile, the 15 to 24 years age bracket for the primary householder has the lowest median household income of $0, with 64 households (1.7%) in this group.
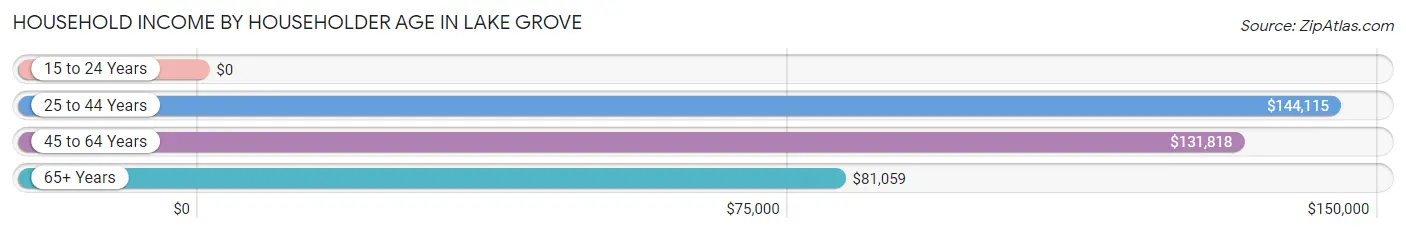
| Income Bracket | # Households | Median Income |
| 15 to 24 Years | 64 (1.7%) | $0 |
| 25 to 44 Years | 951 (25.3%) | $144,115 |
| 45 to 64 Years | 1,810 (48.2%) | $131,818 |
| 65+ Years | 929 (24.7%) | $81,059 |
| Total | 3,754 (100.0%) | $114,381 |
Poverty in Lake Grove
Income Below Poverty by Sex and Age in Lake Grove
With 5.0% poverty level for males and 6.4% for females among the residents of Lake Grove, 55 to 64 year old males and 18 to 24 year old females are the most vulnerable to poverty, with 131 males (12.8%) and 161 females (25.6%) in their respective age groups living below the poverty level.
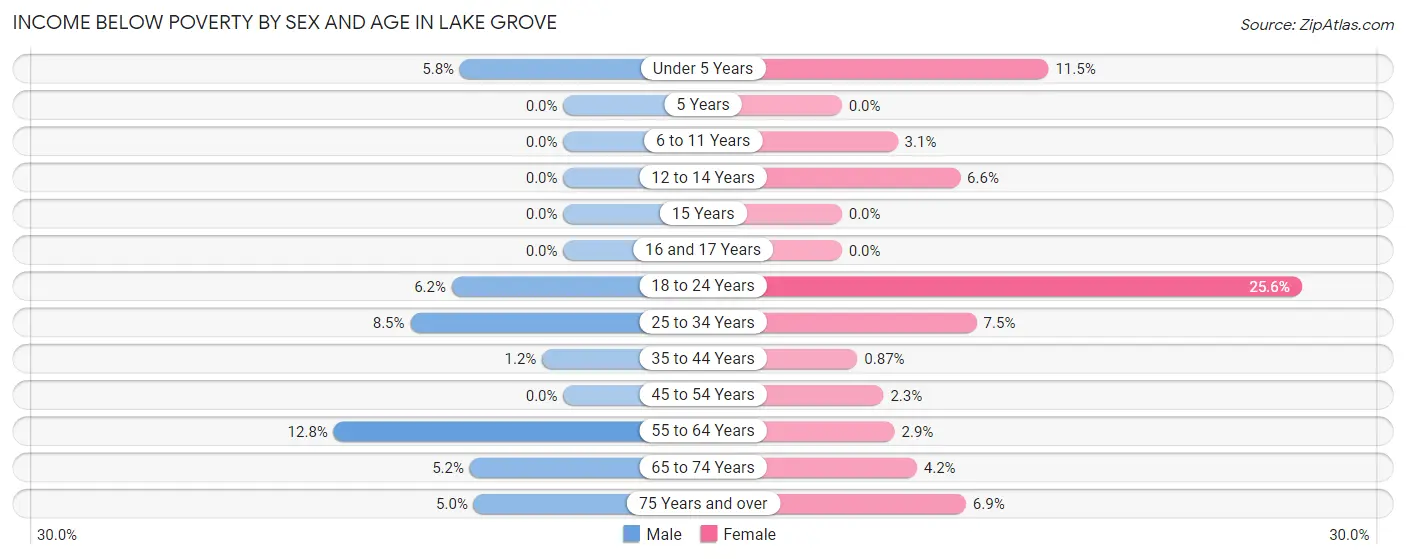
| Age Bracket | Male | Female |
| Under 5 Years | 17 (5.8%) | 16 (11.5%) |
| 5 Years | 0 (0.0%) | 0 (0.0%) |
| 6 to 11 Years | 0 (0.0%) | 12 (3.1%) |
| 12 to 14 Years | 0 (0.0%) | 12 (6.6%) |
| 15 Years | 0 (0.0%) | 0 (0.0%) |
| 16 and 17 Years | 0 (0.0%) | 0 (0.0%) |
| 18 to 24 Years | 29 (6.2%) | 161 (25.6%) |
| 25 to 34 Years | 72 (8.5%) | 37 (7.5%) |
| 35 to 44 Years | 7 (1.2%) | 5 (0.9%) |
| 45 to 54 Years | 0 (0.0%) | 21 (2.3%) |
| 55 to 64 Years | 131 (12.8%) | 21 (2.9%) |
| 65 to 74 Years | 19 (5.2%) | 20 (4.2%) |
| 75 Years and over | 17 (5.0%) | 27 (6.9%) |
| Total | 292 (5.0%) | 332 (6.4%) |
Income Above Poverty by Sex and Age in Lake Grove
According to the poverty statistics in Lake Grove, males aged 5 years and females aged 5 years are the age groups that are most secure financially, with 100.0% of males and 100.0% of females in these age groups living above the poverty line.
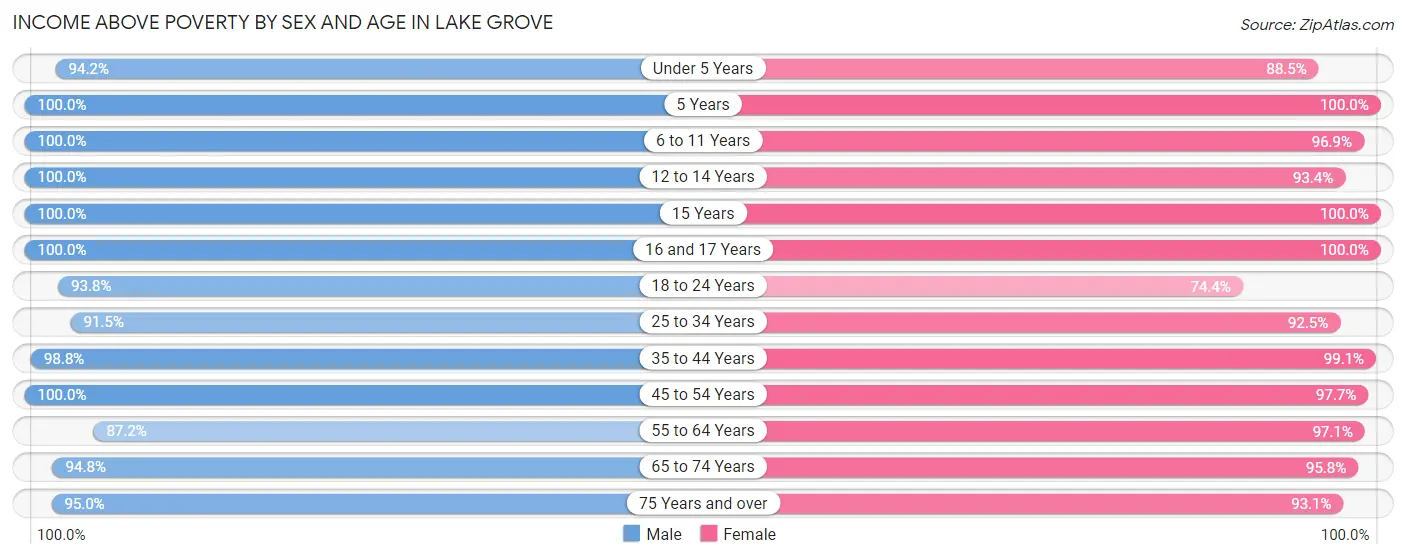
| Age Bracket | Male | Female |
| Under 5 Years | 278 (94.2%) | 123 (88.5%) |
| 5 Years | 74 (100.0%) | 27 (100.0%) |
| 6 to 11 Years | 656 (100.0%) | 374 (96.9%) |
| 12 to 14 Years | 259 (100.0%) | 170 (93.4%) |
| 15 Years | 19 (100.0%) | 118 (100.0%) |
| 16 and 17 Years | 170 (100.0%) | 145 (100.0%) |
| 18 to 24 Years | 438 (93.8%) | 468 (74.4%) |
| 25 to 34 Years | 773 (91.5%) | 456 (92.5%) |
| 35 to 44 Years | 584 (98.8%) | 572 (99.1%) |
| 45 to 54 Years | 754 (100.0%) | 883 (97.7%) |
| 55 to 64 Years | 893 (87.2%) | 693 (97.1%) |
| 65 to 74 Years | 346 (94.8%) | 458 (95.8%) |
| 75 Years and over | 324 (95.0%) | 364 (93.1%) |
| Total | 5,568 (95.0%) | 4,851 (93.6%) |
Income Below Poverty Among Married-Couple Families in Lake Grove
The poverty statistics for married-couple families in Lake Grove show that 1.8% or 40 of the total 2,206 families live below the poverty line. Families with 1 or 2 children have the highest poverty rate of 3.6%, comprising of 31 families. On the other hand, families with 3 or 4 children have the lowest poverty rate of 0.0%, which includes 0 families.
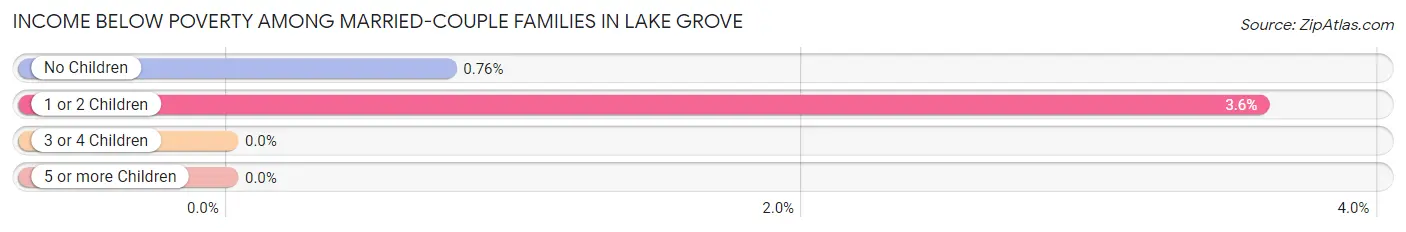
| Children | Above Poverty | Below Poverty |
| No Children | 1,183 (99.2%) | 9 (0.8%) |
| 1 or 2 Children | 832 (96.4%) | 31 (3.6%) |
| 3 or 4 Children | 141 (100.0%) | 0 (0.0%) |
| 5 or more Children | 10 (100.0%) | 0 (0.0%) |
| Total | 2,166 (98.2%) | 40 (1.8%) |
Income Below Poverty Among Single-Parent Households in Lake Grove
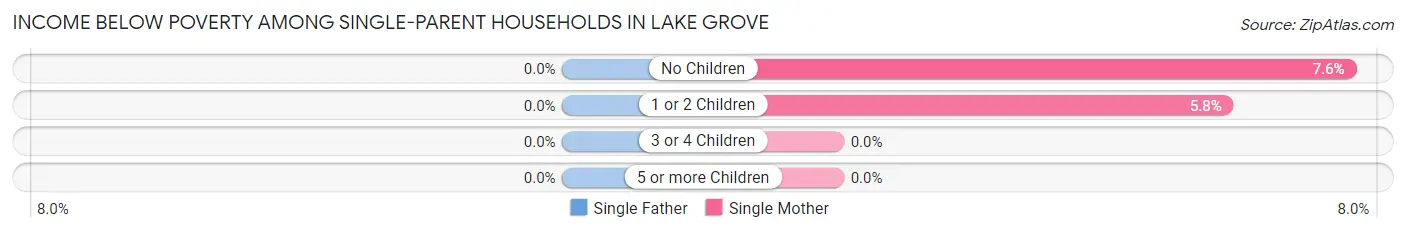
| Children | Single Father | Single Mother |
| No Children | 0 (0.0%) | 12 (7.6%) |
| 1 or 2 Children | 0 (0.0%) | 5 (5.8%) |
| 3 or 4 Children | 0 (0.0%) | 0 (0.0%) |
| 5 or more Children | 0 (0.0%) | 0 (0.0%) |
| Total | 0 (0.0%) | 17 (5.3%) |
Income Below Poverty Among Married-Couple vs Single-Parent Households in Lake Grove
The poverty data for Lake Grove shows that 40 of the married-couple family households (1.8%) and 17 of the single-parent households (3.2%) are living below the poverty level. Within the married-couple family households, those with 1 or 2 children have the highest poverty rate, with 31 households (3.6%) falling below the poverty line. Among the single-parent households, those with 1 or 2 children have the highest poverty rate, with 5 household (5.1%) living below poverty.
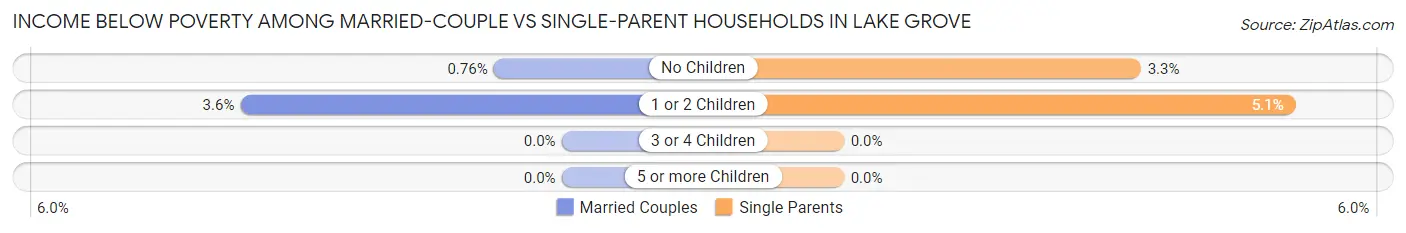
| Children | Married-Couple Families | Single-Parent Households |
| No Children | 9 (0.8%) | 12 (3.3%) |
| 1 or 2 Children | 31 (3.6%) | 5 (5.1%) |
| 3 or 4 Children | 0 (0.0%) | 0 (0.0%) |
| 5 or more Children | 0 (0.0%) | 0 (0.0%) |
| Total | 40 (1.8%) | 17 (3.2%) |
Race in Lake Grove
The most populous races in Lake Grove are White / Caucasian (8,657 | 78.2%), Hispanic or Latino (1,511 | 13.7%), and Asian (1,074 | 9.7%).
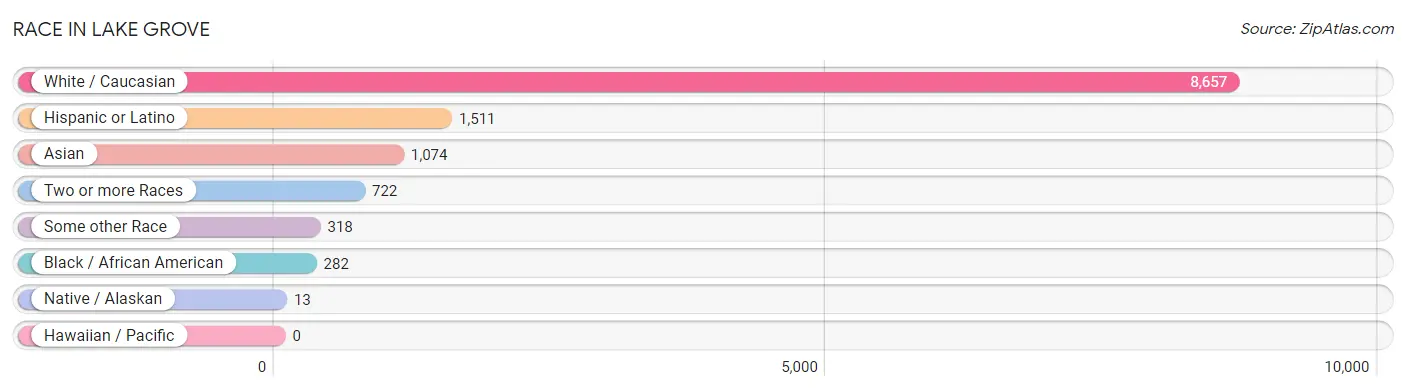
| Race | # Population | % Population |
| Asian | 1,074 | 9.7% |
| Black / African American | 282 | 2.5% |
| Hawaiian / Pacific | 0 | 0.0% |
| Hispanic or Latino | 1,511 | 13.7% |
| Native / Alaskan | 13 | 0.1% |
| White / Caucasian | 8,657 | 78.2% |
| Two or more Races | 722 | 6.5% |
| Some other Race | 318 | 2.9% |
| Total | 11,066 | 100.0% |
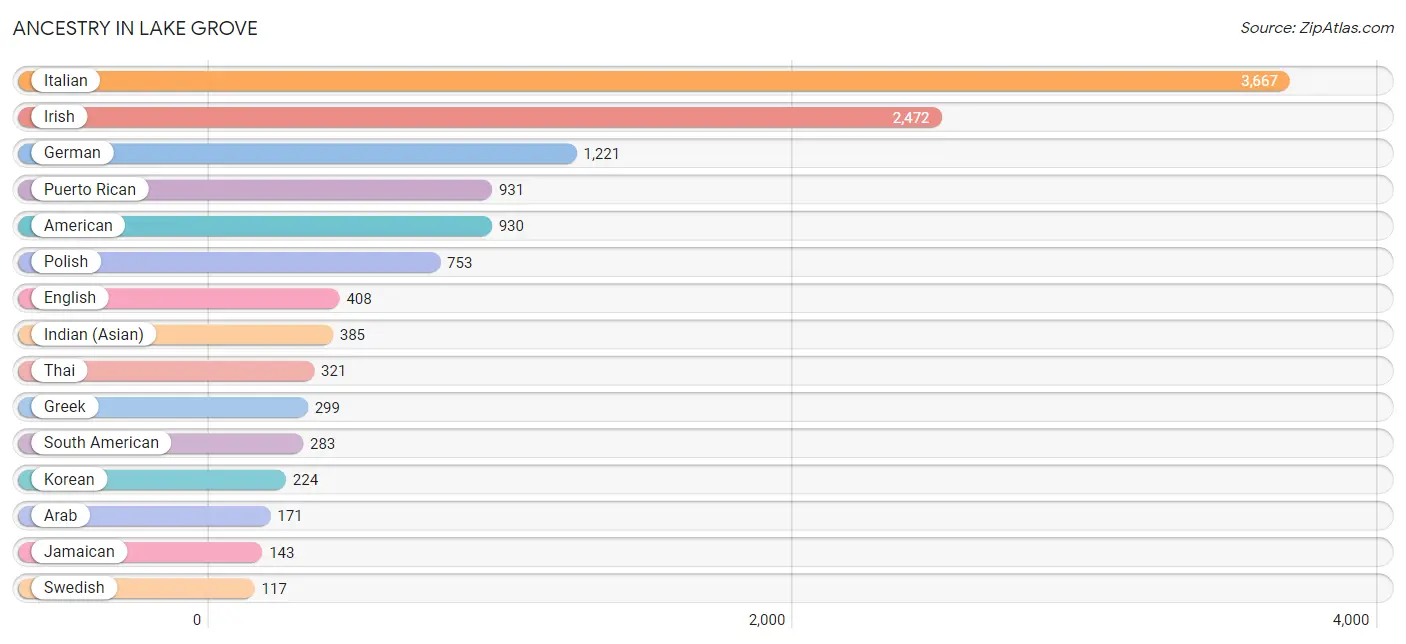
Ancestry in Lake Grove
The most populous ancestries reported in Lake Grove are Italian (3,667 | 33.1%), Irish (2,472 | 22.3%), German (1,221 | 11.0%), Puerto Rican (931 | 8.4%), and American (930 | 8.4%), together accounting for 83.3% of all Lake Grove residents.
| Ancestry | # Population | % Population |
| American | 930 | 8.4% |
| Arab | 171 | 1.5% |
| Argentinean | 73 | 0.7% |
| Armenian | 32 | 0.3% |
| Australian | 7 | 0.1% |
| Austrian | 37 | 0.3% |
| Blackfeet | 17 | 0.2% |
| British | 9 | 0.1% |
| Burmese | 42 | 0.4% |
| Canadian | 10 | 0.1% |
| Central American | 86 | 0.8% |
| Central American Indian | 13 | 0.1% |
| Cherokee | 29 | 0.3% |
| Chilean | 34 | 0.3% |
| Chippewa | 25 | 0.2% |
| Choctaw | 11 | 0.1% |
| Colombian | 19 | 0.2% |
| Creek | 11 | 0.1% |
| Croatian | 23 | 0.2% |
| Cuban | 19 | 0.2% |
| Czech | 35 | 0.3% |
| Czechoslovakian | 31 | 0.3% |
| Danish | 40 | 0.4% |
| Dominican | 41 | 0.4% |
| Dutch | 8 | 0.1% |
| Eastern European | 13 | 0.1% |
| Ecuadorian | 70 | 0.6% |
| Egyptian | 113 | 1.0% |
| English | 408 | 3.7% |
| European | 66 | 0.6% |
| Finnish | 11 | 0.1% |
| French | 51 | 0.5% |
| French Canadian | 22 | 0.2% |
| German | 1,221 | 11.0% |
| Greek | 299 | 2.7% |
| Guatemalan | 38 | 0.3% |
| Haitian | 34 | 0.3% |
| Hungarian | 93 | 0.8% |
| Indian (Asian) | 385 | 3.5% |
| Iranian | 38 | 0.3% |
| Irish | 2,472 | 22.3% |
| Italian | 3,667 | 33.1% |
| Jamaican | 143 | 1.3% |
| Korean | 224 | 2.0% |
| Lithuanian | 6 | 0.1% |
| Luxembourger | 4 | 0.0% |
| Maltese | 7 | 0.1% |
| Mexican | 112 | 1.0% |
| Nigerian | 43 | 0.4% |
| Norwegian | 71 | 0.6% |
| Peruvian | 5 | 0.1% |
| Polish | 753 | 6.8% |
| Puerto Rican | 931 | 8.4% |
| Romanian | 71 | 0.6% |
| Russian | 96 | 0.9% |
| Salvadoran | 48 | 0.4% |
| Scotch-Irish | 8 | 0.1% |
| Scottish | 77 | 0.7% |
| Slovak | 12 | 0.1% |
| South American | 283 | 2.6% |
| Spanish | 31 | 0.3% |
| Sri Lankan | 18 | 0.2% |
| Subsaharan African | 43 | 0.4% |
| Swedish | 117 | 1.1% |
| Swiss | 13 | 0.1% |
| Thai | 321 | 2.9% |
| Turkish | 21 | 0.2% |
| Ukrainian | 30 | 0.3% |
| Uruguayan | 36 | 0.3% |
| Venezuelan | 13 | 0.1% |
| Welsh | 25 | 0.2% |
| West Indian | 15 | 0.1% |
| Yugoslavian | 13 | 0.1% | View All 73 Rows |
Immigrants in Lake Grove
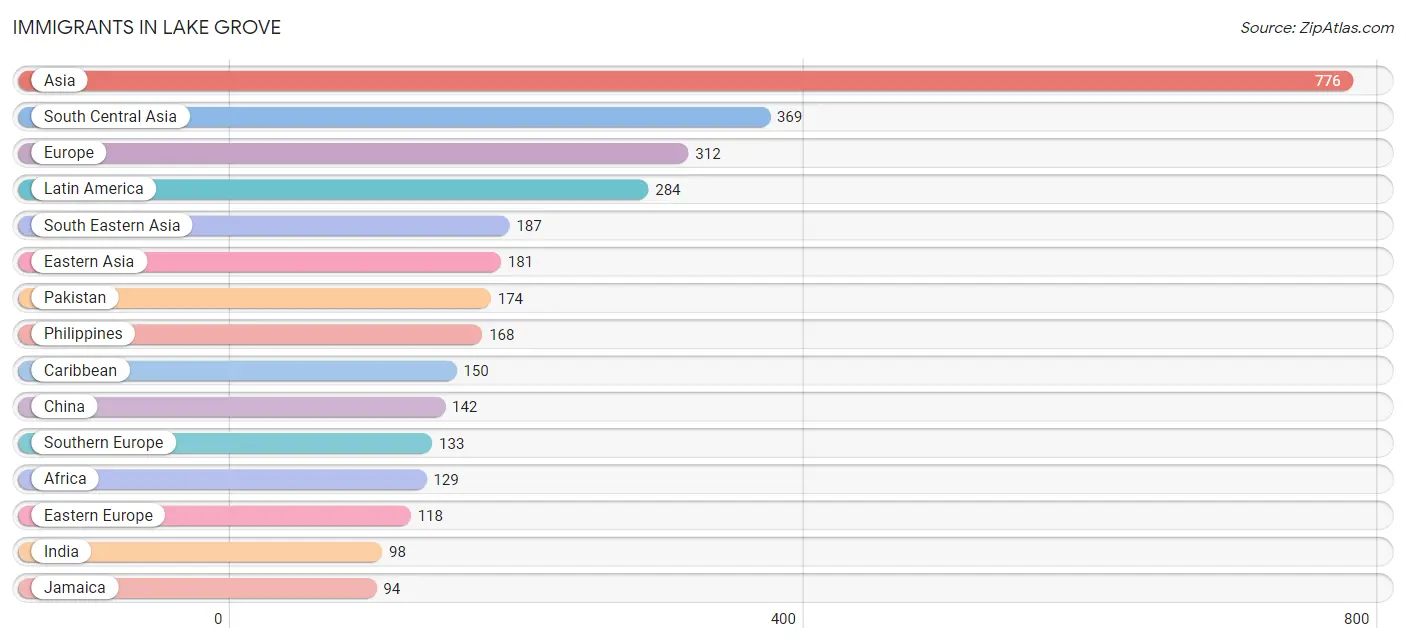
The most numerous immigrant groups reported in Lake Grove came from Asia (776 | 7.0%), South Central Asia (369 | 3.3%), Europe (312 | 2.8%), Latin America (284 | 2.6%), and South Eastern Asia (187 | 1.7%), together accounting for 17.4% of all Lake Grove residents.
| Immigration Origin | # Population | % Population |
| Africa | 129 | 1.2% |
| Argentina | 21 | 0.2% |
| Asia | 776 | 7.0% |
| Bangladesh | 92 | 0.8% |
| Bulgaria | 18 | 0.2% |
| Caribbean | 150 | 1.4% |
| Central America | 44 | 0.4% |
| China | 142 | 1.3% |
| Colombia | 8 | 0.1% |
| Dominican Republic | 49 | 0.4% |
| Eastern Africa | 6 | 0.1% |
| Eastern Asia | 181 | 1.6% |
| Eastern Europe | 118 | 1.1% |
| Ecuador | 38 | 0.3% |
| Egypt | 87 | 0.8% |
| Europe | 312 | 2.8% |
| France | 4 | 0.0% |
| Germany | 30 | 0.3% |
| Greece | 74 | 0.7% |
| Hong Kong | 19 | 0.2% |
| India | 98 | 0.9% |
| Italy | 59 | 0.5% |
| Jamaica | 94 | 0.9% |
| Jordan | 12 | 0.1% |
| Korea | 39 | 0.4% |
| Kuwait | 13 | 0.1% |
| Latin America | 284 | 2.6% |
| Malaysia | 7 | 0.1% |
| Mexico | 44 | 0.4% |
| Nepal | 5 | 0.1% |
| Nigeria | 30 | 0.3% |
| Northern Africa | 93 | 0.8% |
| Northern Europe | 23 | 0.2% |
| Norway | 5 | 0.1% |
| Pakistan | 174 | 1.6% |
| Philippines | 168 | 1.5% |
| Poland | 12 | 0.1% |
| Romania | 50 | 0.4% |
| Russia | 23 | 0.2% |
| South America | 90 | 0.8% |
| South Central Asia | 369 | 3.3% |
| South Eastern Asia | 187 | 1.7% |
| Southern Europe | 133 | 1.2% |
| St. Vincent and the Grenadines | 7 | 0.1% |
| Turkey | 7 | 0.1% |
| Uruguay | 10 | 0.1% |
| Venezuela | 13 | 0.1% |
| Vietnam | 12 | 0.1% |
| Western Africa | 30 | 0.3% |
| Western Asia | 39 | 0.4% |
| Western Europe | 38 | 0.3% | View All 51 Rows |
Sex and Age in Lake Grove
Sex and Age in Lake Grove
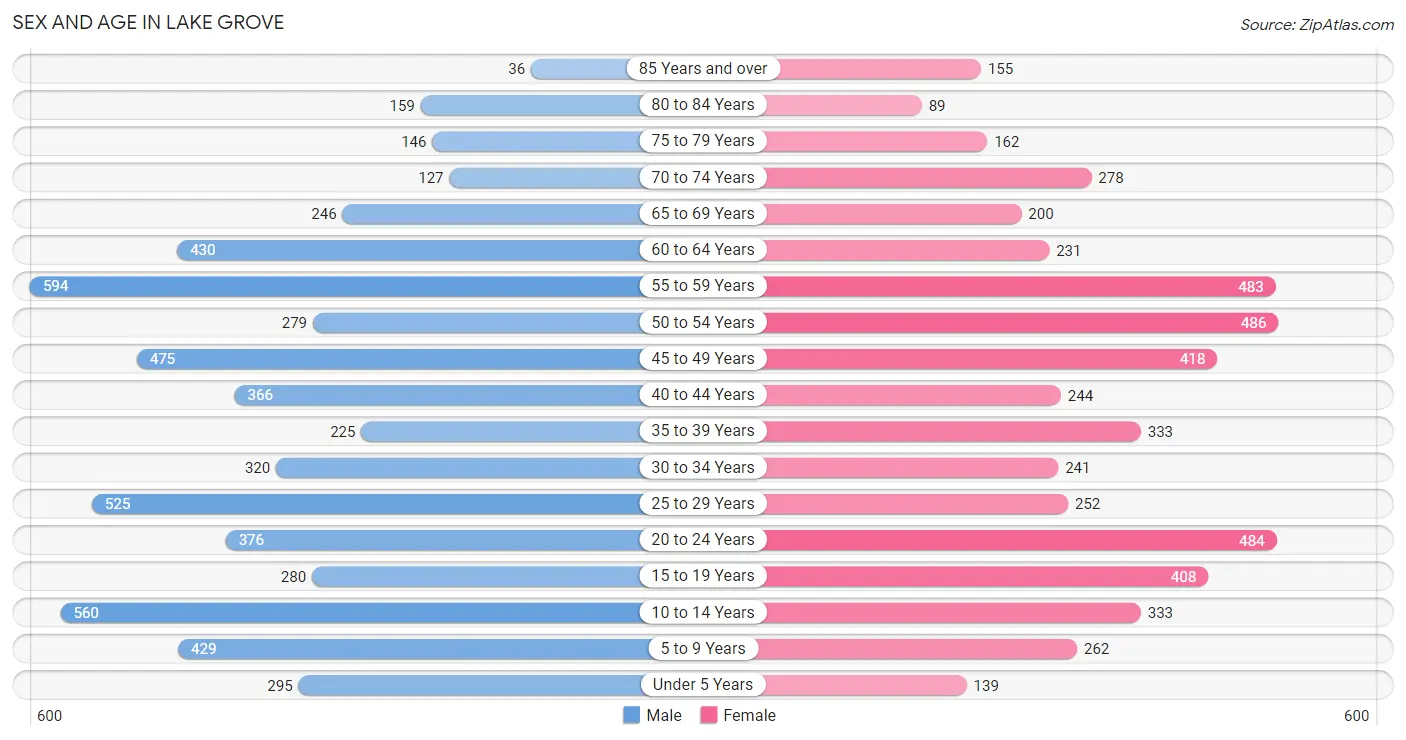
The most populous age groups in Lake Grove are 55 to 59 Years (594 | 10.1%) for men and 50 to 54 Years (486 | 9.3%) for women.
| Age Bracket | Male | Female |
| Under 5 Years | 295 (5.0%) | 139 (2.7%) |
| 5 to 9 Years | 429 (7.3%) | 262 (5.0%) |
| 10 to 14 Years | 560 (9.5%) | 333 (6.4%) |
| 15 to 19 Years | 280 (4.8%) | 408 (7.9%) |
| 20 to 24 Years | 376 (6.4%) | 484 (9.3%) |
| 25 to 29 Years | 525 (8.9%) | 252 (4.9%) |
| 30 to 34 Years | 320 (5.4%) | 241 (4.6%) |
| 35 to 39 Years | 225 (3.8%) | 333 (6.4%) |
| 40 to 44 Years | 366 (6.2%) | 244 (4.7%) |
| 45 to 49 Years | 475 (8.1%) | 418 (8.0%) |
| 50 to 54 Years | 279 (4.8%) | 486 (9.3%) |
| 55 to 59 Years | 594 (10.1%) | 483 (9.3%) |
| 60 to 64 Years | 430 (7.3%) | 231 (4.4%) |
| 65 to 69 Years | 246 (4.2%) | 200 (3.8%) |
| 70 to 74 Years | 127 (2.2%) | 278 (5.3%) |
| 75 to 79 Years | 146 (2.5%) | 162 (3.1%) |
| 80 to 84 Years | 159 (2.7%) | 89 (1.7%) |
| 85 Years and over | 36 (0.6%) | 155 (3.0%) |
| Total | 5,868 (100.0%) | 5,198 (100.0%) |
Families and Households in Lake Grove
Median Family Size in Lake Grove
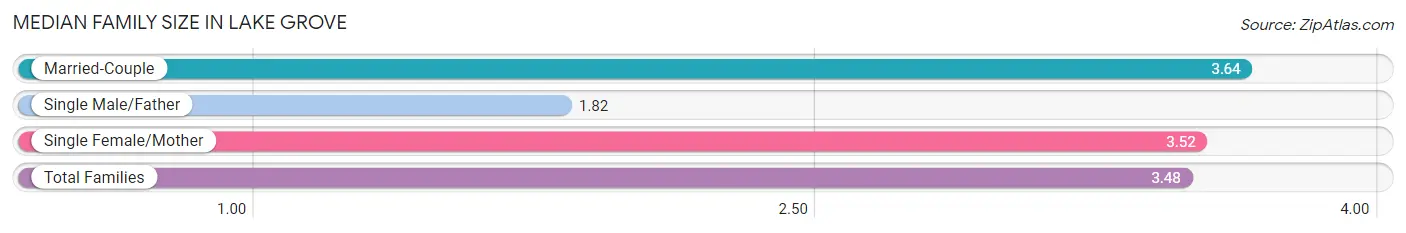
The median family size in Lake Grove is 3.48 persons per family, with married-couple families (2,206 | 80.4%) accounting for the largest median family size of 3.64 persons per family. On the other hand, single male/father families (217 | 7.9%) represent the smallest median family size with 1.82 persons per family.
| Family Type | # Families | Family Size |
| Married-Couple | 2,206 (80.4%) | 3.64 |
| Single Male/Father | 217 (7.9%) | 1.82 |
| Single Female/Mother | 320 (11.7%) | 3.52 |
| Total Families | 2,743 (100.0%) | 3.48 |
Median Household Size in Lake Grove
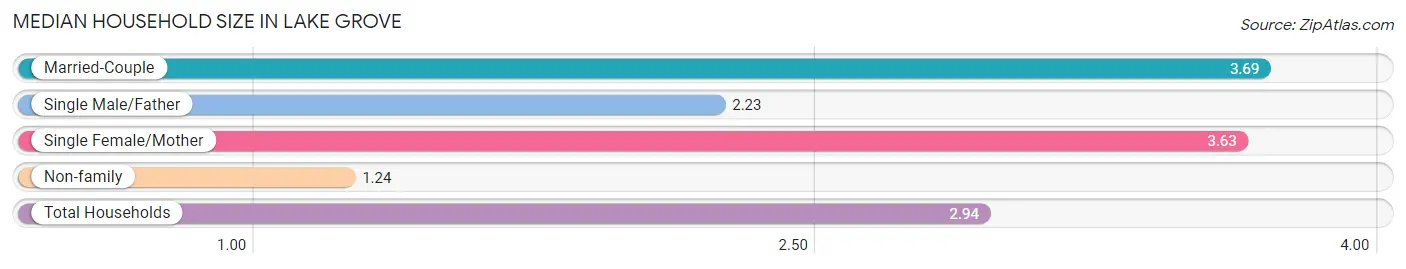
The median household size in Lake Grove is 2.94 persons per household, with married-couple households (2,206 | 58.8%) accounting for the largest median household size of 3.69 persons per household. non-family households (1,011 | 26.9%) represent the smallest median household size with 1.24 persons per household.
| Household Type | # Households | Household Size |
| Married-Couple | 2,206 (58.8%) | 3.69 |
| Single Male/Father | 217 (5.8%) | 2.23 |
| Single Female/Mother | 320 (8.5%) | 3.63 |
| Non-family | 1,011 (26.9%) | 1.24 |
| Total Households | 3,754 (100.0%) | 2.94 |
Household Size by Marriage Status in Lake Grove
Out of a total of 3,754 households in Lake Grove, 2,743 (73.1%) are family households, while 1,011 (26.9%) are nonfamily households. The most numerous type of family households are 4-person households, comprising 803, and the most common type of nonfamily households are 1-person households, comprising 839.
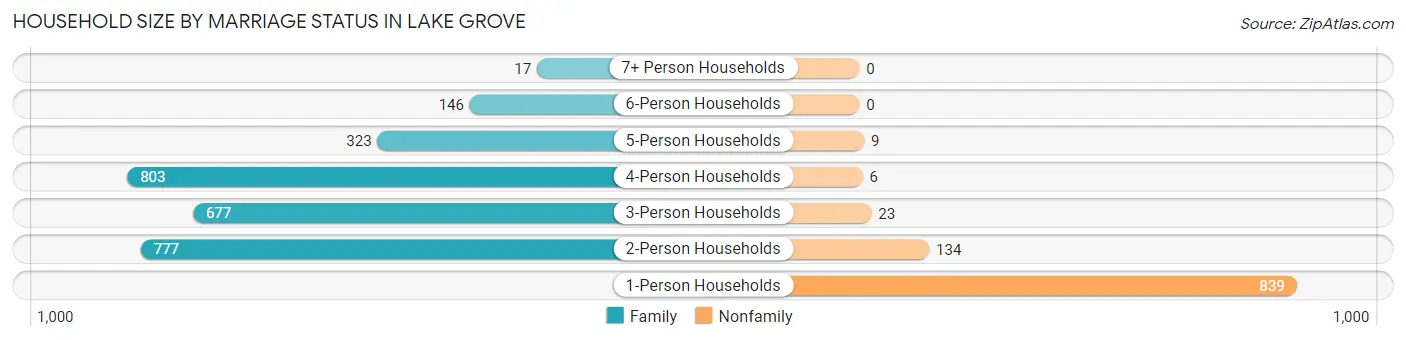
| Household Size | Family Households | Nonfamily Households |
| 1-Person Households | - | 839 (22.4%) |
| 2-Person Households | 777 (20.7%) | 134 (3.6%) |
| 3-Person Households | 677 (18.0%) | 23 (0.6%) |
| 4-Person Households | 803 (21.4%) | 6 (0.2%) |
| 5-Person Households | 323 (8.6%) | 9 (0.2%) |
| 6-Person Households | 146 (3.9%) | 0 (0.0%) |
| 7+ Person Households | 17 (0.4%) | 0 (0.0%) |
| Total | 2,743 (73.1%) | 1,011 (26.9%) |
Female Fertility in Lake Grove
Fertility by Age in Lake Grove
Average fertility rate in Lake Grove is 34.0 births per 1,000 women. Women in the age bracket of 20 to 34 years have the highest fertility rate with 43.0 births per 1,000 women. Women in the age bracket of 20 to 34 years acount for 50.6% of all women with births.
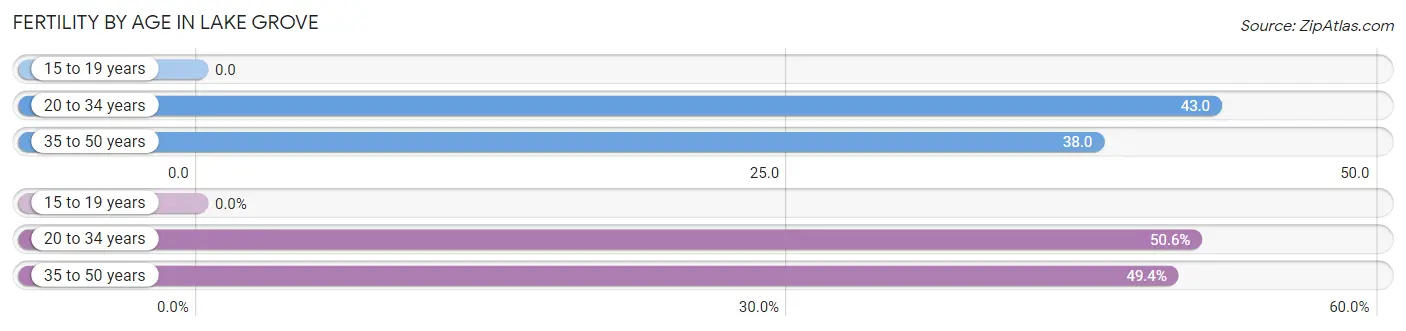
| Age Bracket | Women with Births | Births / 1,000 Women |
| 15 to 19 years | 0 (0.0%) | 0.0 |
| 20 to 34 years | 42 (50.6%) | 43.0 |
| 35 to 50 years | 41 (49.4%) | 38.0 |
| Total | 83 (100.0%) | 34.0 |
Fertility by Age by Marriage Status in Lake Grove
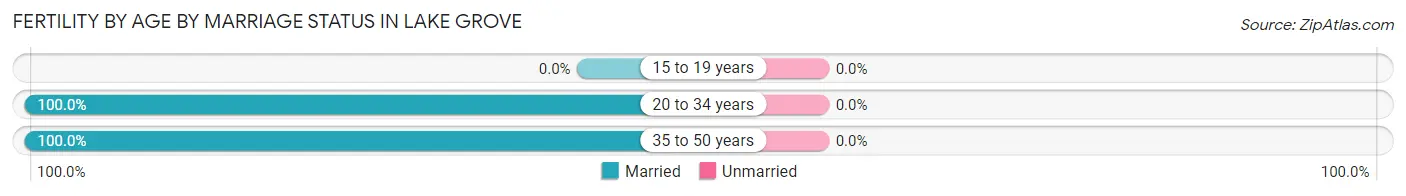
| Age Bracket | Married | Unmarried |
| 15 to 19 years | 0 (0.0%) | 0 (0.0%) |
| 20 to 34 years | 42 (100.0%) | 0 (0.0%) |
| 35 to 50 years | 41 (100.0%) | 0 (0.0%) |
| Total | 83 (100.0%) | 0 (0.0%) |
Fertility by Education in Lake Grove
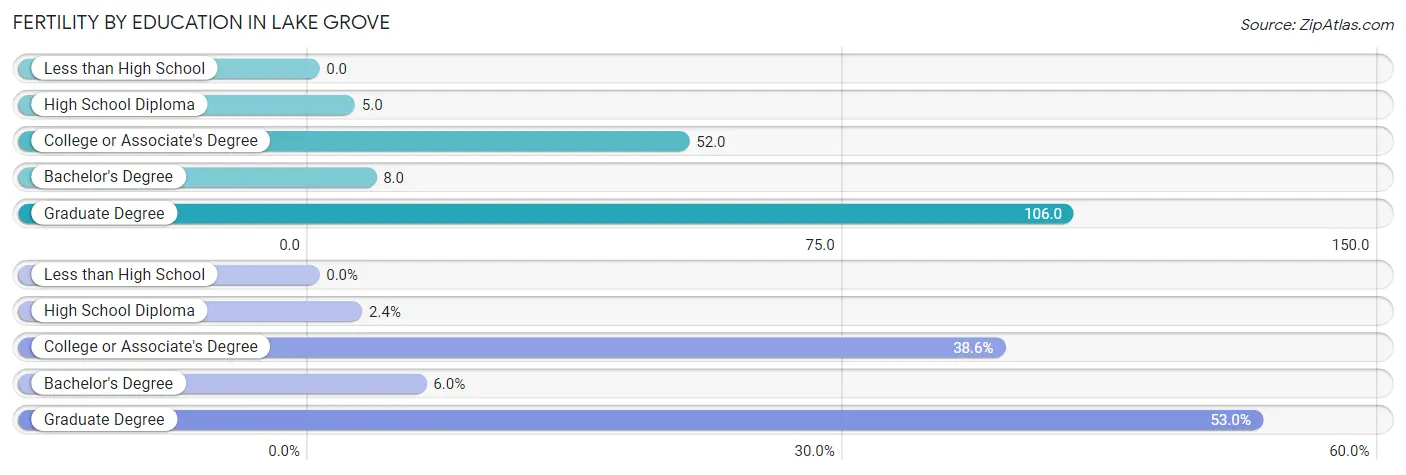
| Educational Attainment | Women with Births | Births / 1,000 Women |
| Less than High School | 0 (0.0%) | 0.0 |
| High School Diploma | 2 (2.4%) | 5.0 |
| College or Associate's Degree | 32 (38.6%) | 52.0 |
| Bachelor's Degree | 5 (6.0%) | 8.0 |
| Graduate Degree | 44 (53.0%) | 106.0 |
| Total | 83 (100.0%) | 34.0 |
Fertility by Education by Marriage Status in Lake Grove
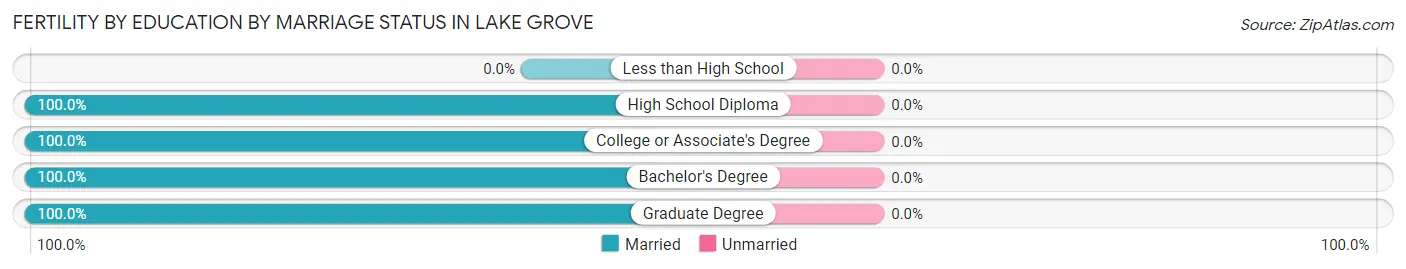
| Educational Attainment | Married | Unmarried |
| Less than High School | 0 (0.0%) | 0 (0.0%) |
| High School Diploma | 2 (100.0%) | 0 (0.0%) |
| College or Associate's Degree | 32 (100.0%) | 0 (0.0%) |
| Bachelor's Degree | 5 (100.0%) | 0 (0.0%) |
| Graduate Degree | 44 (100.0%) | 0 (0.0%) |
| Total | 83 (100.0%) | 0 (0.0%) |
Employment Characteristics in Lake Grove
Employment by Class of Employer in Lake Grove
Among the 5,448 employed individuals in Lake Grove, private company employees (3,576 | 65.6%), local government employees (487 | 8.9%), and state government employees (417 | 7.6%) make up the most common classes of employment.
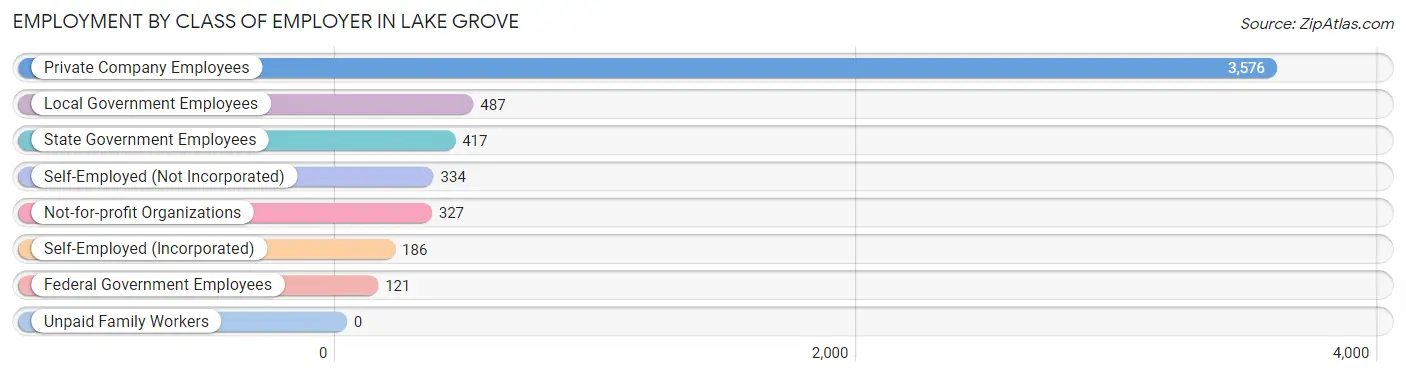
| Employer Class | # Employees | % Employees |
| Private Company Employees | 3,576 | 65.6% |
| Self-Employed (Incorporated) | 186 | 3.4% |
| Self-Employed (Not Incorporated) | 334 | 6.1% |
| Not-for-profit Organizations | 327 | 6.0% |
| Local Government Employees | 487 | 8.9% |
| State Government Employees | 417 | 7.6% |
| Federal Government Employees | 121 | 2.2% |
| Unpaid Family Workers | 0 | 0.0% |
| Total | 5,448 | 100.0% |
Employment Status by Age in Lake Grove
According to the labor force statistics for Lake Grove, out of the total population over 16 years of age (8,911), 65.3% or 5,819 individuals are in the labor force, with 5.2% or 303 of them unemployed. The age group with the highest labor force participation rate is 30 to 34 years, with 93.0% or 522 individuals in the labor force. Within the labor force, the 16 to 19 years age range has the highest percentage of unemployed individuals, with 19.9% or 32 of them being unemployed.
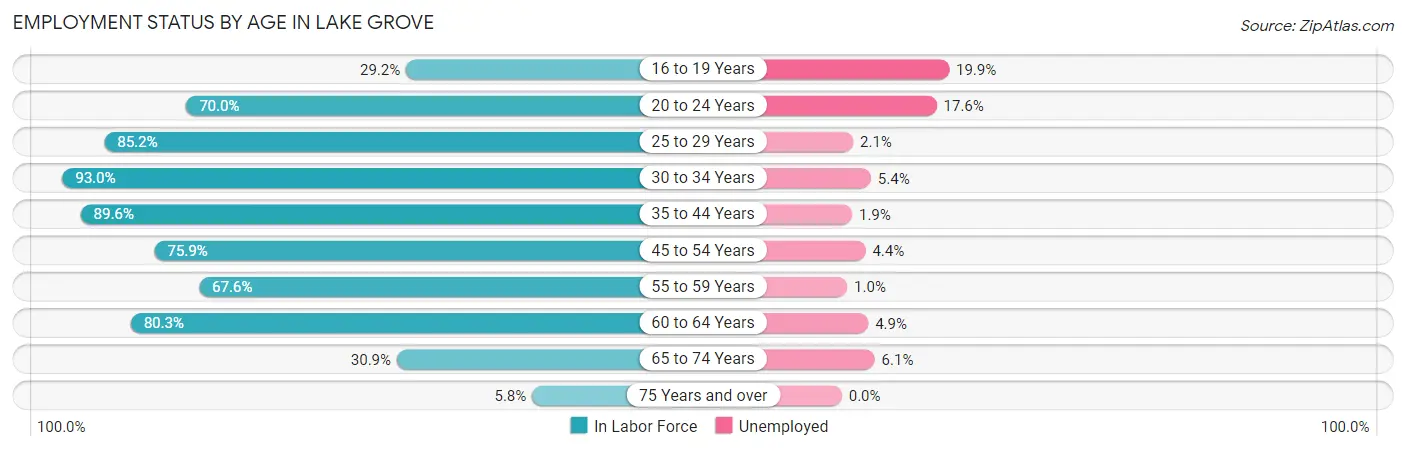
| Age Bracket | In Labor Force | Unemployed |
| 16 to 19 Years | 161 (29.2%) | 32 (19.9%) |
| 20 to 24 Years | 602 (70.0%) | 106 (17.6%) |
| 25 to 29 Years | 662 (85.2%) | 14 (2.1%) |
| 30 to 34 Years | 522 (93.0%) | 28 (5.4%) |
| 35 to 44 Years | 1,047 (89.6%) | 20 (1.9%) |
| 45 to 54 Years | 1,258 (75.9%) | 55 (4.4%) |
| 55 to 59 Years | 728 (67.6%) | 7 (1.0%) |
| 60 to 64 Years | 531 (80.3%) | 26 (4.9%) |
| 65 to 74 Years | 263 (30.9%) | 16 (6.1%) |
| 75 Years and over | 43 (5.8%) | 0 (0.0%) |
| Total | 5,819 (65.3%) | 303 (5.2%) |
Employment Status by Educational Attainment in Lake Grove
According to labor force statistics for Lake Grove, 80.4% of individuals (4,745) out of the total population between 25 and 64 years of age (5,902) are in the labor force, with 3.2% or 152 of them being unemployed. The group with the highest labor force participation rate are those with the educational attainment of bachelor's degree or higher, with 87.4% or 2,560 individuals in the labor force. Within the labor force, individuals with less than high school education have the highest percentage of unemployment, with 16.0% or 20 of them being unemployed.
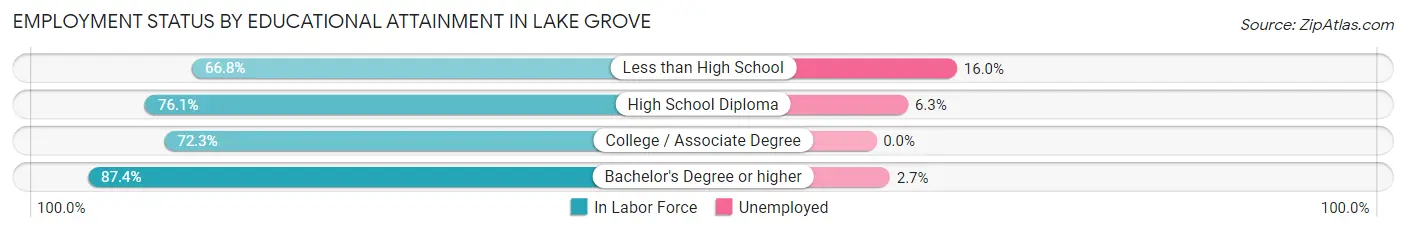
| Educational Attainment | In Labor Force | Unemployed |
| Less than High School | 125 (66.8%) | 30 (16.0%) |
| High School Diploma | 954 (76.1%) | 79 (6.3%) |
| College / Associate Degree | 1,108 (72.3%) | 0 (0.0%) |
| Bachelor's Degree or higher | 2,560 (87.4%) | 79 (2.7%) |
| Total | 4,745 (80.4%) | 189 (3.2%) |
Employment Occupations by Sex in Lake Grove
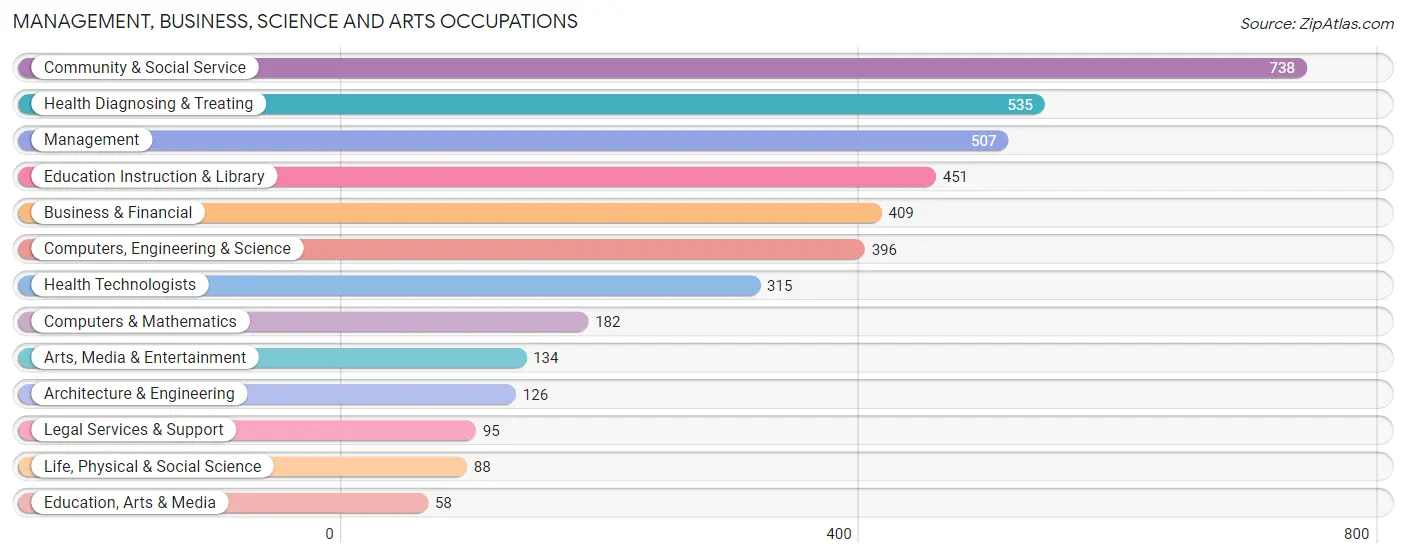
Management, Business, Science and Arts Occupations
The most common Management, Business, Science and Arts occupations in Lake Grove are Community & Social Service (738 | 13.4%), Health Diagnosing & Treating (535 | 9.7%), Management (507 | 9.2%), Education Instruction & Library (451 | 8.2%), and Business & Financial (409 | 7.4%).
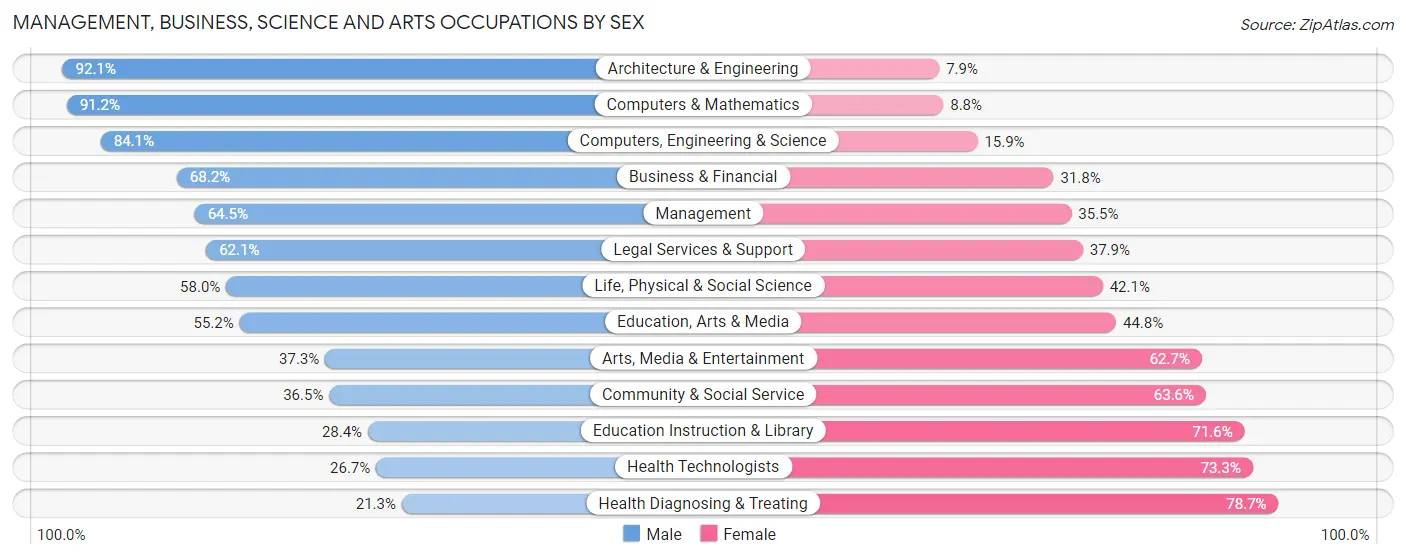
Management, Business, Science and Arts Occupations by Sex
Within the Management, Business, Science and Arts occupations in Lake Grove, the most male-oriented occupations are Architecture & Engineering (92.1%), Computers & Mathematics (91.2%), and Computers, Engineering & Science (84.1%), while the most female-oriented occupations are Health Diagnosing & Treating (78.7%), Health Technologists (73.3%), and Education Instruction & Library (71.6%).
| Occupation | Male | Female |
| Management | 327 (64.5%) | 180 (35.5%) |
| Business & Financial | 279 (68.2%) | 130 (31.8%) |
| Computers, Engineering & Science | 333 (84.1%) | 63 (15.9%) |
| Computers & Mathematics | 166 (91.2%) | 16 (8.8%) |
| Architecture & Engineering | 116 (92.1%) | 10 (7.9%) |
| Life, Physical & Social Science | 51 (58.0%) | 37 (42.0%) |
| Community & Social Service | 269 (36.4%) | 469 (63.5%) |
| Education, Arts & Media | 32 (55.2%) | 26 (44.8%) |
| Legal Services & Support | 59 (62.1%) | 36 (37.9%) |
| Education Instruction & Library | 128 (28.4%) | 323 (71.6%) |
| Arts, Media & Entertainment | 50 (37.3%) | 84 (62.7%) |
| Health Diagnosing & Treating | 114 (21.3%) | 421 (78.7%) |
| Health Technologists | 84 (26.7%) | 231 (73.3%) |
| Total (Category) | 1,322 (51.1%) | 1,263 (48.9%) |
| Total (Overall) | 3,037 (55.1%) | 2,475 (44.9%) |
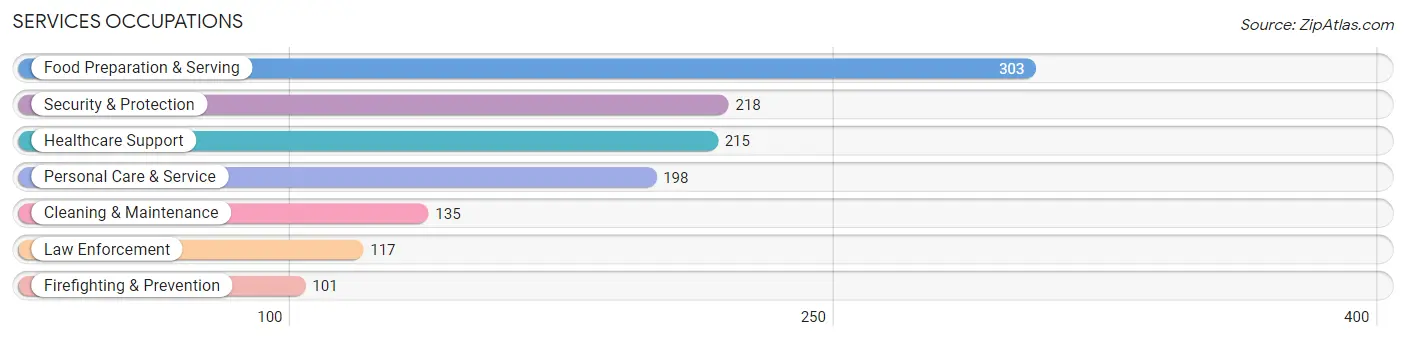
Services Occupations
The most common Services occupations in Lake Grove are Food Preparation & Serving (303 | 5.5%), Security & Protection (218 | 4.0%), Healthcare Support (215 | 3.9%), Personal Care & Service (198 | 3.6%), and Cleaning & Maintenance (135 | 2.5%).
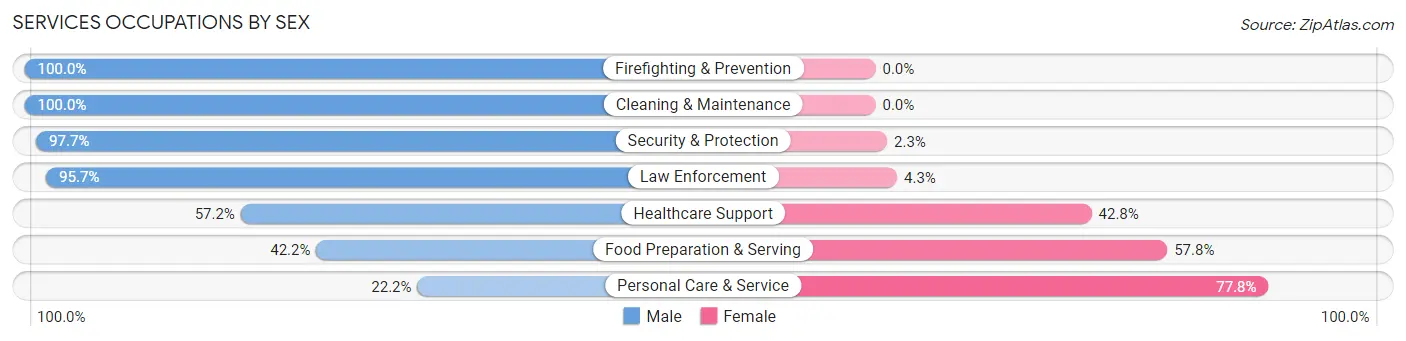
Services Occupations by Sex
Within the Services occupations in Lake Grove, the most male-oriented occupations are Firefighting & Prevention (100.0%), Cleaning & Maintenance (100.0%), and Security & Protection (97.7%), while the most female-oriented occupations are Personal Care & Service (77.8%), Food Preparation & Serving (57.8%), and Healthcare Support (42.8%).
| Occupation | Male | Female |
| Healthcare Support | 123 (57.2%) | 92 (42.8%) |
| Security & Protection | 213 (97.7%) | 5 (2.3%) |
| Firefighting & Prevention | 101 (100.0%) | 0 (0.0%) |
| Law Enforcement | 112 (95.7%) | 5 (4.3%) |
| Food Preparation & Serving | 128 (42.2%) | 175 (57.8%) |
| Cleaning & Maintenance | 135 (100.0%) | 0 (0.0%) |
| Personal Care & Service | 44 (22.2%) | 154 (77.8%) |
| Total (Category) | 643 (60.2%) | 426 (39.9%) |
| Total (Overall) | 3,037 (55.1%) | 2,475 (44.9%) |
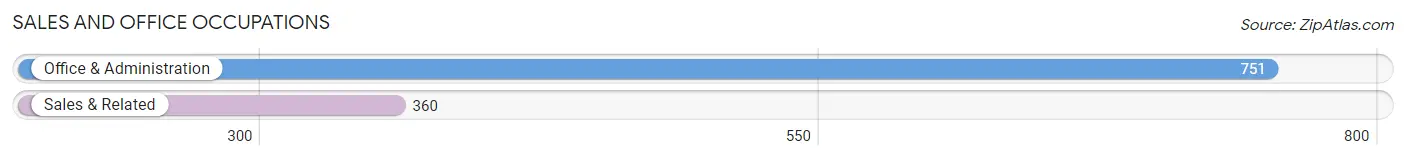
Sales and Office Occupations
The most common Sales and Office occupations in Lake Grove are Office & Administration (751 | 13.6%), and Sales & Related (360 | 6.5%).
Sales and Office Occupations by Sex
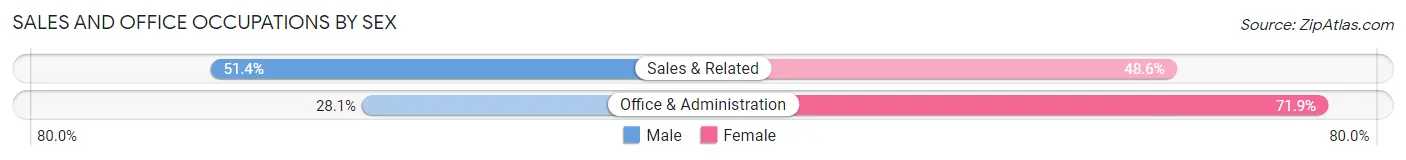
| Occupation | Male | Female |
| Sales & Related | 185 (51.4%) | 175 (48.6%) |
| Office & Administration | 211 (28.1%) | 540 (71.9%) |
| Total (Category) | 396 (35.6%) | 715 (64.4%) |
| Total (Overall) | 3,037 (55.1%) | 2,475 (44.9%) |
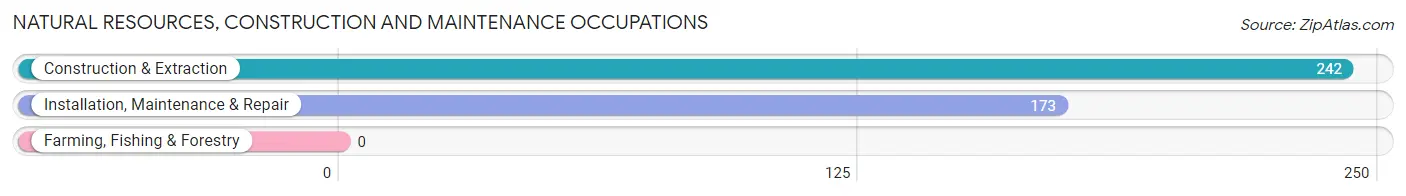
Natural Resources, Construction and Maintenance Occupations
The most common Natural Resources, Construction and Maintenance occupations in Lake Grove are Construction & Extraction (242 | 4.4%), and Installation, Maintenance & Repair (173 | 3.1%).
Natural Resources, Construction and Maintenance Occupations by Sex
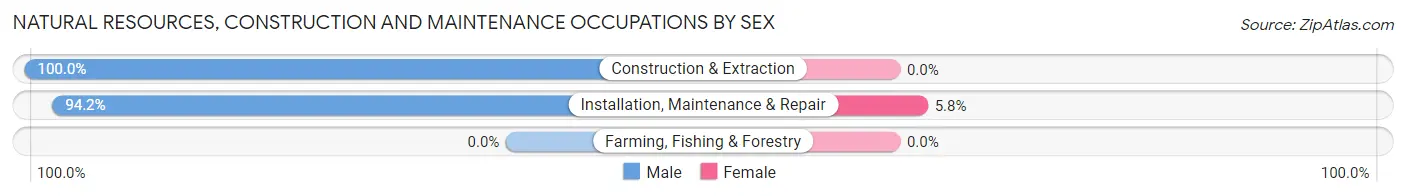
| Occupation | Male | Female |
| Farming, Fishing & Forestry | 0 (0.0%) | 0 (0.0%) |
| Construction & Extraction | 242 (100.0%) | 0 (0.0%) |
| Installation, Maintenance & Repair | 163 (94.2%) | 10 (5.8%) |
| Total (Category) | 405 (97.6%) | 10 (2.4%) |
| Total (Overall) | 3,037 (55.1%) | 2,475 (44.9%) |
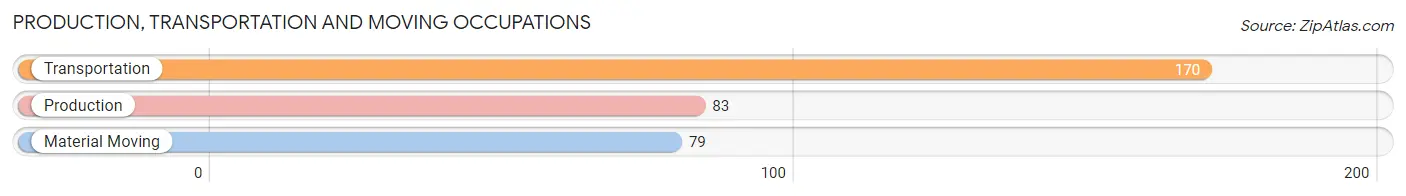
Production, Transportation and Moving Occupations
The most common Production, Transportation and Moving occupations in Lake Grove are Transportation (170 | 3.1%), Production (83 | 1.5%), and Material Moving (79 | 1.4%).
Production, Transportation and Moving Occupations by Sex
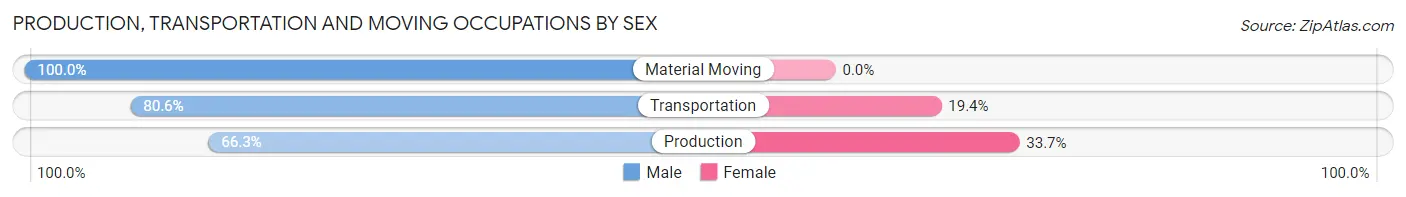
| Occupation | Male | Female |
| Production | 55 (66.3%) | 28 (33.7%) |
| Transportation | 137 (80.6%) | 33 (19.4%) |
| Material Moving | 79 (100.0%) | 0 (0.0%) |
| Total (Category) | 271 (81.6%) | 61 (18.4%) |
| Total (Overall) | 3,037 (55.1%) | 2,475 (44.9%) |
Employment Industries by Sex in Lake Grove
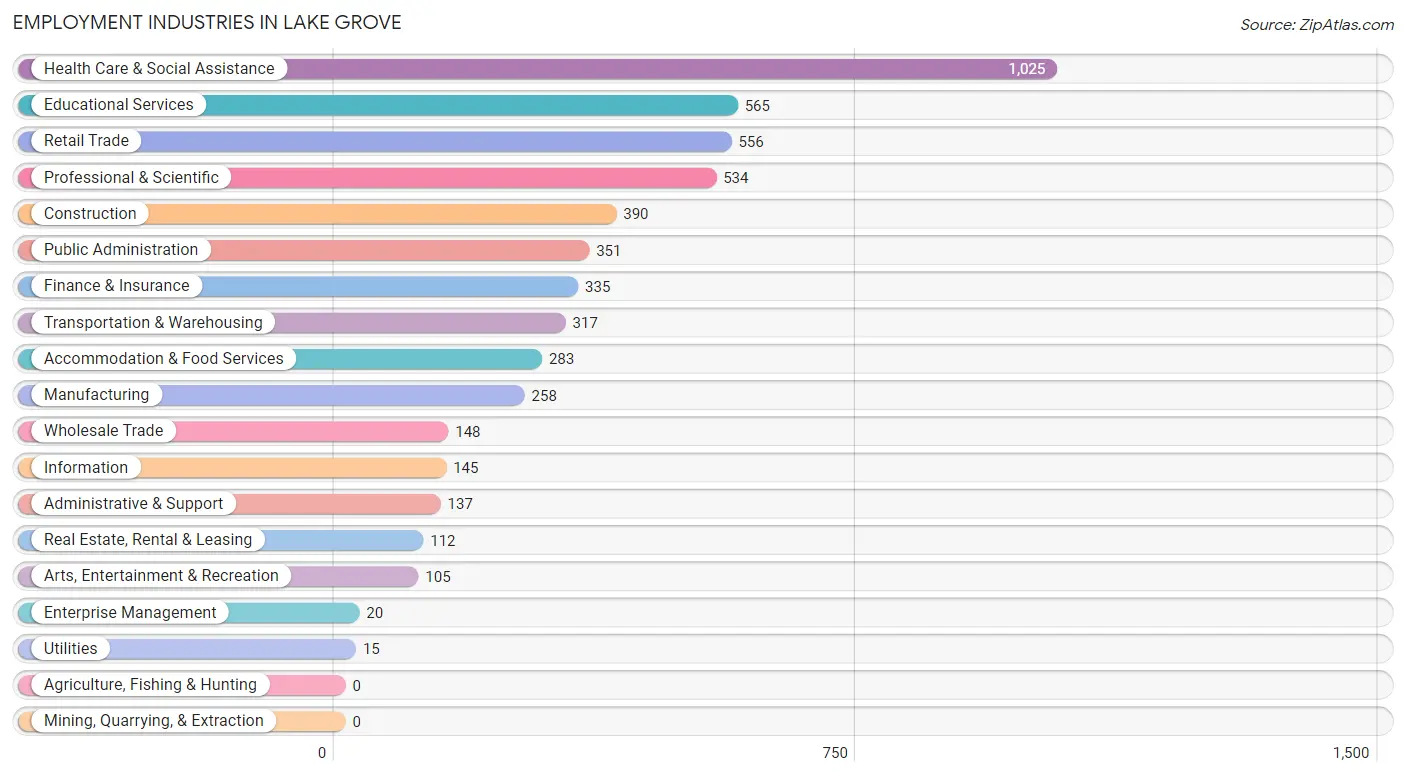
Employment Industries in Lake Grove
The major employment industries in Lake Grove include Health Care & Social Assistance (1,025 | 18.6%), Educational Services (565 | 10.2%), Retail Trade (556 | 10.1%), Professional & Scientific (534 | 9.7%), and Construction (390 | 7.1%).
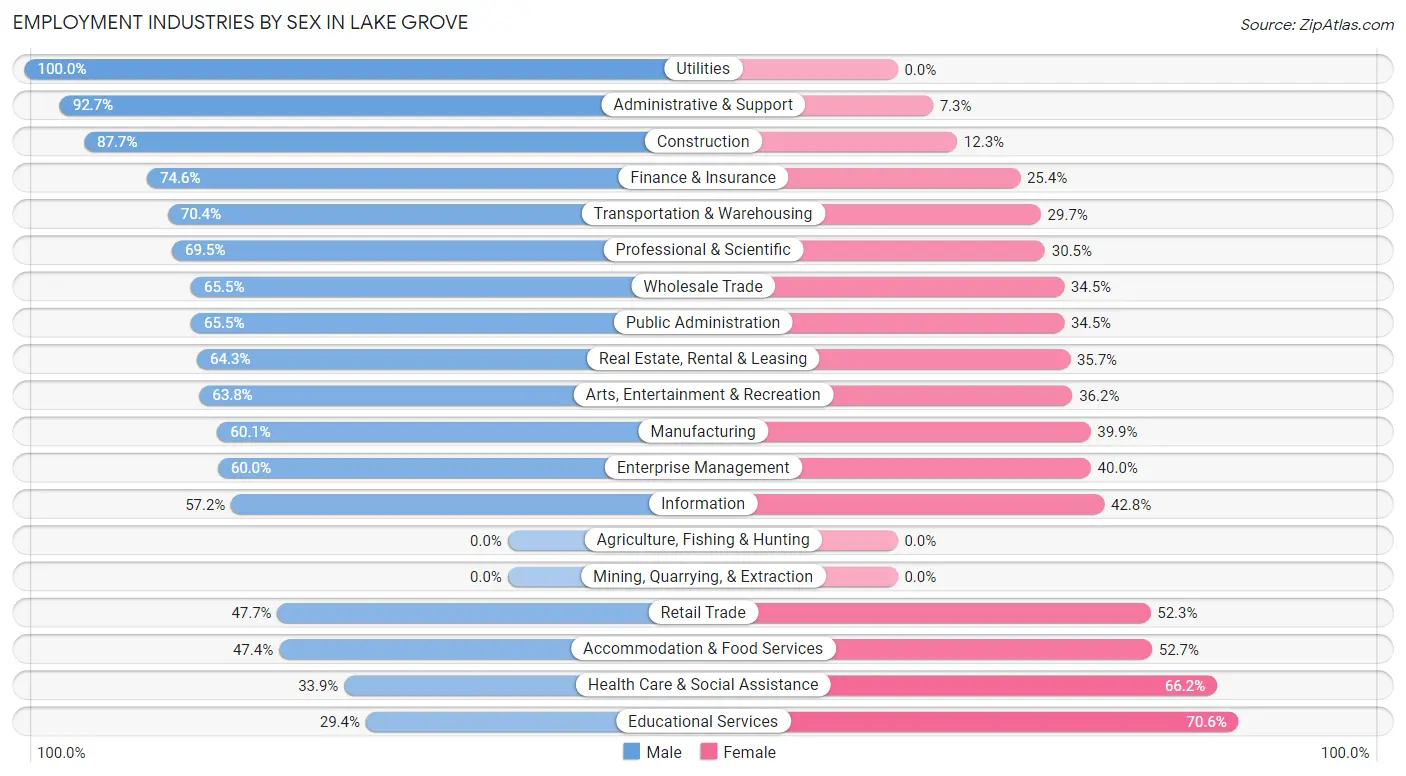
Employment Industries by Sex in Lake Grove
The Lake Grove industries that see more men than women are Utilities (100.0%), Administrative & Support (92.7%), and Construction (87.7%), whereas the industries that tend to have a higher number of women are Educational Services (70.6%), Health Care & Social Assistance (66.1%), and Accommodation & Food Services (52.6%).
| Industry | Male | Female |
| Agriculture, Fishing & Hunting | 0 (0.0%) | 0 (0.0%) |
| Mining, Quarrying, & Extraction | 0 (0.0%) | 0 (0.0%) |
| Construction | 342 (87.7%) | 48 (12.3%) |
| Manufacturing | 155 (60.1%) | 103 (39.9%) |
| Wholesale Trade | 97 (65.5%) | 51 (34.5%) |
| Retail Trade | 265 (47.7%) | 291 (52.3%) |
| Transportation & Warehousing | 223 (70.4%) | 94 (29.6%) |
| Utilities | 15 (100.0%) | 0 (0.0%) |
| Information | 83 (57.2%) | 62 (42.8%) |
| Finance & Insurance | 250 (74.6%) | 85 (25.4%) |
| Real Estate, Rental & Leasing | 72 (64.3%) | 40 (35.7%) |
| Professional & Scientific | 371 (69.5%) | 163 (30.5%) |
| Enterprise Management | 12 (60.0%) | 8 (40.0%) |
| Administrative & Support | 127 (92.7%) | 10 (7.3%) |
| Educational Services | 166 (29.4%) | 399 (70.6%) |
| Health Care & Social Assistance | 347 (33.9%) | 678 (66.1%) |
| Arts, Entertainment & Recreation | 67 (63.8%) | 38 (36.2%) |
| Accommodation & Food Services | 134 (47.3%) | 149 (52.6%) |
| Public Administration | 230 (65.5%) | 121 (34.5%) |
| Total | 3,037 (55.1%) | 2,475 (44.9%) |
Education in Lake Grove
School Enrollment in Lake Grove
The most common levels of schooling among the 3,175 students in Lake Grove are middle school (749 | 23.6%), college / undergraduate (706 | 22.2%), and high school (532 | 16.8%).
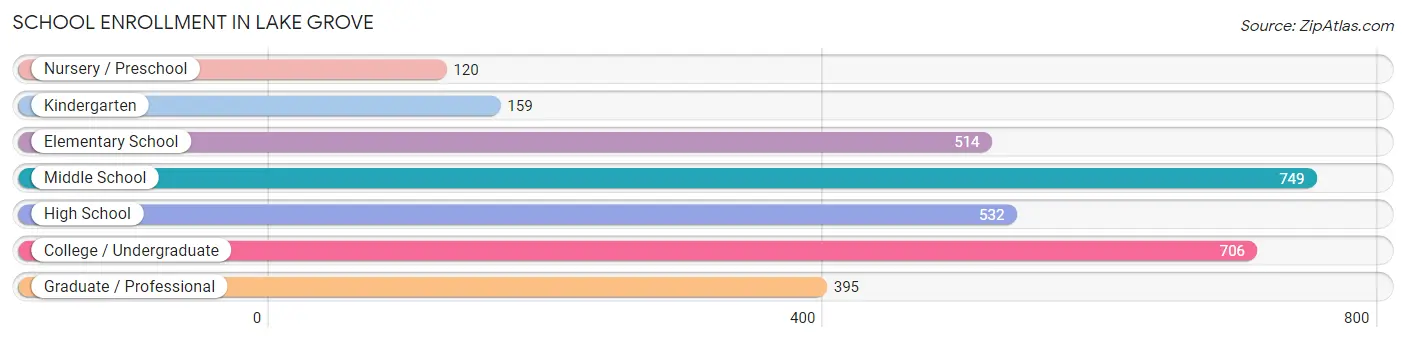
| School Level | # Students | % Students |
| Nursery / Preschool | 120 | 3.8% |
| Kindergarten | 159 | 5.0% |
| Elementary School | 514 | 16.2% |
| Middle School | 749 | 23.6% |
| High School | 532 | 16.8% |
| College / Undergraduate | 706 | 22.2% |
| Graduate / Professional | 395 | 12.4% |
| Total | 3,175 | 100.0% |
School Enrollment by Age by Funding Source in Lake Grove
Out of a total of 3,175 students who are enrolled in schools in Lake Grove, 432 (13.6%) attend a private institution, while the remaining 2,743 (86.4%) are enrolled in public schools. The age group of 35 years and over has the highest likelihood of being enrolled in private schools, with 65 (40.6% in the age bracket) enrolled. Conversely, the age group of 15 to 17 year olds has the lowest likelihood of being enrolled in a private school, with 428 (100.0% in the age bracket) attending a public institution.
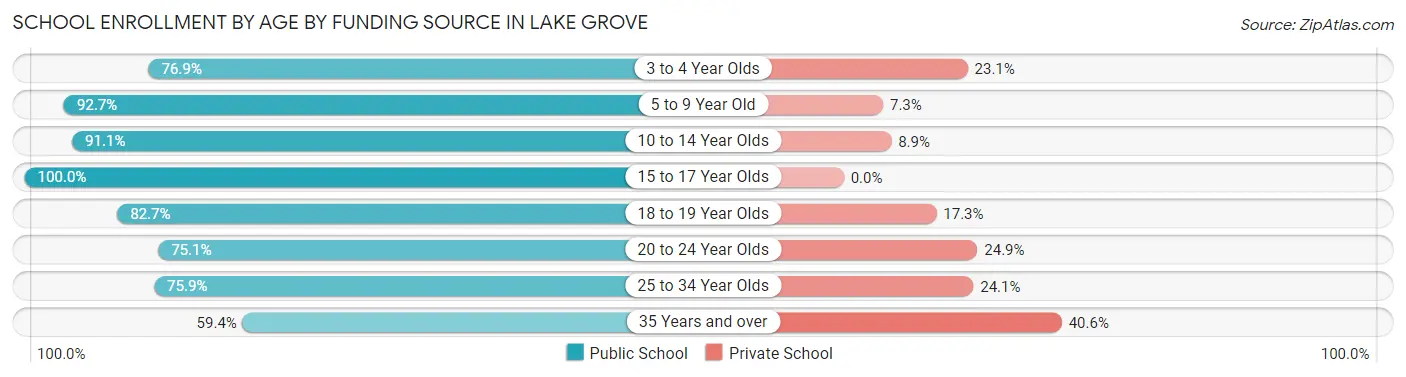
| Age Bracket | Public School | Private School |
| 3 to 4 Year Olds | 70 (76.9%) | 21 (23.1%) |
| 5 to 9 Year Old | 632 (92.7%) | 50 (7.3%) |
| 10 to 14 Year Olds | 782 (91.1%) | 76 (8.9%) |
| 15 to 17 Year Olds | 428 (100.0%) | 0 (0.0%) |
| 18 to 19 Year Olds | 187 (82.7%) | 39 (17.3%) |
| 20 to 24 Year Olds | 374 (75.1%) | 124 (24.9%) |
| 25 to 34 Year Olds | 176 (75.9%) | 56 (24.1%) |
| 35 Years and over | 95 (59.4%) | 65 (40.6%) |
| Total | 2,743 (86.4%) | 432 (13.6%) |
Educational Attainment by Field of Study in Lake Grove
Business (814 | 21.7%), social sciences (463 | 12.3%), science & technology (341 | 9.1%), education (327 | 8.7%), and engineering (288 | 7.7%) are the most common fields of study among 3,748 individuals in Lake Grove who have obtained a bachelor's degree or higher.
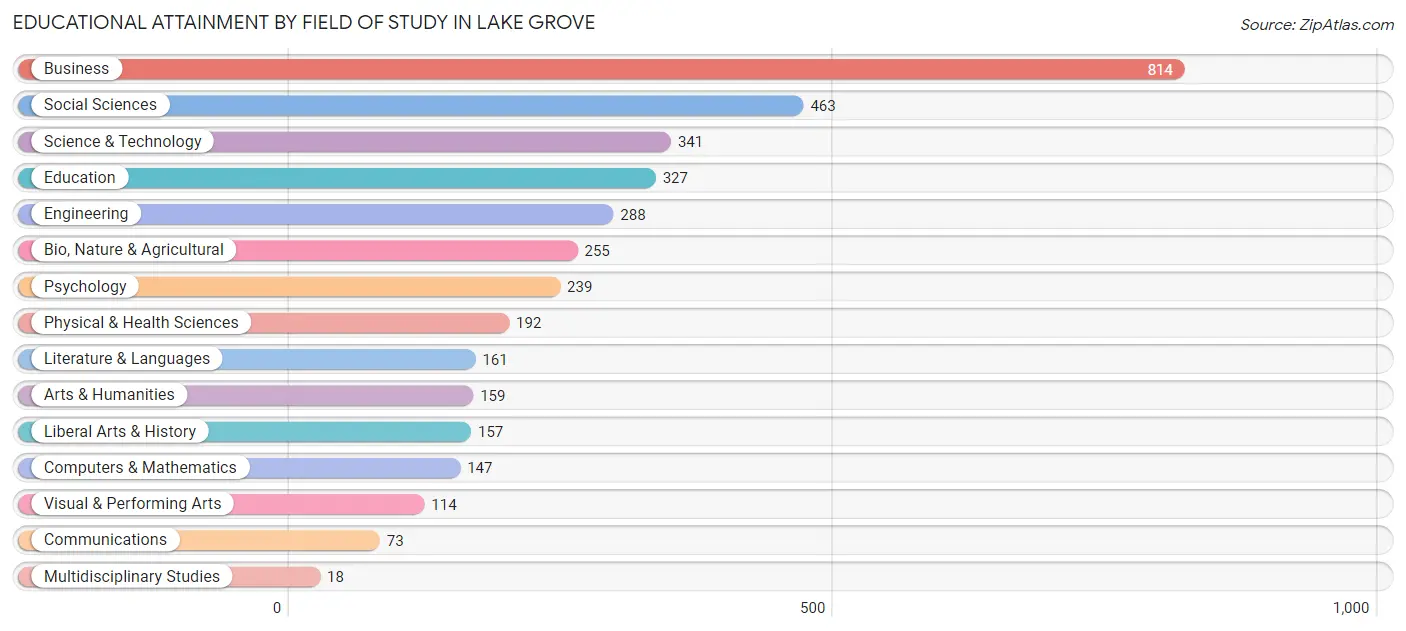
| Field of Study | # Graduates | % Graduates |
| Computers & Mathematics | 147 | 3.9% |
| Bio, Nature & Agricultural | 255 | 6.8% |
| Physical & Health Sciences | 192 | 5.1% |
| Psychology | 239 | 6.4% |
| Social Sciences | 463 | 12.3% |
| Engineering | 288 | 7.7% |
| Multidisciplinary Studies | 18 | 0.5% |
| Science & Technology | 341 | 9.1% |
| Business | 814 | 21.7% |
| Education | 327 | 8.7% |
| Literature & Languages | 161 | 4.3% |
| Liberal Arts & History | 157 | 4.2% |
| Visual & Performing Arts | 114 | 3.0% |
| Communications | 73 | 1.9% |
| Arts & Humanities | 159 | 4.2% |
| Total | 3,748 | 100.0% |
Transportation & Commute in Lake Grove
Vehicle Availability by Sex in Lake Grove
The most prevalent vehicle ownership categories in Lake Grove are males with 2 vehicles (1,043, accounting for 34.7%) and females with 2 vehicles (634, making up 42.7%).
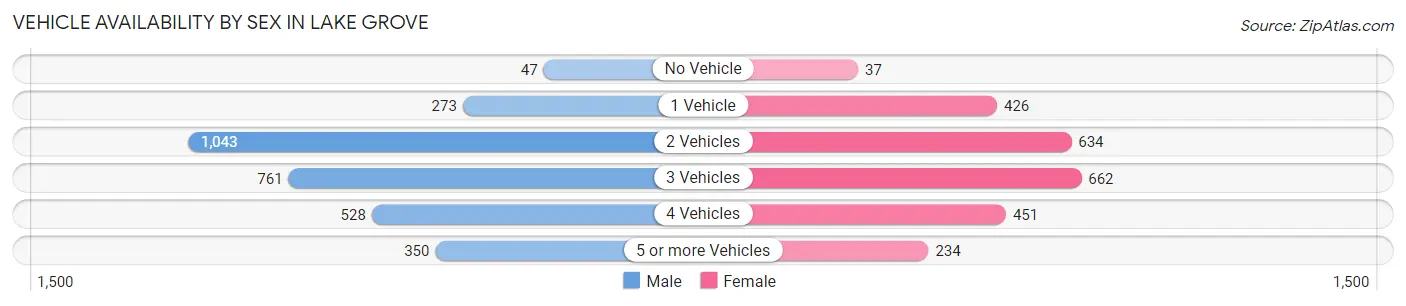
| Vehicles Available | Male | Female |
| No Vehicle | 47 (1.6%) | 37 (1.5%) |
| 1 Vehicle | 273 (9.1%) | 426 (17.4%) |
| 2 Vehicles | 1,043 (34.7%) | 634 (25.9%) |
| 3 Vehicles | 761 (25.4%) | 662 (27.1%) |
| 4 Vehicles | 528 (17.6%) | 451 (18.4%) |
| 5 or more Vehicles | 350 (11.7%) | 234 (9.6%) |
| Total | 3,002 (100.0%) | 2,444 (100.0%) |
Commute Time in Lake Grove
The most frequently occuring commute durations in Lake Grove are 20 to 24 minutes (854 commuters, 17.1%), 15 to 19 minutes (774 commuters, 15.4%), and 90 or more minutes (625 commuters, 12.5%).
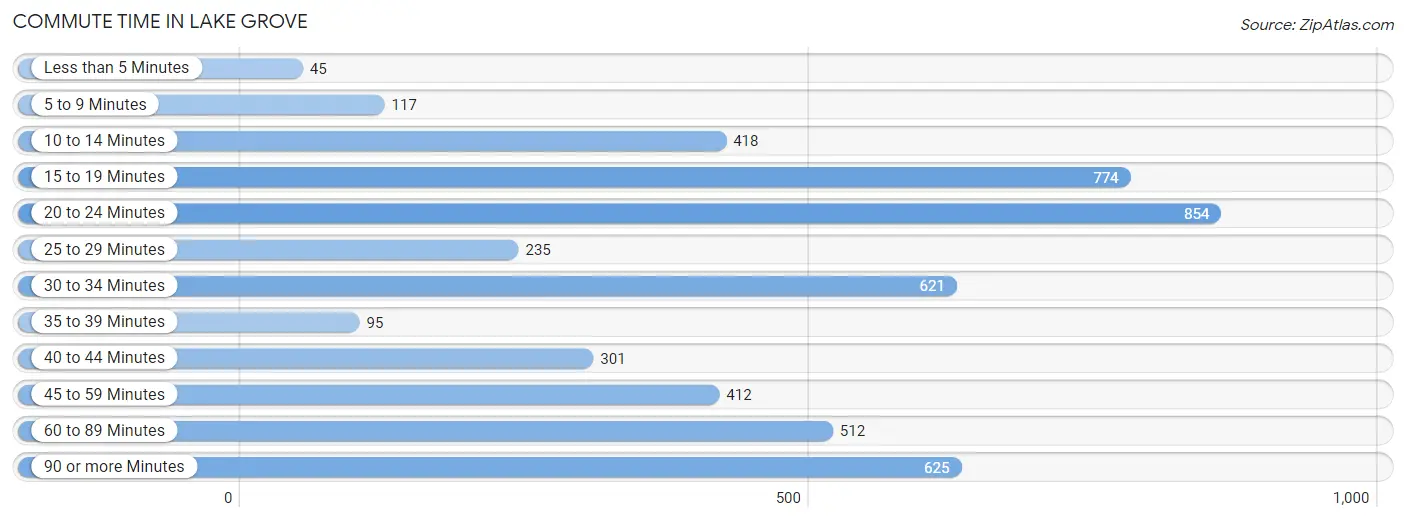
| Commute Time | # Commuters | % Commuters |
| Less than 5 Minutes | 45 | 0.9% |
| 5 to 9 Minutes | 117 | 2.3% |
| 10 to 14 Minutes | 418 | 8.3% |
| 15 to 19 Minutes | 774 | 15.4% |
| 20 to 24 Minutes | 854 | 17.1% |
| 25 to 29 Minutes | 235 | 4.7% |
| 30 to 34 Minutes | 621 | 12.4% |
| 35 to 39 Minutes | 95 | 1.9% |
| 40 to 44 Minutes | 301 | 6.0% |
| 45 to 59 Minutes | 412 | 8.2% |
| 60 to 89 Minutes | 512 | 10.2% |
| 90 or more Minutes | 625 | 12.5% |
Commute Time by Sex in Lake Grove
The most common commute times in Lake Grove are 90 or more minutes (485 commuters, 17.5%) for males and 15 to 19 minutes (444 commuters, 19.9%) for females.
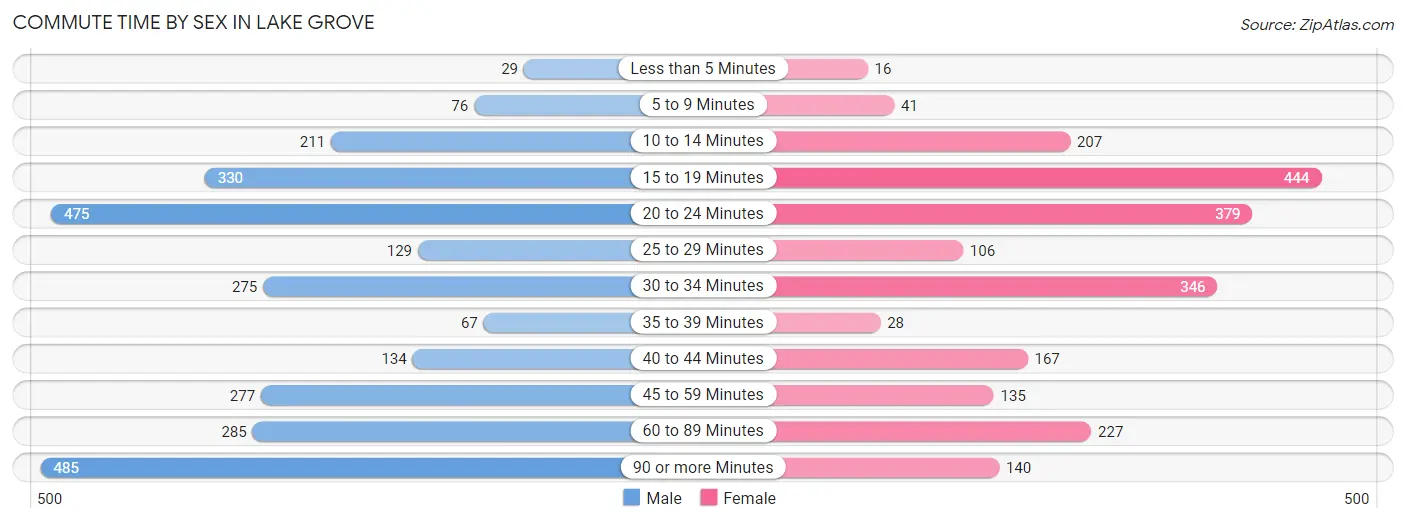
| Commute Time | Male | Female |
| Less than 5 Minutes | 29 (1.1%) | 16 (0.7%) |
| 5 to 9 Minutes | 76 (2.7%) | 41 (1.8%) |
| 10 to 14 Minutes | 211 (7.6%) | 207 (9.3%) |
| 15 to 19 Minutes | 330 (11.9%) | 444 (19.9%) |
| 20 to 24 Minutes | 475 (17.1%) | 379 (17.0%) |
| 25 to 29 Minutes | 129 (4.6%) | 106 (4.7%) |
| 30 to 34 Minutes | 275 (9.9%) | 346 (15.5%) |
| 35 to 39 Minutes | 67 (2.4%) | 28 (1.3%) |
| 40 to 44 Minutes | 134 (4.8%) | 167 (7.5%) |
| 45 to 59 Minutes | 277 (10.0%) | 135 (6.0%) |
| 60 to 89 Minutes | 285 (10.3%) | 227 (10.2%) |
| 90 or more Minutes | 485 (17.5%) | 140 (6.3%) |
Time of Departure to Work by Sex in Lake Grove
The most frequent times of departure to work in Lake Grove are 8:00 AM to 8:29 AM (419, 15.1%) for males and 8:00 AM to 8:29 AM (434, 19.4%) for females.
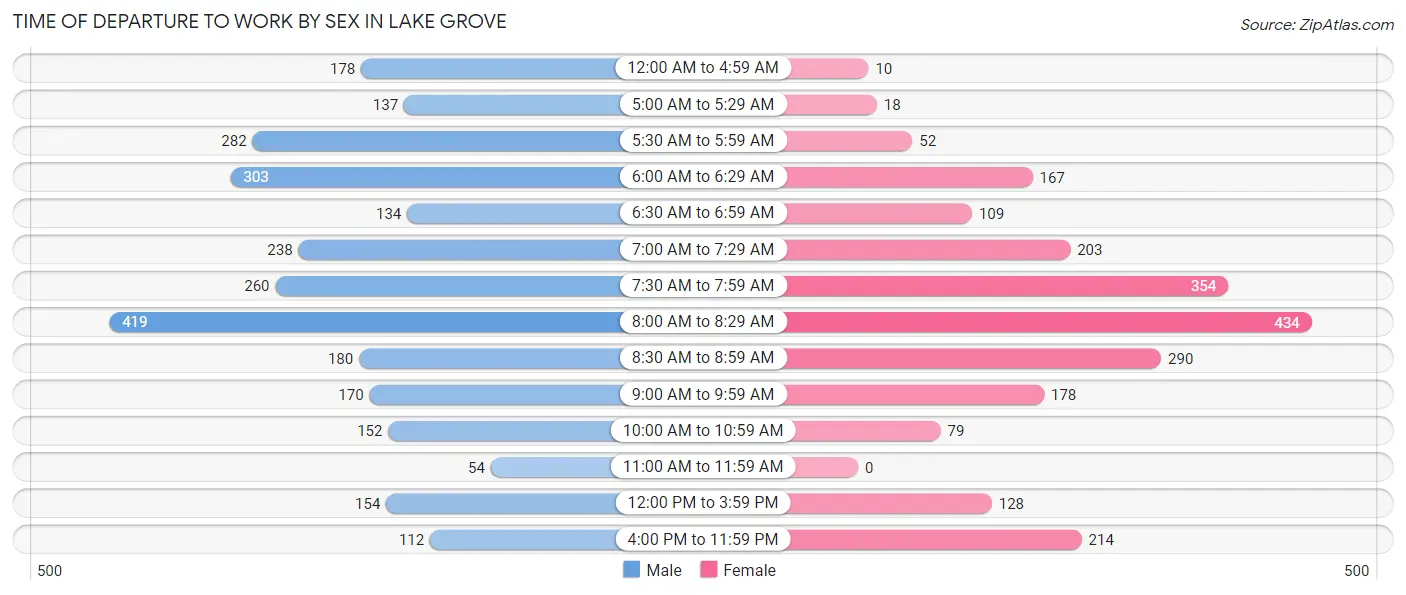
| Time of Departure | Male | Female |
| 12:00 AM to 4:59 AM | 178 (6.4%) | 10 (0.4%) |
| 5:00 AM to 5:29 AM | 137 (4.9%) | 18 (0.8%) |
| 5:30 AM to 5:59 AM | 282 (10.2%) | 52 (2.3%) |
| 6:00 AM to 6:29 AM | 303 (10.9%) | 167 (7.5%) |
| 6:30 AM to 6:59 AM | 134 (4.8%) | 109 (4.9%) |
| 7:00 AM to 7:29 AM | 238 (8.6%) | 203 (9.1%) |
| 7:30 AM to 7:59 AM | 260 (9.4%) | 354 (15.8%) |
| 8:00 AM to 8:29 AM | 419 (15.1%) | 434 (19.4%) |
| 8:30 AM to 8:59 AM | 180 (6.5%) | 290 (13.0%) |
| 9:00 AM to 9:59 AM | 170 (6.1%) | 178 (8.0%) |
| 10:00 AM to 10:59 AM | 152 (5.5%) | 79 (3.5%) |
| 11:00 AM to 11:59 AM | 54 (1.9%) | 0 (0.0%) |
| 12:00 PM to 3:59 PM | 154 (5.6%) | 128 (5.7%) |
| 4:00 PM to 11:59 PM | 112 (4.0%) | 214 (9.6%) |
| Total | 2,773 (100.0%) | 2,236 (100.0%) |
Housing Occupancy in Lake Grove
Occupancy by Ownership in Lake Grove
Of the total 3,754 dwellings in Lake Grove, owner-occupied units account for 3,015 (80.3%), while renter-occupied units make up 739 (19.7%).
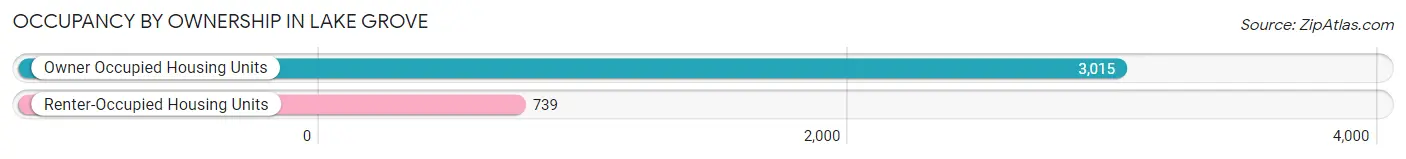
| Occupancy | # Housing Units | % Housing Units |
| Owner Occupied Housing Units | 3,015 | 80.3% |
| Renter-Occupied Housing Units | 739 | 19.7% |
| Total Occupied Housing Units | 3,754 | 100.0% |
Occupancy by Household Size in Lake Grove
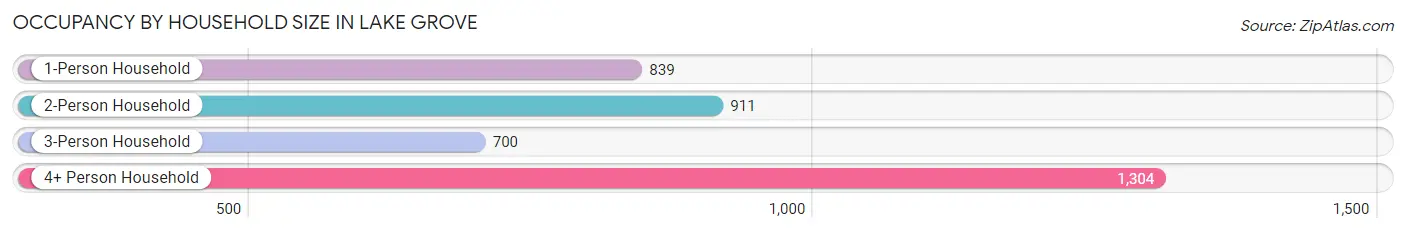
| Household Size | # Housing Units | % Housing Units |
| 1-Person Household | 839 | 22.4% |
| 2-Person Household | 911 | 24.3% |
| 3-Person Household | 700 | 18.6% |
| 4+ Person Household | 1,304 | 34.7% |
| Total Housing Units | 3,754 | 100.0% |
Occupancy by Ownership by Household Size in Lake Grove
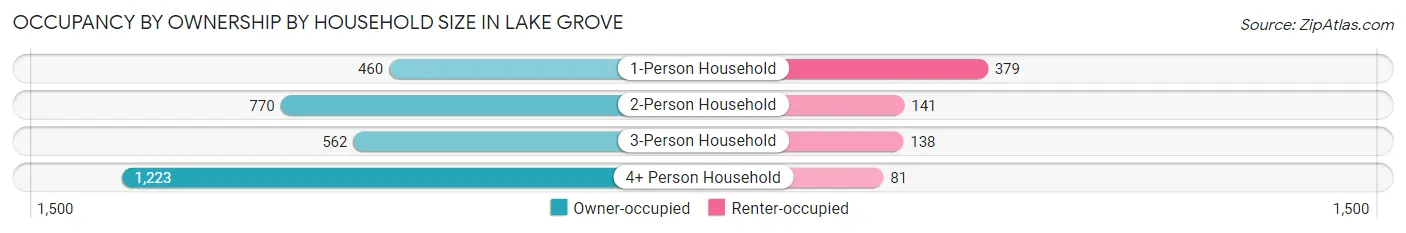
| Household Size | Owner-occupied | Renter-occupied |
| 1-Person Household | 460 (54.8%) | 379 (45.2%) |
| 2-Person Household | 770 (84.5%) | 141 (15.5%) |
| 3-Person Household | 562 (80.3%) | 138 (19.7%) |
| 4+ Person Household | 1,223 (93.8%) | 81 (6.2%) |
| Total Housing Units | 3,015 (80.3%) | 739 (19.7%) |
Occupancy by Educational Attainment in Lake Grove
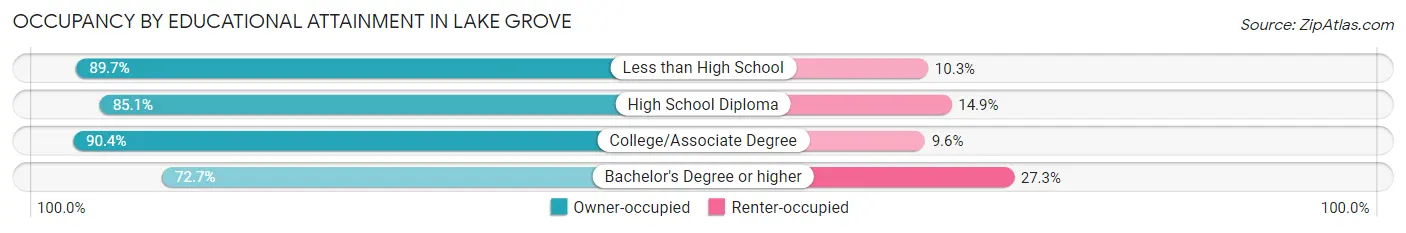
| Household Size | Owner-occupied | Renter-occupied |
| Less than High School | 105 (89.7%) | 12 (10.3%) |
| High School Diploma | 777 (85.1%) | 136 (14.9%) |
| College/Associate Degree | 779 (90.4%) | 83 (9.6%) |
| Bachelor's Degree or higher | 1,354 (72.7%) | 508 (27.3%) |
Occupancy by Age of Householder in Lake Grove
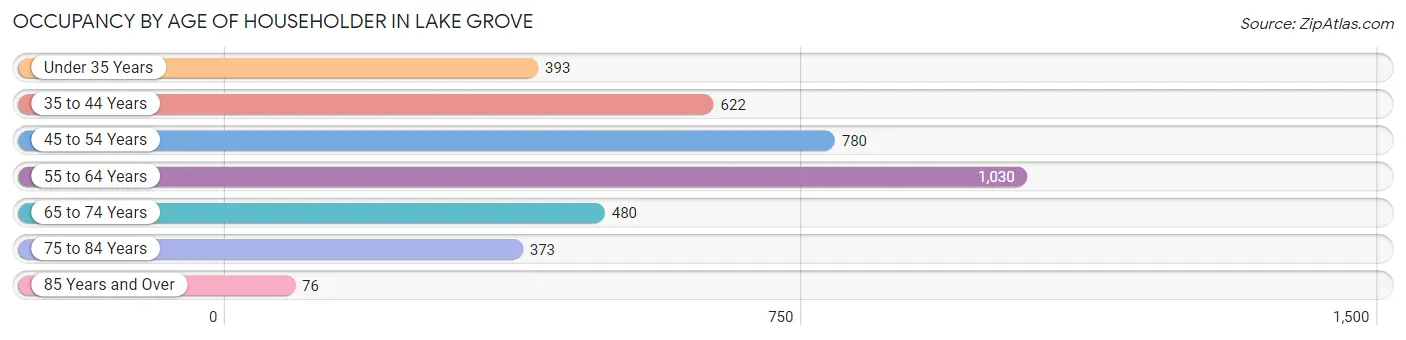
| Age Bracket | # Households | % Households |
| Under 35 Years | 393 | 10.5% |
| 35 to 44 Years | 622 | 16.6% |
| 45 to 54 Years | 780 | 20.8% |
| 55 to 64 Years | 1,030 | 27.4% |
| 65 to 74 Years | 480 | 12.8% |
| 75 to 84 Years | 373 | 9.9% |
| 85 Years and Over | 76 | 2.0% |
| Total | 3,754 | 100.0% |
Housing Finances in Lake Grove
Median Income by Occupancy in Lake Grove
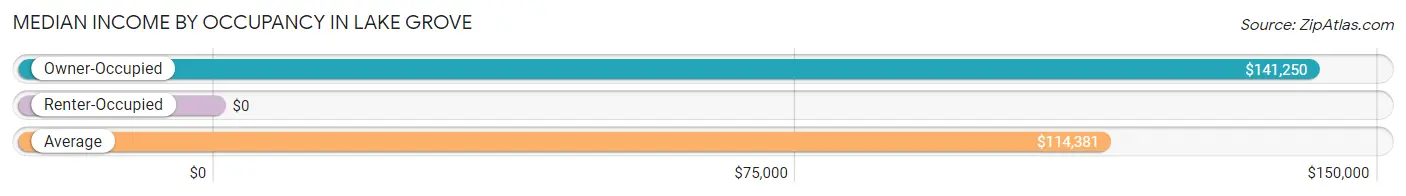
| Occupancy Type | # Households | Median Income |
| Owner-Occupied | 3,015 (80.3%) | $141,250 |
| Renter-Occupied | 739 (19.7%) | $0 |
| Average | 3,754 (100.0%) | $114,381 |
Occupancy by Householder Income Bracket in Lake Grove
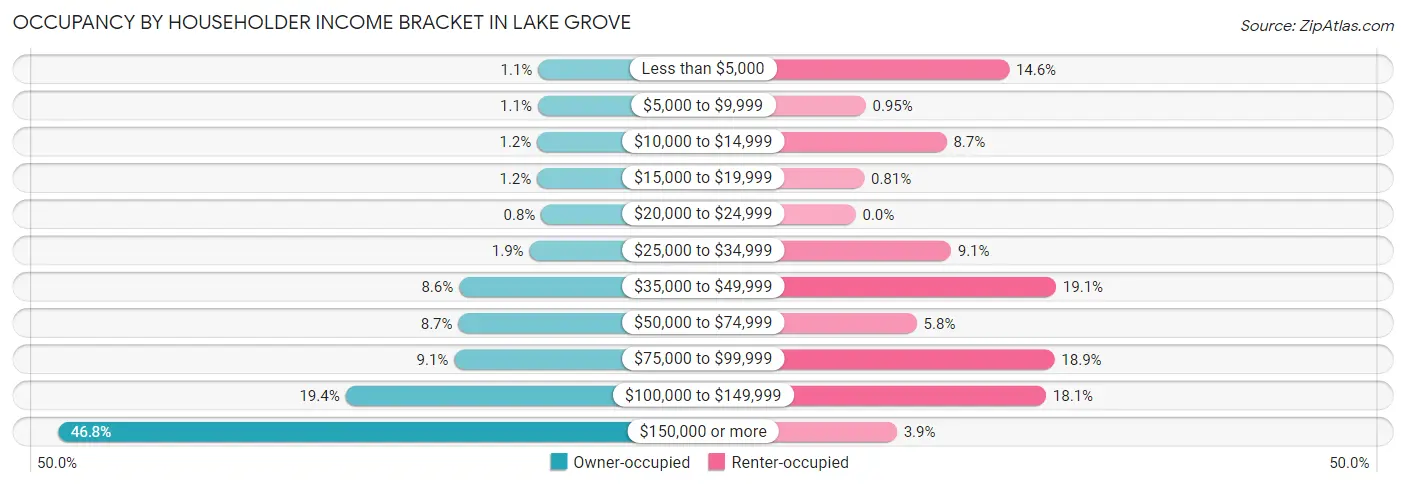
| Income Bracket | Owner-occupied | Renter-occupied |
| Less than $5,000 | 33 (1.1%) | 108 (14.6%) |
| $5,000 to $9,999 | 34 (1.1%) | 7 (0.9%) |
| $10,000 to $14,999 | 36 (1.2%) | 64 (8.7%) |
| $15,000 to $19,999 | 36 (1.2%) | 6 (0.8%) |
| $20,000 to $24,999 | 24 (0.8%) | 0 (0.0%) |
| $25,000 to $34,999 | 58 (1.9%) | 67 (9.1%) |
| $35,000 to $49,999 | 260 (8.6%) | 141 (19.1%) |
| $50,000 to $74,999 | 262 (8.7%) | 43 (5.8%) |
| $75,000 to $99,999 | 274 (9.1%) | 140 (18.9%) |
| $100,000 to $149,999 | 586 (19.4%) | 134 (18.1%) |
| $150,000 or more | 1,412 (46.8%) | 29 (3.9%) |
| Total | 3,015 (100.0%) | 739 (100.0%) |
Monthly Housing Cost Tiers in Lake Grove
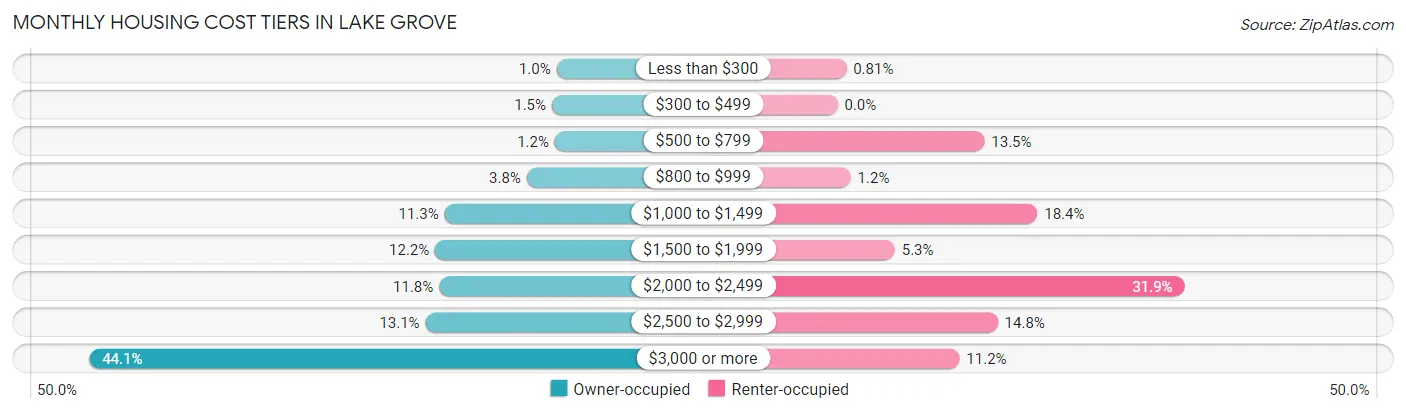
| Monthly Cost | Owner-occupied | Renter-occupied |
| Less than $300 | 31 (1.0%) | 6 (0.8%) |
| $300 to $499 | 44 (1.5%) | 0 (0.0%) |
| $500 to $799 | 36 (1.2%) | 100 (13.5%) |
| $800 to $999 | 114 (3.8%) | 9 (1.2%) |
| $1,000 to $1,499 | 342 (11.3%) | 136 (18.4%) |
| $1,500 to $1,999 | 368 (12.2%) | 39 (5.3%) |
| $2,000 to $2,499 | 357 (11.8%) | 236 (31.9%) |
| $2,500 to $2,999 | 395 (13.1%) | 109 (14.7%) |
| $3,000 or more | 1,328 (44.1%) | 83 (11.2%) |
| Total | 3,015 (100.0%) | 739 (100.0%) |
Physical Housing Characteristics in Lake Grove
Housing Structures in Lake Grove
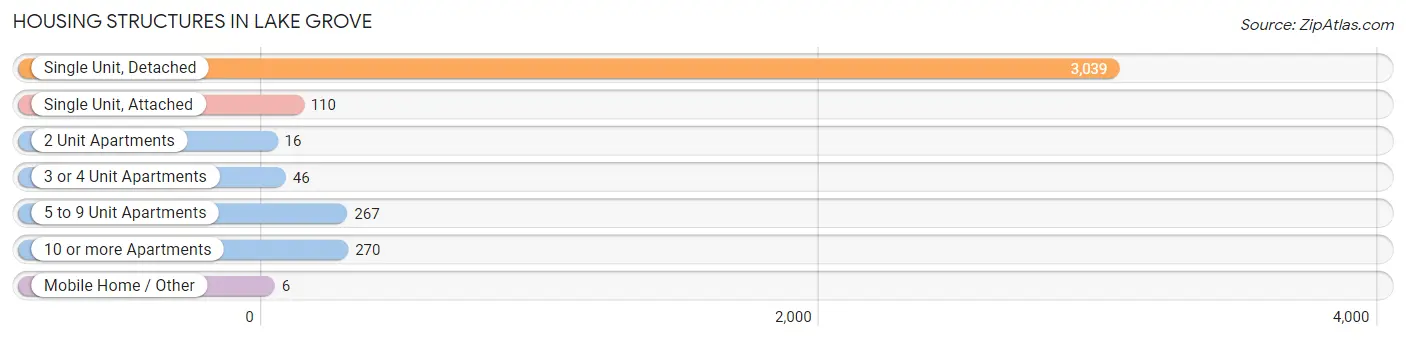
| Structure Type | # Housing Units | % Housing Units |
| Single Unit, Detached | 3,039 | 80.9% |
| Single Unit, Attached | 110 | 2.9% |
| 2 Unit Apartments | 16 | 0.4% |
| 3 or 4 Unit Apartments | 46 | 1.2% |
| 5 to 9 Unit Apartments | 267 | 7.1% |
| 10 or more Apartments | 270 | 7.2% |
| Mobile Home / Other | 6 | 0.2% |
| Total | 3,754 | 100.0% |
Housing Structures by Occupancy in Lake Grove
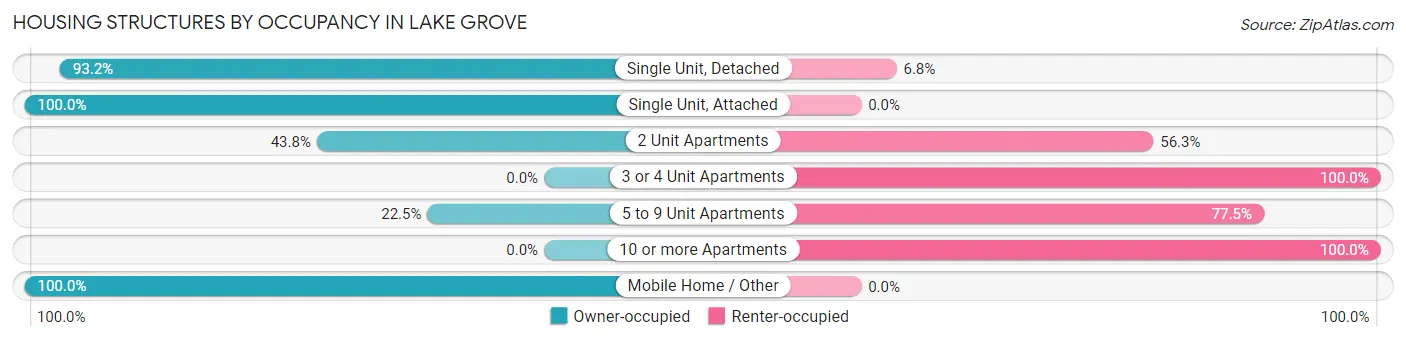
| Structure Type | Owner-occupied | Renter-occupied |
| Single Unit, Detached | 2,832 (93.2%) | 207 (6.8%) |
| Single Unit, Attached | 110 (100.0%) | 0 (0.0%) |
| 2 Unit Apartments | 7 (43.8%) | 9 (56.2%) |
| 3 or 4 Unit Apartments | 0 (0.0%) | 46 (100.0%) |
| 5 to 9 Unit Apartments | 60 (22.5%) | 207 (77.5%) |
| 10 or more Apartments | 0 (0.0%) | 270 (100.0%) |
| Mobile Home / Other | 6 (100.0%) | 0 (0.0%) |
| Total | 3,015 (80.3%) | 739 (19.7%) |
Housing Structures by Number of Rooms in Lake Grove
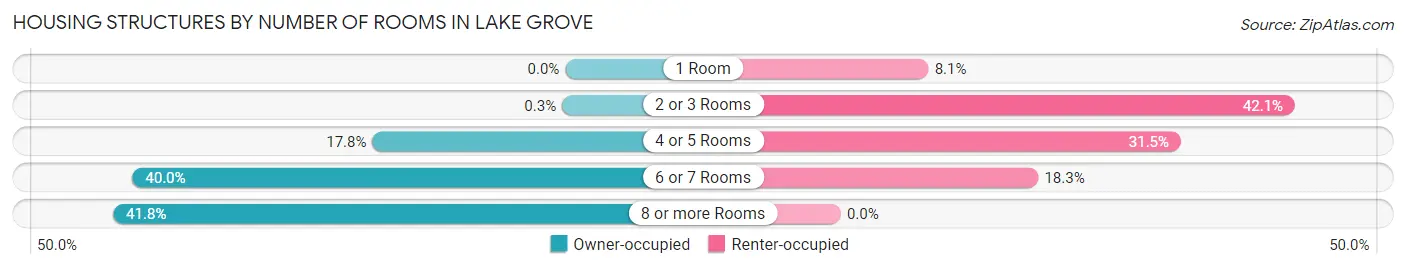
| Number of Rooms | Owner-occupied | Renter-occupied |
| 1 Room | 0 (0.0%) | 60 (8.1%) |
| 2 or 3 Rooms | 9 (0.3%) | 311 (42.1%) |
| 4 or 5 Rooms | 538 (17.8%) | 233 (31.5%) |
| 6 or 7 Rooms | 1,207 (40.0%) | 135 (18.3%) |
| 8 or more Rooms | 1,261 (41.8%) | 0 (0.0%) |
| Total | 3,015 (100.0%) | 739 (100.0%) |
Housing Structure by Heating Type in Lake Grove
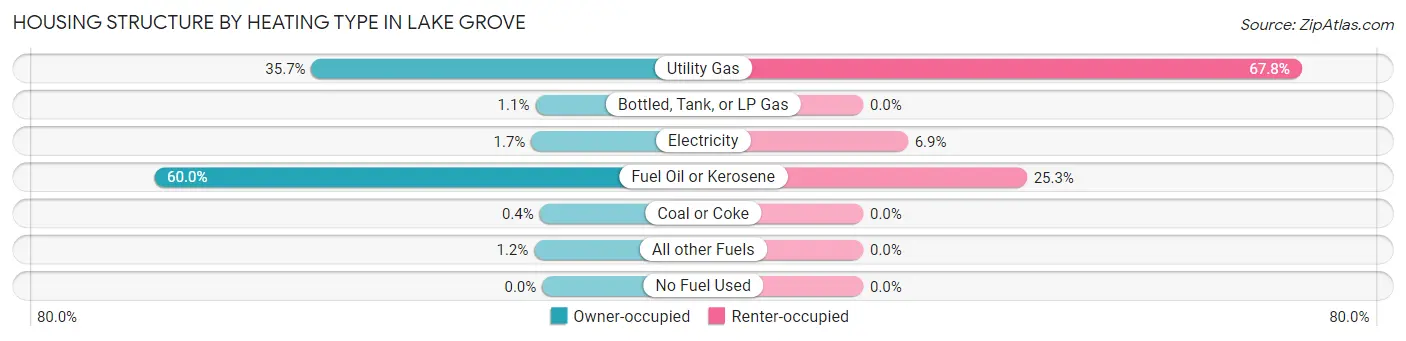
| Heating Type | Owner-occupied | Renter-occupied |
| Utility Gas | 1,075 (35.7%) | 501 (67.8%) |
| Bottled, Tank, or LP Gas | 32 (1.1%) | 0 (0.0%) |
| Electricity | 51 (1.7%) | 51 (6.9%) |
| Fuel Oil or Kerosene | 1,808 (60.0%) | 187 (25.3%) |
| Coal or Coke | 12 (0.4%) | 0 (0.0%) |
| All other Fuels | 37 (1.2%) | 0 (0.0%) |
| No Fuel Used | 0 (0.0%) | 0 (0.0%) |
| Total | 3,015 (100.0%) | 739 (100.0%) |
Household Vehicle Usage in Lake Grove
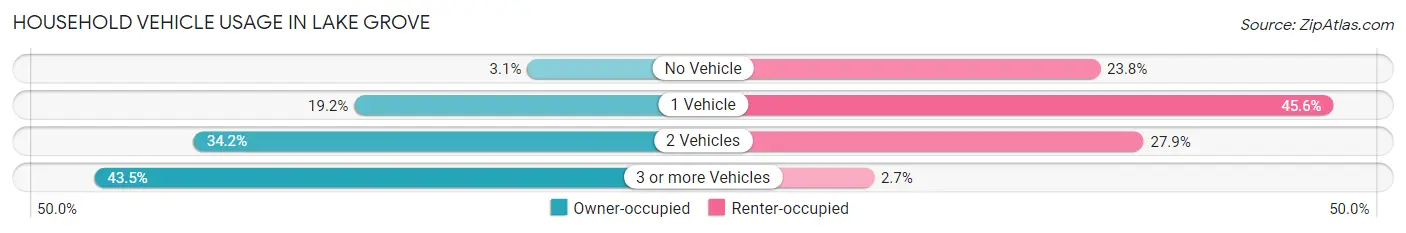
| Vehicles per Household | Owner-occupied | Renter-occupied |
| No Vehicle | 93 (3.1%) | 176 (23.8%) |
| 1 Vehicle | 580 (19.2%) | 337 (45.6%) |
| 2 Vehicles | 1,031 (34.2%) | 206 (27.9%) |
| 3 or more Vehicles | 1,311 (43.5%) | 20 (2.7%) |
| Total | 3,015 (100.0%) | 739 (100.0%) |
Real Estate & Mortgages in Lake Grove
Real Estate and Mortgage Overview in Lake Grove
| Characteristic | Without Mortgage | With Mortgage |
| Housing Units | 808 | 2,207 |
| Median Property Value | $478,000 | $507,900 |
| Median Household Income | $93,542 | $1,174 |
| Monthly Housing Costs | $1,302 | $1,328 |
| Real Estate Taxes | $8,945 | $36 |
Property Value by Mortgage Status in Lake Grove
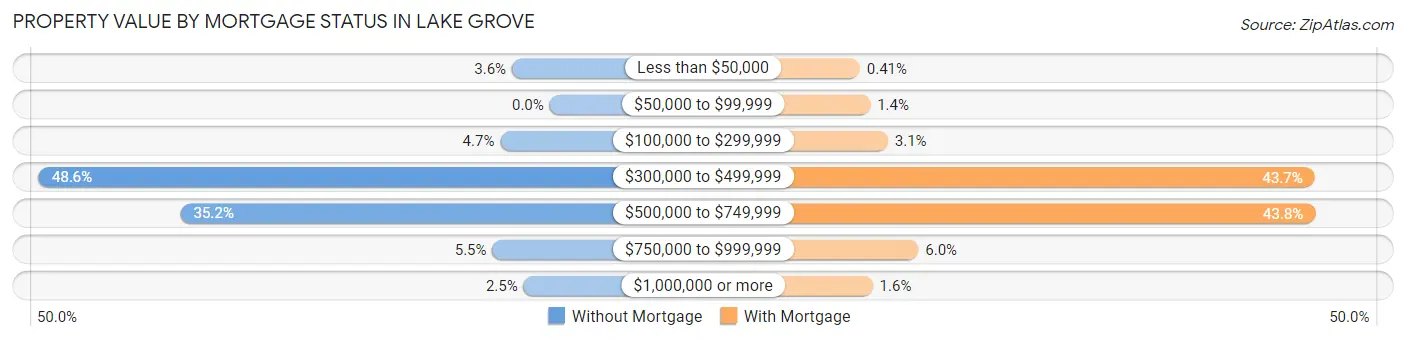
| Property Value | Without Mortgage | With Mortgage |
| Less than $50,000 | 29 (3.6%) | 9 (0.4%) |
| $50,000 to $99,999 | 0 (0.0%) | 31 (1.4%) |
| $100,000 to $299,999 | 38 (4.7%) | 68 (3.1%) |
| $300,000 to $499,999 | 393 (48.6%) | 965 (43.7%) |
| $500,000 to $749,999 | 284 (35.1%) | 966 (43.8%) |
| $750,000 to $999,999 | 44 (5.4%) | 132 (6.0%) |
| $1,000,000 or more | 20 (2.5%) | 36 (1.6%) |
| Total | 808 (100.0%) | 2,207 (100.0%) |
Household Income by Mortgage Status in Lake Grove
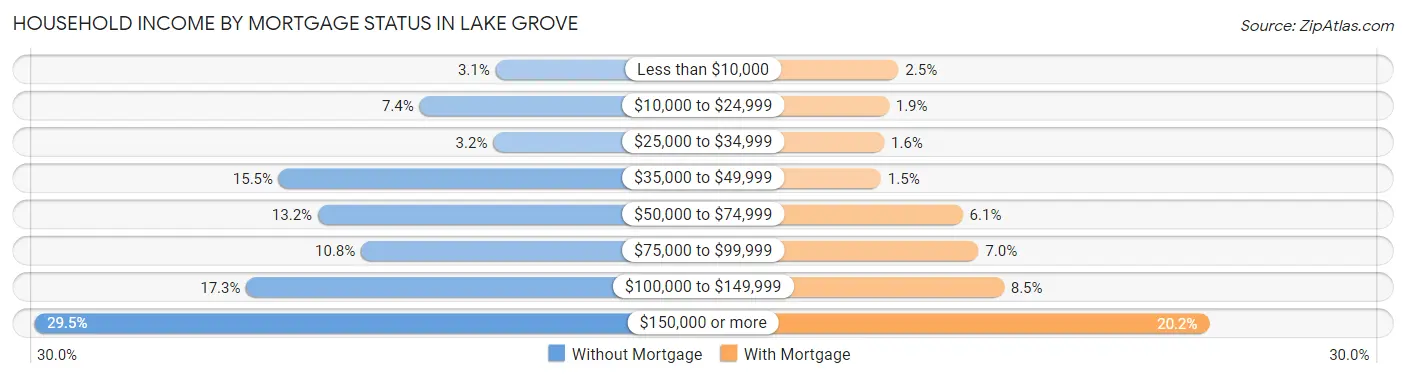
| Household Income | Without Mortgage | With Mortgage |
| Less than $10,000 | 25 (3.1%) | 54 (2.5%) |
| $10,000 to $24,999 | 60 (7.4%) | 42 (1.9%) |
| $25,000 to $34,999 | 26 (3.2%) | 36 (1.6%) |
| $35,000 to $49,999 | 125 (15.5%) | 32 (1.5%) |
| $50,000 to $74,999 | 107 (13.2%) | 135 (6.1%) |
| $75,000 to $99,999 | 87 (10.8%) | 155 (7.0%) |
| $100,000 to $149,999 | 140 (17.3%) | 187 (8.5%) |
| $150,000 or more | 238 (29.5%) | 446 (20.2%) |
| Total | 808 (100.0%) | 2,207 (100.0%) |
Property Value to Household Income Ratio in Lake Grove
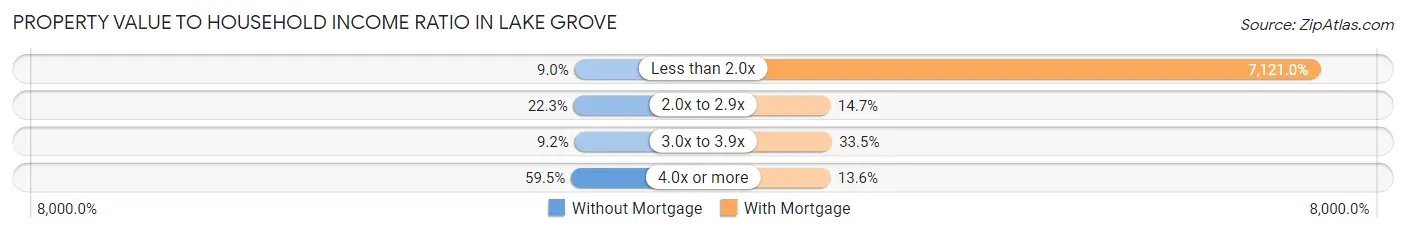
| Value-to-Income Ratio | Without Mortgage | With Mortgage |
| Less than 2.0x | 73 (9.0%) | 157,161 (7,121.0%) |
| 2.0x to 2.9x | 180 (22.3%) | 325 (14.7%) |
| 3.0x to 3.9x | 74 (9.2%) | 740 (33.5%) |
| 4.0x or more | 481 (59.5%) | 299 (13.6%) |
| Total | 808 (100.0%) | 2,207 (100.0%) |
Real Estate Taxes by Mortgage Status in Lake Grove
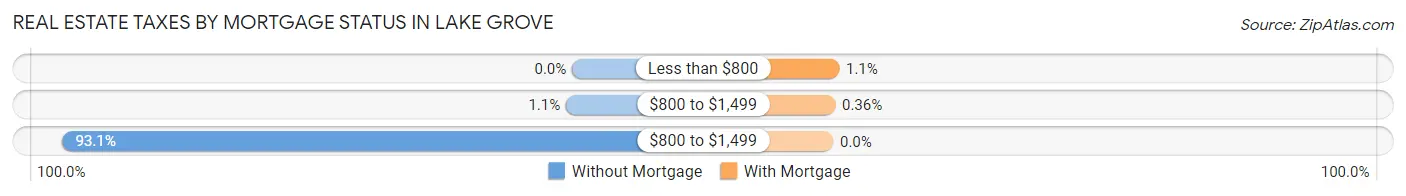
| Property Taxes | Without Mortgage | With Mortgage |
| Less than $800 | 0 (0.0%) | 24 (1.1%) |
| $800 to $1,499 | 9 (1.1%) | 8 (0.4%) |
| $800 to $1,499 | 752 (93.1%) | 0 (0.0%) |
| Total | 808 (100.0%) | 2,207 (100.0%) |
Health & Disability in Lake Grove
Health Insurance Coverage by Age in Lake Grove
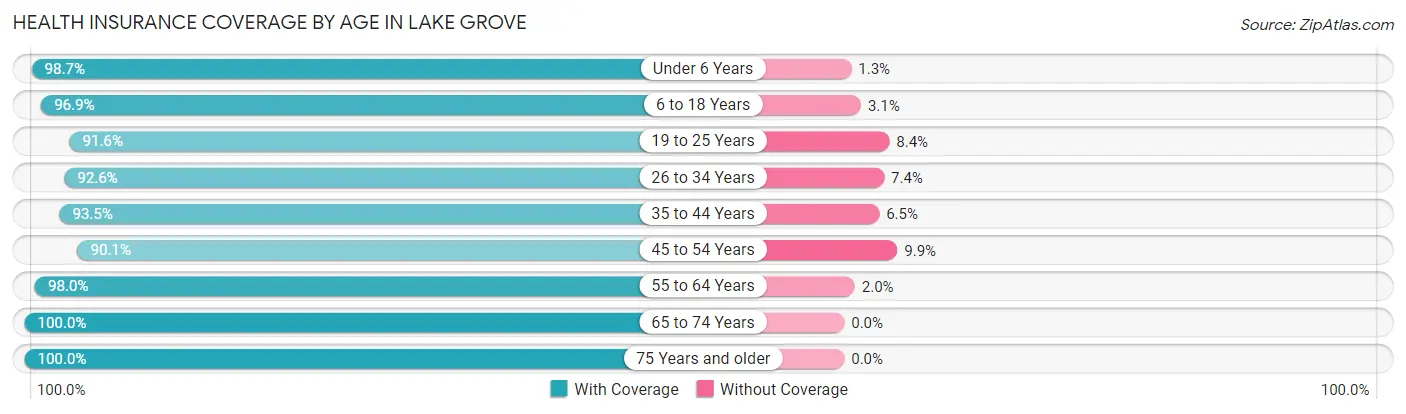
| Age Bracket | With Coverage | Without Coverage |
| Under 6 Years | 528 (98.7%) | 7 (1.3%) |
| 6 to 18 Years | 1,930 (96.9%) | 62 (3.1%) |
| 19 to 25 Years | 1,080 (91.6%) | 99 (8.4%) |
| 26 to 34 Years | 1,109 (92.6%) | 89 (7.4%) |
| 35 to 44 Years | 1,092 (93.5%) | 76 (6.5%) |
| 45 to 54 Years | 1,494 (90.1%) | 164 (9.9%) |
| 55 to 64 Years | 1,704 (98.0%) | 34 (2.0%) |
| 65 to 74 Years | 843 (100.0%) | 0 (0.0%) |
| 75 Years and older | 732 (100.0%) | 0 (0.0%) |
| Total | 10,512 (95.2%) | 531 (4.8%) |
Health Insurance Coverage by Citizenship Status in Lake Grove
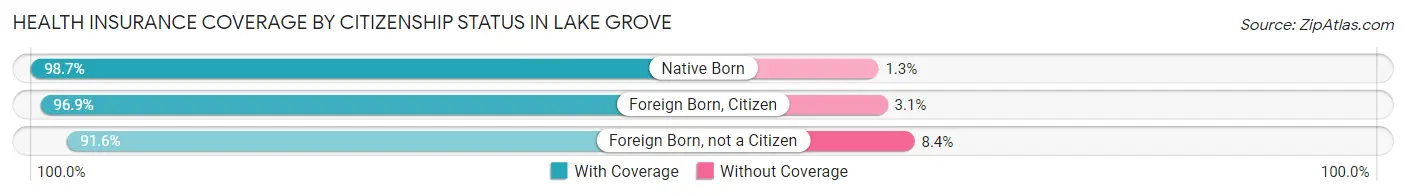
| Citizenship Status | With Coverage | Without Coverage |
| Native Born | 528 (98.7%) | 7 (1.3%) |
| Foreign Born, Citizen | 1,930 (96.9%) | 62 (3.1%) |
| Foreign Born, not a Citizen | 1,080 (91.6%) | 99 (8.4%) |
Health Insurance Coverage by Household Income in Lake Grove
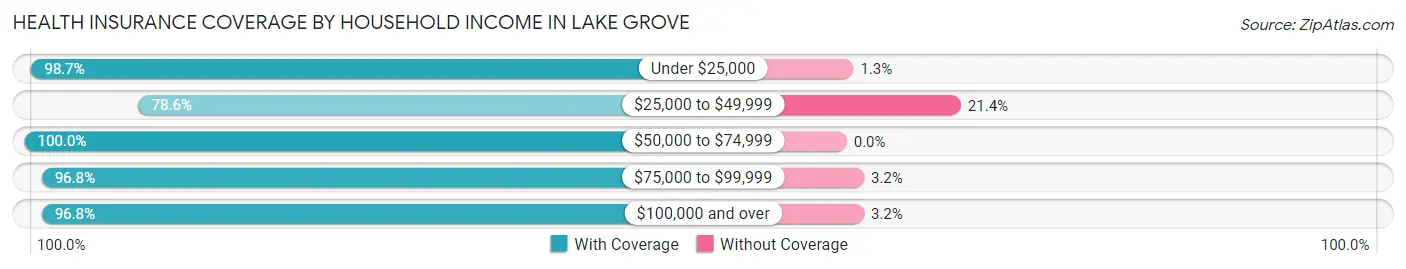
| Household Income | With Coverage | Without Coverage |
| Under $25,000 | 471 (98.7%) | 6 (1.3%) |
| $25,000 to $49,999 | 912 (78.6%) | 248 (21.4%) |
| $50,000 to $74,999 | 773 (100.0%) | 0 (0.0%) |
| $75,000 to $99,999 | 993 (96.8%) | 33 (3.2%) |
| $100,000 and over | 7,344 (96.8%) | 244 (3.2%) |
Public vs Private Health Insurance Coverage by Age in Lake Grove
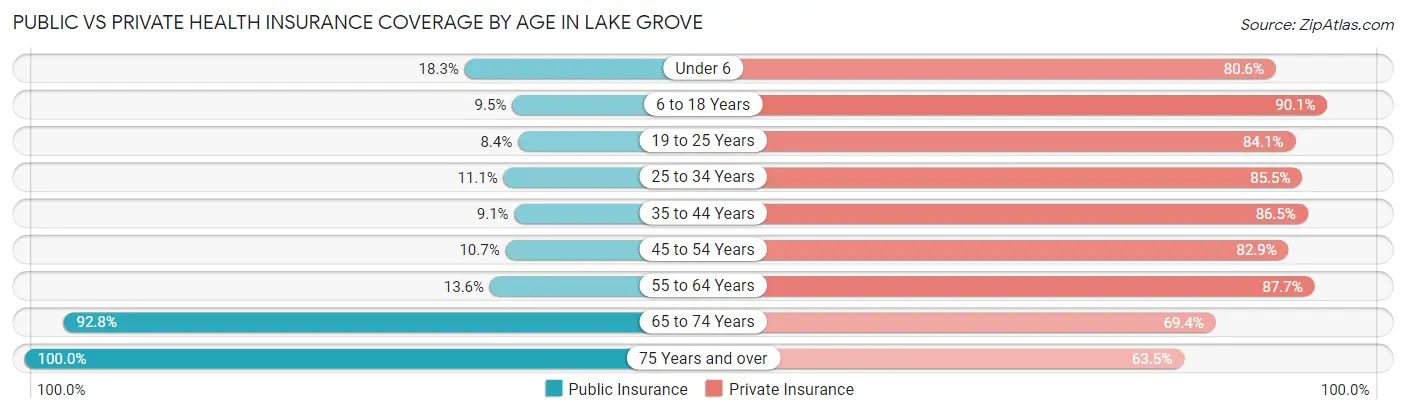
| Age Bracket | Public Insurance | Private Insurance |
| Under 6 | 98 (18.3%) | 431 (80.6%) |
| 6 to 18 Years | 189 (9.5%) | 1,795 (90.1%) |
| 19 to 25 Years | 99 (8.4%) | 992 (84.1%) |
| 25 to 34 Years | 133 (11.1%) | 1,024 (85.5%) |
| 35 to 44 Years | 106 (9.1%) | 1,010 (86.5%) |
| 45 to 54 Years | 178 (10.7%) | 1,375 (82.9%) |
| 55 to 64 Years | 237 (13.6%) | 1,525 (87.7%) |
| 65 to 74 Years | 782 (92.8%) | 585 (69.4%) |
| 75 Years and over | 732 (100.0%) | 465 (63.5%) |
| Total | 2,554 (23.1%) | 9,202 (83.3%) |
Disability Status by Sex by Age in Lake Grove
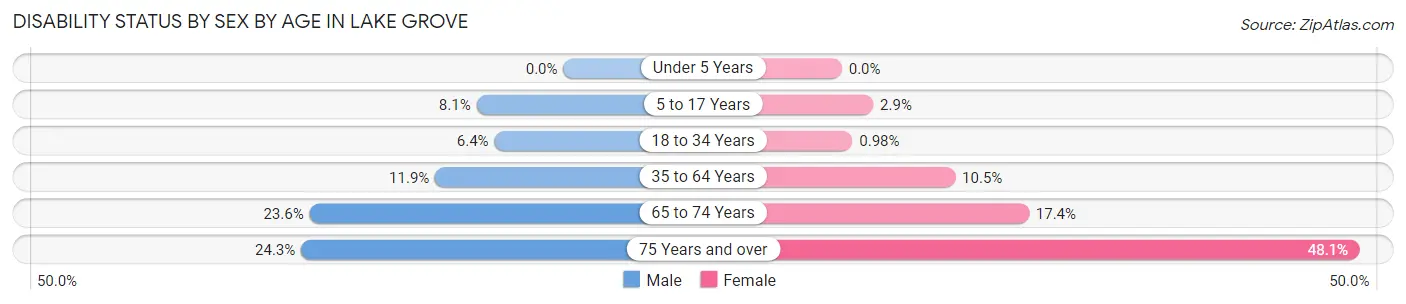
| Age Bracket | Male | Female |
| Under 5 Years | 0 (0.0%) | 0 (0.0%) |
| 5 to 17 Years | 95 (8.1%) | 25 (2.9%) |
| 18 to 34 Years | 84 (6.4%) | 11 (1.0%) |
| 35 to 64 Years | 282 (11.9%) | 231 (10.5%) |
| 65 to 74 Years | 86 (23.6%) | 83 (17.4%) |
| 75 Years and over | 83 (24.3%) | 188 (48.1%) |
Disability Class by Sex by Age in Lake Grove
Disability Class: Hearing Difficulty
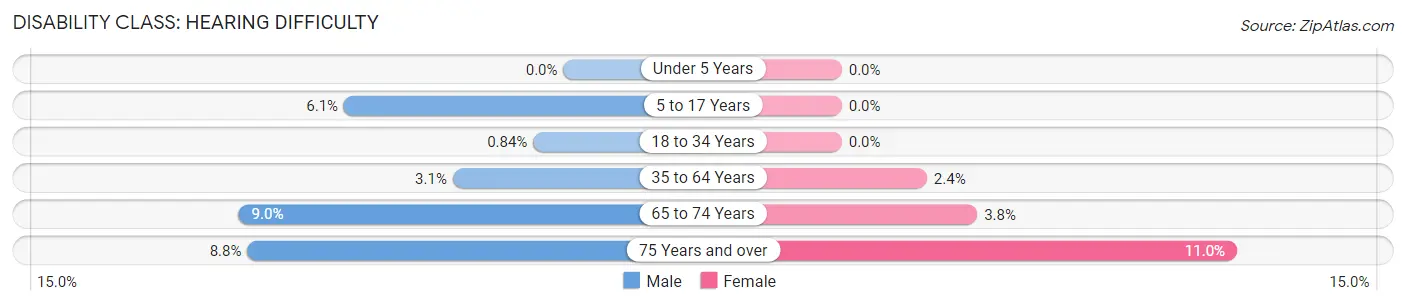
| Age Bracket | Male | Female |
| Under 5 Years | 0 (0.0%) | 0 (0.0%) |
| 5 to 17 Years | 72 (6.1%) | 0 (0.0%) |
| 18 to 34 Years | 11 (0.8%) | 0 (0.0%) |
| 35 to 64 Years | 73 (3.1%) | 52 (2.4%) |
| 65 to 74 Years | 33 (9.0%) | 18 (3.8%) |
| 75 Years and over | 30 (8.8%) | 43 (11.0%) |
Disability Class: Vision Difficulty
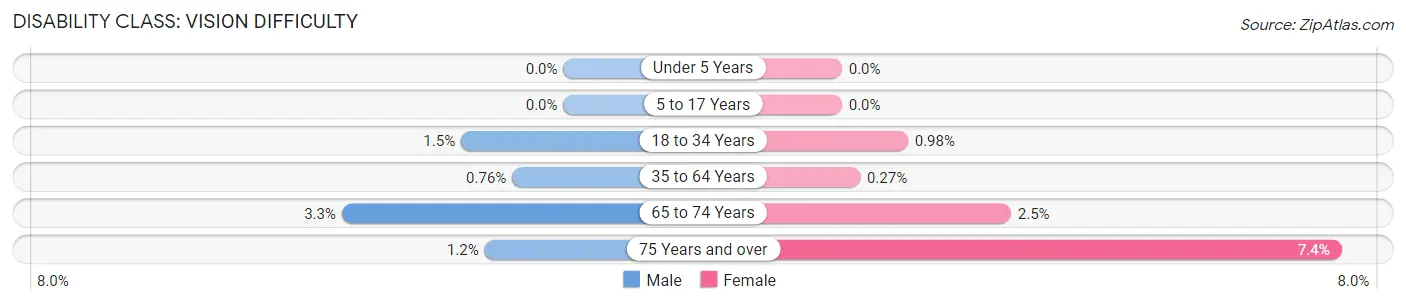
| Age Bracket | Male | Female |
| Under 5 Years | 0 (0.0%) | 0 (0.0%) |
| 5 to 17 Years | 0 (0.0%) | 0 (0.0%) |
| 18 to 34 Years | 20 (1.5%) | 11 (1.0%) |
| 35 to 64 Years | 18 (0.8%) | 6 (0.3%) |
| 65 to 74 Years | 12 (3.3%) | 12 (2.5%) |
| 75 Years and over | 4 (1.2%) | 29 (7.4%) |
Disability Class: Cognitive Difficulty
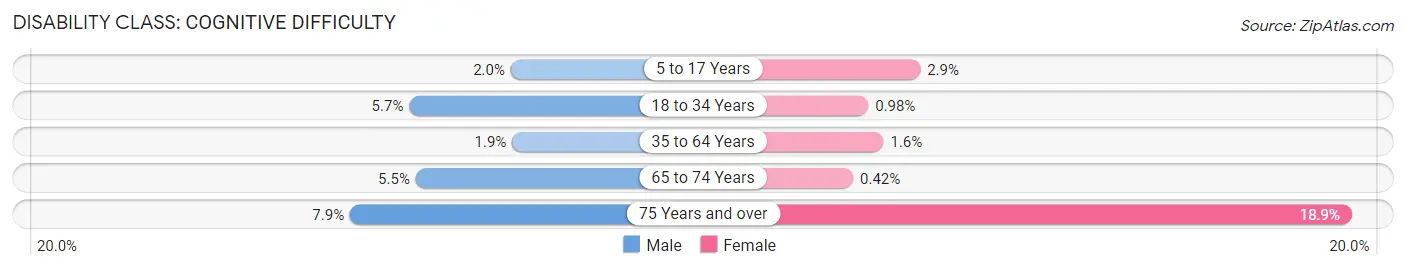
| Age Bracket | Male | Female |
| 5 to 17 Years | 23 (1.9%) | 25 (2.9%) |
| 18 to 34 Years | 75 (5.7%) | 11 (1.0%) |
| 35 to 64 Years | 45 (1.9%) | 34 (1.5%) |
| 65 to 74 Years | 20 (5.5%) | 2 (0.4%) |
| 75 Years and over | 27 (7.9%) | 74 (18.9%) |
Disability Class: Ambulatory Difficulty
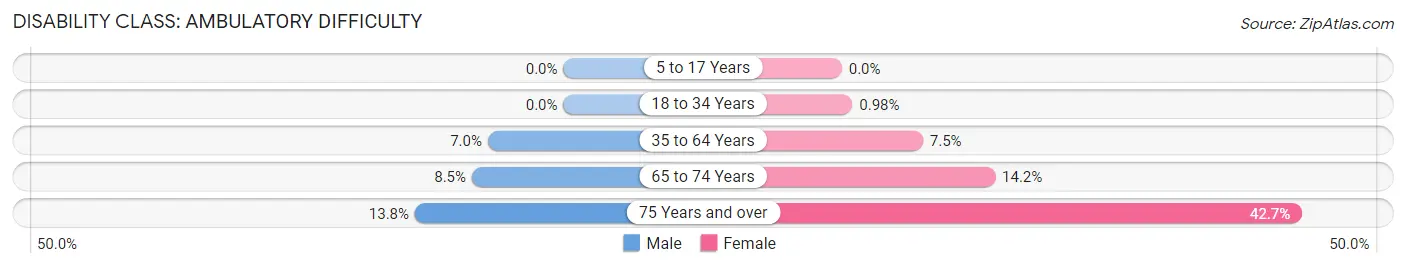
| Age Bracket | Male | Female |
| 5 to 17 Years | 0 (0.0%) | 0 (0.0%) |
| 18 to 34 Years | 0 (0.0%) | 11 (1.0%) |
| 35 to 64 Years | 166 (7.0%) | 165 (7.5%) |
| 65 to 74 Years | 31 (8.5%) | 68 (14.2%) |
| 75 Years and over | 47 (13.8%) | 167 (42.7%) |
Disability Class: Self-Care Difficulty
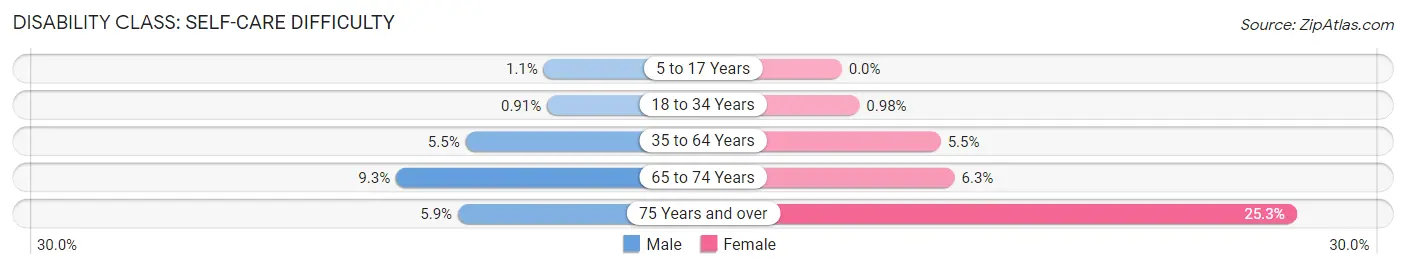
| Age Bracket | Male | Female |
| 5 to 17 Years | 13 (1.1%) | 0 (0.0%) |
| 18 to 34 Years | 12 (0.9%) | 11 (1.0%) |
| 35 to 64 Years | 129 (5.4%) | 121 (5.5%) |
| 65 to 74 Years | 34 (9.3%) | 30 (6.3%) |
| 75 Years and over | 20 (5.9%) | 99 (25.3%) |
Technology Access in Lake Grove
Computing Device Access in Lake Grove
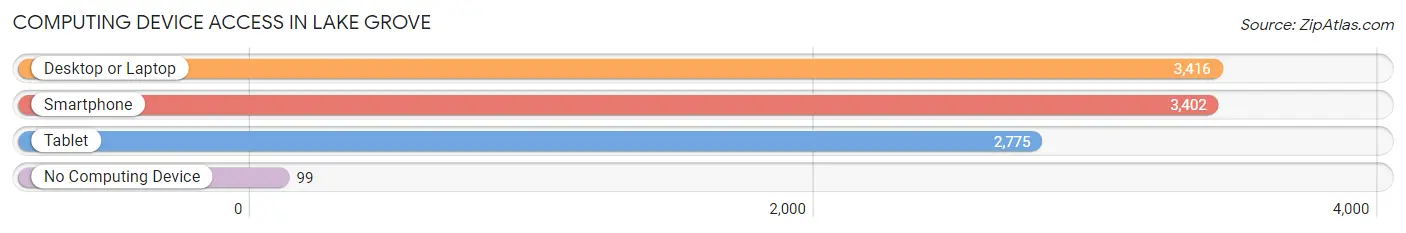
| Device Type | # Households | % Households |
| Desktop or Laptop | 3,416 | 91.0% |
| Smartphone | 3,402 | 90.6% |
| Tablet | 2,775 | 73.9% |
| No Computing Device | 99 | 2.6% |
| Total | 3,754 | 100.0% |
Internet Access in Lake Grove
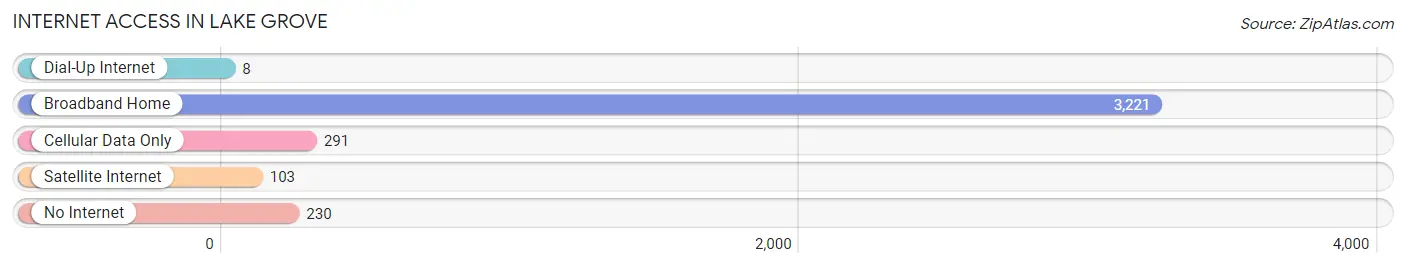
| Internet Type | # Households | % Households |
| Dial-Up Internet | 8 | 0.2% |
| Broadband Home | 3,221 | 85.8% |
| Cellular Data Only | 291 | 7.7% |
| Satellite Internet | 103 | 2.7% |
| No Internet | 230 | 6.1% |
| Total | 3,754 | 100.0% |
Lake Grove Summary
History
Lake Grove is a hamlet located in the Town of Brookhaven in Suffolk County, New York. It is situated on the north shore of Long Island, approximately 60 miles east of New York City. The hamlet was originally part of the Setauket Indians’ territory, and was first settled by Europeans in the late 1600s. The area was known as “Stump Lot” until the mid-1800s, when it was renamed “Lake Grove” after the nearby lake.
In the late 1800s, Lake Grove began to develop as a summer resort community. The area was known for its natural beauty, and many wealthy New Yorkers built large estates in the area. The hamlet was also home to several resorts, including the Lake Grove Hotel, which opened in 1891.
In the early 1900s, Lake Grove began to transition from a resort community to a residential community. The hamlet was incorporated in 1921, and the population grew steadily throughout the 20th century. By the 2000s, Lake Grove had become a popular bedroom community for New York City commuters.
Geography
Lake Grove is located in the Town of Brookhaven in Suffolk County, New York. It is situated on the north shore of Long Island, approximately 60 miles east of New York City. The hamlet is bordered by the hamlets of Nesconset to the west, Stony Brook to the north, and Centereach to the east.
The terrain of Lake Grove is mostly flat, with some rolling hills. The hamlet is home to several lakes, including Lake Grove Lake, which is the largest. The lake is a popular spot for fishing, swimming, and boating.
Economy
The economy of Lake Grove is largely based on retail and services. The hamlet is home to several shopping centers, including the Smith Haven Mall, which is the largest in Suffolk County. The mall is home to over 150 stores and restaurants, and is a popular destination for shoppers from all over Long Island.
The hamlet is also home to several corporate offices, including those of the pharmaceutical company Pfizer and the financial services company MetLife. In addition, Lake Grove is home to several small businesses, including restaurants, boutiques, and professional services.
Demographics
As of the 2010 census, the population of Lake Grove was 11,907. The population is predominantly white (86.3%), with smaller percentages of African Americans (4.7%), Asians (4.2%), and Hispanics (3.7%). The median household income is $90,945, and the median home value is $400,000.
The majority of the population (77.3%) is married, and the median age is 43. The hamlet is home to several schools, including the Lake Grove Elementary School, the Lake Grove Middle School, and the Lake Grove High School.
Conclusion
Lake Grove is a hamlet located in the Town of Brookhaven in Suffolk County, New York. It is situated on the north shore of Long Island, approximately 60 miles east of New York City. The hamlet was originally part of the Setauket Indians’ territory, and was first settled by Europeans in the late 1600s. The area was known as “Stump Lot” until the mid-1800s, when it was renamed “Lake Grove” after the nearby lake. In the late 1800s, Lake Grove began to develop as a summer resort community, and by the 2000s, it had become a popular bedroom community for New York City commuters. The economy of Lake Grove is largely based on retail and services, and the population is predominantly white. The median household income is $90,945, and the median home value is $400,000.
Common Questions
What is Per Capita Income in Lake Grove?
Per Capita income in Lake Grove is $49,057.
What is the Median Family Income in Lake Grove?
Median Family Income in Lake Grove is $136,349.
What is the Median Household income in Lake Grove?
Median Household Income in Lake Grove is $114,381.
What is Income or Wage Gap in Lake Grove?
Income or Wage Gap in Lake Grove is 29.1%.
Women in Lake Grove earn 70.9 cents for every dollar earned by a man.
What is Inequality or Gini Index in Lake Grove?
Inequality or Gini Index in Lake Grove is 0.42.
What is the Total Population of Lake Grove?
Total Population of Lake Grove is 11,066.
What is the Total Male Population of Lake Grove?
Total Male Population of Lake Grove is 5,868.
What is the Total Female Population of Lake Grove?
Total Female Population of Lake Grove is 5,198.
What is the Ratio of Males per 100 Females in Lake Grove?
There are 112.89 Males per 100 Females in Lake Grove.
What is the Ratio of Females per 100 Males in Lake Grove?
There are 88.58 Females per 100 Males in Lake Grove.
What is the Median Population Age in Lake Grove?
Median Population Age in Lake Grove is 40.6 Years.
What is the Average Family Size in Lake Grove
Average Family Size in Lake Grove is 3.5 People.
What is the Average Household Size in Lake Grove
Average Household Size in Lake Grove is 2.9 People.
How Large is the Labor Force in Lake Grove?
There are 5,819 People in the Labor Forcein in Lake Grove.
What is the Percentage of People in the Labor Force in Lake Grove?
65.3% of People are in the Labor Force in Lake Grove.
What is the Unemployment Rate in Lake Grove?
Unemployment Rate in Lake Grove is 5.2%.