Freedom Plains, NY Map & Demographics
Freedom Plains Map
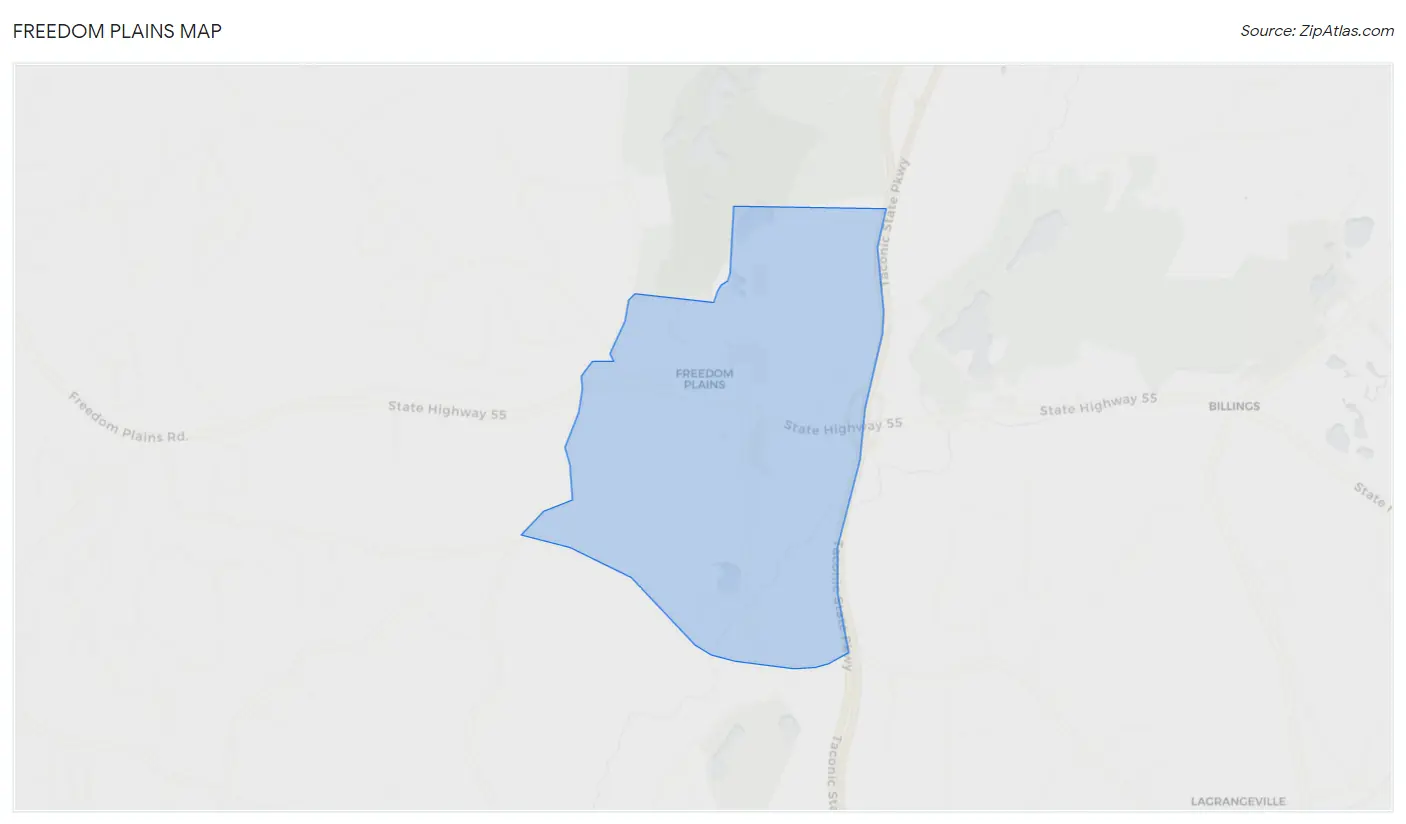
Freedom Plains Overview
$27,825
PER CAPITA INCOME
0.40
INEQUALITY / GINI INDEX
641
TOTAL POPULATION
258
MALE POPULATION
383
FEMALE POPULATION
67.36
MALES / 100 FEMALES
148.45
FEMALES / 100 MALES
37.4
MEDIAN AGE
2.8
AVG FAMILY SIZE
2.5
AVG HOUSEHOLD SIZE
453
LABOR FORCE [ PEOPLE ]
81.6%
PERCENT IN LABOR FORCE
Income in Freedom Plains
Income Overview in Freedom Plains
| Characteristic | Number | Measure |
| Per Capita Income | 641 | $27,825 |
| Median Family Income | 207 | $0 |
| Mean Family Income | 207 | $66,375 |
| Median Household Income | 261 | $0 |
| Mean Household Income | 261 | $68,508 |
| Income Deficit | 207 | $0 |
| Wage / Income Gap (%) | 641 | 0.00% |
| Wage / Income Gap ($) | 641 | 100.00¢ per $1 |
| Gini / Inequality Index | 641 | 0.40 |
Earnings by Sex in Freedom Plains
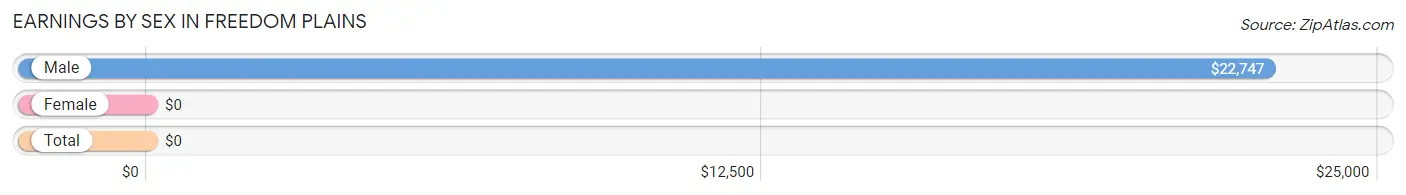
| Sex | Number | Average Earnings |
| Male | 211 (46.6%) | $22,747 |
| Female | 242 (53.4%) | $0 |
| Total | 453 (100.0%) | $0 |
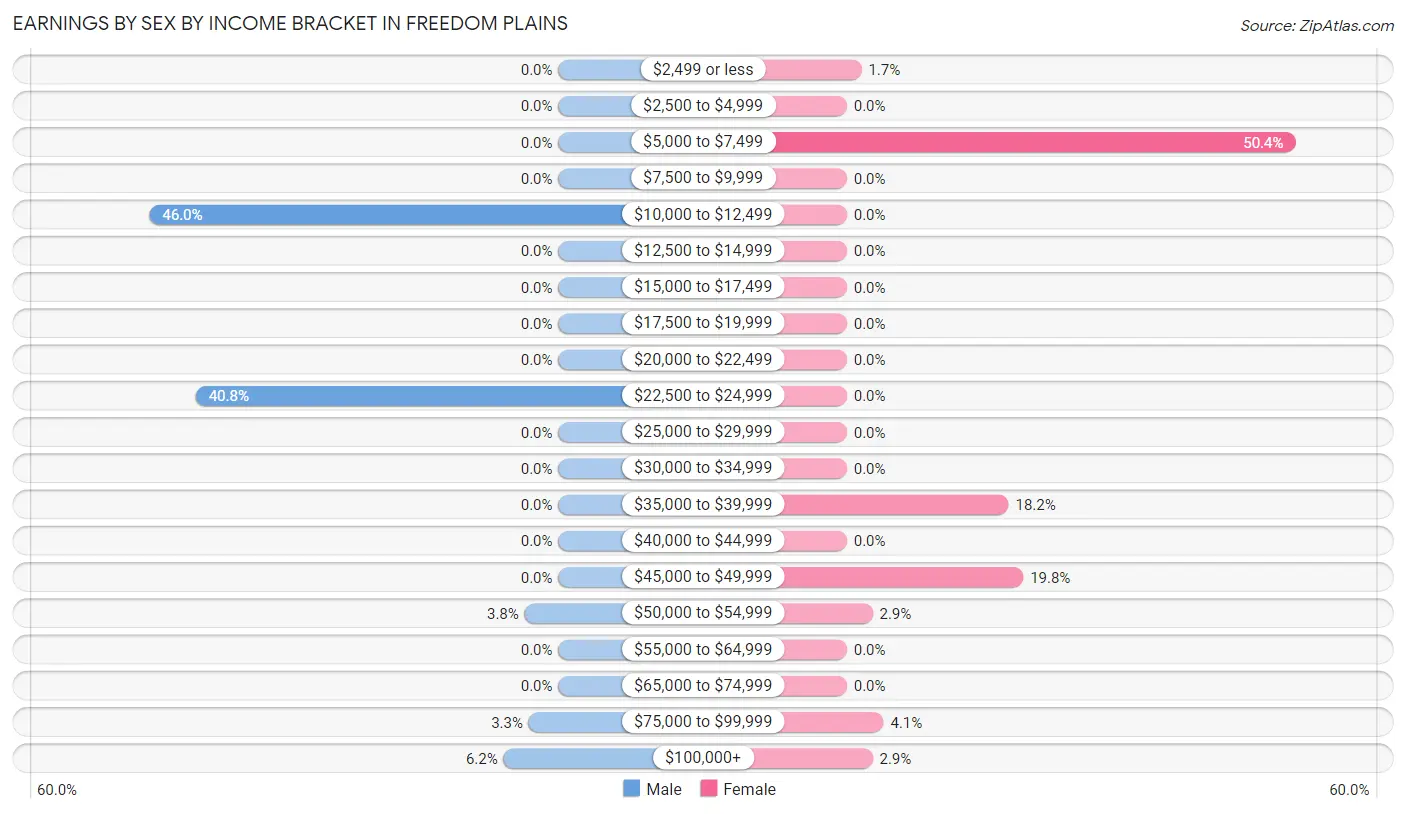
Earnings by Sex by Income Bracket in Freedom Plains
The most common earnings brackets in Freedom Plains are $10,000 to $12,499 for men (97 | 46.0%) and $5,000 to $7,499 for women (122 | 50.4%).
| Income | Male | Female |
| $2,499 or less | 0 (0.0%) | 4 (1.7%) |
| $2,500 to $4,999 | 0 (0.0%) | 0 (0.0%) |
| $5,000 to $7,499 | 0 (0.0%) | 122 (50.4%) |
| $7,500 to $9,999 | 0 (0.0%) | 0 (0.0%) |
| $10,000 to $12,499 | 97 (46.0%) | 0 (0.0%) |
| $12,500 to $14,999 | 0 (0.0%) | 0 (0.0%) |
| $15,000 to $17,499 | 0 (0.0%) | 0 (0.0%) |
| $17,500 to $19,999 | 0 (0.0%) | 0 (0.0%) |
| $20,000 to $22,499 | 0 (0.0%) | 0 (0.0%) |
| $22,500 to $24,999 | 86 (40.8%) | 0 (0.0%) |
| $25,000 to $29,999 | 0 (0.0%) | 0 (0.0%) |
| $30,000 to $34,999 | 0 (0.0%) | 0 (0.0%) |
| $35,000 to $39,999 | 0 (0.0%) | 44 (18.2%) |
| $40,000 to $44,999 | 0 (0.0%) | 0 (0.0%) |
| $45,000 to $49,999 | 0 (0.0%) | 48 (19.8%) |
| $50,000 to $54,999 | 8 (3.8%) | 7 (2.9%) |
| $55,000 to $64,999 | 0 (0.0%) | 0 (0.0%) |
| $65,000 to $74,999 | 0 (0.0%) | 0 (0.0%) |
| $75,000 to $99,999 | 7 (3.3%) | 10 (4.1%) |
| $100,000+ | 13 (6.2%) | 7 (2.9%) |
| Total | 211 (100.0%) | 242 (100.0%) |
Earnings by Sex by Educational Attainment in Freedom Plains
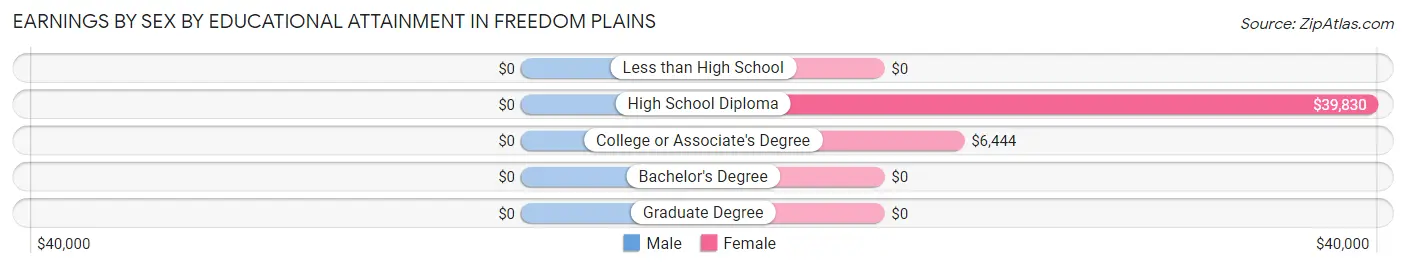
| Educational Attainment | Male Income | Female Income |
| Less than High School | - | - |
| High School Diploma | - | - |
| College or Associate's Degree | - | - |
| Bachelor's Degree | - | - |
| Graduate Degree | - | - |
| Total | $97,143 | $0 |
Family Income in Freedom Plains
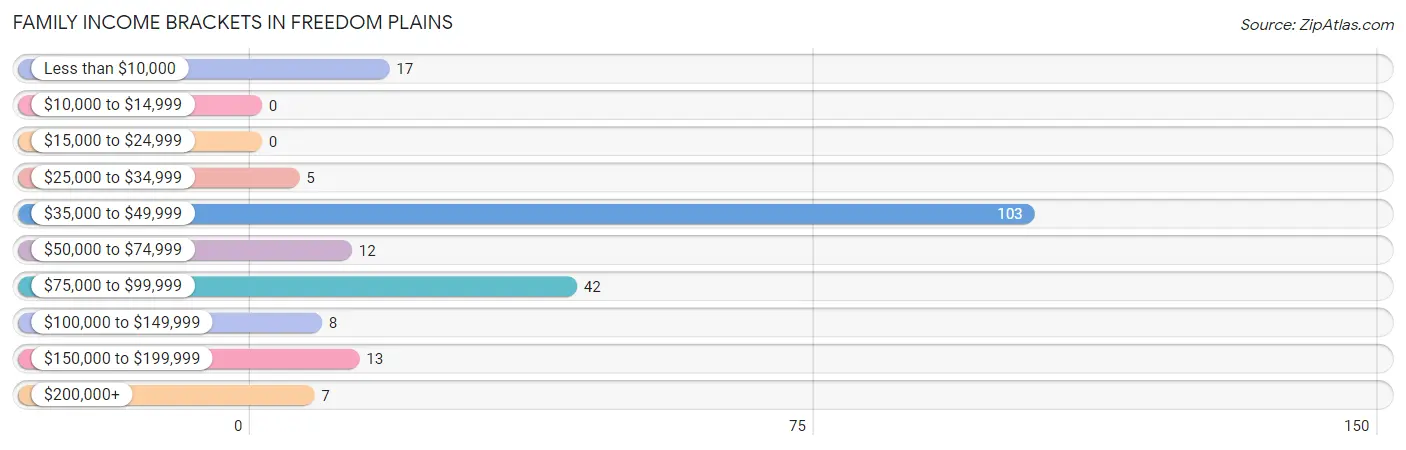
Family Income Brackets in Freedom Plains
According to the Freedom Plains family income data, there are 103 families falling into the $35,000 to $49,999 income range, which is the most common income bracket and makes up 49.8% of all families.
| Income Bracket | # Families | % Families |
| Less than $10,000 | 17 | 8.2% |
| $10,000 to $14,999 | 0 | 0.0% |
| $15,000 to $24,999 | 0 | 0.0% |
| $25,000 to $34,999 | 5 | 2.4% |
| $35,000 to $49,999 | 103 | 49.8% |
| $50,000 to $74,999 | 12 | 5.8% |
| $75,000 to $99,999 | 42 | 20.3% |
| $100,000 to $149,999 | 8 | 3.9% |
| $150,000 to $199,999 | 13 | 6.3% |
| $200,000+ | 7 | 3.4% |
Family Income by Famaliy Size in Freedom Plains
| Income Bracket | # Families | Median Income |
| 2-Person Families | 55 (26.6%) | $0 |
| 3-Person Families | 152 (73.4%) | $0 |
| 4-Person Families | 0 (0.0%) | $0 |
| 5-Person Families | 0 (0.0%) | $0 |
| 6-Person Families | 0 (0.0%) | $0 |
| 7+ Person Families | 0 (0.0%) | $0 |
| Total | 207 (100.0%) | $0 |
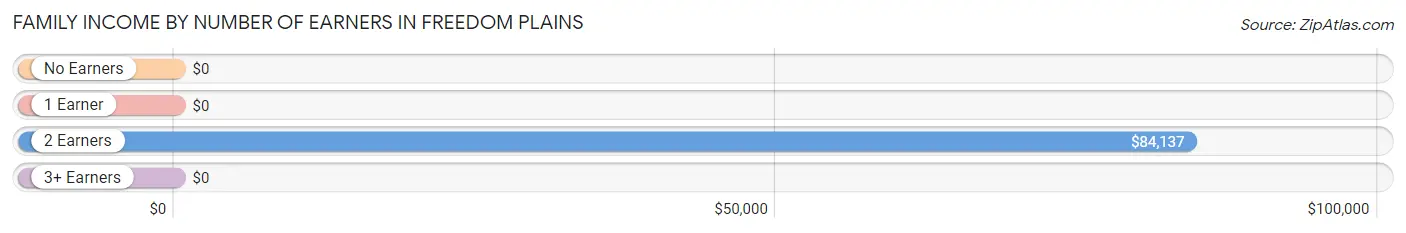
Family Income by Number of Earners in Freedom Plains
| Number of Earners | # Families | Median Income |
| No Earners | 12 (5.8%) | $0 |
| 1 Earner | 37 (17.9%) | $0 |
| 2 Earners | 55 (26.6%) | $84,137 |
| 3+ Earners | 103 (49.8%) | $0 |
| Total | 207 (100.0%) | $0 |
Household Income in Freedom Plains
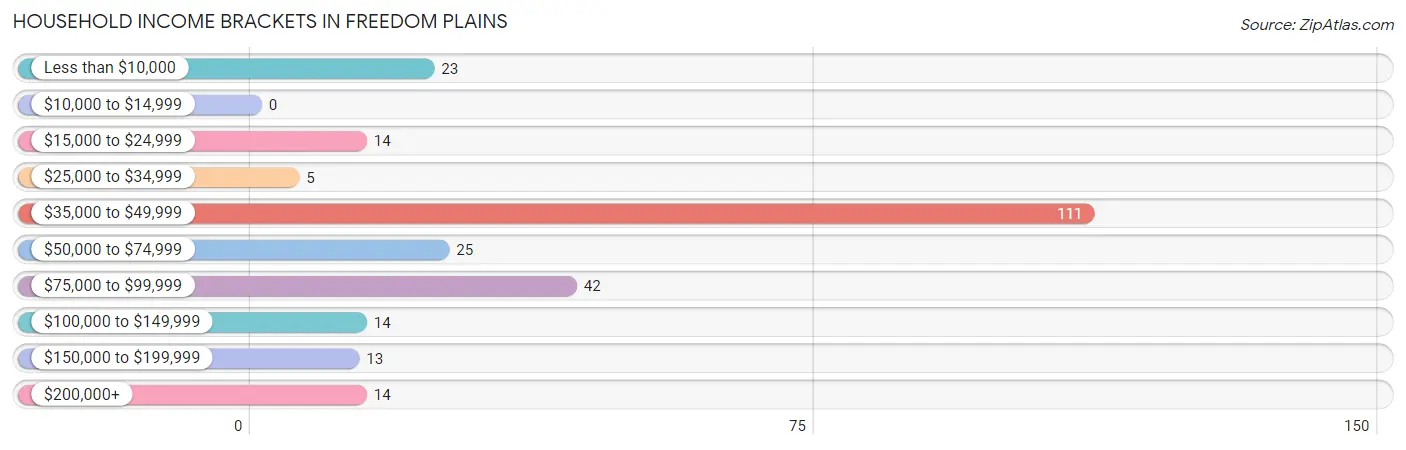
Household Income Brackets in Freedom Plains
With 111 households falling in the category, the $35,000 to $49,999 income range is the most frequent in Freedom Plains, accounting for 42.5% of all households.
| Income Bracket | # Households | % Households |
| Less than $10,000 | 23 | 8.8% |
| $10,000 to $14,999 | 0 | 0.0% |
| $15,000 to $24,999 | 14 | 5.4% |
| $25,000 to $34,999 | 5 | 1.9% |
| $35,000 to $49,999 | 111 | 42.5% |
| $50,000 to $74,999 | 25 | 9.6% |
| $75,000 to $99,999 | 42 | 16.1% |
| $100,000 to $149,999 | 14 | 5.4% |
| $150,000 to $199,999 | 13 | 5.0% |
| $200,000+ | 14 | 5.4% |
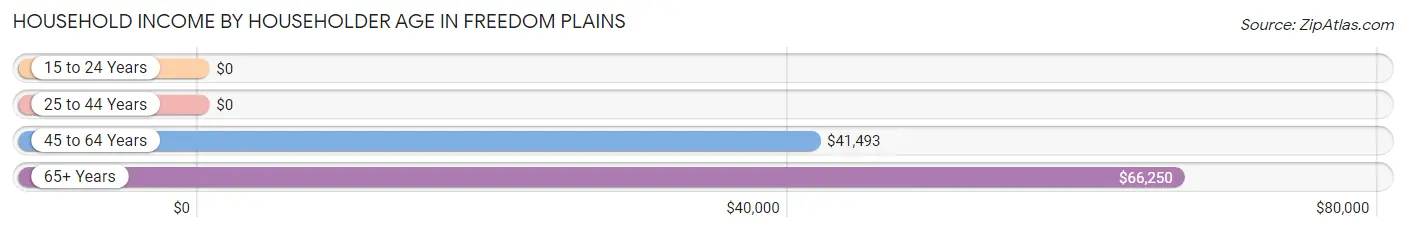
Household Income by Householder Age in Freedom Plains
The median household income in Freedom Plains is $0, with the highest median household income of $66,250 found in the 65+ years age bracket for the primary householder. A total of 57 households (21.8%) fall into this category.
| Income Bracket | # Households | Median Income |
| 15 to 24 Years | 0 (0.0%) | $0 |
| 25 to 44 Years | 67 (25.7%) | $0 |
| 45 to 64 Years | 137 (52.5%) | $41,493 |
| 65+ Years | 57 (21.8%) | $66,250 |
| Total | 261 (100.0%) | $0 |
Poverty in Freedom Plains
Income Below Poverty by Sex and Age in Freedom Plains
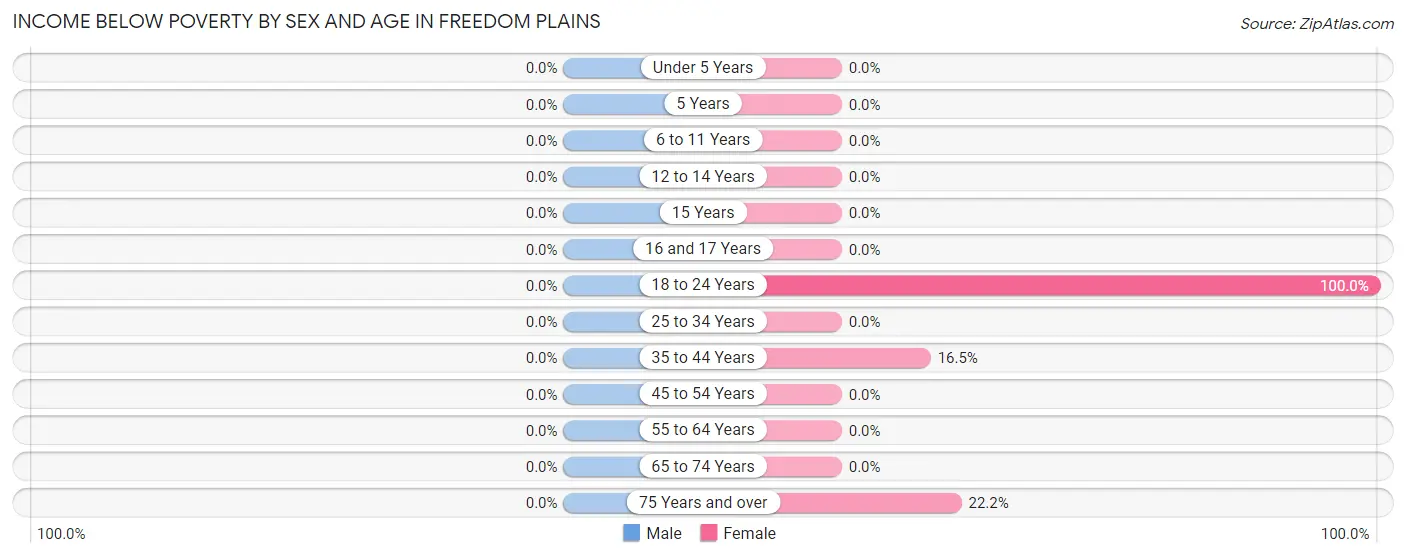
| Age Bracket | Male | Female |
| Under 5 Years | 0 (0.0%) | 0 (0.0%) |
| 5 Years | 0 (0.0%) | 0 (0.0%) |
| 6 to 11 Years | 0 (0.0%) | 0 (0.0%) |
| 12 to 14 Years | 0 (0.0%) | 0 (0.0%) |
| 15 Years | 0 (0.0%) | 0 (0.0%) |
| 16 and 17 Years | 0 (0.0%) | 0 (0.0%) |
| 18 to 24 Years | 0 (0.0%) | 18 (100.0%) |
| 25 to 34 Years | 0 (0.0%) | 0 (0.0%) |
| 35 to 44 Years | 0 (0.0%) | 17 (16.5%) |
| 45 to 54 Years | 0 (0.0%) | 0 (0.0%) |
| 55 to 64 Years | 0 (0.0%) | 0 (0.0%) |
| 65 to 74 Years | 0 (0.0%) | 0 (0.0%) |
| 75 Years and over | 0 (0.0%) | 6 (22.2%) |
| Total | 0 (0.0%) | 41 (10.7%) |
Income Above Poverty by Sex and Age in Freedom Plains
According to the poverty statistics in Freedom Plains, males aged 12 to 14 years and females aged 12 to 14 years are the age groups that are most secure financially, with 100.0% of males and 100.0% of females in these age groups living above the poverty line.
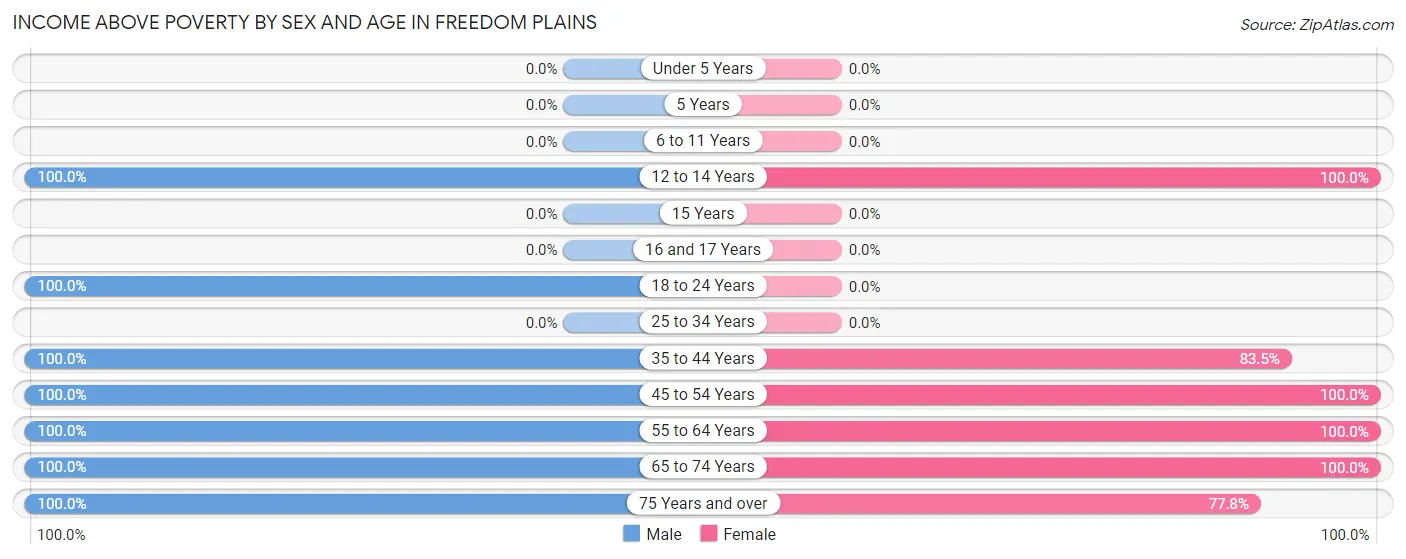
| Age Bracket | Male | Female |
| Under 5 Years | 0 (0.0%) | 0 (0.0%) |
| 5 Years | 0 (0.0%) | 0 (0.0%) |
| 6 to 11 Years | 0 (0.0%) | 0 (0.0%) |
| 12 to 14 Years | 7 (100.0%) | 79 (100.0%) |
| 15 Years | 0 (0.0%) | 0 (0.0%) |
| 16 and 17 Years | 0 (0.0%) | 0 (0.0%) |
| 18 to 24 Years | 183 (100.0%) | 0 (0.0%) |
| 25 to 34 Years | 0 (0.0%) | 0 (0.0%) |
| 35 to 44 Years | 8 (100.0%) | 86 (83.5%) |
| 45 to 54 Years | 15 (100.0%) | 120 (100.0%) |
| 55 to 64 Years | 7 (100.0%) | 20 (100.0%) |
| 65 to 74 Years | 31 (100.0%) | 16 (100.0%) |
| 75 Years and over | 7 (100.0%) | 21 (77.8%) |
| Total | 258 (100.0%) | 342 (89.3%) |
Income Below Poverty Among Married-Couple Families in Freedom Plains
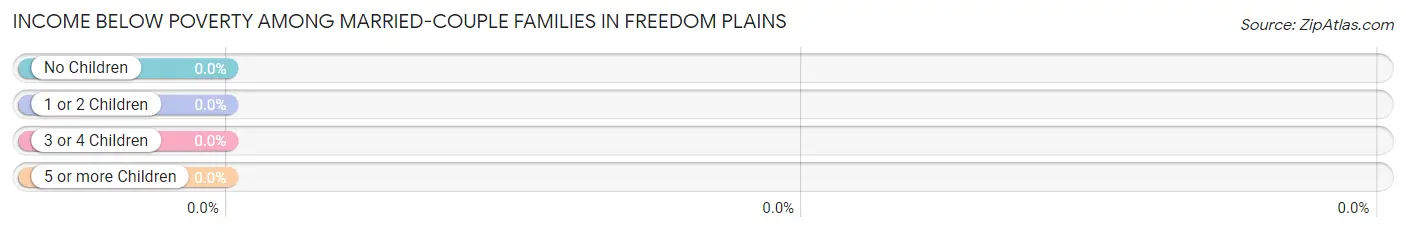
| Children | Above Poverty | Below Poverty |
| No Children | 38 (100.0%) | 0 (0.0%) |
| 1 or 2 Children | 7 (100.0%) | 0 (0.0%) |
| 3 or 4 Children | 0 (0.0%) | 0 (0.0%) |
| 5 or more Children | 0 (0.0%) | 0 (0.0%) |
| Total | 45 (100.0%) | 0 (0.0%) |
Income Below Poverty Among Single-Parent Households in Freedom Plains
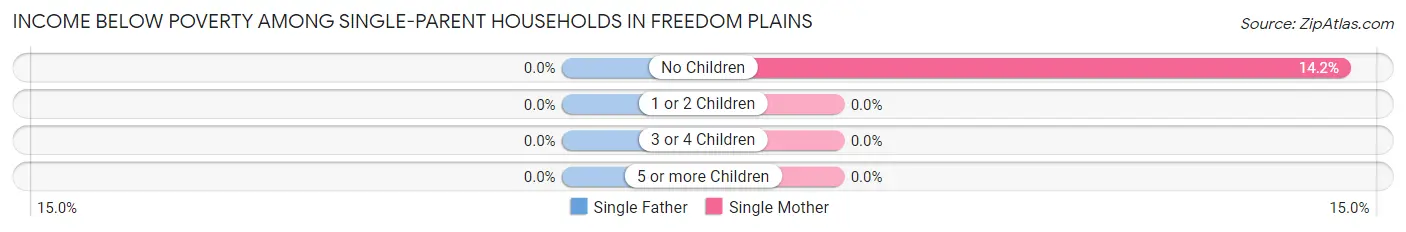
| Children | Single Father | Single Mother |
| No Children | 0 (0.0%) | 17 (14.2%) |
| 1 or 2 Children | 0 (0.0%) | 0 (0.0%) |
| 3 or 4 Children | 0 (0.0%) | 0 (0.0%) |
| 5 or more Children | 0 (0.0%) | 0 (0.0%) |
| Total | 0 (0.0%) | 17 (10.5%) |
Income Below Poverty Among Married-Couple vs Single-Parent Households in Freedom Plains
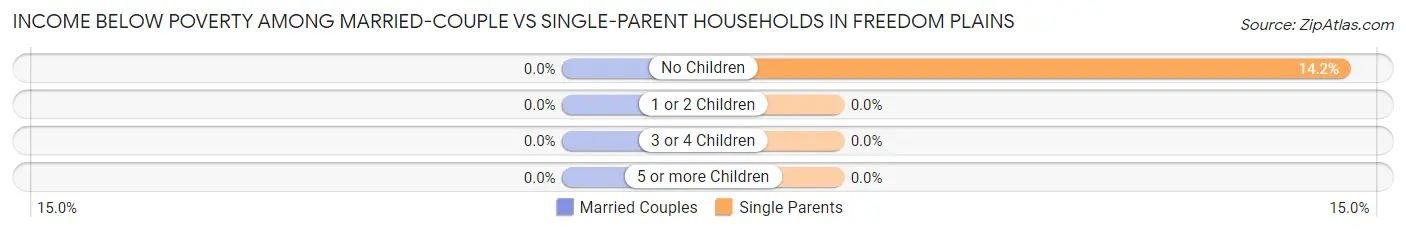
| Children | Married-Couple Families | Single-Parent Households |
| No Children | 0 (0.0%) | 17 (14.2%) |
| 1 or 2 Children | 0 (0.0%) | 0 (0.0%) |
| 3 or 4 Children | 0 (0.0%) | 0 (0.0%) |
| 5 or more Children | 0 (0.0%) | 0 (0.0%) |
| Total | 0 (0.0%) | 17 (10.5%) |
Race in Freedom Plains
The most populous races in Freedom Plains are White / Caucasian (449 | 70.1%), Black / African American (173 | 27.0%), and Hispanic or Latino (54 | 8.4%).
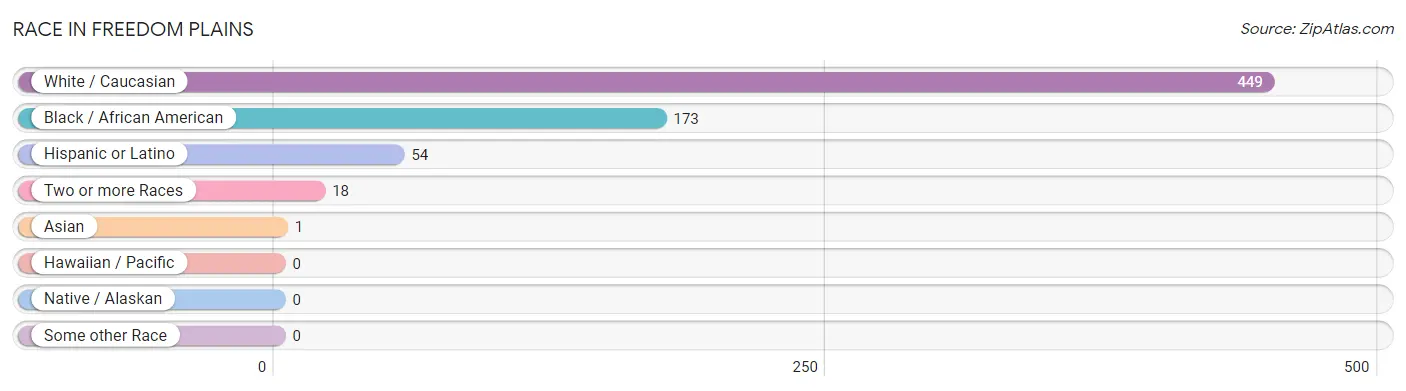
| Race | # Population | % Population |
| Asian | 1 | 0.2% |
| Black / African American | 173 | 27.0% |
| Hawaiian / Pacific | 0 | 0.0% |
| Hispanic or Latino | 54 | 8.4% |
| Native / Alaskan | 0 | 0.0% |
| White / Caucasian | 449 | 70.1% |
| Two or more Races | 18 | 2.8% |
| Some other Race | 0 | 0.0% |
| Total | 641 | 100.0% |
Ancestry in Freedom Plains
The most populous ancestries reported in Freedom Plains are Italian (242 | 37.8%), Jamaican (183 | 28.5%), Scottish (183 | 28.5%), Scotch-Irish (103 | 16.1%), and Puerto Rican (46 | 7.2%), together accounting for 118.1% of all Freedom Plains residents.
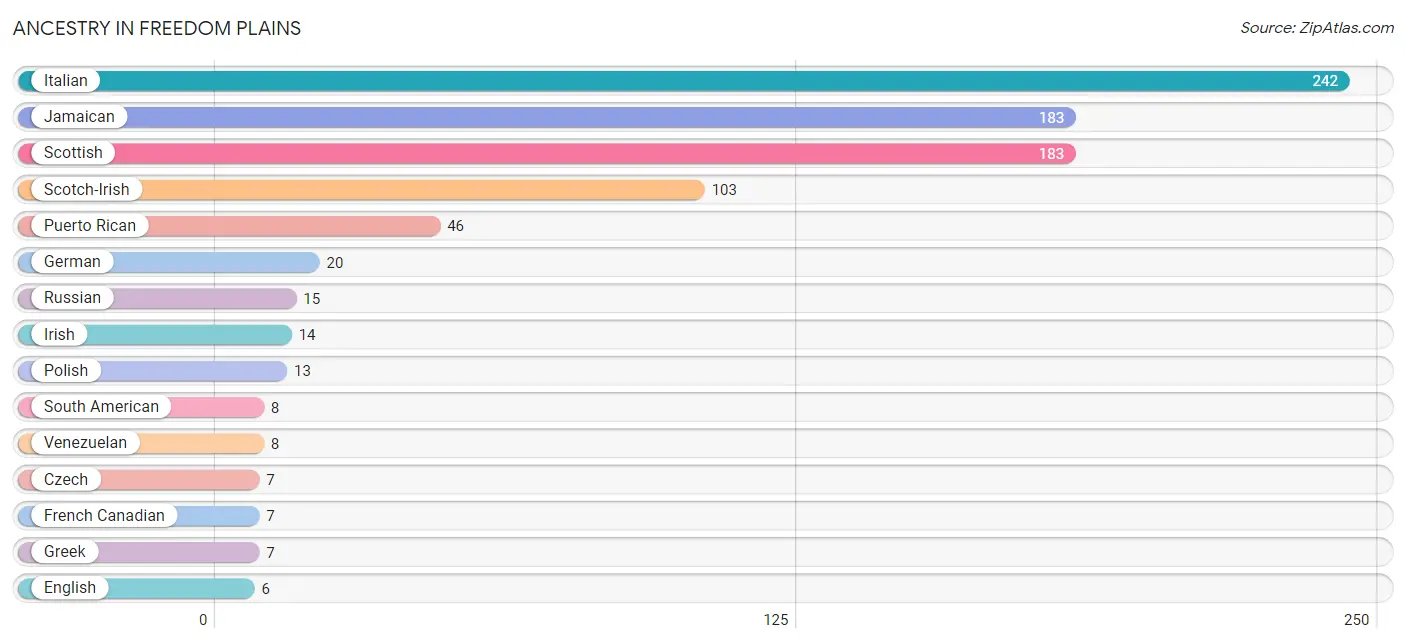
| Ancestry | # Population | % Population |
| Czech | 7 | 1.1% |
| English | 6 | 0.9% |
| French Canadian | 7 | 1.1% |
| German | 20 | 3.1% |
| Greek | 7 | 1.1% |
| Irish | 14 | 2.2% |
| Italian | 242 | 37.8% |
| Jamaican | 183 | 28.5% |
| Norwegian | 6 | 0.9% |
| Polish | 13 | 2.0% |
| Puerto Rican | 46 | 7.2% |
| Russian | 15 | 2.3% |
| Scotch-Irish | 103 | 16.1% |
| Scottish | 183 | 28.5% |
| South American | 8 | 1.3% |
| Venezuelan | 8 | 1.3% | View All 16 Rows |
Immigrants in Freedom Plains
The most numerous immigrant groups reported in Freedom Plains came from Caribbean (165 | 25.7%), Jamaica (165 | 25.7%), and Latin America (165 | 25.7%), together accounting for 77.2% of all Freedom Plains residents.
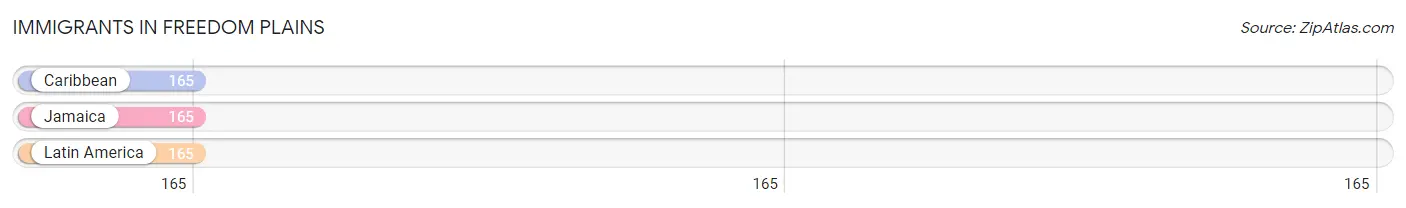
| Immigration Origin | # Population | % Population |
| Caribbean | 165 | 25.7% |
| Jamaica | 165 | 25.7% |
| Latin America | 165 | 25.7% | View All 3 Rows |
Sex and Age in Freedom Plains
Sex and Age in Freedom Plains
The most populous age groups in Freedom Plains are 20 to 24 Years (183 | 70.9%) for men and 35 to 39 Years (103 | 26.9%) for women.
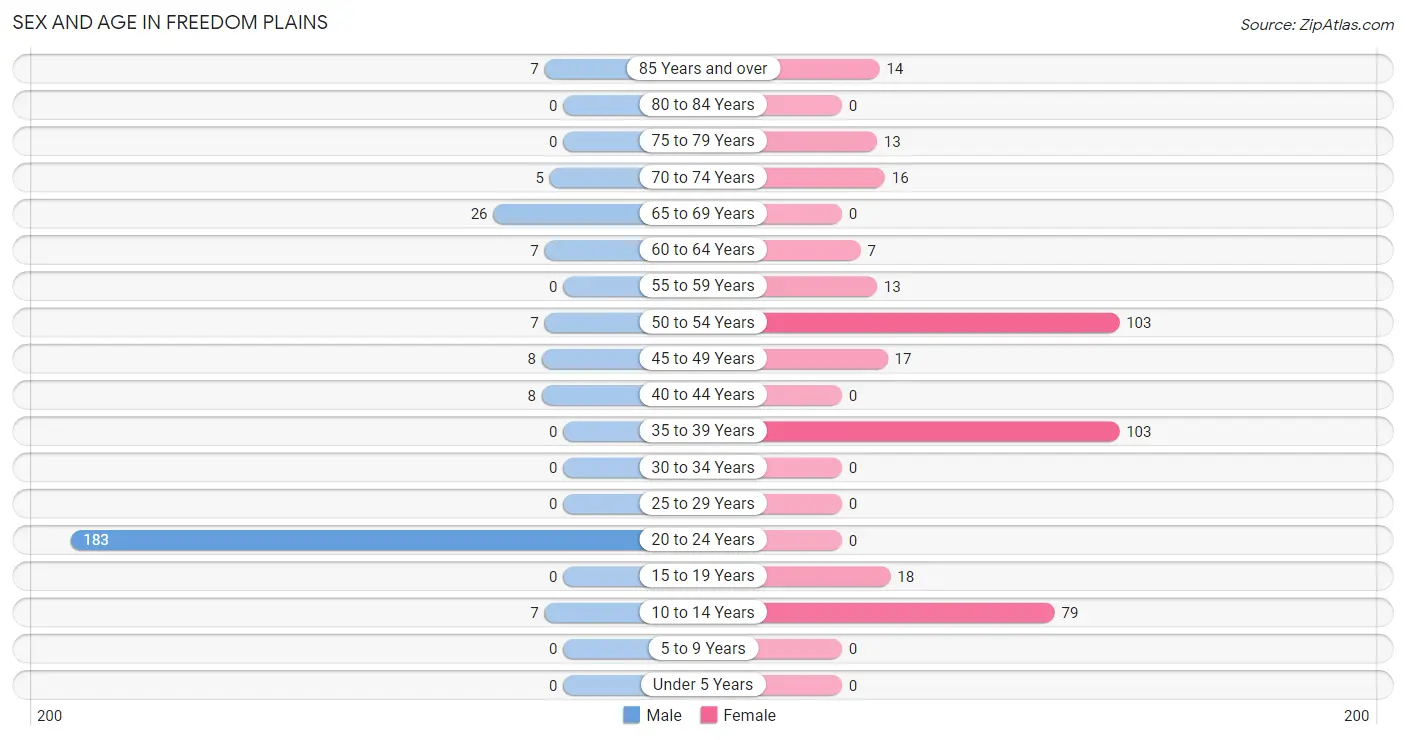
| Age Bracket | Male | Female |
| Under 5 Years | 0 (0.0%) | 0 (0.0%) |
| 5 to 9 Years | 0 (0.0%) | 0 (0.0%) |
| 10 to 14 Years | 7 (2.7%) | 79 (20.6%) |
| 15 to 19 Years | 0 (0.0%) | 18 (4.7%) |
| 20 to 24 Years | 183 (70.9%) | 0 (0.0%) |
| 25 to 29 Years | 0 (0.0%) | 0 (0.0%) |
| 30 to 34 Years | 0 (0.0%) | 0 (0.0%) |
| 35 to 39 Years | 0 (0.0%) | 103 (26.9%) |
| 40 to 44 Years | 8 (3.1%) | 0 (0.0%) |
| 45 to 49 Years | 8 (3.1%) | 17 (4.4%) |
| 50 to 54 Years | 7 (2.7%) | 103 (26.9%) |
| 55 to 59 Years | 0 (0.0%) | 13 (3.4%) |
| 60 to 64 Years | 7 (2.7%) | 7 (1.8%) |
| 65 to 69 Years | 26 (10.1%) | 0 (0.0%) |
| 70 to 74 Years | 5 (1.9%) | 16 (4.2%) |
| 75 to 79 Years | 0 (0.0%) | 13 (3.4%) |
| 80 to 84 Years | 0 (0.0%) | 0 (0.0%) |
| 85 Years and over | 7 (2.7%) | 14 (3.7%) |
| Total | 258 (100.0%) | 383 (100.0%) |
Families and Households in Freedom Plains
Median Family Size in Freedom Plains
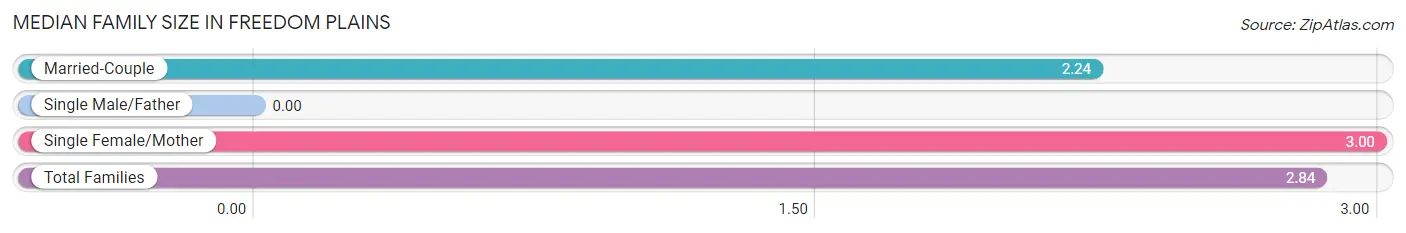
| Family Type | # Families | Family Size |
| Married-Couple | 45 (21.7%) | 2.24 |
| Single Male/Father | 0 (0.0%) | - |
| Single Female/Mother | 162 (78.3%) | 3.00 |
| Total Families | 207 (100.0%) | 2.84 |
Median Household Size in Freedom Plains
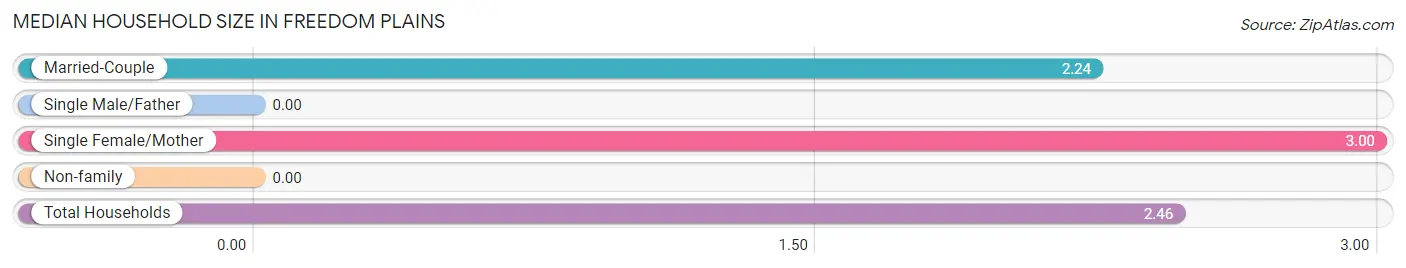
| Household Type | # Households | Household Size |
| Married-Couple | 45 (17.2%) | 2.24 |
| Single Male/Father | 0 (0.0%) | - |
| Single Female/Mother | 162 (62.1%) | 3.00 |
| Non-family | 54 (20.7%) | - |
| Total Households | 261 (100.0%) | 2.46 |
Household Size by Marriage Status in Freedom Plains
Out of a total of 261 households in Freedom Plains, 207 (79.3%) are family households, while 54 (20.7%) are nonfamily households. The most numerous type of family households are 3-person households, comprising 152, and the most common type of nonfamily households are 1-person households, comprising 54.
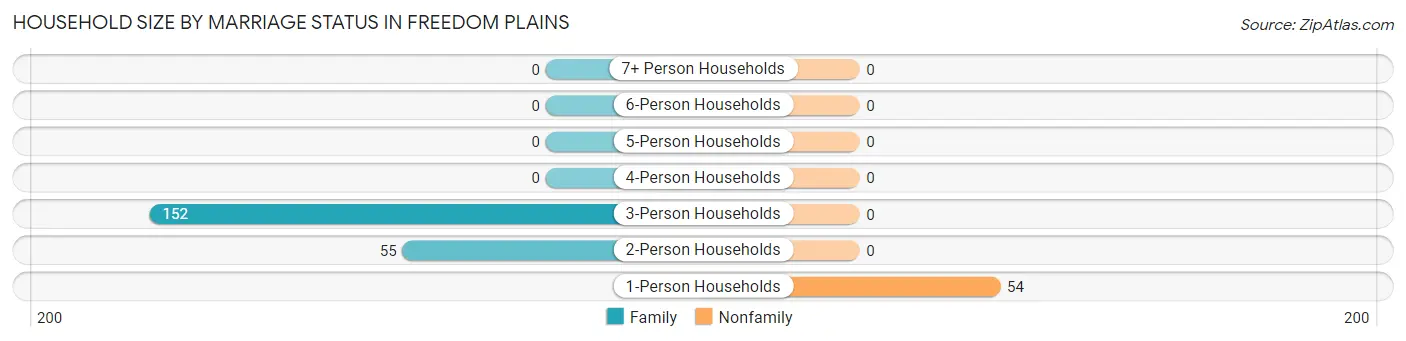
| Household Size | Family Households | Nonfamily Households |
| 1-Person Households | - | 54 (20.7%) |
| 2-Person Households | 55 (21.1%) | 0 (0.0%) |
| 3-Person Households | 152 (58.2%) | 0 (0.0%) |
| 4-Person Households | 0 (0.0%) | 0 (0.0%) |
| 5-Person Households | 0 (0.0%) | 0 (0.0%) |
| 6-Person Households | 0 (0.0%) | 0 (0.0%) |
| 7+ Person Households | 0 (0.0%) | 0 (0.0%) |
| Total | 207 (79.3%) | 54 (20.7%) |
Female Fertility in Freedom Plains
Fertility by Age in Freedom Plains
| Age Bracket | Women with Births | Births / 1,000 Women |
| 15 to 19 years | 0 (0.0%) | 0.0 |
| 20 to 34 years | 0 (0.0%) | 0.0 |
| 35 to 50 years | 0 (0.0%) | 0.0 |
| Total | 0 (0.0%) | 0.0 |
Fertility by Age by Marriage Status in Freedom Plains
| Age Bracket | Married | Unmarried |
| 15 to 19 years | 0 (0.0%) | 0 (0.0%) |
| 20 to 34 years | 0 (0.0%) | 0 (0.0%) |
| 35 to 50 years | 0 (0.0%) | 0 (0.0%) |
| Total | 0 (0.0%) | 0 (0.0%) |
Fertility by Education in Freedom Plains
| Educational Attainment | Women with Births | Births / 1,000 Women |
| Less than High School | 0 (0.0%) | 0.0 |
| High School Diploma | 0 (0.0%) | 0.0 |
| College or Associate's Degree | 0 (0.0%) | 0.0 |
| Bachelor's Degree | 0 (0.0%) | 0.0 |
| Graduate Degree | 0 (0.0%) | 0.0 |
| Total | 0 (0.0%) | 0.0 |
Fertility by Education by Marriage Status in Freedom Plains
| Educational Attainment | Married | Unmarried |
| Less than High School | 0 (0.0%) | 0 (0.0%) |
| High School Diploma | 0 (0.0%) | 0 (0.0%) |
| College or Associate's Degree | 0 (0.0%) | 0 (0.0%) |
| Bachelor's Degree | 0 (0.0%) | 0 (0.0%) |
| Graduate Degree | 0 (0.0%) | 0 (0.0%) |
| Total | 0 (0.0%) | 0 (0.0%) |
Employment Characteristics in Freedom Plains
Employment by Class of Employer in Freedom Plains
Among the 453 employed individuals in Freedom Plains, private company employees (165 | 36.4%), self-employed (incorporated) (103 | 22.7%), and federal government employees (98 | 21.6%) make up the most common classes of employment.
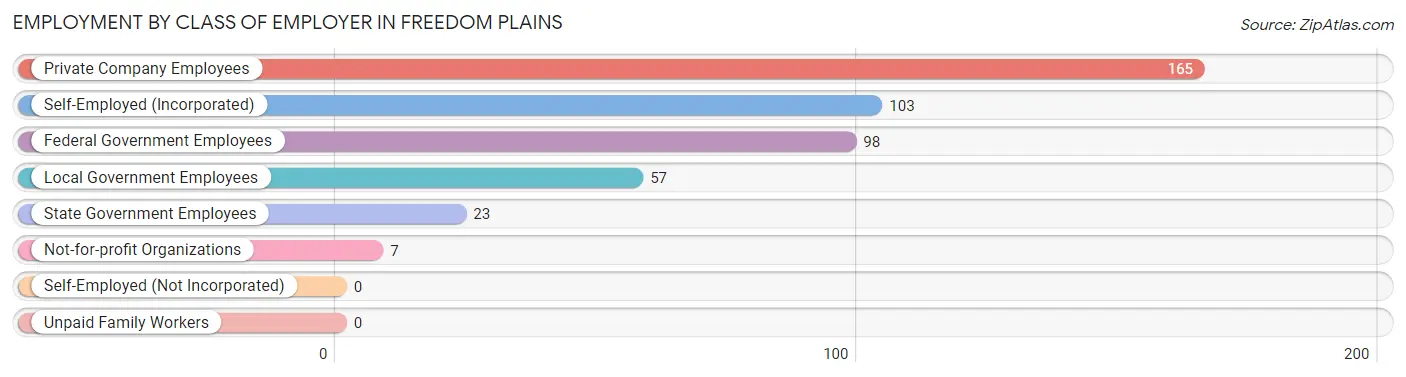
| Employer Class | # Employees | % Employees |
| Private Company Employees | 165 | 36.4% |
| Self-Employed (Incorporated) | 103 | 22.7% |
| Self-Employed (Not Incorporated) | 0 | 0.0% |
| Not-for-profit Organizations | 7 | 1.5% |
| Local Government Employees | 57 | 12.6% |
| State Government Employees | 23 | 5.1% |
| Federal Government Employees | 98 | 21.6% |
| Unpaid Family Workers | 0 | 0.0% |
| Total | 453 | 100.0% |
Employment Status by Age in Freedom Plains
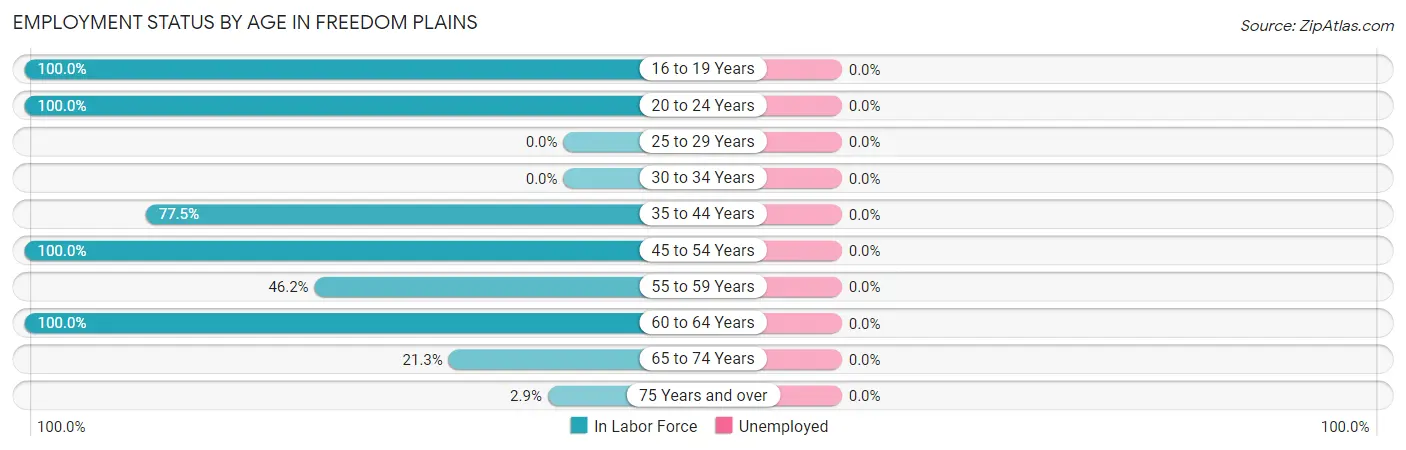
| Age Bracket | In Labor Force | Unemployed |
| 16 to 19 Years | 18 (100.0%) | 0 (0.0%) |
| 20 to 24 Years | 183 (100.0%) | 0 (0.0%) |
| 25 to 29 Years | 0 (0.0%) | 0 (0.0%) |
| 30 to 34 Years | 0 (0.0%) | 0 (0.0%) |
| 35 to 44 Years | 86 (77.5%) | 0 (0.0%) |
| 45 to 54 Years | 135 (100.0%) | 0 (0.0%) |
| 55 to 59 Years | 6 (46.2%) | 0 (0.0%) |
| 60 to 64 Years | 14 (100.0%) | 0 (0.0%) |
| 65 to 74 Years | 10 (21.3%) | 0 (0.0%) |
| 75 Years and over | 1 (2.9%) | 0 (0.0%) |
| Total | 453 (81.6%) | 0 (0.0%) |
Employment Status by Educational Attainment in Freedom Plains
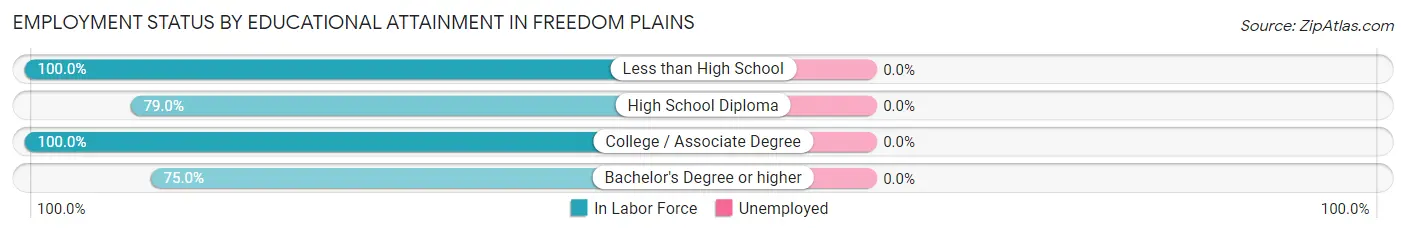
| Educational Attainment | In Labor Force | Unemployed |
| Less than High School | 7 (100.0%) | 0 (0.0%) |
| High School Diploma | 94 (79.0%) | 0 (0.0%) |
| College / Associate Degree | 119 (100.0%) | 0 (0.0%) |
| Bachelor's Degree or higher | 21 (75.0%) | 0 (0.0%) |
| Total | 241 (88.3%) | 0 (0.0%) |
Employment Occupations by Sex in Freedom Plains
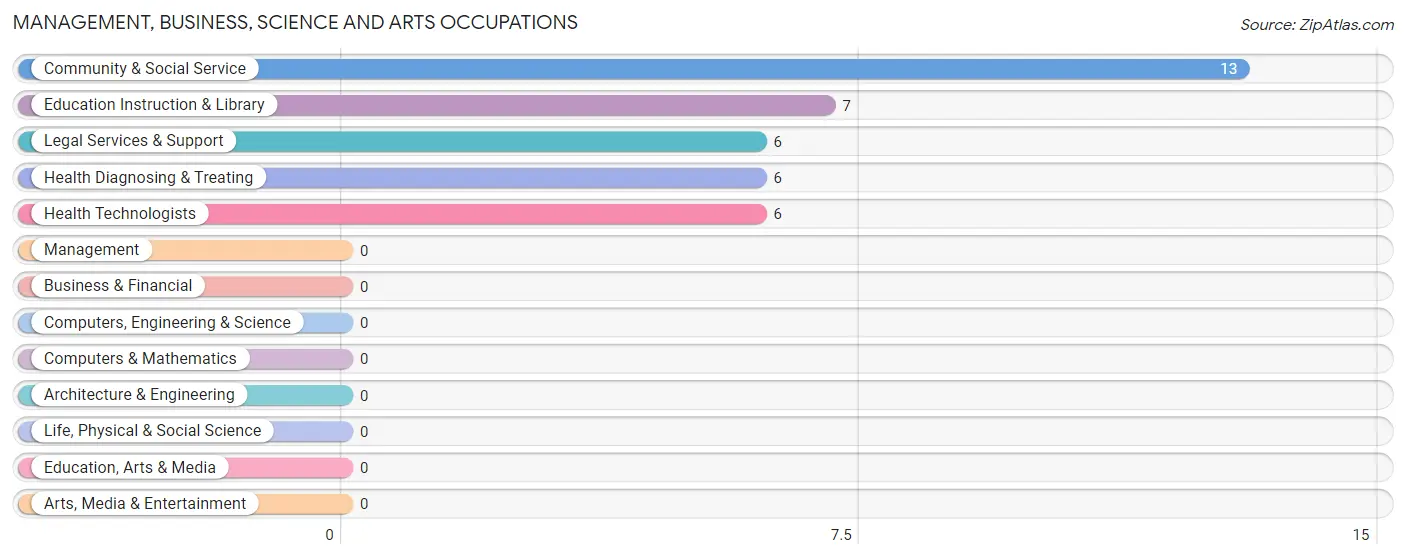
Management, Business, Science and Arts Occupations
The most common Management, Business, Science and Arts occupations in Freedom Plains are Community & Social Service (13 | 2.9%), Education Instruction & Library (7 | 1.5%), Legal Services & Support (6 | 1.3%), Health Diagnosing & Treating (6 | 1.3%), and Health Technologists (6 | 1.3%).
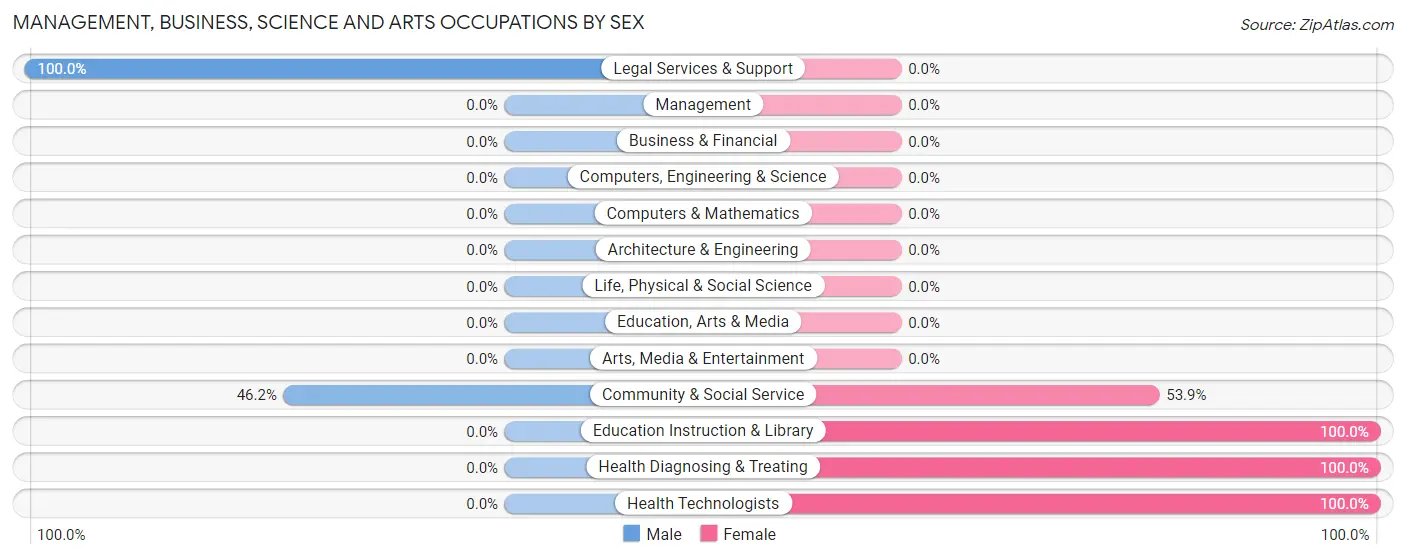
Management, Business, Science and Arts Occupations by Sex
Within the Management, Business, Science and Arts occupations in Freedom Plains, the most male-oriented occupations are Legal Services & Support (100.0%), and Community & Social Service (46.2%), while the most female-oriented occupations are Education Instruction & Library (100.0%), Health Diagnosing & Treating (100.0%), and Health Technologists (100.0%).
| Occupation | Male | Female |
| Management | 0 (0.0%) | 0 (0.0%) |
| Business & Financial | 0 (0.0%) | 0 (0.0%) |
| Computers, Engineering & Science | 0 (0.0%) | 0 (0.0%) |
| Computers & Mathematics | 0 (0.0%) | 0 (0.0%) |
| Architecture & Engineering | 0 (0.0%) | 0 (0.0%) |
| Life, Physical & Social Science | 0 (0.0%) | 0 (0.0%) |
| Community & Social Service | 6 (46.2%) | 7 (53.8%) |
| Education, Arts & Media | 0 (0.0%) | 0 (0.0%) |
| Legal Services & Support | 6 (100.0%) | 0 (0.0%) |
| Education Instruction & Library | 0 (0.0%) | 7 (100.0%) |
| Arts, Media & Entertainment | 0 (0.0%) | 0 (0.0%) |
| Health Diagnosing & Treating | 0 (0.0%) | 6 (100.0%) |
| Health Technologists | 0 (0.0%) | 6 (100.0%) |
| Total (Category) | 6 (31.6%) | 13 (68.4%) |
| Total (Overall) | 211 (46.6%) | 242 (53.4%) |
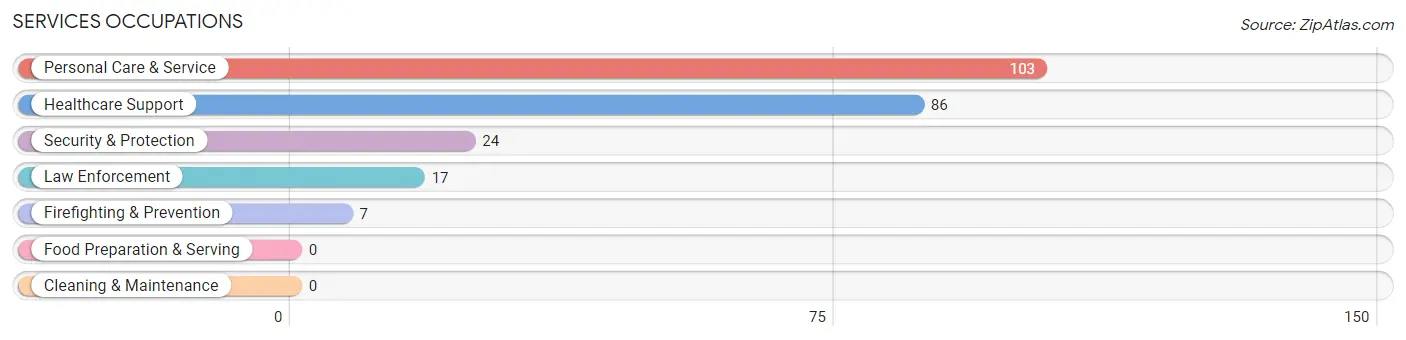
Services Occupations
The most common Services occupations in Freedom Plains are Personal Care & Service (103 | 22.7%), Healthcare Support (86 | 19.0%), Security & Protection (24 | 5.3%), Law Enforcement (17 | 3.7%), and Firefighting & Prevention (7 | 1.5%).
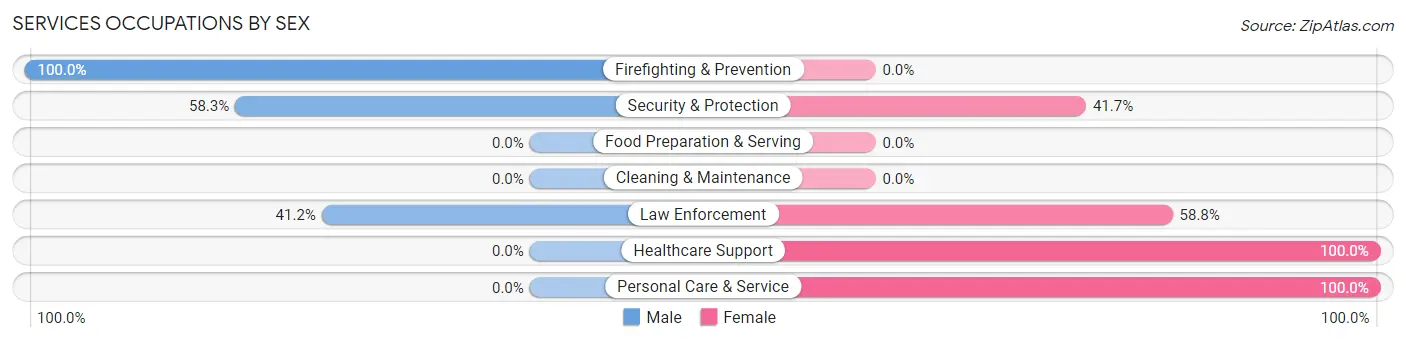
Services Occupations by Sex
Within the Services occupations in Freedom Plains, the most male-oriented occupations are Firefighting & Prevention (100.0%), Security & Protection (58.3%), and Law Enforcement (41.2%), while the most female-oriented occupations are Healthcare Support (100.0%), Personal Care & Service (100.0%), and Law Enforcement (58.8%).
| Occupation | Male | Female |
| Healthcare Support | 0 (0.0%) | 86 (100.0%) |
| Security & Protection | 14 (58.3%) | 10 (41.7%) |
| Firefighting & Prevention | 7 (100.0%) | 0 (0.0%) |
| Law Enforcement | 7 (41.2%) | 10 (58.8%) |
| Food Preparation & Serving | 0 (0.0%) | 0 (0.0%) |
| Cleaning & Maintenance | 0 (0.0%) | 0 (0.0%) |
| Personal Care & Service | 0 (0.0%) | 103 (100.0%) |
| Total (Category) | 14 (6.6%) | 199 (93.4%) |
| Total (Overall) | 211 (46.6%) | 242 (53.4%) |
Sales and Office Occupations
The most common Sales and Office occupations in Freedom Plains are , and Office & Administration (202 | 44.6%).
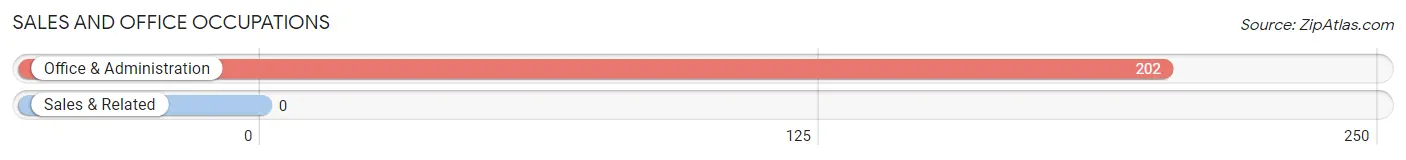
Sales and Office Occupations by Sex
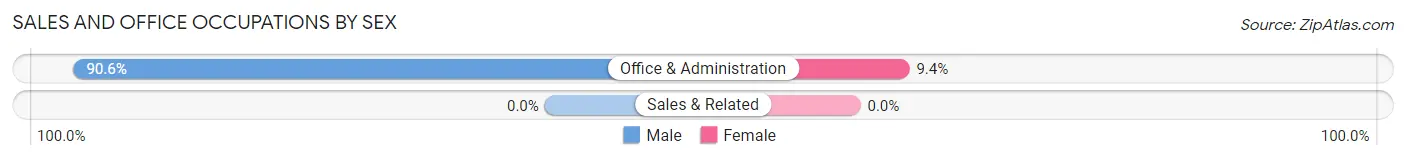
| Occupation | Male | Female |
| Sales & Related | 0 (0.0%) | 0 (0.0%) |
| Office & Administration | 183 (90.6%) | 19 (9.4%) |
| Total (Category) | 183 (90.6%) | 19 (9.4%) |
| Total (Overall) | 211 (46.6%) | 242 (53.4%) |
Natural Resources, Construction and Maintenance Occupations
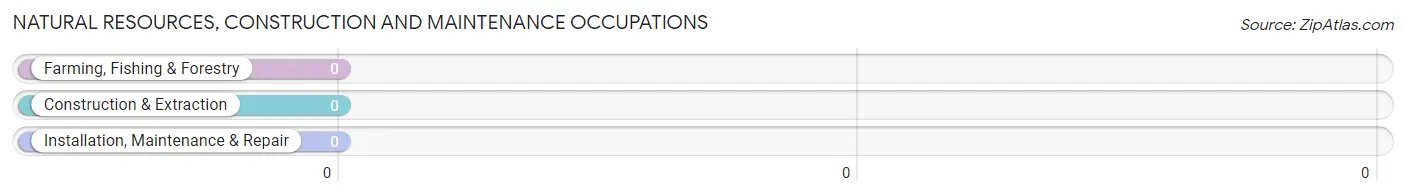
Natural Resources, Construction and Maintenance Occupations by Sex
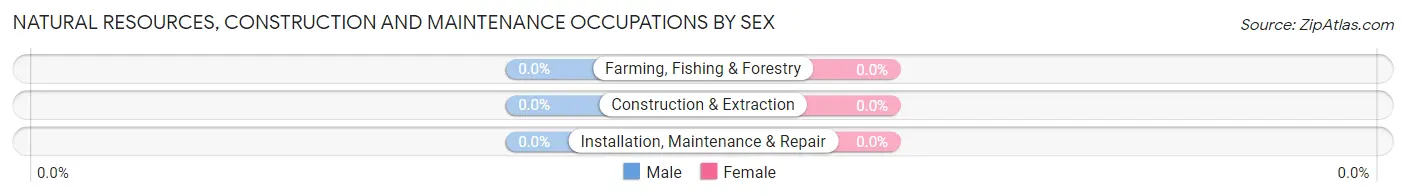
| Occupation | Male | Female |
| Farming, Fishing & Forestry | 0 (0.0%) | 0 (0.0%) |
| Construction & Extraction | 0 (0.0%) | 0 (0.0%) |
| Installation, Maintenance & Repair | 0 (0.0%) | 0 (0.0%) |
| Total (Category) | 0 (0.0%) | 0 (0.0%) |
| Total (Overall) | 211 (46.6%) | 242 (53.4%) |
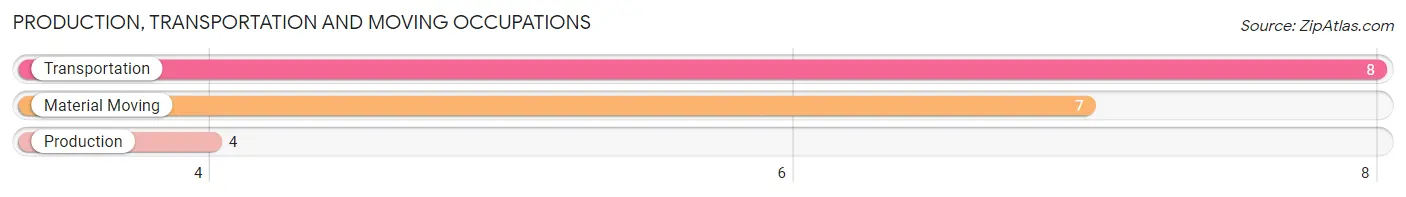
Production, Transportation and Moving Occupations
The most common Production, Transportation and Moving occupations in Freedom Plains are Transportation (8 | 1.8%), Material Moving (7 | 1.5%), and Production (4 | 0.9%).
Production, Transportation and Moving Occupations by Sex
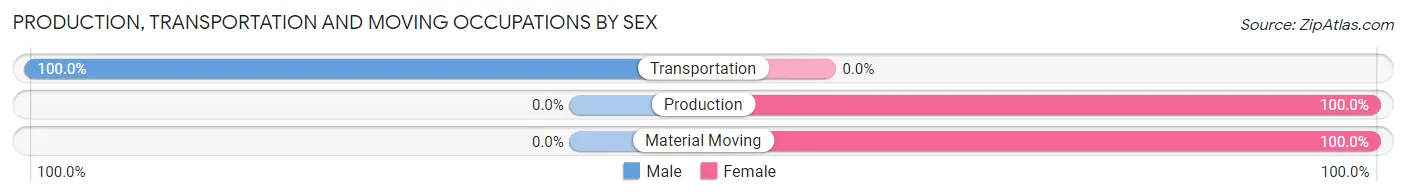
| Occupation | Male | Female |
| Production | 0 (0.0%) | 4 (100.0%) |
| Transportation | 8 (100.0%) | 0 (0.0%) |
| Material Moving | 0 (0.0%) | 7 (100.0%) |
| Total (Category) | 8 (42.1%) | 11 (57.9%) |
| Total (Overall) | 211 (46.6%) | 242 (53.4%) |
Employment Industries by Sex in Freedom Plains
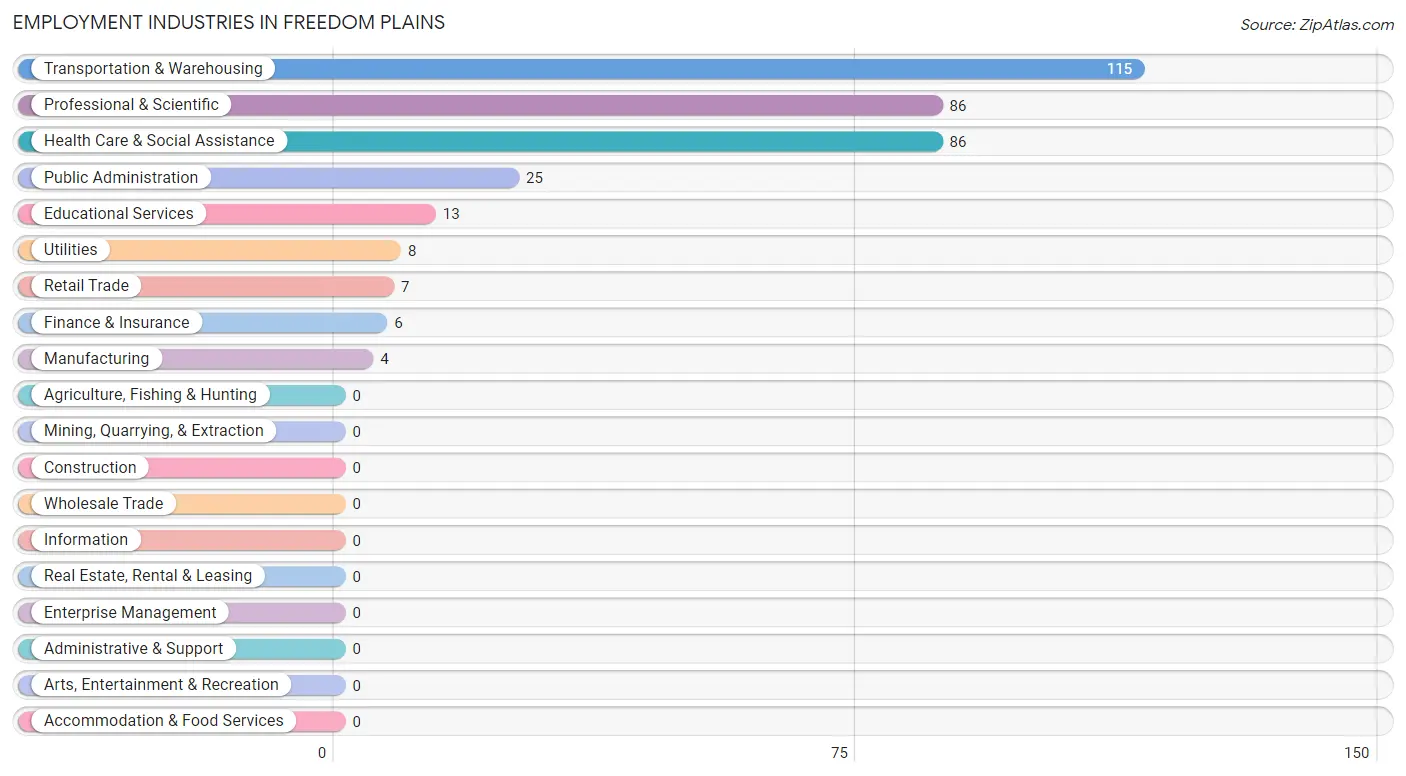
Employment Industries in Freedom Plains
The major employment industries in Freedom Plains include Transportation & Warehousing (115 | 25.4%), Professional & Scientific (86 | 19.0%), Health Care & Social Assistance (86 | 19.0%), Public Administration (25 | 5.5%), and Educational Services (13 | 2.9%).
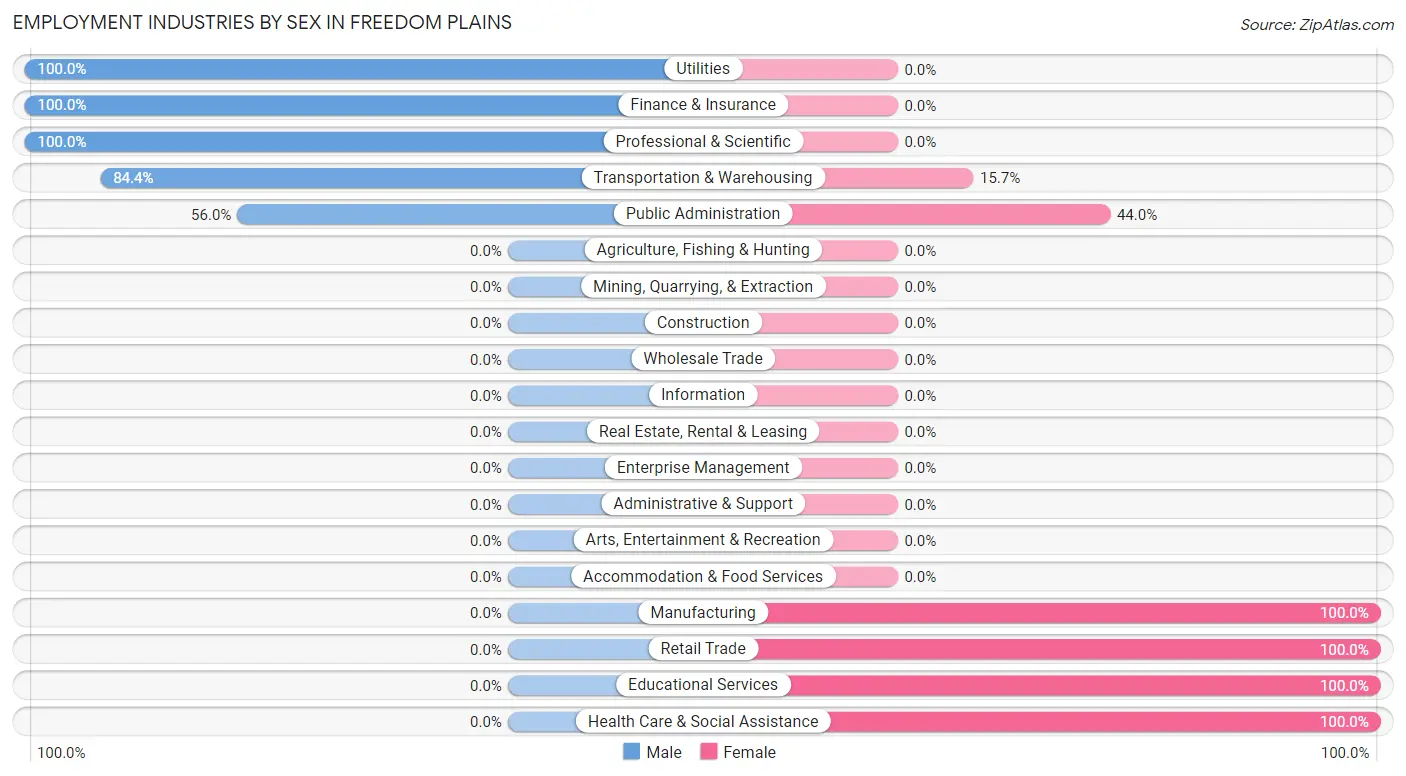
Employment Industries by Sex in Freedom Plains
The Freedom Plains industries that see more men than women are Utilities (100.0%), Finance & Insurance (100.0%), and Professional & Scientific (100.0%), whereas the industries that tend to have a higher number of women are Manufacturing (100.0%), Retail Trade (100.0%), and Educational Services (100.0%).
| Industry | Male | Female |
| Agriculture, Fishing & Hunting | 0 (0.0%) | 0 (0.0%) |
| Mining, Quarrying, & Extraction | 0 (0.0%) | 0 (0.0%) |
| Construction | 0 (0.0%) | 0 (0.0%) |
| Manufacturing | 0 (0.0%) | 4 (100.0%) |
| Wholesale Trade | 0 (0.0%) | 0 (0.0%) |
| Retail Trade | 0 (0.0%) | 7 (100.0%) |
| Transportation & Warehousing | 97 (84.4%) | 18 (15.7%) |
| Utilities | 8 (100.0%) | 0 (0.0%) |
| Information | 0 (0.0%) | 0 (0.0%) |
| Finance & Insurance | 6 (100.0%) | 0 (0.0%) |
| Real Estate, Rental & Leasing | 0 (0.0%) | 0 (0.0%) |
| Professional & Scientific | 86 (100.0%) | 0 (0.0%) |
| Enterprise Management | 0 (0.0%) | 0 (0.0%) |
| Administrative & Support | 0 (0.0%) | 0 (0.0%) |
| Educational Services | 0 (0.0%) | 13 (100.0%) |
| Health Care & Social Assistance | 0 (0.0%) | 86 (100.0%) |
| Arts, Entertainment & Recreation | 0 (0.0%) | 0 (0.0%) |
| Accommodation & Food Services | 0 (0.0%) | 0 (0.0%) |
| Public Administration | 14 (56.0%) | 11 (44.0%) |
| Total | 211 (46.6%) | 242 (53.4%) |
Education in Freedom Plains
School Enrollment in Freedom Plains
The most common levels of schooling among the 172 students in Freedom Plains are graduate / professional (86 | 50.0%), high school (79 | 45.9%), and middle school (7 | 4.1%).
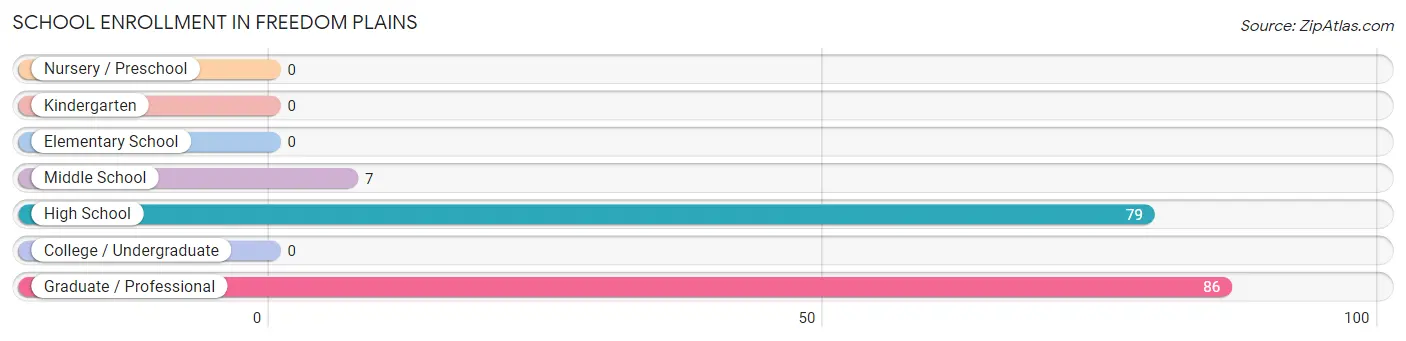
| School Level | # Students | % Students |
| Nursery / Preschool | 0 | 0.0% |
| Kindergarten | 0 | 0.0% |
| Elementary School | 0 | 0.0% |
| Middle School | 7 | 4.1% |
| High School | 79 | 45.9% |
| College / Undergraduate | 0 | 0.0% |
| Graduate / Professional | 86 | 50.0% |
| Total | 172 | 100.0% |
School Enrollment by Age by Funding Source in Freedom Plains
Out of a total of 172 students who are enrolled in schools in Freedom Plains, 86 (50.0%) attend a private institution, while the remaining 86 (50.0%) are enrolled in public schools. The age group of 20 to 24 year olds has the highest likelihood of being enrolled in private schools, with 86 (100.0% in the age bracket) enrolled. Conversely, the age group of 10 to 14 year olds has the lowest likelihood of being enrolled in a private school, with 86 (100.0% in the age bracket) attending a public institution.
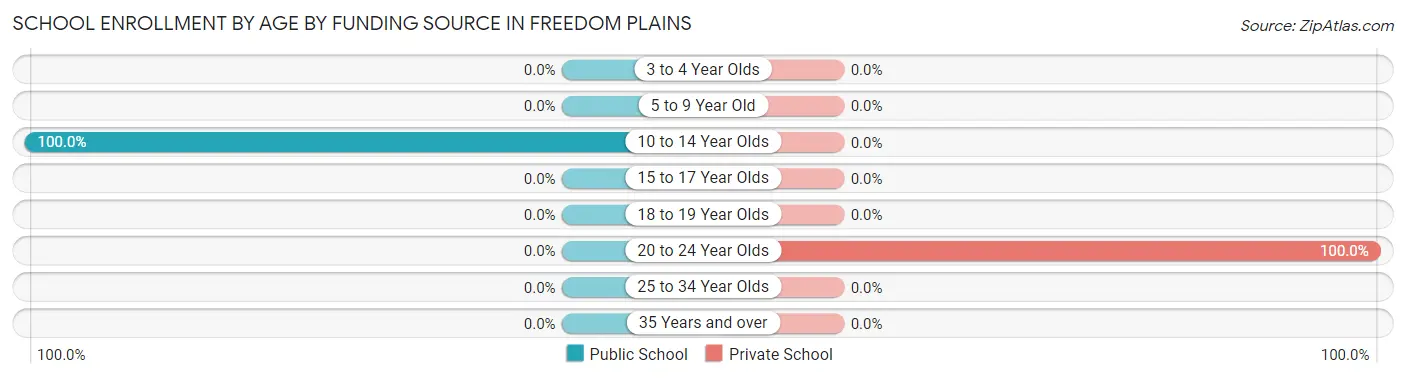
| Age Bracket | Public School | Private School |
| 3 to 4 Year Olds | 0 (0.0%) | 0 (0.0%) |
| 5 to 9 Year Old | 0 (0.0%) | 0 (0.0%) |
| 10 to 14 Year Olds | 86 (100.0%) | 0 (0.0%) |
| 15 to 17 Year Olds | 0 (0.0%) | 0 (0.0%) |
| 18 to 19 Year Olds | 0 (0.0%) | 0 (0.0%) |
| 20 to 24 Year Olds | 0 (0.0%) | 86 (100.0%) |
| 25 to 34 Year Olds | 0 (0.0%) | 0 (0.0%) |
| 35 Years and over | 0 (0.0%) | 0 (0.0%) |
| Total | 86 (50.0%) | 86 (50.0%) |
Educational Attainment by Field of Study in Freedom Plains
Arts & humanities (14 | 33.3%), psychology (7 | 16.7%), business (7 | 16.7%), communications (7 | 16.7%), and liberal arts & history (6 | 14.3%) are the most common fields of study among 42 individuals in Freedom Plains who have obtained a bachelor's degree or higher.
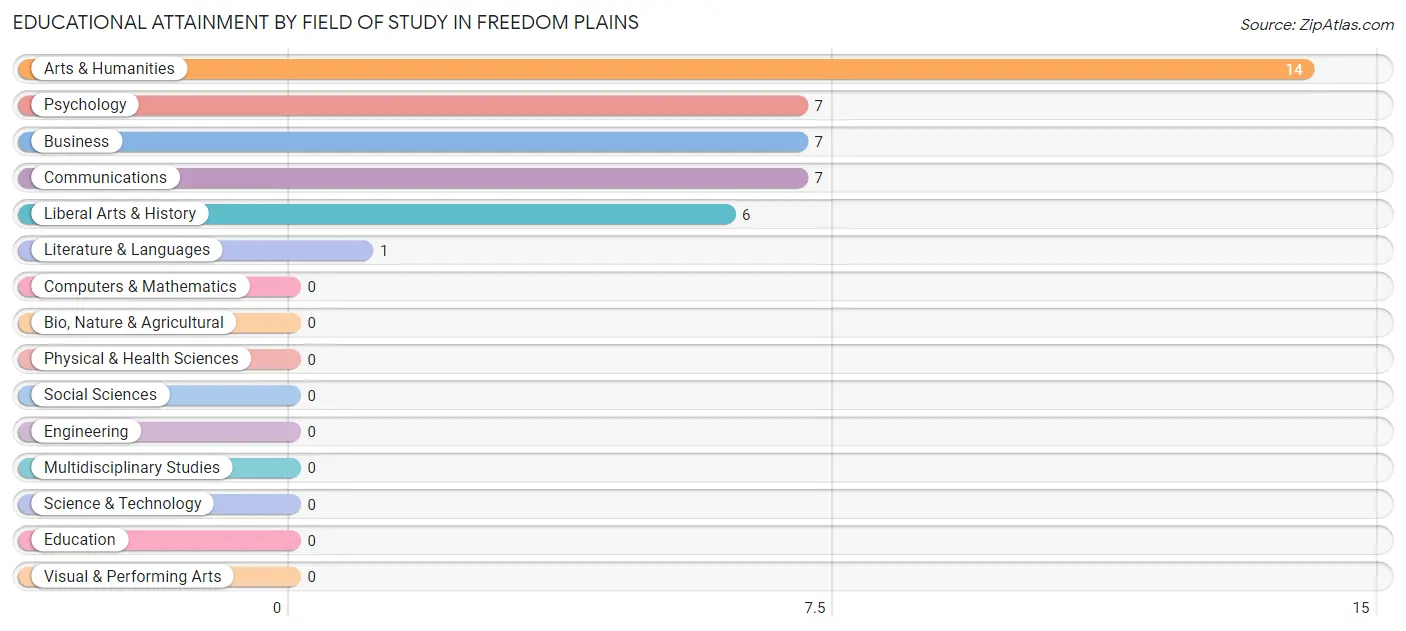
| Field of Study | # Graduates | % Graduates |
| Computers & Mathematics | 0 | 0.0% |
| Bio, Nature & Agricultural | 0 | 0.0% |
| Physical & Health Sciences | 0 | 0.0% |
| Psychology | 7 | 16.7% |
| Social Sciences | 0 | 0.0% |
| Engineering | 0 | 0.0% |
| Multidisciplinary Studies | 0 | 0.0% |
| Science & Technology | 0 | 0.0% |
| Business | 7 | 16.7% |
| Education | 0 | 0.0% |
| Literature & Languages | 1 | 2.4% |
| Liberal Arts & History | 6 | 14.3% |
| Visual & Performing Arts | 0 | 0.0% |
| Communications | 7 | 16.7% |
| Arts & Humanities | 14 | 33.3% |
| Total | 42 | 100.0% |
Transportation & Commute in Freedom Plains
Vehicle Availability by Sex in Freedom Plains
The most prevalent vehicle ownership categories in Freedom Plains are males with 3 vehicles (190, accounting for 90.0%) and females with 3 vehicles (109, making up 78.5%).
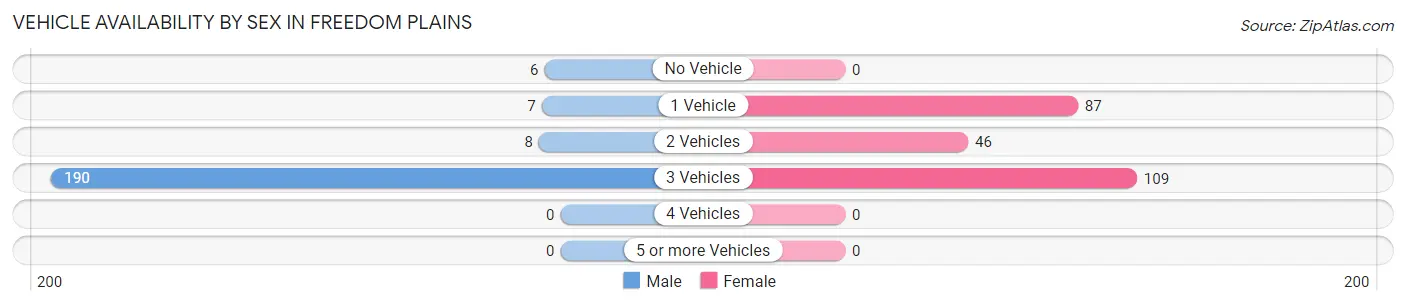
| Vehicles Available | Male | Female |
| No Vehicle | 6 (2.8%) | 0 (0.0%) |
| 1 Vehicle | 7 (3.3%) | 87 (35.9%) |
| 2 Vehicles | 8 (3.8%) | 46 (19.0%) |
| 3 Vehicles | 190 (90.0%) | 109 (45.0%) |
| 4 Vehicles | 0 (0.0%) | 0 (0.0%) |
| 5 or more Vehicles | 0 (0.0%) | 0 (0.0%) |
| Total | 211 (100.0%) | 242 (100.0%) |
Commute Time in Freedom Plains
The most frequently occuring commute durations in Freedom Plains are 25 to 29 minutes (148 commuters, 33.2%), 20 to 24 minutes (131 commuters, 29.4%), and 45 to 59 minutes (86 commuters, 19.3%).
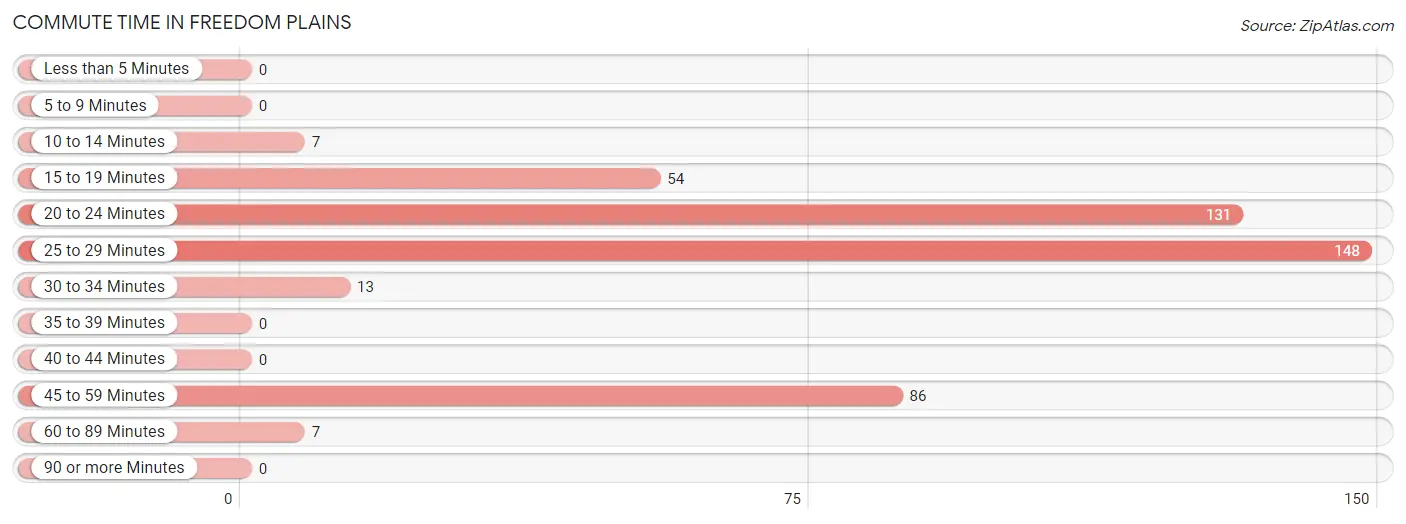
| Commute Time | # Commuters | % Commuters |
| Less than 5 Minutes | 0 | 0.0% |
| 5 to 9 Minutes | 0 | 0.0% |
| 10 to 14 Minutes | 7 | 1.6% |
| 15 to 19 Minutes | 54 | 12.1% |
| 20 to 24 Minutes | 131 | 29.4% |
| 25 to 29 Minutes | 148 | 33.2% |
| 30 to 34 Minutes | 13 | 2.9% |
| 35 to 39 Minutes | 0 | 0.0% |
| 40 to 44 Minutes | 0 | 0.0% |
| 45 to 59 Minutes | 86 | 19.3% |
| 60 to 89 Minutes | 7 | 1.6% |
| 90 or more Minutes | 0 | 0.0% |
Commute Time by Sex in Freedom Plains
The most common commute times in Freedom Plains are 20 to 24 minutes (103 commuters, 48.8%) for males and 25 to 29 minutes (148 commuters, 63.0%) for females.
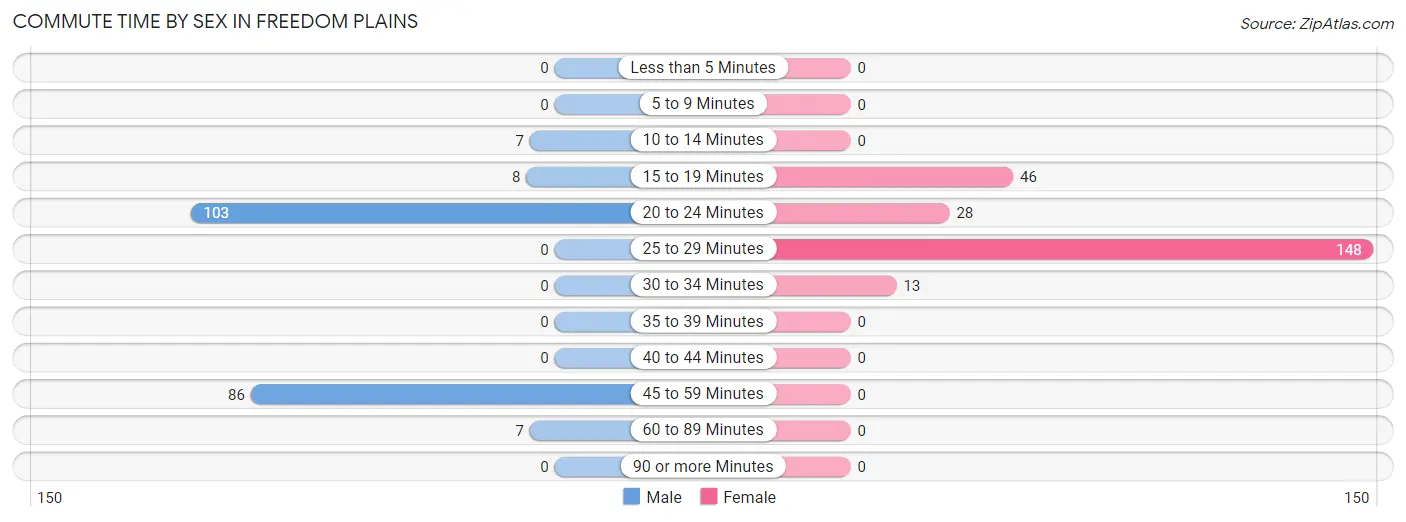
| Commute Time | Male | Female |
| Less than 5 Minutes | 0 (0.0%) | 0 (0.0%) |
| 5 to 9 Minutes | 0 (0.0%) | 0 (0.0%) |
| 10 to 14 Minutes | 7 (3.3%) | 0 (0.0%) |
| 15 to 19 Minutes | 8 (3.8%) | 46 (19.6%) |
| 20 to 24 Minutes | 103 (48.8%) | 28 (11.9%) |
| 25 to 29 Minutes | 0 (0.0%) | 148 (63.0%) |
| 30 to 34 Minutes | 0 (0.0%) | 13 (5.5%) |
| 35 to 39 Minutes | 0 (0.0%) | 0 (0.0%) |
| 40 to 44 Minutes | 0 (0.0%) | 0 (0.0%) |
| 45 to 59 Minutes | 86 (40.8%) | 0 (0.0%) |
| 60 to 89 Minutes | 7 (3.3%) | 0 (0.0%) |
| 90 or more Minutes | 0 (0.0%) | 0 (0.0%) |
Time of Departure to Work by Sex in Freedom Plains
The most frequent times of departure to work in Freedom Plains are 12:00 PM to 3:59 PM (103, 48.8%) for males and 8:00 AM to 8:29 AM (161, 68.5%) for females.
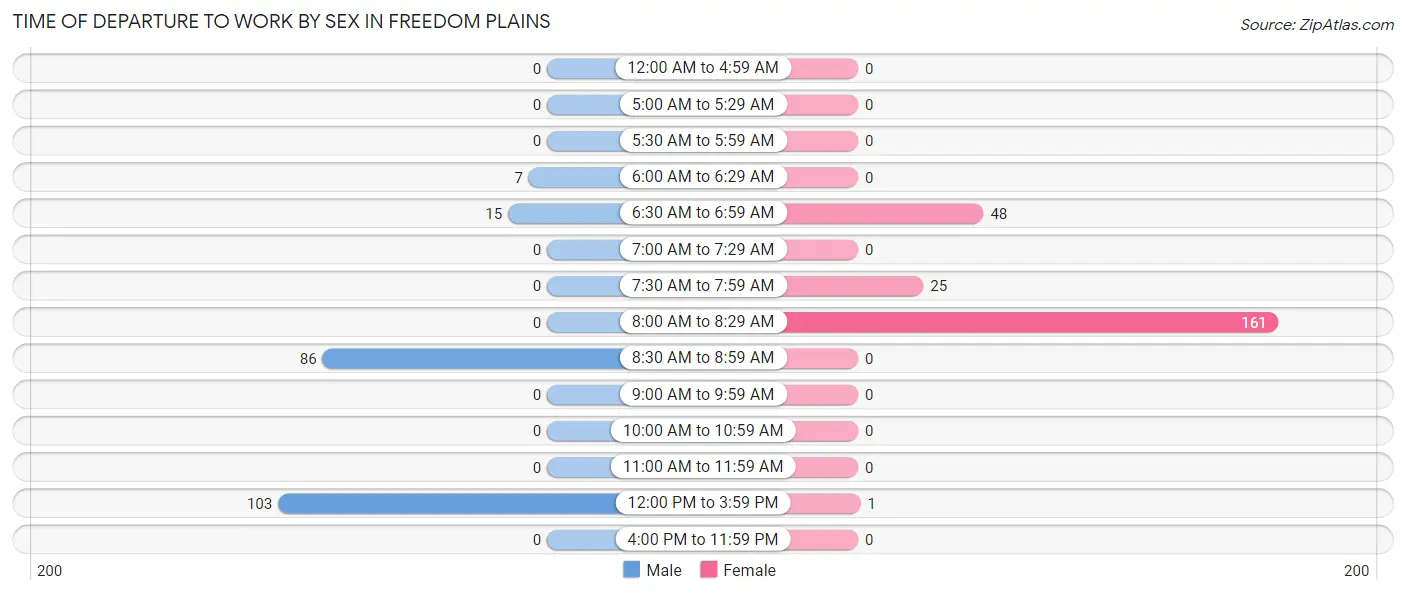
| Time of Departure | Male | Female |
| 12:00 AM to 4:59 AM | 0 (0.0%) | 0 (0.0%) |
| 5:00 AM to 5:29 AM | 0 (0.0%) | 0 (0.0%) |
| 5:30 AM to 5:59 AM | 0 (0.0%) | 0 (0.0%) |
| 6:00 AM to 6:29 AM | 7 (3.3%) | 0 (0.0%) |
| 6:30 AM to 6:59 AM | 15 (7.1%) | 48 (20.4%) |
| 7:00 AM to 7:29 AM | 0 (0.0%) | 0 (0.0%) |
| 7:30 AM to 7:59 AM | 0 (0.0%) | 25 (10.6%) |
| 8:00 AM to 8:29 AM | 0 (0.0%) | 161 (68.5%) |
| 8:30 AM to 8:59 AM | 86 (40.8%) | 0 (0.0%) |
| 9:00 AM to 9:59 AM | 0 (0.0%) | 0 (0.0%) |
| 10:00 AM to 10:59 AM | 0 (0.0%) | 0 (0.0%) |
| 11:00 AM to 11:59 AM | 0 (0.0%) | 0 (0.0%) |
| 12:00 PM to 3:59 PM | 103 (48.8%) | 1 (0.4%) |
| 4:00 PM to 11:59 PM | 0 (0.0%) | 0 (0.0%) |
| Total | 211 (100.0%) | 235 (100.0%) |
Housing Occupancy in Freedom Plains
Occupancy by Ownership in Freedom Plains
Of the total 261 dwellings in Freedom Plains, owner-occupied units account for 195 (74.7%), while renter-occupied units make up 66 (25.3%).
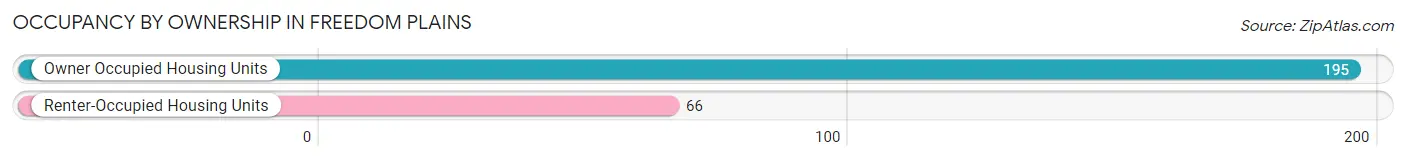
| Occupancy | # Housing Units | % Housing Units |
| Owner Occupied Housing Units | 195 | 74.7% |
| Renter-Occupied Housing Units | 66 | 25.3% |
| Total Occupied Housing Units | 261 | 100.0% |
Occupancy by Household Size in Freedom Plains
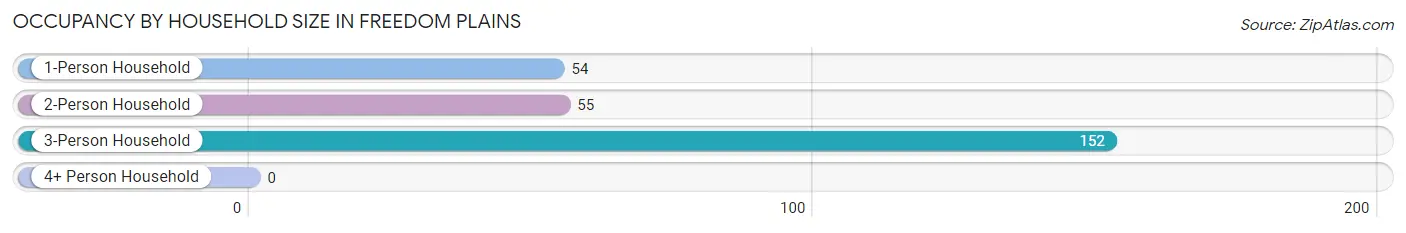
| Household Size | # Housing Units | % Housing Units |
| 1-Person Household | 54 | 20.7% |
| 2-Person Household | 55 | 21.1% |
| 3-Person Household | 152 | 58.2% |
| 4+ Person Household | 0 | 0.0% |
| Total Housing Units | 261 | 100.0% |
Occupancy by Ownership by Household Size in Freedom Plains
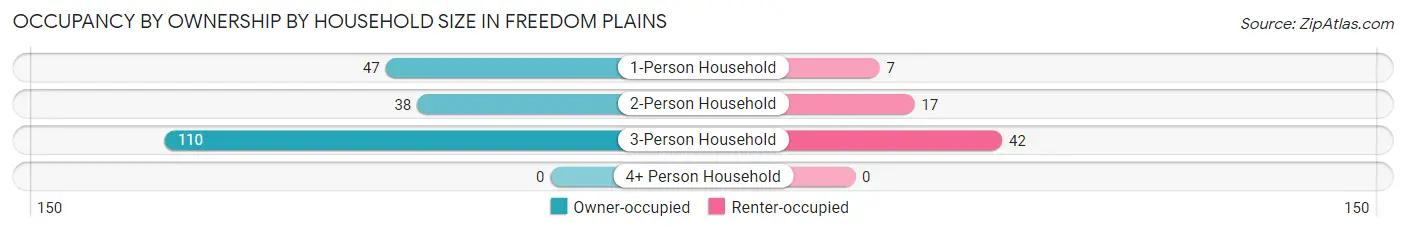
| Household Size | Owner-occupied | Renter-occupied |
| 1-Person Household | 47 (87.0%) | 7 (13.0%) |
| 2-Person Household | 38 (69.1%) | 17 (30.9%) |
| 3-Person Household | 110 (72.4%) | 42 (27.6%) |
| 4+ Person Household | 0 (0.0%) | 0 (0.0%) |
| Total Housing Units | 195 (74.7%) | 66 (25.3%) |
Occupancy by Educational Attainment in Freedom Plains
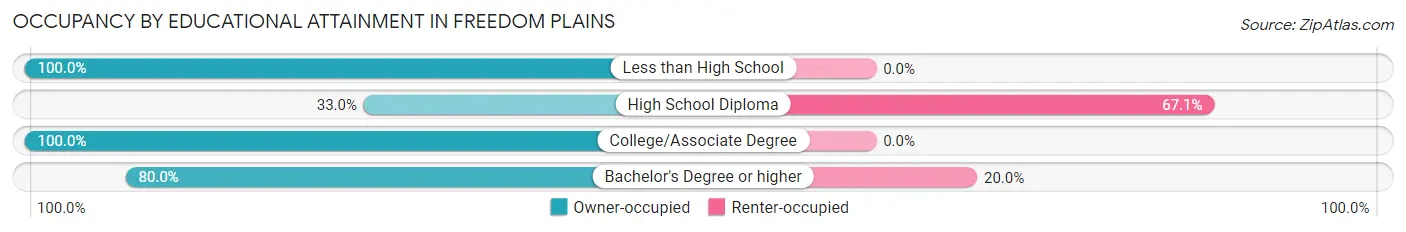
| Household Size | Owner-occupied | Renter-occupied |
| Less than High School | 7 (100.0%) | 0 (0.0%) |
| High School Diploma | 29 (33.0%) | 59 (67.0%) |
| College/Associate Degree | 131 (100.0%) | 0 (0.0%) |
| Bachelor's Degree or higher | 28 (80.0%) | 7 (20.0%) |
Occupancy by Age of Householder in Freedom Plains
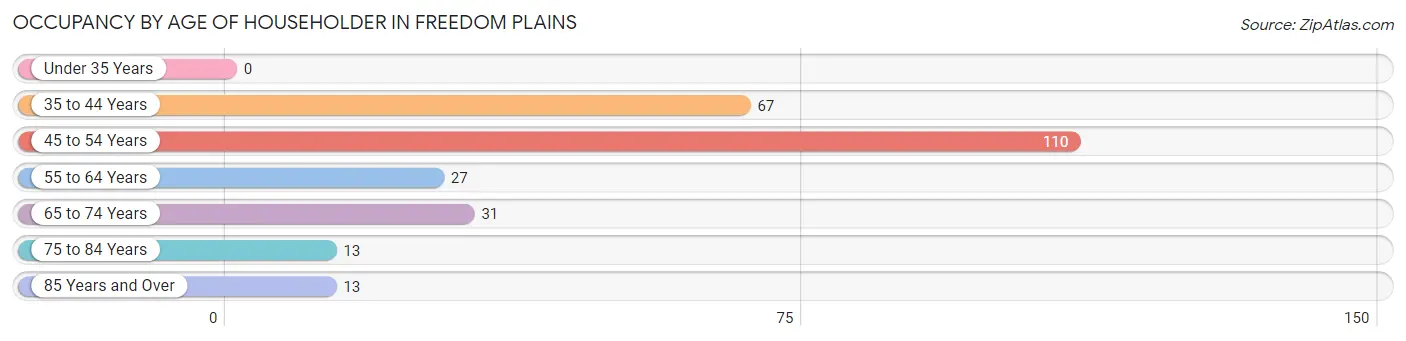
| Age Bracket | # Households | % Households |
| Under 35 Years | 0 | 0.0% |
| 35 to 44 Years | 67 | 25.7% |
| 45 to 54 Years | 110 | 42.1% |
| 55 to 64 Years | 27 | 10.3% |
| 65 to 74 Years | 31 | 11.9% |
| 75 to 84 Years | 13 | 5.0% |
| 85 Years and Over | 13 | 5.0% |
| Total | 261 | 100.0% |
Housing Finances in Freedom Plains
Median Income by Occupancy in Freedom Plains
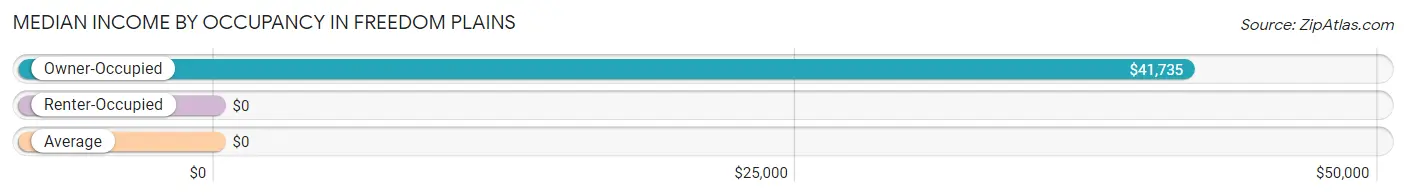
| Occupancy Type | # Households | Median Income |
| Owner-Occupied | 195 (74.7%) | $41,735 |
| Renter-Occupied | 66 (25.3%) | $0 |
| Average | 261 (100.0%) | $0 |
Occupancy by Householder Income Bracket in Freedom Plains
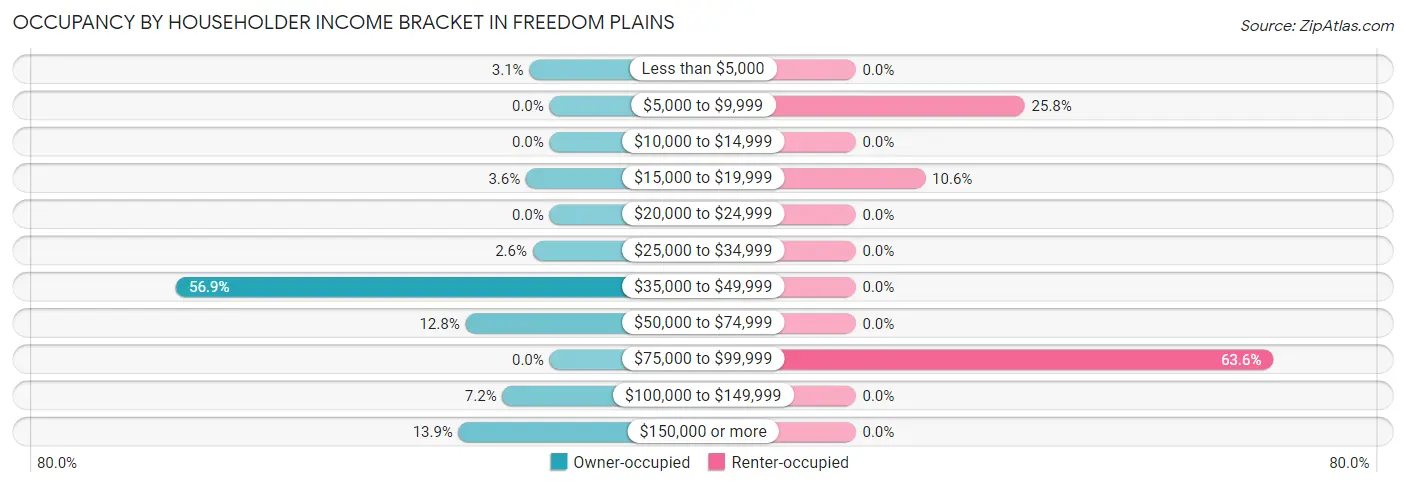
| Income Bracket | Owner-occupied | Renter-occupied |
| Less than $5,000 | 6 (3.1%) | 0 (0.0%) |
| $5,000 to $9,999 | 0 (0.0%) | 17 (25.8%) |
| $10,000 to $14,999 | 0 (0.0%) | 0 (0.0%) |
| $15,000 to $19,999 | 7 (3.6%) | 7 (10.6%) |
| $20,000 to $24,999 | 0 (0.0%) | 0 (0.0%) |
| $25,000 to $34,999 | 5 (2.6%) | 0 (0.0%) |
| $35,000 to $49,999 | 111 (56.9%) | 0 (0.0%) |
| $50,000 to $74,999 | 25 (12.8%) | 0 (0.0%) |
| $75,000 to $99,999 | 0 (0.0%) | 42 (63.6%) |
| $100,000 to $149,999 | 14 (7.2%) | 0 (0.0%) |
| $150,000 or more | 27 (13.9%) | 0 (0.0%) |
| Total | 195 (100.0%) | 66 (100.0%) |
Monthly Housing Cost Tiers in Freedom Plains
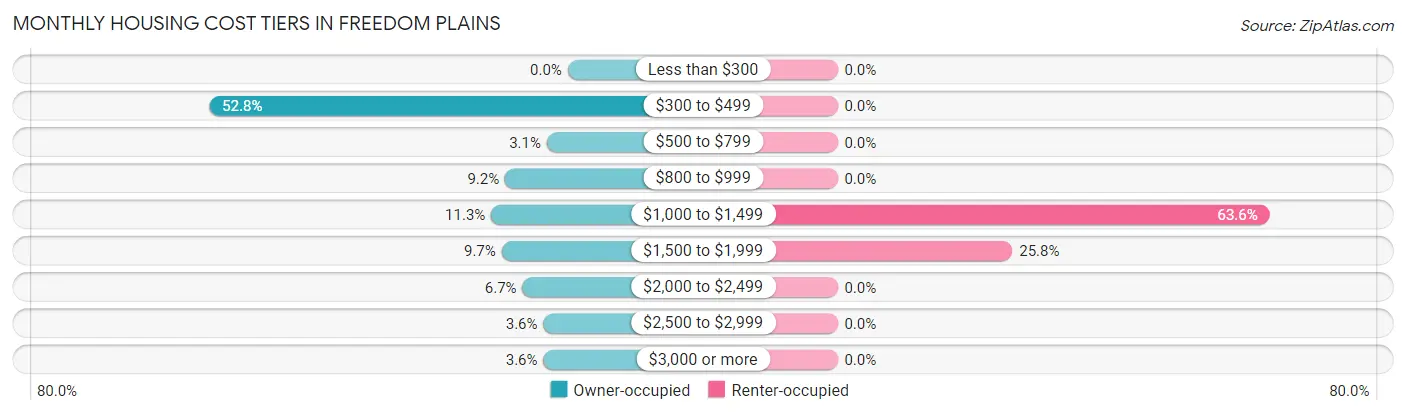
| Monthly Cost | Owner-occupied | Renter-occupied |
| Less than $300 | 0 (0.0%) | 0 (0.0%) |
| $300 to $499 | 103 (52.8%) | 0 (0.0%) |
| $500 to $799 | 6 (3.1%) | 0 (0.0%) |
| $800 to $999 | 18 (9.2%) | 0 (0.0%) |
| $1,000 to $1,499 | 22 (11.3%) | 42 (63.6%) |
| $1,500 to $1,999 | 19 (9.7%) | 17 (25.8%) |
| $2,000 to $2,499 | 13 (6.7%) | 0 (0.0%) |
| $2,500 to $2,999 | 7 (3.6%) | 0 (0.0%) |
| $3,000 or more | 7 (3.6%) | 0 (0.0%) |
| Total | 195 (100.0%) | 66 (100.0%) |
Physical Housing Characteristics in Freedom Plains
Housing Structures in Freedom Plains
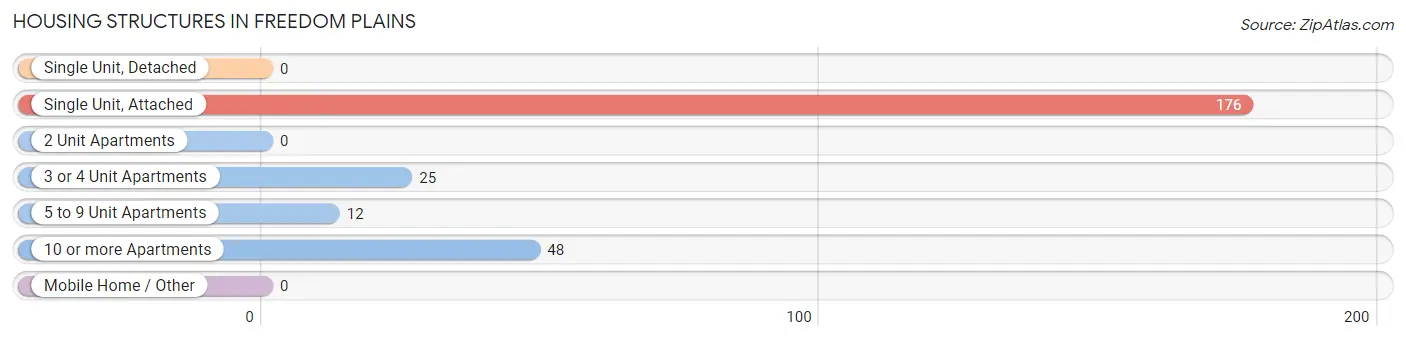
| Structure Type | # Housing Units | % Housing Units |
| Single Unit, Detached | 0 | 0.0% |
| Single Unit, Attached | 176 | 67.4% |
| 2 Unit Apartments | 0 | 0.0% |
| 3 or 4 Unit Apartments | 25 | 9.6% |
| 5 to 9 Unit Apartments | 12 | 4.6% |
| 10 or more Apartments | 48 | 18.4% |
| Mobile Home / Other | 0 | 0.0% |
| Total | 261 | 100.0% |
Housing Structures by Occupancy in Freedom Plains
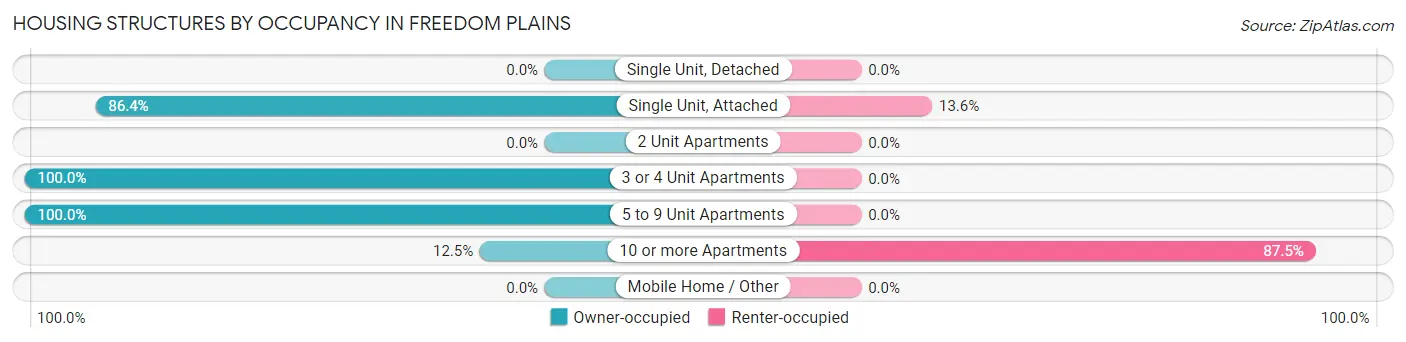
| Structure Type | Owner-occupied | Renter-occupied |
| Single Unit, Detached | 0 (0.0%) | 0 (0.0%) |
| Single Unit, Attached | 152 (86.4%) | 24 (13.6%) |
| 2 Unit Apartments | 0 (0.0%) | 0 (0.0%) |
| 3 or 4 Unit Apartments | 25 (100.0%) | 0 (0.0%) |
| 5 to 9 Unit Apartments | 12 (100.0%) | 0 (0.0%) |
| 10 or more Apartments | 6 (12.5%) | 42 (87.5%) |
| Mobile Home / Other | 0 (0.0%) | 0 (0.0%) |
| Total | 195 (74.7%) | 66 (25.3%) |
Housing Structures by Number of Rooms in Freedom Plains
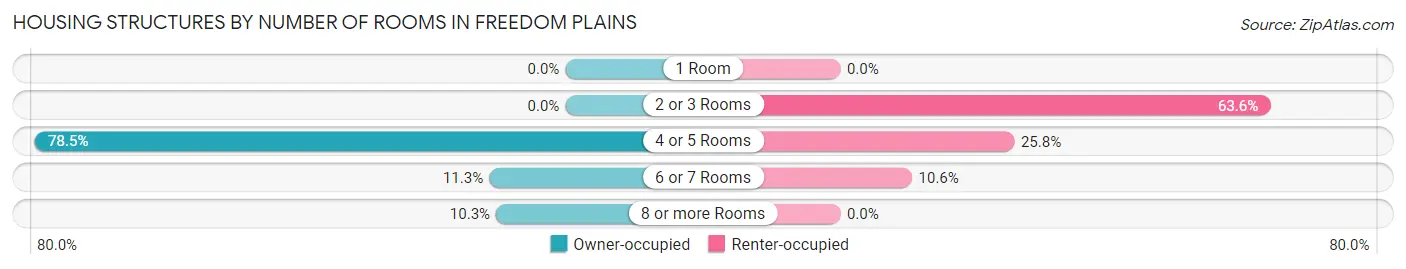
| Number of Rooms | Owner-occupied | Renter-occupied |
| 1 Room | 0 (0.0%) | 0 (0.0%) |
| 2 or 3 Rooms | 0 (0.0%) | 42 (63.6%) |
| 4 or 5 Rooms | 153 (78.5%) | 17 (25.8%) |
| 6 or 7 Rooms | 22 (11.3%) | 7 (10.6%) |
| 8 or more Rooms | 20 (10.3%) | 0 (0.0%) |
| Total | 195 (100.0%) | 66 (100.0%) |
Housing Structure by Heating Type in Freedom Plains
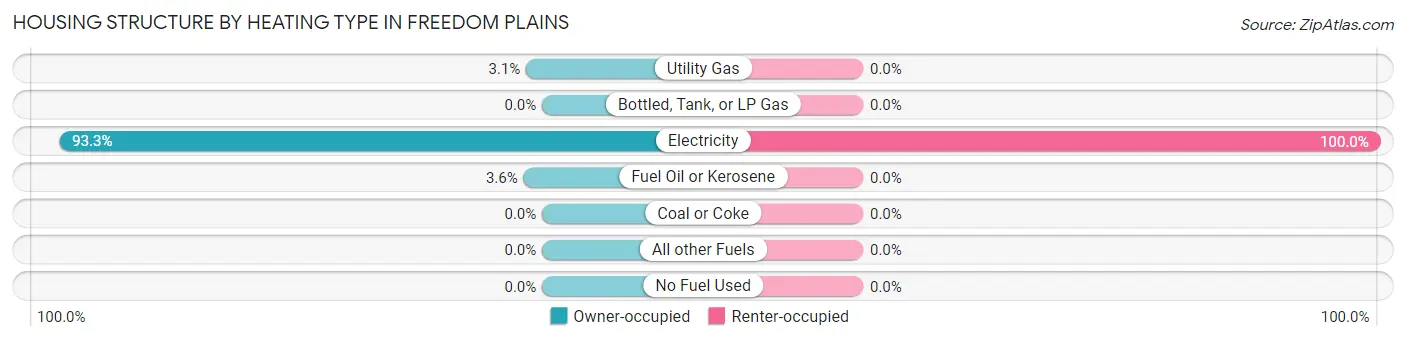
| Heating Type | Owner-occupied | Renter-occupied |
| Utility Gas | 6 (3.1%) | 0 (0.0%) |
| Bottled, Tank, or LP Gas | 0 (0.0%) | 0 (0.0%) |
| Electricity | 182 (93.3%) | 66 (100.0%) |
| Fuel Oil or Kerosene | 7 (3.6%) | 0 (0.0%) |
| Coal or Coke | 0 (0.0%) | 0 (0.0%) |
| All other Fuels | 0 (0.0%) | 0 (0.0%) |
| No Fuel Used | 0 (0.0%) | 0 (0.0%) |
| Total | 195 (100.0%) | 66 (100.0%) |
Household Vehicle Usage in Freedom Plains
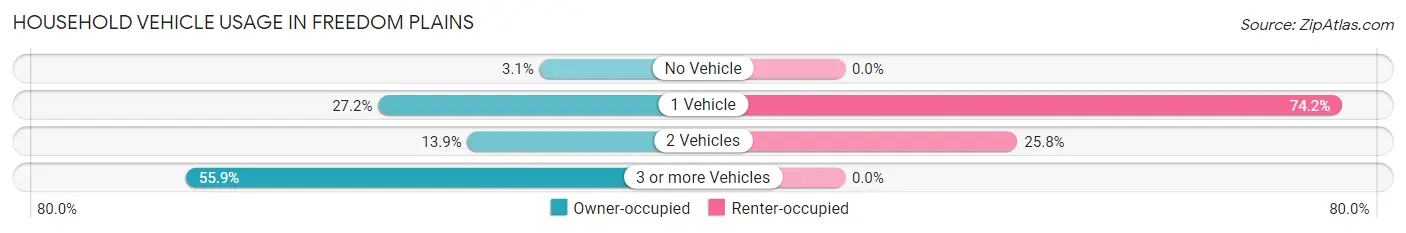
| Vehicles per Household | Owner-occupied | Renter-occupied |
| No Vehicle | 6 (3.1%) | 0 (0.0%) |
| 1 Vehicle | 53 (27.2%) | 49 (74.2%) |
| 2 Vehicles | 27 (13.9%) | 17 (25.8%) |
| 3 or more Vehicles | 109 (55.9%) | 0 (0.0%) |
| Total | 195 (100.0%) | 66 (100.0%) |
Real Estate & Mortgages in Freedom Plains
Real Estate and Mortgage Overview in Freedom Plains
| Characteristic | Without Mortgage | With Mortgage |
| Housing Units | 142 | 53 |
| Median Property Value | $271,600 | $246,400 |
| Median Household Income | $41,214 | $27 |
| Monthly Housing Costs | $469 | $7 |
| Real Estate Taxes | $738 | $8 |
Property Value by Mortgage Status in Freedom Plains
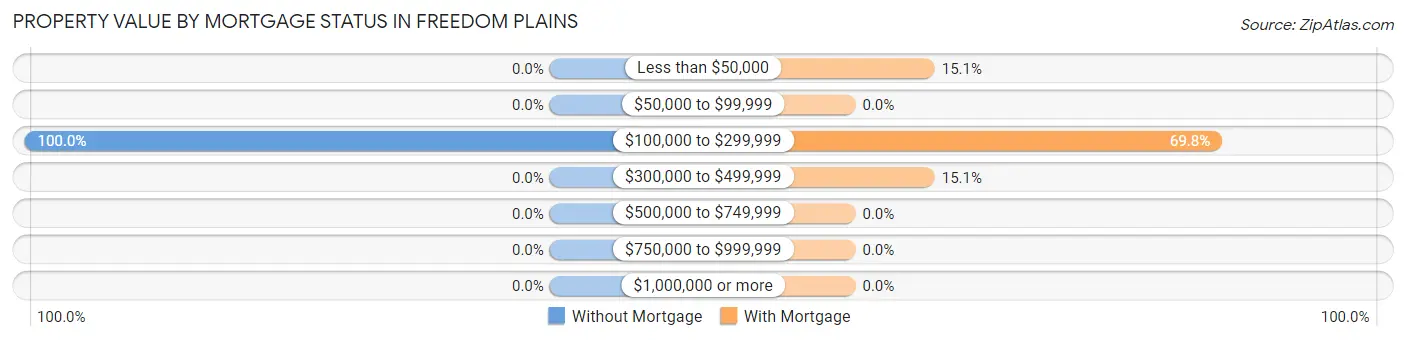
| Property Value | Without Mortgage | With Mortgage |
| Less than $50,000 | 0 (0.0%) | 8 (15.1%) |
| $50,000 to $99,999 | 0 (0.0%) | 0 (0.0%) |
| $100,000 to $299,999 | 142 (100.0%) | 37 (69.8%) |
| $300,000 to $499,999 | 0 (0.0%) | 8 (15.1%) |
| $500,000 to $749,999 | 0 (0.0%) | 0 (0.0%) |
| $750,000 to $999,999 | 0 (0.0%) | 0 (0.0%) |
| $1,000,000 or more | 0 (0.0%) | 0 (0.0%) |
| Total | 142 (100.0%) | 53 (100.0%) |
Household Income by Mortgage Status in Freedom Plains
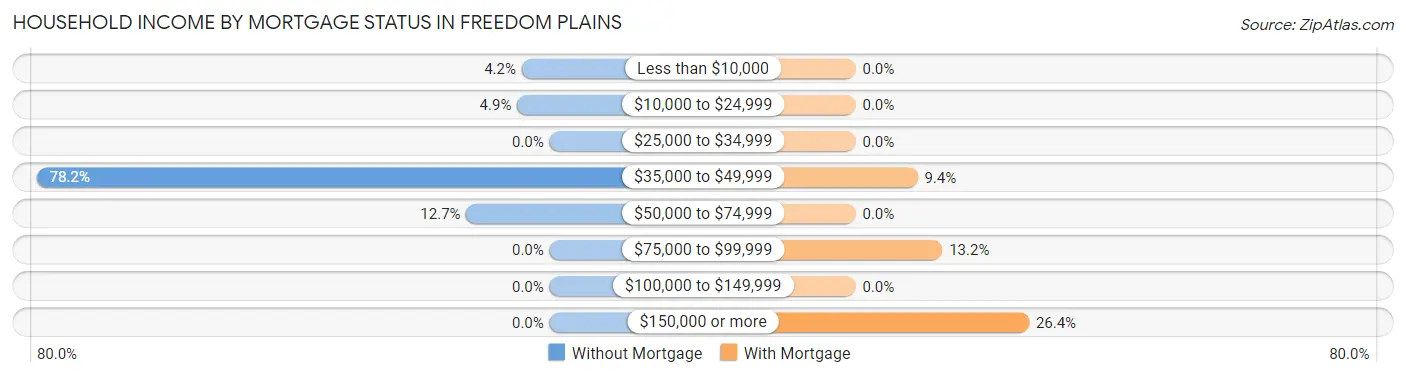
| Household Income | Without Mortgage | With Mortgage |
| Less than $10,000 | 6 (4.2%) | 0 (0.0%) |
| $10,000 to $24,999 | 7 (4.9%) | 0 (0.0%) |
| $25,000 to $34,999 | 0 (0.0%) | 0 (0.0%) |
| $35,000 to $49,999 | 111 (78.2%) | 5 (9.4%) |
| $50,000 to $74,999 | 18 (12.7%) | 0 (0.0%) |
| $75,000 to $99,999 | 0 (0.0%) | 7 (13.2%) |
| $100,000 to $149,999 | 0 (0.0%) | 0 (0.0%) |
| $150,000 or more | 0 (0.0%) | 14 (26.4%) |
| Total | 142 (100.0%) | 53 (100.0%) |
Property Value to Household Income Ratio in Freedom Plains
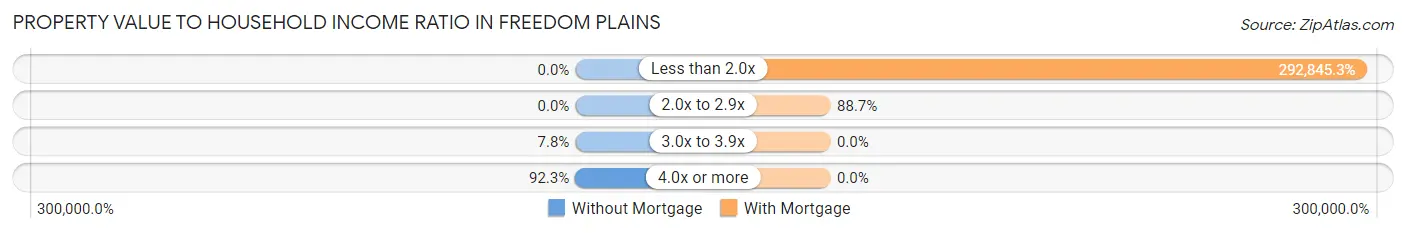
| Value-to-Income Ratio | Without Mortgage | With Mortgage |
| Less than 2.0x | 0 (0.0%) | 155,208 (292,845.3%) |
| 2.0x to 2.9x | 0 (0.0%) | 47 (88.7%) |
| 3.0x to 3.9x | 11 (7.7%) | 0 (0.0%) |
| 4.0x or more | 131 (92.2%) | 0 (0.0%) |
| Total | 142 (100.0%) | 53 (100.0%) |
Real Estate Taxes by Mortgage Status in Freedom Plains
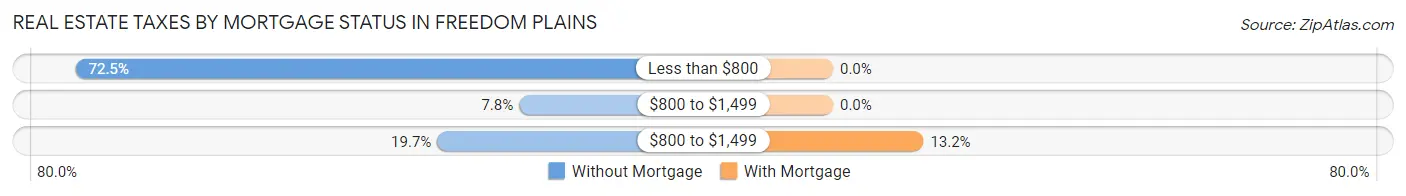
| Property Taxes | Without Mortgage | With Mortgage |
| Less than $800 | 103 (72.5%) | 0 (0.0%) |
| $800 to $1,499 | 11 (7.7%) | 0 (0.0%) |
| $800 to $1,499 | 28 (19.7%) | 7 (13.2%) |
| Total | 142 (100.0%) | 53 (100.0%) |
Health & Disability in Freedom Plains
Health Insurance Coverage by Age in Freedom Plains
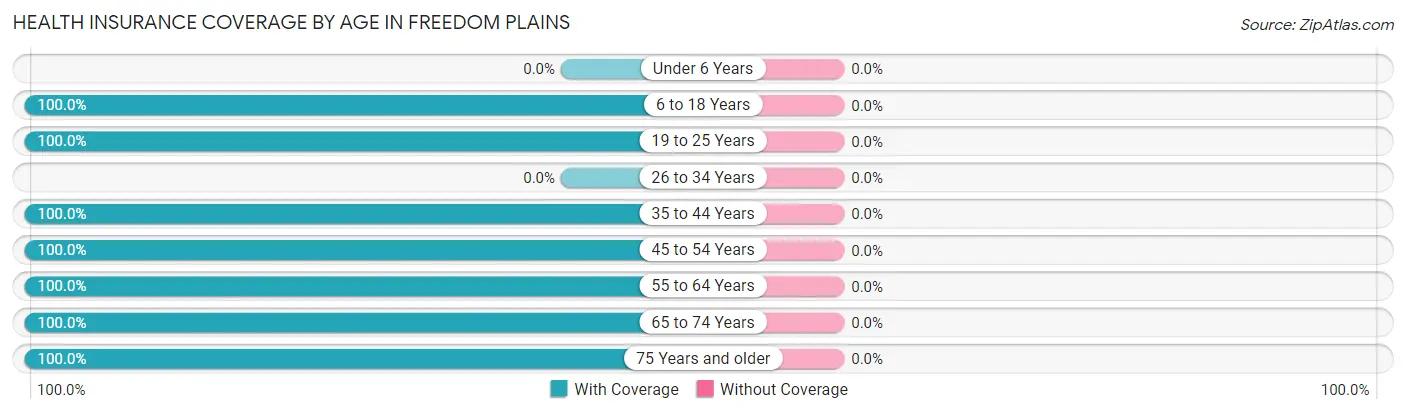
| Age Bracket | With Coverage | Without Coverage |
| Under 6 Years | 0 (0.0%) | 0 (0.0%) |
| 6 to 18 Years | 86 (100.0%) | 0 (0.0%) |
| 19 to 25 Years | 201 (100.0%) | 0 (0.0%) |
| 26 to 34 Years | 0 (0.0%) | 0 (0.0%) |
| 35 to 44 Years | 111 (100.0%) | 0 (0.0%) |
| 45 to 54 Years | 135 (100.0%) | 0 (0.0%) |
| 55 to 64 Years | 27 (100.0%) | 0 (0.0%) |
| 65 to 74 Years | 47 (100.0%) | 0 (0.0%) |
| 75 Years and older | 34 (100.0%) | 0 (0.0%) |
| Total | 641 (100.0%) | 0 (0.0%) |
Health Insurance Coverage by Citizenship Status in Freedom Plains
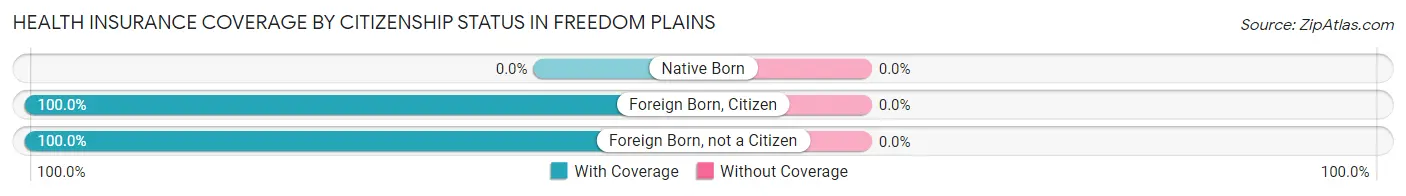
| Citizenship Status | With Coverage | Without Coverage |
| Native Born | 0 (0.0%) | 0 (0.0%) |
| Foreign Born, Citizen | 86 (100.0%) | 0 (0.0%) |
| Foreign Born, not a Citizen | 201 (100.0%) | 0 (0.0%) |
Health Insurance Coverage by Household Income in Freedom Plains
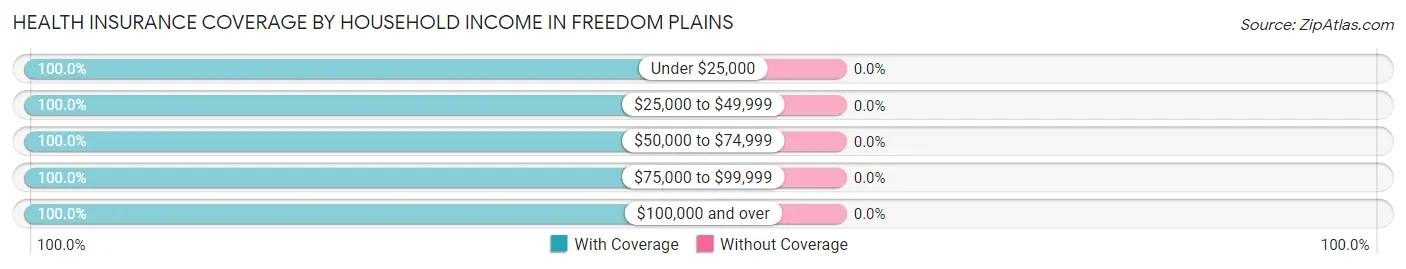
| Household Income | With Coverage | Without Coverage |
| Under $25,000 | 55 (100.0%) | 0 (0.0%) |
| $25,000 to $49,999 | 303 (100.0%) | 0 (0.0%) |
| $50,000 to $74,999 | 38 (100.0%) | 0 (0.0%) |
| $75,000 to $99,999 | 165 (100.0%) | 0 (0.0%) |
| $100,000 and over | 80 (100.0%) | 0 (0.0%) |
Public vs Private Health Insurance Coverage by Age in Freedom Plains
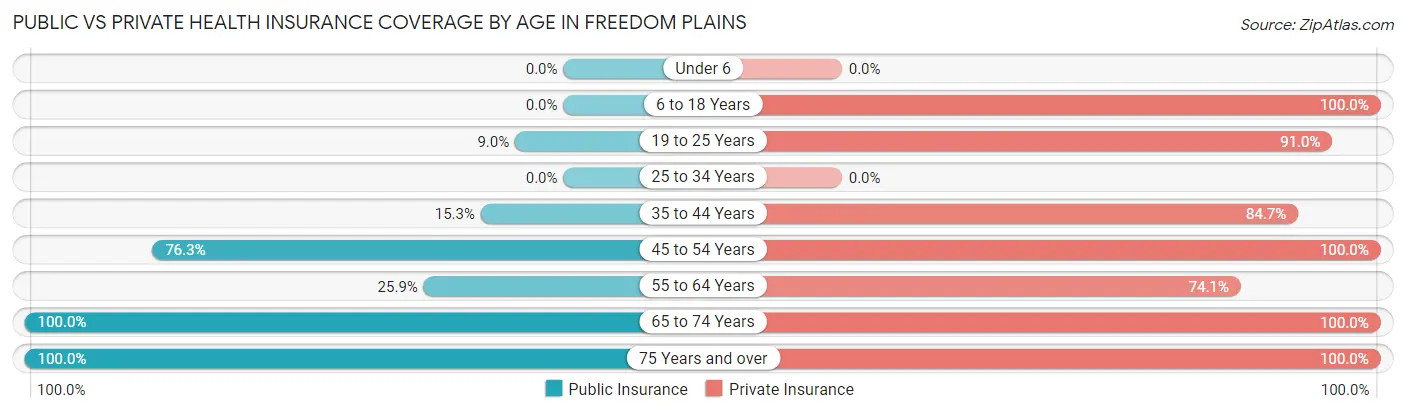
| Age Bracket | Public Insurance | Private Insurance |
| Under 6 | 0 (0.0%) | 0 (0.0%) |
| 6 to 18 Years | 0 (0.0%) | 86 (100.0%) |
| 19 to 25 Years | 18 (9.0%) | 183 (91.0%) |
| 25 to 34 Years | 0 (0.0%) | 0 (0.0%) |
| 35 to 44 Years | 17 (15.3%) | 94 (84.7%) |
| 45 to 54 Years | 103 (76.3%) | 135 (100.0%) |
| 55 to 64 Years | 7 (25.9%) | 20 (74.1%) |
| 65 to 74 Years | 47 (100.0%) | 47 (100.0%) |
| 75 Years and over | 34 (100.0%) | 34 (100.0%) |
| Total | 226 (35.3%) | 599 (93.4%) |
Disability Status by Sex by Age in Freedom Plains
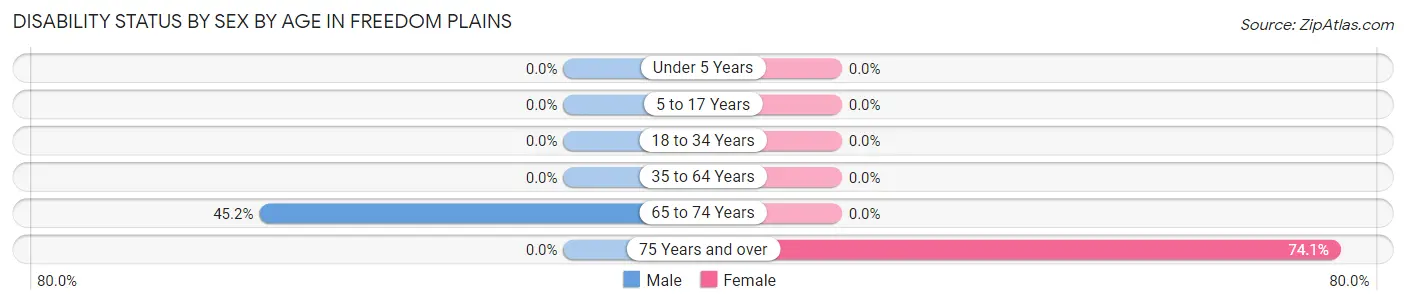
| Age Bracket | Male | Female |
| Under 5 Years | 0 (0.0%) | 0 (0.0%) |
| 5 to 17 Years | 0 (0.0%) | 0 (0.0%) |
| 18 to 34 Years | 0 (0.0%) | 0 (0.0%) |
| 35 to 64 Years | 0 (0.0%) | 0 (0.0%) |
| 65 to 74 Years | 14 (45.2%) | 0 (0.0%) |
| 75 Years and over | 0 (0.0%) | 20 (74.1%) |
Disability Class by Sex by Age in Freedom Plains
Disability Class: Hearing Difficulty
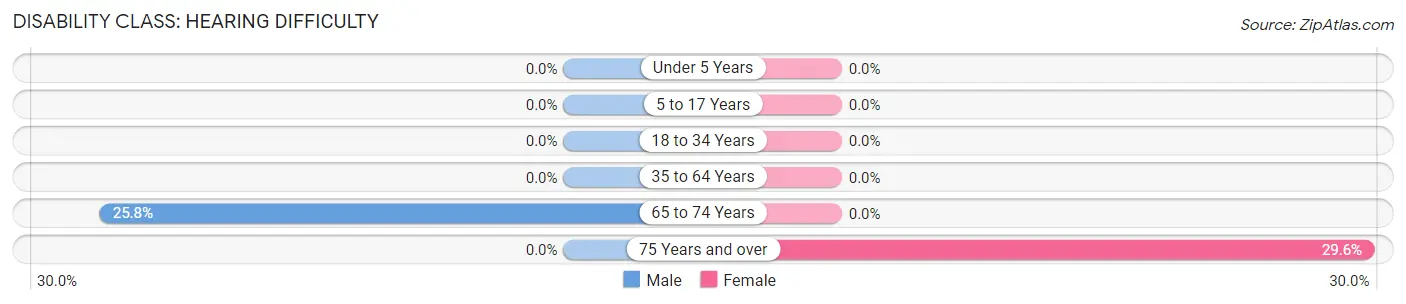
| Age Bracket | Male | Female |
| Under 5 Years | 0 (0.0%) | 0 (0.0%) |
| 5 to 17 Years | 0 (0.0%) | 0 (0.0%) |
| 18 to 34 Years | 0 (0.0%) | 0 (0.0%) |
| 35 to 64 Years | 0 (0.0%) | 0 (0.0%) |
| 65 to 74 Years | 8 (25.8%) | 0 (0.0%) |
| 75 Years and over | 0 (0.0%) | 8 (29.6%) |
Disability Class: Vision Difficulty
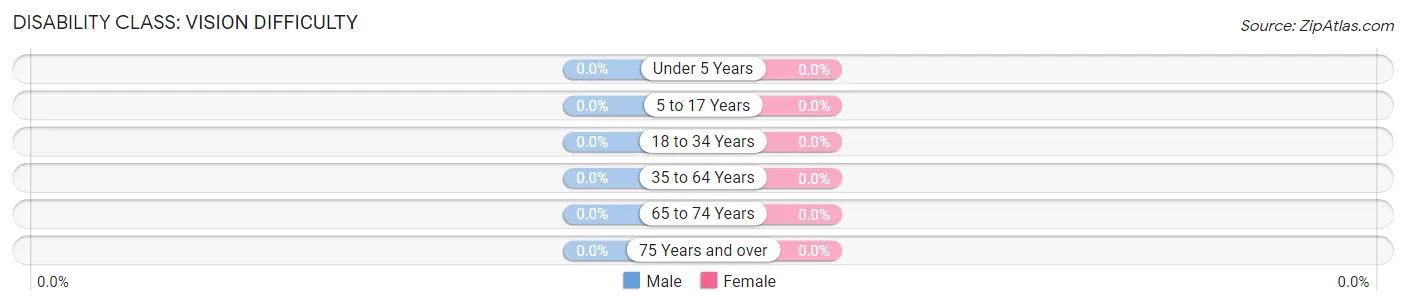
| Age Bracket | Male | Female |
| Under 5 Years | 0 (0.0%) | 0 (0.0%) |
| 5 to 17 Years | 0 (0.0%) | 0 (0.0%) |
| 18 to 34 Years | 0 (0.0%) | 0 (0.0%) |
| 35 to 64 Years | 0 (0.0%) | 0 (0.0%) |
| 65 to 74 Years | 0 (0.0%) | 0 (0.0%) |
| 75 Years and over | 0 (0.0%) | 0 (0.0%) |
Disability Class: Cognitive Difficulty
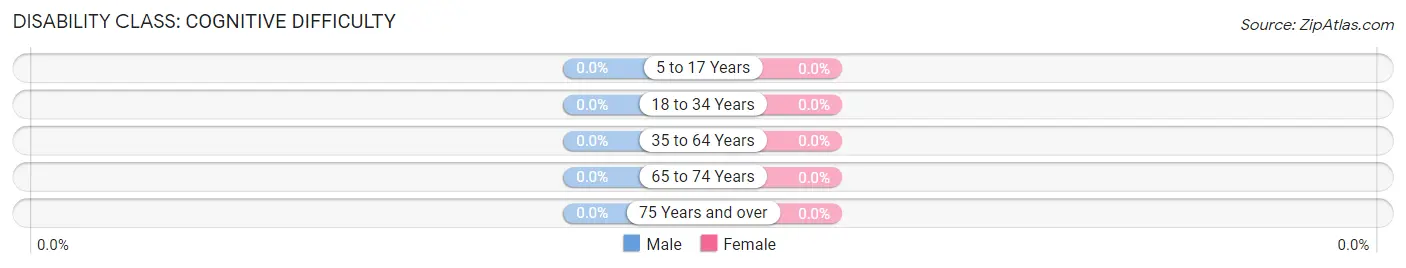
| Age Bracket | Male | Female |
| 5 to 17 Years | 0 (0.0%) | 0 (0.0%) |
| 18 to 34 Years | 0 (0.0%) | 0 (0.0%) |
| 35 to 64 Years | 0 (0.0%) | 0 (0.0%) |
| 65 to 74 Years | 0 (0.0%) | 0 (0.0%) |
| 75 Years and over | 0 (0.0%) | 0 (0.0%) |
Disability Class: Ambulatory Difficulty
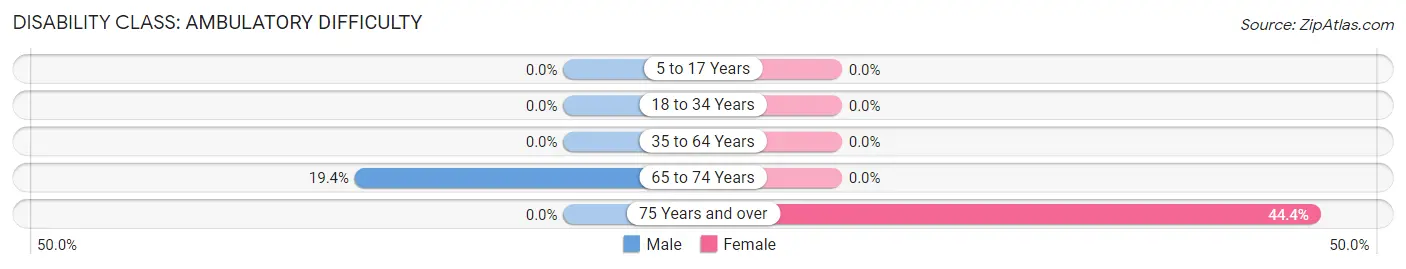
| Age Bracket | Male | Female |
| 5 to 17 Years | 0 (0.0%) | 0 (0.0%) |
| 18 to 34 Years | 0 (0.0%) | 0 (0.0%) |
| 35 to 64 Years | 0 (0.0%) | 0 (0.0%) |
| 65 to 74 Years | 6 (19.4%) | 0 (0.0%) |
| 75 Years and over | 0 (0.0%) | 12 (44.4%) |
Disability Class: Self-Care Difficulty
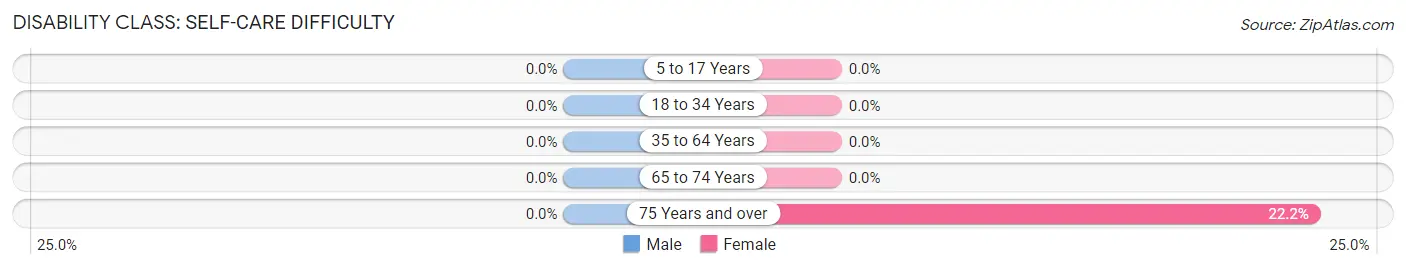
| Age Bracket | Male | Female |
| 5 to 17 Years | 0 (0.0%) | 0 (0.0%) |
| 18 to 34 Years | 0 (0.0%) | 0 (0.0%) |
| 35 to 64 Years | 0 (0.0%) | 0 (0.0%) |
| 65 to 74 Years | 0 (0.0%) | 0 (0.0%) |
| 75 Years and over | 0 (0.0%) | 6 (22.2%) |
Technology Access in Freedom Plains
Computing Device Access in Freedom Plains
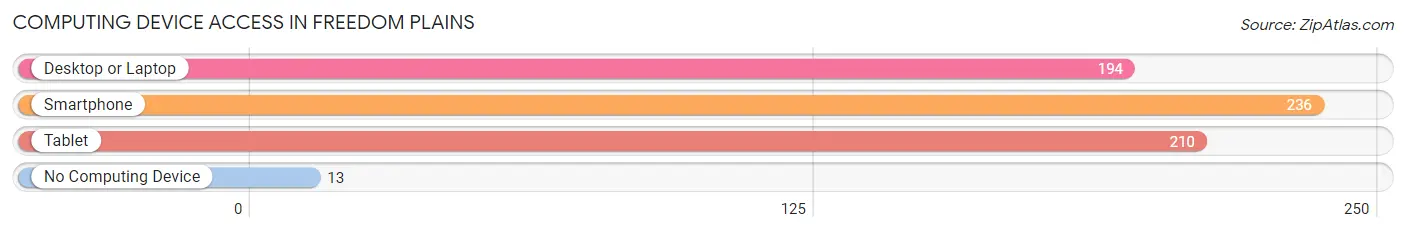
| Device Type | # Households | % Households |
| Desktop or Laptop | 194 | 74.3% |
| Smartphone | 236 | 90.4% |
| Tablet | 210 | 80.5% |
| No Computing Device | 13 | 5.0% |
| Total | 261 | 100.0% |
Internet Access in Freedom Plains
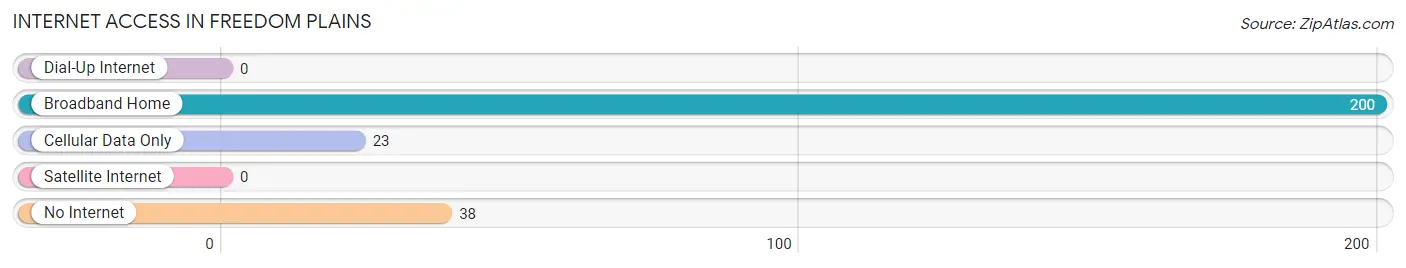
| Internet Type | # Households | % Households |
| Dial-Up Internet | 0 | 0.0% |
| Broadband Home | 200 | 76.6% |
| Cellular Data Only | 23 | 8.8% |
| Satellite Internet | 0 | 0.0% |
| No Internet | 38 | 14.6% |
| Total | 261 | 100.0% |
Freedom Plains Summary
Plains, New York is a small town located in the Hudson Valley region of New York State. It is situated in the town of Southeast, which is part of Putnam County. The town is located on the east side of the Hudson River, about 40 miles north of New York City. The population of Freedom Plains was 2,845 at the 2010 census.
History
The area that is now Freedom Plains was originally inhabited by the Wappinger Indians. The first European settlers arrived in the area in the late 17th century. The town was originally known as “Plainsfield” and was part of the Philipse Patent, which was granted to Frederick Philipse in 1697. The town was renamed “Freedom Plains” in 1776, in honor of the Revolutionary War.
The town was an important stop on the Underground Railroad, and was home to several prominent abolitionists, including the Reverend John Rankin and the Reverend John Rankin Jr. The Rankin family home, which is now a National Historic Landmark, was a major stop on the Underground Railroad.
Geography
Freedom Plains is located in the Hudson Valley region of New York State. It is situated in the town of Southeast, which is part of Putnam County. The town is located on the east side of the Hudson River, about 40 miles north of New York City. The terrain of the town is mostly flat, with some rolling hills. The town is bordered by the towns of Patterson to the north, Southeast to the east, and Kent to the south.
Economy
The economy of Freedom Plains is largely based on agriculture. The town is home to several farms, which produce a variety of crops, including corn, wheat, and hay. The town is also home to several small businesses, including a hardware store, a grocery store, and a few restaurants.
Demographics
As of the 2010 census, the population of Freedom Plains was 2,845. The racial makeup of the town was 94.3% White, 1.7% African American, 0.3% Native American, 0.7% Asian, 0.1% Pacific Islander, 1.2% from other races, and 1.9% from two or more races. Hispanic or Latino of any race were 4.2% of the population.
The median income for a household in Freedom Plains was $60,938, and the median income for a family was $68,750. The per capita income for the town was $25,945. About 4.3% of families and 5.7% of the population were below the poverty line, including 6.3% of those under age 18 and 4.2% of those age 65 or over.
Common Questions
What is Per Capita Income in Freedom Plains?
Per Capita income in Freedom Plains is $27,825.
What is Inequality or Gini Index in Freedom Plains?
Inequality or Gini Index in Freedom Plains is 0.40.
What is the Total Population of Freedom Plains?
Total Population of Freedom Plains is 641.
What is the Total Male Population of Freedom Plains?
Total Male Population of Freedom Plains is 258.
What is the Total Female Population of Freedom Plains?
Total Female Population of Freedom Plains is 383.
What is the Ratio of Males per 100 Females in Freedom Plains?
There are 67.36 Males per 100 Females in Freedom Plains.
What is the Ratio of Females per 100 Males in Freedom Plains?
There are 148.45 Females per 100 Males in Freedom Plains.
What is the Median Population Age in Freedom Plains?
Median Population Age in Freedom Plains is 37.4 Years.
What is the Average Family Size in Freedom Plains
Average Family Size in Freedom Plains is 2.8 People.
What is the Average Household Size in Freedom Plains
Average Household Size in Freedom Plains is 2.5 People.
How Large is the Labor Force in Freedom Plains?
There are 453 People in the Labor Forcein in Freedom Plains.
What is the Percentage of People in the Labor Force in Freedom Plains?
81.6% of People are in the Labor Force in Freedom Plains.