Busti, NY Map & Demographics
Busti Map
Busti Overview
$32,257
PER CAPITA INCOME
$69,236
AVG FAMILY INCOME
$69,097
AVG HOUSEHOLD INCOME
1.0%
WAGE / INCOME GAP [ % ]
99.0¢/ $1
WAGE / INCOME GAP [ $ ]
0.34
INEQUALITY / GINI INDEX
260
TOTAL POPULATION
161
MALE POPULATION
99
FEMALE POPULATION
162.63
MALES / 100 FEMALES
61.49
FEMALES / 100 MALES
41.6
MEDIAN AGE
2.4
AVG FAMILY SIZE
2.2
AVG HOUSEHOLD SIZE
175
LABOR FORCE [ PEOPLE ]
67.3%
PERCENT IN LABOR FORCE
Income in Busti
Income Overview in Busti
Per Capita Income in Busti is $32,257, while median incomes of families and households are $69,236 and $69,097 respectively.
| Characteristic | Number | Measure |
| Per Capita Income | 260 | $32,257 |
| Median Family Income | 84 | $69,236 |
| Mean Family Income | 84 | $71,330 |
| Median Household Income | 120 | $69,097 |
| Mean Household Income | 120 | $71,528 |
| Income Deficit | 84 | $0 |
| Wage / Income Gap (%) | 260 | 1.01% |
| Wage / Income Gap ($) | 260 | 98.99¢ per $1 |
| Gini / Inequality Index | 260 | 0.34 |
Earnings by Sex in Busti
Average Earnings in Busti are $32,831, $32,674 for men and $33,008 for women, a difference of 1.0%.
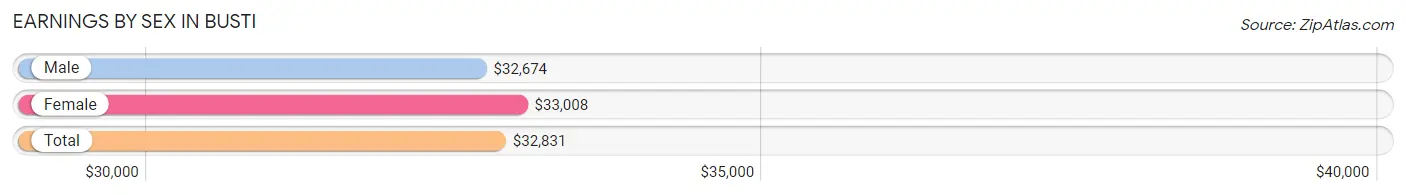
| Sex | Number | Average Earnings |
| Male | 125 (63.8%) | $32,674 |
| Female | 71 (36.2%) | $33,008 |
| Total | 196 (100.0%) | $32,831 |
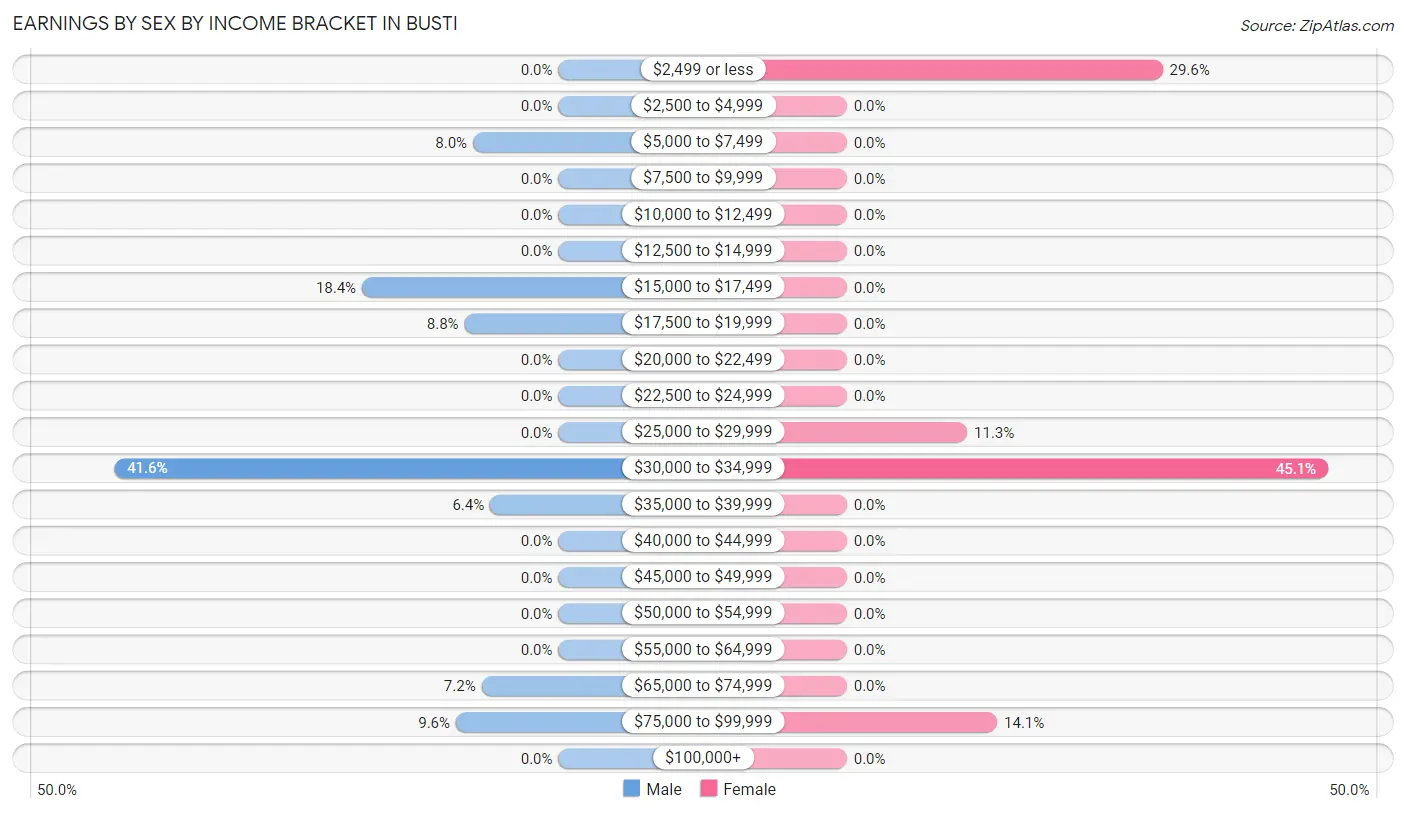
Earnings by Sex by Income Bracket in Busti
The most common earnings brackets in Busti are $30,000 to $34,999 for men (52 | 41.6%) and $30,000 to $34,999 for women (32 | 45.1%).
| Income | Male | Female |
| $2,499 or less | 0 (0.0%) | 21 (29.6%) |
| $2,500 to $4,999 | 0 (0.0%) | 0 (0.0%) |
| $5,000 to $7,499 | 10 (8.0%) | 0 (0.0%) |
| $7,500 to $9,999 | 0 (0.0%) | 0 (0.0%) |
| $10,000 to $12,499 | 0 (0.0%) | 0 (0.0%) |
| $12,500 to $14,999 | 0 (0.0%) | 0 (0.0%) |
| $15,000 to $17,499 | 23 (18.4%) | 0 (0.0%) |
| $17,500 to $19,999 | 11 (8.8%) | 0 (0.0%) |
| $20,000 to $22,499 | 0 (0.0%) | 0 (0.0%) |
| $22,500 to $24,999 | 0 (0.0%) | 0 (0.0%) |
| $25,000 to $29,999 | 0 (0.0%) | 8 (11.3%) |
| $30,000 to $34,999 | 52 (41.6%) | 32 (45.1%) |
| $35,000 to $39,999 | 8 (6.4%) | 0 (0.0%) |
| $40,000 to $44,999 | 0 (0.0%) | 0 (0.0%) |
| $45,000 to $49,999 | 0 (0.0%) | 0 (0.0%) |
| $50,000 to $54,999 | 0 (0.0%) | 0 (0.0%) |
| $55,000 to $64,999 | 0 (0.0%) | 0 (0.0%) |
| $65,000 to $74,999 | 9 (7.2%) | 0 (0.0%) |
| $75,000 to $99,999 | 12 (9.6%) | 10 (14.1%) |
| $100,000+ | 0 (0.0%) | 0 (0.0%) |
| Total | 125 (100.0%) | 71 (100.0%) |
Earnings by Sex by Educational Attainment in Busti
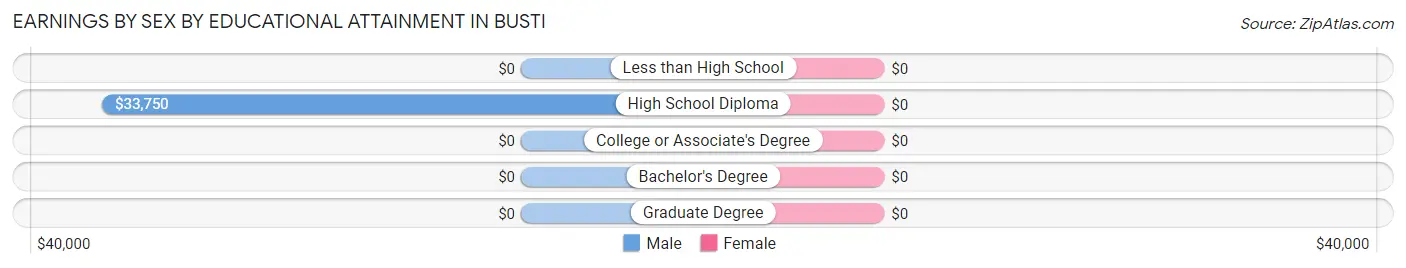
| Educational Attainment | Male Income | Female Income |
| Less than High School | - | - |
| High School Diploma | $33,750 | $0 |
| College or Associate's Degree | - | - |
| Bachelor's Degree | - | - |
| Graduate Degree | - | - |
| Total | $33,264 | $33,828 |
Family Income in Busti
Family Income Brackets in Busti
According to the Busti family income data, there are 72 families falling into the $50,000 to $74,999 income range, which is the most common income bracket and makes up 85.7% of all families.
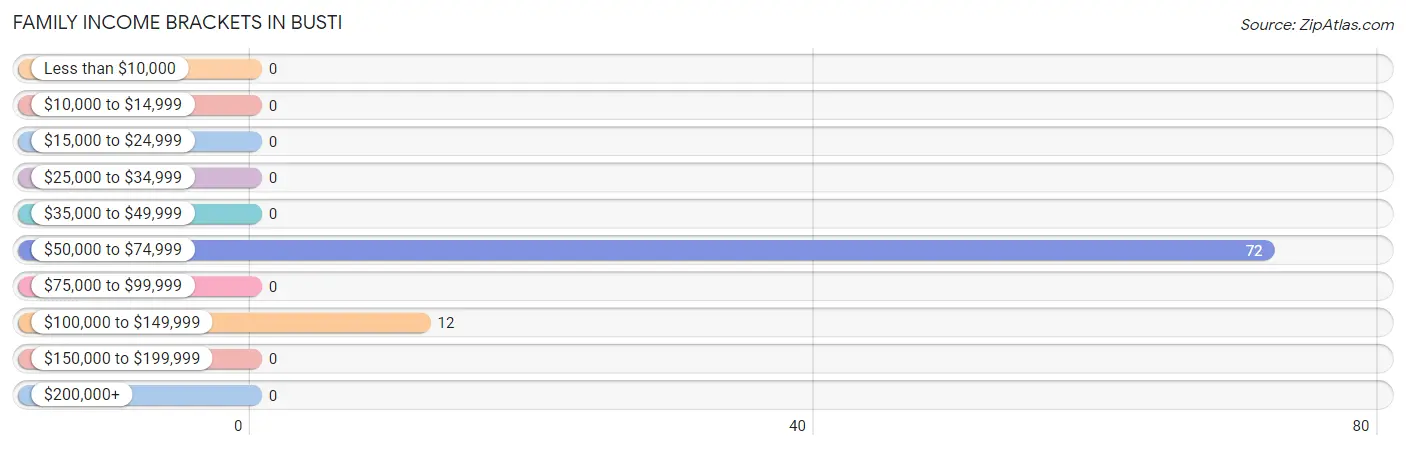
| Income Bracket | # Families | % Families |
| Less than $10,000 | 0 | 0.0% |
| $10,000 to $14,999 | 0 | 0.0% |
| $15,000 to $24,999 | 0 | 0.0% |
| $25,000 to $34,999 | 0 | 0.0% |
| $35,000 to $49,999 | 0 | 0.0% |
| $50,000 to $74,999 | 72 | 85.7% |
| $75,000 to $99,999 | 0 | 0.0% |
| $100,000 to $149,999 | 12 | 14.3% |
| $150,000 to $199,999 | 0 | 0.0% |
| $200,000+ | 0 | 0.0% |
Family Income by Famaliy Size in Busti
2-person families (65 | 77.4%) account for the highest median family income in Busti with $68,576 per family, while 2-person families (65 | 77.4%) have the highest median income of $34,288 per family member.
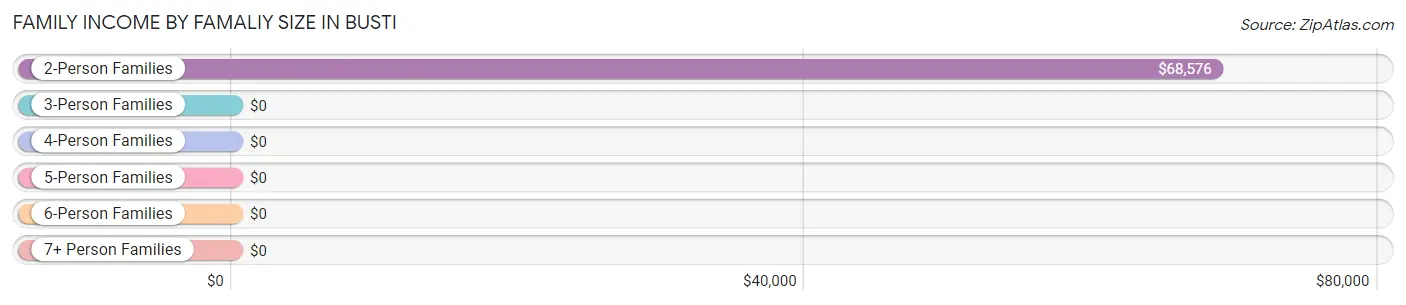
| Income Bracket | # Families | Median Income |
| 2-Person Families | 65 (77.4%) | $68,576 |
| 3-Person Families | 0 (0.0%) | $0 |
| 4-Person Families | 19 (22.6%) | $0 |
| 5-Person Families | 0 (0.0%) | $0 |
| 6-Person Families | 0 (0.0%) | $0 |
| 7+ Person Families | 0 (0.0%) | $0 |
| Total | 84 (100.0%) | $69,236 |
Family Income by Number of Earners in Busti
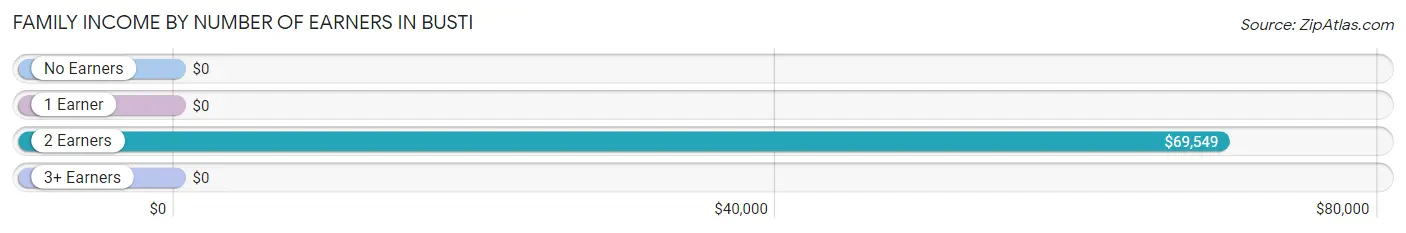
| Number of Earners | # Families | Median Income |
| No Earners | 0 (0.0%) | $0 |
| 1 Earner | 9 (10.7%) | $0 |
| 2 Earners | 75 (89.3%) | $69,549 |
| 3+ Earners | 0 (0.0%) | $0 |
| Total | 84 (100.0%) | $69,236 |
Household Income in Busti
Household Income Brackets in Busti
With 64 households falling in the category, the $50,000 to $74,999 income range is the most frequent in Busti, accounting for 53.3% of all households.
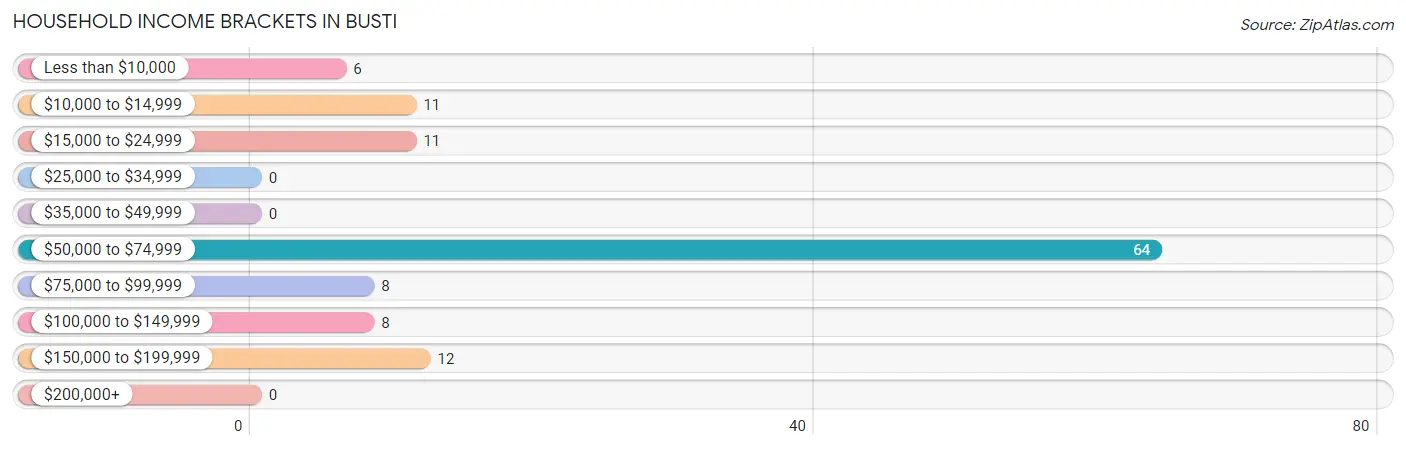
| Income Bracket | # Households | % Households |
| Less than $10,000 | 6 | 5.0% |
| $10,000 to $14,999 | 11 | 9.2% |
| $15,000 to $24,999 | 11 | 9.2% |
| $25,000 to $34,999 | 0 | 0.0% |
| $35,000 to $49,999 | 0 | 0.0% |
| $50,000 to $74,999 | 64 | 53.3% |
| $75,000 to $99,999 | 8 | 6.7% |
| $100,000 to $149,999 | 8 | 6.7% |
| $150,000 to $199,999 | 12 | 10.0% |
| $200,000+ | 0 | 0.0% |
Household Income by Householder Age in Busti
| Income Bracket | # Households | Median Income |
| 15 to 24 Years | 0 (0.0%) | $0 |
| 25 to 44 Years | 58 (48.3%) | $0 |
| 45 to 64 Years | 35 (29.2%) | $0 |
| 65+ Years | 27 (22.5%) | $0 |
| Total | 120 (100.0%) | $69,097 |
Poverty in Busti
Income Below Poverty by Sex and Age in Busti
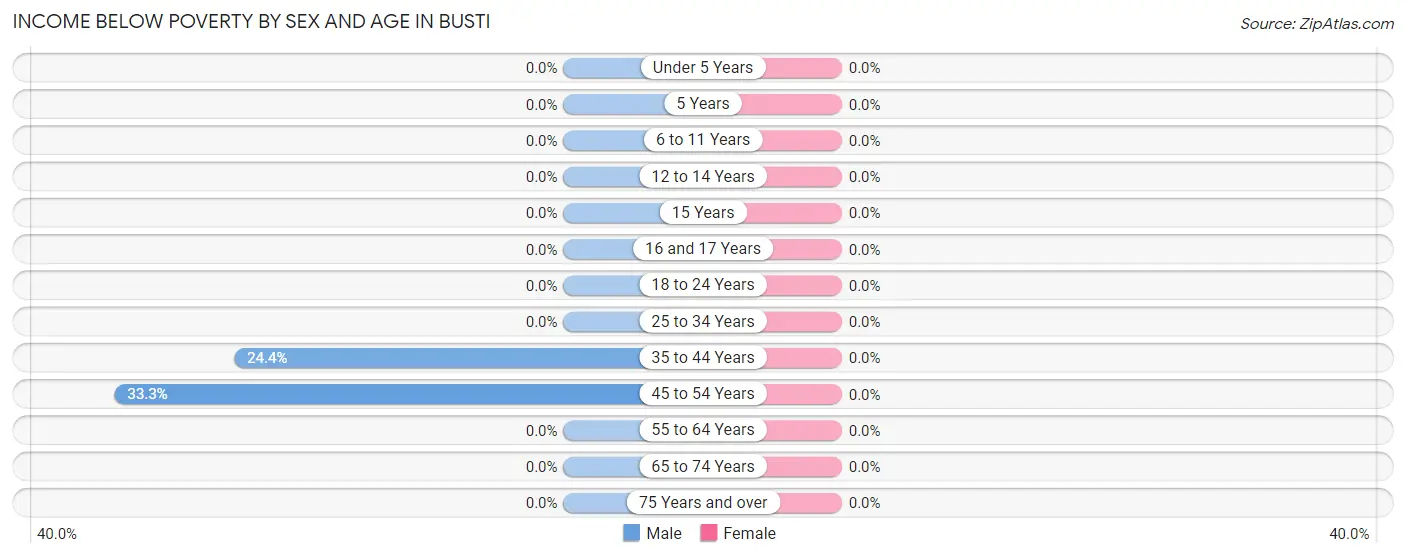
| Age Bracket | Male | Female |
| Under 5 Years | 0 (0.0%) | 0 (0.0%) |
| 5 Years | 0 (0.0%) | 0 (0.0%) |
| 6 to 11 Years | 0 (0.0%) | 0 (0.0%) |
| 12 to 14 Years | 0 (0.0%) | 0 (0.0%) |
| 15 Years | 0 (0.0%) | 0 (0.0%) |
| 16 and 17 Years | 0 (0.0%) | 0 (0.0%) |
| 18 to 24 Years | 0 (0.0%) | 0 (0.0%) |
| 25 to 34 Years | 0 (0.0%) | 0 (0.0%) |
| 35 to 44 Years | 11 (24.4%) | 0 (0.0%) |
| 45 to 54 Years | 6 (33.3%) | 0 (0.0%) |
| 55 to 64 Years | 0 (0.0%) | 0 (0.0%) |
| 65 to 74 Years | 0 (0.0%) | 0 (0.0%) |
| 75 Years and over | 0 (0.0%) | 0 (0.0%) |
| Total | 17 (10.6%) | 0 (0.0%) |
Income Above Poverty by Sex and Age in Busti
According to the poverty statistics in Busti, males aged 16 and 17 years and females aged 18 to 24 years are the age groups that are most secure financially, with 100.0% of males and 100.0% of females in these age groups living above the poverty line.
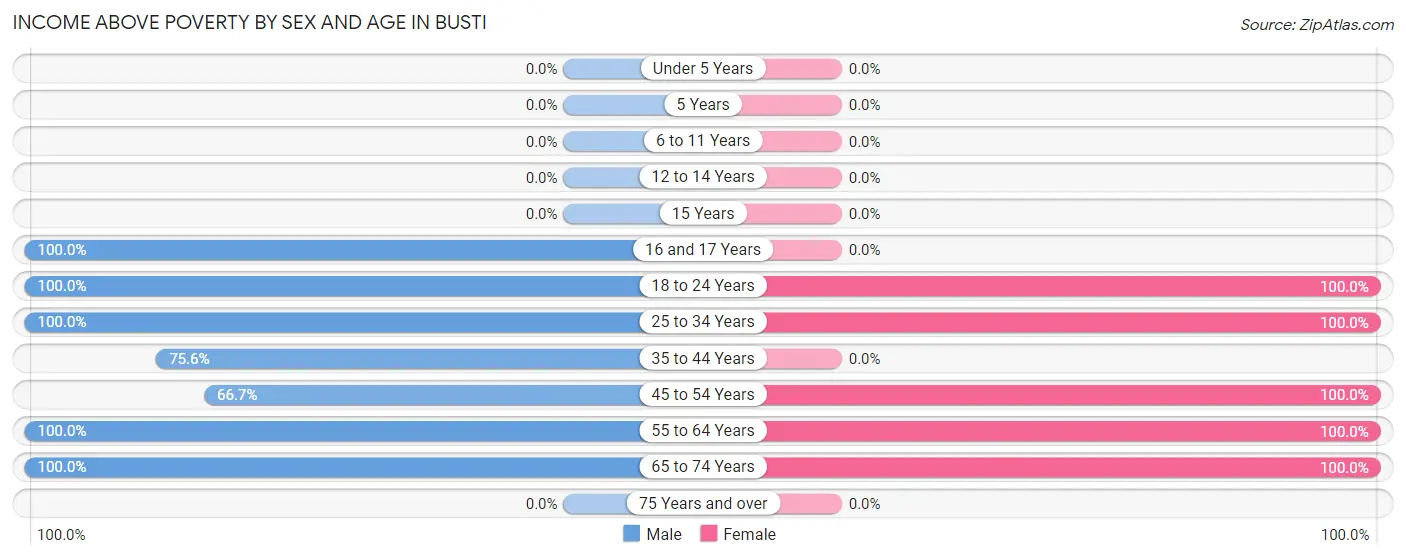
| Age Bracket | Male | Female |
| Under 5 Years | 0 (0.0%) | 0 (0.0%) |
| 5 Years | 0 (0.0%) | 0 (0.0%) |
| 6 to 11 Years | 0 (0.0%) | 0 (0.0%) |
| 12 to 14 Years | 0 (0.0%) | 0 (0.0%) |
| 15 Years | 0 (0.0%) | 0 (0.0%) |
| 16 and 17 Years | 10 (100.0%) | 0 (0.0%) |
| 18 to 24 Years | 7 (100.0%) | 21 (100.0%) |
| 25 to 34 Years | 36 (100.0%) | 32 (100.0%) |
| 35 to 44 Years | 34 (75.6%) | 0 (0.0%) |
| 45 to 54 Years | 12 (66.7%) | 10 (100.0%) |
| 55 to 64 Years | 18 (100.0%) | 17 (100.0%) |
| 65 to 74 Years | 27 (100.0%) | 19 (100.0%) |
| 75 Years and over | 0 (0.0%) | 0 (0.0%) |
| Total | 144 (89.4%) | 99 (100.0%) |
Income Below Poverty Among Married-Couple Families in Busti
| Children | Above Poverty | Below Poverty |
| No Children | 64 (100.0%) | 0 (0.0%) |
| 1 or 2 Children | 0 (0.0%) | 0 (0.0%) |
| 3 or 4 Children | 0 (0.0%) | 0 (0.0%) |
| 5 or more Children | 0 (0.0%) | 0 (0.0%) |
| Total | 64 (100.0%) | 0 (0.0%) |
Income Below Poverty Among Single-Parent Households in Busti
| Children | Single Father | Single Mother |
| No Children | 0 (0.0%) | 0 (0.0%) |
| 1 or 2 Children | 0 (0.0%) | 0 (0.0%) |
| 3 or 4 Children | 0 (0.0%) | 0 (0.0%) |
| 5 or more Children | 0 (0.0%) | 0 (0.0%) |
| Total | 0 (0.0%) | 0 (0.0%) |
Income Below Poverty Among Married-Couple vs Single-Parent Households in Busti
| Children | Married-Couple Families | Single-Parent Households |
| No Children | 0 (0.0%) | 0 (0.0%) |
| 1 or 2 Children | 0 (0.0%) | 0 (0.0%) |
| 3 or 4 Children | 0 (0.0%) | 0 (0.0%) |
| 5 or more Children | 0 (0.0%) | 0 (0.0%) |
| Total | 0 (0.0%) | 0 (0.0%) |
Race in Busti
The most populous races in Busti are , and White / Caucasian (260 | 100.0%).
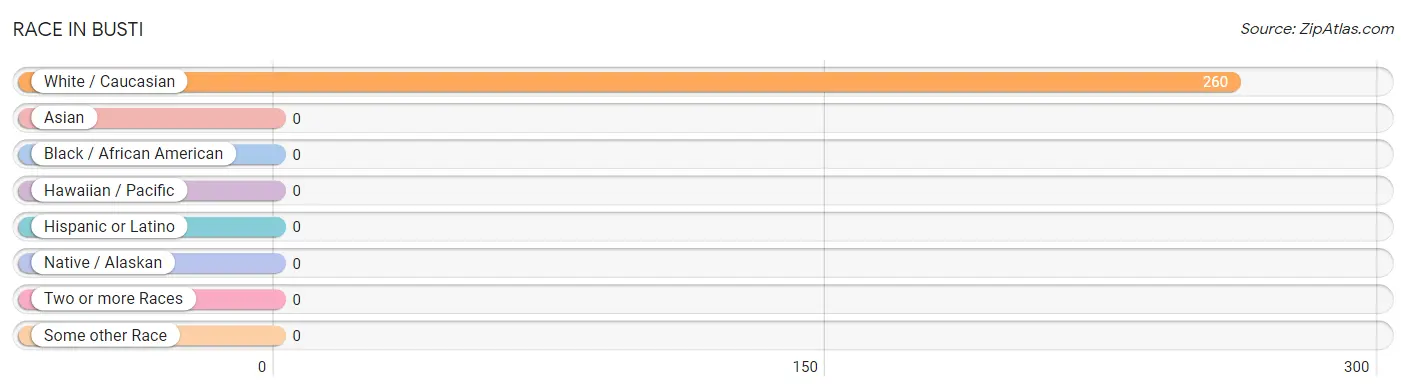
| Race | # Population | % Population |
| Asian | 0 | 0.0% |
| Black / African American | 0 | 0.0% |
| Hawaiian / Pacific | 0 | 0.0% |
| Hispanic or Latino | 0 | 0.0% |
| Native / Alaskan | 0 | 0.0% |
| White / Caucasian | 260 | 100.0% |
| Two or more Races | 0 | 0.0% |
| Some other Race | 0 | 0.0% |
| Total | 260 | 100.0% |
Ancestry in Busti
The most populous ancestries reported in Busti are Irish (82 | 31.5%), Swedish (75 | 28.8%), German (63 | 24.2%), Italian (19 | 7.3%), and American (11 | 4.2%), together accounting for 96.2% of all Busti residents.
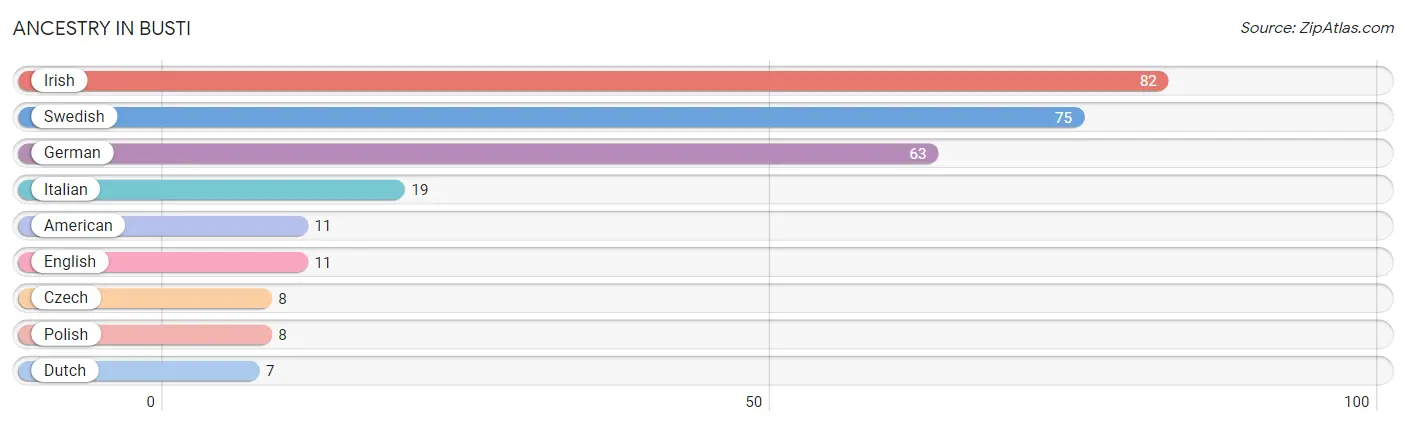
| Ancestry | # Population | % Population |
| American | 11 | 4.2% |
| Czech | 8 | 3.1% |
| Dutch | 7 | 2.7% |
| English | 11 | 4.2% |
| German | 63 | 24.2% |
| Irish | 82 | 31.5% |
| Italian | 19 | 7.3% |
| Polish | 8 | 3.1% |
| Swedish | 75 | 28.8% | View All 9 Rows |
Immigrants in Busti

| Immigration Origin | # Population | % Population | View All 0 Rows |
Sex and Age in Busti
Sex and Age in Busti
The most populous age groups in Busti are 30 to 34 Years (36 | 22.4%) for men and 30 to 34 Years (32 | 32.3%) for women.
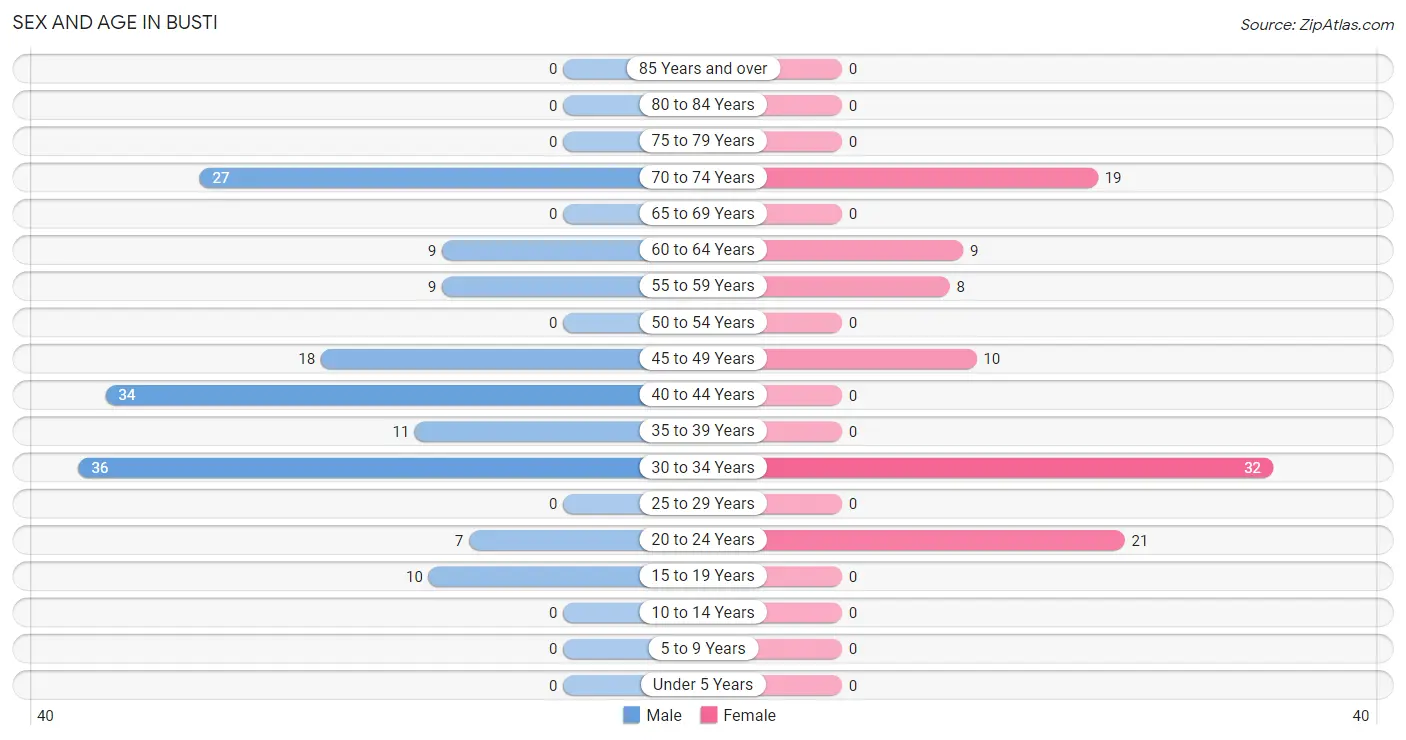
| Age Bracket | Male | Female |
| Under 5 Years | 0 (0.0%) | 0 (0.0%) |
| 5 to 9 Years | 0 (0.0%) | 0 (0.0%) |
| 10 to 14 Years | 0 (0.0%) | 0 (0.0%) |
| 15 to 19 Years | 10 (6.2%) | 0 (0.0%) |
| 20 to 24 Years | 7 (4.3%) | 21 (21.2%) |
| 25 to 29 Years | 0 (0.0%) | 0 (0.0%) |
| 30 to 34 Years | 36 (22.4%) | 32 (32.3%) |
| 35 to 39 Years | 11 (6.8%) | 0 (0.0%) |
| 40 to 44 Years | 34 (21.1%) | 0 (0.0%) |
| 45 to 49 Years | 18 (11.2%) | 10 (10.1%) |
| 50 to 54 Years | 0 (0.0%) | 0 (0.0%) |
| 55 to 59 Years | 9 (5.6%) | 8 (8.1%) |
| 60 to 64 Years | 9 (5.6%) | 9 (9.1%) |
| 65 to 69 Years | 0 (0.0%) | 0 (0.0%) |
| 70 to 74 Years | 27 (16.8%) | 19 (19.2%) |
| 75 to 79 Years | 0 (0.0%) | 0 (0.0%) |
| 80 to 84 Years | 0 (0.0%) | 0 (0.0%) |
| 85 Years and over | 0 (0.0%) | 0 (0.0%) |
| Total | 161 (100.0%) | 99 (100.0%) |
Families and Households in Busti
Median Family Size in Busti
The median family size in Busti is 2.44 persons per family, with married-couple families (64 | 76.2%) accounting for the largest median family size of 2.63 persons per family. On the other hand, single male/father families (12 | 14.3%) represent the smallest median family size with 1.83 persons per family.
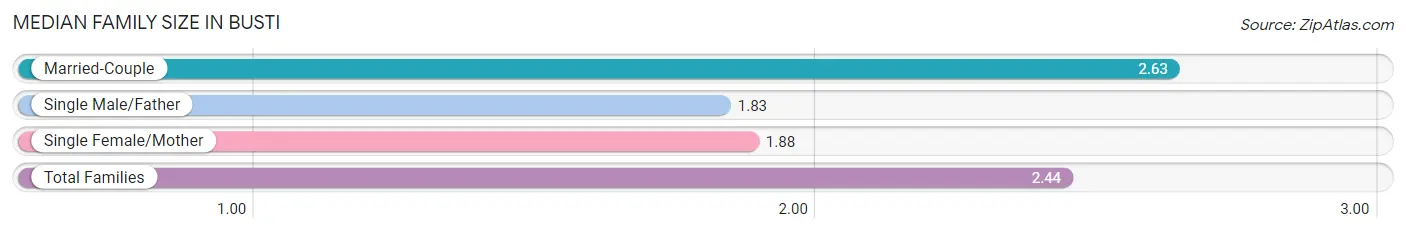
| Family Type | # Families | Family Size |
| Married-Couple | 64 (76.2%) | 2.63 |
| Single Male/Father | 12 (14.3%) | 1.83 |
| Single Female/Mother | 8 (9.5%) | 1.88 |
| Total Families | 84 (100.0%) | 2.44 |
Median Household Size in Busti
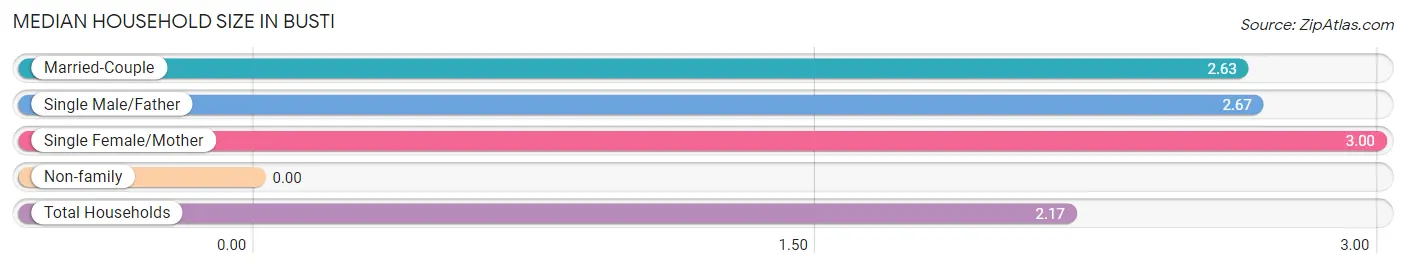
| Household Type | # Households | Household Size |
| Married-Couple | 64 (53.3%) | 2.63 |
| Single Male/Father | 12 (10.0%) | 2.67 |
| Single Female/Mother | 8 (6.7%) | 3.00 |
| Non-family | 36 (30.0%) | - |
| Total Households | 120 (100.0%) | 2.17 |
Household Size by Marriage Status in Busti
Out of a total of 120 households in Busti, 84 (70.0%) are family households, while 36 (30.0%) are nonfamily households. The most numerous type of family households are 2-person households, comprising 45, and the most common type of nonfamily households are 1-person households, comprising 36.
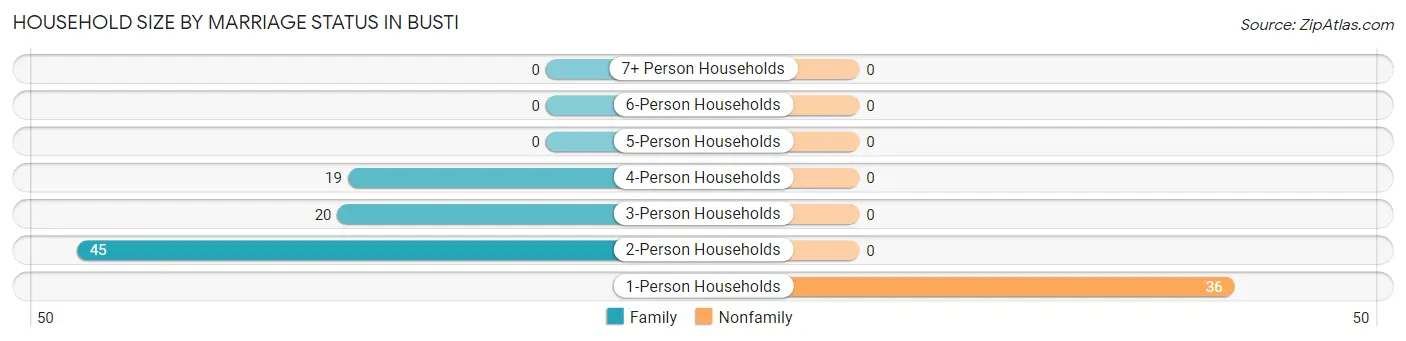
| Household Size | Family Households | Nonfamily Households |
| 1-Person Households | - | 36 (30.0%) |
| 2-Person Households | 45 (37.5%) | 0 (0.0%) |
| 3-Person Households | 20 (16.7%) | 0 (0.0%) |
| 4-Person Households | 19 (15.8%) | 0 (0.0%) |
| 5-Person Households | 0 (0.0%) | 0 (0.0%) |
| 6-Person Households | 0 (0.0%) | 0 (0.0%) |
| 7+ Person Households | 0 (0.0%) | 0 (0.0%) |
| Total | 84 (70.0%) | 36 (30.0%) |
Female Fertility in Busti
Fertility by Age in Busti
| Age Bracket | Women with Births | Births / 1,000 Women |
| 15 to 19 years | 0 (0.0%) | 0.0 |
| 20 to 34 years | 0 (0.0%) | 0.0 |
| 35 to 50 years | 0 (0.0%) | 0.0 |
| Total | 0 (0.0%) | 0.0 |
Fertility by Age by Marriage Status in Busti
| Age Bracket | Married | Unmarried |
| 15 to 19 years | 0 (0.0%) | 0 (0.0%) |
| 20 to 34 years | 0 (0.0%) | 0 (0.0%) |
| 35 to 50 years | 0 (0.0%) | 0 (0.0%) |
| Total | 0 (0.0%) | 0 (0.0%) |
Fertility by Education in Busti
| Educational Attainment | Women with Births | Births / 1,000 Women |
| Less than High School | 0 (0.0%) | 0.0 |
| High School Diploma | 0 (0.0%) | 0.0 |
| College or Associate's Degree | 0 (0.0%) | 0.0 |
| Bachelor's Degree | 0 (0.0%) | 0.0 |
| Graduate Degree | 0 (0.0%) | 0.0 |
| Total | 0 (0.0%) | 0.0 |
Fertility by Education by Marriage Status in Busti
| Educational Attainment | Married | Unmarried |
| Less than High School | 0 (0.0%) | 0 (0.0%) |
| High School Diploma | 0 (0.0%) | 0 (0.0%) |
| College or Associate's Degree | 0 (0.0%) | 0 (0.0%) |
| Bachelor's Degree | 0 (0.0%) | 0 (0.0%) |
| Graduate Degree | 0 (0.0%) | 0 (0.0%) |
| Total | 0 (0.0%) | 0 (0.0%) |
Employment Characteristics in Busti
Employment by Class of Employer in Busti
Among the 175 employed individuals in Busti, private company employees (120 | 68.6%), local government employees (32 | 18.3%), and not-for-profit organizations (23 | 13.1%) make up the most common classes of employment.
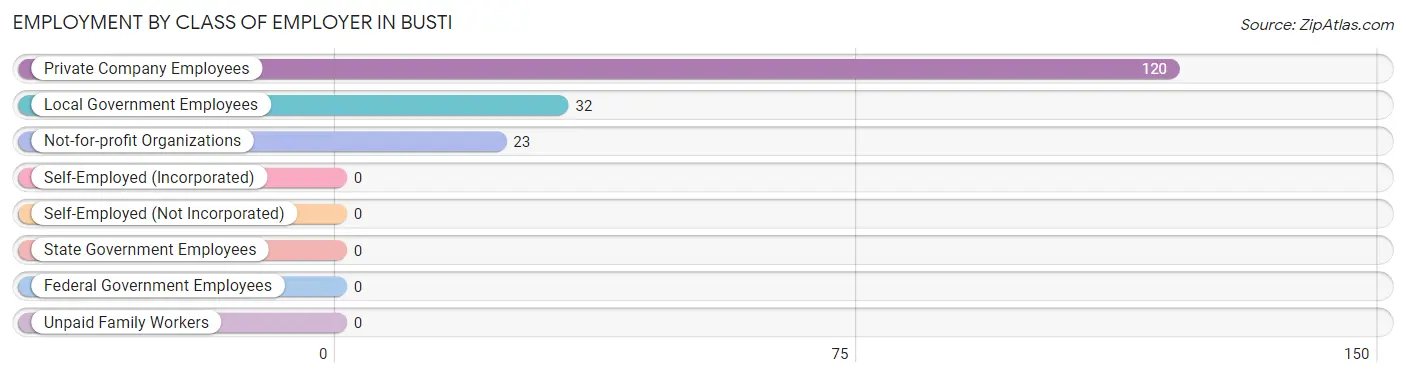
| Employer Class | # Employees | % Employees |
| Private Company Employees | 120 | 68.6% |
| Self-Employed (Incorporated) | 0 | 0.0% |
| Self-Employed (Not Incorporated) | 0 | 0.0% |
| Not-for-profit Organizations | 23 | 13.1% |
| Local Government Employees | 32 | 18.3% |
| State Government Employees | 0 | 0.0% |
| Federal Government Employees | 0 | 0.0% |
| Unpaid Family Workers | 0 | 0.0% |
| Total | 175 | 100.0% |
Employment Status by Age in Busti
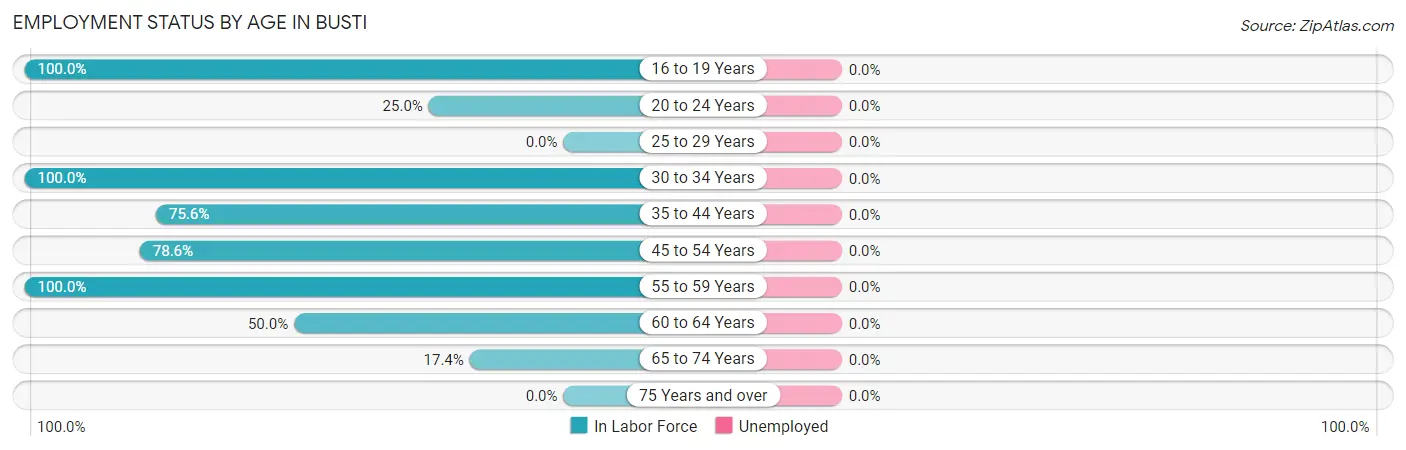
| Age Bracket | In Labor Force | Unemployed |
| 16 to 19 Years | 10 (100.0%) | 0 (0.0%) |
| 20 to 24 Years | 7 (25.0%) | 0 (0.0%) |
| 25 to 29 Years | 0 (0.0%) | 0 (0.0%) |
| 30 to 34 Years | 68 (100.0%) | 0 (0.0%) |
| 35 to 44 Years | 34 (75.6%) | 0 (0.0%) |
| 45 to 54 Years | 22 (78.6%) | 0 (0.0%) |
| 55 to 59 Years | 17 (100.0%) | 0 (0.0%) |
| 60 to 64 Years | 9 (50.0%) | 0 (0.0%) |
| 65 to 74 Years | 8 (17.4%) | 0 (0.0%) |
| 75 Years and over | 0 (0.0%) | 0 (0.0%) |
| Total | 175 (67.3%) | 0 (0.0%) |
Employment Status by Educational Attainment in Busti

| Educational Attainment | In Labor Force | Unemployed |
| Less than High School | 8 (100.0%) | 0 (0.0%) |
| High School Diploma | 64 (91.4%) | 0 (0.0%) |
| College / Associate Degree | 55 (73.3%) | 0 (0.0%) |
| Bachelor's Degree or higher | 23 (100.0%) | 0 (0.0%) |
| Total | 150 (85.2%) | 0 (0.0%) |
Employment Occupations by Sex in Busti
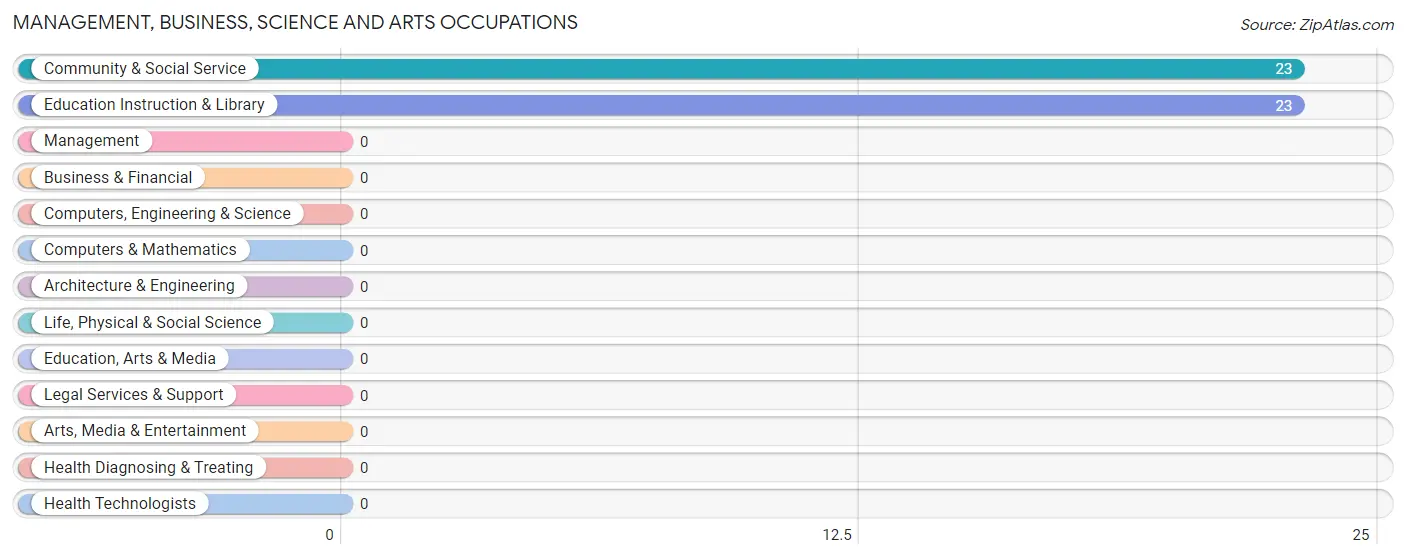
Management, Business, Science and Arts Occupations
The most common Management, Business, Science and Arts occupations in Busti are Community & Social Service (23 | 13.1%), and Education Instruction & Library (23 | 13.1%).
Management, Business, Science and Arts Occupations by Sex
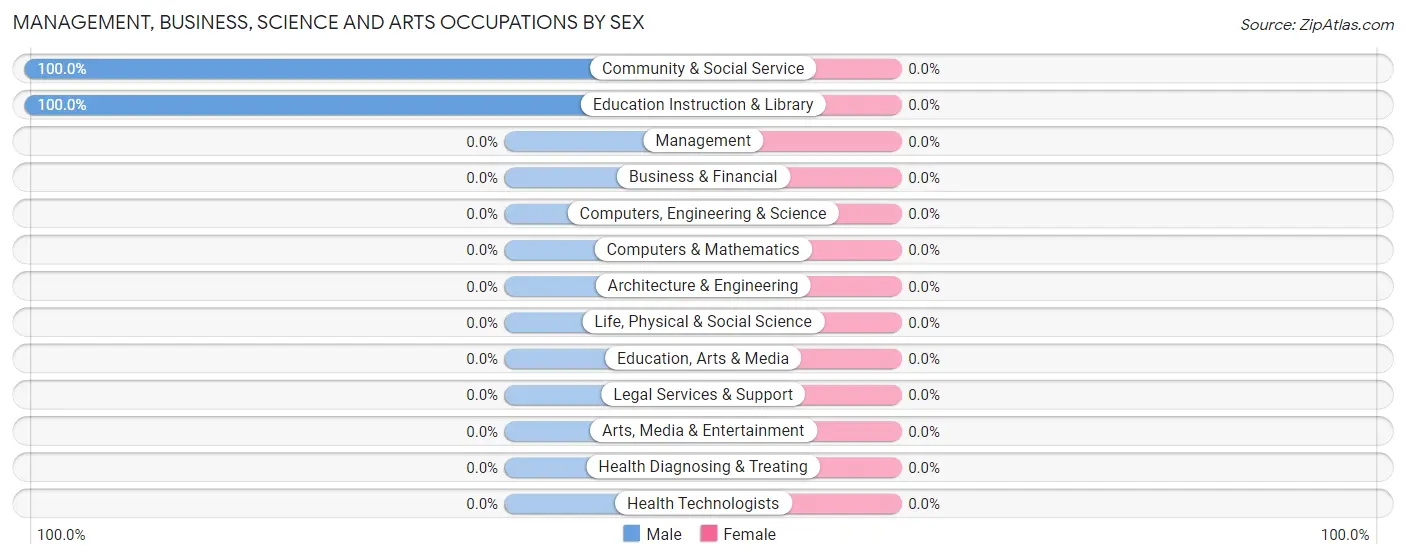
| Occupation | Male | Female |
| Management | 0 (0.0%) | 0 (0.0%) |
| Business & Financial | 0 (0.0%) | 0 (0.0%) |
| Computers, Engineering & Science | 0 (0.0%) | 0 (0.0%) |
| Computers & Mathematics | 0 (0.0%) | 0 (0.0%) |
| Architecture & Engineering | 0 (0.0%) | 0 (0.0%) |
| Life, Physical & Social Science | 0 (0.0%) | 0 (0.0%) |
| Community & Social Service | 23 (100.0%) | 0 (0.0%) |
| Education, Arts & Media | 0 (0.0%) | 0 (0.0%) |
| Legal Services & Support | 0 (0.0%) | 0 (0.0%) |
| Education Instruction & Library | 23 (100.0%) | 0 (0.0%) |
| Arts, Media & Entertainment | 0 (0.0%) | 0 (0.0%) |
| Health Diagnosing & Treating | 0 (0.0%) | 0 (0.0%) |
| Health Technologists | 0 (0.0%) | 0 (0.0%) |
| Total (Category) | 23 (100.0%) | 0 (0.0%) |
| Total (Overall) | 125 (71.4%) | 50 (28.6%) |
Services Occupations
The most common Services occupations in Busti are Cleaning & Maintenance (11 | 6.3%), and Food Preparation & Serving (10 | 5.7%).
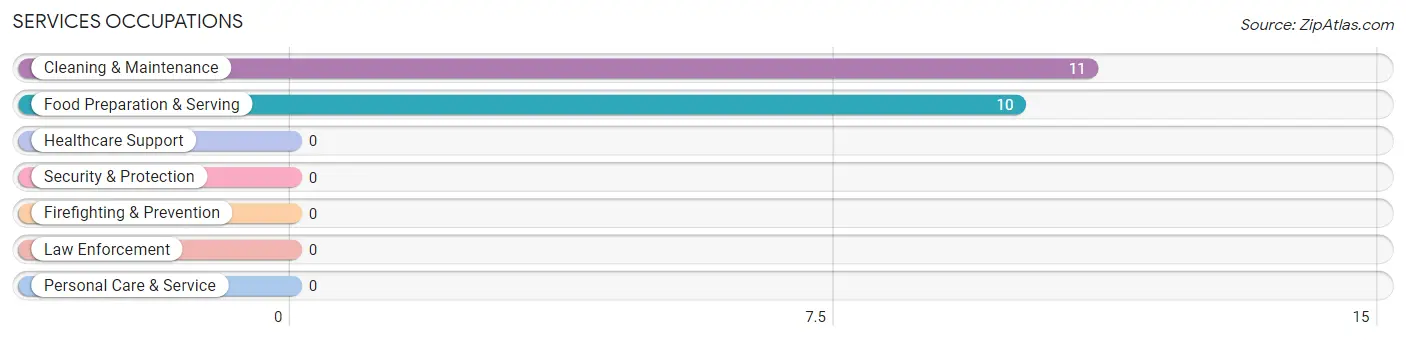
Services Occupations by Sex
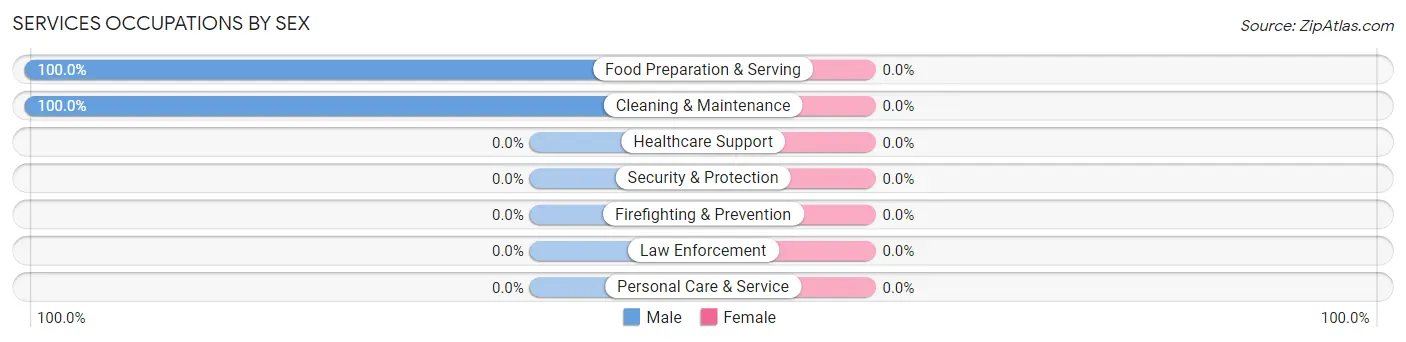
| Occupation | Male | Female |
| Healthcare Support | 0 (0.0%) | 0 (0.0%) |
| Security & Protection | 0 (0.0%) | 0 (0.0%) |
| Firefighting & Prevention | 0 (0.0%) | 0 (0.0%) |
| Law Enforcement | 0 (0.0%) | 0 (0.0%) |
| Food Preparation & Serving | 10 (100.0%) | 0 (0.0%) |
| Cleaning & Maintenance | 11 (100.0%) | 0 (0.0%) |
| Personal Care & Service | 0 (0.0%) | 0 (0.0%) |
| Total (Category) | 21 (100.0%) | 0 (0.0%) |
| Total (Overall) | 125 (71.4%) | 50 (28.6%) |
Sales and Office Occupations
The most common Sales and Office occupations in Busti are Office & Administration (40 | 22.9%), and Sales & Related (8 | 4.6%).
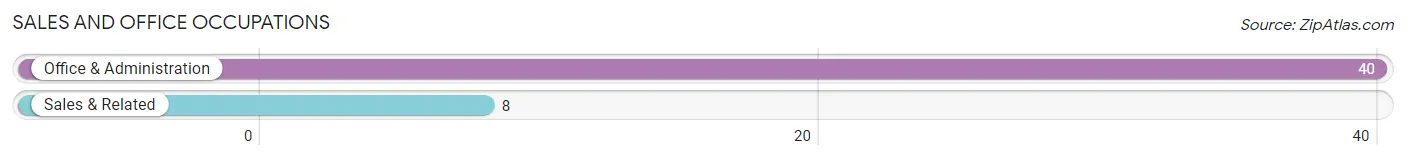
Sales and Office Occupations by Sex

| Occupation | Male | Female |
| Sales & Related | 8 (100.0%) | 0 (0.0%) |
| Office & Administration | 0 (0.0%) | 40 (100.0%) |
| Total (Category) | 8 (16.7%) | 40 (83.3%) |
| Total (Overall) | 125 (71.4%) | 50 (28.6%) |
Natural Resources, Construction and Maintenance Occupations
The most common Natural Resources, Construction and Maintenance occupations in Busti are , and Construction & Extraction (7 | 4.0%).
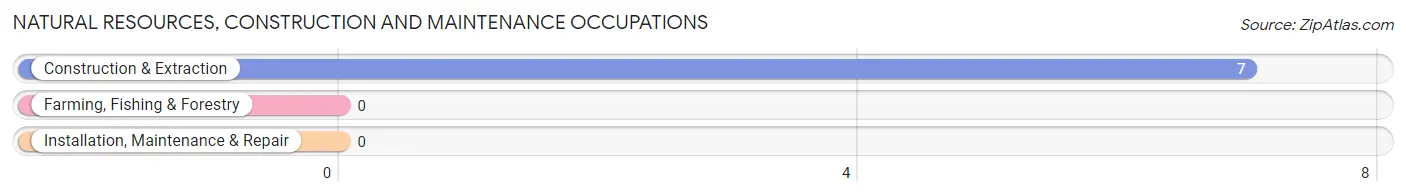
Natural Resources, Construction and Maintenance Occupations by Sex
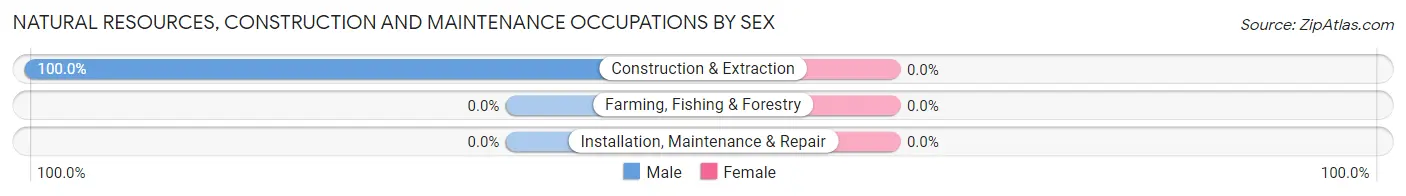
| Occupation | Male | Female |
| Farming, Fishing & Forestry | 0 (0.0%) | 0 (0.0%) |
| Construction & Extraction | 7 (100.0%) | 0 (0.0%) |
| Installation, Maintenance & Repair | 0 (0.0%) | 0 (0.0%) |
| Total (Category) | 7 (100.0%) | 0 (0.0%) |
| Total (Overall) | 125 (71.4%) | 50 (28.6%) |
Production, Transportation and Moving Occupations
The most common Production, Transportation and Moving occupations in Busti are Production (67 | 38.3%), and Transportation (9 | 5.1%).
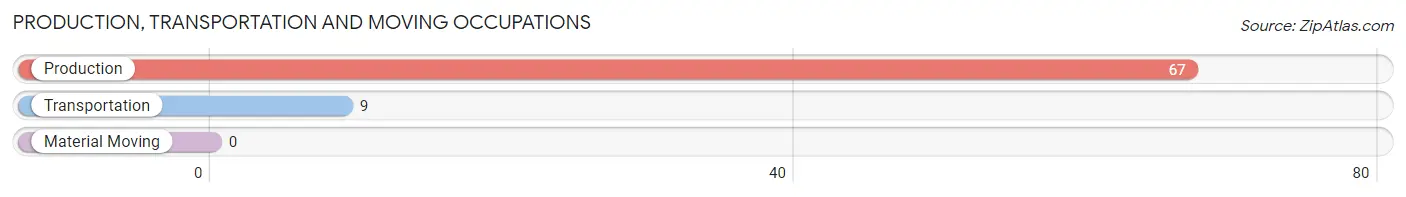
Production, Transportation and Moving Occupations by Sex
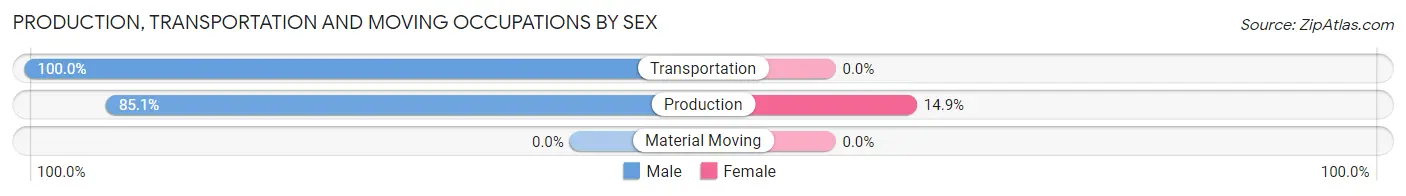
| Occupation | Male | Female |
| Production | 57 (85.1%) | 10 (14.9%) |
| Transportation | 9 (100.0%) | 0 (0.0%) |
| Material Moving | 0 (0.0%) | 0 (0.0%) |
| Total (Category) | 66 (86.8%) | 10 (13.2%) |
| Total (Overall) | 125 (71.4%) | 50 (28.6%) |
Employment Industries by Sex in Busti
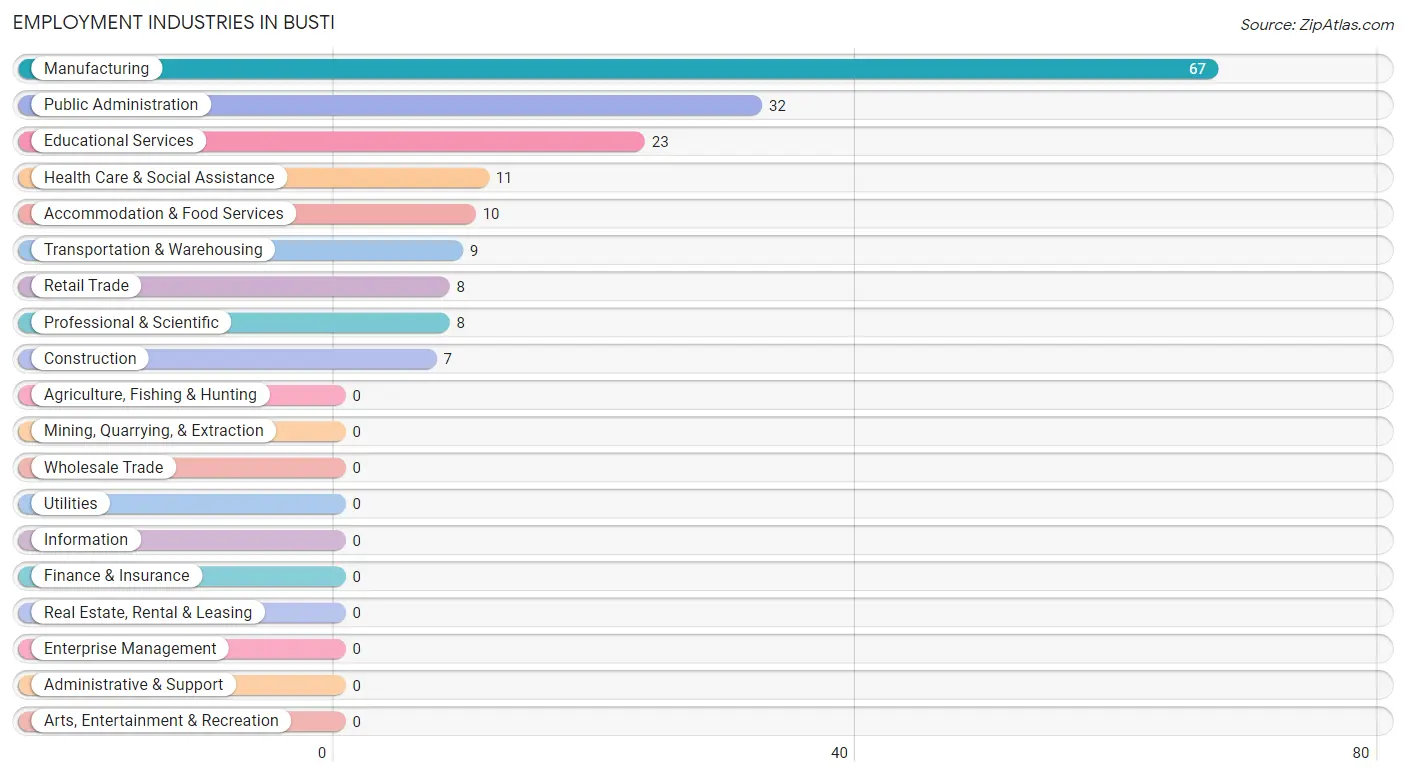
Employment Industries in Busti
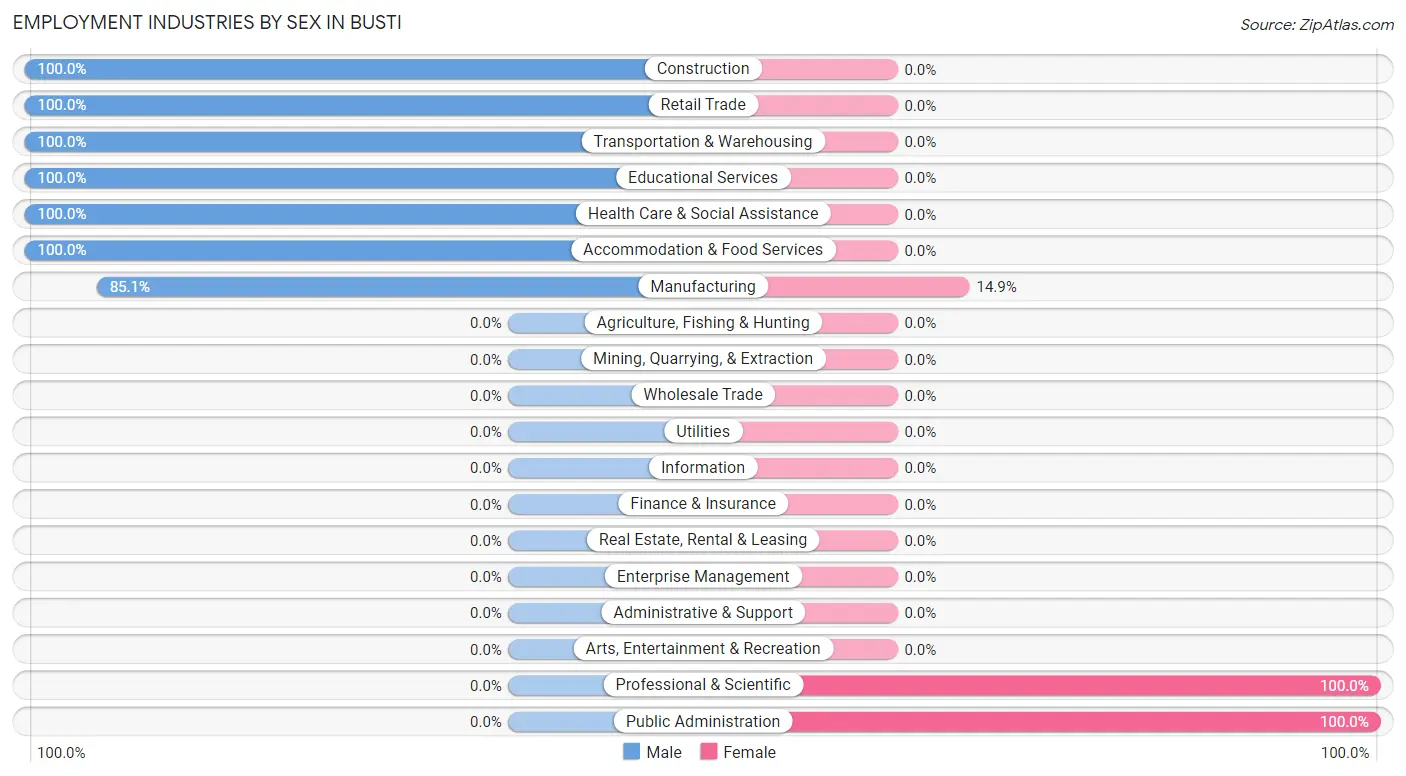
The major employment industries in Busti include Manufacturing (67 | 38.3%), Public Administration (32 | 18.3%), Educational Services (23 | 13.1%), Health Care & Social Assistance (11 | 6.3%), and Accommodation & Food Services (10 | 5.7%).
Employment Industries by Sex in Busti
The Busti industries that see more men than women are Construction (100.0%), Retail Trade (100.0%), and Transportation & Warehousing (100.0%), whereas the industries that tend to have a higher number of women are Professional & Scientific (100.0%), Public Administration (100.0%), and Manufacturing (14.9%).
| Industry | Male | Female |
| Agriculture, Fishing & Hunting | 0 (0.0%) | 0 (0.0%) |
| Mining, Quarrying, & Extraction | 0 (0.0%) | 0 (0.0%) |
| Construction | 7 (100.0%) | 0 (0.0%) |
| Manufacturing | 57 (85.1%) | 10 (14.9%) |
| Wholesale Trade | 0 (0.0%) | 0 (0.0%) |
| Retail Trade | 8 (100.0%) | 0 (0.0%) |
| Transportation & Warehousing | 9 (100.0%) | 0 (0.0%) |
| Utilities | 0 (0.0%) | 0 (0.0%) |
| Information | 0 (0.0%) | 0 (0.0%) |
| Finance & Insurance | 0 (0.0%) | 0 (0.0%) |
| Real Estate, Rental & Leasing | 0 (0.0%) | 0 (0.0%) |
| Professional & Scientific | 0 (0.0%) | 8 (100.0%) |
| Enterprise Management | 0 (0.0%) | 0 (0.0%) |
| Administrative & Support | 0 (0.0%) | 0 (0.0%) |
| Educational Services | 23 (100.0%) | 0 (0.0%) |
| Health Care & Social Assistance | 11 (100.0%) | 0 (0.0%) |
| Arts, Entertainment & Recreation | 0 (0.0%) | 0 (0.0%) |
| Accommodation & Food Services | 10 (100.0%) | 0 (0.0%) |
| Public Administration | 0 (0.0%) | 32 (100.0%) |
| Total | 125 (71.4%) | 50 (28.6%) |
Education in Busti
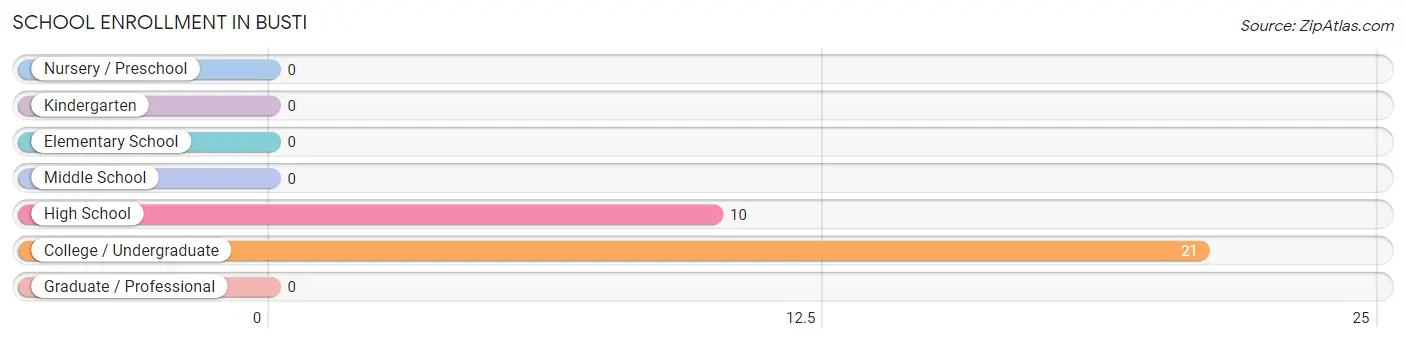
School Enrollment in Busti
The most common levels of schooling among the 31 students in Busti are college / undergraduate (21 | 67.7%), and high school (10 | 32.3%).
| School Level | # Students | % Students |
| Nursery / Preschool | 0 | 0.0% |
| Kindergarten | 0 | 0.0% |
| Elementary School | 0 | 0.0% |
| Middle School | 0 | 0.0% |
| High School | 10 | 32.3% |
| College / Undergraduate | 21 | 67.7% |
| Graduate / Professional | 0 | 0.0% |
| Total | 31 | 100.0% |
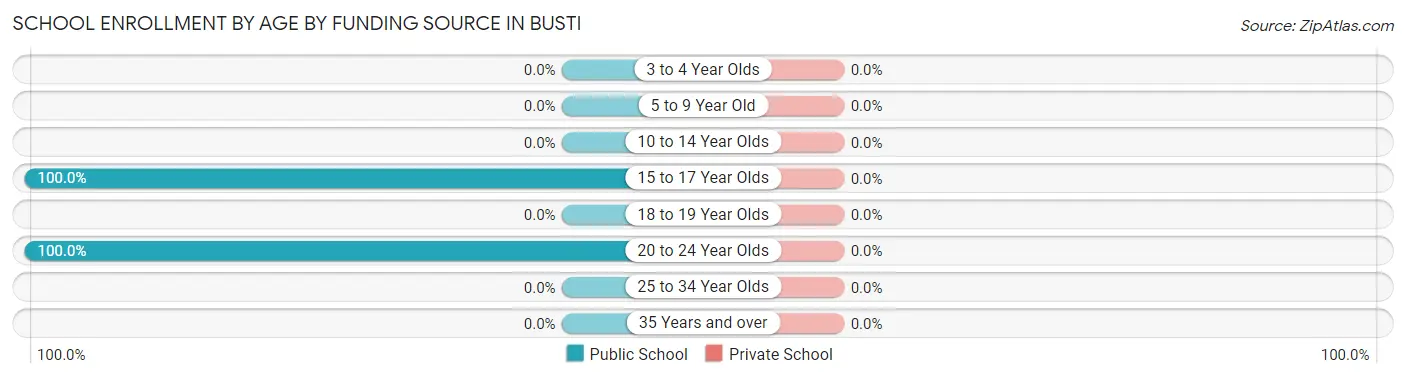
School Enrollment by Age by Funding Source in Busti
| Age Bracket | Public School | Private School |
| 3 to 4 Year Olds | 0 (0.0%) | 0 (0.0%) |
| 5 to 9 Year Old | 0 (0.0%) | 0 (0.0%) |
| 10 to 14 Year Olds | 0 (0.0%) | 0 (0.0%) |
| 15 to 17 Year Olds | 10 (100.0%) | 0 (0.0%) |
| 18 to 19 Year Olds | 0 (0.0%) | 0 (0.0%) |
| 20 to 24 Year Olds | 21 (100.0%) | 0 (0.0%) |
| 25 to 34 Year Olds | 0 (0.0%) | 0 (0.0%) |
| 35 Years and over | 0 (0.0%) | 0 (0.0%) |
| Total | 31 (100.0%) | 0 (0.0%) |
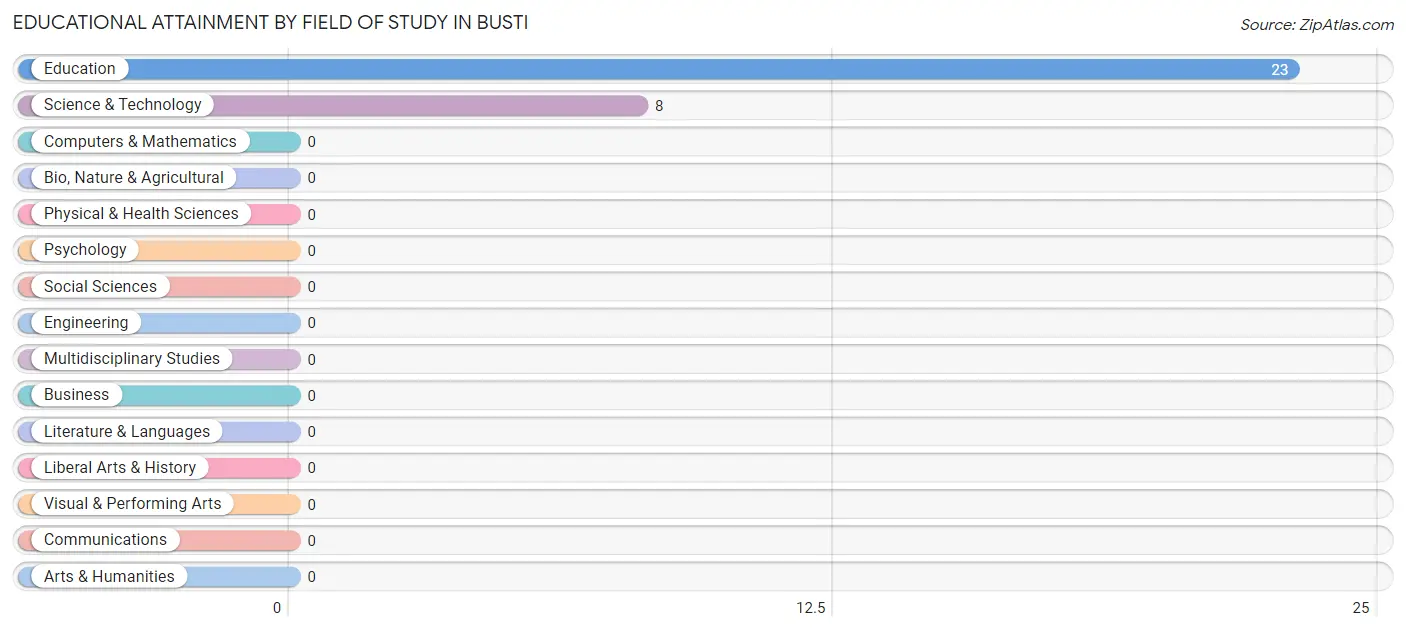
Educational Attainment by Field of Study in Busti
Education (23 | 74.2%), and science & technology (8 | 25.8%) are the most common fields of study among 31 individuals in Busti who have obtained a bachelor's degree or higher.
| Field of Study | # Graduates | % Graduates |
| Computers & Mathematics | 0 | 0.0% |
| Bio, Nature & Agricultural | 0 | 0.0% |
| Physical & Health Sciences | 0 | 0.0% |
| Psychology | 0 | 0.0% |
| Social Sciences | 0 | 0.0% |
| Engineering | 0 | 0.0% |
| Multidisciplinary Studies | 0 | 0.0% |
| Science & Technology | 8 | 25.8% |
| Business | 0 | 0.0% |
| Education | 23 | 74.2% |
| Literature & Languages | 0 | 0.0% |
| Liberal Arts & History | 0 | 0.0% |
| Visual & Performing Arts | 0 | 0.0% |
| Communications | 0 | 0.0% |
| Arts & Humanities | 0 | 0.0% |
| Total | 31 | 100.0% |
Transportation & Commute in Busti
Vehicle Availability by Sex in Busti
The most prevalent vehicle ownership categories in Busti are males with 2 vehicles (45, accounting for 36.0%) and females with 2 vehicles (32, making up 90.0%).
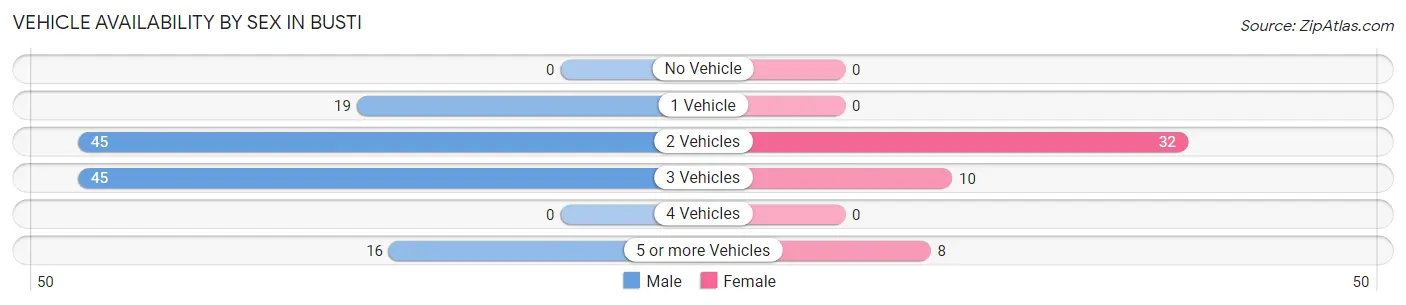
| Vehicles Available | Male | Female |
| No Vehicle | 0 (0.0%) | 0 (0.0%) |
| 1 Vehicle | 19 (15.2%) | 0 (0.0%) |
| 2 Vehicles | 45 (36.0%) | 32 (64.0%) |
| 3 Vehicles | 45 (36.0%) | 10 (20.0%) |
| 4 Vehicles | 0 (0.0%) | 0 (0.0%) |
| 5 or more Vehicles | 16 (12.8%) | 8 (16.0%) |
| Total | 125 (100.0%) | 50 (100.0%) |
Commute Time in Busti
The most frequently occuring commute durations in Busti are 15 to 19 minutes (44 commuters, 25.1%), 10 to 14 minutes (41 commuters, 23.4%), and 20 to 24 minutes (39 commuters, 22.3%).
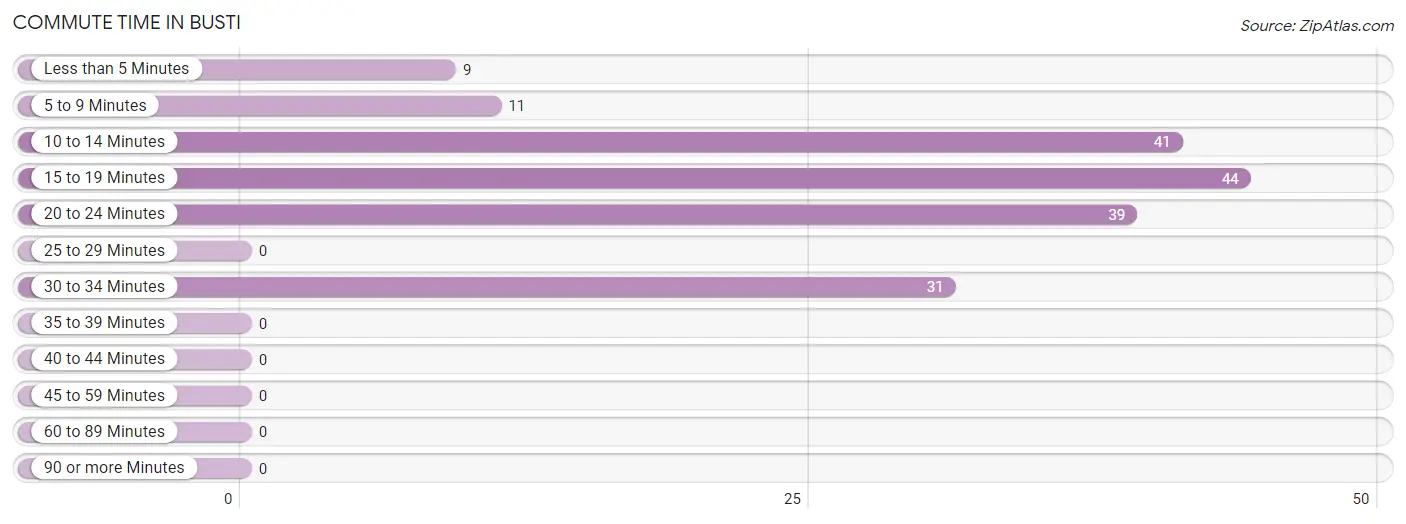
| Commute Time | # Commuters | % Commuters |
| Less than 5 Minutes | 9 | 5.1% |
| 5 to 9 Minutes | 11 | 6.3% |
| 10 to 14 Minutes | 41 | 23.4% |
| 15 to 19 Minutes | 44 | 25.1% |
| 20 to 24 Minutes | 39 | 22.3% |
| 25 to 29 Minutes | 0 | 0.0% |
| 30 to 34 Minutes | 31 | 17.7% |
| 35 to 39 Minutes | 0 | 0.0% |
| 40 to 44 Minutes | 0 | 0.0% |
| 45 to 59 Minutes | 0 | 0.0% |
| 60 to 89 Minutes | 0 | 0.0% |
| 90 or more Minutes | 0 | 0.0% |
Commute Time by Sex in Busti
The most common commute times in Busti are 15 to 19 minutes (36 commuters, 28.8%) for males and 20 to 24 minutes (32 commuters, 64.0%) for females.
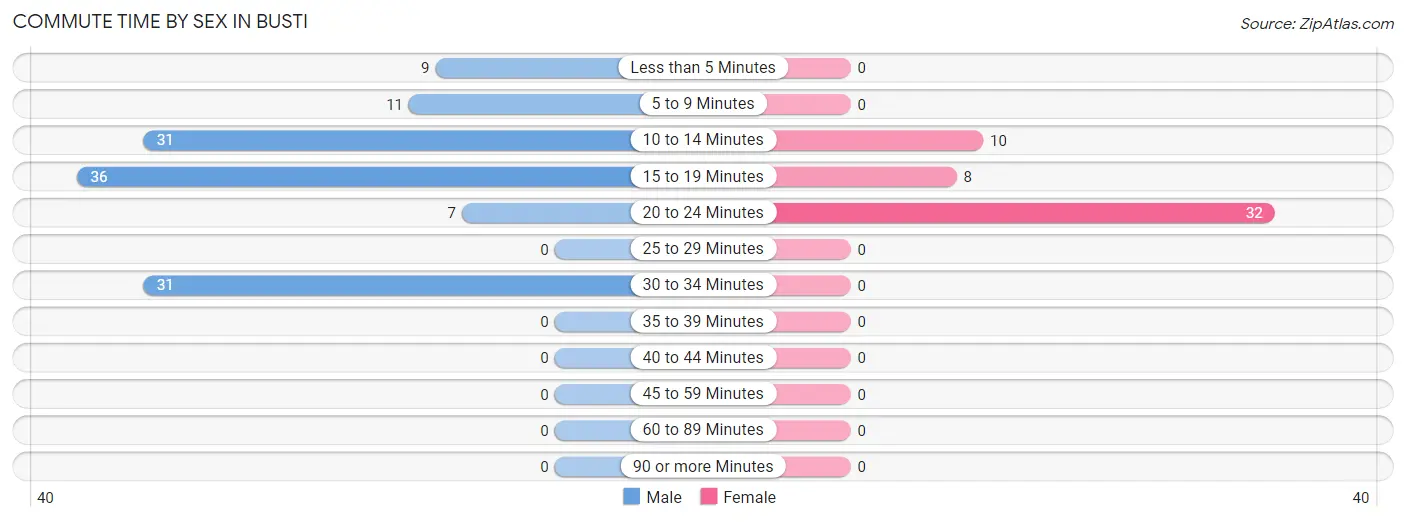
| Commute Time | Male | Female |
| Less than 5 Minutes | 9 (7.2%) | 0 (0.0%) |
| 5 to 9 Minutes | 11 (8.8%) | 0 (0.0%) |
| 10 to 14 Minutes | 31 (24.8%) | 10 (20.0%) |
| 15 to 19 Minutes | 36 (28.8%) | 8 (16.0%) |
| 20 to 24 Minutes | 7 (5.6%) | 32 (64.0%) |
| 25 to 29 Minutes | 0 (0.0%) | 0 (0.0%) |
| 30 to 34 Minutes | 31 (24.8%) | 0 (0.0%) |
| 35 to 39 Minutes | 0 (0.0%) | 0 (0.0%) |
| 40 to 44 Minutes | 0 (0.0%) | 0 (0.0%) |
| 45 to 59 Minutes | 0 (0.0%) | 0 (0.0%) |
| 60 to 89 Minutes | 0 (0.0%) | 0 (0.0%) |
| 90 or more Minutes | 0 (0.0%) | 0 (0.0%) |
Time of Departure to Work by Sex in Busti
The most frequent times of departure to work in Busti are 7:30 AM to 7:59 AM (36, 28.8%) for males and 7:30 AM to 7:59 AM (32, 64.0%) for females.
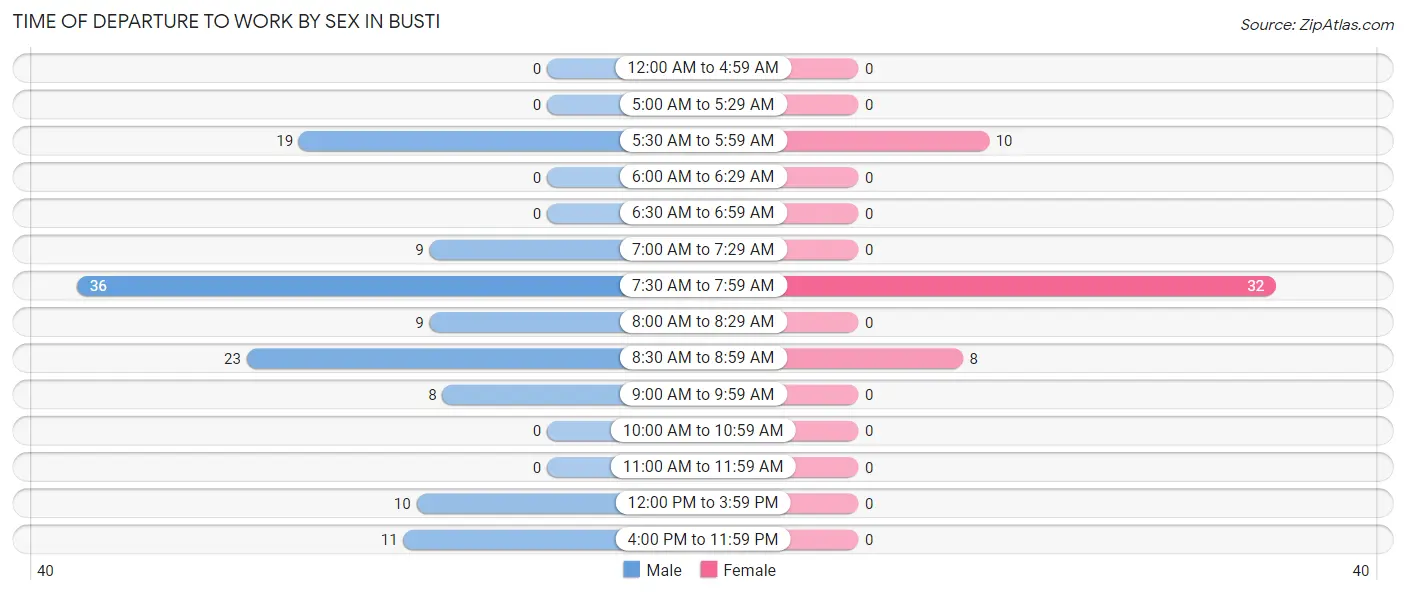
| Time of Departure | Male | Female |
| 12:00 AM to 4:59 AM | 0 (0.0%) | 0 (0.0%) |
| 5:00 AM to 5:29 AM | 0 (0.0%) | 0 (0.0%) |
| 5:30 AM to 5:59 AM | 19 (15.2%) | 10 (20.0%) |
| 6:00 AM to 6:29 AM | 0 (0.0%) | 0 (0.0%) |
| 6:30 AM to 6:59 AM | 0 (0.0%) | 0 (0.0%) |
| 7:00 AM to 7:29 AM | 9 (7.2%) | 0 (0.0%) |
| 7:30 AM to 7:59 AM | 36 (28.8%) | 32 (64.0%) |
| 8:00 AM to 8:29 AM | 9 (7.2%) | 0 (0.0%) |
| 8:30 AM to 8:59 AM | 23 (18.4%) | 8 (16.0%) |
| 9:00 AM to 9:59 AM | 8 (6.4%) | 0 (0.0%) |
| 10:00 AM to 10:59 AM | 0 (0.0%) | 0 (0.0%) |
| 11:00 AM to 11:59 AM | 0 (0.0%) | 0 (0.0%) |
| 12:00 PM to 3:59 PM | 10 (8.0%) | 0 (0.0%) |
| 4:00 PM to 11:59 PM | 11 (8.8%) | 0 (0.0%) |
| Total | 125 (100.0%) | 50 (100.0%) |
Housing Occupancy in Busti
Occupancy by Ownership in Busti
Of the total 120 dwellings in Busti, owner-occupied units account for 56 (46.7%), while renter-occupied units make up 64 (53.3%).
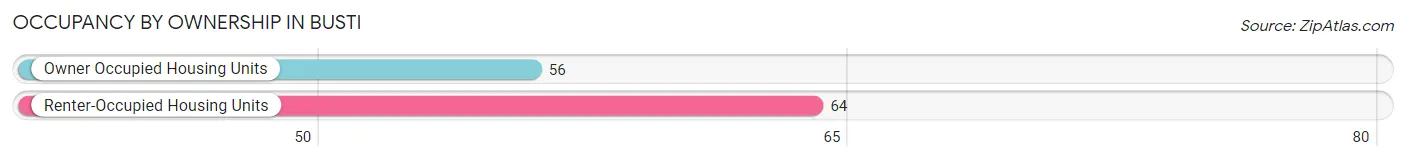
| Occupancy | # Housing Units | % Housing Units |
| Owner Occupied Housing Units | 56 | 46.7% |
| Renter-Occupied Housing Units | 64 | 53.3% |
| Total Occupied Housing Units | 120 | 100.0% |
Occupancy by Household Size in Busti
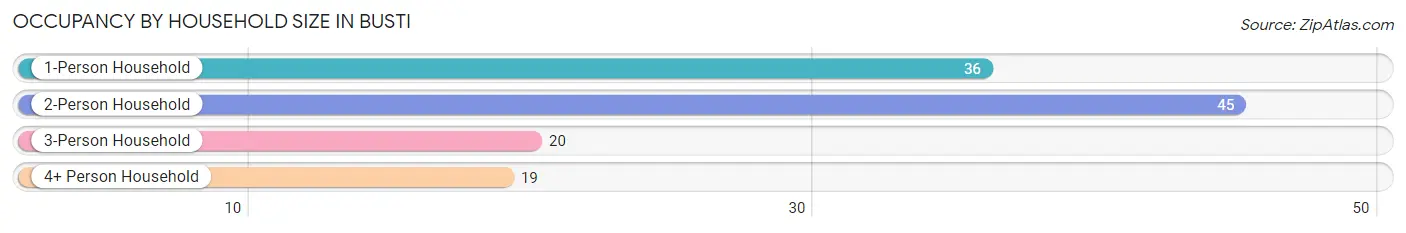
| Household Size | # Housing Units | % Housing Units |
| 1-Person Household | 36 | 30.0% |
| 2-Person Household | 45 | 37.5% |
| 3-Person Household | 20 | 16.7% |
| 4+ Person Household | 19 | 15.8% |
| Total Housing Units | 120 | 100.0% |
Occupancy by Ownership by Household Size in Busti
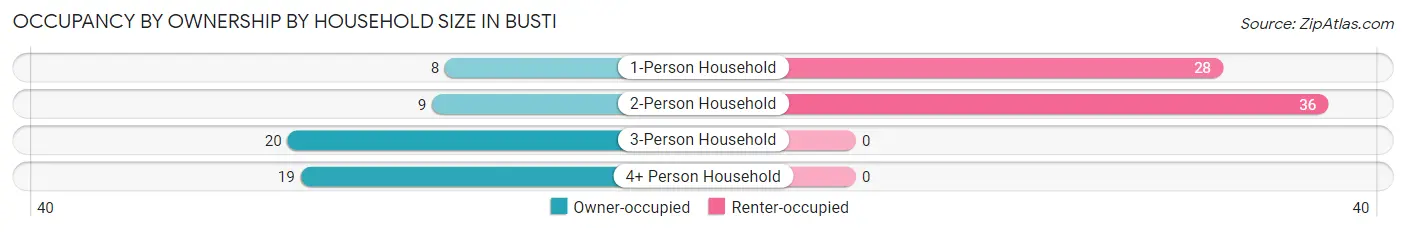
| Household Size | Owner-occupied | Renter-occupied |
| 1-Person Household | 8 (22.2%) | 28 (77.8%) |
| 2-Person Household | 9 (20.0%) | 36 (80.0%) |
| 3-Person Household | 20 (100.0%) | 0 (0.0%) |
| 4+ Person Household | 19 (100.0%) | 0 (0.0%) |
| Total Housing Units | 56 (46.7%) | 64 (53.3%) |
Occupancy by Educational Attainment in Busti
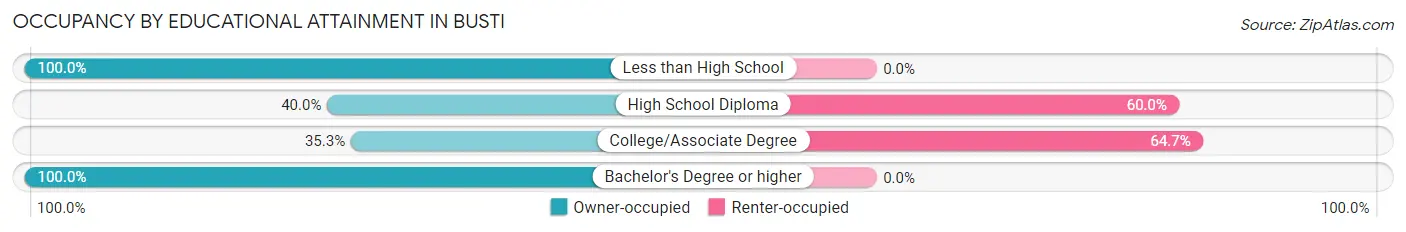
| Household Size | Owner-occupied | Renter-occupied |
| Less than High School | 8 (100.0%) | 0 (0.0%) |
| High School Diploma | 28 (40.0%) | 42 (60.0%) |
| College/Associate Degree | 12 (35.3%) | 22 (64.7%) |
| Bachelor's Degree or higher | 8 (100.0%) | 0 (0.0%) |
Occupancy by Age of Householder in Busti
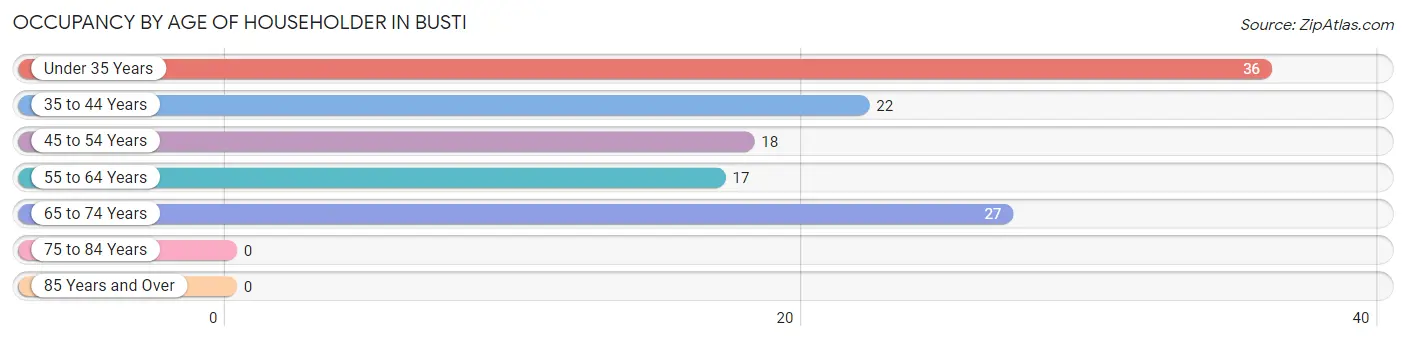
| Age Bracket | # Households | % Households |
| Under 35 Years | 36 | 30.0% |
| 35 to 44 Years | 22 | 18.3% |
| 45 to 54 Years | 18 | 15.0% |
| 55 to 64 Years | 17 | 14.2% |
| 65 to 74 Years | 27 | 22.5% |
| 75 to 84 Years | 0 | 0.0% |
| 85 Years and Over | 0 | 0.0% |
| Total | 120 | 100.0% |
Housing Finances in Busti
Median Income by Occupancy in Busti
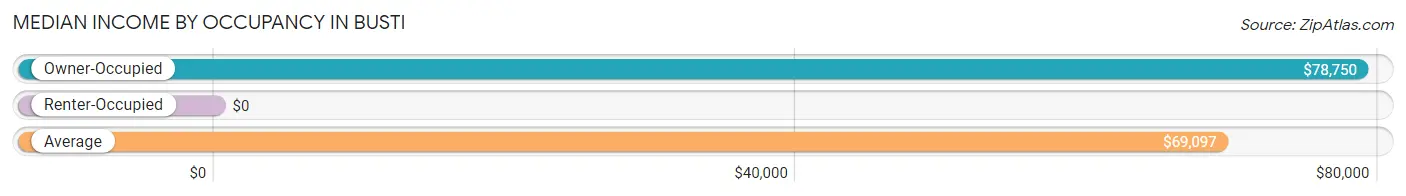
| Occupancy Type | # Households | Median Income |
| Owner-Occupied | 56 (46.7%) | $78,750 |
| Renter-Occupied | 64 (53.3%) | $0 |
| Average | 120 (100.0%) | $69,097 |
Occupancy by Householder Income Bracket in Busti
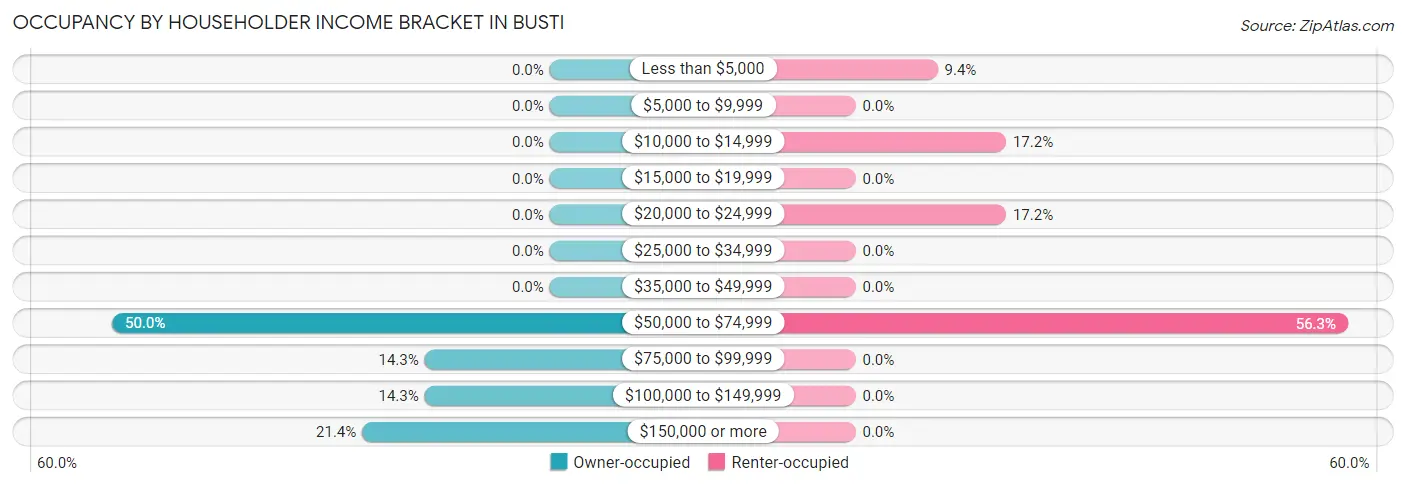
| Income Bracket | Owner-occupied | Renter-occupied |
| Less than $5,000 | 0 (0.0%) | 6 (9.4%) |
| $5,000 to $9,999 | 0 (0.0%) | 0 (0.0%) |
| $10,000 to $14,999 | 0 (0.0%) | 11 (17.2%) |
| $15,000 to $19,999 | 0 (0.0%) | 0 (0.0%) |
| $20,000 to $24,999 | 0 (0.0%) | 11 (17.2%) |
| $25,000 to $34,999 | 0 (0.0%) | 0 (0.0%) |
| $35,000 to $49,999 | 0 (0.0%) | 0 (0.0%) |
| $50,000 to $74,999 | 28 (50.0%) | 36 (56.2%) |
| $75,000 to $99,999 | 8 (14.3%) | 0 (0.0%) |
| $100,000 to $149,999 | 8 (14.3%) | 0 (0.0%) |
| $150,000 or more | 12 (21.4%) | 0 (0.0%) |
| Total | 56 (100.0%) | 64 (100.0%) |
Monthly Housing Cost Tiers in Busti
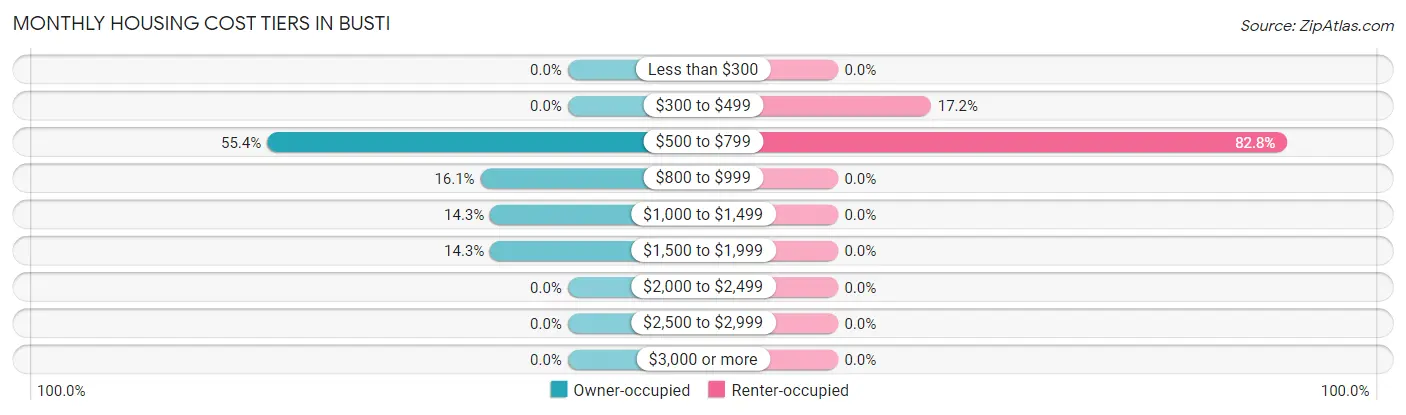
| Monthly Cost | Owner-occupied | Renter-occupied |
| Less than $300 | 0 (0.0%) | 0 (0.0%) |
| $300 to $499 | 0 (0.0%) | 11 (17.2%) |
| $500 to $799 | 31 (55.4%) | 53 (82.8%) |
| $800 to $999 | 9 (16.1%) | 0 (0.0%) |
| $1,000 to $1,499 | 8 (14.3%) | 0 (0.0%) |
| $1,500 to $1,999 | 8 (14.3%) | 0 (0.0%) |
| $2,000 to $2,499 | 0 (0.0%) | 0 (0.0%) |
| $2,500 to $2,999 | 0 (0.0%) | 0 (0.0%) |
| $3,000 or more | 0 (0.0%) | 0 (0.0%) |
| Total | 56 (100.0%) | 64 (100.0%) |
Physical Housing Characteristics in Busti
Housing Structures in Busti
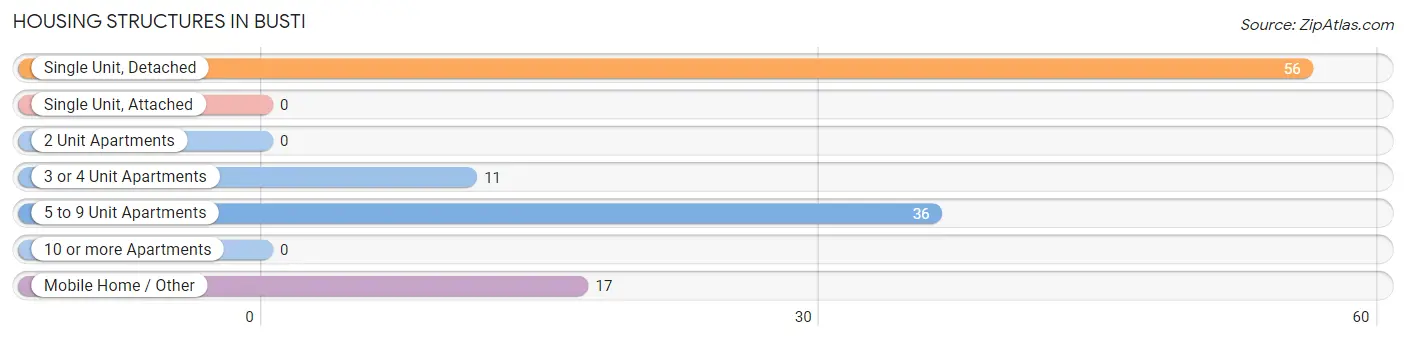
| Structure Type | # Housing Units | % Housing Units |
| Single Unit, Detached | 56 | 46.7% |
| Single Unit, Attached | 0 | 0.0% |
| 2 Unit Apartments | 0 | 0.0% |
| 3 or 4 Unit Apartments | 11 | 9.2% |
| 5 to 9 Unit Apartments | 36 | 30.0% |
| 10 or more Apartments | 0 | 0.0% |
| Mobile Home / Other | 17 | 14.2% |
| Total | 120 | 100.0% |
Housing Structures by Occupancy in Busti
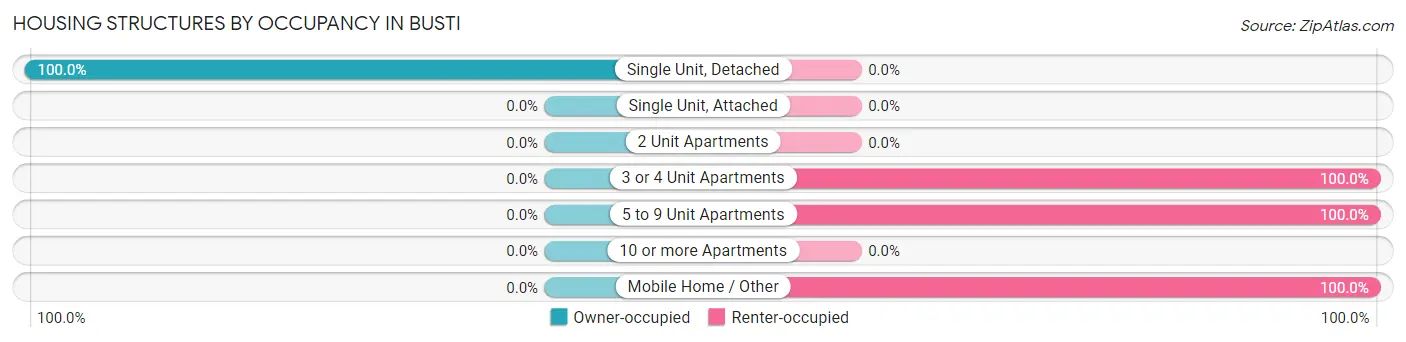
| Structure Type | Owner-occupied | Renter-occupied |
| Single Unit, Detached | 56 (100.0%) | 0 (0.0%) |
| Single Unit, Attached | 0 (0.0%) | 0 (0.0%) |
| 2 Unit Apartments | 0 (0.0%) | 0 (0.0%) |
| 3 or 4 Unit Apartments | 0 (0.0%) | 11 (100.0%) |
| 5 to 9 Unit Apartments | 0 (0.0%) | 36 (100.0%) |
| 10 or more Apartments | 0 (0.0%) | 0 (0.0%) |
| Mobile Home / Other | 0 (0.0%) | 17 (100.0%) |
| Total | 56 (46.7%) | 64 (53.3%) |
Housing Structures by Number of Rooms in Busti
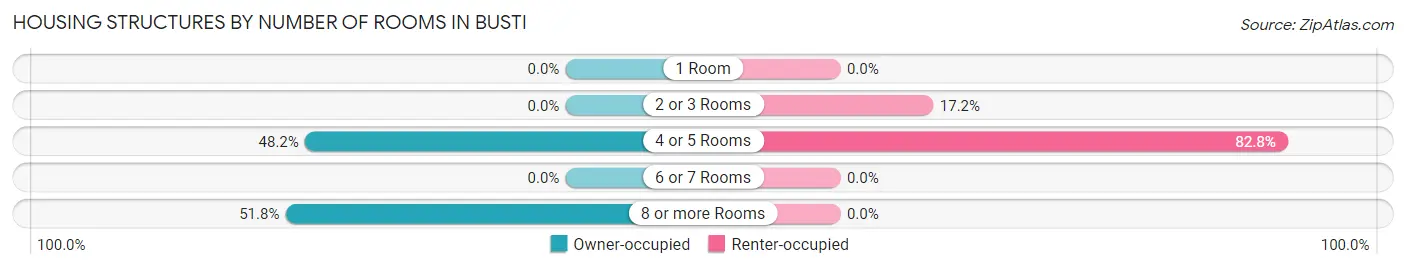
| Number of Rooms | Owner-occupied | Renter-occupied |
| 1 Room | 0 (0.0%) | 0 (0.0%) |
| 2 or 3 Rooms | 0 (0.0%) | 11 (17.2%) |
| 4 or 5 Rooms | 27 (48.2%) | 53 (82.8%) |
| 6 or 7 Rooms | 0 (0.0%) | 0 (0.0%) |
| 8 or more Rooms | 29 (51.8%) | 0 (0.0%) |
| Total | 56 (100.0%) | 64 (100.0%) |
Housing Structure by Heating Type in Busti
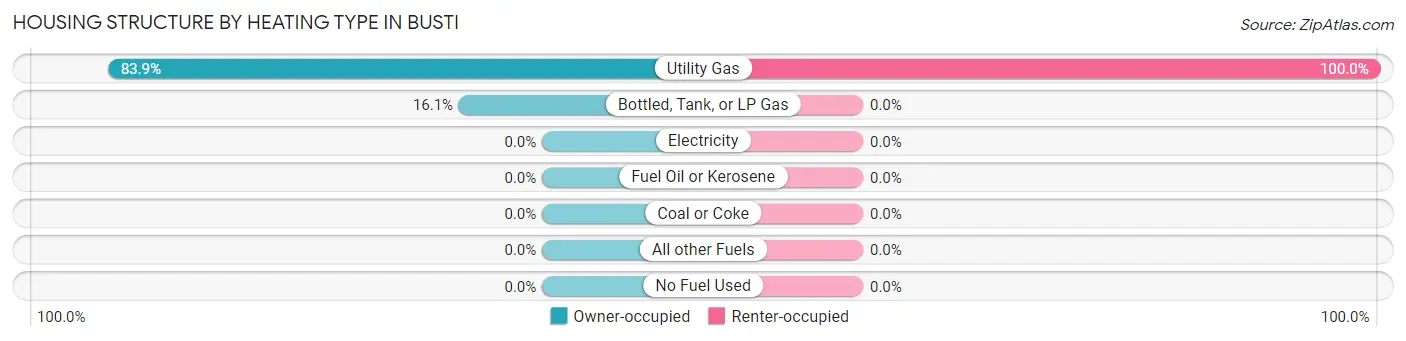
| Heating Type | Owner-occupied | Renter-occupied |
| Utility Gas | 47 (83.9%) | 64 (100.0%) |
| Bottled, Tank, or LP Gas | 9 (16.1%) | 0 (0.0%) |
| Electricity | 0 (0.0%) | 0 (0.0%) |
| Fuel Oil or Kerosene | 0 (0.0%) | 0 (0.0%) |
| Coal or Coke | 0 (0.0%) | 0 (0.0%) |
| All other Fuels | 0 (0.0%) | 0 (0.0%) |
| No Fuel Used | 0 (0.0%) | 0 (0.0%) |
| Total | 56 (100.0%) | 64 (100.0%) |
Household Vehicle Usage in Busti
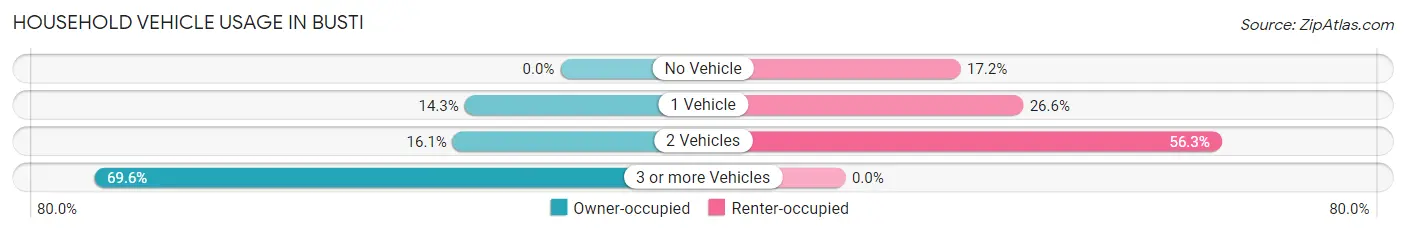
| Vehicles per Household | Owner-occupied | Renter-occupied |
| No Vehicle | 0 (0.0%) | 11 (17.2%) |
| 1 Vehicle | 8 (14.3%) | 17 (26.6%) |
| 2 Vehicles | 9 (16.1%) | 36 (56.2%) |
| 3 or more Vehicles | 39 (69.6%) | 0 (0.0%) |
| Total | 56 (100.0%) | 64 (100.0%) |
Real Estate & Mortgages in Busti
Real Estate and Mortgage Overview in Busti
| Characteristic | Without Mortgage | With Mortgage |
| Housing Units | 9 | 47 |
| Median Property Value | - | - |
| Median Household Income | - | - |
| Monthly Housing Costs | - | - |
| Real Estate Taxes | - | - |
Property Value by Mortgage Status in Busti
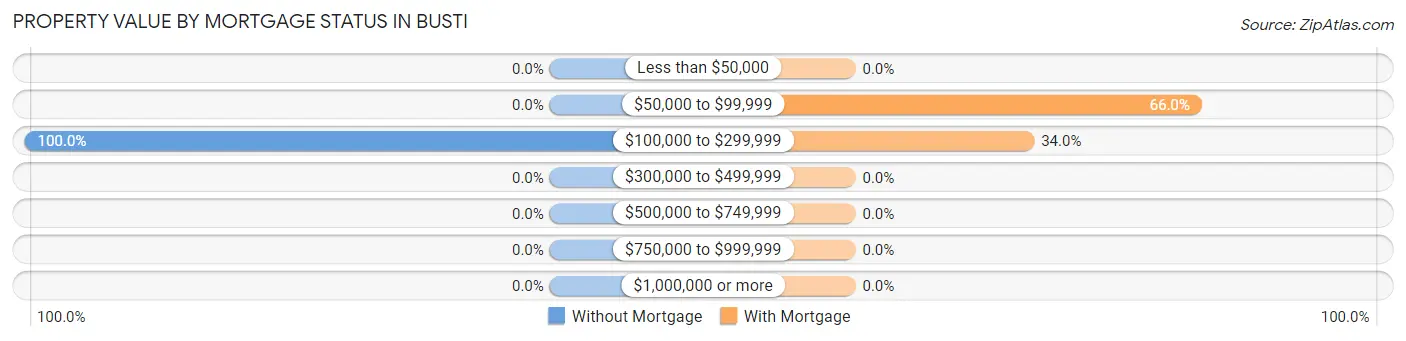
| Property Value | Without Mortgage | With Mortgage |
| Less than $50,000 | 0 (0.0%) | 0 (0.0%) |
| $50,000 to $99,999 | 0 (0.0%) | 31 (66.0%) |
| $100,000 to $299,999 | 9 (100.0%) | 16 (34.0%) |
| $300,000 to $499,999 | 0 (0.0%) | 0 (0.0%) |
| $500,000 to $749,999 | 0 (0.0%) | 0 (0.0%) |
| $750,000 to $999,999 | 0 (0.0%) | 0 (0.0%) |
| $1,000,000 or more | 0 (0.0%) | 0 (0.0%) |
| Total | 9 (100.0%) | 47 (100.0%) |
Household Income by Mortgage Status in Busti
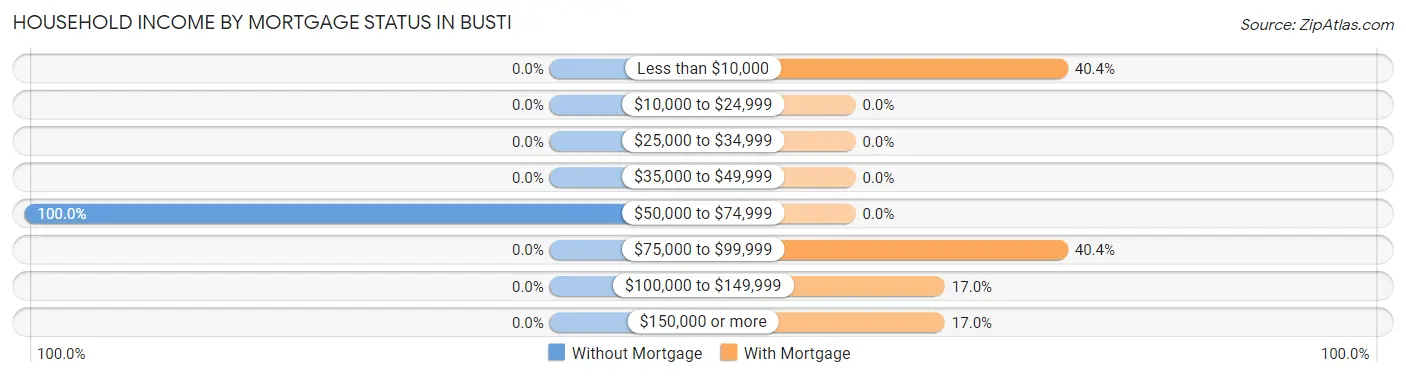
| Household Income | Without Mortgage | With Mortgage |
| Less than $10,000 | 0 (0.0%) | 19 (40.4%) |
| $10,000 to $24,999 | 0 (0.0%) | 0 (0.0%) |
| $25,000 to $34,999 | 0 (0.0%) | 0 (0.0%) |
| $35,000 to $49,999 | 0 (0.0%) | 0 (0.0%) |
| $50,000 to $74,999 | 9 (100.0%) | 0 (0.0%) |
| $75,000 to $99,999 | 0 (0.0%) | 19 (40.4%) |
| $100,000 to $149,999 | 0 (0.0%) | 8 (17.0%) |
| $150,000 or more | 0 (0.0%) | 8 (17.0%) |
| Total | 9 (100.0%) | 47 (100.0%) |
Property Value to Household Income Ratio in Busti
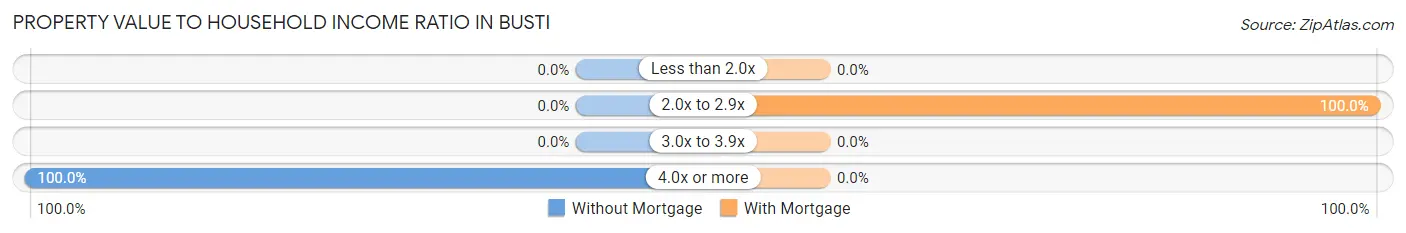
| Value-to-Income Ratio | Without Mortgage | With Mortgage |
| Less than 2.0x | 0 (0.0%) | 0 (0.0%) |
| 2.0x to 2.9x | 0 (0.0%) | 47 (100.0%) |
| 3.0x to 3.9x | 0 (0.0%) | 0 (0.0%) |
| 4.0x or more | 9 (100.0%) | 0 (0.0%) |
| Total | 9 (100.0%) | 47 (100.0%) |
Real Estate Taxes by Mortgage Status in Busti
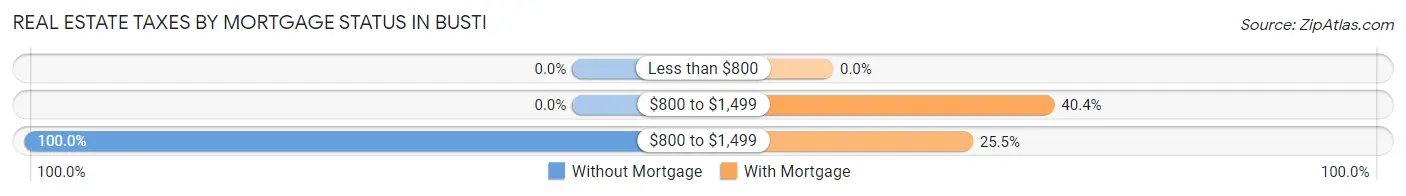
| Property Taxes | Without Mortgage | With Mortgage |
| Less than $800 | 0 (0.0%) | 0 (0.0%) |
| $800 to $1,499 | 0 (0.0%) | 19 (40.4%) |
| $800 to $1,499 | 9 (100.0%) | 12 (25.5%) |
| Total | 9 (100.0%) | 47 (100.0%) |
Health & Disability in Busti
Health Insurance Coverage by Age in Busti
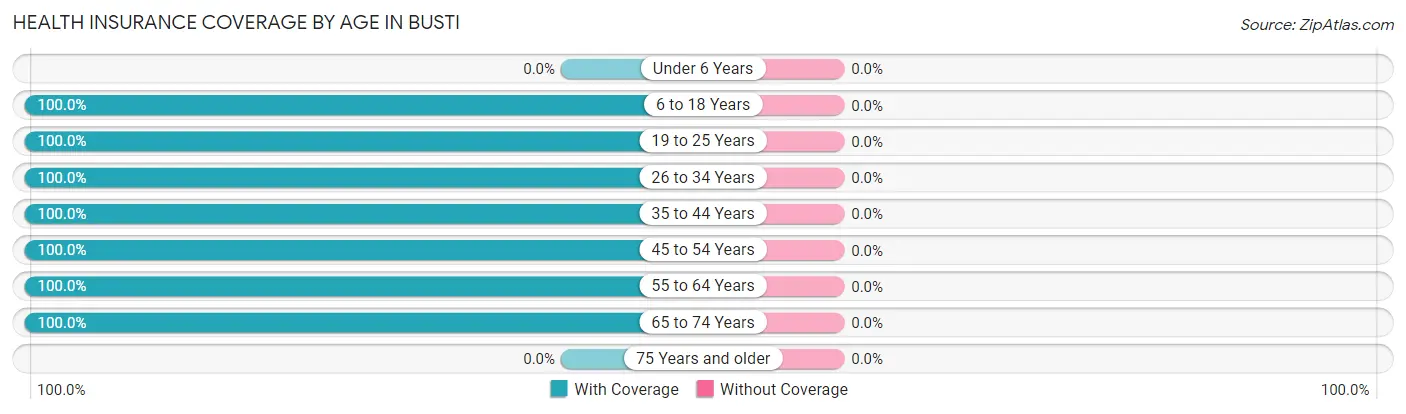
| Age Bracket | With Coverage | Without Coverage |
| Under 6 Years | 0 (0.0%) | 0 (0.0%) |
| 6 to 18 Years | 10 (100.0%) | 0 (0.0%) |
| 19 to 25 Years | 28 (100.0%) | 0 (0.0%) |
| 26 to 34 Years | 68 (100.0%) | 0 (0.0%) |
| 35 to 44 Years | 45 (100.0%) | 0 (0.0%) |
| 45 to 54 Years | 28 (100.0%) | 0 (0.0%) |
| 55 to 64 Years | 35 (100.0%) | 0 (0.0%) |
| 65 to 74 Years | 46 (100.0%) | 0 (0.0%) |
| 75 Years and older | 0 (0.0%) | 0 (0.0%) |
| Total | 260 (100.0%) | 0 (0.0%) |
Health Insurance Coverage by Citizenship Status in Busti
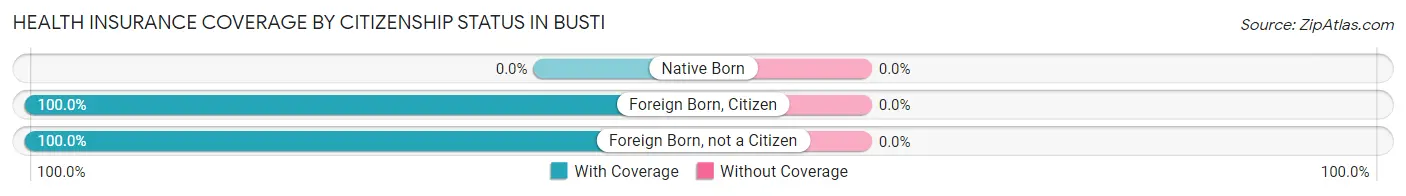
| Citizenship Status | With Coverage | Without Coverage |
| Native Born | 0 (0.0%) | 0 (0.0%) |
| Foreign Born, Citizen | 10 (100.0%) | 0 (0.0%) |
| Foreign Born, not a Citizen | 28 (100.0%) | 0 (0.0%) |
Health Insurance Coverage by Household Income in Busti
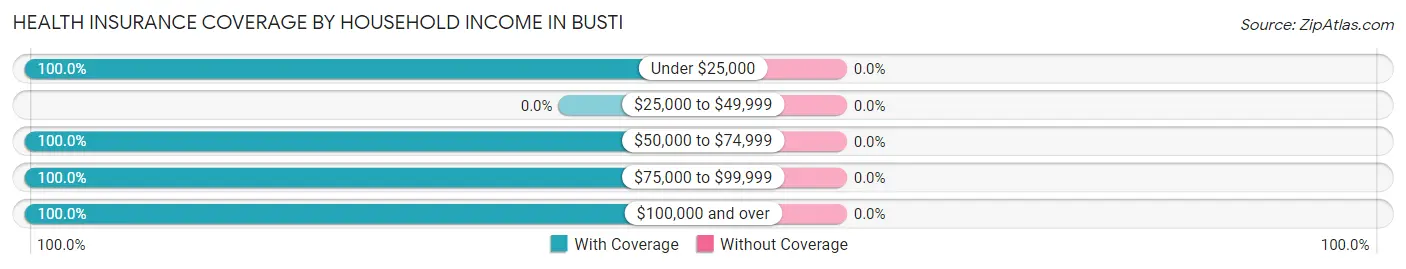
| Household Income | With Coverage | Without Coverage |
| Under $25,000 | 28 (100.0%) | 0 (0.0%) |
| $25,000 to $49,999 | 0 (0.0%) | 0 (0.0%) |
| $50,000 to $74,999 | 168 (100.0%) | 0 (0.0%) |
| $75,000 to $99,999 | 8 (100.0%) | 0 (0.0%) |
| $100,000 and over | 56 (100.0%) | 0 (0.0%) |
Public vs Private Health Insurance Coverage by Age in Busti
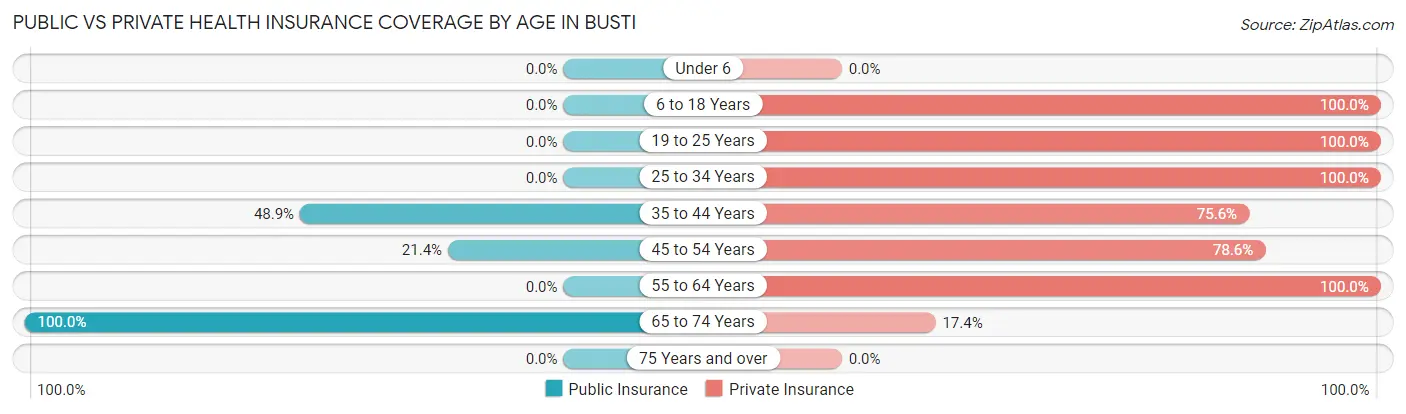
| Age Bracket | Public Insurance | Private Insurance |
| Under 6 | 0 (0.0%) | 0 (0.0%) |
| 6 to 18 Years | 0 (0.0%) | 10 (100.0%) |
| 19 to 25 Years | 0 (0.0%) | 28 (100.0%) |
| 25 to 34 Years | 0 (0.0%) | 68 (100.0%) |
| 35 to 44 Years | 22 (48.9%) | 34 (75.6%) |
| 45 to 54 Years | 6 (21.4%) | 22 (78.6%) |
| 55 to 64 Years | 0 (0.0%) | 35 (100.0%) |
| 65 to 74 Years | 46 (100.0%) | 8 (17.4%) |
| 75 Years and over | 0 (0.0%) | 0 (0.0%) |
| Total | 74 (28.5%) | 205 (78.8%) |
Disability Status by Sex by Age in Busti
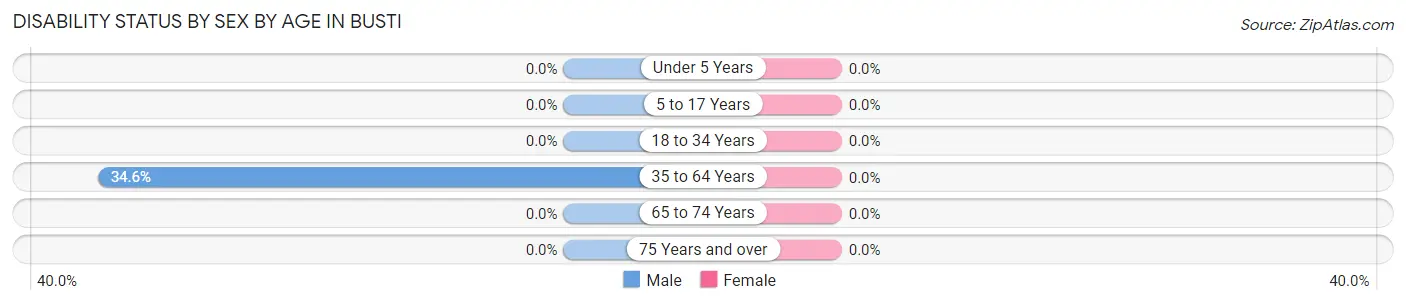
| Age Bracket | Male | Female |
| Under 5 Years | 0 (0.0%) | 0 (0.0%) |
| 5 to 17 Years | 0 (0.0%) | 0 (0.0%) |
| 18 to 34 Years | 0 (0.0%) | 0 (0.0%) |
| 35 to 64 Years | 28 (34.6%) | 0 (0.0%) |
| 65 to 74 Years | 0 (0.0%) | 0 (0.0%) |
| 75 Years and over | 0 (0.0%) | 0 (0.0%) |
Disability Class by Sex by Age in Busti
Disability Class: Hearing Difficulty
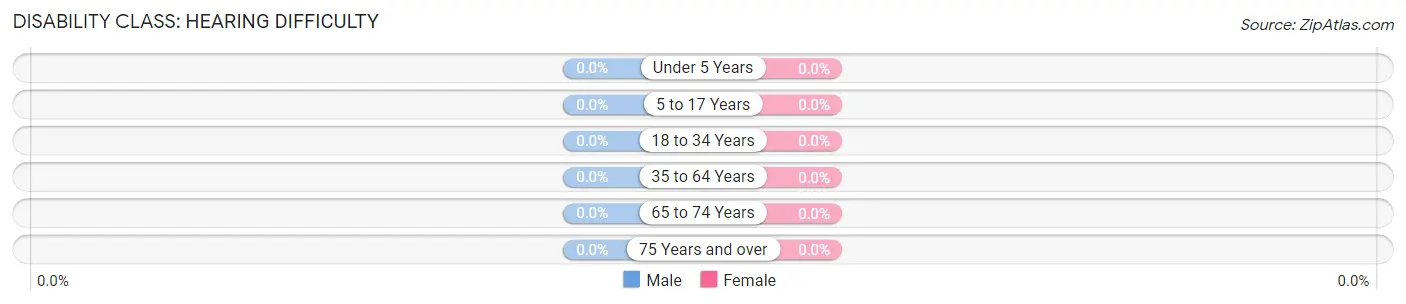
| Age Bracket | Male | Female |
| Under 5 Years | 0 (0.0%) | 0 (0.0%) |
| 5 to 17 Years | 0 (0.0%) | 0 (0.0%) |
| 18 to 34 Years | 0 (0.0%) | 0 (0.0%) |
| 35 to 64 Years | 0 (0.0%) | 0 (0.0%) |
| 65 to 74 Years | 0 (0.0%) | 0 (0.0%) |
| 75 Years and over | 0 (0.0%) | 0 (0.0%) |
Disability Class: Vision Difficulty
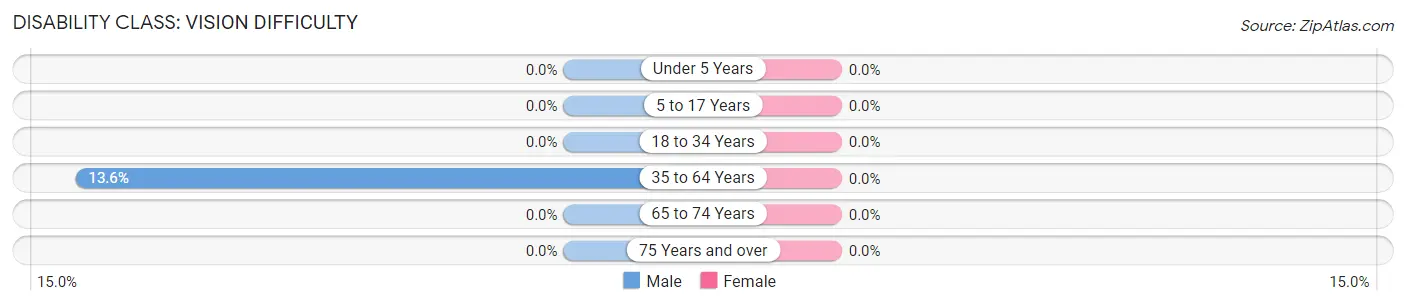
| Age Bracket | Male | Female |
| Under 5 Years | 0 (0.0%) | 0 (0.0%) |
| 5 to 17 Years | 0 (0.0%) | 0 (0.0%) |
| 18 to 34 Years | 0 (0.0%) | 0 (0.0%) |
| 35 to 64 Years | 11 (13.6%) | 0 (0.0%) |
| 65 to 74 Years | 0 (0.0%) | 0 (0.0%) |
| 75 Years and over | 0 (0.0%) | 0 (0.0%) |
Disability Class: Cognitive Difficulty
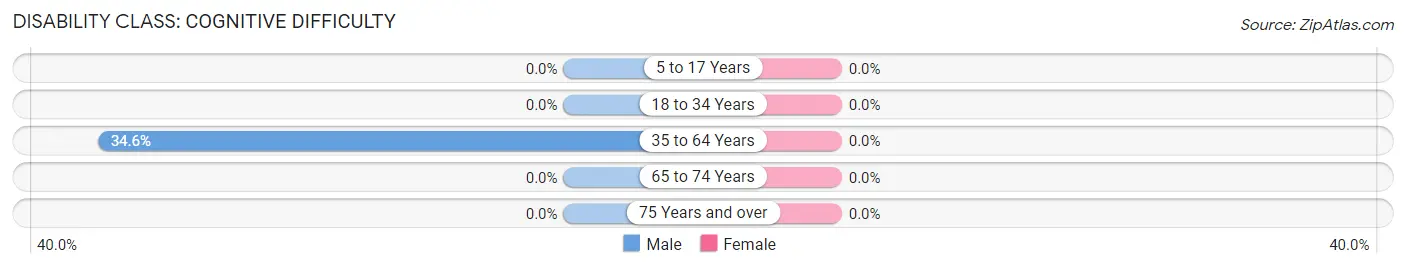
| Age Bracket | Male | Female |
| 5 to 17 Years | 0 (0.0%) | 0 (0.0%) |
| 18 to 34 Years | 0 (0.0%) | 0 (0.0%) |
| 35 to 64 Years | 28 (34.6%) | 0 (0.0%) |
| 65 to 74 Years | 0 (0.0%) | 0 (0.0%) |
| 75 Years and over | 0 (0.0%) | 0 (0.0%) |
Disability Class: Ambulatory Difficulty
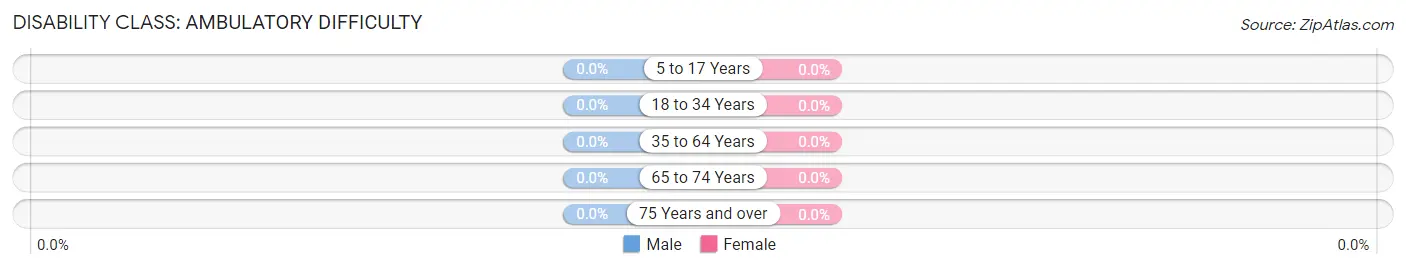
| Age Bracket | Male | Female |
| 5 to 17 Years | 0 (0.0%) | 0 (0.0%) |
| 18 to 34 Years | 0 (0.0%) | 0 (0.0%) |
| 35 to 64 Years | 0 (0.0%) | 0 (0.0%) |
| 65 to 74 Years | 0 (0.0%) | 0 (0.0%) |
| 75 Years and over | 0 (0.0%) | 0 (0.0%) |
Disability Class: Self-Care Difficulty
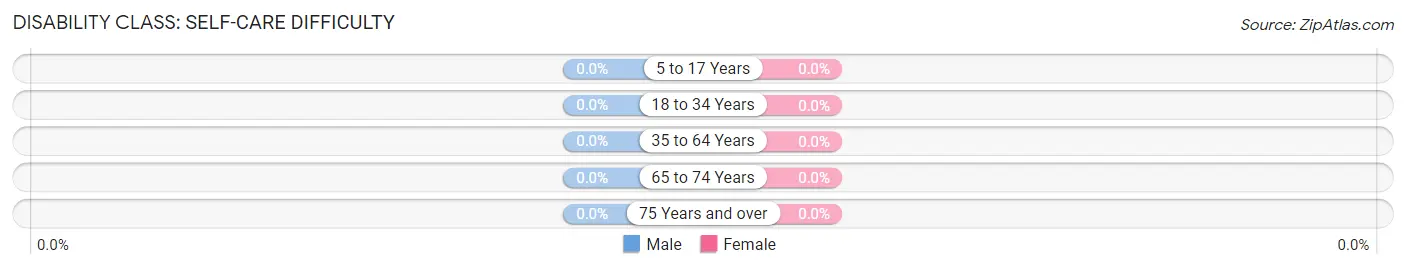
| Age Bracket | Male | Female |
| 5 to 17 Years | 0 (0.0%) | 0 (0.0%) |
| 18 to 34 Years | 0 (0.0%) | 0 (0.0%) |
| 35 to 64 Years | 0 (0.0%) | 0 (0.0%) |
| 65 to 74 Years | 0 (0.0%) | 0 (0.0%) |
| 75 Years and over | 0 (0.0%) | 0 (0.0%) |
Technology Access in Busti
Computing Device Access in Busti
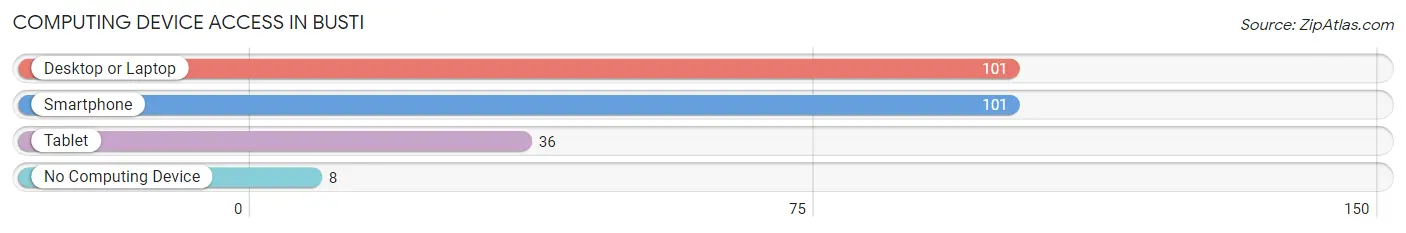
| Device Type | # Households | % Households |
| Desktop or Laptop | 101 | 84.2% |
| Smartphone | 101 | 84.2% |
| Tablet | 36 | 30.0% |
| No Computing Device | 8 | 6.7% |
| Total | 120 | 100.0% |
Internet Access in Busti
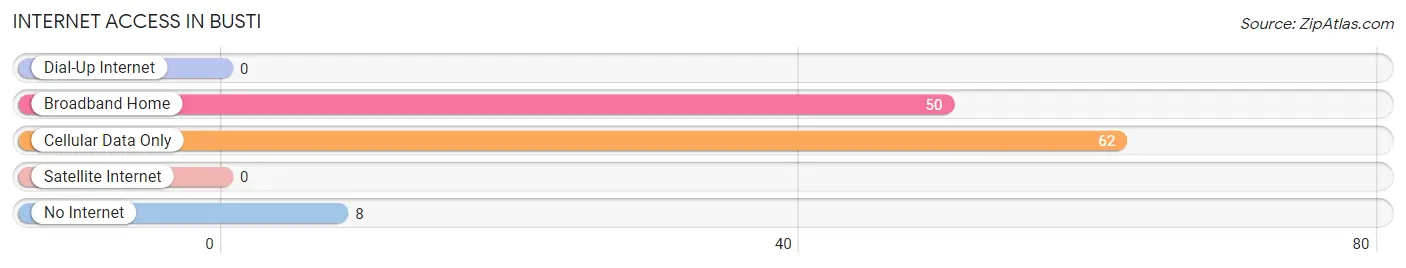
| Internet Type | # Households | % Households |
| Dial-Up Internet | 0 | 0.0% |
| Broadband Home | 50 | 41.7% |
| Cellular Data Only | 62 | 51.7% |
| Satellite Internet | 0 | 0.0% |
| No Internet | 8 | 6.7% |
| Total | 120 | 100.0% |
Busti Summary
Busti is a town located in Chautauqua County, New York, United States. The population was 2,845 at the 2010 census. The town is named after the Busti family, who were among the first settlers in the area.
Geography
Busti is located in the southwestern corner of Chautauqua County, bordered by the towns of Ellery to the north, Kiantone to the east, and Gerry to the south. To the west, across Chautauqua Lake, is the town of North Harmony in neighboring Cattaraugus County.
According to the United States Census Bureau, the town of Busti has a total area of 36.2 square miles (93.7 km2), of which 35.7 square miles (92.5 km2) is land and 0.5 square miles (1.2 km2), or 1.37%, is water.
Demographics
As of the census of 2000, there were 2,845 people, 1,093 households, and 809 families residing in the town. The population density was 79.7 people per square mile (30.8/km2). There were 1,220 housing units at an average density of 34.2 per square mile (13.2/km2). The racial makeup of the town was 98.45% White, 0.21% African American, 0.14% Native American, 0.14% Asian, 0.14% from other races, and 0.93% from two or more races. Hispanic or Latino of any race were 0.53% of the population.
There were 1,093 households, out of which 33.2% had children under the age of 18 living with them, 61.2% were married couples living together, 8.2% had a female householder with no husband present, and 26.2% were non-families. 22.2% of all households were made up of individuals, and 10.2% had someone living alone who was 65 years of age or older. The average household size was 2.60 and the average family size was 3.03.
In the town, the population was spread out, with 25.7% under the age of 18, 6.2% from 18 to 24, 28.2% from 25 to 44, 24.2% from 45 to 64, and 15.7% who were 65 years of age or older. The median age was 39 years. For every 100 females, there were 97.2 males. For every 100 females age 18 and over, there were 94.2 males.
The median income for a household in the town was $41,944, and the median income for a family was $48,958. Males had a median income of $35,938 versus $25,000 for females. The per capita income for the town was $18,945. About 4.2% of families and 6.2% of the population were below the poverty line, including 8.2% of those under age 18 and 5.2% of those age 65 or over.
Economy
Busti is a rural town with a primarily agricultural economy. The town is home to several farms, including dairy farms, vegetable farms, and fruit farms. The town is also home to several wineries, including the award-winning Chautauqua Cellars Winery.
The town is also home to several small businesses, including a hardware store, a lumber yard, and a variety of restaurants and shops. The town is also home to a number of small manufacturing companies, including a furniture manufacturer and a metal fabrication company.
The town is also home to a number of tourist attractions, including the Chautauqua Lake and the Chautauqua Institution. The town is also home to a number of parks and recreational areas, including the Busti-Stillwater State Park.
Conclusion
Busti is a small town located in Chautauqua County, New York. The town has a population of 2,845 as of the 2010 census and is home to a primarily agricultural economy. The town is home to several farms, wineries, small businesses, and tourist attractions. Busti is also home to a number of parks and recreational areas, making it a great place to visit and explore.
Common Questions
What is Per Capita Income in Busti?
Per Capita income in Busti is $32,257.
What is the Median Family Income in Busti?
Median Family Income in Busti is $69,236.
What is the Median Household income in Busti?
Median Household Income in Busti is $69,097.
What is Income or Wage Gap in Busti?
Income or Wage Gap in Busti is 1.0%.
Women in Busti earn 99.0 cents for every dollar earned by a man.
What is Inequality or Gini Index in Busti?
Inequality or Gini Index in Busti is 0.34.
What is the Total Population of Busti?
Total Population of Busti is 260.
What is the Total Male Population of Busti?
Total Male Population of Busti is 161.
What is the Total Female Population of Busti?
Total Female Population of Busti is 99.
What is the Ratio of Males per 100 Females in Busti?
There are 162.63 Males per 100 Females in Busti.
What is the Ratio of Females per 100 Males in Busti?
There are 61.49 Females per 100 Males in Busti.
What is the Median Population Age in Busti?
Median Population Age in Busti is 41.6 Years.
What is the Average Family Size in Busti
Average Family Size in Busti is 2.4 People.
What is the Average Household Size in Busti
Average Household Size in Busti is 2.2 People.
How Large is the Labor Force in Busti?
There are 175 People in the Labor Forcein in Busti.
What is the Percentage of People in the Labor Force in Busti?
67.3% of People are in the Labor Force in Busti.