Scotchtown, NY Map & Demographics
Scotchtown Map
Scotchtown Overview
$40,114
PER CAPITA INCOME
$109,804
AVG FAMILY INCOME
$89,880
AVG HOUSEHOLD INCOME
2.5%
WAGE / INCOME GAP [ % ]
97.5¢/ $1
WAGE / INCOME GAP [ $ ]
$12,726
FAMILY INCOME DEFICIT
0.36
INEQUALITY / GINI INDEX
10,353
TOTAL POPULATION
5,392
MALE POPULATION
4,961
FEMALE POPULATION
108.69
MALES / 100 FEMALES
92.01
FEMALES / 100 MALES
34.8
MEDIAN AGE
3.3
AVG FAMILY SIZE
2.6
AVG HOUSEHOLD SIZE
5,995
LABOR FORCE [ PEOPLE ]
68.7%
PERCENT IN LABOR FORCE
4.2%
UNEMPLOYMENT RATE
Income in Scotchtown
Income Overview in Scotchtown
Per Capita Income in Scotchtown is $40,114, while median incomes of families and households are $109,804 and $89,880 respectively.
| Characteristic | Number | Measure |
| Per Capita Income | 10,353 | $40,114 |
| Median Family Income | 2,486 | $109,804 |
| Mean Family Income | 2,486 | $115,218 |
| Median Household Income | 3,957 | $89,880 |
| Mean Household Income | 3,957 | $103,653 |
| Income Deficit | 2,486 | $12,726 |
| Wage / Income Gap (%) | 10,353 | 2.53% |
| Wage / Income Gap ($) | 10,353 | 97.47¢ per $1 |
| Gini / Inequality Index | 10,353 | 0.36 |
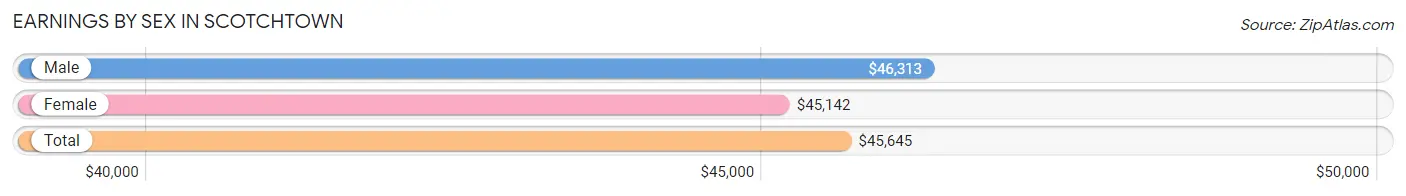
Earnings by Sex in Scotchtown
Average Earnings in Scotchtown are $45,645, $46,313 for men and $45,142 for women, a difference of 2.5%.
| Sex | Number | Average Earnings |
| Male | 3,218 (51.1%) | $46,313 |
| Female | 3,076 (48.9%) | $45,142 |
| Total | 6,294 (100.0%) | $45,645 |
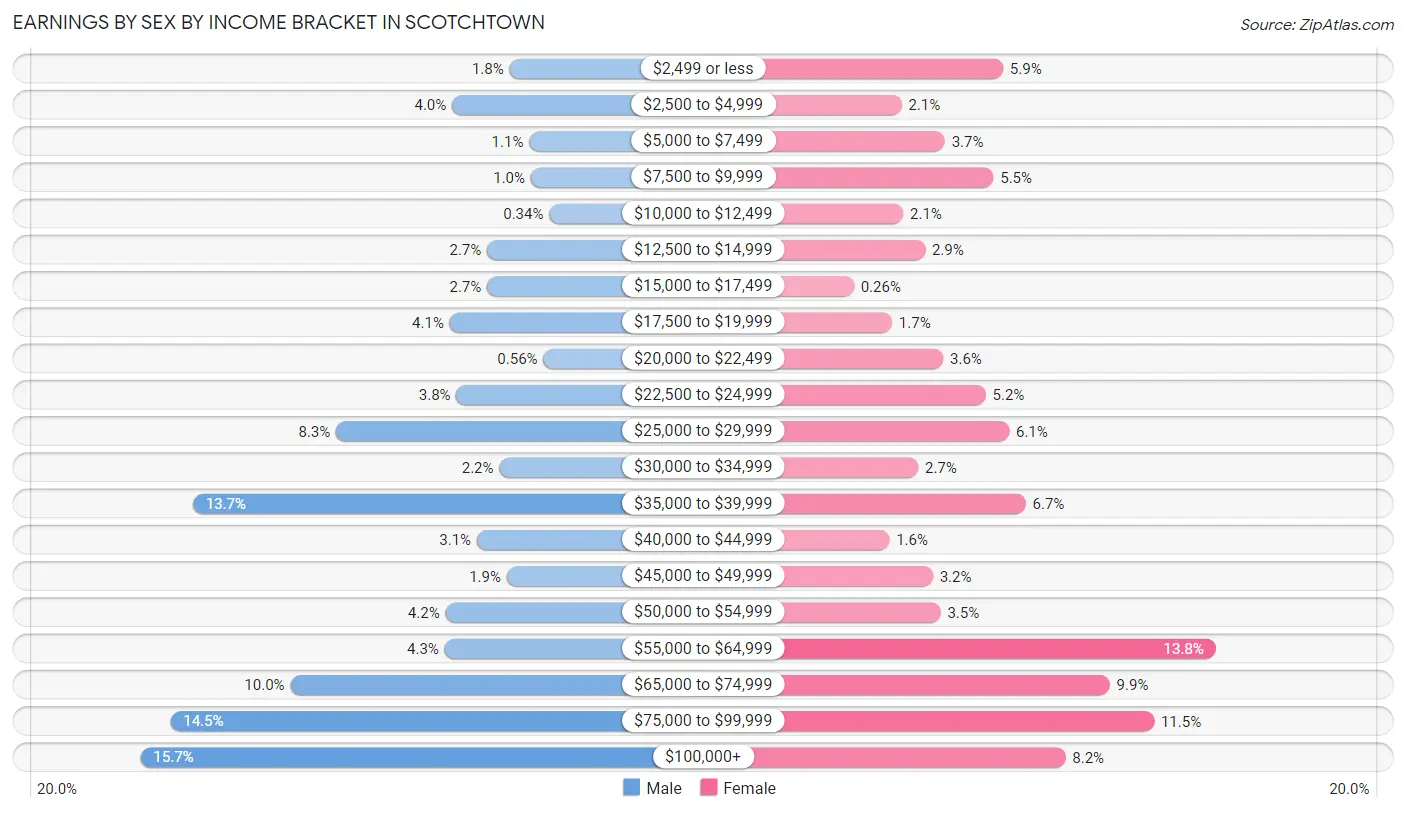
Earnings by Sex by Income Bracket in Scotchtown
The most common earnings brackets in Scotchtown are $100,000+ for men (504 | 15.7%) and $55,000 to $64,999 for women (425 | 13.8%).
| Income | Male | Female |
| $2,499 or less | 59 (1.8%) | 180 (5.9%) |
| $2,500 to $4,999 | 128 (4.0%) | 63 (2.1%) |
| $5,000 to $7,499 | 35 (1.1%) | 113 (3.7%) |
| $7,500 to $9,999 | 33 (1.0%) | 169 (5.5%) |
| $10,000 to $12,499 | 11 (0.3%) | 65 (2.1%) |
| $12,500 to $14,999 | 86 (2.7%) | 90 (2.9%) |
| $15,000 to $17,499 | 86 (2.7%) | 8 (0.3%) |
| $17,500 to $19,999 | 131 (4.1%) | 52 (1.7%) |
| $20,000 to $22,499 | 18 (0.6%) | 111 (3.6%) |
| $22,500 to $24,999 | 123 (3.8%) | 160 (5.2%) |
| $25,000 to $29,999 | 268 (8.3%) | 187 (6.1%) |
| $30,000 to $34,999 | 71 (2.2%) | 82 (2.7%) |
| $35,000 to $39,999 | 441 (13.7%) | 206 (6.7%) |
| $40,000 to $44,999 | 98 (3.0%) | 49 (1.6%) |
| $45,000 to $49,999 | 62 (1.9%) | 99 (3.2%) |
| $50,000 to $54,999 | 136 (4.2%) | 108 (3.5%) |
| $55,000 to $64,999 | 137 (4.3%) | 425 (13.8%) |
| $65,000 to $74,999 | 323 (10.0%) | 303 (9.9%) |
| $75,000 to $99,999 | 468 (14.5%) | 354 (11.5%) |
| $100,000+ | 504 (15.7%) | 252 (8.2%) |
| Total | 3,218 (100.0%) | 3,076 (100.0%) |
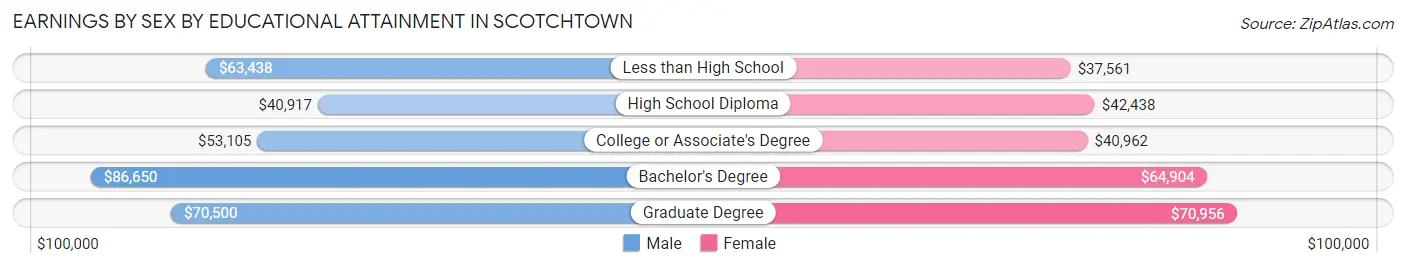
Earnings by Sex by Educational Attainment in Scotchtown
Average earnings in Scotchtown are $61,583 for men and $57,560 for women, a difference of 6.5%. Men with an educational attainment of bachelor's degree enjoy the highest average annual earnings of $86,650, while those with high school diploma education earn the least with $40,917. Women with an educational attainment of graduate degree earn the most with the average annual earnings of $70,956, while those with less than high school education have the smallest earnings of $37,561.
| Educational Attainment | Male Income | Female Income |
| Less than High School | $63,438 | $37,561 |
| High School Diploma | $40,917 | $42,438 |
| College or Associate's Degree | $53,105 | $40,962 |
| Bachelor's Degree | $86,650 | $64,904 |
| Graduate Degree | $70,500 | $70,956 |
| Total | $61,583 | $57,560 |
Family Income in Scotchtown
Family Income Brackets in Scotchtown
According to the Scotchtown family income data, there are 721 families falling into the $100,000 to $149,999 income range, which is the most common income bracket and makes up 29.0% of all families. Conversely, the $25,000 to $34,999 income bracket is the least frequent group with only 32 families (1.3%) belonging to this category.
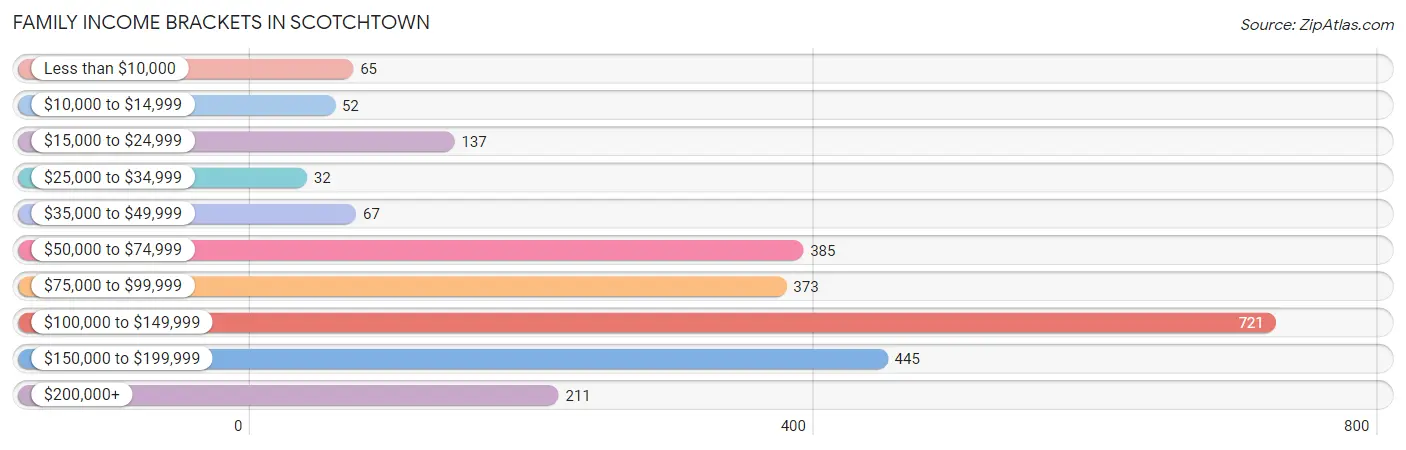
| Income Bracket | # Families | % Families |
| Less than $10,000 | 65 | 2.6% |
| $10,000 to $14,999 | 52 | 2.1% |
| $15,000 to $24,999 | 137 | 5.5% |
| $25,000 to $34,999 | 32 | 1.3% |
| $35,000 to $49,999 | 67 | 2.7% |
| $50,000 to $74,999 | 385 | 15.5% |
| $75,000 to $99,999 | 373 | 15.0% |
| $100,000 to $149,999 | 721 | 29.0% |
| $150,000 to $199,999 | 445 | 17.9% |
| $200,000+ | 211 | 8.5% |
Family Income by Famaliy Size in Scotchtown
7+ person families (80 | 3.2%) account for the highest median family income in Scotchtown with $131,371 per family, while 2-person families (1,044 | 42.0%) have the highest median income of $48,958 per family member.
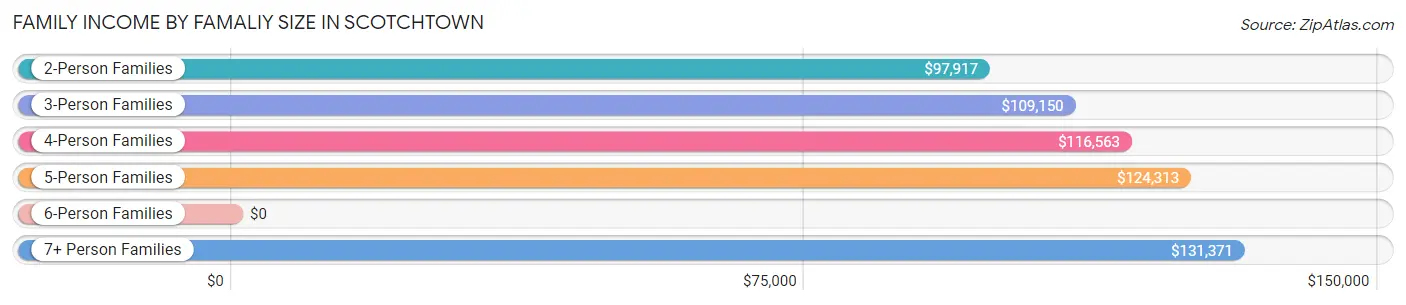
| Income Bracket | # Families | Median Income |
| 2-Person Families | 1,044 (42.0%) | $97,917 |
| 3-Person Families | 639 (25.7%) | $109,150 |
| 4-Person Families | 403 (16.2%) | $116,563 |
| 5-Person Families | 155 (6.2%) | $124,313 |
| 6-Person Families | 165 (6.6%) | $0 |
| 7+ Person Families | 80 (3.2%) | $131,371 |
| Total | 2,486 (100.0%) | $109,804 |
Family Income by Number of Earners in Scotchtown
The median family income in Scotchtown is $109,804, with families comprising 3+ earners (469) having the highest median family income of $173,005, while families with no earners (243) have the lowest median family income of $59,375, accounting for 18.9% and 9.8% of families, respectively.
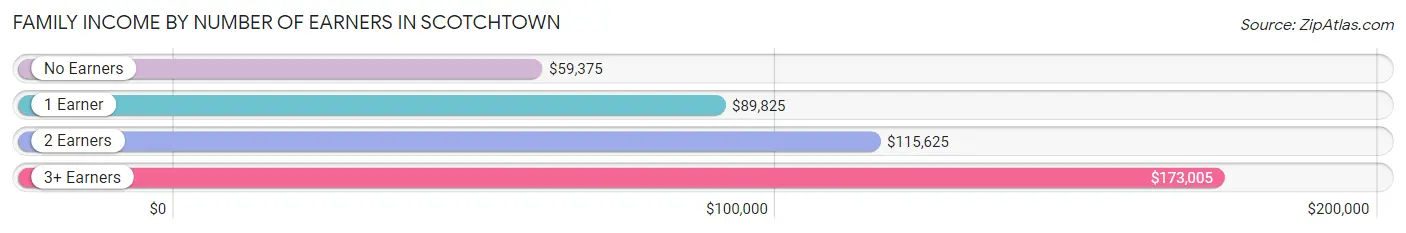
| Number of Earners | # Families | Median Income |
| No Earners | 243 (9.8%) | $59,375 |
| 1 Earner | 779 (31.3%) | $89,825 |
| 2 Earners | 995 (40.0%) | $115,625 |
| 3+ Earners | 469 (18.9%) | $173,005 |
| Total | 2,486 (100.0%) | $109,804 |
Household Income in Scotchtown
Household Income Brackets in Scotchtown
With 803 households falling in the category, the $100,000 to $149,999 income range is the most frequent in Scotchtown, accounting for 20.3% of all households. In contrast, only 75 households (1.9%) fall into the $25,000 to $34,999 income bracket, making it the least populous group.
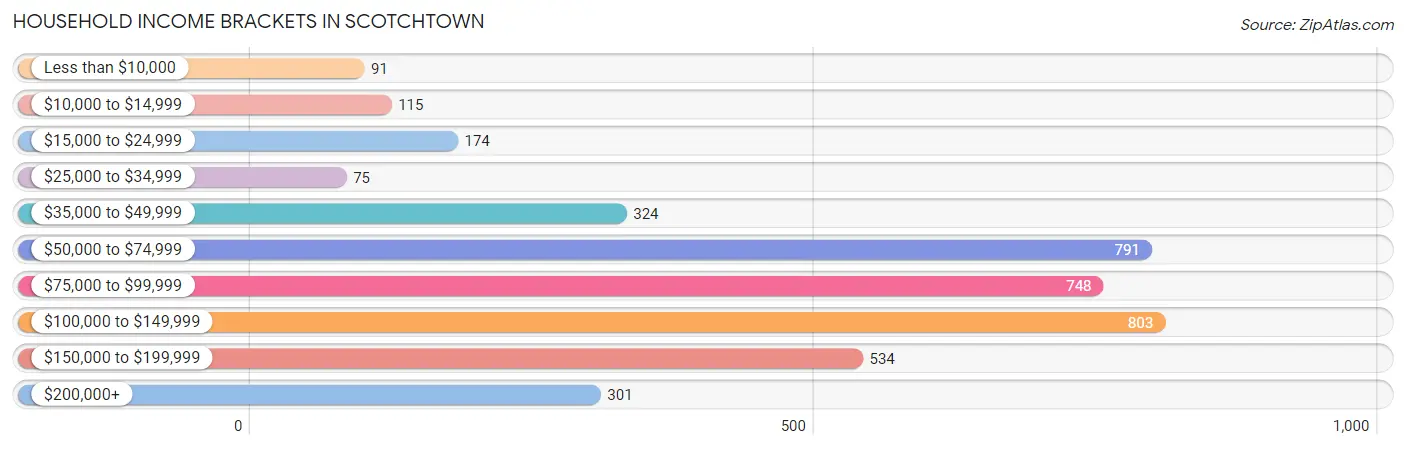
| Income Bracket | # Households | % Households |
| Less than $10,000 | 91 | 2.3% |
| $10,000 to $14,999 | 115 | 2.9% |
| $15,000 to $24,999 | 174 | 4.4% |
| $25,000 to $34,999 | 75 | 1.9% |
| $35,000 to $49,999 | 324 | 8.2% |
| $50,000 to $74,999 | 791 | 20.0% |
| $75,000 to $99,999 | 748 | 18.9% |
| $100,000 to $149,999 | 803 | 20.3% |
| $150,000 to $199,999 | 534 | 13.5% |
| $200,000+ | 301 | 7.6% |
Household Income by Householder Age in Scotchtown
The median household income in Scotchtown is $89,880, with the highest median household income of $117,833 found in the 45 to 64 years age bracket for the primary householder. A total of 1,628 households (41.1%) fall into this category. Meanwhile, the 15 to 24 years age bracket for the primary householder has the lowest median household income of $63,750, with 322 households (8.1%) in this group.
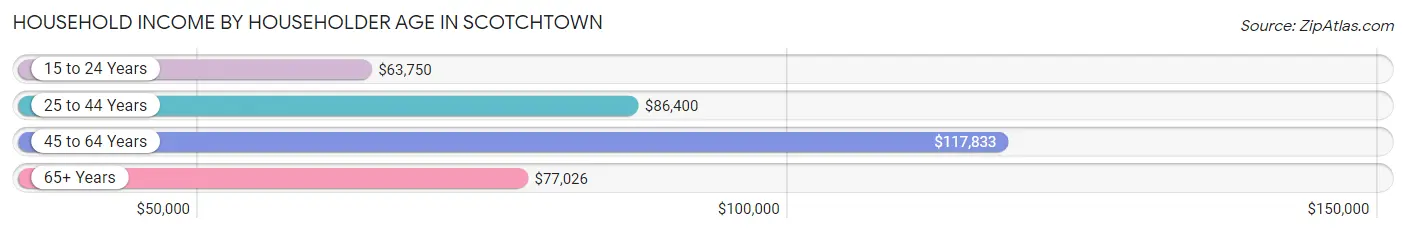
| Income Bracket | # Households | Median Income |
| 15 to 24 Years | 322 (8.1%) | $63,750 |
| 25 to 44 Years | 1,394 (35.2%) | $86,400 |
| 45 to 64 Years | 1,628 (41.1%) | $117,833 |
| 65+ Years | 613 (15.5%) | $77,026 |
| Total | 3,957 (100.0%) | $89,880 |
Poverty in Scotchtown
Income Below Poverty by Sex and Age in Scotchtown
With 11.3% poverty level for males and 12.0% for females among the residents of Scotchtown, 15 year old males and under 5 year old females are the most vulnerable to poverty, with 50 males (48.5%) and 48 females (24.4%) in their respective age groups living below the poverty level.
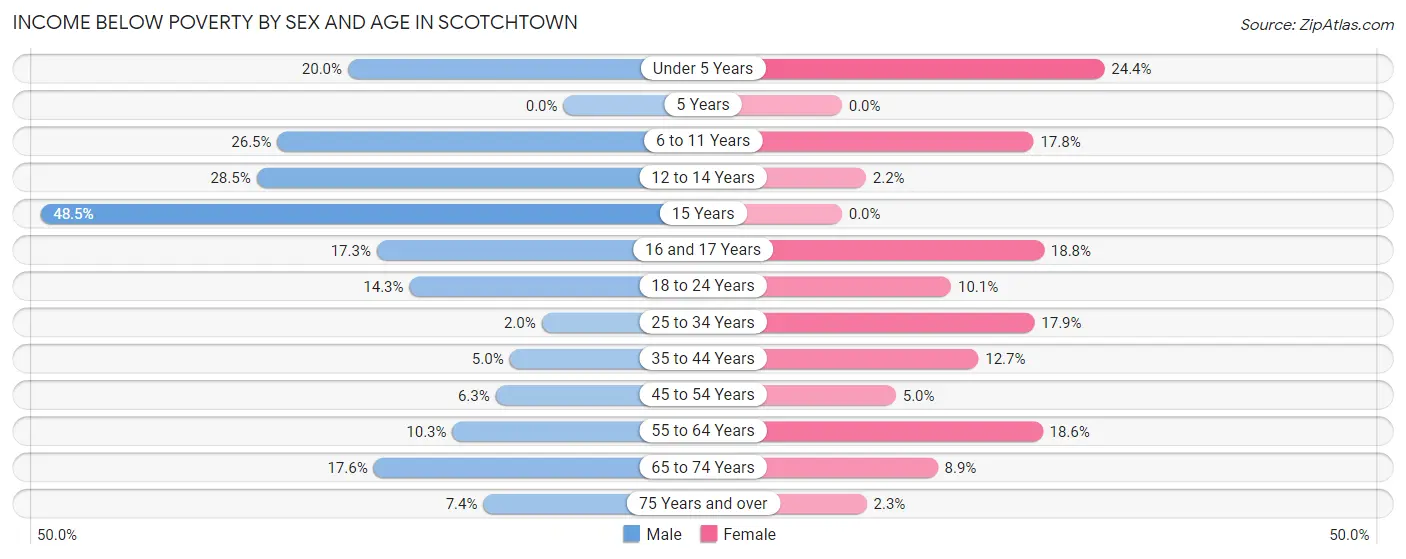
| Age Bracket | Male | Female |
| Under 5 Years | 53 (20.0%) | 48 (24.4%) |
| 5 Years | 0 (0.0%) | 0 (0.0%) |
| 6 to 11 Years | 69 (26.5%) | 58 (17.8%) |
| 12 to 14 Years | 43 (28.5%) | 4 (2.2%) |
| 15 Years | 50 (48.5%) | 0 (0.0%) |
| 16 and 17 Years | 40 (17.3%) | 12 (18.8%) |
| 18 to 24 Years | 102 (14.3%) | 70 (10.1%) |
| 25 to 34 Years | 22 (2.0%) | 141 (17.9%) |
| 35 to 44 Years | 27 (5.0%) | 75 (12.7%) |
| 45 to 54 Years | 41 (6.3%) | 45 (5.0%) |
| 55 to 64 Years | 75 (10.3%) | 103 (18.6%) |
| 65 to 74 Years | 71 (17.6%) | 36 (8.9%) |
| 75 Years and over | 15 (7.4%) | 4 (2.3%) |
| Total | 608 (11.3%) | 596 (12.0%) |
Income Above Poverty by Sex and Age in Scotchtown
According to the poverty statistics in Scotchtown, males aged 5 years and females aged 5 years are the age groups that are most secure financially, with 100.0% of males and 100.0% of females in these age groups living above the poverty line.
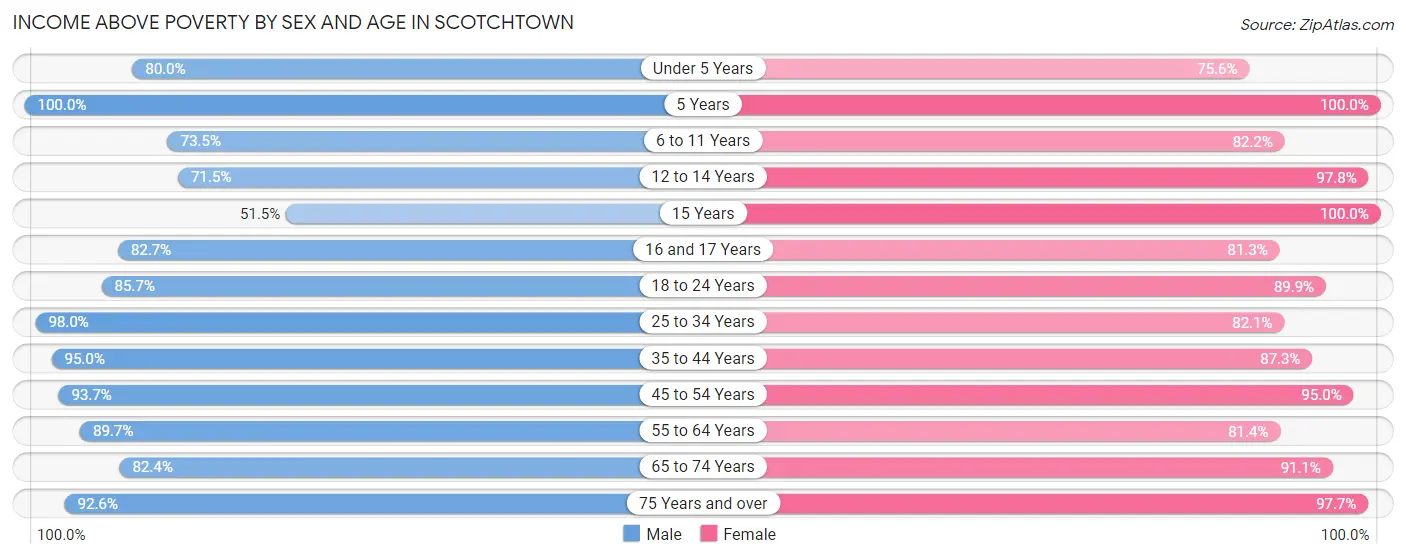
| Age Bracket | Male | Female |
| Under 5 Years | 212 (80.0%) | 149 (75.6%) |
| 5 Years | 45 (100.0%) | 5 (100.0%) |
| 6 to 11 Years | 191 (73.5%) | 268 (82.2%) |
| 12 to 14 Years | 108 (71.5%) | 175 (97.8%) |
| 15 Years | 53 (51.5%) | 75 (100.0%) |
| 16 and 17 Years | 191 (82.7%) | 52 (81.2%) |
| 18 to 24 Years | 612 (85.7%) | 620 (89.9%) |
| 25 to 34 Years | 1,069 (98.0%) | 648 (82.1%) |
| 35 to 44 Years | 513 (95.0%) | 517 (87.3%) |
| 45 to 54 Years | 611 (93.7%) | 854 (95.0%) |
| 55 to 64 Years | 653 (89.7%) | 450 (81.4%) |
| 65 to 74 Years | 332 (82.4%) | 369 (91.1%) |
| 75 Years and over | 187 (92.6%) | 170 (97.7%) |
| Total | 4,777 (88.7%) | 4,352 (87.9%) |
Income Below Poverty Among Married-Couple Families in Scotchtown
The poverty statistics for married-couple families in Scotchtown show that 4.9% or 76 of the total 1,545 families live below the poverty line. Families with 3 or 4 children have the highest poverty rate of 39.9%, comprising of 55 families. On the other hand, families with 5 or more children have the lowest poverty rate of 0.0%, which includes 0 families.
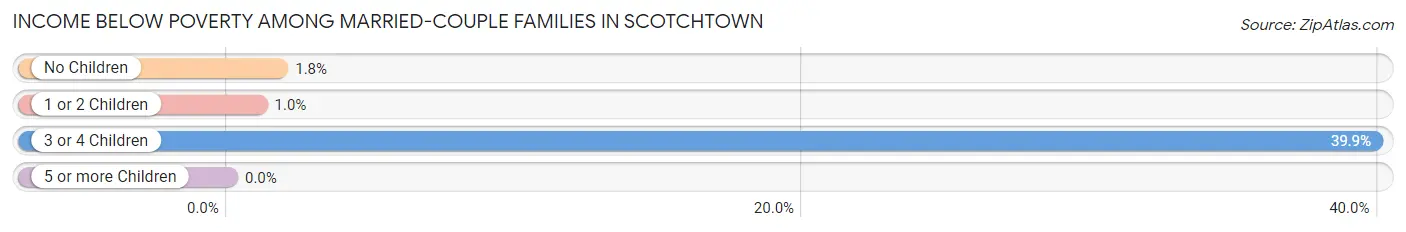
| Children | Above Poverty | Below Poverty |
| No Children | 898 (98.3%) | 16 (1.8%) |
| 1 or 2 Children | 479 (99.0%) | 5 (1.0%) |
| 3 or 4 Children | 83 (60.1%) | 55 (39.9%) |
| 5 or more Children | 9 (100.0%) | 0 (0.0%) |
| Total | 1,469 (95.1%) | 76 (4.9%) |
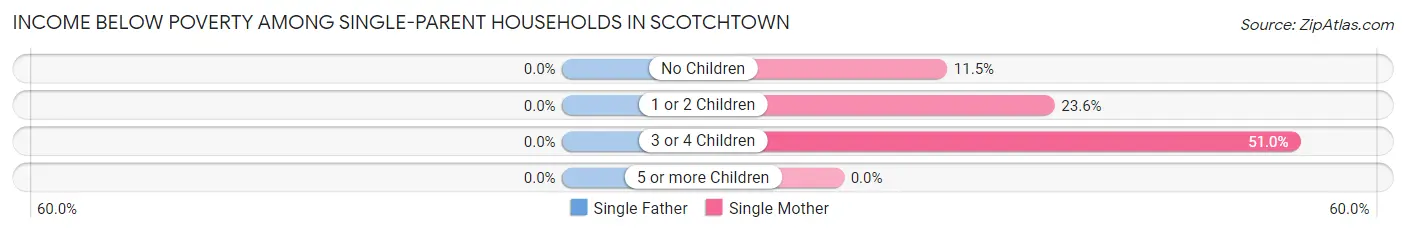
Income Below Poverty Among Single-Parent Households in Scotchtown
| Children | Single Father | Single Mother |
| No Children | 0 (0.0%) | 30 (11.5%) |
| 1 or 2 Children | 0 (0.0%) | 61 (23.5%) |
| 3 or 4 Children | 0 (0.0%) | 74 (51.0%) |
| 5 or more Children | 0 (0.0%) | 0 (0.0%) |
| Total | 0 (0.0%) | 165 (24.8%) |
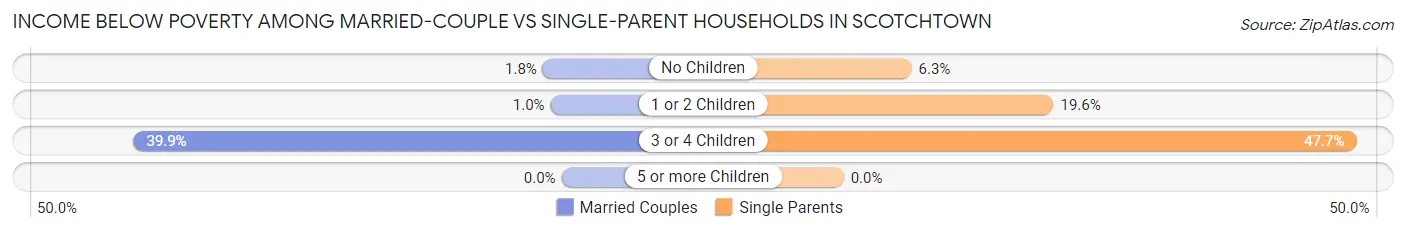
Income Below Poverty Among Married-Couple vs Single-Parent Households in Scotchtown
The poverty data for Scotchtown shows that 76 of the married-couple family households (4.9%) and 165 of the single-parent households (17.5%) are living below the poverty level. Within the married-couple family households, those with 3 or 4 children have the highest poverty rate, with 55 households (39.9%) falling below the poverty line. Among the single-parent households, those with 3 or 4 children have the highest poverty rate, with 74 household (47.7%) living below poverty.
| Children | Married-Couple Families | Single-Parent Households |
| No Children | 16 (1.8%) | 30 (6.3%) |
| 1 or 2 Children | 5 (1.0%) | 61 (19.6%) |
| 3 or 4 Children | 55 (39.9%) | 74 (47.7%) |
| 5 or more Children | 0 (0.0%) | 0 (0.0%) |
| Total | 76 (4.9%) | 165 (17.5%) |
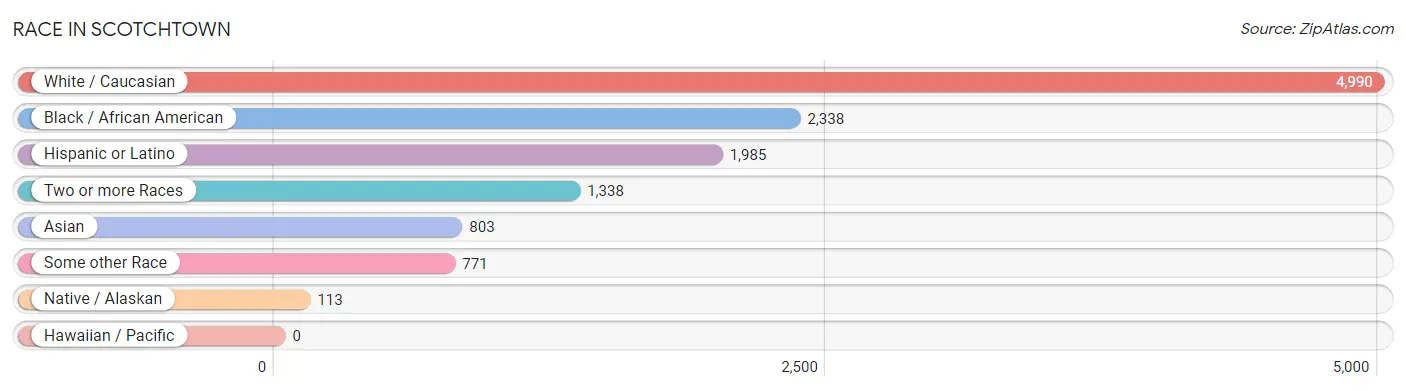
Race in Scotchtown
The most populous races in Scotchtown are White / Caucasian (4,990 | 48.2%), Black / African American (2,338 | 22.6%), and Hispanic or Latino (1,985 | 19.2%).
| Race | # Population | % Population |
| Asian | 803 | 7.8% |
| Black / African American | 2,338 | 22.6% |
| Hawaiian / Pacific | 0 | 0.0% |
| Hispanic or Latino | 1,985 | 19.2% |
| Native / Alaskan | 113 | 1.1% |
| White / Caucasian | 4,990 | 48.2% |
| Two or more Races | 1,338 | 12.9% |
| Some other Race | 771 | 7.4% |
| Total | 10,353 | 100.0% |
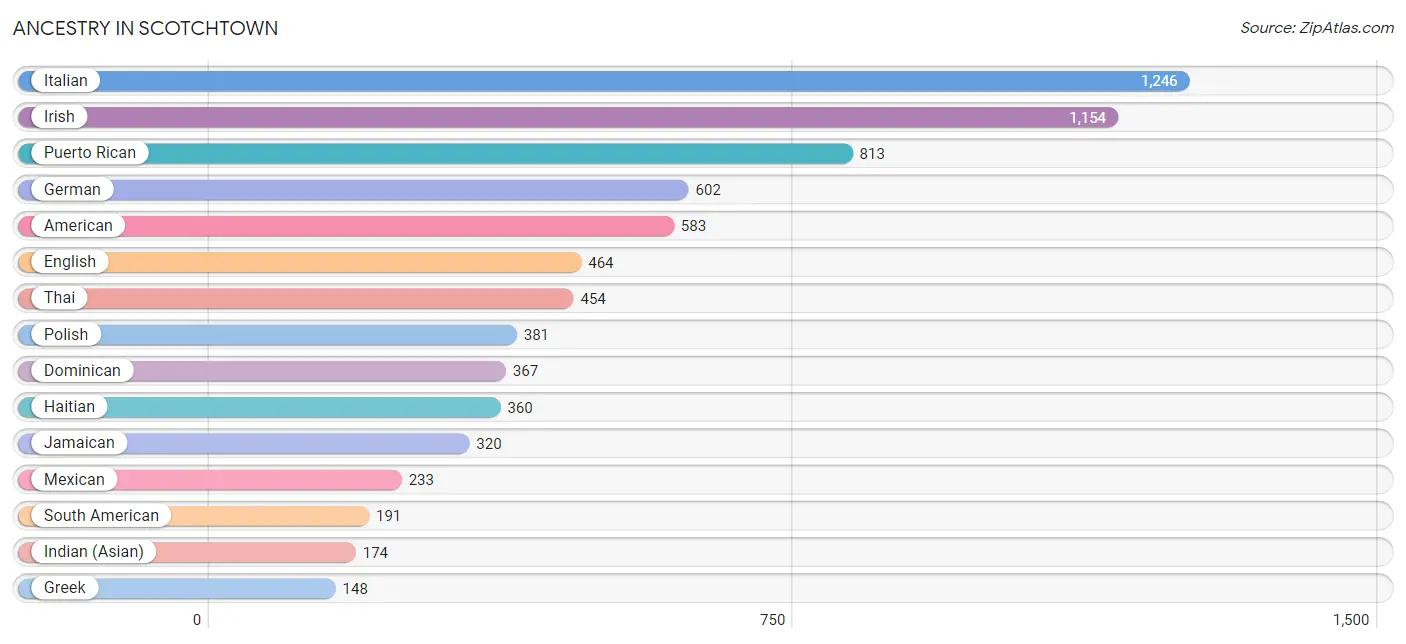
Ancestry in Scotchtown
The most populous ancestries reported in Scotchtown are Italian (1,246 | 12.0%), Irish (1,154 | 11.2%), Puerto Rican (813 | 7.9%), German (602 | 5.8%), and American (583 | 5.6%), together accounting for 42.5% of all Scotchtown residents.
| Ancestry | # Population | % Population |
| African | 61 | 0.6% |
| American | 583 | 5.6% |
| Arab | 71 | 0.7% |
| Argentinean | 10 | 0.1% |
| Armenian | 32 | 0.3% |
| Austrian | 52 | 0.5% |
| Brazilian | 34 | 0.3% |
| British | 10 | 0.1% |
| Bulgarian | 126 | 1.2% |
| Burmese | 16 | 0.2% |
| Central American | 124 | 1.2% |
| Central American Indian | 67 | 0.6% |
| Colombian | 93 | 0.9% |
| Costa Rican | 9 | 0.1% |
| Cuban | 87 | 0.8% |
| Danish | 45 | 0.4% |
| Dominican | 367 | 3.5% |
| Dutch | 105 | 1.0% |
| Eastern European | 40 | 0.4% |
| Ecuadorian | 20 | 0.2% |
| English | 464 | 4.5% |
| European | 51 | 0.5% |
| French | 55 | 0.5% |
| German | 602 | 5.8% |
| Greek | 148 | 1.4% |
| Guatemalan | 57 | 0.5% |
| Haitian | 360 | 3.5% |
| Honduran | 33 | 0.3% |
| Hungarian | 17 | 0.2% |
| Indian (Asian) | 174 | 1.7% |
| Indonesian | 11 | 0.1% |
| Irish | 1,154 | 11.2% |
| Iroquois | 22 | 0.2% |
| Italian | 1,246 | 12.0% |
| Jamaican | 320 | 3.1% |
| Korean | 92 | 0.9% |
| Laotian | 7 | 0.1% |
| Latvian | 2 | 0.0% |
| Lebanese | 20 | 0.2% |
| Mexican | 233 | 2.2% |
| Moroccan | 51 | 0.5% |
| Nigerian | 45 | 0.4% |
| Norwegian | 13 | 0.1% |
| Peruvian | 62 | 0.6% |
| Polish | 381 | 3.7% |
| Portuguese | 5 | 0.1% |
| Puerto Rican | 813 | 7.9% |
| Romanian | 6 | 0.1% |
| Russian | 34 | 0.3% |
| Salvadoran | 25 | 0.2% |
| Scotch-Irish | 16 | 0.2% |
| Scottish | 96 | 0.9% |
| Slovene | 4 | 0.0% |
| South American | 191 | 1.8% |
| Spaniard | 22 | 0.2% |
| Spanish | 71 | 0.7% |
| Sri Lankan | 64 | 0.6% |
| Subsaharan African | 106 | 1.0% |
| Swedish | 19 | 0.2% |
| Thai | 454 | 4.4% |
| Trinidadian and Tobagonian | 75 | 0.7% |
| Venezuelan | 6 | 0.1% |
| Vietnamese | 110 | 1.1% |
| Welsh | 102 | 1.0% |
| West Indian | 78 | 0.7% |
| Yugoslavian | 49 | 0.5% | View All 66 Rows |
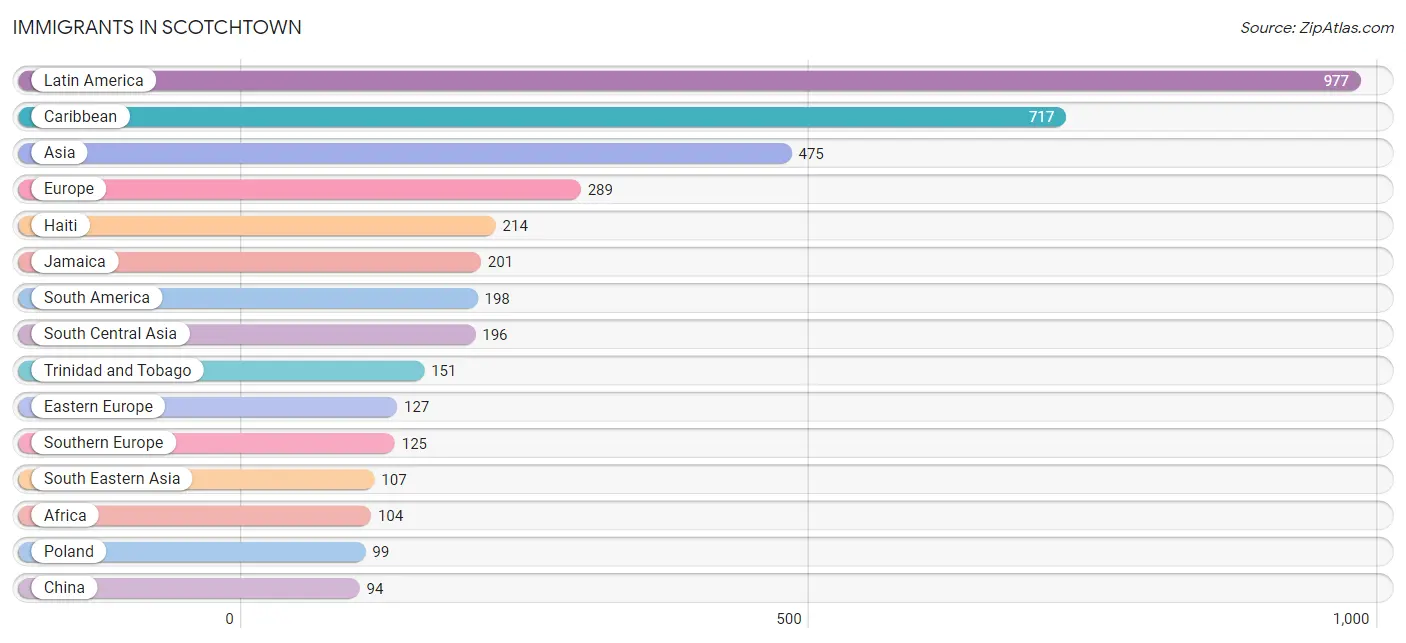
Immigrants in Scotchtown
The most numerous immigrant groups reported in Scotchtown came from Latin America (977 | 9.4%), Caribbean (717 | 6.9%), Asia (475 | 4.6%), Europe (289 | 2.8%), and Haiti (214 | 2.1%), together accounting for 25.8% of all Scotchtown residents.
| Immigration Origin | # Population | % Population |
| Africa | 104 | 1.0% |
| Argentina | 10 | 0.1% |
| Asia | 475 | 4.6% |
| Bangladesh | 44 | 0.4% |
| Bosnia and Herzegovina | 28 | 0.3% |
| Brazil | 34 | 0.3% |
| Canada | 6 | 0.1% |
| Caribbean | 717 | 6.9% |
| Central America | 62 | 0.6% |
| China | 94 | 0.9% |
| Colombia | 78 | 0.7% |
| Costa Rica | 9 | 0.1% |
| Dominica | 56 | 0.5% |
| Dominican Republic | 77 | 0.7% |
| Eastern Asia | 94 | 0.9% |
| Eastern Europe | 127 | 1.2% |
| El Salvador | 3 | 0.0% |
| England | 11 | 0.1% |
| Europe | 289 | 2.8% |
| Germany | 26 | 0.3% |
| Greece | 28 | 0.3% |
| Guatemala | 20 | 0.2% |
| Guyana | 8 | 0.1% |
| Haiti | 214 | 2.1% |
| Hong Kong | 1 | 0.0% |
| India | 63 | 0.6% |
| Indonesia | 7 | 0.1% |
| Israel | 12 | 0.1% |
| Italy | 86 | 0.8% |
| Jamaica | 201 | 1.9% |
| Jordan | 12 | 0.1% |
| Latin America | 977 | 9.4% |
| Lebanon | 32 | 0.3% |
| Mexico | 30 | 0.3% |
| Morocco | 51 | 0.5% |
| Nepal | 2 | 0.0% |
| Nigeria | 53 | 0.5% |
| Northern Africa | 51 | 0.5% |
| Northern Europe | 11 | 0.1% |
| Pakistan | 87 | 0.8% |
| Peru | 62 | 0.6% |
| Philippines | 78 | 0.7% |
| Poland | 99 | 1.0% |
| South America | 198 | 1.9% |
| South Central Asia | 196 | 1.9% |
| South Eastern Asia | 107 | 1.0% |
| Southern Europe | 125 | 1.2% |
| Spain | 11 | 0.1% |
| Syria | 22 | 0.2% |
| Trinidad and Tobago | 151 | 1.5% |
| Venezuela | 6 | 0.1% |
| Vietnam | 20 | 0.2% |
| Western Africa | 53 | 0.5% |
| Western Asia | 78 | 0.7% |
| Western Europe | 26 | 0.3% | View All 55 Rows |
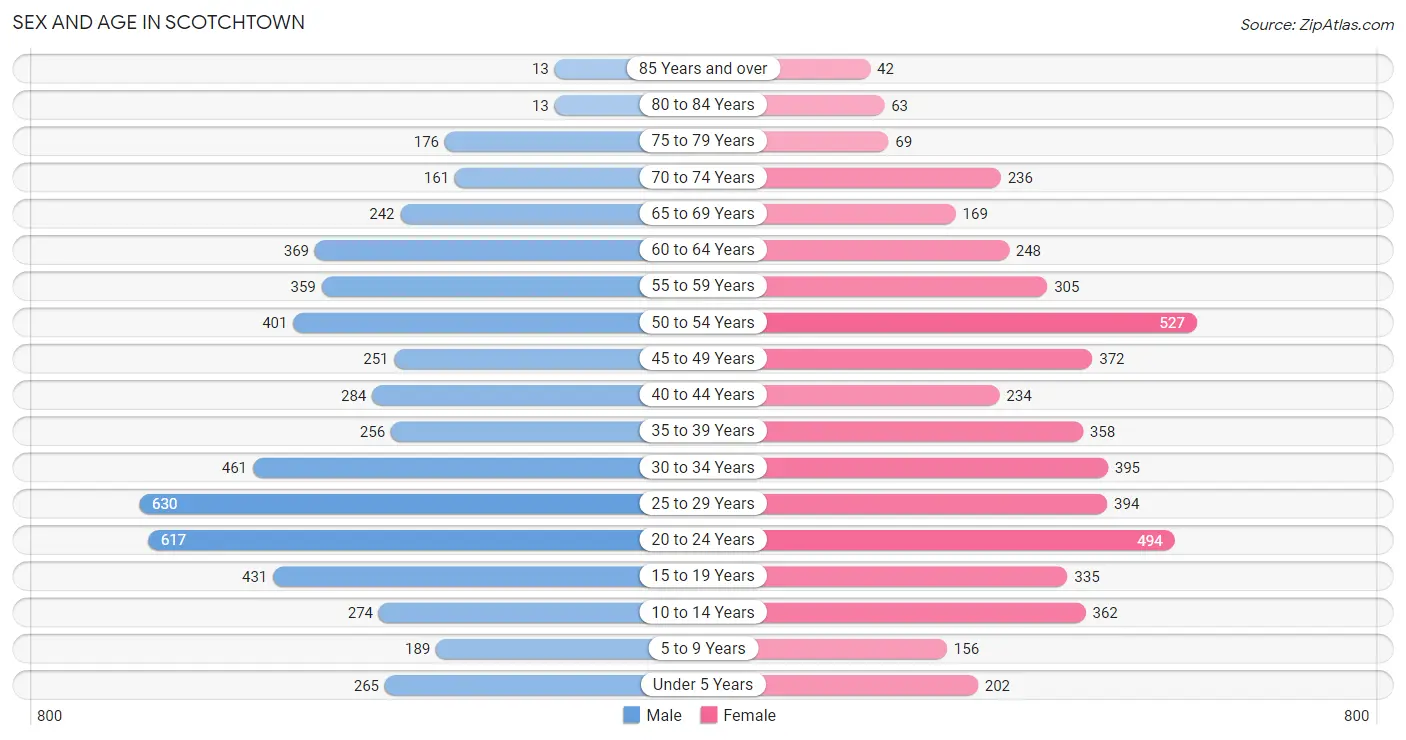
Sex and Age in Scotchtown
Sex and Age in Scotchtown
The most populous age groups in Scotchtown are 25 to 29 Years (630 | 11.7%) for men and 50 to 54 Years (527 | 10.6%) for women.
| Age Bracket | Male | Female |
| Under 5 Years | 265 (4.9%) | 202 (4.1%) |
| 5 to 9 Years | 189 (3.5%) | 156 (3.1%) |
| 10 to 14 Years | 274 (5.1%) | 362 (7.3%) |
| 15 to 19 Years | 431 (8.0%) | 335 (6.8%) |
| 20 to 24 Years | 617 (11.4%) | 494 (10.0%) |
| 25 to 29 Years | 630 (11.7%) | 394 (7.9%) |
| 30 to 34 Years | 461 (8.6%) | 395 (8.0%) |
| 35 to 39 Years | 256 (4.8%) | 358 (7.2%) |
| 40 to 44 Years | 284 (5.3%) | 234 (4.7%) |
| 45 to 49 Years | 251 (4.7%) | 372 (7.5%) |
| 50 to 54 Years | 401 (7.4%) | 527 (10.6%) |
| 55 to 59 Years | 359 (6.7%) | 305 (6.1%) |
| 60 to 64 Years | 369 (6.8%) | 248 (5.0%) |
| 65 to 69 Years | 242 (4.5%) | 169 (3.4%) |
| 70 to 74 Years | 161 (3.0%) | 236 (4.8%) |
| 75 to 79 Years | 176 (3.3%) | 69 (1.4%) |
| 80 to 84 Years | 13 (0.2%) | 63 (1.3%) |
| 85 Years and over | 13 (0.2%) | 42 (0.9%) |
| Total | 5,392 (100.0%) | 4,961 (100.0%) |
Families and Households in Scotchtown
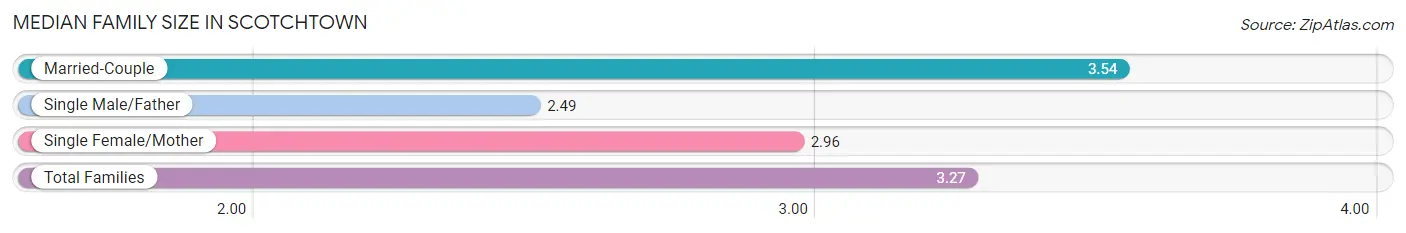
Median Family Size in Scotchtown
The median family size in Scotchtown is 3.27 persons per family, with married-couple families (1,545 | 62.2%) accounting for the largest median family size of 3.54 persons per family. On the other hand, single male/father families (277 | 11.1%) represent the smallest median family size with 2.49 persons per family.
| Family Type | # Families | Family Size |
| Married-Couple | 1,545 (62.2%) | 3.54 |
| Single Male/Father | 277 (11.1%) | 2.49 |
| Single Female/Mother | 664 (26.7%) | 2.96 |
| Total Families | 2,486 (100.0%) | 3.27 |
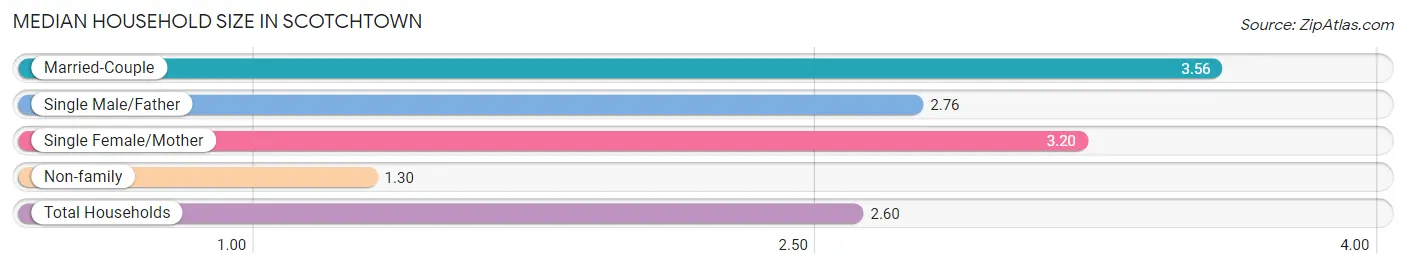
Median Household Size in Scotchtown
The median household size in Scotchtown is 2.60 persons per household, with married-couple households (1,545 | 39.0%) accounting for the largest median household size of 3.56 persons per household. non-family households (1,471 | 37.2%) represent the smallest median household size with 1.30 persons per household.
| Household Type | # Households | Household Size |
| Married-Couple | 1,545 (39.0%) | 3.56 |
| Single Male/Father | 277 (7.0%) | 2.76 |
| Single Female/Mother | 664 (16.8%) | 3.20 |
| Non-family | 1,471 (37.2%) | 1.30 |
| Total Households | 3,957 (100.0%) | 2.60 |
Household Size by Marriage Status in Scotchtown
Out of a total of 3,957 households in Scotchtown, 2,486 (62.8%) are family households, while 1,471 (37.2%) are nonfamily households. The most numerous type of family households are 2-person households, comprising 906, and the most common type of nonfamily households are 1-person households, comprising 1,063.
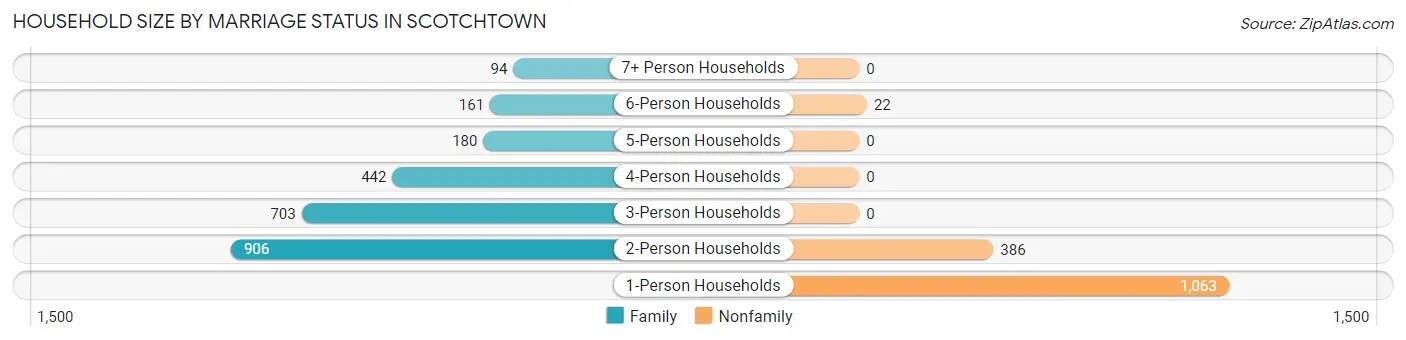
| Household Size | Family Households | Nonfamily Households |
| 1-Person Households | - | 1,063 (26.9%) |
| 2-Person Households | 906 (22.9%) | 386 (9.8%) |
| 3-Person Households | 703 (17.8%) | 0 (0.0%) |
| 4-Person Households | 442 (11.2%) | 0 (0.0%) |
| 5-Person Households | 180 (4.5%) | 0 (0.0%) |
| 6-Person Households | 161 (4.1%) | 22 (0.6%) |
| 7+ Person Households | 94 (2.4%) | 0 (0.0%) |
| Total | 2,486 (62.8%) | 1,471 (37.2%) |
Female Fertility in Scotchtown
Fertility by Age in Scotchtown
Average fertility rate in Scotchtown is 29.0 births per 1,000 women. Women in the age bracket of 20 to 34 years have the highest fertility rate with 37.0 births per 1,000 women. Women in the age bracket of 20 to 34 years acount for 61.0% of all women with births.
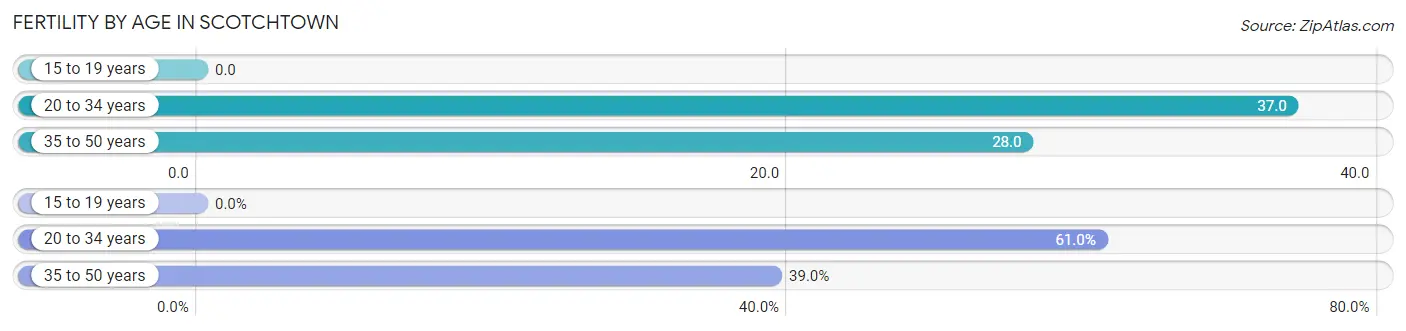
| Age Bracket | Women with Births | Births / 1,000 Women |
| 15 to 19 years | 0 (0.0%) | 0.0 |
| 20 to 34 years | 47 (61.0%) | 37.0 |
| 35 to 50 years | 30 (39.0%) | 28.0 |
| Total | 77 (100.0%) | 29.0 |
Fertility by Age by Marriage Status in Scotchtown
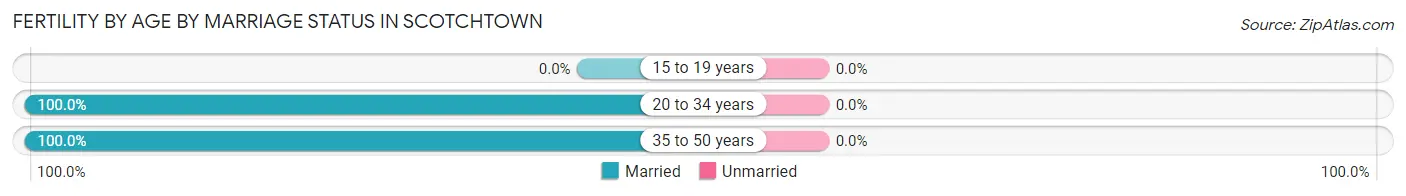
| Age Bracket | Married | Unmarried |
| 15 to 19 years | 0 (0.0%) | 0 (0.0%) |
| 20 to 34 years | 47 (100.0%) | 0 (0.0%) |
| 35 to 50 years | 30 (100.0%) | 0 (0.0%) |
| Total | 77 (100.0%) | 0 (0.0%) |
Fertility by Education in Scotchtown
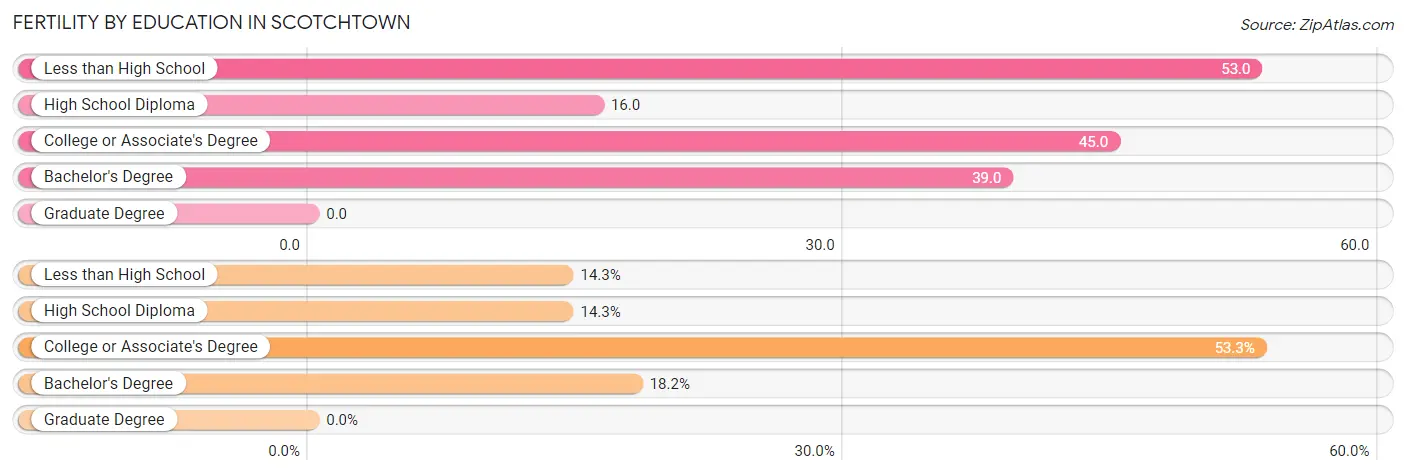
| Educational Attainment | Women with Births | Births / 1,000 Women |
| Less than High School | 11 (14.3%) | 53.0 |
| High School Diploma | 11 (14.3%) | 16.0 |
| College or Associate's Degree | 41 (53.2%) | 45.0 |
| Bachelor's Degree | 14 (18.2%) | 39.0 |
| Graduate Degree | 0 (0.0%) | 0.0 |
| Total | 77 (100.0%) | 29.0 |
Fertility by Education by Marriage Status in Scotchtown
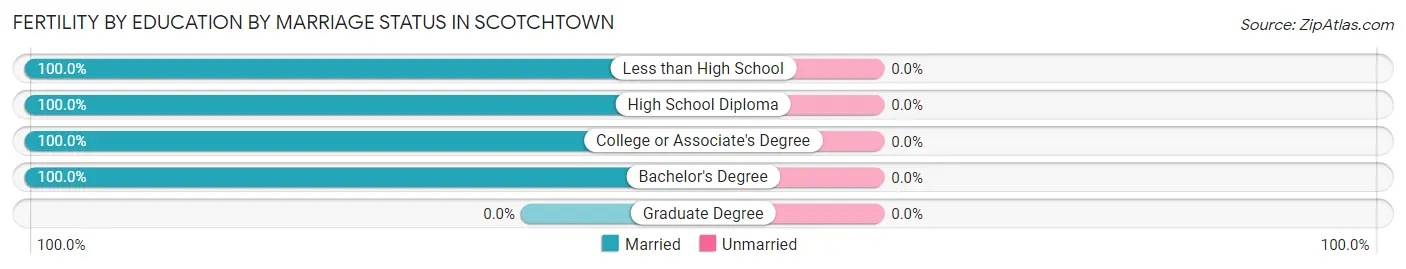
| Educational Attainment | Married | Unmarried |
| Less than High School | 11 (100.0%) | 0 (0.0%) |
| High School Diploma | 11 (100.0%) | 0 (0.0%) |
| College or Associate's Degree | 41 (100.0%) | 0 (0.0%) |
| Bachelor's Degree | 14 (100.0%) | 0 (0.0%) |
| Graduate Degree | 0 (0.0%) | 0 (0.0%) |
| Total | 77 (100.0%) | 0 (0.0%) |
Employment Characteristics in Scotchtown
Employment by Class of Employer in Scotchtown
Among the 5,675 employed individuals in Scotchtown, private company employees (3,341 | 58.9%), not-for-profit organizations (742 | 13.1%), and local government employees (714 | 12.6%) make up the most common classes of employment.
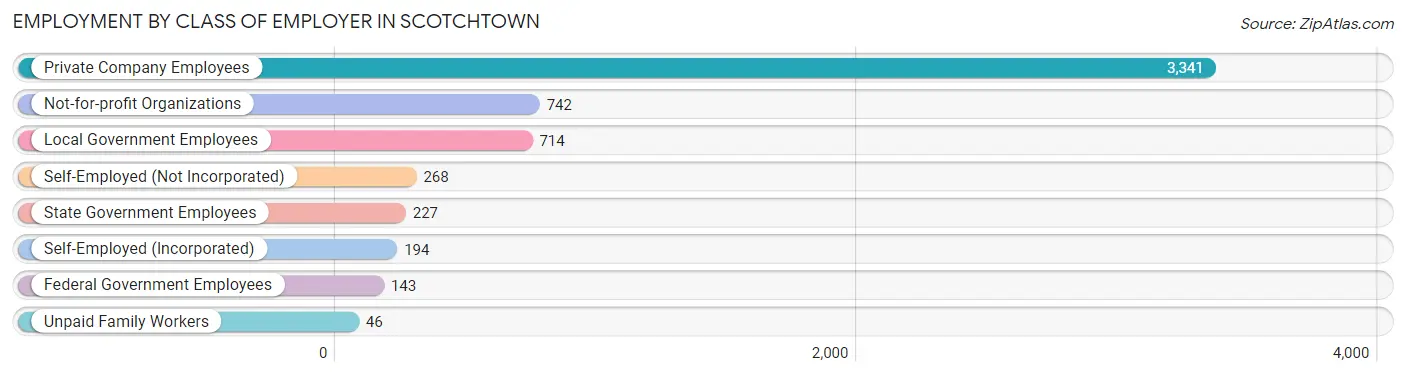
| Employer Class | # Employees | % Employees |
| Private Company Employees | 3,341 | 58.9% |
| Self-Employed (Incorporated) | 194 | 3.4% |
| Self-Employed (Not Incorporated) | 268 | 4.7% |
| Not-for-profit Organizations | 742 | 13.1% |
| Local Government Employees | 714 | 12.6% |
| State Government Employees | 227 | 4.0% |
| Federal Government Employees | 143 | 2.5% |
| Unpaid Family Workers | 46 | 0.8% |
| Total | 5,675 | 100.0% |
Employment Status by Age in Scotchtown
According to the labor force statistics for Scotchtown, out of the total population over 16 years of age (8,727), 68.7% or 5,995 individuals are in the labor force, with 4.2% or 252 of them unemployed. The age group with the highest labor force participation rate is 30 to 34 years, with 93.2% or 798 individuals in the labor force. Within the labor force, the 16 to 19 years age range has the highest percentage of unemployed individuals, with 26.8% or 55 of them being unemployed.
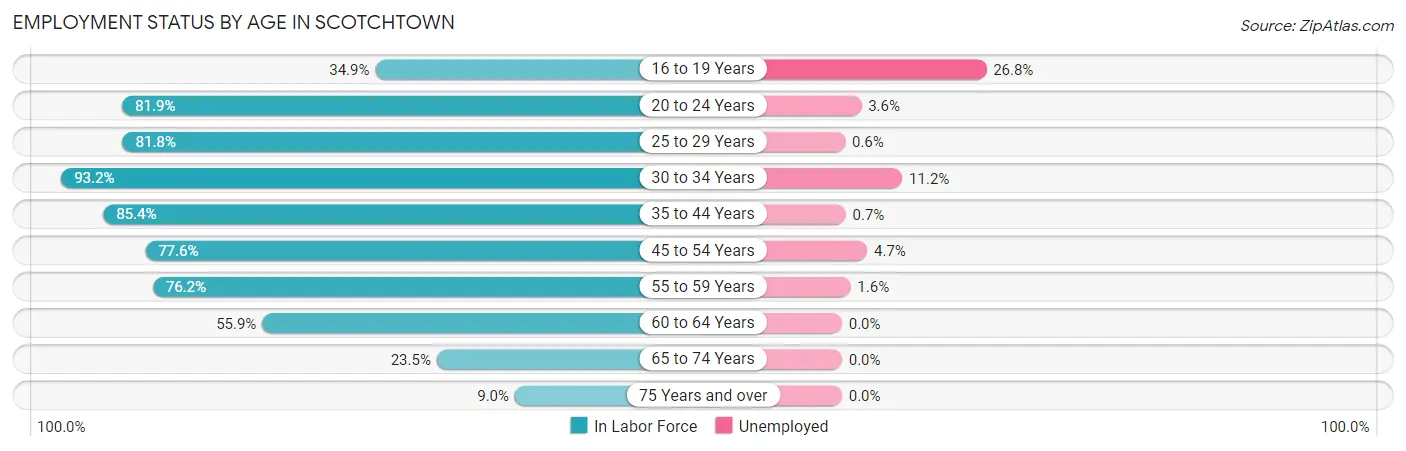
| Age Bracket | In Labor Force | Unemployed |
| 16 to 19 Years | 205 (34.9%) | 55 (26.8%) |
| 20 to 24 Years | 910 (81.9%) | 33 (3.6%) |
| 25 to 29 Years | 838 (81.8%) | 5 (0.6%) |
| 30 to 34 Years | 798 (93.2%) | 89 (11.2%) |
| 35 to 44 Years | 967 (85.4%) | 7 (0.7%) |
| 45 to 54 Years | 1,204 (77.6%) | 57 (4.7%) |
| 55 to 59 Years | 506 (76.2%) | 8 (1.6%) |
| 60 to 64 Years | 345 (55.9%) | 0 (0.0%) |
| 65 to 74 Years | 190 (23.5%) | 0 (0.0%) |
| 75 Years and over | 34 (9.0%) | 0 (0.0%) |
| Total | 5,995 (68.7%) | 252 (4.2%) |
Employment Status by Educational Attainment in Scotchtown
According to labor force statistics for Scotchtown, 79.7% of individuals (4,658) out of the total population between 25 and 64 years of age (5,844) are in the labor force, with 3.6% or 168 of them being unemployed. The group with the highest labor force participation rate are those with the educational attainment of bachelor's degree or higher, with 93.4% or 1,538 individuals in the labor force. Within the labor force, individuals with less than high school education have the highest percentage of unemployment, with 14.9% or 29 of them being unemployed.
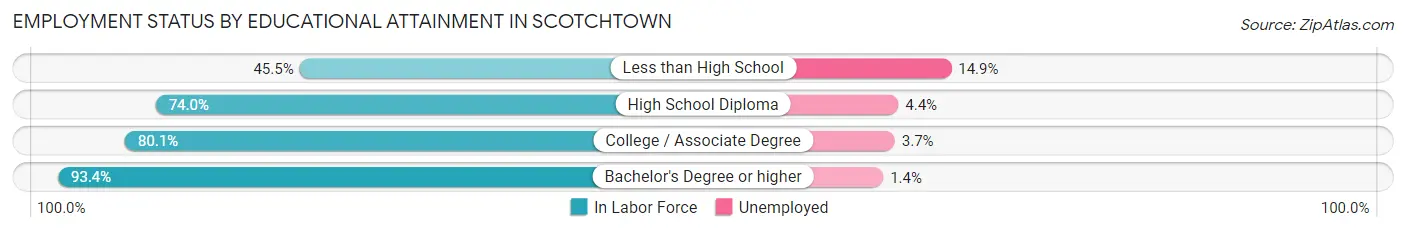
| Educational Attainment | In Labor Force | Unemployed |
| Less than High School | 195 (45.5%) | 64 (14.9%) |
| High School Diploma | 1,163 (74.0%) | 69 (4.4%) |
| College / Associate Degree | 1,759 (80.1%) | 81 (3.7%) |
| Bachelor's Degree or higher | 1,538 (93.4%) | 23 (1.4%) |
| Total | 4,658 (79.7%) | 210 (3.6%) |
Employment Occupations by Sex in Scotchtown
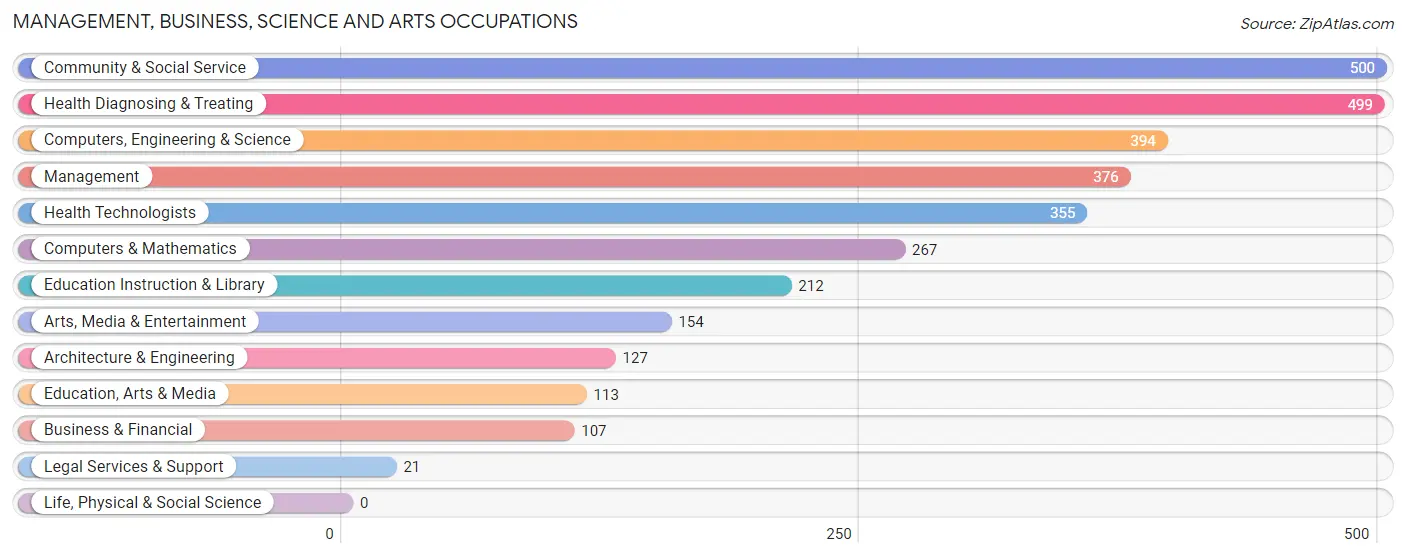
Management, Business, Science and Arts Occupations
The most common Management, Business, Science and Arts occupations in Scotchtown are Community & Social Service (500 | 8.7%), Health Diagnosing & Treating (499 | 8.7%), Computers, Engineering & Science (394 | 6.9%), Management (376 | 6.6%), and Health Technologists (355 | 6.2%).
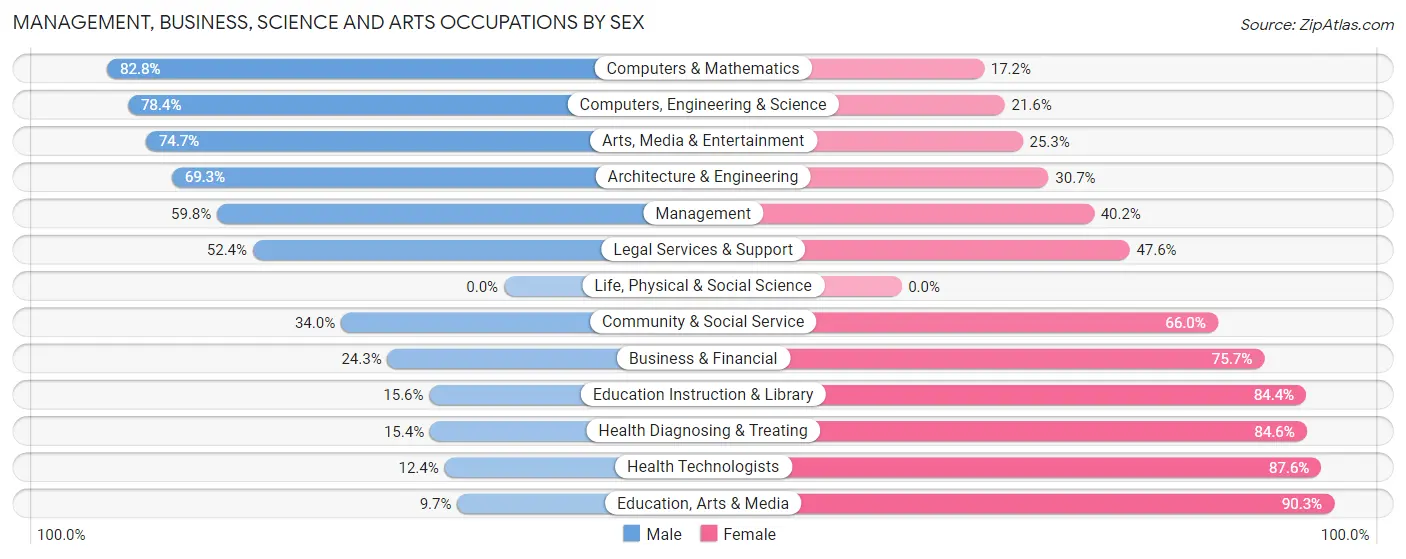
Management, Business, Science and Arts Occupations by Sex
Within the Management, Business, Science and Arts occupations in Scotchtown, the most male-oriented occupations are Computers & Mathematics (82.8%), Computers, Engineering & Science (78.4%), and Arts, Media & Entertainment (74.7%), while the most female-oriented occupations are Education, Arts & Media (90.3%), Health Technologists (87.6%), and Health Diagnosing & Treating (84.6%).
| Occupation | Male | Female |
| Management | 225 (59.8%) | 151 (40.2%) |
| Business & Financial | 26 (24.3%) | 81 (75.7%) |
| Computers, Engineering & Science | 309 (78.4%) | 85 (21.6%) |
| Computers & Mathematics | 221 (82.8%) | 46 (17.2%) |
| Architecture & Engineering | 88 (69.3%) | 39 (30.7%) |
| Life, Physical & Social Science | 0 (0.0%) | 0 (0.0%) |
| Community & Social Service | 170 (34.0%) | 330 (66.0%) |
| Education, Arts & Media | 11 (9.7%) | 102 (90.3%) |
| Legal Services & Support | 11 (52.4%) | 10 (47.6%) |
| Education Instruction & Library | 33 (15.6%) | 179 (84.4%) |
| Arts, Media & Entertainment | 115 (74.7%) | 39 (25.3%) |
| Health Diagnosing & Treating | 77 (15.4%) | 422 (84.6%) |
| Health Technologists | 44 (12.4%) | 311 (87.6%) |
| Total (Category) | 807 (43.0%) | 1,069 (57.0%) |
| Total (Overall) | 2,882 (50.3%) | 2,845 (49.7%) |
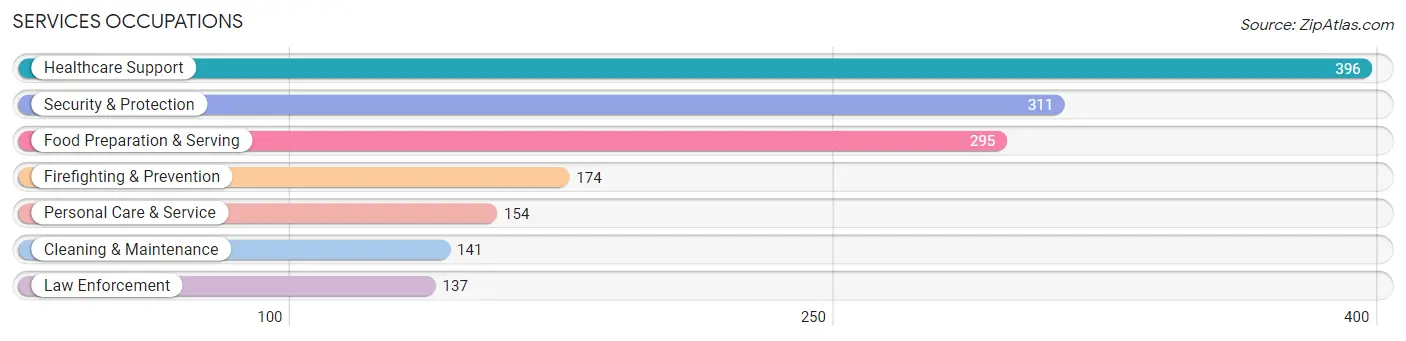
Services Occupations
The most common Services occupations in Scotchtown are Healthcare Support (396 | 6.9%), Security & Protection (311 | 5.4%), Food Preparation & Serving (295 | 5.1%), Firefighting & Prevention (174 | 3.0%), and Personal Care & Service (154 | 2.7%).
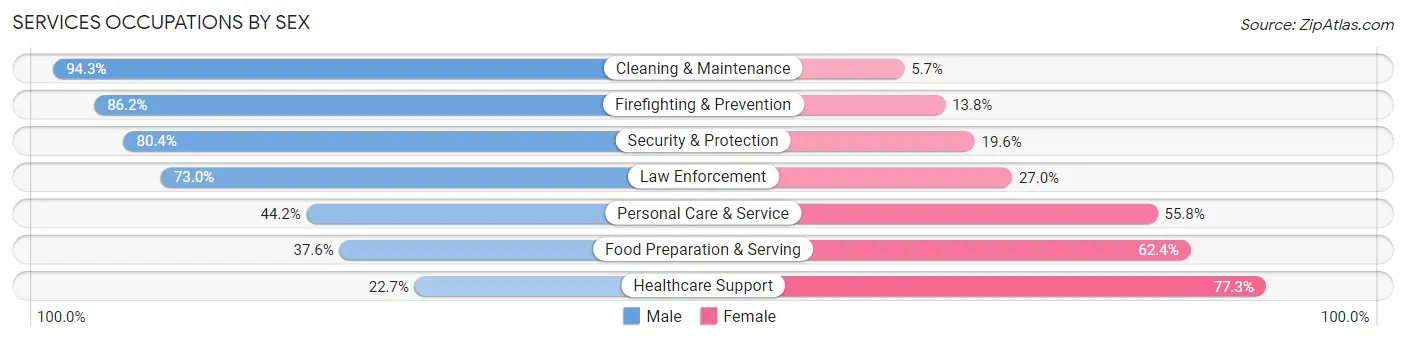
Services Occupations by Sex
Within the Services occupations in Scotchtown, the most male-oriented occupations are Cleaning & Maintenance (94.3%), Firefighting & Prevention (86.2%), and Security & Protection (80.4%), while the most female-oriented occupations are Healthcare Support (77.3%), Food Preparation & Serving (62.4%), and Personal Care & Service (55.8%).
| Occupation | Male | Female |
| Healthcare Support | 90 (22.7%) | 306 (77.3%) |
| Security & Protection | 250 (80.4%) | 61 (19.6%) |
| Firefighting & Prevention | 150 (86.2%) | 24 (13.8%) |
| Law Enforcement | 100 (73.0%) | 37 (27.0%) |
| Food Preparation & Serving | 111 (37.6%) | 184 (62.4%) |
| Cleaning & Maintenance | 133 (94.3%) | 8 (5.7%) |
| Personal Care & Service | 68 (44.2%) | 86 (55.8%) |
| Total (Category) | 652 (50.3%) | 645 (49.7%) |
| Total (Overall) | 2,882 (50.3%) | 2,845 (49.7%) |
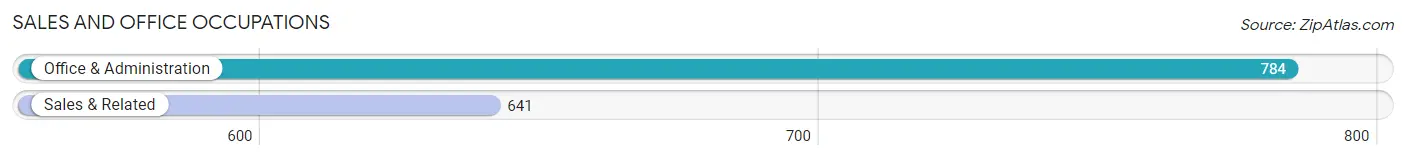
Sales and Office Occupations
The most common Sales and Office occupations in Scotchtown are Office & Administration (784 | 13.7%), and Sales & Related (641 | 11.2%).
Sales and Office Occupations by Sex
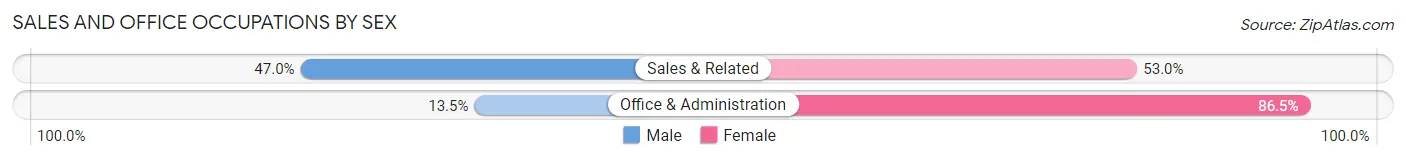
| Occupation | Male | Female |
| Sales & Related | 301 (47.0%) | 340 (53.0%) |
| Office & Administration | 106 (13.5%) | 678 (86.5%) |
| Total (Category) | 407 (28.6%) | 1,018 (71.4%) |
| Total (Overall) | 2,882 (50.3%) | 2,845 (49.7%) |
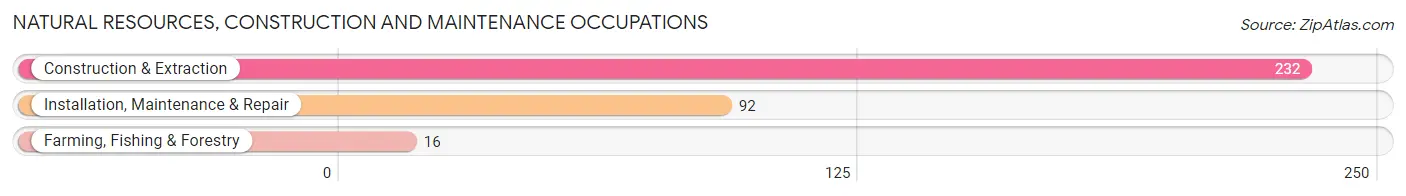
Natural Resources, Construction and Maintenance Occupations
The most common Natural Resources, Construction and Maintenance occupations in Scotchtown are Construction & Extraction (232 | 4.1%), Installation, Maintenance & Repair (92 | 1.6%), and Farming, Fishing & Forestry (16 | 0.3%).
Natural Resources, Construction and Maintenance Occupations by Sex
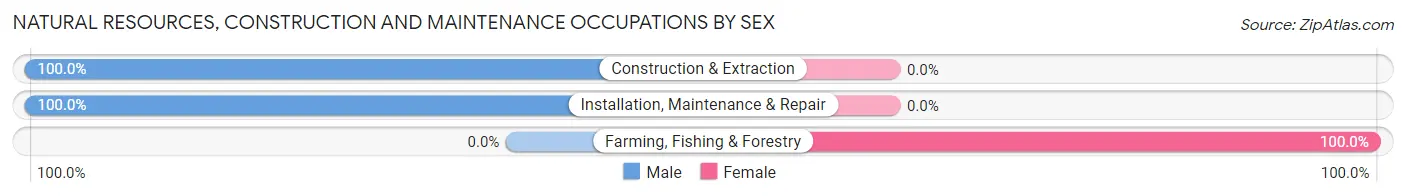
| Occupation | Male | Female |
| Farming, Fishing & Forestry | 0 (0.0%) | 16 (100.0%) |
| Construction & Extraction | 232 (100.0%) | 0 (0.0%) |
| Installation, Maintenance & Repair | 92 (100.0%) | 0 (0.0%) |
| Total (Category) | 324 (95.3%) | 16 (4.7%) |
| Total (Overall) | 2,882 (50.3%) | 2,845 (49.7%) |
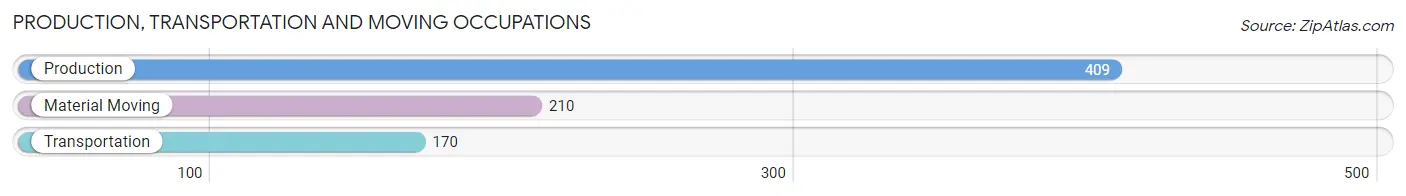
Production, Transportation and Moving Occupations
The most common Production, Transportation and Moving occupations in Scotchtown are Production (409 | 7.1%), Material Moving (210 | 3.7%), and Transportation (170 | 3.0%).
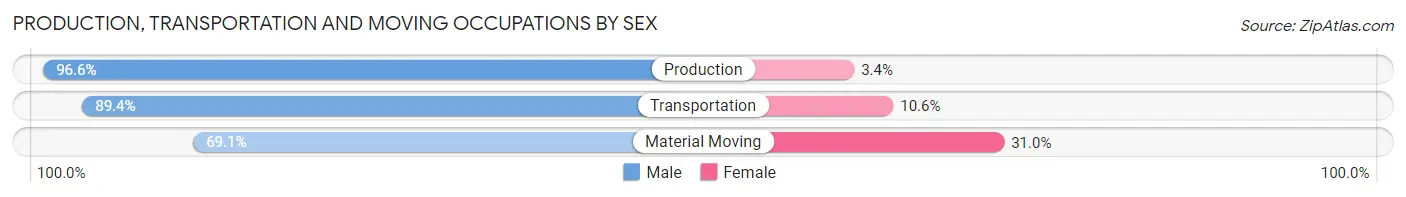
Production, Transportation and Moving Occupations by Sex
| Occupation | Male | Female |
| Production | 395 (96.6%) | 14 (3.4%) |
| Transportation | 152 (89.4%) | 18 (10.6%) |
| Material Moving | 145 (69.1%) | 65 (30.9%) |
| Total (Category) | 692 (87.7%) | 97 (12.3%) |
| Total (Overall) | 2,882 (50.3%) | 2,845 (49.7%) |
Employment Industries by Sex in Scotchtown
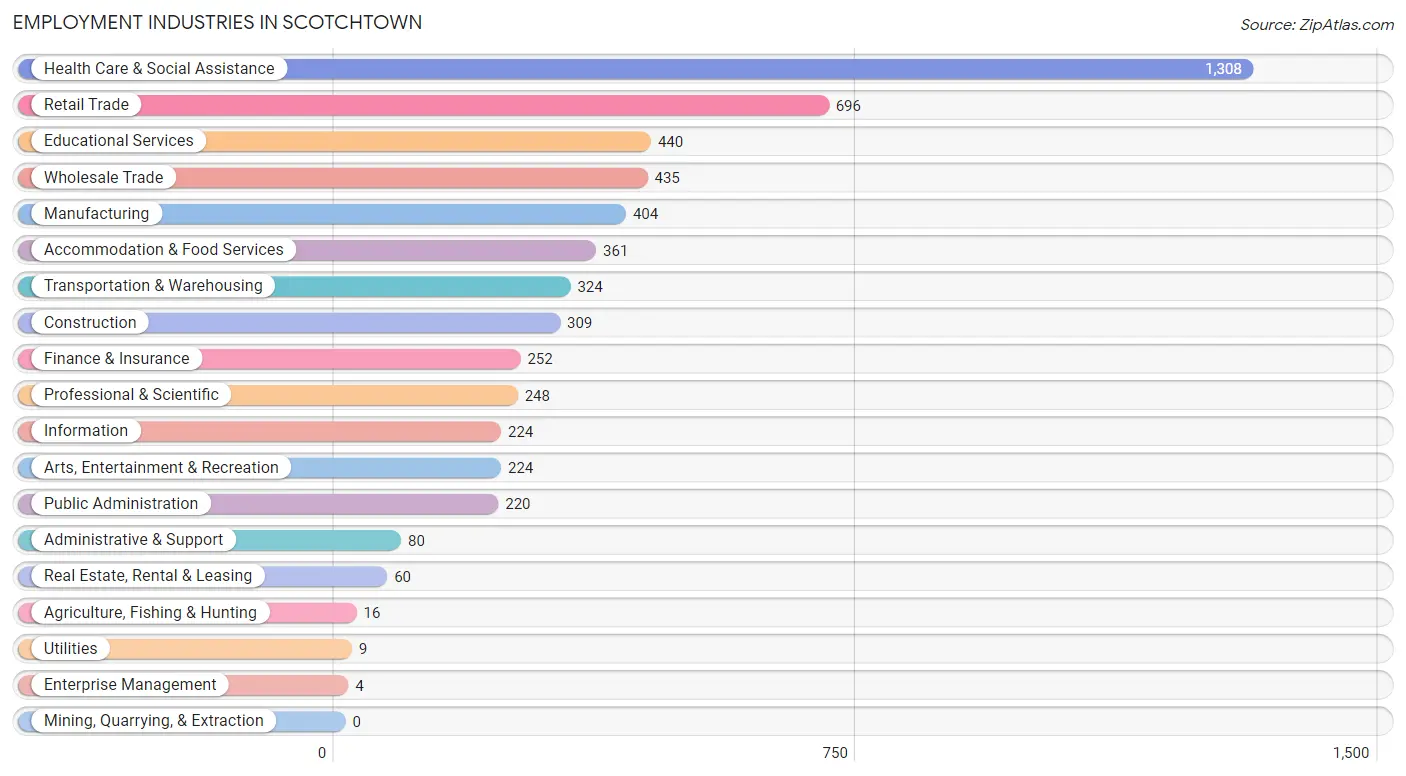
Employment Industries in Scotchtown
The major employment industries in Scotchtown include Health Care & Social Assistance (1,308 | 22.8%), Retail Trade (696 | 12.1%), Educational Services (440 | 7.7%), Wholesale Trade (435 | 7.6%), and Manufacturing (404 | 7.0%).
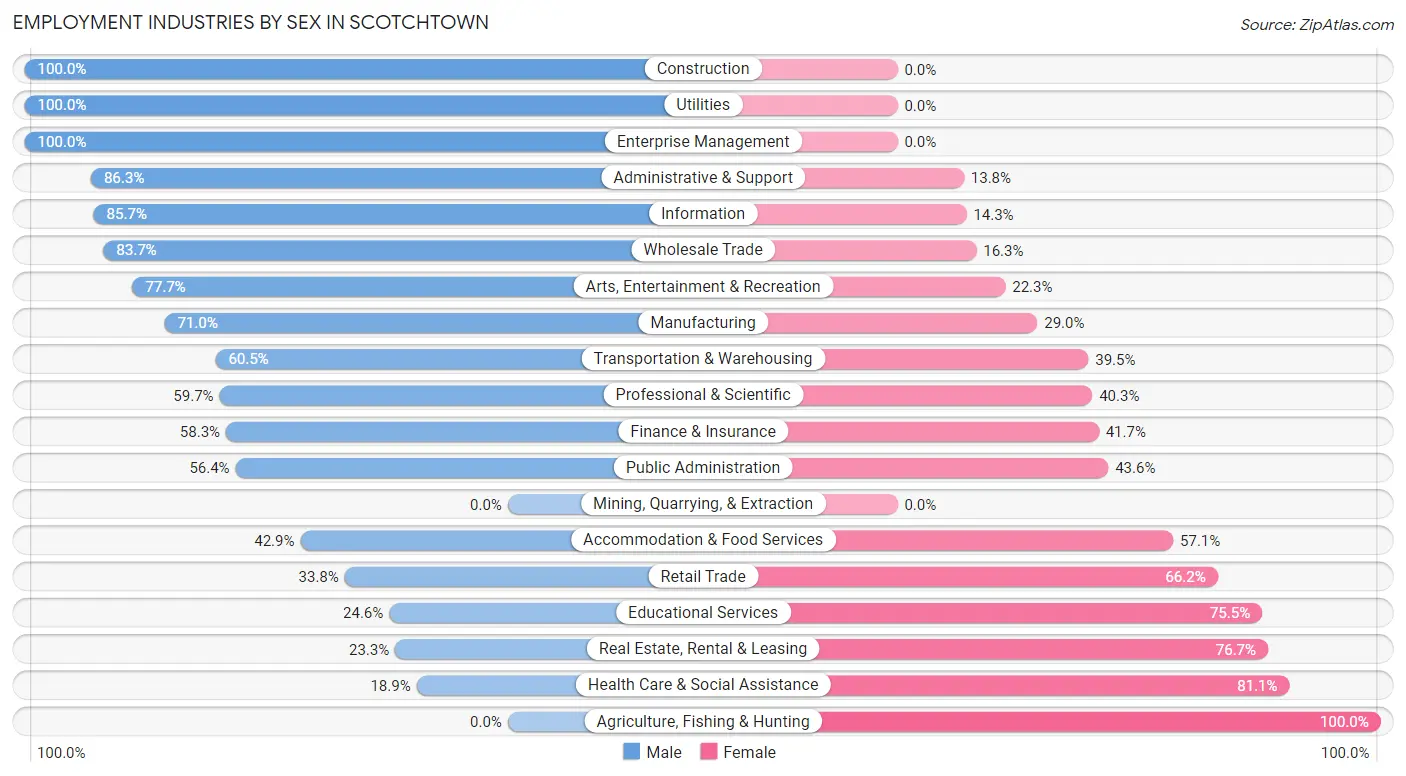
Employment Industries by Sex in Scotchtown
The Scotchtown industries that see more men than women are Construction (100.0%), Utilities (100.0%), and Enterprise Management (100.0%), whereas the industries that tend to have a higher number of women are Agriculture, Fishing & Hunting (100.0%), Health Care & Social Assistance (81.1%), and Real Estate, Rental & Leasing (76.7%).
| Industry | Male | Female |
| Agriculture, Fishing & Hunting | 0 (0.0%) | 16 (100.0%) |
| Mining, Quarrying, & Extraction | 0 (0.0%) | 0 (0.0%) |
| Construction | 309 (100.0%) | 0 (0.0%) |
| Manufacturing | 287 (71.0%) | 117 (29.0%) |
| Wholesale Trade | 364 (83.7%) | 71 (16.3%) |
| Retail Trade | 235 (33.8%) | 461 (66.2%) |
| Transportation & Warehousing | 196 (60.5%) | 128 (39.5%) |
| Utilities | 9 (100.0%) | 0 (0.0%) |
| Information | 192 (85.7%) | 32 (14.3%) |
| Finance & Insurance | 147 (58.3%) | 105 (41.7%) |
| Real Estate, Rental & Leasing | 14 (23.3%) | 46 (76.7%) |
| Professional & Scientific | 148 (59.7%) | 100 (40.3%) |
| Enterprise Management | 4 (100.0%) | 0 (0.0%) |
| Administrative & Support | 69 (86.3%) | 11 (13.8%) |
| Educational Services | 108 (24.5%) | 332 (75.4%) |
| Health Care & Social Assistance | 247 (18.9%) | 1,061 (81.1%) |
| Arts, Entertainment & Recreation | 174 (77.7%) | 50 (22.3%) |
| Accommodation & Food Services | 155 (42.9%) | 206 (57.1%) |
| Public Administration | 124 (56.4%) | 96 (43.6%) |
| Total | 2,882 (50.3%) | 2,845 (49.7%) |
Education in Scotchtown
School Enrollment in Scotchtown
The most common levels of schooling among the 2,928 students in Scotchtown are college / undergraduate (1,103 | 37.7%), high school (636 | 21.7%), and middle school (527 | 18.0%).
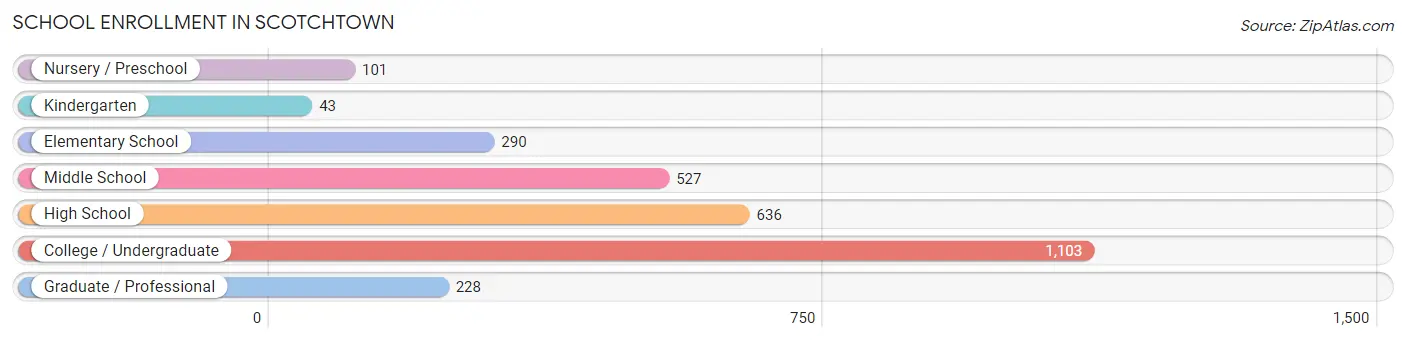
| School Level | # Students | % Students |
| Nursery / Preschool | 101 | 3.5% |
| Kindergarten | 43 | 1.5% |
| Elementary School | 290 | 9.9% |
| Middle School | 527 | 18.0% |
| High School | 636 | 21.7% |
| College / Undergraduate | 1,103 | 37.7% |
| Graduate / Professional | 228 | 7.8% |
| Total | 2,928 | 100.0% |
School Enrollment by Age by Funding Source in Scotchtown
Out of a total of 2,928 students who are enrolled in schools in Scotchtown, 615 (21.0%) attend a private institution, while the remaining 2,313 (79.0%) are enrolled in public schools. The age group of 25 to 34 year olds has the highest likelihood of being enrolled in private schools, with 160 (39.4% in the age bracket) enrolled. Conversely, the age group of 18 to 19 year olds has the lowest likelihood of being enrolled in a private school, with 231 (100.0% in the age bracket) attending a public institution.
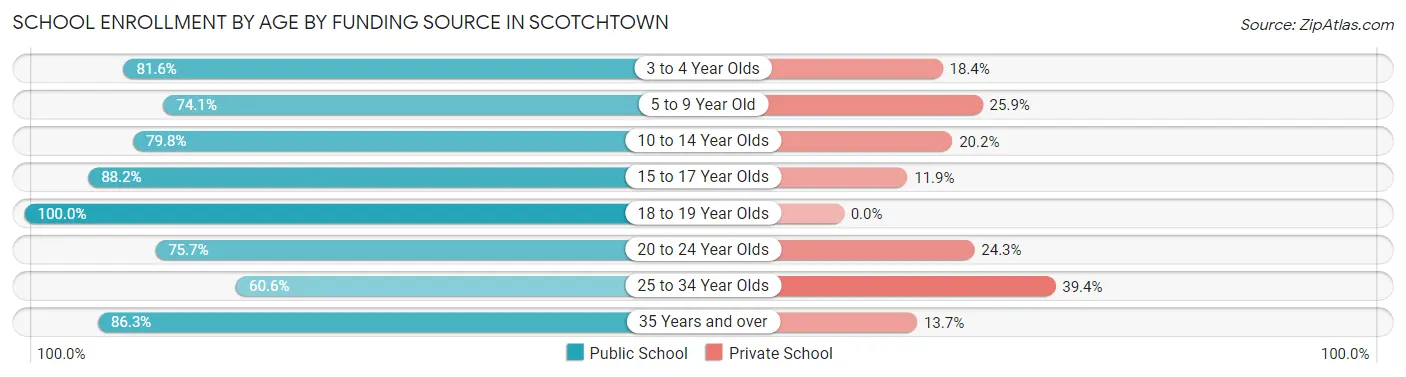
| Age Bracket | Public School | Private School |
| 3 to 4 Year Olds | 62 (81.6%) | 14 (18.4%) |
| 5 to 9 Year Old | 249 (74.1%) | 87 (25.9%) |
| 10 to 14 Year Olds | 501 (79.8%) | 127 (20.2%) |
| 15 to 17 Year Olds | 409 (88.1%) | 55 (11.8%) |
| 18 to 19 Year Olds | 231 (100.0%) | 0 (0.0%) |
| 20 to 24 Year Olds | 457 (75.7%) | 147 (24.3%) |
| 25 to 34 Year Olds | 246 (60.6%) | 160 (39.4%) |
| 35 Years and over | 158 (86.3%) | 25 (13.7%) |
| Total | 2,313 (79.0%) | 615 (21.0%) |
Educational Attainment by Field of Study in Scotchtown
Business (397 | 19.0%), science & technology (346 | 16.6%), visual & performing arts (181 | 8.7%), education (173 | 8.3%), and computers & mathematics (154 | 7.4%) are the most common fields of study among 2,086 individuals in Scotchtown who have obtained a bachelor's degree or higher.
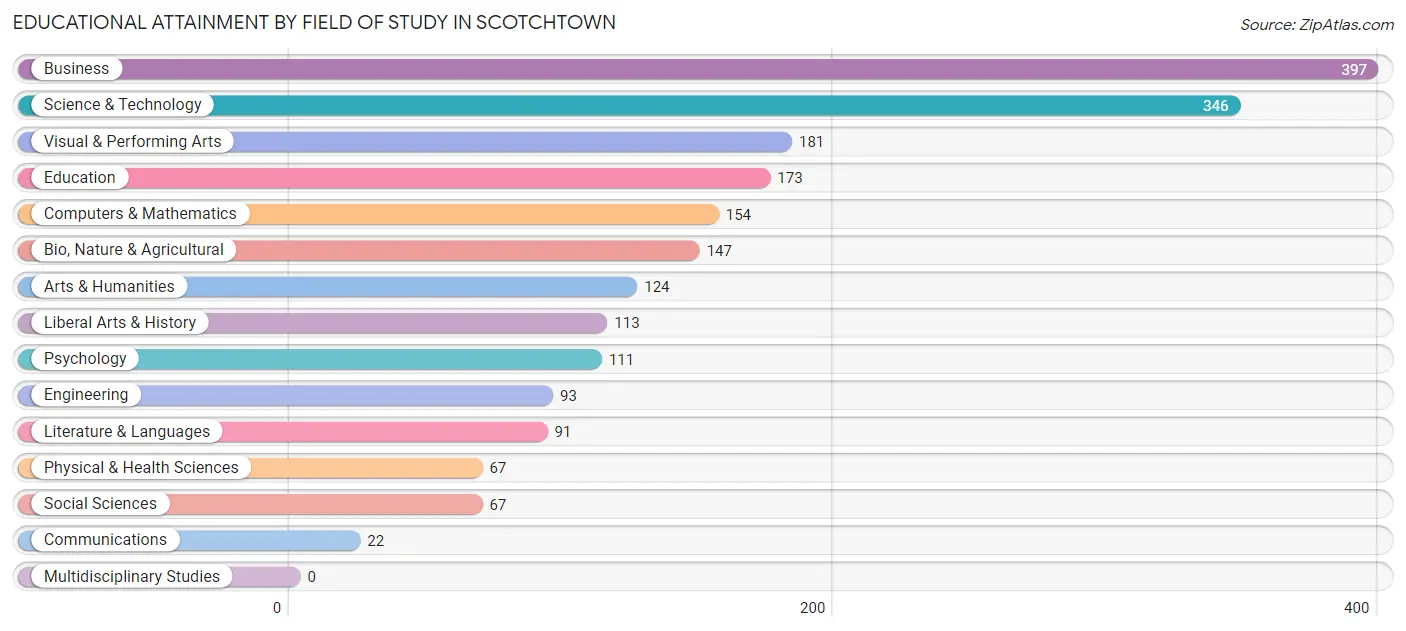
| Field of Study | # Graduates | % Graduates |
| Computers & Mathematics | 154 | 7.4% |
| Bio, Nature & Agricultural | 147 | 7.0% |
| Physical & Health Sciences | 67 | 3.2% |
| Psychology | 111 | 5.3% |
| Social Sciences | 67 | 3.2% |
| Engineering | 93 | 4.5% |
| Multidisciplinary Studies | 0 | 0.0% |
| Science & Technology | 346 | 16.6% |
| Business | 397 | 19.0% |
| Education | 173 | 8.3% |
| Literature & Languages | 91 | 4.4% |
| Liberal Arts & History | 113 | 5.4% |
| Visual & Performing Arts | 181 | 8.7% |
| Communications | 22 | 1.1% |
| Arts & Humanities | 124 | 5.9% |
| Total | 2,086 | 100.0% |
Transportation & Commute in Scotchtown
Vehicle Availability by Sex in Scotchtown
The most prevalent vehicle ownership categories in Scotchtown are males with 2 vehicles (1,020, accounting for 35.3%) and females with 2 vehicles (1,048, making up 36.6%).
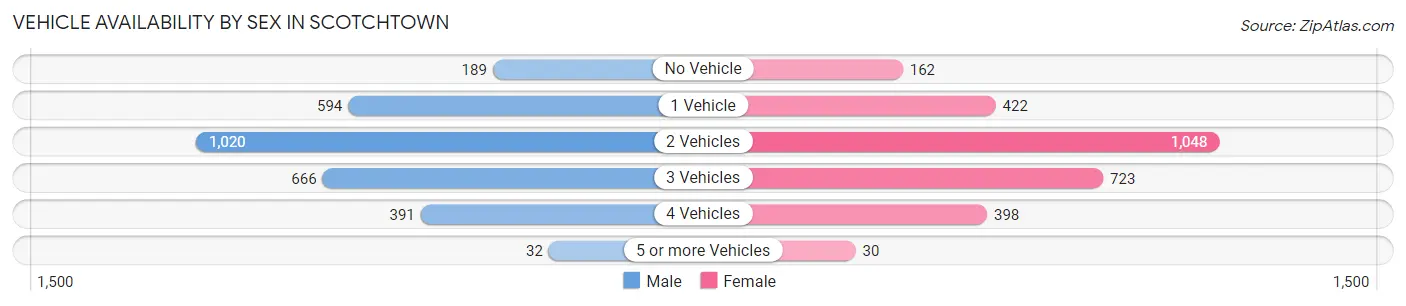
| Vehicles Available | Male | Female |
| No Vehicle | 189 (6.5%) | 162 (5.8%) |
| 1 Vehicle | 594 (20.5%) | 422 (15.2%) |
| 2 Vehicles | 1,020 (35.3%) | 1,048 (37.7%) |
| 3 Vehicles | 666 (23.0%) | 723 (26.0%) |
| 4 Vehicles | 391 (13.5%) | 398 (14.3%) |
| 5 or more Vehicles | 32 (1.1%) | 30 (1.1%) |
| Total | 2,892 (100.0%) | 2,783 (100.0%) |
Commute Time in Scotchtown
The most frequently occuring commute durations in Scotchtown are 10 to 14 minutes (1,048 commuters, 19.9%), 5 to 9 minutes (1,043 commuters, 19.8%), and 15 to 19 minutes (747 commuters, 14.2%).
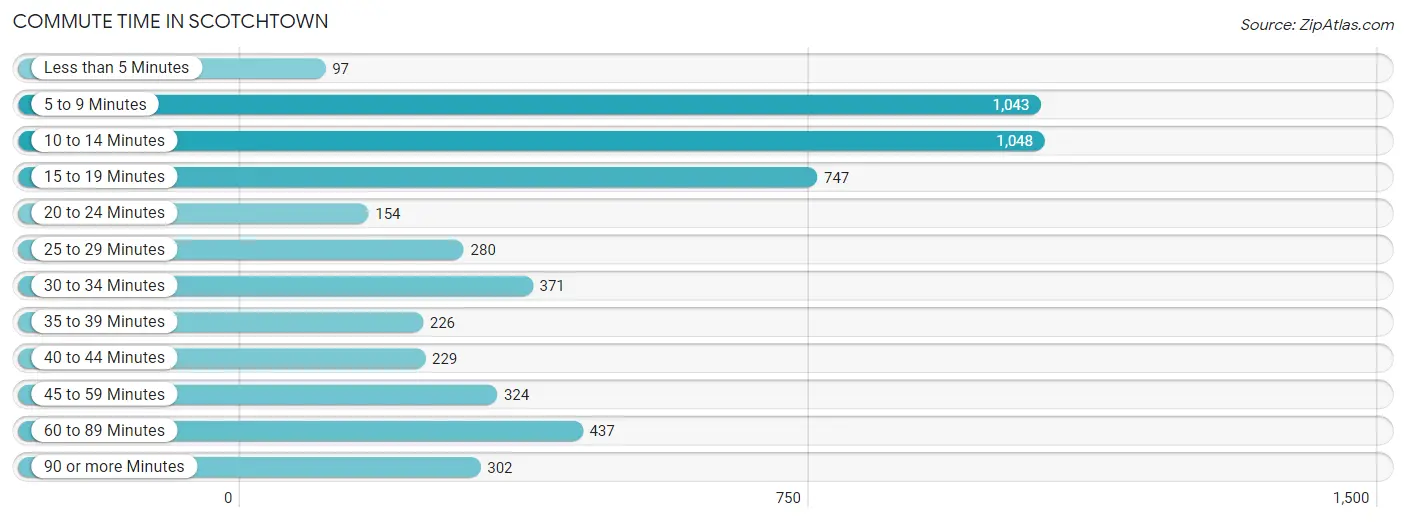
| Commute Time | # Commuters | % Commuters |
| Less than 5 Minutes | 97 | 1.8% |
| 5 to 9 Minutes | 1,043 | 19.8% |
| 10 to 14 Minutes | 1,048 | 19.9% |
| 15 to 19 Minutes | 747 | 14.2% |
| 20 to 24 Minutes | 154 | 2.9% |
| 25 to 29 Minutes | 280 | 5.3% |
| 30 to 34 Minutes | 371 | 7.1% |
| 35 to 39 Minutes | 226 | 4.3% |
| 40 to 44 Minutes | 229 | 4.4% |
| 45 to 59 Minutes | 324 | 6.2% |
| 60 to 89 Minutes | 437 | 8.3% |
| 90 or more Minutes | 302 | 5.7% |
Commute Time by Sex in Scotchtown
The most common commute times in Scotchtown are 10 to 14 minutes (661 commuters, 23.9%) for males and 5 to 9 minutes (717 commuters, 28.8%) for females.
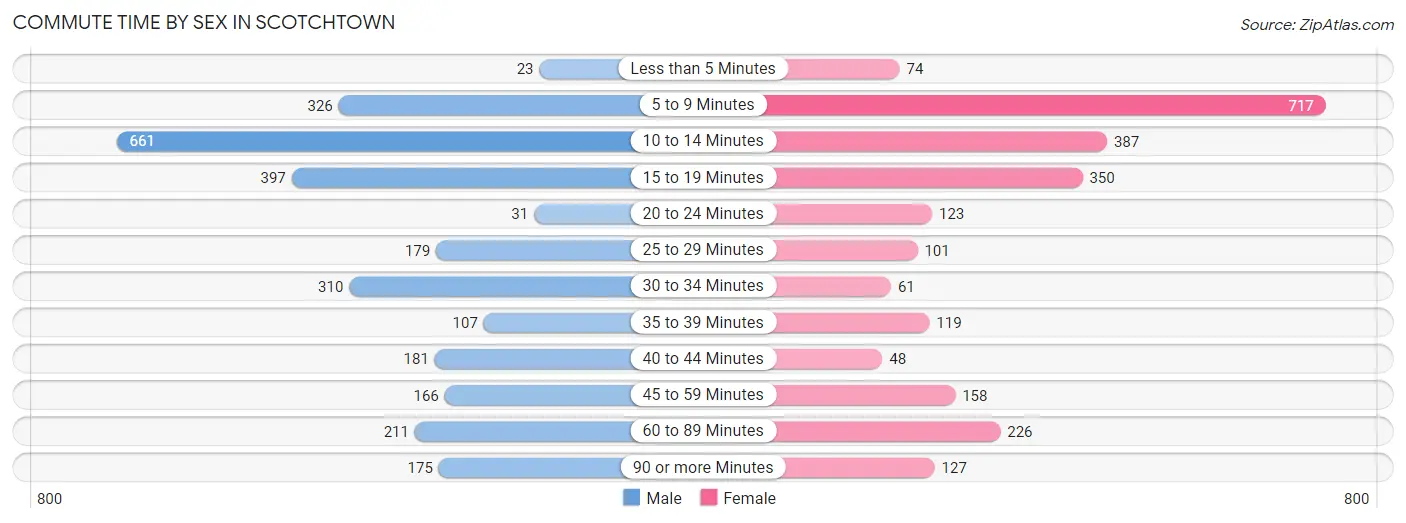
| Commute Time | Male | Female |
| Less than 5 Minutes | 23 (0.8%) | 74 (3.0%) |
| 5 to 9 Minutes | 326 (11.8%) | 717 (28.8%) |
| 10 to 14 Minutes | 661 (23.9%) | 387 (15.5%) |
| 15 to 19 Minutes | 397 (14.3%) | 350 (14.1%) |
| 20 to 24 Minutes | 31 (1.1%) | 123 (4.9%) |
| 25 to 29 Minutes | 179 (6.5%) | 101 (4.1%) |
| 30 to 34 Minutes | 310 (11.2%) | 61 (2.5%) |
| 35 to 39 Minutes | 107 (3.9%) | 119 (4.8%) |
| 40 to 44 Minutes | 181 (6.5%) | 48 (1.9%) |
| 45 to 59 Minutes | 166 (6.0%) | 158 (6.3%) |
| 60 to 89 Minutes | 211 (7.6%) | 226 (9.1%) |
| 90 or more Minutes | 175 (6.3%) | 127 (5.1%) |
Time of Departure to Work by Sex in Scotchtown
The most frequent times of departure to work in Scotchtown are 4:00 PM to 11:59 PM (433, 15.7%) for males and 6:30 AM to 6:59 AM (477, 19.2%) for females.
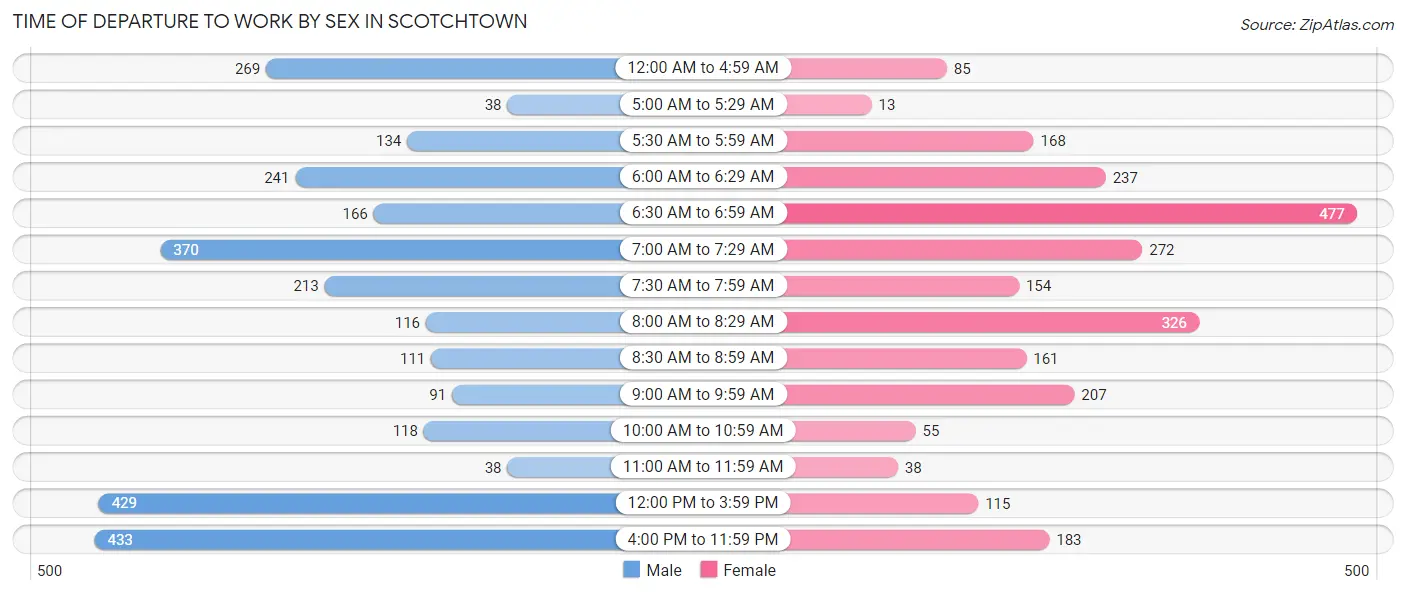
| Time of Departure | Male | Female |
| 12:00 AM to 4:59 AM | 269 (9.7%) | 85 (3.4%) |
| 5:00 AM to 5:29 AM | 38 (1.4%) | 13 (0.5%) |
| 5:30 AM to 5:59 AM | 134 (4.8%) | 168 (6.7%) |
| 6:00 AM to 6:29 AM | 241 (8.7%) | 237 (9.5%) |
| 6:30 AM to 6:59 AM | 166 (6.0%) | 477 (19.2%) |
| 7:00 AM to 7:29 AM | 370 (13.4%) | 272 (10.9%) |
| 7:30 AM to 7:59 AM | 213 (7.7%) | 154 (6.2%) |
| 8:00 AM to 8:29 AM | 116 (4.2%) | 326 (13.1%) |
| 8:30 AM to 8:59 AM | 111 (4.0%) | 161 (6.5%) |
| 9:00 AM to 9:59 AM | 91 (3.3%) | 207 (8.3%) |
| 10:00 AM to 10:59 AM | 118 (4.3%) | 55 (2.2%) |
| 11:00 AM to 11:59 AM | 38 (1.4%) | 38 (1.5%) |
| 12:00 PM to 3:59 PM | 429 (15.5%) | 115 (4.6%) |
| 4:00 PM to 11:59 PM | 433 (15.7%) | 183 (7.3%) |
| Total | 2,767 (100.0%) | 2,491 (100.0%) |
Housing Occupancy in Scotchtown
Occupancy by Ownership in Scotchtown
Of the total 3,957 dwellings in Scotchtown, owner-occupied units account for 2,061 (52.1%), while renter-occupied units make up 1,896 (47.9%).
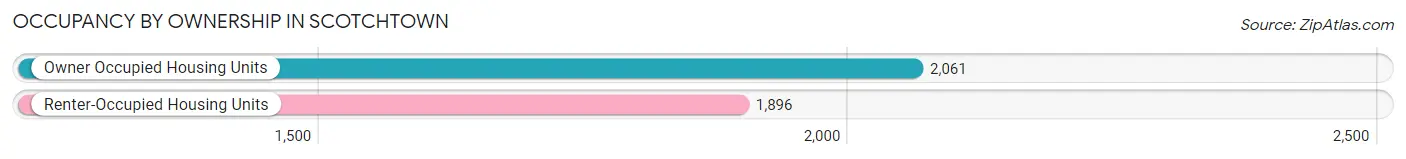
| Occupancy | # Housing Units | % Housing Units |
| Owner Occupied Housing Units | 2,061 | 52.1% |
| Renter-Occupied Housing Units | 1,896 | 47.9% |
| Total Occupied Housing Units | 3,957 | 100.0% |
Occupancy by Household Size in Scotchtown
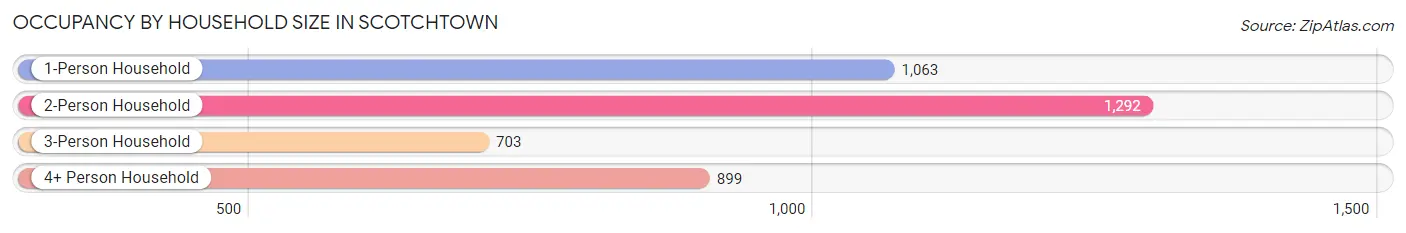
| Household Size | # Housing Units | % Housing Units |
| 1-Person Household | 1,063 | 26.9% |
| 2-Person Household | 1,292 | 32.7% |
| 3-Person Household | 703 | 17.8% |
| 4+ Person Household | 899 | 22.7% |
| Total Housing Units | 3,957 | 100.0% |
Occupancy by Ownership by Household Size in Scotchtown
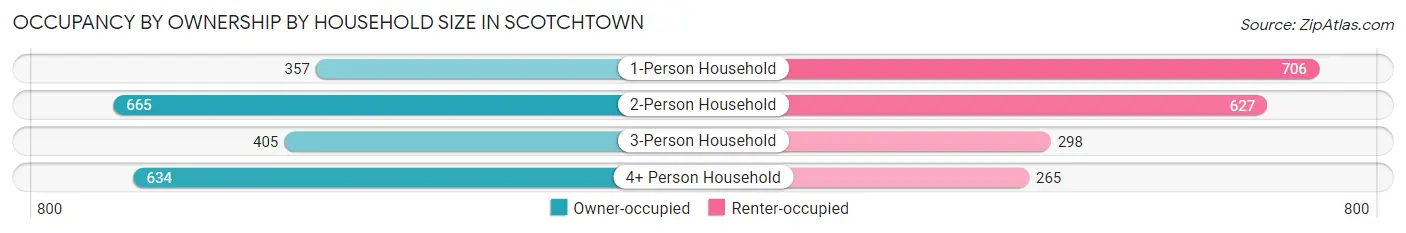
| Household Size | Owner-occupied | Renter-occupied |
| 1-Person Household | 357 (33.6%) | 706 (66.4%) |
| 2-Person Household | 665 (51.5%) | 627 (48.5%) |
| 3-Person Household | 405 (57.6%) | 298 (42.4%) |
| 4+ Person Household | 634 (70.5%) | 265 (29.5%) |
| Total Housing Units | 2,061 (52.1%) | 1,896 (47.9%) |
Occupancy by Educational Attainment in Scotchtown
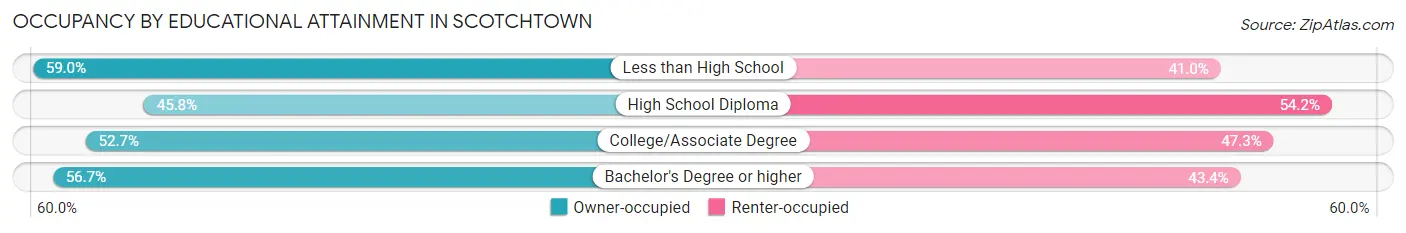
| Household Size | Owner-occupied | Renter-occupied |
| Less than High School | 108 (59.0%) | 75 (41.0%) |
| High School Diploma | 552 (45.8%) | 653 (54.2%) |
| College/Associate Degree | 732 (52.7%) | 656 (47.3%) |
| Bachelor's Degree or higher | 669 (56.7%) | 512 (43.3%) |
Occupancy by Age of Householder in Scotchtown
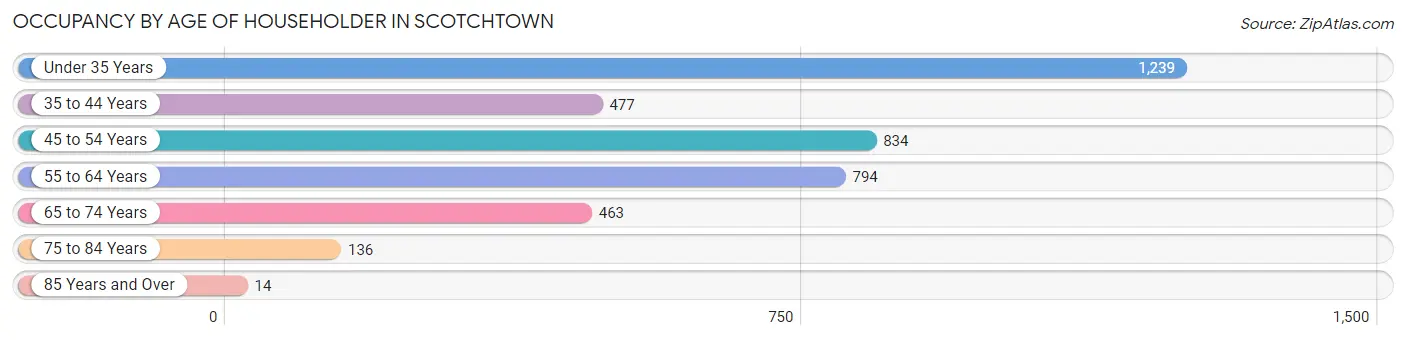
| Age Bracket | # Households | % Households |
| Under 35 Years | 1,239 | 31.3% |
| 35 to 44 Years | 477 | 12.0% |
| 45 to 54 Years | 834 | 21.1% |
| 55 to 64 Years | 794 | 20.1% |
| 65 to 74 Years | 463 | 11.7% |
| 75 to 84 Years | 136 | 3.4% |
| 85 Years and Over | 14 | 0.4% |
| Total | 3,957 | 100.0% |
Housing Finances in Scotchtown
Median Income by Occupancy in Scotchtown
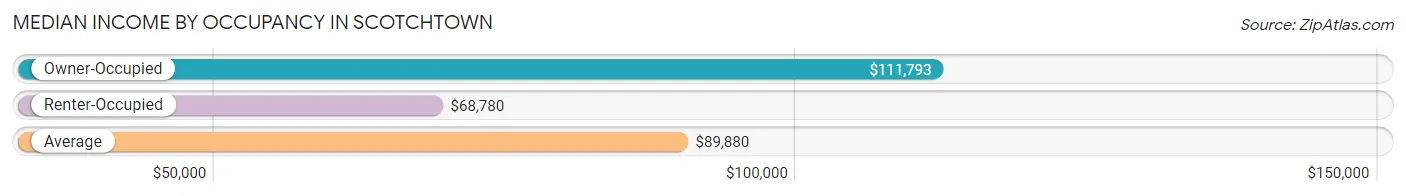
| Occupancy Type | # Households | Median Income |
| Owner-Occupied | 2,061 (52.1%) | $111,793 |
| Renter-Occupied | 1,896 (47.9%) | $68,780 |
| Average | 3,957 (100.0%) | $89,880 |
Occupancy by Householder Income Bracket in Scotchtown
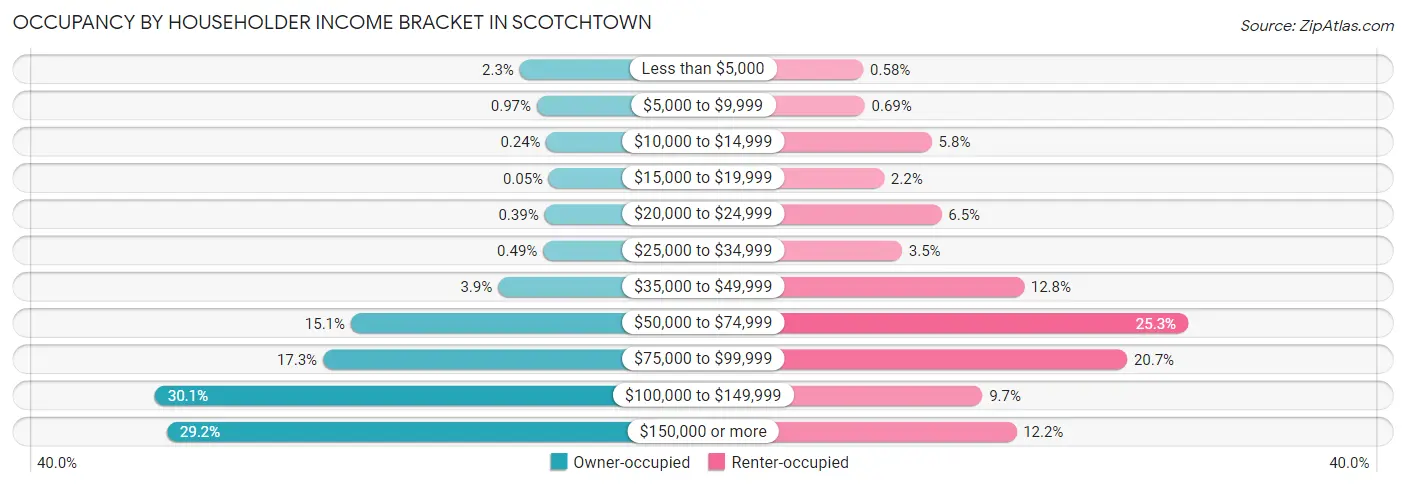
| Income Bracket | Owner-occupied | Renter-occupied |
| Less than $5,000 | 47 (2.3%) | 11 (0.6%) |
| $5,000 to $9,999 | 20 (1.0%) | 13 (0.7%) |
| $10,000 to $14,999 | 5 (0.2%) | 110 (5.8%) |
| $15,000 to $19,999 | 1 (0.1%) | 41 (2.2%) |
| $20,000 to $24,999 | 8 (0.4%) | 124 (6.5%) |
| $25,000 to $34,999 | 10 (0.5%) | 67 (3.5%) |
| $35,000 to $49,999 | 81 (3.9%) | 243 (12.8%) |
| $50,000 to $74,999 | 312 (15.1%) | 480 (25.3%) |
| $75,000 to $99,999 | 356 (17.3%) | 392 (20.7%) |
| $100,000 to $149,999 | 620 (30.1%) | 183 (9.7%) |
| $150,000 or more | 601 (29.2%) | 232 (12.2%) |
| Total | 2,061 (100.0%) | 1,896 (100.0%) |
Monthly Housing Cost Tiers in Scotchtown
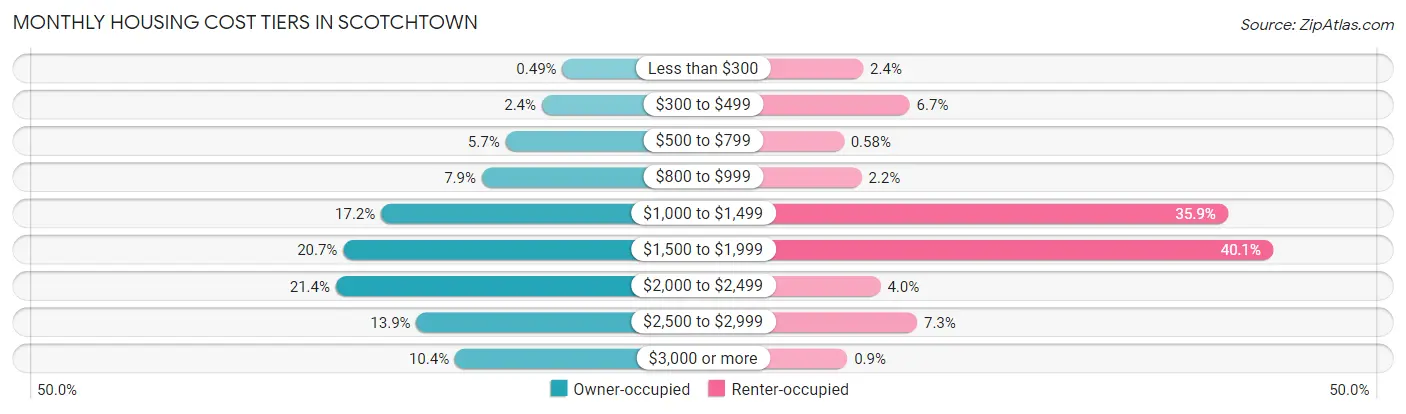
| Monthly Cost | Owner-occupied | Renter-occupied |
| Less than $300 | 10 (0.5%) | 45 (2.4%) |
| $300 to $499 | 49 (2.4%) | 126 (6.7%) |
| $500 to $799 | 118 (5.7%) | 11 (0.6%) |
| $800 to $999 | 163 (7.9%) | 42 (2.2%) |
| $1,000 to $1,499 | 354 (17.2%) | 681 (35.9%) |
| $1,500 to $1,999 | 426 (20.7%) | 760 (40.1%) |
| $2,000 to $2,499 | 440 (21.3%) | 75 (4.0%) |
| $2,500 to $2,999 | 287 (13.9%) | 139 (7.3%) |
| $3,000 or more | 214 (10.4%) | 17 (0.9%) |
| Total | 2,061 (100.0%) | 1,896 (100.0%) |
Physical Housing Characteristics in Scotchtown
Housing Structures in Scotchtown
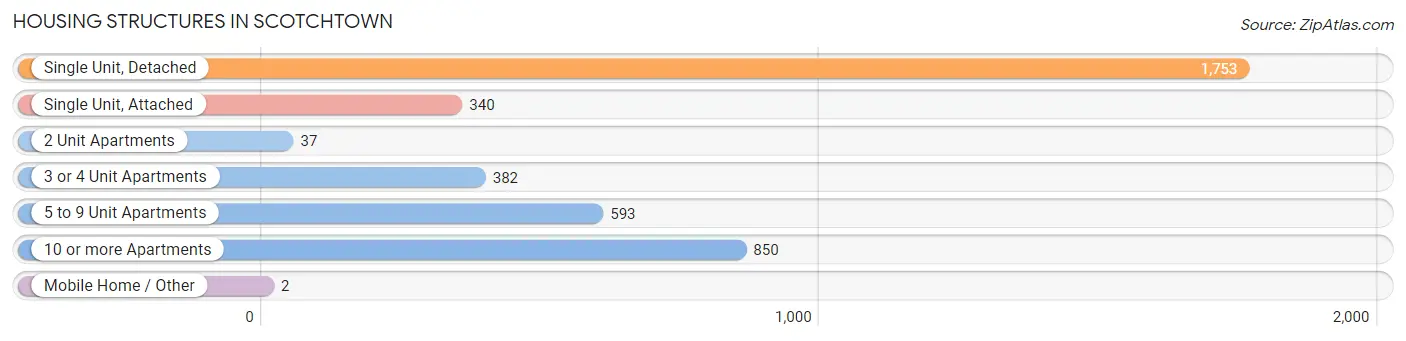
| Structure Type | # Housing Units | % Housing Units |
| Single Unit, Detached | 1,753 | 44.3% |
| Single Unit, Attached | 340 | 8.6% |
| 2 Unit Apartments | 37 | 0.9% |
| 3 or 4 Unit Apartments | 382 | 9.7% |
| 5 to 9 Unit Apartments | 593 | 15.0% |
| 10 or more Apartments | 850 | 21.5% |
| Mobile Home / Other | 2 | 0.1% |
| Total | 3,957 | 100.0% |
Housing Structures by Occupancy in Scotchtown
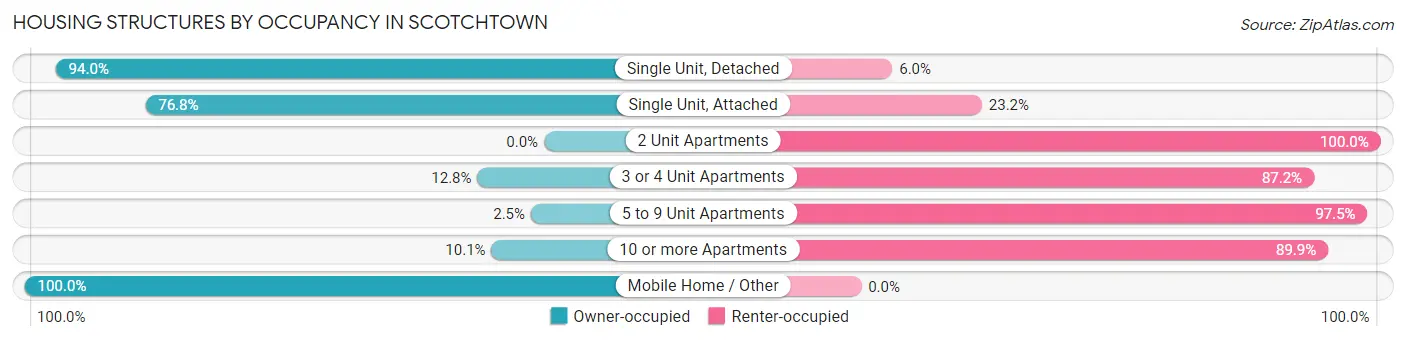
| Structure Type | Owner-occupied | Renter-occupied |
| Single Unit, Detached | 1,648 (94.0%) | 105 (6.0%) |
| Single Unit, Attached | 261 (76.8%) | 79 (23.2%) |
| 2 Unit Apartments | 0 (0.0%) | 37 (100.0%) |
| 3 or 4 Unit Apartments | 49 (12.8%) | 333 (87.2%) |
| 5 to 9 Unit Apartments | 15 (2.5%) | 578 (97.5%) |
| 10 or more Apartments | 86 (10.1%) | 764 (89.9%) |
| Mobile Home / Other | 2 (100.0%) | 0 (0.0%) |
| Total | 2,061 (52.1%) | 1,896 (47.9%) |
Housing Structures by Number of Rooms in Scotchtown
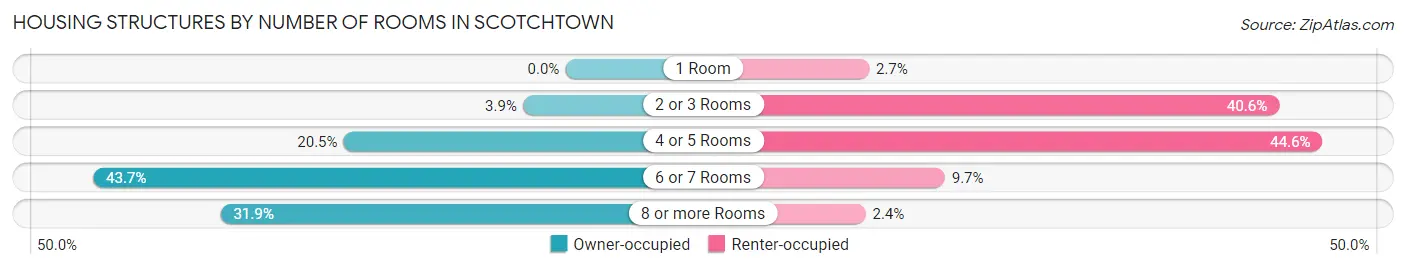
| Number of Rooms | Owner-occupied | Renter-occupied |
| 1 Room | 0 (0.0%) | 51 (2.7%) |
| 2 or 3 Rooms | 81 (3.9%) | 770 (40.6%) |
| 4 or 5 Rooms | 423 (20.5%) | 846 (44.6%) |
| 6 or 7 Rooms | 900 (43.7%) | 184 (9.7%) |
| 8 or more Rooms | 657 (31.9%) | 45 (2.4%) |
| Total | 2,061 (100.0%) | 1,896 (100.0%) |
Housing Structure by Heating Type in Scotchtown
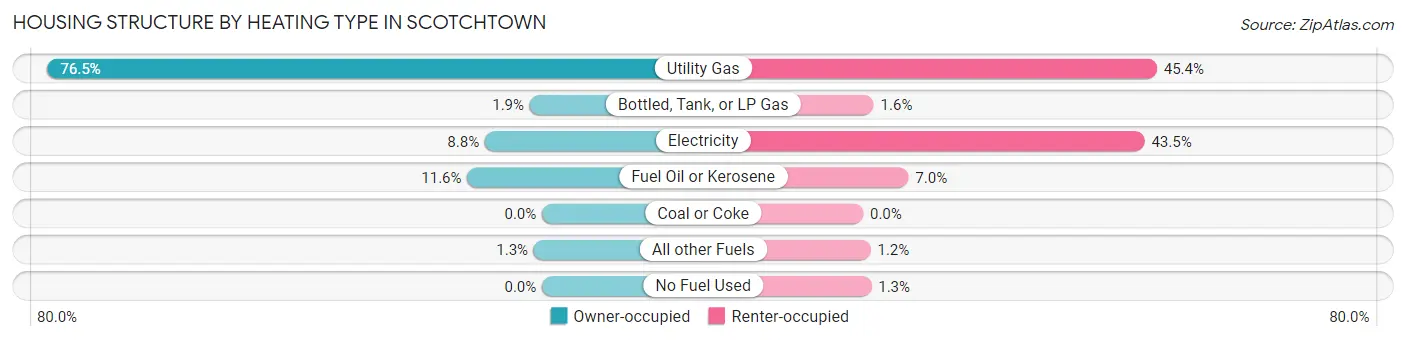
| Heating Type | Owner-occupied | Renter-occupied |
| Utility Gas | 1,576 (76.5%) | 861 (45.4%) |
| Bottled, Tank, or LP Gas | 39 (1.9%) | 31 (1.6%) |
| Electricity | 182 (8.8%) | 825 (43.5%) |
| Fuel Oil or Kerosene | 238 (11.6%) | 133 (7.0%) |
| Coal or Coke | 0 (0.0%) | 0 (0.0%) |
| All other Fuels | 26 (1.3%) | 22 (1.2%) |
| No Fuel Used | 0 (0.0%) | 24 (1.3%) |
| Total | 2,061 (100.0%) | 1,896 (100.0%) |
Household Vehicle Usage in Scotchtown
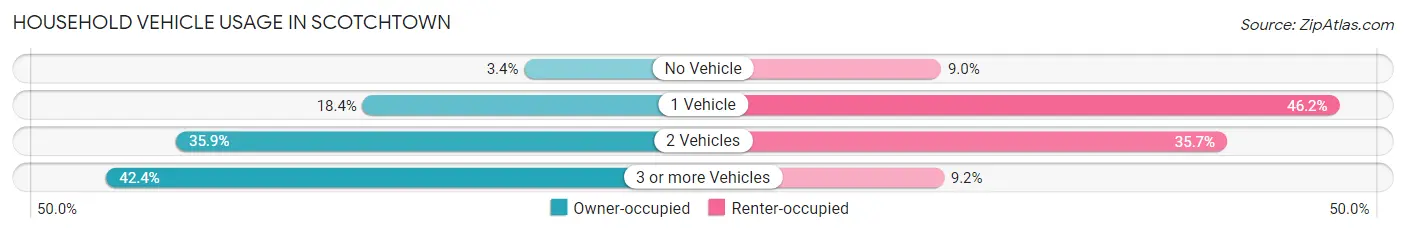
| Vehicles per Household | Owner-occupied | Renter-occupied |
| No Vehicle | 69 (3.4%) | 170 (9.0%) |
| 1 Vehicle | 380 (18.4%) | 875 (46.2%) |
| 2 Vehicles | 739 (35.9%) | 676 (35.6%) |
| 3 or more Vehicles | 873 (42.4%) | 175 (9.2%) |
| Total | 2,061 (100.0%) | 1,896 (100.0%) |
Real Estate & Mortgages in Scotchtown
Real Estate and Mortgage Overview in Scotchtown
| Characteristic | Without Mortgage | With Mortgage |
| Housing Units | 516 | 1,545 |
| Median Property Value | $270,500 | $281,700 |
| Median Household Income | $88,882 | $505 |
| Monthly Housing Costs | $894 | $214 |
| Real Estate Taxes | $5,563 | $0 |
Property Value by Mortgage Status in Scotchtown
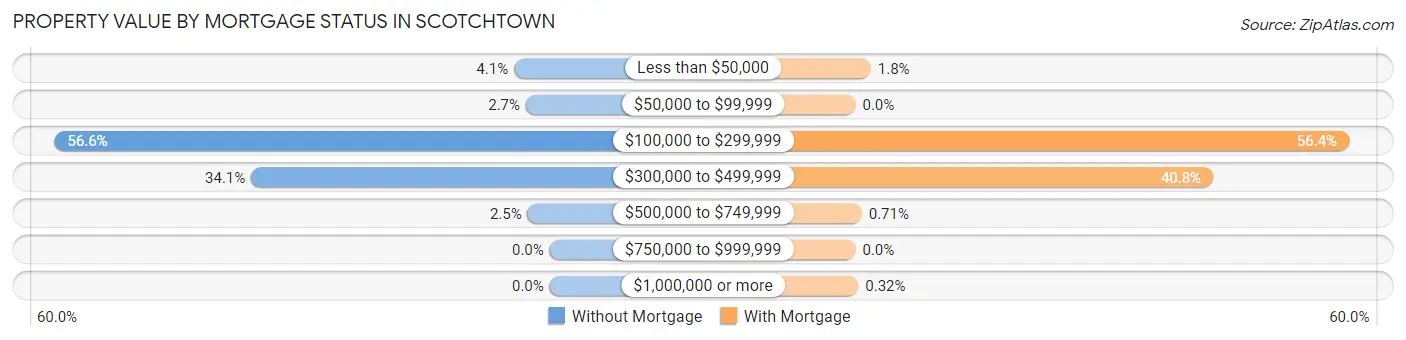
| Property Value | Without Mortgage | With Mortgage |
| Less than $50,000 | 21 (4.1%) | 27 (1.8%) |
| $50,000 to $99,999 | 14 (2.7%) | 0 (0.0%) |
| $100,000 to $299,999 | 292 (56.6%) | 871 (56.4%) |
| $300,000 to $499,999 | 176 (34.1%) | 631 (40.8%) |
| $500,000 to $749,999 | 13 (2.5%) | 11 (0.7%) |
| $750,000 to $999,999 | 0 (0.0%) | 0 (0.0%) |
| $1,000,000 or more | 0 (0.0%) | 5 (0.3%) |
| Total | 516 (100.0%) | 1,545 (100.0%) |
Household Income by Mortgage Status in Scotchtown
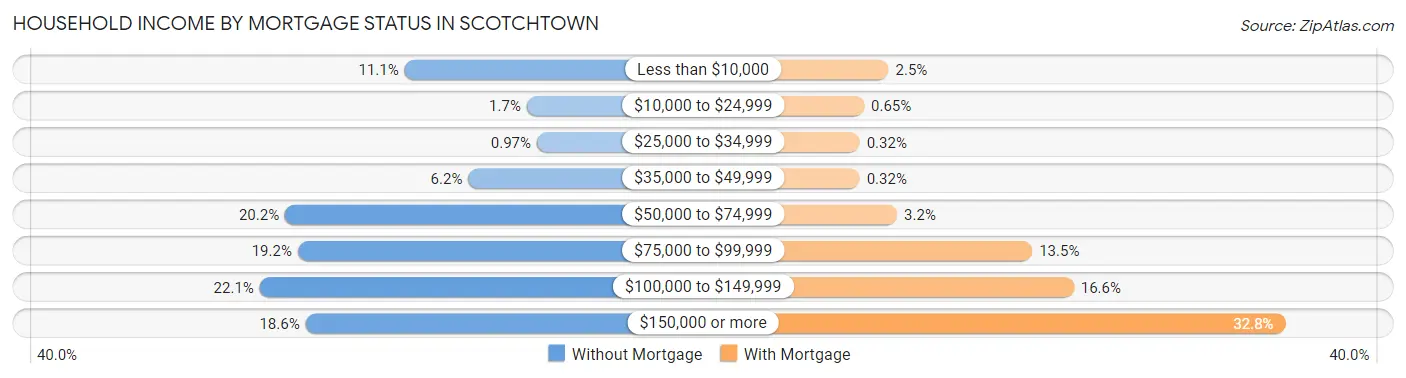
| Household Income | Without Mortgage | With Mortgage |
| Less than $10,000 | 57 (11.1%) | 39 (2.5%) |
| $10,000 to $24,999 | 9 (1.7%) | 10 (0.6%) |
| $25,000 to $34,999 | 5 (1.0%) | 5 (0.3%) |
| $35,000 to $49,999 | 32 (6.2%) | 5 (0.3%) |
| $50,000 to $74,999 | 104 (20.2%) | 49 (3.2%) |
| $75,000 to $99,999 | 99 (19.2%) | 208 (13.5%) |
| $100,000 to $149,999 | 114 (22.1%) | 257 (16.6%) |
| $150,000 or more | 96 (18.6%) | 506 (32.8%) |
| Total | 516 (100.0%) | 1,545 (100.0%) |
Property Value to Household Income Ratio in Scotchtown
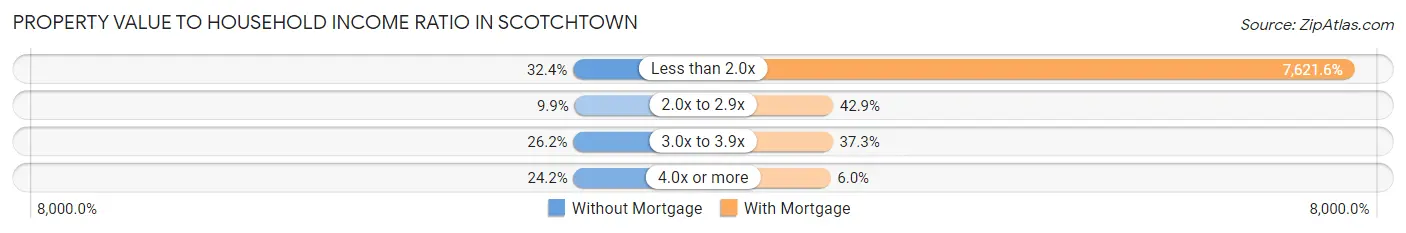
| Value-to-Income Ratio | Without Mortgage | With Mortgage |
| Less than 2.0x | 167 (32.4%) | 117,753 (7,621.6%) |
| 2.0x to 2.9x | 51 (9.9%) | 663 (42.9%) |
| 3.0x to 3.9x | 135 (26.2%) | 576 (37.3%) |
| 4.0x or more | 125 (24.2%) | 92 (5.9%) |
| Total | 516 (100.0%) | 1,545 (100.0%) |
Real Estate Taxes by Mortgage Status in Scotchtown
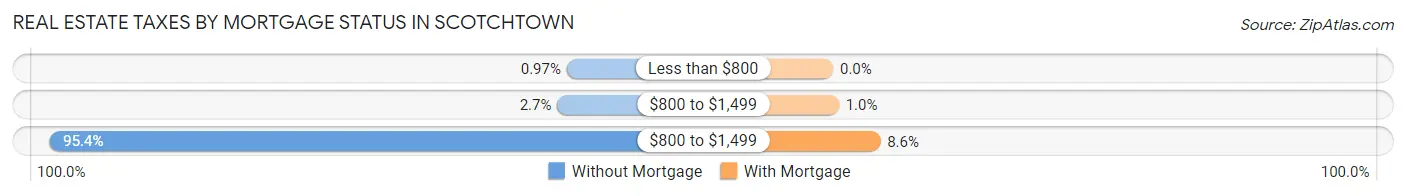
| Property Taxes | Without Mortgage | With Mortgage |
| Less than $800 | 5 (1.0%) | 0 (0.0%) |
| $800 to $1,499 | 14 (2.7%) | 16 (1.0%) |
| $800 to $1,499 | 492 (95.4%) | 133 (8.6%) |
| Total | 516 (100.0%) | 1,545 (100.0%) |
Health & Disability in Scotchtown
Health Insurance Coverage by Age in Scotchtown
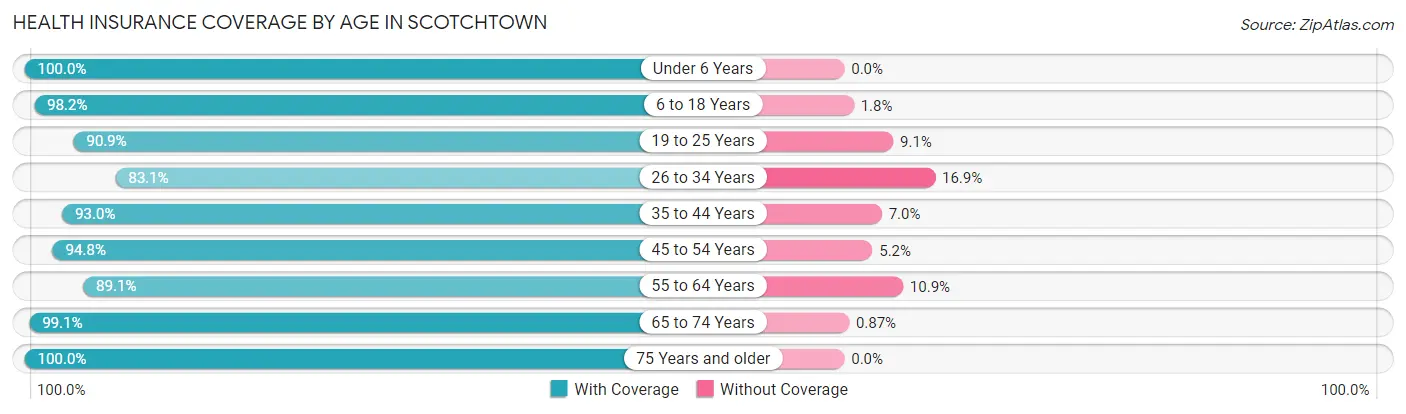
| Age Bracket | With Coverage | Without Coverage |
| Under 6 Years | 517 (100.0%) | 0 (0.0%) |
| 6 to 18 Years | 1,503 (98.2%) | 27 (1.8%) |
| 19 to 25 Years | 1,319 (90.9%) | 132 (9.1%) |
| 26 to 34 Years | 1,404 (83.1%) | 286 (16.9%) |
| 35 to 44 Years | 1,053 (93.0%) | 79 (7.0%) |
| 45 to 54 Years | 1,470 (94.8%) | 81 (5.2%) |
| 55 to 64 Years | 1,141 (89.1%) | 140 (10.9%) |
| 65 to 74 Years | 801 (99.1%) | 7 (0.9%) |
| 75 Years and older | 376 (100.0%) | 0 (0.0%) |
| Total | 9,584 (92.7%) | 752 (7.3%) |
Health Insurance Coverage by Citizenship Status in Scotchtown
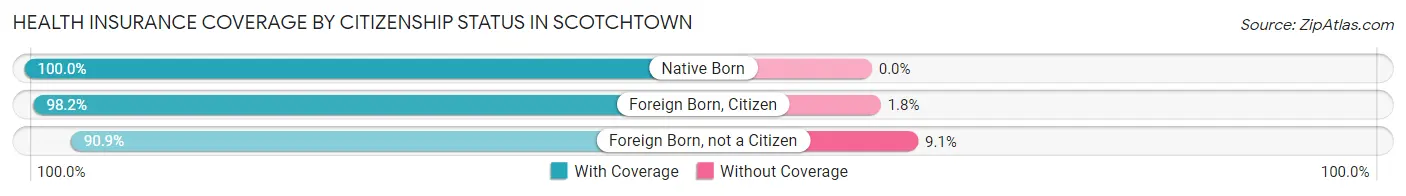
| Citizenship Status | With Coverage | Without Coverage |
| Native Born | 517 (100.0%) | 0 (0.0%) |
| Foreign Born, Citizen | 1,503 (98.2%) | 27 (1.8%) |
| Foreign Born, not a Citizen | 1,319 (90.9%) | 132 (9.1%) |
Health Insurance Coverage by Household Income in Scotchtown
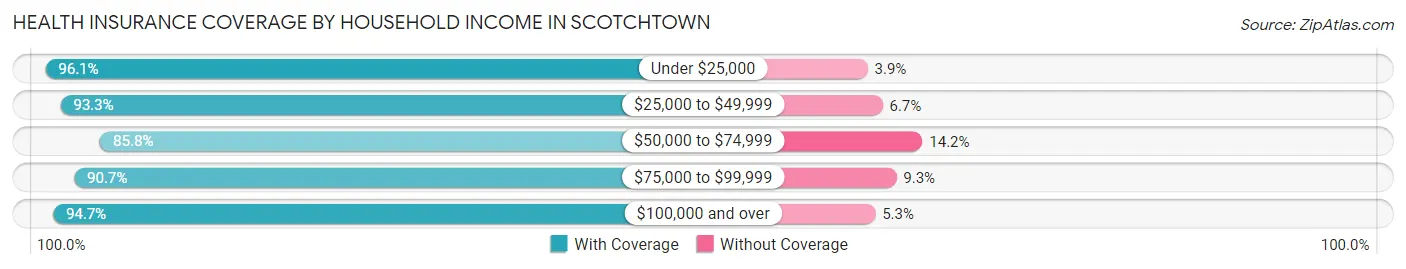
| Household Income | With Coverage | Without Coverage |
| Under $25,000 | 789 (96.1%) | 32 (3.9%) |
| $25,000 to $49,999 | 656 (93.3%) | 47 (6.7%) |
| $50,000 to $74,999 | 1,382 (85.8%) | 228 (14.2%) |
| $75,000 to $99,999 | 1,486 (90.7%) | 152 (9.3%) |
| $100,000 and over | 5,217 (94.7%) | 293 (5.3%) |
Public vs Private Health Insurance Coverage by Age in Scotchtown
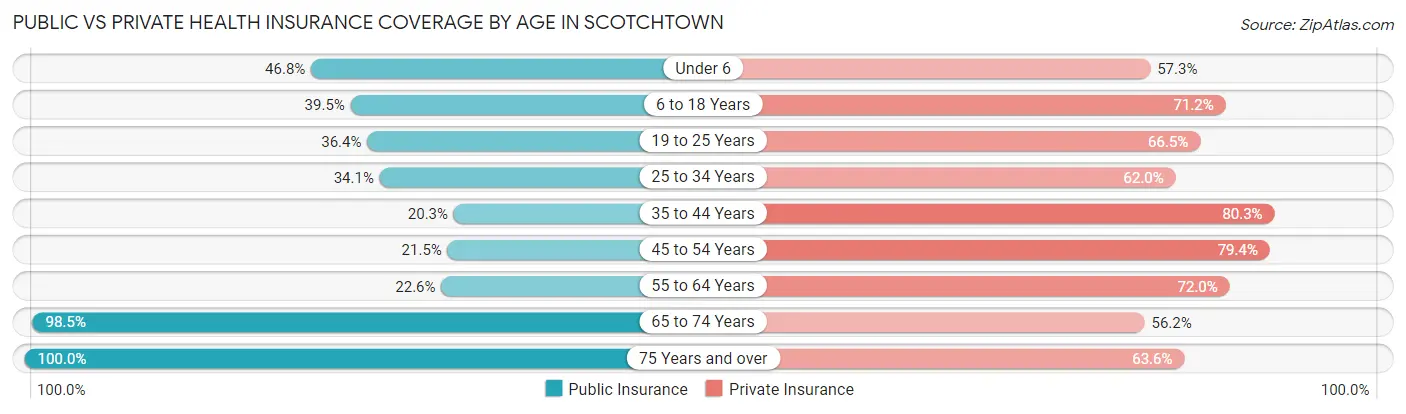
| Age Bracket | Public Insurance | Private Insurance |
| Under 6 | 242 (46.8%) | 296 (57.3%) |
| 6 to 18 Years | 604 (39.5%) | 1,090 (71.2%) |
| 19 to 25 Years | 528 (36.4%) | 965 (66.5%) |
| 25 to 34 Years | 576 (34.1%) | 1,047 (62.0%) |
| 35 to 44 Years | 230 (20.3%) | 909 (80.3%) |
| 45 to 54 Years | 333 (21.5%) | 1,232 (79.4%) |
| 55 to 64 Years | 290 (22.6%) | 922 (72.0%) |
| 65 to 74 Years | 796 (98.5%) | 454 (56.2%) |
| 75 Years and over | 376 (100.0%) | 239 (63.6%) |
| Total | 3,975 (38.5%) | 7,154 (69.2%) |
Disability Status by Sex by Age in Scotchtown
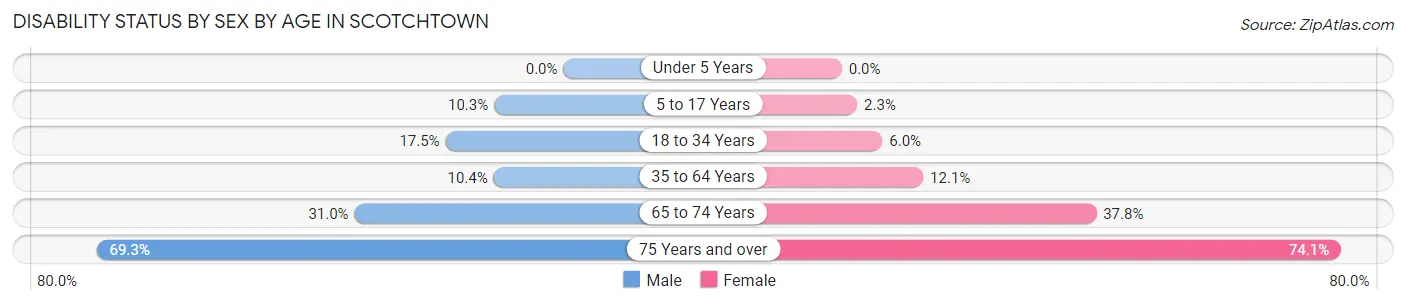
| Age Bracket | Male | Female |
| Under 5 Years | 0 (0.0%) | 0 (0.0%) |
| 5 to 17 Years | 82 (10.3%) | 15 (2.3%) |
| 18 to 34 Years | 313 (17.5%) | 89 (6.0%) |
| 35 to 64 Years | 199 (10.4%) | 247 (12.1%) |
| 65 to 74 Years | 125 (31.0%) | 153 (37.8%) |
| 75 Years and over | 140 (69.3%) | 129 (74.1%) |
Disability Class by Sex by Age in Scotchtown
Disability Class: Hearing Difficulty
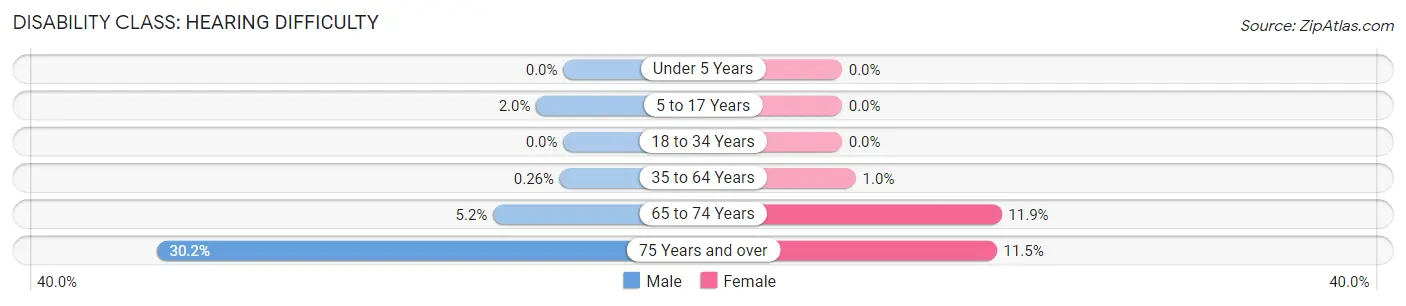
| Age Bracket | Male | Female |
| Under 5 Years | 0 (0.0%) | 0 (0.0%) |
| 5 to 17 Years | 16 (2.0%) | 0 (0.0%) |
| 18 to 34 Years | 0 (0.0%) | 0 (0.0%) |
| 35 to 64 Years | 5 (0.3%) | 21 (1.0%) |
| 65 to 74 Years | 21 (5.2%) | 48 (11.8%) |
| 75 Years and over | 61 (30.2%) | 20 (11.5%) |
Disability Class: Vision Difficulty
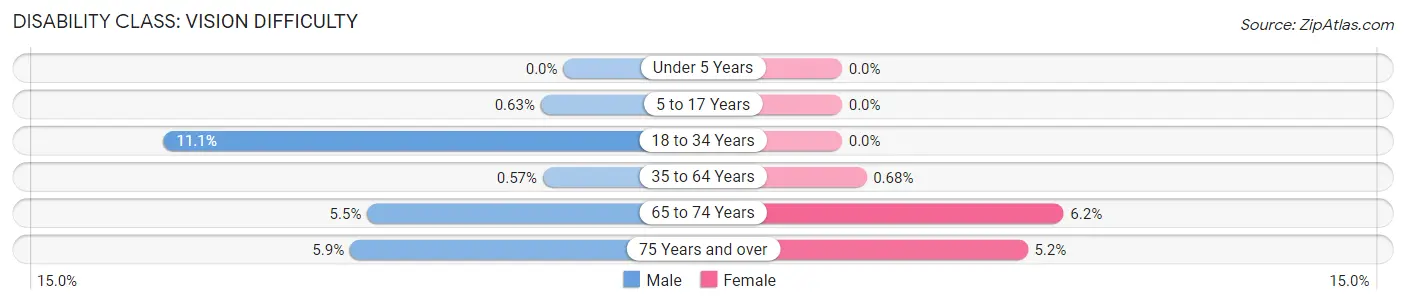
| Age Bracket | Male | Female |
| Under 5 Years | 0 (0.0%) | 0 (0.0%) |
| 5 to 17 Years | 5 (0.6%) | 0 (0.0%) |
| 18 to 34 Years | 199 (11.1%) | 0 (0.0%) |
| 35 to 64 Years | 11 (0.6%) | 14 (0.7%) |
| 65 to 74 Years | 22 (5.5%) | 25 (6.2%) |
| 75 Years and over | 12 (5.9%) | 9 (5.2%) |
Disability Class: Cognitive Difficulty
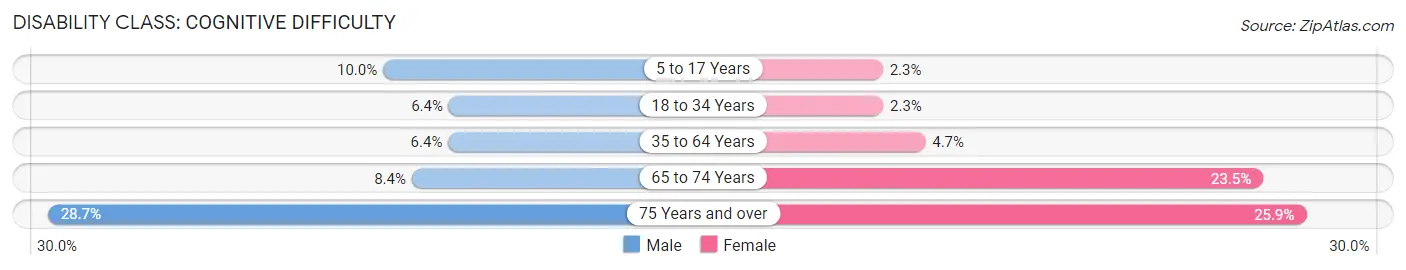
| Age Bracket | Male | Female |
| 5 to 17 Years | 80 (10.0%) | 15 (2.3%) |
| 18 to 34 Years | 114 (6.4%) | 34 (2.3%) |
| 35 to 64 Years | 123 (6.4%) | 95 (4.6%) |
| 65 to 74 Years | 34 (8.4%) | 95 (23.5%) |
| 75 Years and over | 58 (28.7%) | 45 (25.9%) |
Disability Class: Ambulatory Difficulty
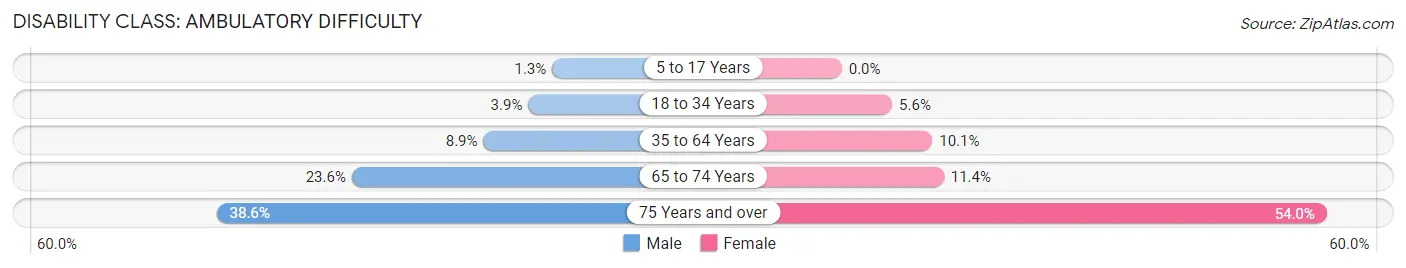
| Age Bracket | Male | Female |
| 5 to 17 Years | 10 (1.3%) | 0 (0.0%) |
| 18 to 34 Years | 70 (3.9%) | 83 (5.6%) |
| 35 to 64 Years | 171 (8.9%) | 206 (10.1%) |
| 65 to 74 Years | 95 (23.6%) | 46 (11.4%) |
| 75 Years and over | 78 (38.6%) | 94 (54.0%) |
Disability Class: Self-Care Difficulty
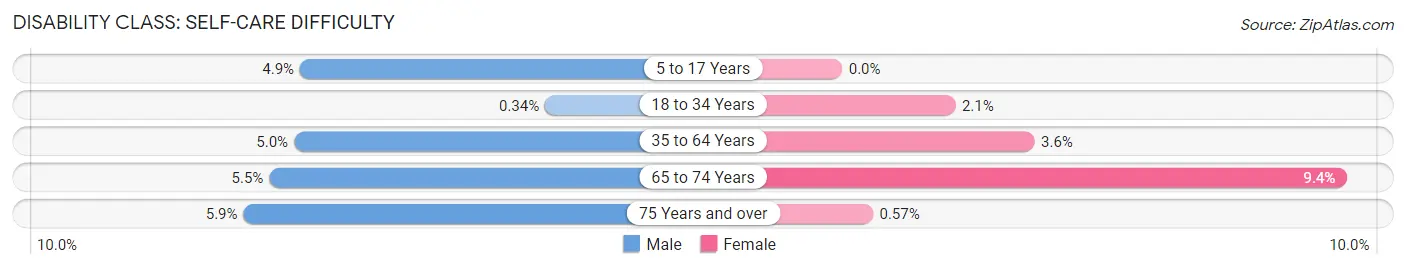
| Age Bracket | Male | Female |
| 5 to 17 Years | 39 (4.9%) | 0 (0.0%) |
| 18 to 34 Years | 6 (0.3%) | 31 (2.1%) |
| 35 to 64 Years | 96 (5.0%) | 73 (3.6%) |
| 65 to 74 Years | 22 (5.5%) | 38 (9.4%) |
| 75 Years and over | 12 (5.9%) | 1 (0.6%) |
Technology Access in Scotchtown
Computing Device Access in Scotchtown
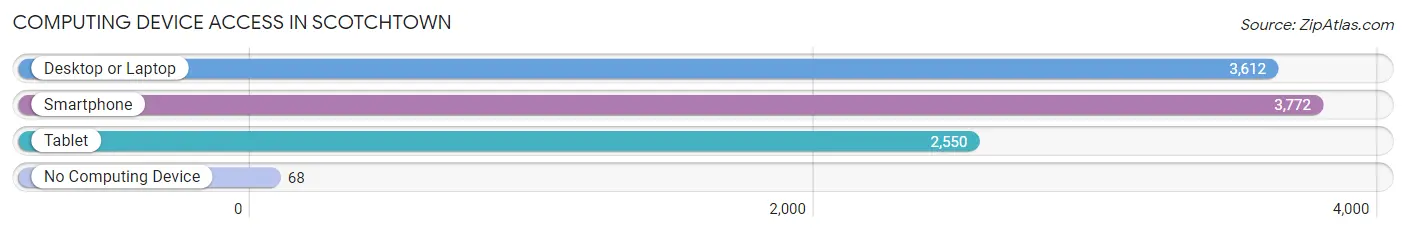
| Device Type | # Households | % Households |
| Desktop or Laptop | 3,612 | 91.3% |
| Smartphone | 3,772 | 95.3% |
| Tablet | 2,550 | 64.4% |
| No Computing Device | 68 | 1.7% |
| Total | 3,957 | 100.0% |
Internet Access in Scotchtown
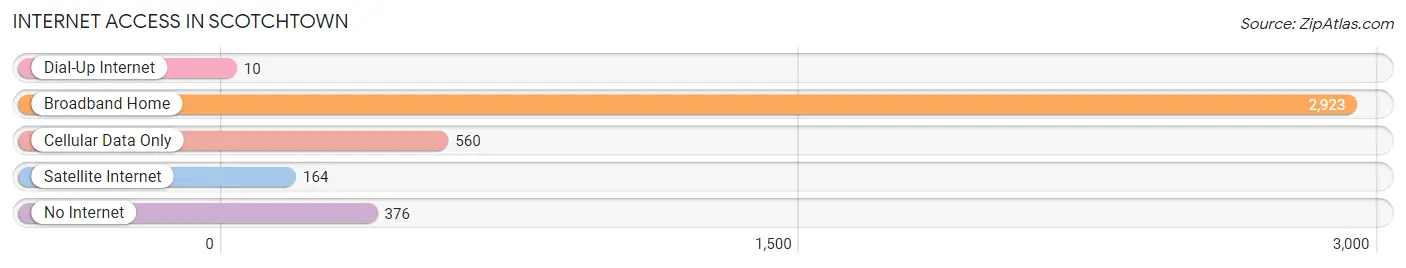
| Internet Type | # Households | % Households |
| Dial-Up Internet | 10 | 0.3% |
| Broadband Home | 2,923 | 73.9% |
| Cellular Data Only | 560 | 14.1% |
| Satellite Internet | 164 | 4.1% |
| No Internet | 376 | 9.5% |
| Total | 3,957 | 100.0% |
Scotchtown Summary
Scotchtown is a hamlet located in the Town of Crawford in Orange County, New York. It is situated on the east side of the Hudson River, about 25 miles north of New York City. The hamlet is home to a population of approximately 1,000 people.
History
The hamlet of Scotchtown was first settled in the late 1700s by Dutch and German immigrants. The area was originally known as “Scotchtown” due to the large number of Scottish immigrants who settled in the area. The hamlet was officially incorporated in 1809.
In the early 1800s, Scotchtown was a thriving agricultural community. The hamlet was home to several farms, as well as a grist mill, a saw mill, and a blacksmith shop. The hamlet also had a post office, a general store, and a school.
In the late 1800s, the hamlet began to decline as the population shifted to larger cities. The grist mill and saw mill closed, and the post office was discontinued in 1891. The hamlet was largely abandoned by the early 1900s.
Geography
Scotchtown is located in the Town of Crawford in Orange County, New York. The hamlet is situated on the east side of the Hudson River, about 25 miles north of New York City. The hamlet is bordered by the hamlets of Bullville to the north, and Pine Bush to the south.
The terrain of Scotchtown is mostly flat, with some rolling hills. The hamlet is located in the foothills of the Shawangunk Mountains, and is surrounded by forests and farmland. The hamlet is home to several small lakes and ponds, as well as the Wallkill River.
Economy
The economy of Scotchtown is largely based on agriculture. The hamlet is home to several farms, which produce a variety of crops, including corn, soybeans, and hay. The hamlet is also home to several wineries, which produce a variety of wines.
The hamlet is also home to several small businesses, including a hardware store, a gas station, and a restaurant. The hamlet is also home to a small airport, which serves as a base for private aircraft.
Demographics
As of the 2010 census, the population of Scotchtown was 1,000. The population is largely white (94.7%), with small percentages of African American (2.2%), Hispanic (1.7%), and Asian (1.4%) residents. The median household income is $50,000, and the median home value is $150,000.
Conclusion
Scotchtown is a small hamlet located in the Town of Crawford in Orange County, New York. The hamlet is situated on the east side of the Hudson River, about 25 miles north of New York City. The hamlet is home to a population of approximately 1,000 people, and is largely based on agriculture. The hamlet is also home to several small businesses, and is a popular destination for private aircraft. The population of Scotchtown is largely white, with small percentages of African American, Hispanic, and Asian residents.
Common Questions
What is Per Capita Income in Scotchtown?
Per Capita income in Scotchtown is $40,114.
What is the Median Family Income in Scotchtown?
Median Family Income in Scotchtown is $109,804.
What is the Median Household income in Scotchtown?
Median Household Income in Scotchtown is $89,880.
What is Income or Wage Gap in Scotchtown?
Income or Wage Gap in Scotchtown is 2.5%.
Women in Scotchtown earn 97.5 cents for every dollar earned by a man.
What is Family Income Deficit in Scotchtown?
Family Income Deficit in Scotchtown is $12,726.
Families that are below poverty line in Scotchtown earn $12,726 less on average than the poverty threshold level.
What is Inequality or Gini Index in Scotchtown?
Inequality or Gini Index in Scotchtown is 0.36.
What is the Total Population of Scotchtown?
Total Population of Scotchtown is 10,353.
What is the Total Male Population of Scotchtown?
Total Male Population of Scotchtown is 5,392.
What is the Total Female Population of Scotchtown?
Total Female Population of Scotchtown is 4,961.
What is the Ratio of Males per 100 Females in Scotchtown?
There are 108.69 Males per 100 Females in Scotchtown.
What is the Ratio of Females per 100 Males in Scotchtown?
There are 92.01 Females per 100 Males in Scotchtown.
What is the Median Population Age in Scotchtown?
Median Population Age in Scotchtown is 34.8 Years.
What is the Average Family Size in Scotchtown
Average Family Size in Scotchtown is 3.3 People.
What is the Average Household Size in Scotchtown
Average Household Size in Scotchtown is 2.6 People.
How Large is the Labor Force in Scotchtown?
There are 5,995 People in the Labor Forcein in Scotchtown.
What is the Percentage of People in the Labor Force in Scotchtown?
68.7% of People are in the Labor Force in Scotchtown.
What is the Unemployment Rate in Scotchtown?
Unemployment Rate in Scotchtown is 4.2%.