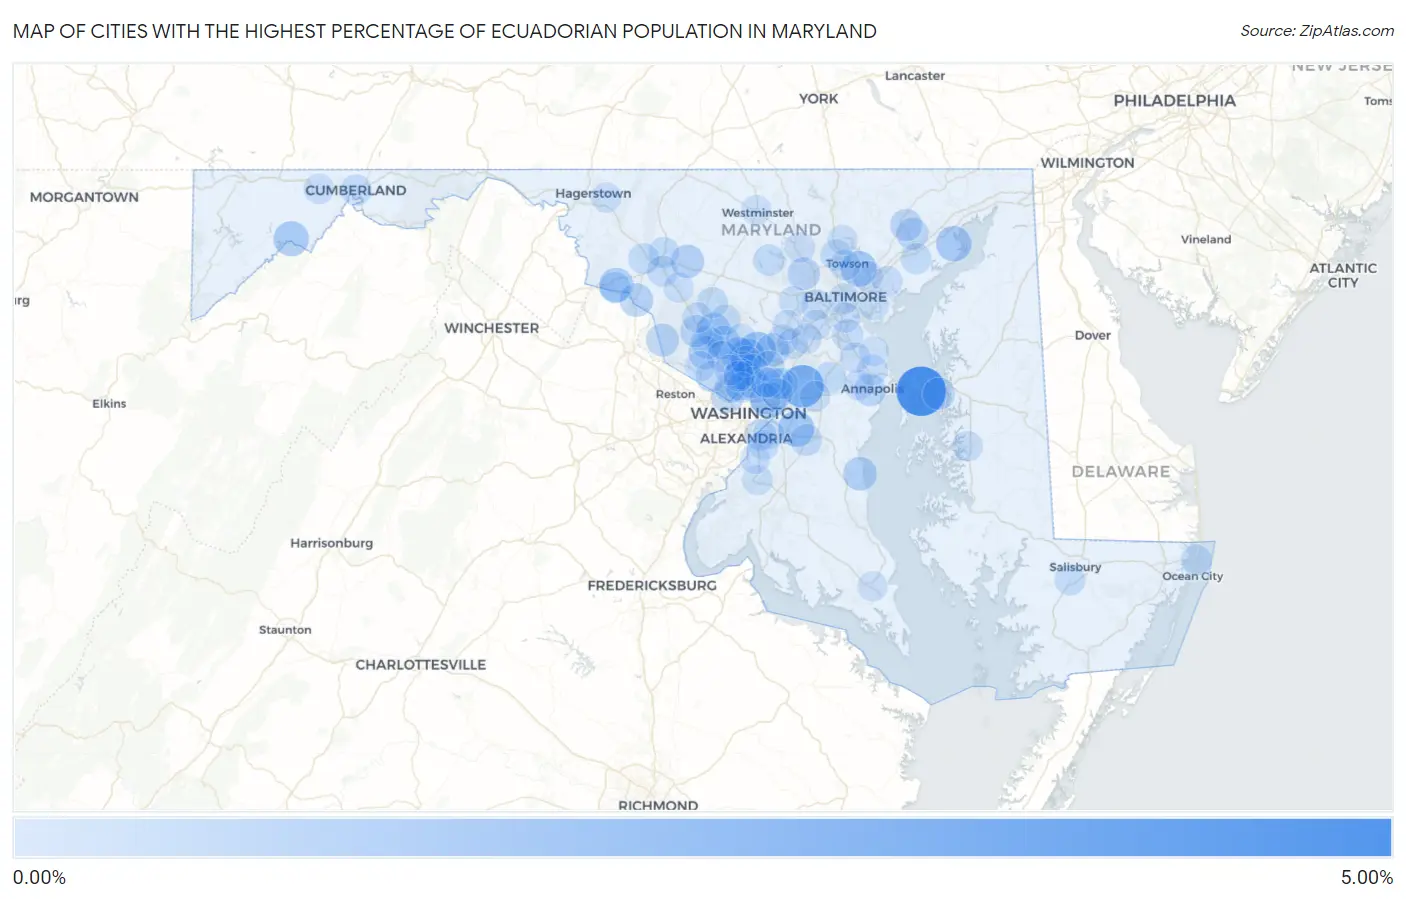
Cities with the Highest Percentage of Ecuadorian Population in Maryland
RELATED REPORTS & OPTIONS
Ecuadorian
Maryland
Compare Cities
Map of Cities with the Highest Percentage of Ecuadorian Population in Maryland
0.00%
5.00%
Cities with the Highest Percentage of Ecuadorian Population in Maryland
| City | Ecuadorian | vs State | vs National | |
| 1. | Chester | 4.65% | 0.17%(+4.48)#1 | 0.24%(+4.40)#91 |
| 2. | Glenn Dale | 2.91% | 0.17%(+2.74)#2 | 0.24%(+2.66)#156 |
| 3. | Burnt Mills | 1.97% | 0.17%(+1.80)#3 | 0.24%(+1.72)#270 |
| 4. | Cloverly | 1.47% | 0.17%(+1.30)#4 | 0.24%(+1.22)#369 |
| 5. | Cottage City | 1.43% | 0.17%(+1.26)#5 | 0.24%(+1.19)#381 |
| 6. | Westphalia | 1.41% | 0.17%(+1.24)#6 | 0.24%(+1.17)#391 |
| 7. | Parkville | 1.35% | 0.17%(+1.18)#7 | 0.24%(+1.11)#413 |
| 8. | Layhill | 1.30% | 0.17%(+1.13)#8 | 0.24%(+1.06)#434 |
| 9. | Aberdeen Proving Ground | 1.26% | 0.17%(+1.09)#9 | 0.24%(+1.02)#444 |
| 10. | Aspen Hill | 1.23% | 0.17%(+1.06)#10 | 0.24%(+0.988)#453 |
| 11. | Flower Hill | 1.23% | 0.17%(+1.06)#11 | 0.24%(+0.987)#455 |
| 12. | Westernport | 1.15% | 0.17%(+0.984)#12 | 0.24%(+0.911)#485 |
| 13. | Rosemont | 1.01% | 0.17%(+0.837)#13 | 0.24%(+0.764)#540 |
| 14. | Montgomery Village | 0.84% | 0.17%(+0.673)#14 | 0.24%(+0.600)#627 |
| 15. | Chesapeake Beach | 0.83% | 0.17%(+0.664)#15 | 0.24%(+0.591)#638 |
| 16. | Redland | 0.81% | 0.17%(+0.637)#16 | 0.24%(+0.564)#655 |
| 17. | Point Of Rocks | 0.81% | 0.17%(+0.635)#17 | 0.24%(+0.562)#657 |
| 18. | Linganore | 0.78% | 0.17%(+0.605)#18 | 0.24%(+0.532)#681 |
| 19. | North Potomac | 0.75% | 0.17%(+0.579)#19 | 0.24%(+0.506)#709 |
| 20. | Burtonsville | 0.75% | 0.17%(+0.576)#20 | 0.24%(+0.504)#711 |
| 21. | Brookmont | 0.72% | 0.17%(+0.553)#21 | 0.24%(+0.481)#734 |
| 22. | Poolesville | 0.69% | 0.17%(+0.516)#22 | 0.24%(+0.443)#771 |
| 23. | Chevy Chase | 0.67% | 0.17%(+0.504)#23 | 0.24%(+0.431)#787 |
| 24. | Gaithersburg | 0.64% | 0.17%(+0.473)#24 | 0.24%(+0.401)#819 |
| 25. | Randallstown | 0.61% | 0.17%(+0.437)#25 | 0.24%(+0.365)#864 |
| 26. | Annapolis | 0.52% | 0.17%(+0.348)#26 | 0.24%(+0.275)#976 |
| 27. | Grasonville | 0.51% | 0.17%(+0.340)#27 | 0.24%(+0.267)#986 |
| 28. | Bel Air South | 0.51% | 0.17%(+0.340)#28 | 0.24%(+0.267)#988 |
| 29. | Germantown | 0.51% | 0.17%(+0.335)#29 | 0.24%(+0.263)#994 |
| 30. | Bel Air | 0.50% | 0.17%(+0.329)#30 | 0.24%(+0.256)#1,007 |
| 31. | Wheaton | 0.47% | 0.17%(+0.302)#31 | 0.24%(+0.229)#1,043 |
| 32. | Queensland | 0.39% | 0.17%(+0.223)#32 | 0.24%(+0.151)#1,166 |
| 33. | Glassmanor | 0.37% | 0.17%(+0.205)#33 | 0.24%(+0.132)#1,194 |
| 34. | Kemp Mill | 0.37% | 0.17%(+0.199)#34 | 0.24%(+0.126)#1,208 |
| 35. | Takoma Park | 0.32% | 0.17%(+0.149)#35 | 0.24%(+0.076)#1,314 |
| 36. | Eldersburg | 0.31% | 0.17%(+0.140)#36 | 0.24%(+0.067)#1,338 |
| 37. | Brunswick | 0.31% | 0.17%(+0.138)#37 | 0.24%(+0.066)#1,343 |
| 38. | Silver Spring | 0.30% | 0.17%(+0.134)#38 | 0.24%(+0.062)#1,350 |
| 39. | Berwyn Heights | 0.30% | 0.17%(+0.132)#39 | 0.24%(+0.059)#1,361 |
| 40. | Crofton | 0.30% | 0.17%(+0.126)#40 | 0.24%(+0.054)#1,374 |
| 41. | Mays Chapel | 0.29% | 0.17%(+0.120)#41 | 0.24%(+0.047)#1,389 |
| 42. | Honeygo | 0.28% | 0.17%(+0.112)#42 | 0.24%(+0.039)#1,412 |
| 43. | Frederick | 0.28% | 0.17%(+0.111)#43 | 0.24%(+0.038)#1,418 |
| 44. | Glen Burnie | 0.26% | 0.17%(+0.095)#44 | 0.24%(+0.022)#1,463 |
| 45. | Greenbelt | 0.26% | 0.17%(+0.086)#45 | 0.24%(+0.013)#1,490 |
| 46. | Edgewood | 0.25% | 0.17%(+0.081)#46 | 0.24%(+0.008)#1,502 |
| 47. | Braddock Heights | 0.25% | 0.17%(+0.075)#47 | 0.24%(+0.002)#1,520 |
| 48. | Rockville | 0.24% | 0.17%(+0.073)#48 | 0.24%(-0.000)#1,525 |
| 49. | Ballenger Creek | 0.24% | 0.17%(+0.073)#49 | 0.24%(-0.000)#1,526 |
| 50. | Cumberland | 0.24% | 0.17%(+0.072)#50 | 0.24%(-0.001)#1,528 |
| 51. | College Park | 0.23% | 0.17%(+0.060)#51 | 0.24%(-0.013)#1,570 |
| 52. | Potomac | 0.22% | 0.17%(+0.054)#52 | 0.24%(-0.019)#1,589 |
| 53. | Kensington | 0.22% | 0.17%(+0.053)#53 | 0.24%(-0.020)#1,594 |
| 54. | Bethesda | 0.22% | 0.17%(+0.049)#54 | 0.24%(-0.024)#1,616 |
| 55. | Ocean City | 0.22% | 0.17%(+0.048)#55 | 0.24%(-0.025)#1,620 |
| 56. | Fruitland | 0.21% | 0.17%(+0.044)#56 | 0.24%(-0.029)#1,633 |
| 57. | Damascus | 0.21% | 0.17%(+0.044)#57 | 0.24%(-0.029)#1,634 |
| 58. | Scaggsville | 0.20% | 0.17%(+0.034)#58 | 0.24%(-0.039)#1,673 |
| 59. | Forest Glen | 0.19% | 0.17%(+0.020)#59 | 0.24%(-0.053)#1,732 |
| 60. | Catonsville | 0.19% | 0.17%(+0.019)#60 | 0.24%(-0.053)#1,733 |
| 61. | Glenmont | 0.18% | 0.17%(+0.010)#61 | 0.24%(-0.062)#1,774 |
| 62. | Calverton | 0.18% | 0.17%(+0.010)#62 | 0.24%(-0.063)#1,776 |
| 63. | Arnold | 0.18% | 0.17%(+0.007)#63 | 0.24%(-0.066)#1,788 |
| 64. | Marlow Heights | 0.18% | 0.17%(+0.006)#64 | 0.24%(-0.067)#1,795 |
| 65. | Overlea | 0.17% | 0.17%(+0.002)#65 | 0.24%(-0.071)#1,807 |
| 66. | Baltimore | 0.17% | 0.17%(-0.003)#66 | 0.24%(-0.076)#1,830 |
| 67. | North Laurel | 0.16% | 0.17%(-0.010)#67 | 0.24%(-0.083)#1,869 |
| 68. | Mount Rainier | 0.16% | 0.17%(-0.013)#68 | 0.24%(-0.085)#1,874 |
| 69. | East Riverdale | 0.15% | 0.17%(-0.021)#69 | 0.24%(-0.093)#1,910 |
| 70. | Bowie | 0.15% | 0.17%(-0.022)#70 | 0.24%(-0.094)#1,916 |
| 71. | Easton | 0.14% | 0.17%(-0.030)#71 | 0.24%(-0.103)#1,976 |
| 72. | Laytonsville | 0.14% | 0.17%(-0.034)#72 | 0.24%(-0.107)#1,997 |
| 73. | Parole | 0.13% | 0.17%(-0.040)#73 | 0.24%(-0.113)#2,031 |
| 74. | Reisterstown | 0.13% | 0.17%(-0.043)#74 | 0.24%(-0.116)#2,051 |
| 75. | Clarksburg | 0.12% | 0.17%(-0.046)#75 | 0.24%(-0.119)#2,065 |
| 76. | North Bethesda | 0.12% | 0.17%(-0.047)#76 | 0.24%(-0.120)#2,069 |
| 77. | Towson | 0.12% | 0.17%(-0.054)#77 | 0.24%(-0.126)#2,124 |
| 78. | Severna Park | 0.12% | 0.17%(-0.054)#78 | 0.24%(-0.127)#2,127 |
| 79. | Jessup | 0.11% | 0.17%(-0.055)#79 | 0.24%(-0.128)#2,142 |
| 80. | Brooklyn Park | 0.11% | 0.17%(-0.063)#80 | 0.24%(-0.136)#2,192 |
| 81. | Martin S Additions | 0.10% | 0.17%(-0.069)#81 | 0.24%(-0.142)#2,224 |
| 82. | Robinwood | 0.100% | 0.17%(-0.070)#82 | 0.24%(-0.143)#2,228 |
| 83. | Urbana | 0.097% | 0.17%(-0.073)#83 | 0.24%(-0.146)#2,248 |
| 84. | Accokeek | 0.094% | 0.17%(-0.076)#84 | 0.24%(-0.149)#2,269 |
| 85. | Travilah | 0.092% | 0.17%(-0.078)#85 | 0.24%(-0.151)#2,282 |
| 86. | Middle River | 0.090% | 0.17%(-0.080)#86 | 0.24%(-0.153)#2,297 |
| 87. | Chevy Chase View | 0.089% | 0.17%(-0.081)#87 | 0.24%(-0.154)#2,302 |
| 88. | Elkridge | 0.087% | 0.17%(-0.083)#88 | 0.24%(-0.156)#2,321 |
| 89. | Frostburg | 0.084% | 0.17%(-0.086)#89 | 0.24%(-0.158)#2,344 |
| 90. | Adelphi | 0.083% | 0.17%(-0.087)#90 | 0.24%(-0.160)#2,363 |
| 91. | Ellicott City | 0.076% | 0.17%(-0.094)#91 | 0.24%(-0.167)#2,410 |
| 92. | Dundalk | 0.074% | 0.17%(-0.096)#92 | 0.24%(-0.169)#2,430 |
| 93. | Fort Washington | 0.070% | 0.17%(-0.100)#93 | 0.24%(-0.173)#2,470 |
| 94. | Westminster | 0.055% | 0.17%(-0.115)#94 | 0.24%(-0.188)#2,590 |
| 95. | California | 0.051% | 0.17%(-0.119)#95 | 0.24%(-0.191)#2,632 |
| 96. | Olney | 0.039% | 0.17%(-0.131)#96 | 0.24%(-0.203)#2,735 |
| 97. | Cockeysville | 0.039% | 0.17%(-0.131)#97 | 0.24%(-0.204)#2,742 |
| 98. | Oxon Hill | 0.038% | 0.17%(-0.132)#98 | 0.24%(-0.205)#2,747 |
| 99. | Lake Shore | 0.032% | 0.17%(-0.138)#99 | 0.24%(-0.211)#2,799 |
| 100. | Columbia | 0.019% | 0.17%(-0.151)#100 | 0.24%(-0.224)#2,935 |
Common Questions
What are the Top 10 Cities with the Highest Percentage of Ecuadorian Population in Maryland?
Top 10 Cities with the Highest Percentage of Ecuadorian Population in Maryland are:
#1
4.65%
#2
2.91%
#3
1.47%
#4
1.43%
#5
1.41%
#6
1.35%
#7
1.30%
#8
1.26%
#9
1.23%
#10
1.15%
What city has the Highest Percentage of Ecuadorian Population in Maryland?
Chester has the Highest Percentage of Ecuadorian Population in Maryland with 4.65%.
What is the Percentage of Ecuadorian Population in the State of Maryland?
Percentage of Ecuadorian Population in Maryland is 0.17%.
What is the Percentage of Ecuadorian Population in the United States?
Percentage of Ecuadorian Population in the United States is 0.24%.