Cities with the Highest Percentage of Ecuadorian Population in Virginia
RELATED REPORTS & OPTIONS
Ecuadorian
Virginia
Compare Cities
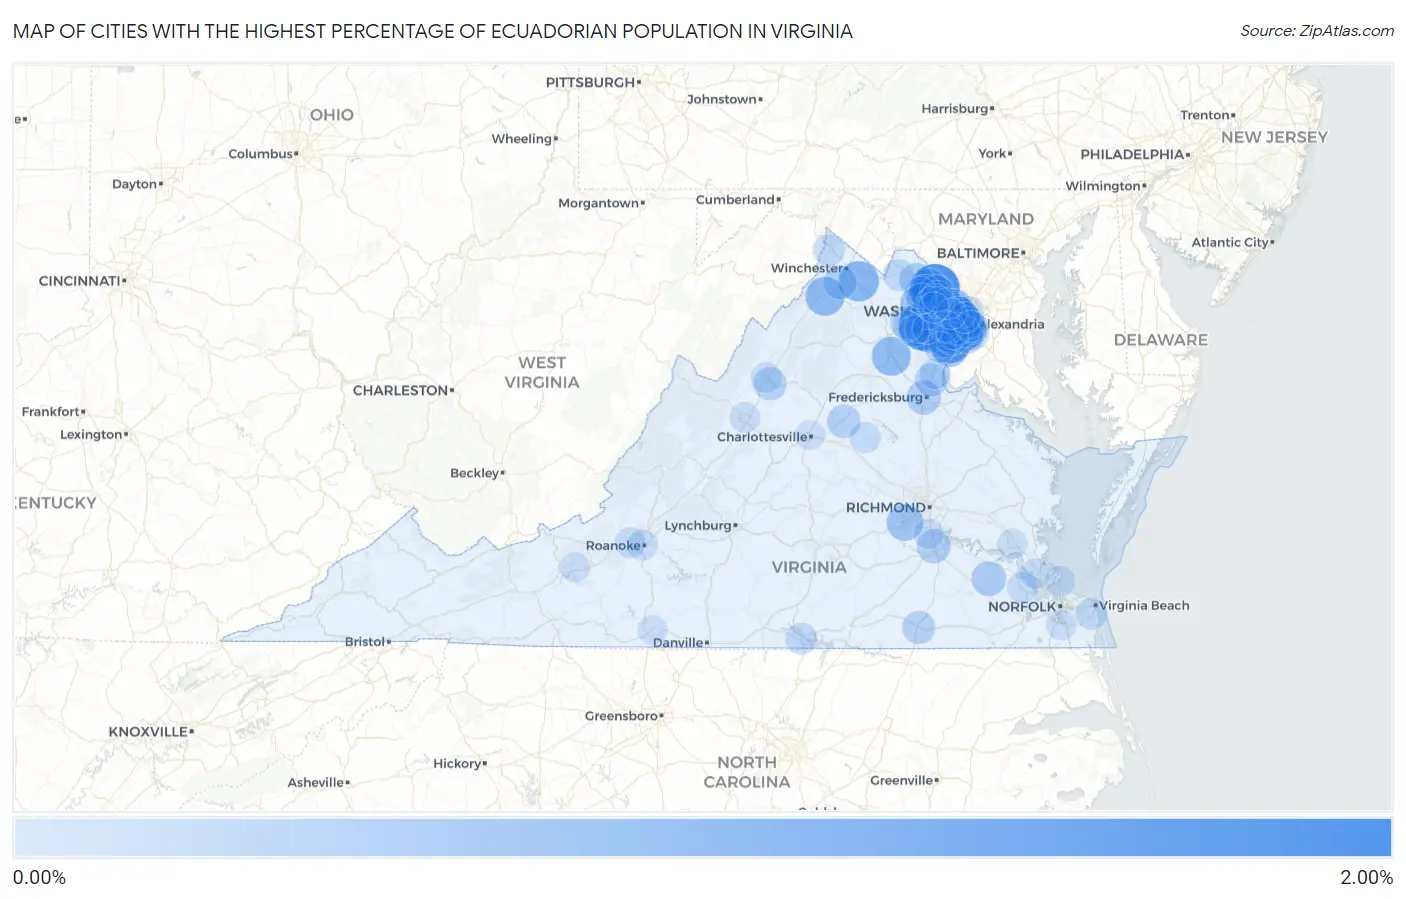
Map of Cities with the Highest Percentage of Ecuadorian Population in Virginia
0.00%
2.00%
Cities with the Highest Percentage of Ecuadorian Population in Virginia
| City | Ecuadorian | vs State | vs National | |
| 1. | Cascades | 1.56% | 0.11%(+1.45)#1 | 0.24%(+1.32)#348 |
| 2. | Sudley | 1.41% | 0.11%(+1.30)#2 | 0.24%(+1.17)#394 |
| 3. | Franconia | 1.22% | 0.11%(+1.11)#3 | 0.24%(+0.980)#459 |
| 4. | Occoquan | 1.12% | 0.11%(+1.01)#4 | 0.24%(+0.877)#500 |
| 5. | Difficult Run | 1.09% | 0.11%(+0.982)#5 | 0.24%(+0.850)#511 |
| 6. | Kings Park | 1.00% | 0.11%(+0.889)#6 | 0.24%(+0.756)#544 |
| 7. | Sterling | 0.99% | 0.11%(+0.875)#7 | 0.24%(+0.742)#556 |
| 8. | Boyce | 0.84% | 0.11%(+0.727)#8 | 0.24%(+0.594)#630 |
| 9. | Lincolnia | 0.78% | 0.11%(+0.672)#9 | 0.24%(+0.540)#670 |
| 10. | South Run | 0.76% | 0.11%(+0.653)#10 | 0.24%(+0.521)#694 |
| 11. | Centreville | 0.76% | 0.11%(+0.653)#11 | 0.24%(+0.521)#695 |
| 12. | Dunn Loring | 0.76% | 0.11%(+0.648)#12 | 0.24%(+0.515)#699 |
| 13. | Strasburg | 0.73% | 0.11%(+0.622)#13 | 0.24%(+0.489)#723 |
| 14. | Bealeton | 0.73% | 0.11%(+0.618)#14 | 0.24%(+0.485)#727 |
| 15. | Fairfax Station | 0.72% | 0.11%(+0.615)#15 | 0.24%(+0.482)#733 |
| 16. | Long Branch | 0.72% | 0.11%(+0.610)#16 | 0.24%(+0.478)#738 |
| 17. | Manassas | 0.64% | 0.11%(+0.528)#17 | 0.24%(+0.395)#829 |
| 18. | Tysons | 0.59% | 0.11%(+0.476)#18 | 0.24%(+0.344)#879 |
| 19. | Arcola | 0.57% | 0.11%(+0.464)#19 | 0.24%(+0.332)#894 |
| 20. | West Falls Church | 0.57% | 0.11%(+0.459)#20 | 0.24%(+0.326)#908 |
| 21. | Brandermill | 0.55% | 0.11%(+0.443)#21 | 0.24%(+0.310)#929 |
| 22. | Woodbridge | 0.53% | 0.11%(+0.418)#22 | 0.24%(+0.285)#965 |
| 23. | Groveton | 0.47% | 0.11%(+0.362)#23 | 0.24%(+0.229)#1,042 |
| 24. | University Center | 0.45% | 0.11%(+0.340)#24 | 0.24%(+0.207)#1,064 |
| 25. | Buckhall | 0.43% | 0.11%(+0.318)#25 | 0.24%(+0.185)#1,092 |
| 26. | Lake Barcroft | 0.42% | 0.11%(+0.305)#26 | 0.24%(+0.173)#1,118 |
| 27. | Dendron | 0.41% | 0.11%(+0.301)#27 | 0.24%(+0.169)#1,124 |
| 28. | Idylwood | 0.38% | 0.11%(+0.266)#28 | 0.24%(+0.134)#1,191 |
| 29. | Fredericksburg | 0.38% | 0.11%(+0.265)#29 | 0.24%(+0.132)#1,193 |
| 30. | Kings Park West | 0.37% | 0.11%(+0.259)#30 | 0.24%(+0.127)#1,204 |
| 31. | Colonial Heights | 0.35% | 0.11%(+0.242)#31 | 0.24%(+0.110)#1,244 |
| 32. | Leesburg | 0.35% | 0.11%(+0.238)#32 | 0.24%(+0.106)#1,255 |
| 33. | West Springfield | 0.34% | 0.11%(+0.232)#33 | 0.24%(+0.100)#1,270 |
| 34. | Stephens City | 0.33% | 0.11%(+0.222)#34 | 0.24%(+0.089)#1,289 |
| 35. | Chantilly | 0.32% | 0.11%(+0.214)#35 | 0.24%(+0.082)#1,305 |
| 36. | Gordonsville | 0.31% | 0.11%(+0.198)#36 | 0.24%(+0.066)#1,344 |
| 37. | Massanetta Springs | 0.29% | 0.11%(+0.178)#37 | 0.24%(+0.045)#1,397 |
| 38. | Emporia | 0.28% | 0.11%(+0.171)#38 | 0.24%(+0.039)#1,414 |
| 39. | Stafford Courthouse | 0.28% | 0.11%(+0.170)#39 | 0.24%(+0.037)#1,421 |
| 40. | Ashburn | 0.26% | 0.11%(+0.154)#40 | 0.24%(+0.021)#1,466 |
| 41. | Kingstowne | 0.26% | 0.11%(+0.153)#41 | 0.24%(+0.021)#1,468 |
| 42. | Haymarket | 0.25% | 0.11%(+0.144)#42 | 0.24%(+0.012)#1,492 |
| 43. | Fort Hunt | 0.25% | 0.11%(+0.140)#43 | 0.24%(+0.007)#1,505 |
| 44. | Newington | 0.24% | 0.11%(+0.126)#44 | 0.24%(-0.007)#1,553 |
| 45. | Fair Oaks | 0.23% | 0.11%(+0.123)#45 | 0.24%(-0.009)#1,559 |
| 46. | Arlington | 0.23% | 0.11%(+0.120)#46 | 0.24%(-0.013)#1,569 |
| 47. | Crosspointe | 0.23% | 0.11%(+0.116)#47 | 0.24%(-0.017)#1,584 |
| 48. | Lake Ridge | 0.22% | 0.11%(+0.111)#48 | 0.24%(-0.021)#1,601 |
| 49. | Belle Haven | 0.22% | 0.11%(+0.110)#49 | 0.24%(-0.023)#1,608 |
| 50. | Annandale | 0.22% | 0.11%(+0.109)#50 | 0.24%(-0.023)#1,613 |
| 51. | Woodlawn Cdp Fairfax County | 0.22% | 0.11%(+0.107)#51 | 0.24%(-0.025)#1,623 |
| 52. | Woodburn | 0.21% | 0.11%(+0.101)#52 | 0.24%(-0.032)#1,644 |
| 53. | Hayfield | 0.21% | 0.11%(+0.095)#53 | 0.24%(-0.038)#1,669 |
| 54. | Mount Vernon | 0.20% | 0.11%(+0.085)#54 | 0.24%(-0.047)#1,709 |
| 55. | Oakton | 0.19% | 0.11%(+0.081)#55 | 0.24%(-0.051)#1,727 |
| 56. | Alexandria | 0.19% | 0.11%(+0.078)#56 | 0.24%(-0.054)#1,736 |
| 57. | Sugarland Run | 0.19% | 0.11%(+0.077)#57 | 0.24%(-0.056)#1,743 |
| 58. | Springfield | 0.19% | 0.11%(+0.077)#58 | 0.24%(-0.056)#1,745 |
| 59. | Broadlands | 0.19% | 0.11%(+0.075)#59 | 0.24%(-0.058)#1,757 |
| 60. | Clarksville | 0.18% | 0.11%(+0.074)#60 | 0.24%(-0.059)#1,762 |
| 61. | Purcellville | 0.18% | 0.11%(+0.069)#61 | 0.24%(-0.064)#1,780 |
| 62. | Lake Holiday | 0.18% | 0.11%(+0.069)#62 | 0.24%(-0.064)#1,781 |
| 63. | Virginia Beach | 0.18% | 0.11%(+0.069)#63 | 0.24%(-0.064)#1,782 |
| 64. | Falls Church | 0.18% | 0.11%(+0.068)#64 | 0.24%(-0.064)#1,785 |
| 65. | Laurel Hill | 0.18% | 0.11%(+0.067)#65 | 0.24%(-0.066)#1,789 |
| 66. | Herndon | 0.17% | 0.11%(+0.057)#66 | 0.24%(-0.075)#1,823 |
| 67. | Mcnair | 0.17% | 0.11%(+0.057)#67 | 0.24%(-0.076)#1,828 |
| 68. | Reston | 0.14% | 0.11%(+0.033)#68 | 0.24%(-0.100)#1,957 |
| 69. | Smithfield | 0.14% | 0.11%(+0.029)#69 | 0.24%(-0.104)#1,983 |
| 70. | Louisa | 0.14% | 0.11%(+0.028)#70 | 0.24%(-0.105)#1,988 |
| 71. | Burke Centre | 0.13% | 0.11%(+0.024)#71 | 0.24%(-0.109)#2,010 |
| 72. | Aquia Harbour | 0.13% | 0.11%(+0.019)#72 | 0.24%(-0.113)#2,030 |
| 73. | Burke | 0.12% | 0.11%(+0.014)#73 | 0.24%(-0.118)#2,058 |
| 74. | Huntington | 0.12% | 0.11%(+0.012)#74 | 0.24%(-0.121)#2,071 |
| 75. | Dale City | 0.12% | 0.11%(+0.011)#75 | 0.24%(-0.121)#2,078 |
| 76. | Linton Hall | 0.12% | 0.11%(+0.009)#76 | 0.24%(-0.123)#2,095 |
| 77. | Harrisonburg | 0.12% | 0.11%(+0.008)#77 | 0.24%(-0.125)#2,108 |
| 78. | Salem | 0.11% | 0.11%(+0.004)#78 | 0.24%(-0.128)#2,144 |
| 79. | Roanoke | 0.11% | 0.11%(-0.000)#79 | 0.24%(-0.133)#2,168 |
| 80. | Wolf Trap | 0.11% | 0.11%(-0.002)#80 | 0.24%(-0.135)#2,181 |
| 81. | Hampton | 0.11% | 0.11%(-0.003)#81 | 0.24%(-0.136)#2,189 |
| 82. | Newington Forest | 0.10% | 0.11%(-0.007)#82 | 0.24%(-0.140)#2,210 |
| 83. | Staunton | 0.098% | 0.11%(-0.013)#83 | 0.24%(-0.145)#2,243 |
| 84. | Bailey S Crossroads | 0.097% | 0.11%(-0.013)#84 | 0.24%(-0.146)#2,252 |
| 85. | Bull Run | 0.096% | 0.11%(-0.014)#85 | 0.24%(-0.147)#2,257 |
| 86. | Chester | 0.095% | 0.11%(-0.015)#86 | 0.24%(-0.147)#2,262 |
| 87. | Loudoun Valley Estates | 0.095% | 0.11%(-0.015)#87 | 0.24%(-0.148)#2,264 |
| 88. | Newport News | 0.095% | 0.11%(-0.016)#88 | 0.24%(-0.148)#2,267 |
| 89. | Dranesville | 0.091% | 0.11%(-0.020)#89 | 0.24%(-0.152)#2,291 |
| 90. | Chesapeake | 0.074% | 0.11%(-0.036)#90 | 0.24%(-0.169)#2,432 |
| 91. | Radford | 0.073% | 0.11%(-0.037)#91 | 0.24%(-0.170)#2,440 |
| 92. | Williamsburg | 0.071% | 0.11%(-0.039)#92 | 0.24%(-0.172)#2,459 |
| 93. | Rose Hill Cdp Fairfax County | 0.071% | 0.11%(-0.039)#93 | 0.24%(-0.172)#2,462 |
| 94. | Martinsville | 0.066% | 0.11%(-0.044)#94 | 0.24%(-0.176)#2,504 |
| 95. | Merrifield | 0.065% | 0.11%(-0.045)#95 | 0.24%(-0.178)#2,515 |
| 96. | Charlottesville | 0.060% | 0.11%(-0.050)#96 | 0.24%(-0.182)#2,540 |
| 97. | Gainesville | 0.059% | 0.11%(-0.051)#97 | 0.24%(-0.184)#2,554 |
| 98. | Manassas Park | 0.058% | 0.11%(-0.052)#98 | 0.24%(-0.184)#2,556 |
| 99. | Franklin Farm | 0.058% | 0.11%(-0.052)#99 | 0.24%(-0.185)#2,561 |
| 100. | Leesylvania | 0.054% | 0.11%(-0.056)#100 | 0.24%(-0.189)#2,599 |
Common Questions
What are the Top 10 Cities with the Highest Percentage of Ecuadorian Population in Virginia?
Top 10 Cities with the Highest Percentage of Ecuadorian Population in Virginia are:
#1
1.56%
#2
1.41%
#3
1.22%
#4
1.12%
#5
1.00%
#6
0.99%
#7
0.84%
#8
0.78%
#9
0.76%
#10
0.76%
What city has the Highest Percentage of Ecuadorian Population in Virginia?
Cascades has the Highest Percentage of Ecuadorian Population in Virginia with 1.56%.
What is the Percentage of Ecuadorian Population in the State of Virginia?
Percentage of Ecuadorian Population in Virginia is 0.11%.
What is the Percentage of Ecuadorian Population in the United States?
Percentage of Ecuadorian Population in the United States is 0.24%.