Cities with the Highest Percentage of Ecuadorian Population in Connecticut
RELATED REPORTS & OPTIONS
Ecuadorian
Connecticut
Compare Cities
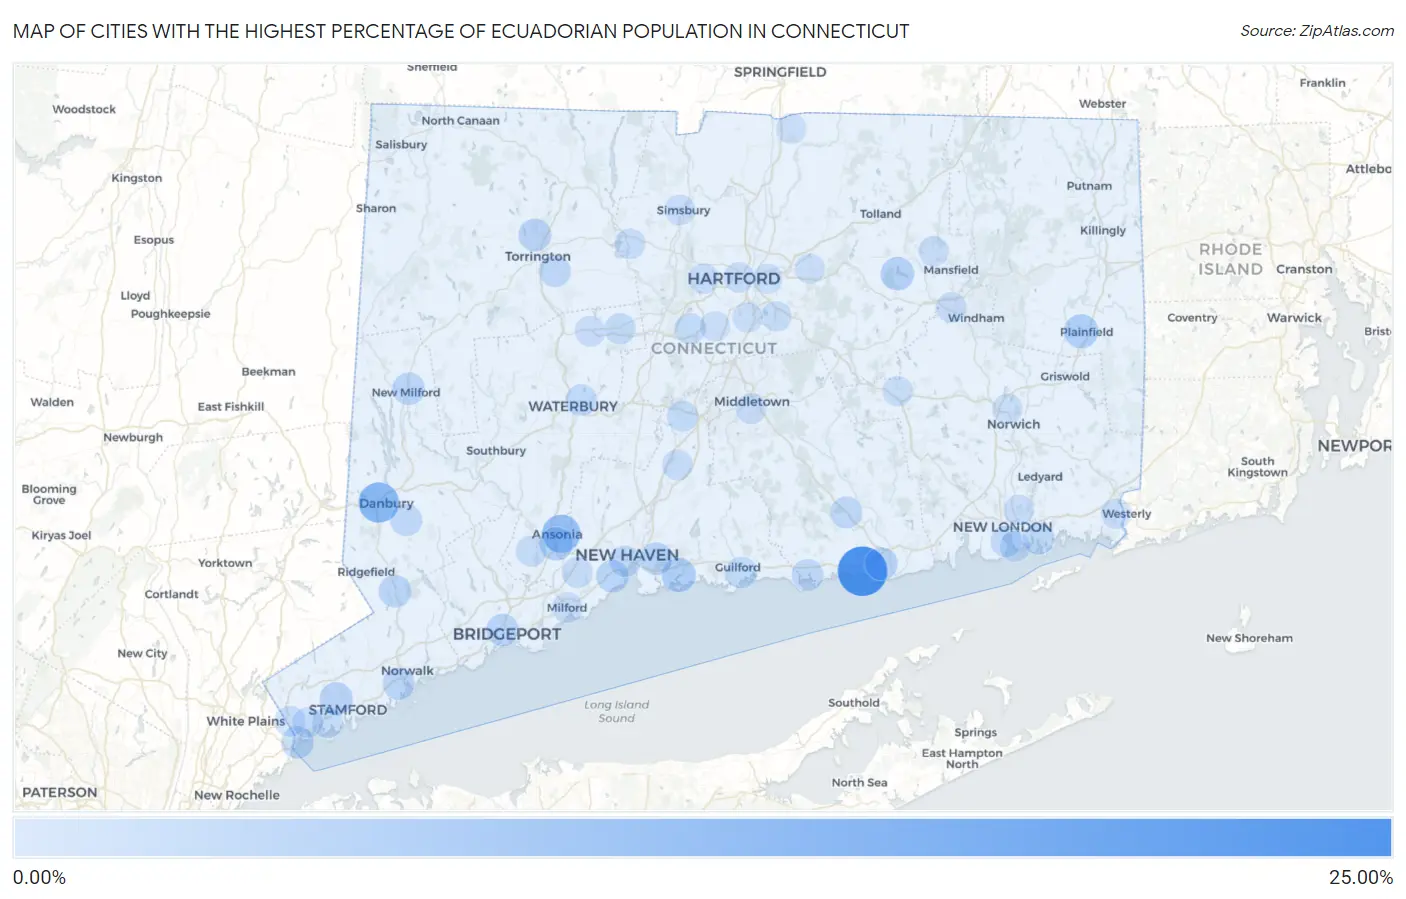
Map of Cities with the Highest Percentage of Ecuadorian Population in Connecticut
0.00%
25.00%
Cities with the Highest Percentage of Ecuadorian Population in Connecticut
| City | Ecuadorian | vs State | vs National | |
| 1. | Saybrook Manor | 21.04% | 1.11%(+19.9)#1 | 0.24%(+20.8)#9 |
| 2. | Greens Farms | 13.08% | 1.11%(+12.0)#2 | 0.24%(+12.8)#22 |
| 3. | Danbury | 10.78% | 1.11%(+9.67)#3 | 0.24%(+10.5)#27 |
| 4. | Ansonia | 8.38% | 1.11%(+7.28)#4 | 0.24%(+8.14)#43 |
| 5. | Danielson Borough | 6.68% | 1.11%(+5.57)#5 | 0.24%(+6.44)#61 |
| 6. | Branford Center | 4.29% | 1.11%(+3.18)#6 | 0.24%(+4.05)#102 |
| 7. | Plainfield Village | 4.14% | 1.11%(+3.03)#7 | 0.24%(+3.90)#104 |
| 8. | Derby | 3.53% | 1.11%(+2.42)#8 | 0.24%(+3.29)#122 |
| 9. | Coventry Lake | 3.41% | 1.11%(+2.30)#9 | 0.24%(+3.17)#130 |
| 10. | Candlewood Orchards | 3.05% | 1.11%(+1.95)#10 | 0.24%(+2.81)#151 |
| 11. | Stamford | 2.96% | 1.11%(+1.86)#11 | 0.24%(+2.72)#155 |
| 12. | Old Saybrook Center | 2.73% | 1.11%(+1.62)#12 | 0.24%(+2.48)#171 |
| 13. | Darien Downtown | 2.72% | 1.11%(+1.61)#13 | 0.24%(+2.48)#174 |
| 14. | Torrington | 2.70% | 1.11%(+1.59)#14 | 0.24%(+2.46)#176 |
| 15. | East Haven | 2.62% | 1.11%(+1.51)#15 | 0.24%(+2.38)#184 |
| 16. | West Haven | 2.59% | 1.11%(+1.48)#16 | 0.24%(+2.35)#188 |
| 17. | New Milford | 2.47% | 1.11%(+1.36)#17 | 0.24%(+2.22)#200 |
| 18. | Georgetown | 2.42% | 1.11%(+1.31)#18 | 0.24%(+2.17)#210 |
| 19. | Bridgeport | 2.40% | 1.11%(+1.29)#19 | 0.24%(+2.16)#213 |
| 20. | Byram | 2.33% | 1.11%(+1.22)#20 | 0.24%(+2.08)#221 |
| 21. | Ball Pond | 2.02% | 1.11%(+0.907)#21 | 0.24%(+1.77)#257 |
| 22. | Norwalk | 2.00% | 1.11%(+0.889)#22 | 0.24%(+1.76)#261 |
| 23. | Deep River Center | 1.85% | 1.11%(+0.743)#23 | 0.24%(+1.61)#292 |
| 24. | Bethel | 1.78% | 1.11%(+0.675)#24 | 0.24%(+1.54)#305 |
| 25. | Northwest Harwinton | 1.75% | 1.11%(+0.641)#25 | 0.24%(+1.51)#312 |
| 26. | Clinton | 1.64% | 1.11%(+0.530)#26 | 0.24%(+1.40)#334 |
| 27. | New Haven | 1.44% | 1.11%(+0.328)#27 | 0.24%(+1.19)#380 |
| 28. | Waterbury | 1.42% | 1.11%(+0.315)#28 | 0.24%(+1.18)#387 |
| 29. | New London | 1.41% | 1.11%(+0.305)#29 | 0.24%(+1.17)#390 |
| 30. | Guilford Center | 1.38% | 1.11%(+0.269)#30 | 0.24%(+1.13)#404 |
| 31. | Poquonock Bridge | 1.37% | 1.11%(+0.259)#31 | 0.24%(+1.12)#407 |
| 32. | Noroton | 1.25% | 1.11%(+0.140)#32 | 0.24%(+1.01)#449 |
| 33. | Bristol | 1.14% | 1.11%(+0.032)#33 | 0.24%(+0.897)#492 |
| 34. | New Britain | 1.06% | 1.11%(-0.051)#34 | 0.24%(+0.815)#524 |
| 35. | Meriden | 0.98% | 1.11%(-0.127)#35 | 0.24%(+0.738)#562 |
| 36. | Westport | 0.94% | 1.11%(-0.171)#36 | 0.24%(+0.694)#580 |
| 37. | Naugatuck Borough | 0.88% | 1.11%(-0.227)#37 | 0.24%(+0.639)#606 |
| 38. | Glenville | 0.84% | 1.11%(-0.273)#38 | 0.24%(+0.593)#632 |
| 39. | Shelton | 0.83% | 1.11%(-0.281)#39 | 0.24%(+0.585)#641 |
| 40. | Orange | 0.77% | 1.11%(-0.335)#40 | 0.24%(+0.530)#685 |
| 41. | Wallingford Center | 0.75% | 1.11%(-0.356)#41 | 0.24%(+0.510)#705 |
| 42. | Saugatuck | 0.63% | 1.11%(-0.475)#42 | 0.24%(+0.391)#834 |
| 43. | Riverside | 0.63% | 1.11%(-0.482)#43 | 0.24%(+0.384)#842 |
| 44. | Stepney | 0.60% | 1.11%(-0.510)#44 | 0.24%(+0.356)#869 |
| 45. | Milford City Balance | 0.52% | 1.11%(-0.593)#45 | 0.24%(+0.272)#979 |
| 46. | Simsbury Center | 0.51% | 1.11%(-0.601)#46 | 0.24%(+0.265)#990 |
| 47. | Groton | 0.49% | 1.11%(-0.617)#47 | 0.24%(+0.248)#1,012 |
| 48. | Terryville | 0.46% | 1.11%(-0.648)#48 | 0.24%(+0.217)#1,054 |
| 49. | Middletown | 0.43% | 1.11%(-0.681)#49 | 0.24%(+0.185)#1,094 |
| 50. | Storrs | 0.40% | 1.11%(-0.705)#50 | 0.24%(+0.160)#1,135 |
| 51. | West Hartford | 0.39% | 1.11%(-0.717)#51 | 0.24%(+0.149)#1,168 |
| 52. | Hartford | 0.39% | 1.11%(-0.719)#52 | 0.24%(+0.146)#1,171 |
| 53. | Collinsville | 0.37% | 1.11%(-0.735)#53 | 0.24%(+0.131)#1,196 |
| 54. | Pawcatuck | 0.36% | 1.11%(-0.749)#54 | 0.24%(+0.116)#1,231 |
| 55. | Noroton Heights | 0.33% | 1.11%(-0.776)#55 | 0.24%(+0.090)#1,285 |
| 56. | Willimantic | 0.32% | 1.11%(-0.787)#56 | 0.24%(+0.078)#1,311 |
| 57. | Conning Towers Nautilus Park | 0.29% | 1.11%(-0.820)#57 | 0.24%(+0.045)#1,395 |
| 58. | Greenwich | 0.27% | 1.11%(-0.838)#58 | 0.24%(+0.028)#1,443 |
| 59. | Daniels Farm | 0.23% | 1.11%(-0.878)#59 | 0.24%(-0.012)#1,568 |
| 60. | Glastonbury Center | 0.23% | 1.11%(-0.882)#60 | 0.24%(-0.017)#1,585 |
| 61. | Colchester | 0.23% | 1.11%(-0.882)#61 | 0.24%(-0.017)#1,586 |
| 62. | Quinnipiac University | 0.22% | 1.11%(-0.885)#62 | 0.24%(-0.019)#1,593 |
| 63. | Compo | 0.22% | 1.11%(-0.889)#63 | 0.24%(-0.023)#1,610 |
| 64. | Wethersfield | 0.19% | 1.11%(-0.921)#64 | 0.24%(-0.055)#1,741 |
| 65. | Sherwood Manor | 0.17% | 1.11%(-0.934)#65 | 0.24%(-0.068)#1,799 |
| 66. | Newington | 0.14% | 1.11%(-0.971)#66 | 0.24%(-0.105)#1,990 |
| 67. | Norwich | 0.12% | 1.11%(-0.991)#67 | 0.24%(-0.125)#2,111 |
| 68. | Trumbull Center | 0.087% | 1.11%(-1.02)#68 | 0.24%(-0.156)#2,322 |
| 69. | Manchester | 0.041% | 1.11%(-1.07)#69 | 0.24%(-0.202)#2,722 |
| 70. | East Hartford | 0.035% | 1.11%(-1.07)#70 | 0.24%(-0.207)#2,770 |
| 71. | Lordship | 0.026% | 1.11%(-1.08)#71 | 0.24%(-0.217)#2,857 |
1
2Common Questions
What are the Top 10 Cities with the Highest Percentage of Ecuadorian Population in Connecticut?
Top 10 Cities with the Highest Percentage of Ecuadorian Population in Connecticut are:
#1
21.04%
#2
10.78%
#3
8.38%
#4
4.29%
#5
4.14%
#6
3.53%
#7
3.41%
#8
2.96%
#9
2.73%
#10
2.70%
What city has the Highest Percentage of Ecuadorian Population in Connecticut?
Saybrook Manor has the Highest Percentage of Ecuadorian Population in Connecticut with 21.04%.
What is the Percentage of Ecuadorian Population in the State of Connecticut?
Percentage of Ecuadorian Population in Connecticut is 1.11%.
What is the Percentage of Ecuadorian Population in the United States?
Percentage of Ecuadorian Population in the United States is 0.24%.