Brinckerhoff, NY Map & Demographics
Brinckerhoff Map
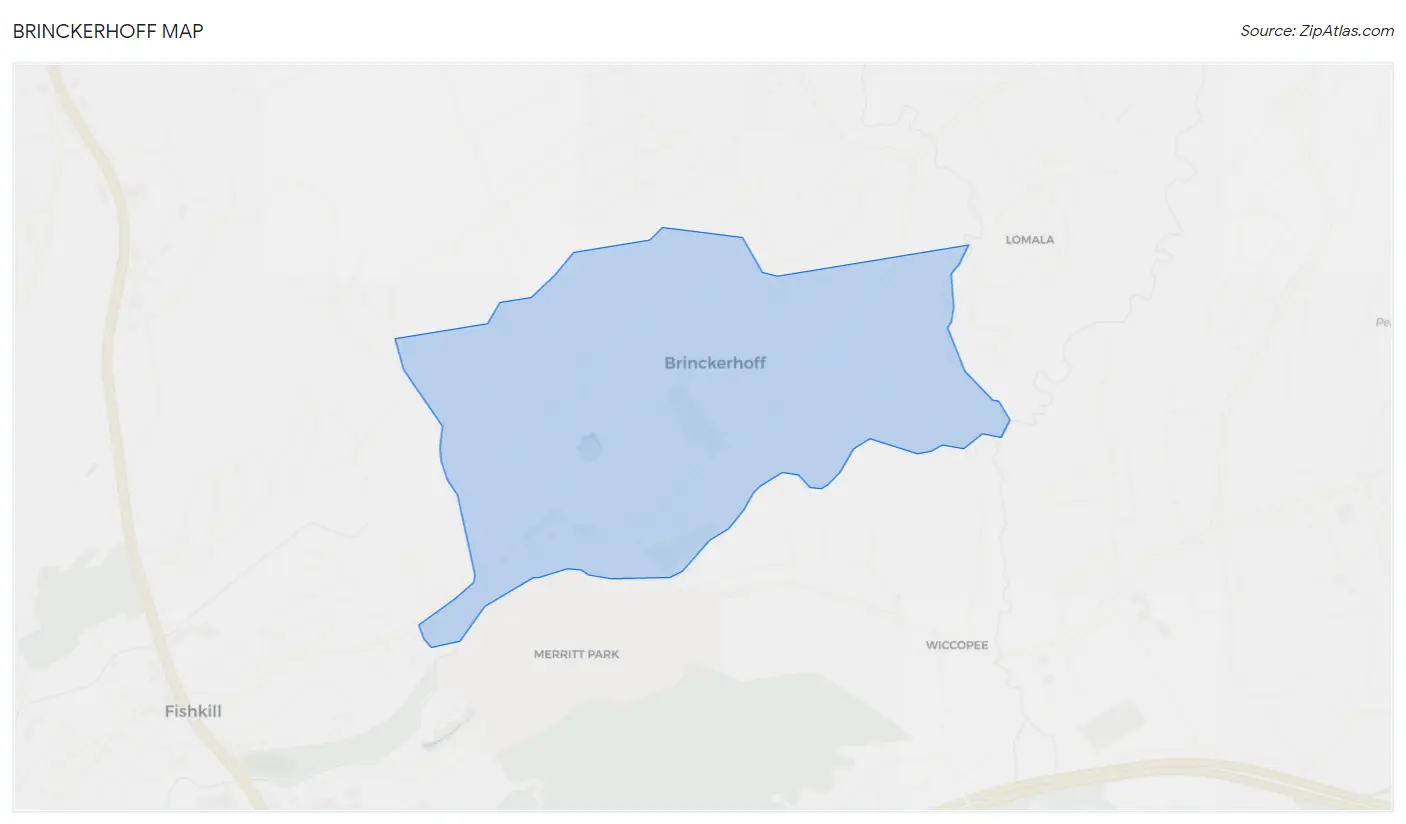
Brinckerhoff Overview
$49,331
PER CAPITA INCOME
$100,417
AVG FAMILY INCOME
$84,830
AVG HOUSEHOLD INCOME
1.8%
WAGE / INCOME GAP [ % ]
98.2¢/ $1
WAGE / INCOME GAP [ $ ]
0.43
INEQUALITY / GINI INDEX
2,519
TOTAL POPULATION
1,255
MALE POPULATION
1,264
FEMALE POPULATION
99.29
MALES / 100 FEMALES
100.72
FEMALES / 100 MALES
52.5
MEDIAN AGE
2.7
AVG FAMILY SIZE
2.1
AVG HOUSEHOLD SIZE
1,391
LABOR FORCE [ PEOPLE ]
62.5%
PERCENT IN LABOR FORCE
4.2%
UNEMPLOYMENT RATE
Income in Brinckerhoff
Income Overview in Brinckerhoff
Per Capita Income in Brinckerhoff is $49,331, while median incomes of families and households are $100,417 and $84,830 respectively.
| Characteristic | Number | Measure |
| Per Capita Income | 2,519 | $49,331 |
| Median Family Income | 738 | $100,417 |
| Mean Family Income | 738 | $132,083 |
| Median Household Income | 1,212 | $84,830 |
| Mean Household Income | 1,212 | $102,916 |
| Income Deficit | 738 | $0 |
| Wage / Income Gap (%) | 2,519 | 1.79% |
| Wage / Income Gap ($) | 2,519 | 98.21¢ per $1 |
| Gini / Inequality Index | 2,519 | 0.43 |
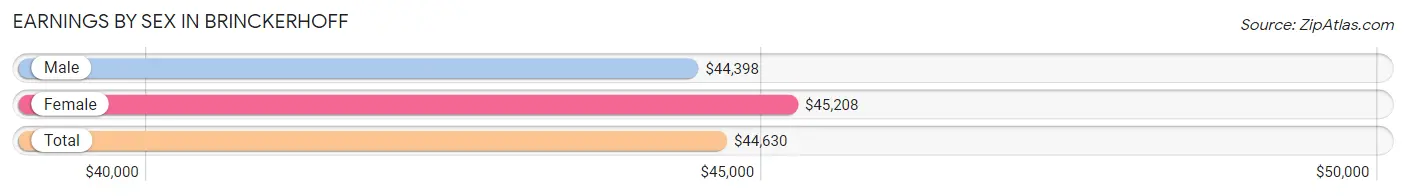
Earnings by Sex in Brinckerhoff
Average Earnings in Brinckerhoff are $44,630, $44,398 for men and $45,208 for women, a difference of 1.8%.
| Sex | Number | Average Earnings |
| Male | 819 (53.9%) | $44,398 |
| Female | 699 (46.1%) | $45,208 |
| Total | 1,518 (100.0%) | $44,630 |
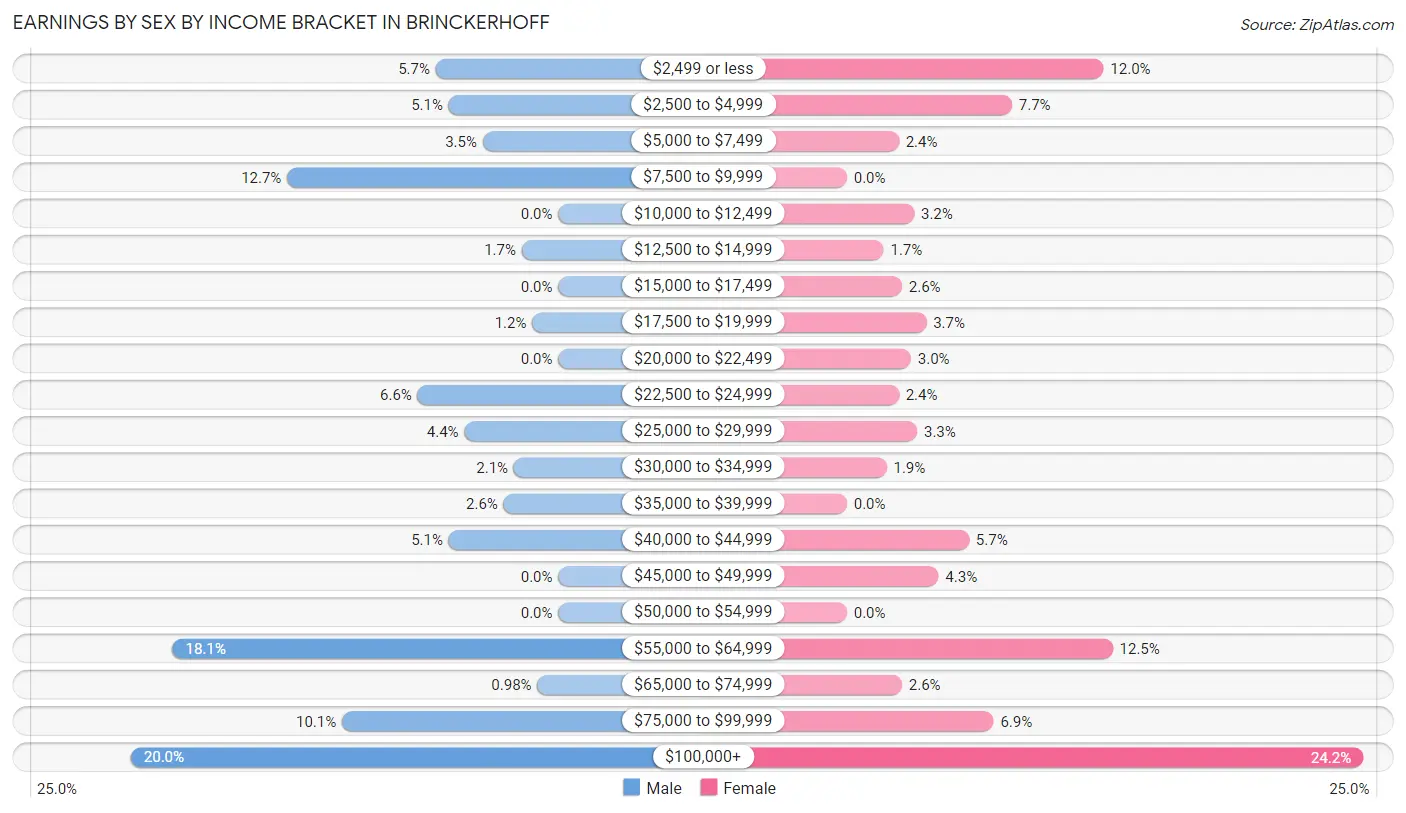
Earnings by Sex by Income Bracket in Brinckerhoff
The most common earnings brackets in Brinckerhoff are $100,000+ for men (164 | 20.0%) and $100,000+ for women (169 | 24.2%).
| Income | Male | Female |
| $2,499 or less | 47 (5.7%) | 84 (12.0%) |
| $2,500 to $4,999 | 42 (5.1%) | 54 (7.7%) |
| $5,000 to $7,499 | 29 (3.5%) | 17 (2.4%) |
| $7,500 to $9,999 | 104 (12.7%) | 0 (0.0%) |
| $10,000 to $12,499 | 0 (0.0%) | 22 (3.2%) |
| $12,500 to $14,999 | 14 (1.7%) | 12 (1.7%) |
| $15,000 to $17,499 | 0 (0.0%) | 18 (2.6%) |
| $17,500 to $19,999 | 10 (1.2%) | 26 (3.7%) |
| $20,000 to $22,499 | 0 (0.0%) | 21 (3.0%) |
| $22,500 to $24,999 | 54 (6.6%) | 17 (2.4%) |
| $25,000 to $29,999 | 36 (4.4%) | 23 (3.3%) |
| $30,000 to $34,999 | 17 (2.1%) | 13 (1.9%) |
| $35,000 to $39,999 | 21 (2.6%) | 0 (0.0%) |
| $40,000 to $44,999 | 42 (5.1%) | 40 (5.7%) |
| $45,000 to $49,999 | 0 (0.0%) | 30 (4.3%) |
| $50,000 to $54,999 | 0 (0.0%) | 0 (0.0%) |
| $55,000 to $64,999 | 148 (18.1%) | 87 (12.4%) |
| $65,000 to $74,999 | 8 (1.0%) | 18 (2.6%) |
| $75,000 to $99,999 | 83 (10.1%) | 48 (6.9%) |
| $100,000+ | 164 (20.0%) | 169 (24.2%) |
| Total | 819 (100.0%) | 699 (100.0%) |
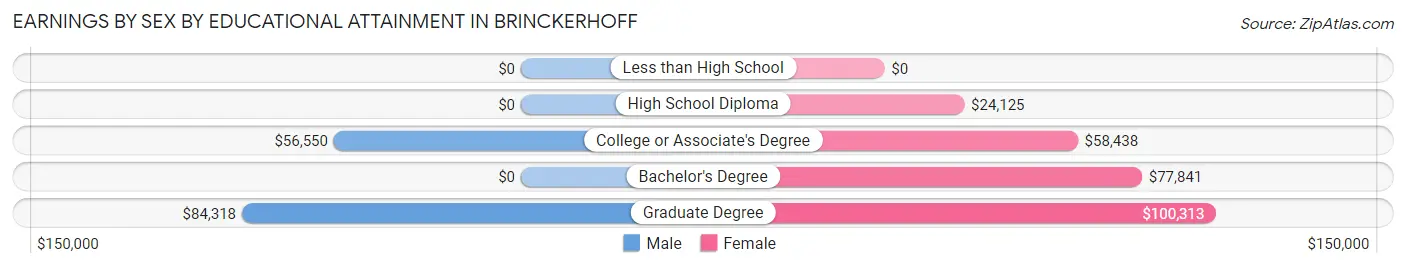
Earnings by Sex by Educational Attainment in Brinckerhoff
Average earnings in Brinckerhoff are $58,199 for men and $57,813 for women, a difference of 0.7%. Men with an educational attainment of graduate degree enjoy the highest average annual earnings of $84,318, while those with college or associate's degree education earn the least with $56,550. Women with an educational attainment of graduate degree earn the most with the average annual earnings of $100,313, while those with high school diploma education have the smallest earnings of $24,125.
| Educational Attainment | Male Income | Female Income |
| Less than High School | - | - |
| High School Diploma | - | - |
| College or Associate's Degree | $56,550 | $58,438 |
| Bachelor's Degree | - | - |
| Graduate Degree | $84,318 | $100,313 |
| Total | $58,199 | $57,813 |
Family Income in Brinckerhoff
Family Income Brackets in Brinckerhoff
According to the Brinckerhoff family income data, there are 189 families falling into the $100,000 to $149,999 income range, which is the most common income bracket and makes up 25.6% of all families. Conversely, the $25,000 to $34,999 income bracket is the least frequent group with only 7 families (0.9%) belonging to this category.
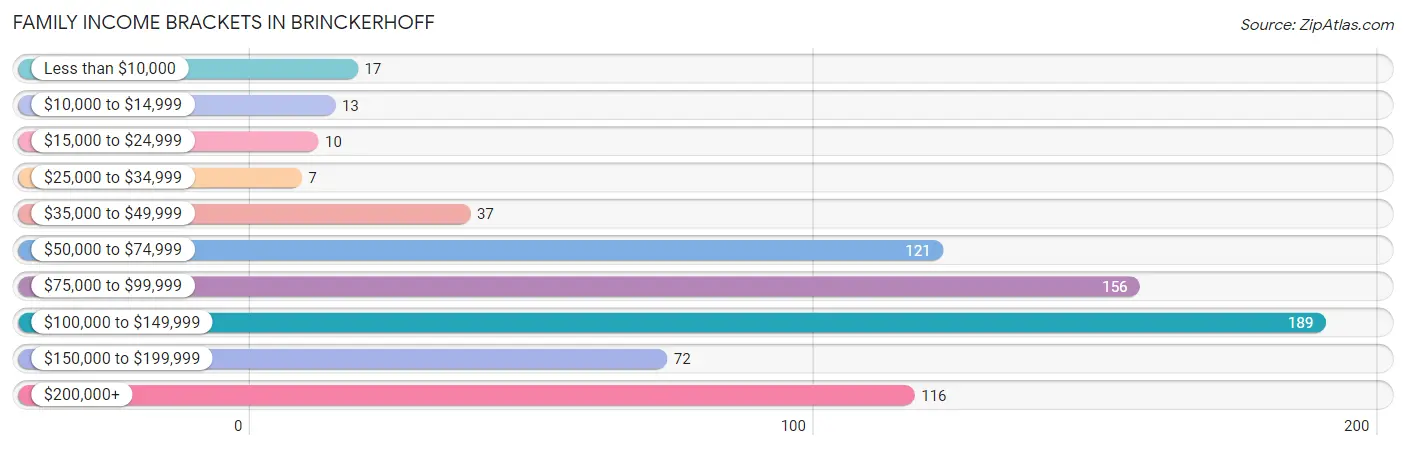
| Income Bracket | # Families | % Families |
| Less than $10,000 | 17 | 2.3% |
| $10,000 to $14,999 | 13 | 1.8% |
| $15,000 to $24,999 | 10 | 1.4% |
| $25,000 to $34,999 | 7 | 0.9% |
| $35,000 to $49,999 | 37 | 5.0% |
| $50,000 to $74,999 | 121 | 16.4% |
| $75,000 to $99,999 | 156 | 21.1% |
| $100,000 to $149,999 | 189 | 25.6% |
| $150,000 to $199,999 | 72 | 9.8% |
| $200,000+ | 116 | 15.7% |
Family Income by Famaliy Size in Brinckerhoff
5-person families (27 | 3.7%) account for the highest median family income in Brinckerhoff with $210,469 per family, while 2-person families (483 | 65.4%) have the highest median income of $44,678 per family member.
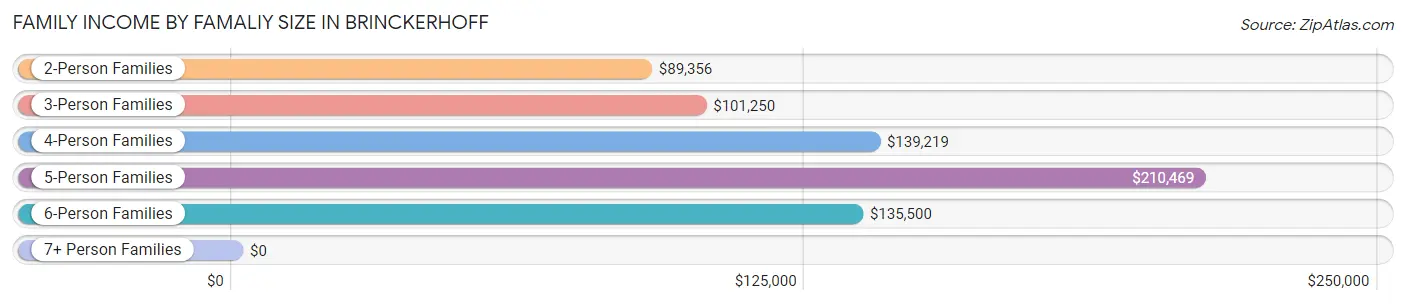
| Income Bracket | # Families | Median Income |
| 2-Person Families | 483 (65.4%) | $89,356 |
| 3-Person Families | 113 (15.3%) | $101,250 |
| 4-Person Families | 67 (9.1%) | $139,219 |
| 5-Person Families | 27 (3.7%) | $210,469 |
| 6-Person Families | 48 (6.5%) | $135,500 |
| 7+ Person Families | 0 (0.0%) | $0 |
| Total | 738 (100.0%) | $100,417 |
Family Income by Number of Earners in Brinckerhoff
The median family income in Brinckerhoff is $100,417, with families comprising 3+ earners (108) having the highest median family income of $148,542, while families with no earners (131) have the lowest median family income of $63,875, accounting for 14.6% and 17.7% of families, respectively.
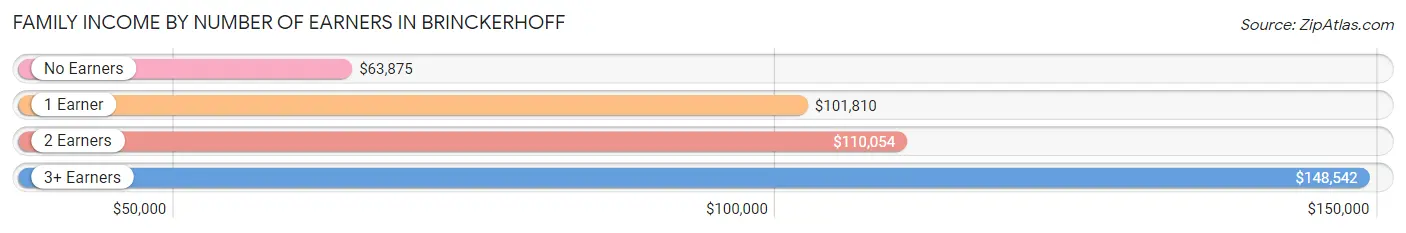
| Number of Earners | # Families | Median Income |
| No Earners | 131 (17.7%) | $63,875 |
| 1 Earner | 180 (24.4%) | $101,810 |
| 2 Earners | 319 (43.2%) | $110,054 |
| 3+ Earners | 108 (14.6%) | $148,542 |
| Total | 738 (100.0%) | $100,417 |
Household Income in Brinckerhoff
Household Income Brackets in Brinckerhoff
With 265 households falling in the category, the $100,000 to $149,999 income range is the most frequent in Brinckerhoff, accounting for 21.9% of all households. In contrast, only 40 households (3.3%) fall into the $10,000 to $14,999 income bracket, making it the least populous group.
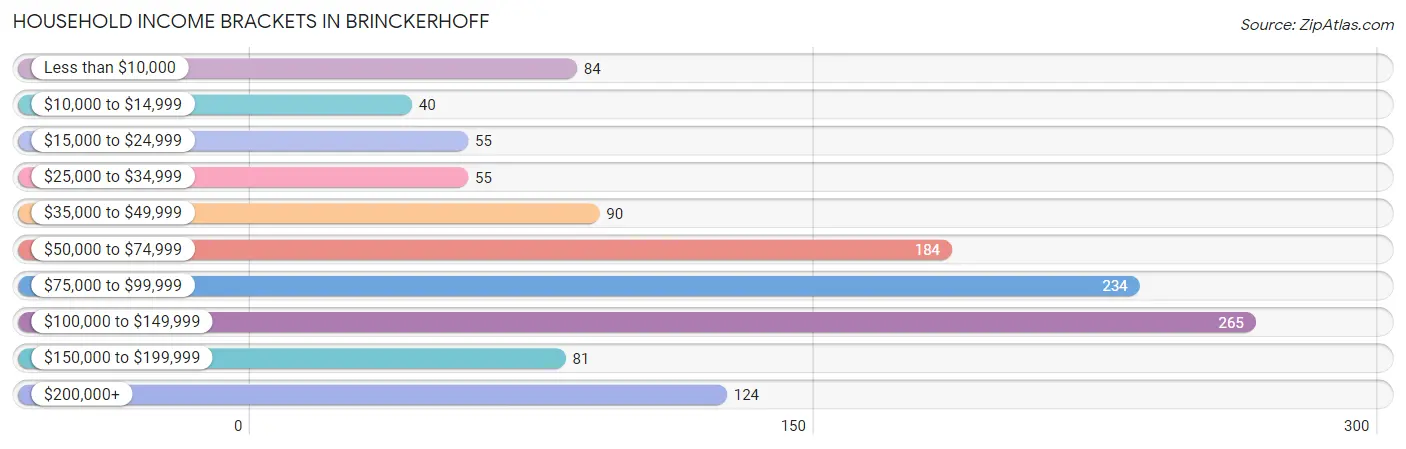
| Income Bracket | # Households | % Households |
| Less than $10,000 | 84 | 6.9% |
| $10,000 to $14,999 | 40 | 3.3% |
| $15,000 to $24,999 | 55 | 4.5% |
| $25,000 to $34,999 | 55 | 4.5% |
| $35,000 to $49,999 | 90 | 7.4% |
| $50,000 to $74,999 | 184 | 15.2% |
| $75,000 to $99,999 | 234 | 19.3% |
| $100,000 to $149,999 | 265 | 21.9% |
| $150,000 to $199,999 | 81 | 6.7% |
| $200,000+ | 124 | 10.2% |
Household Income by Householder Age in Brinckerhoff
The median household income in Brinckerhoff is $84,830, with the highest median household income of $101,883 found in the 45 to 64 years age bracket for the primary householder. A total of 454 households (37.5%) fall into this category.
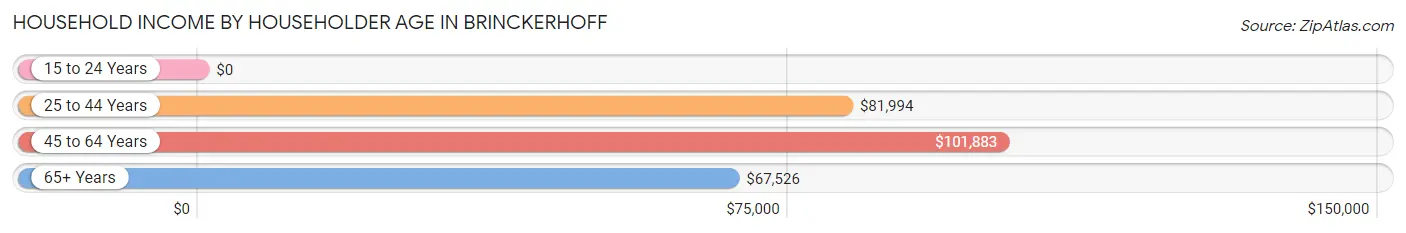
| Income Bracket | # Households | Median Income |
| 15 to 24 Years | 0 (0.0%) | $0 |
| 25 to 44 Years | 235 (19.4%) | $81,994 |
| 45 to 64 Years | 454 (37.5%) | $101,883 |
| 65+ Years | 523 (43.1%) | $67,526 |
| Total | 1,212 (100.0%) | $84,830 |
Poverty in Brinckerhoff
Income Below Poverty by Sex and Age in Brinckerhoff
With 5.2% poverty level for males and 9.8% for females among the residents of Brinckerhoff, 35 to 44 year old males and 25 to 34 year old females are the most vulnerable to poverty, with 46 males (26.1%) and 29 females (37.7%) in their respective age groups living below the poverty level.
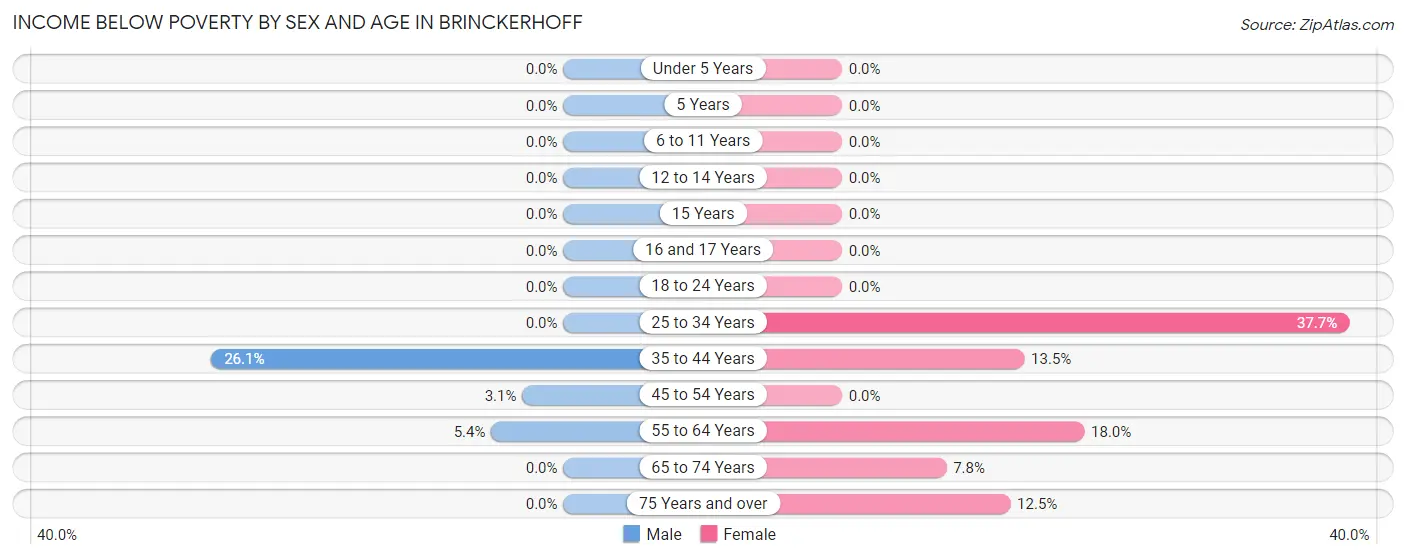
| Age Bracket | Male | Female |
| Under 5 Years | 0 (0.0%) | 0 (0.0%) |
| 5 Years | 0 (0.0%) | 0 (0.0%) |
| 6 to 11 Years | 0 (0.0%) | 0 (0.0%) |
| 12 to 14 Years | 0 (0.0%) | 0 (0.0%) |
| 15 Years | 0 (0.0%) | 0 (0.0%) |
| 16 and 17 Years | 0 (0.0%) | 0 (0.0%) |
| 18 to 24 Years | 0 (0.0%) | 0 (0.0%) |
| 25 to 34 Years | 0 (0.0%) | 29 (37.7%) |
| 35 to 44 Years | 46 (26.1%) | 13 (13.5%) |
| 45 to 54 Years | 6 (3.0%) | 0 (0.0%) |
| 55 to 64 Years | 13 (5.3%) | 34 (18.0%) |
| 65 to 74 Years | 0 (0.0%) | 21 (7.7%) |
| 75 Years and over | 0 (0.0%) | 27 (12.5%) |
| Total | 65 (5.2%) | 124 (9.8%) |
Income Above Poverty by Sex and Age in Brinckerhoff
According to the poverty statistics in Brinckerhoff, males aged under 5 years and females aged under 5 years are the age groups that are most secure financially, with 100.0% of males and 100.0% of females in these age groups living above the poverty line.
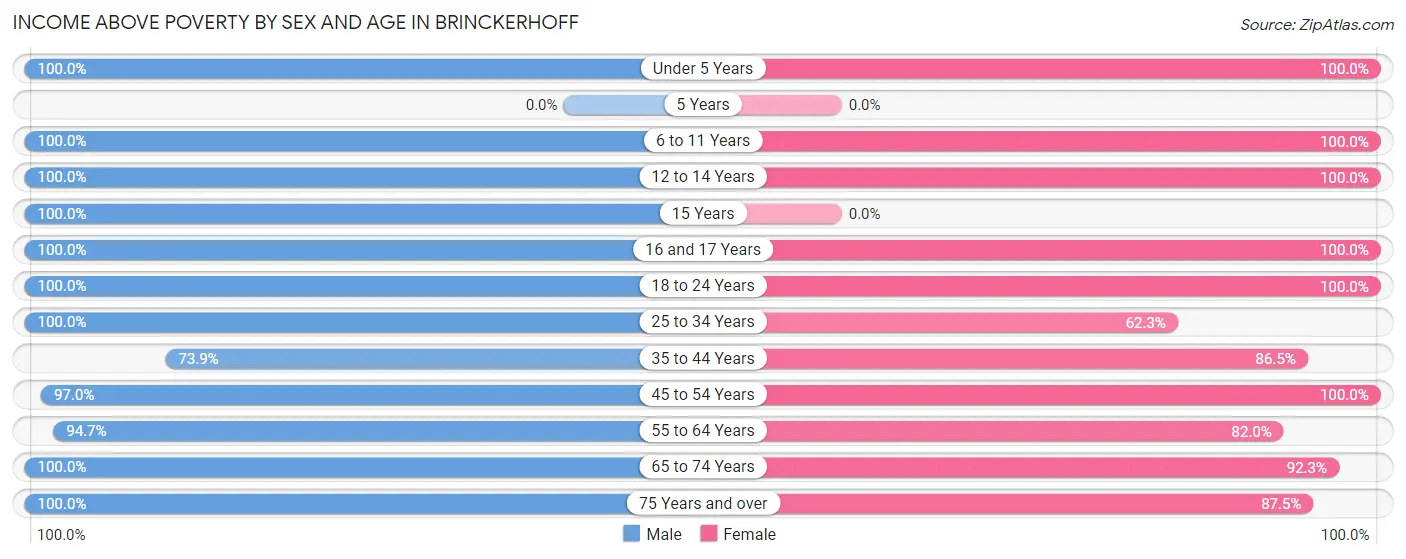
| Age Bracket | Male | Female |
| Under 5 Years | 34 (100.0%) | 43 (100.0%) |
| 5 Years | 0 (0.0%) | 0 (0.0%) |
| 6 to 11 Years | 13 (100.0%) | 71 (100.0%) |
| 12 to 14 Years | 74 (100.0%) | 32 (100.0%) |
| 15 Years | 19 (100.0%) | 0 (0.0%) |
| 16 and 17 Years | 12 (100.0%) | 41 (100.0%) |
| 18 to 24 Years | 106 (100.0%) | 59 (100.0%) |
| 25 to 34 Years | 143 (100.0%) | 48 (62.3%) |
| 35 to 44 Years | 130 (73.9%) | 83 (86.5%) |
| 45 to 54 Years | 191 (97.0%) | 169 (100.0%) |
| 55 to 64 Years | 230 (94.7%) | 155 (82.0%) |
| 65 to 74 Years | 159 (100.0%) | 250 (92.2%) |
| 75 Years and over | 71 (100.0%) | 189 (87.5%) |
| Total | 1,182 (94.8%) | 1,140 (90.2%) |
Income Below Poverty Among Married-Couple Families in Brinckerhoff
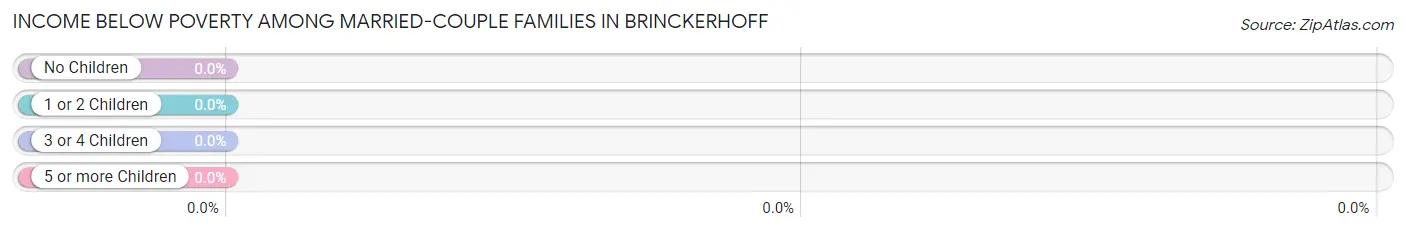
| Children | Above Poverty | Below Poverty |
| No Children | 309 (100.0%) | 0 (0.0%) |
| 1 or 2 Children | 135 (100.0%) | 0 (0.0%) |
| 3 or 4 Children | 8 (100.0%) | 0 (0.0%) |
| 5 or more Children | 0 (0.0%) | 0 (0.0%) |
| Total | 452 (100.0%) | 0 (0.0%) |
Income Below Poverty Among Single-Parent Households in Brinckerhoff
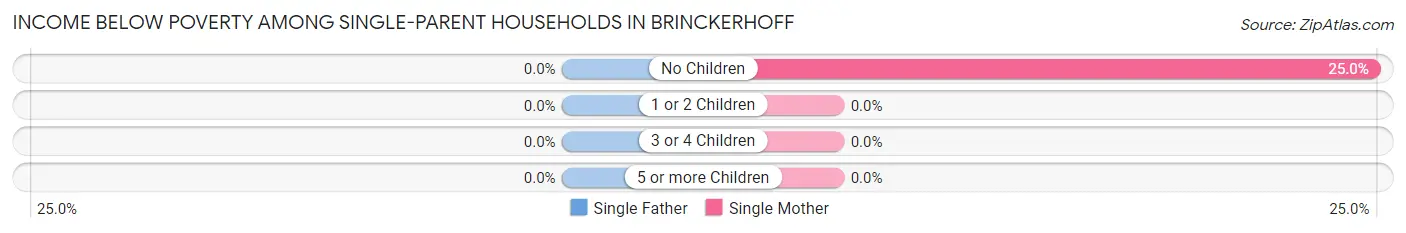
| Children | Single Father | Single Mother |
| No Children | 0 (0.0%) | 30 (25.0%) |
| 1 or 2 Children | 0 (0.0%) | 0 (0.0%) |
| 3 or 4 Children | 0 (0.0%) | 0 (0.0%) |
| 5 or more Children | 0 (0.0%) | 0 (0.0%) |
| Total | 0 (0.0%) | 30 (21.0%) |
Income Below Poverty Among Married-Couple vs Single-Parent Households in Brinckerhoff
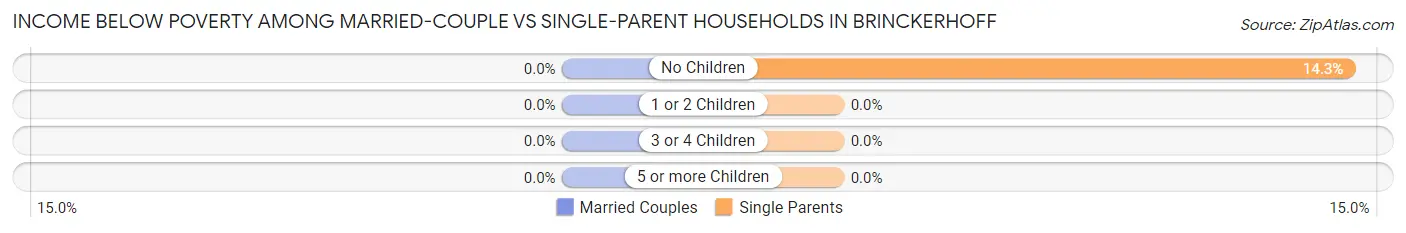
| Children | Married-Couple Families | Single-Parent Households |
| No Children | 0 (0.0%) | 30 (14.3%) |
| 1 or 2 Children | 0 (0.0%) | 0 (0.0%) |
| 3 or 4 Children | 0 (0.0%) | 0 (0.0%) |
| 5 or more Children | 0 (0.0%) | 0 (0.0%) |
| Total | 0 (0.0%) | 30 (10.5%) |
Race in Brinckerhoff
The most populous races in Brinckerhoff are White / Caucasian (2,305 | 91.5%), Hispanic or Latino (284 | 11.3%), and Two or more Races (110 | 4.4%).
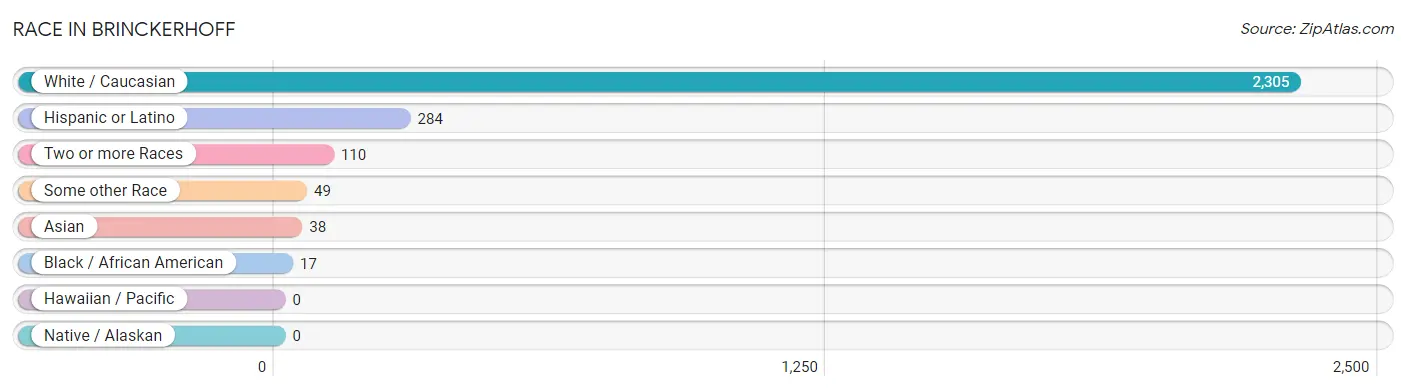
| Race | # Population | % Population |
| Asian | 38 | 1.5% |
| Black / African American | 17 | 0.7% |
| Hawaiian / Pacific | 0 | 0.0% |
| Hispanic or Latino | 284 | 11.3% |
| Native / Alaskan | 0 | 0.0% |
| White / Caucasian | 2,305 | 91.5% |
| Two or more Races | 110 | 4.4% |
| Some other Race | 49 | 1.9% |
| Total | 2,519 | 100.0% |
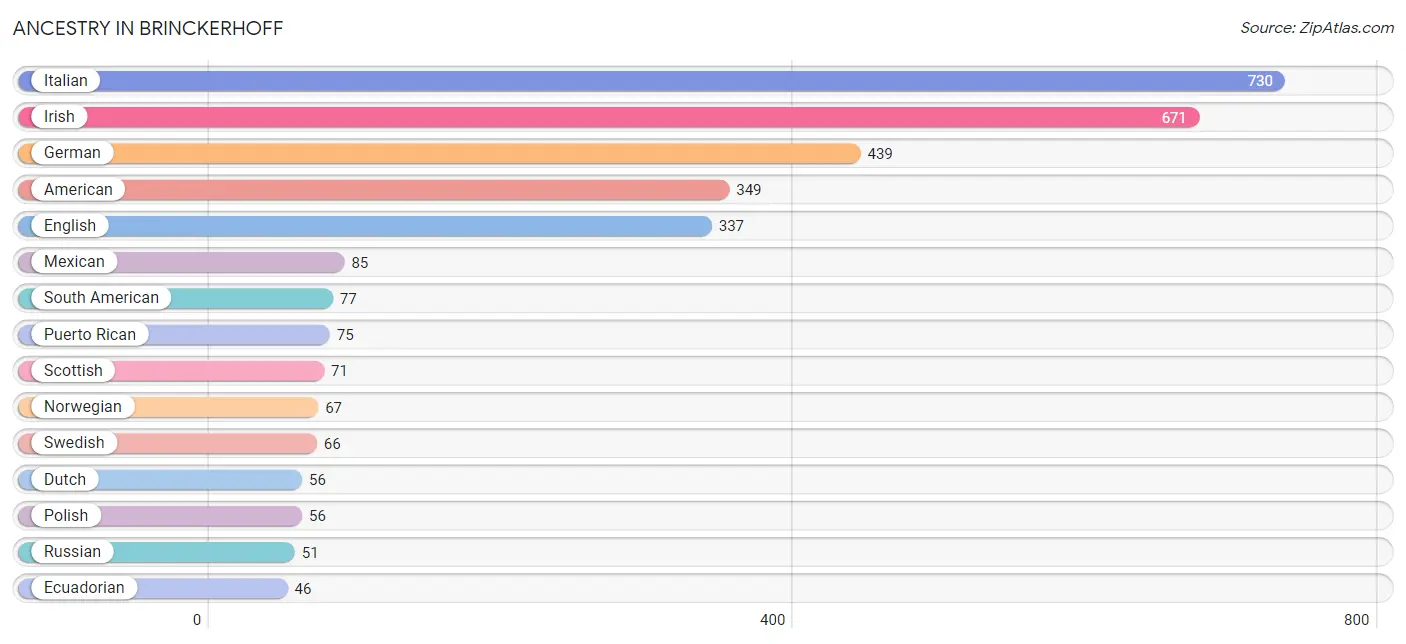
Ancestry in Brinckerhoff
The most populous ancestries reported in Brinckerhoff are Italian (730 | 29.0%), Irish (671 | 26.6%), German (439 | 17.4%), American (349 | 13.9%), and English (337 | 13.4%), together accounting for 100.3% of all Brinckerhoff residents.
| Ancestry | # Population | % Population |
| Albanian | 26 | 1.0% |
| American | 349 | 13.9% |
| Arab | 15 | 0.6% |
| Argentinean | 31 | 1.2% |
| Central American | 8 | 0.3% |
| Costa Rican | 8 | 0.3% |
| Cuban | 7 | 0.3% |
| Czech | 12 | 0.5% |
| Danish | 9 | 0.4% |
| Dutch | 56 | 2.2% |
| Ecuadorian | 46 | 1.8% |
| English | 337 | 13.4% |
| European | 9 | 0.4% |
| Finnish | 25 | 1.0% |
| French | 40 | 1.6% |
| French Canadian | 18 | 0.7% |
| German | 439 | 17.4% |
| Greek | 21 | 0.8% |
| Hungarian | 10 | 0.4% |
| Irish | 671 | 26.6% |
| Italian | 730 | 29.0% |
| Mexican | 85 | 3.4% |
| Northern European | 5 | 0.2% |
| Norwegian | 67 | 2.7% |
| Polish | 56 | 2.2% |
| Portuguese | 17 | 0.7% |
| Puerto Rican | 75 | 3.0% |
| Russian | 51 | 2.0% |
| Scottish | 71 | 2.8% |
| South American | 77 | 3.1% |
| Swedish | 66 | 2.6% |
| Syrian | 15 | 0.6% |
| Ukrainian | 30 | 1.2% | View All 33 Rows |
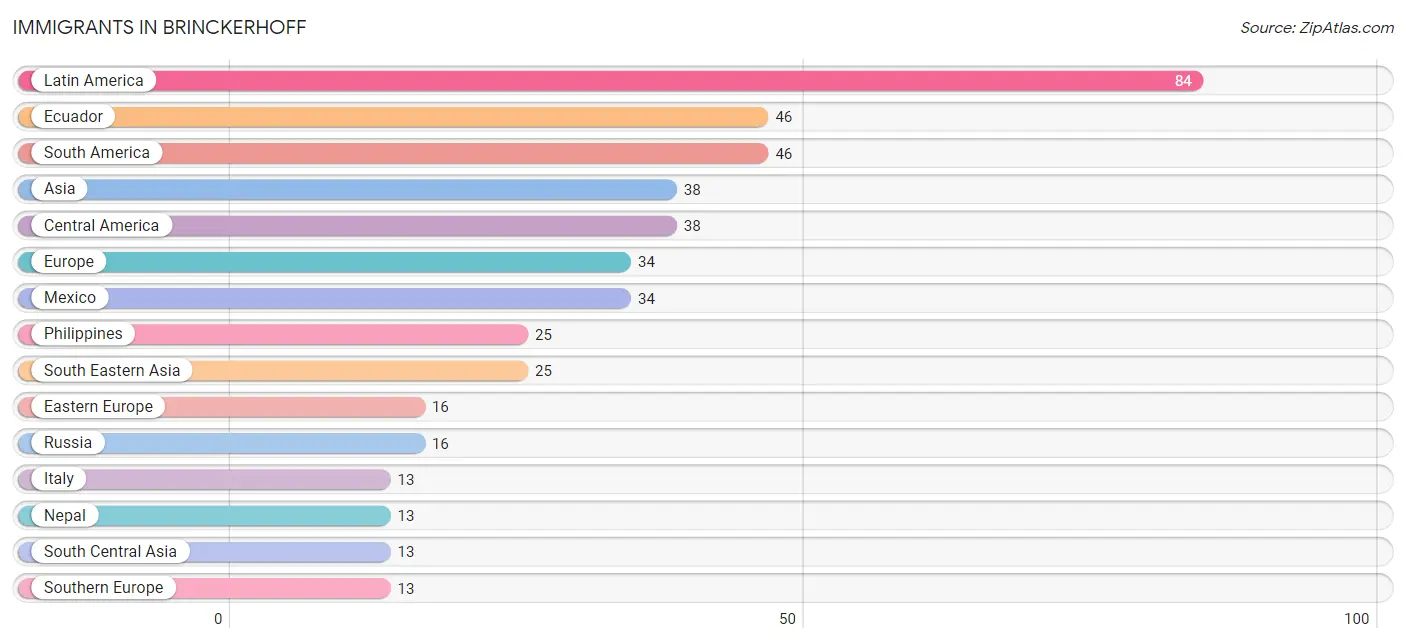
Immigrants in Brinckerhoff
The most numerous immigrant groups reported in Brinckerhoff came from Latin America (84 | 3.3%), Ecuador (46 | 1.8%), South America (46 | 1.8%), Asia (38 | 1.5%), and Central America (38 | 1.5%), together accounting for 10.0% of all Brinckerhoff residents.
| Immigration Origin | # Population | % Population |
| Asia | 38 | 1.5% |
| Central America | 38 | 1.5% |
| Costa Rica | 4 | 0.2% |
| Eastern Europe | 16 | 0.6% |
| Ecuador | 46 | 1.8% |
| Europe | 34 | 1.3% |
| Germany | 5 | 0.2% |
| Italy | 13 | 0.5% |
| Latin America | 84 | 3.3% |
| Mexico | 34 | 1.3% |
| Nepal | 13 | 0.5% |
| Philippines | 25 | 1.0% |
| Russia | 16 | 0.6% |
| South America | 46 | 1.8% |
| South Central Asia | 13 | 0.5% |
| South Eastern Asia | 25 | 1.0% |
| Southern Europe | 13 | 0.5% |
| Western Europe | 5 | 0.2% | View All 18 Rows |
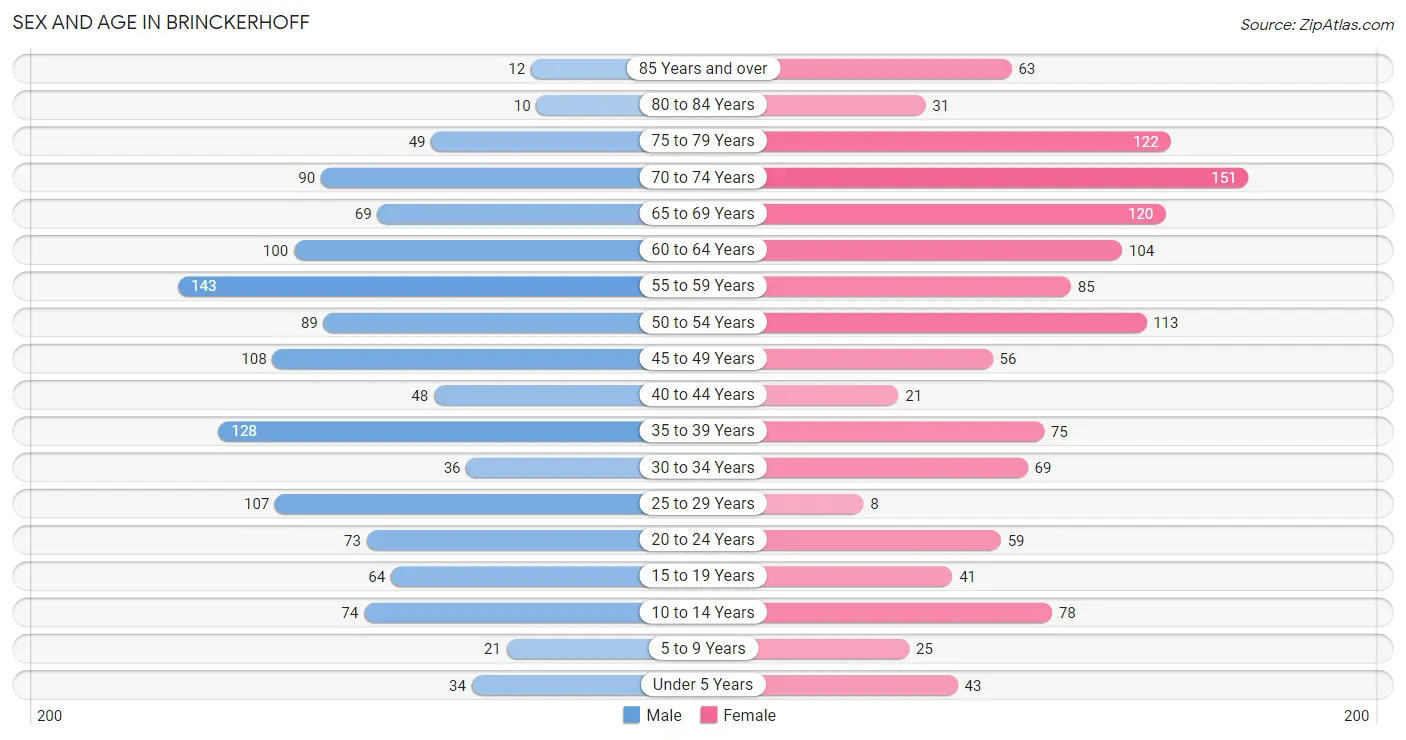
Sex and Age in Brinckerhoff
Sex and Age in Brinckerhoff
The most populous age groups in Brinckerhoff are 55 to 59 Years (143 | 11.4%) for men and 70 to 74 Years (151 | 11.9%) for women.
| Age Bracket | Male | Female |
| Under 5 Years | 34 (2.7%) | 43 (3.4%) |
| 5 to 9 Years | 21 (1.7%) | 25 (2.0%) |
| 10 to 14 Years | 74 (5.9%) | 78 (6.2%) |
| 15 to 19 Years | 64 (5.1%) | 41 (3.2%) |
| 20 to 24 Years | 73 (5.8%) | 59 (4.7%) |
| 25 to 29 Years | 107 (8.5%) | 8 (0.6%) |
| 30 to 34 Years | 36 (2.9%) | 69 (5.5%) |
| 35 to 39 Years | 128 (10.2%) | 75 (5.9%) |
| 40 to 44 Years | 48 (3.8%) | 21 (1.7%) |
| 45 to 49 Years | 108 (8.6%) | 56 (4.4%) |
| 50 to 54 Years | 89 (7.1%) | 113 (8.9%) |
| 55 to 59 Years | 143 (11.4%) | 85 (6.7%) |
| 60 to 64 Years | 100 (8.0%) | 104 (8.2%) |
| 65 to 69 Years | 69 (5.5%) | 120 (9.5%) |
| 70 to 74 Years | 90 (7.2%) | 151 (11.9%) |
| 75 to 79 Years | 49 (3.9%) | 122 (9.7%) |
| 80 to 84 Years | 10 (0.8%) | 31 (2.5%) |
| 85 Years and over | 12 (1.0%) | 63 (5.0%) |
| Total | 1,255 (100.0%) | 1,264 (100.0%) |
Families and Households in Brinckerhoff
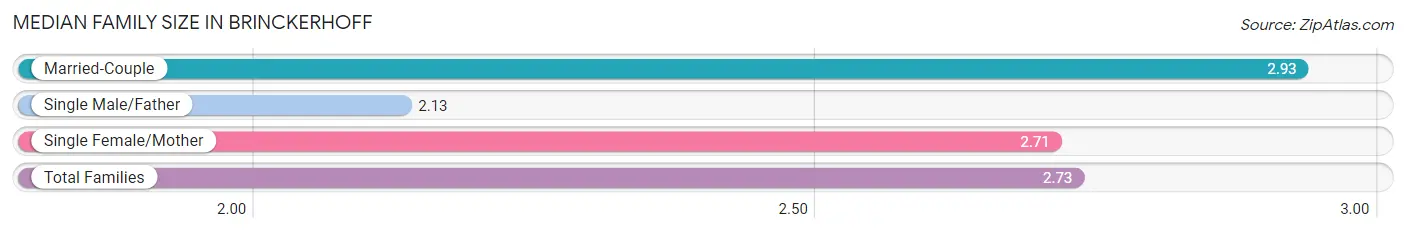
Median Family Size in Brinckerhoff
The median family size in Brinckerhoff is 2.73 persons per family, with married-couple families (452 | 61.3%) accounting for the largest median family size of 2.93 persons per family. On the other hand, single male/father families (143 | 19.4%) represent the smallest median family size with 2.13 persons per family.
| Family Type | # Families | Family Size |
| Married-Couple | 452 (61.3%) | 2.93 |
| Single Male/Father | 143 (19.4%) | 2.13 |
| Single Female/Mother | 143 (19.4%) | 2.71 |
| Total Families | 738 (100.0%) | 2.73 |
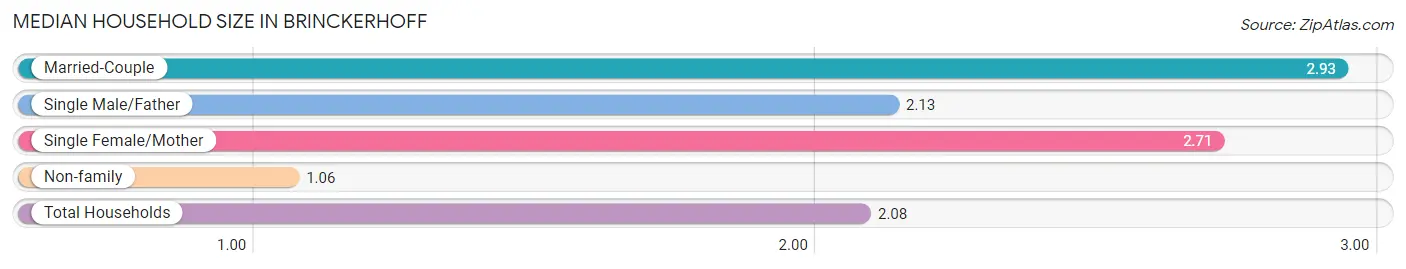
Median Household Size in Brinckerhoff
The median household size in Brinckerhoff is 2.08 persons per household, with married-couple households (452 | 37.3%) accounting for the largest median household size of 2.93 persons per household. non-family households (474 | 39.1%) represent the smallest median household size with 1.06 persons per household.
| Household Type | # Households | Household Size |
| Married-Couple | 452 (37.3%) | 2.93 |
| Single Male/Father | 143 (11.8%) | 2.13 |
| Single Female/Mother | 143 (11.8%) | 2.71 |
| Non-family | 474 (39.1%) | 1.06 |
| Total Households | 1,212 (100.0%) | 2.08 |
Household Size by Marriage Status in Brinckerhoff
Out of a total of 1,212 households in Brinckerhoff, 738 (60.9%) are family households, while 474 (39.1%) are nonfamily households. The most numerous type of family households are 2-person households, comprising 483, and the most common type of nonfamily households are 1-person households, comprising 456.
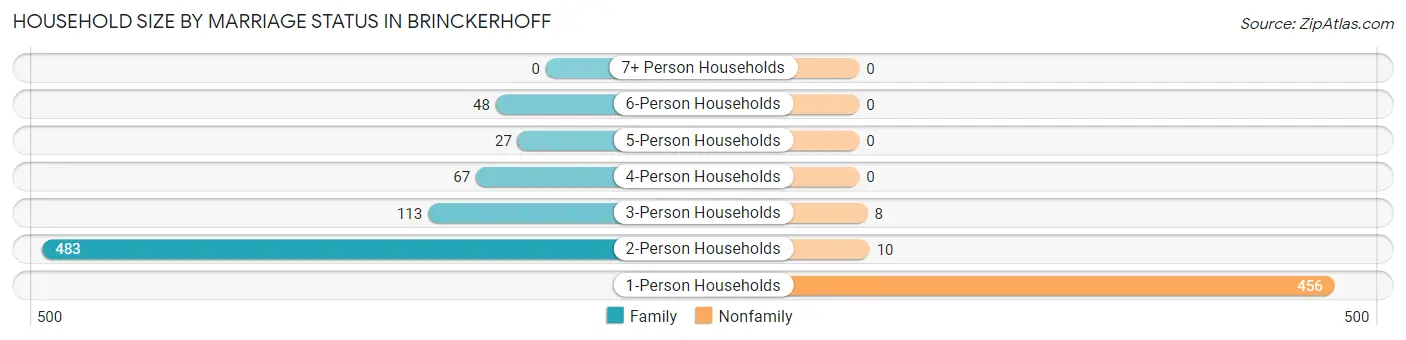
| Household Size | Family Households | Nonfamily Households |
| 1-Person Households | - | 456 (37.6%) |
| 2-Person Households | 483 (39.9%) | 10 (0.8%) |
| 3-Person Households | 113 (9.3%) | 8 (0.7%) |
| 4-Person Households | 67 (5.5%) | 0 (0.0%) |
| 5-Person Households | 27 (2.2%) | 0 (0.0%) |
| 6-Person Households | 48 (4.0%) | 0 (0.0%) |
| 7+ Person Households | 0 (0.0%) | 0 (0.0%) |
| Total | 738 (60.9%) | 474 (39.1%) |
Female Fertility in Brinckerhoff
Fertility by Age in Brinckerhoff
Average fertility rate in Brinckerhoff is 58.0 births per 1,000 women. Women in the age bracket of 35 to 50 years have the highest fertility rate with 79.0 births per 1,000 women. Women in the age bracket of 35 to 50 years acount for 63.2% of all women with births.
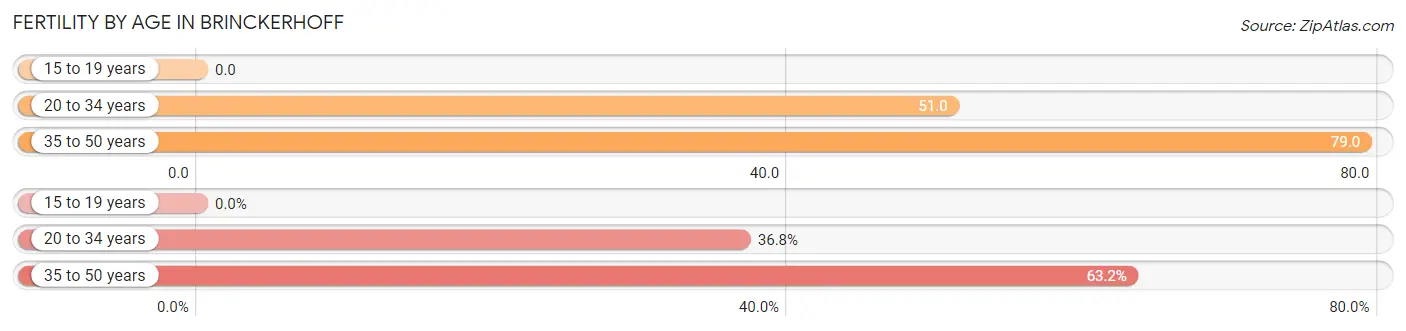
| Age Bracket | Women with Births | Births / 1,000 Women |
| 15 to 19 years | 0 (0.0%) | 0.0 |
| 20 to 34 years | 7 (36.8%) | 51.0 |
| 35 to 50 years | 12 (63.2%) | 79.0 |
| Total | 19 (100.0%) | 58.0 |
Fertility by Age by Marriage Status in Brinckerhoff
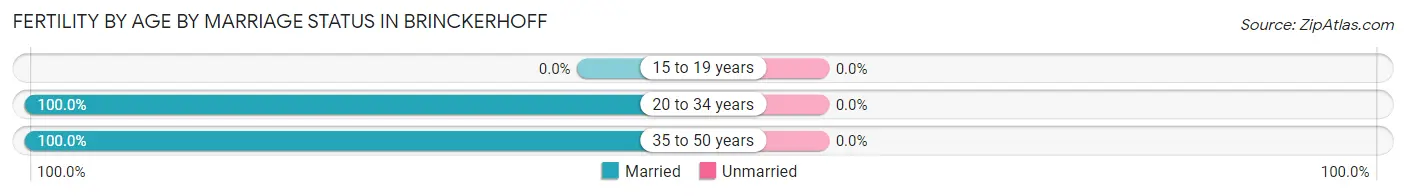
| Age Bracket | Married | Unmarried |
| 15 to 19 years | 0 (0.0%) | 0 (0.0%) |
| 20 to 34 years | 7 (100.0%) | 0 (0.0%) |
| 35 to 50 years | 12 (100.0%) | 0 (0.0%) |
| Total | 19 (100.0%) | 0 (0.0%) |
Fertility by Education in Brinckerhoff
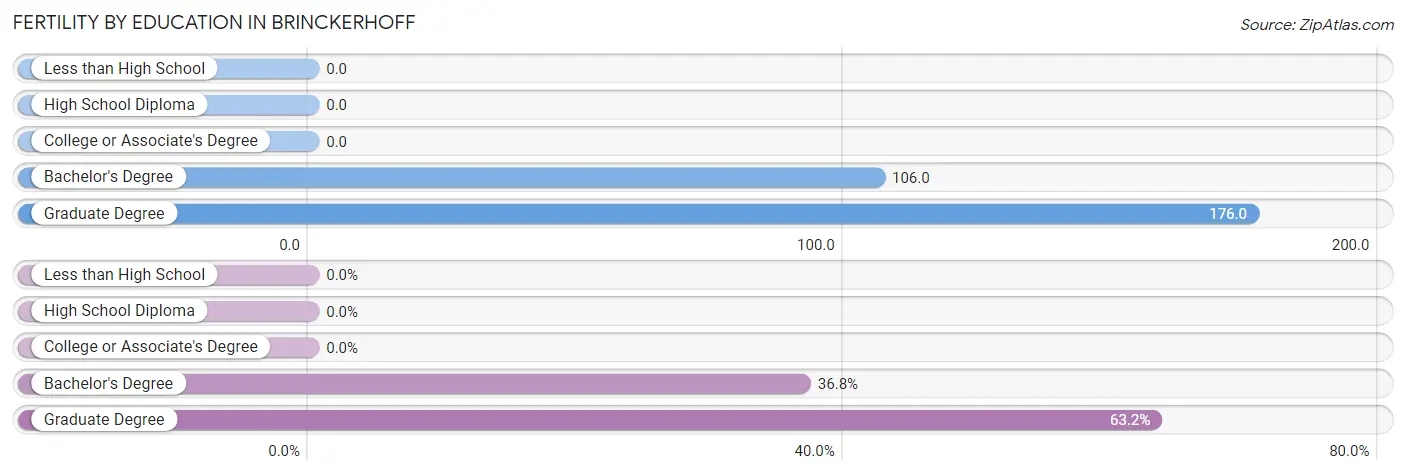
| Educational Attainment | Women with Births | Births / 1,000 Women |
| Less than High School | 0 (0.0%) | 0.0 |
| High School Diploma | 0 (0.0%) | 0.0 |
| College or Associate's Degree | 0 (0.0%) | 0.0 |
| Bachelor's Degree | 7 (36.8%) | 106.0 |
| Graduate Degree | 12 (63.2%) | 176.0 |
| Total | 19 (100.0%) | 58.0 |
Fertility by Education by Marriage Status in Brinckerhoff
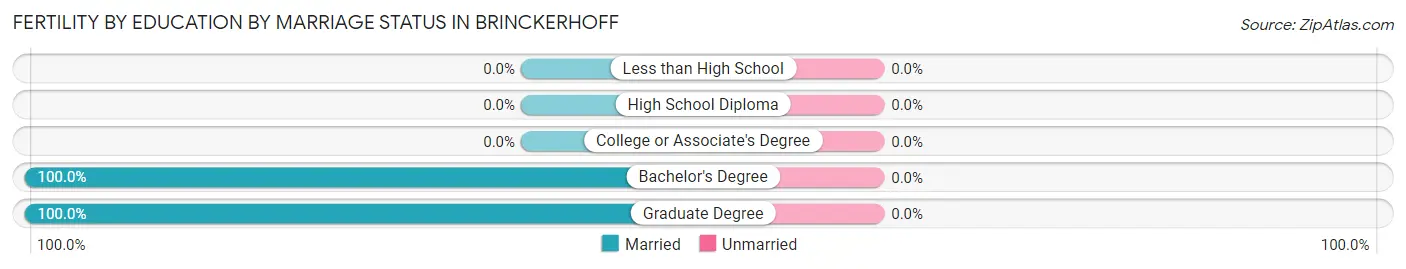
| Educational Attainment | Married | Unmarried |
| Less than High School | 0 (0.0%) | 0 (0.0%) |
| High School Diploma | 0 (0.0%) | 0 (0.0%) |
| College or Associate's Degree | 0 (0.0%) | 0 (0.0%) |
| Bachelor's Degree | 7 (100.0%) | 0 (0.0%) |
| Graduate Degree | 12 (100.0%) | 0 (0.0%) |
| Total | 19 (100.0%) | 0 (0.0%) |
Employment Characteristics in Brinckerhoff
Employment by Class of Employer in Brinckerhoff
Among the 1,293 employed individuals in Brinckerhoff, private company employees (818 | 63.3%), local government employees (157 | 12.1%), and self-employed (not incorporated) (98 | 7.6%) make up the most common classes of employment.
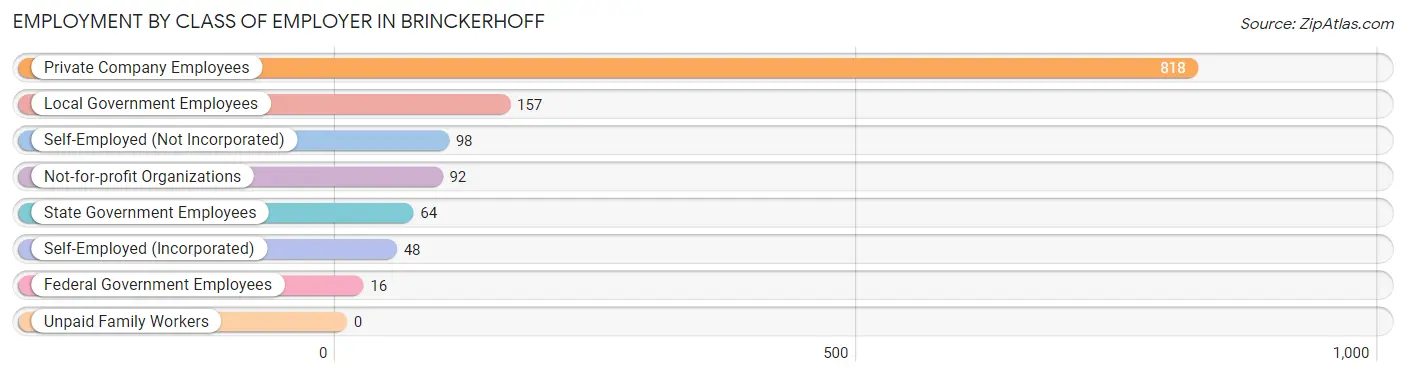
| Employer Class | # Employees | % Employees |
| Private Company Employees | 818 | 63.3% |
| Self-Employed (Incorporated) | 48 | 3.7% |
| Self-Employed (Not Incorporated) | 98 | 7.6% |
| Not-for-profit Organizations | 92 | 7.1% |
| Local Government Employees | 157 | 12.1% |
| State Government Employees | 64 | 5.0% |
| Federal Government Employees | 16 | 1.2% |
| Unpaid Family Workers | 0 | 0.0% |
| Total | 1,293 | 100.0% |
Employment Status by Age in Brinckerhoff
According to the labor force statistics for Brinckerhoff, out of the total population over 16 years of age (2,225), 62.5% or 1,391 individuals are in the labor force, with 4.2% or 58 of them unemployed. The age group with the highest labor force participation rate is 25 to 29 years, with 100.0% or 115 individuals in the labor force. Within the labor force, the 20 to 24 years age range has the highest percentage of unemployed individuals, with 23.1% or 27 of them being unemployed.
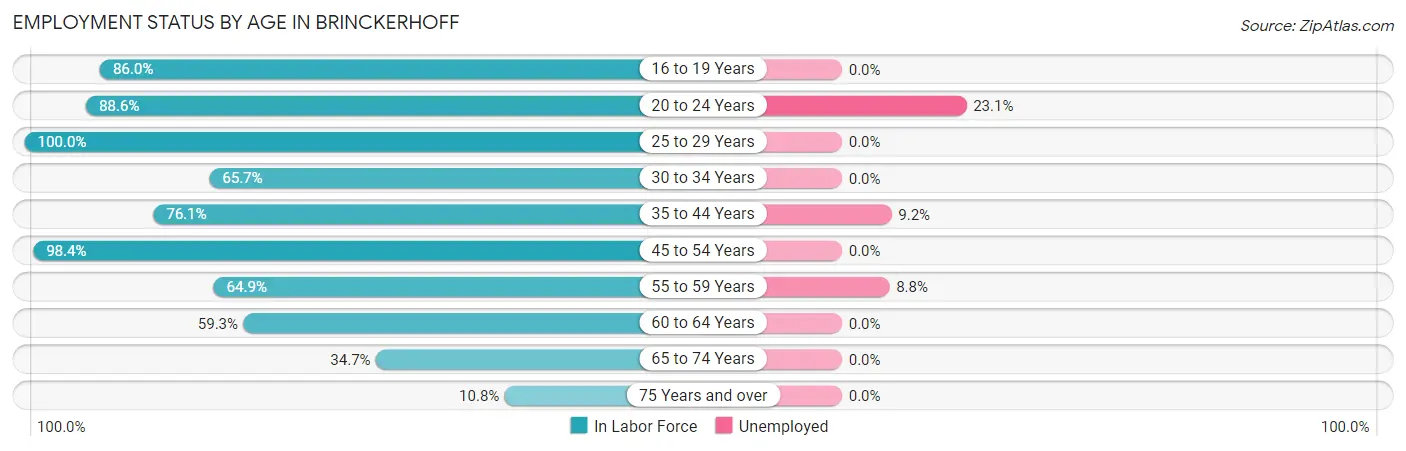
| Age Bracket | In Labor Force | Unemployed |
| 16 to 19 Years | 74 (86.0%) | 0 (0.0%) |
| 20 to 24 Years | 117 (88.6%) | 27 (23.1%) |
| 25 to 29 Years | 115 (100.0%) | 0 (0.0%) |
| 30 to 34 Years | 69 (65.7%) | 0 (0.0%) |
| 35 to 44 Years | 207 (76.1%) | 19 (9.2%) |
| 45 to 54 Years | 360 (98.4%) | 0 (0.0%) |
| 55 to 59 Years | 148 (64.9%) | 13 (8.8%) |
| 60 to 64 Years | 121 (59.3%) | 0 (0.0%) |
| 65 to 74 Years | 149 (34.7%) | 0 (0.0%) |
| 75 Years and over | 31 (10.8%) | 0 (0.0%) |
| Total | 1,391 (62.5%) | 58 (4.2%) |
Employment Status by Educational Attainment in Brinckerhoff
According to labor force statistics for Brinckerhoff, 79.1% of individuals (1,020) out of the total population between 25 and 64 years of age (1,290) are in the labor force, with 3.1% or 32 of them being unemployed. The group with the highest labor force participation rate are those with the educational attainment of less than high school, with 100.0% or 13 individuals in the labor force. Within the labor force, individuals with college / associate degree education have the highest percentage of unemployment, with 9.3% or 32 of them being unemployed.
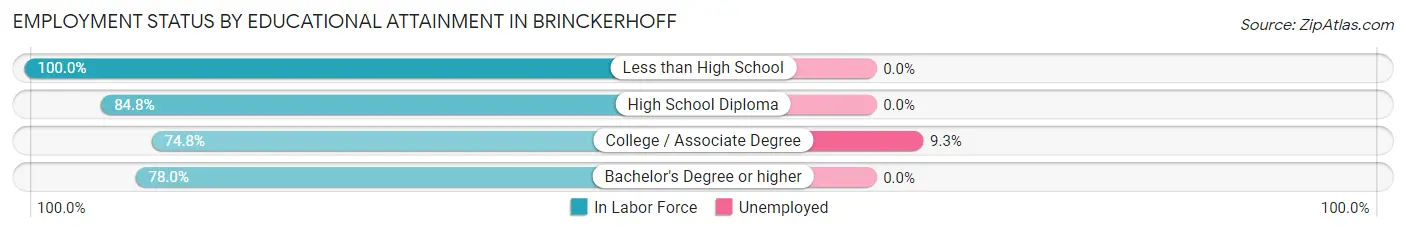
| Educational Attainment | In Labor Force | Unemployed |
| Less than High School | 13 (100.0%) | 0 (0.0%) |
| High School Diploma | 319 (84.8%) | 0 (0.0%) |
| College / Associate Degree | 344 (74.8%) | 43 (9.3%) |
| Bachelor's Degree or higher | 344 (78.0%) | 0 (0.0%) |
| Total | 1,020 (79.1%) | 40 (3.1%) |
Employment Occupations by Sex in Brinckerhoff
Management, Business, Science and Arts Occupations
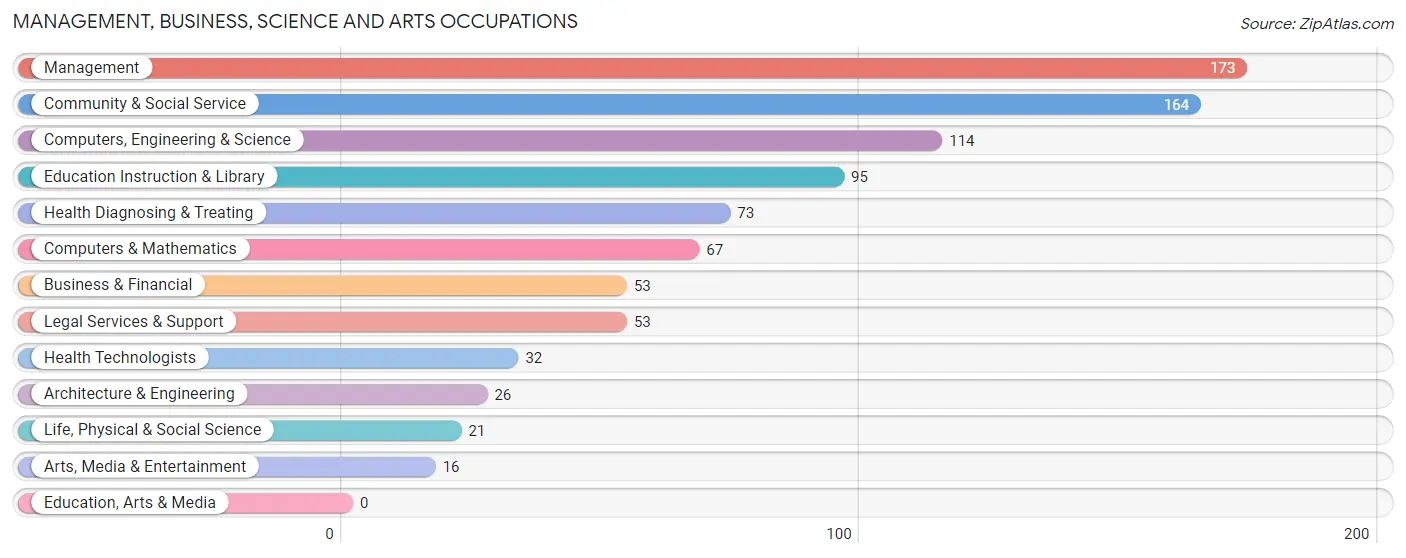
The most common Management, Business, Science and Arts occupations in Brinckerhoff are Management (173 | 13.0%), Community & Social Service (164 | 12.3%), Computers, Engineering & Science (114 | 8.6%), Education Instruction & Library (95 | 7.1%), and Health Diagnosing & Treating (73 | 5.5%).
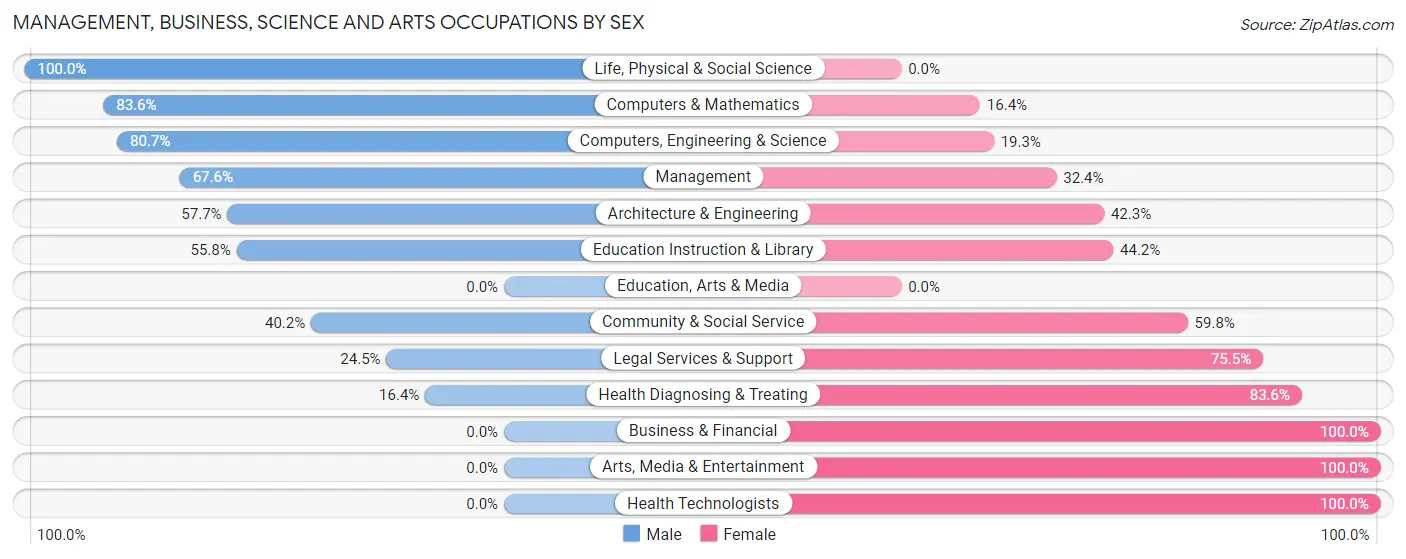
Management, Business, Science and Arts Occupations by Sex
Within the Management, Business, Science and Arts occupations in Brinckerhoff, the most male-oriented occupations are Life, Physical & Social Science (100.0%), Computers & Mathematics (83.6%), and Computers, Engineering & Science (80.7%), while the most female-oriented occupations are Business & Financial (100.0%), Arts, Media & Entertainment (100.0%), and Health Technologists (100.0%).
| Occupation | Male | Female |
| Management | 117 (67.6%) | 56 (32.4%) |
| Business & Financial | 0 (0.0%) | 53 (100.0%) |
| Computers, Engineering & Science | 92 (80.7%) | 22 (19.3%) |
| Computers & Mathematics | 56 (83.6%) | 11 (16.4%) |
| Architecture & Engineering | 15 (57.7%) | 11 (42.3%) |
| Life, Physical & Social Science | 21 (100.0%) | 0 (0.0%) |
| Community & Social Service | 66 (40.2%) | 98 (59.8%) |
| Education, Arts & Media | 0 (0.0%) | 0 (0.0%) |
| Legal Services & Support | 13 (24.5%) | 40 (75.5%) |
| Education Instruction & Library | 53 (55.8%) | 42 (44.2%) |
| Arts, Media & Entertainment | 0 (0.0%) | 16 (100.0%) |
| Health Diagnosing & Treating | 12 (16.4%) | 61 (83.6%) |
| Health Technologists | 0 (0.0%) | 32 (100.0%) |
| Total (Category) | 287 (49.7%) | 290 (50.3%) |
| Total (Overall) | 728 (54.6%) | 604 (45.4%) |
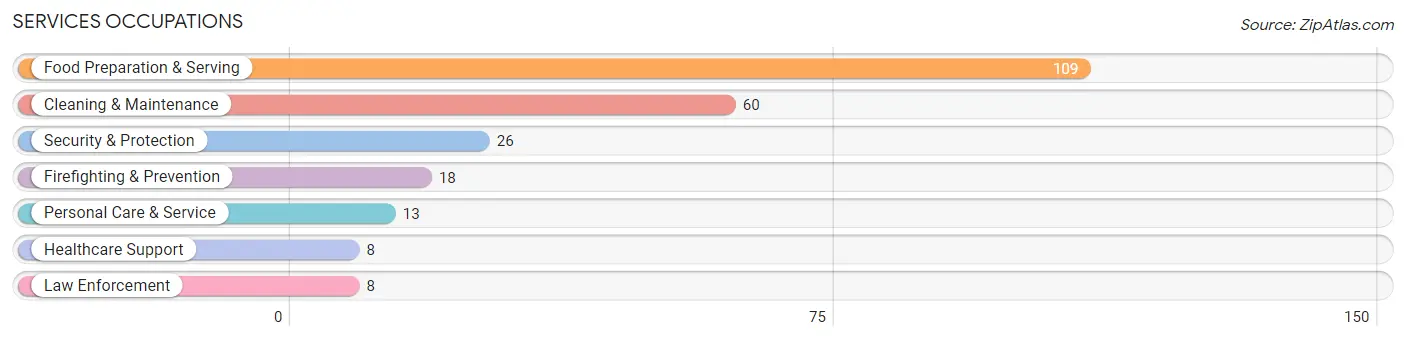
Services Occupations
The most common Services occupations in Brinckerhoff are Food Preparation & Serving (109 | 8.2%), Cleaning & Maintenance (60 | 4.5%), Security & Protection (26 | 1.9%), Firefighting & Prevention (18 | 1.3%), and Personal Care & Service (13 | 1.0%).
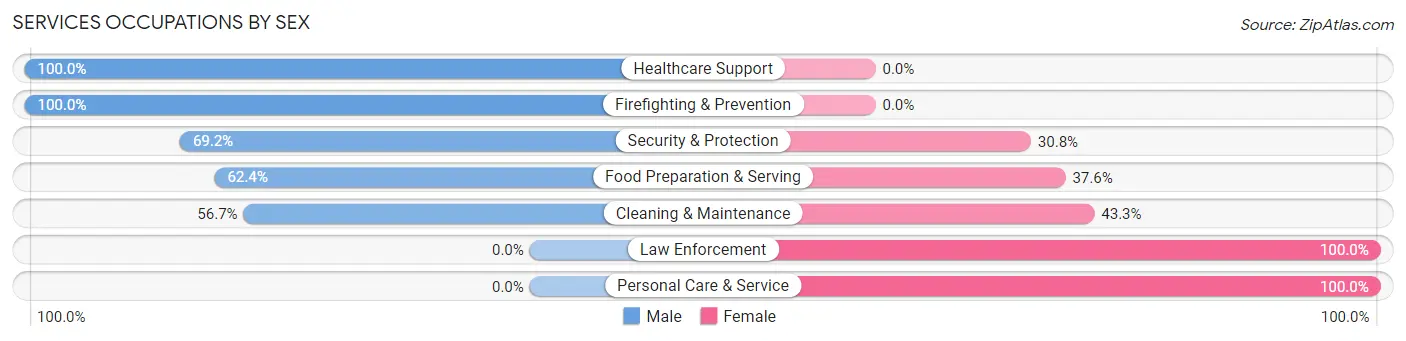
Services Occupations by Sex
Within the Services occupations in Brinckerhoff, the most male-oriented occupations are Healthcare Support (100.0%), Firefighting & Prevention (100.0%), and Security & Protection (69.2%), while the most female-oriented occupations are Law Enforcement (100.0%), Personal Care & Service (100.0%), and Cleaning & Maintenance (43.3%).
| Occupation | Male | Female |
| Healthcare Support | 8 (100.0%) | 0 (0.0%) |
| Security & Protection | 18 (69.2%) | 8 (30.8%) |
| Firefighting & Prevention | 18 (100.0%) | 0 (0.0%) |
| Law Enforcement | 0 (0.0%) | 8 (100.0%) |
| Food Preparation & Serving | 68 (62.4%) | 41 (37.6%) |
| Cleaning & Maintenance | 34 (56.7%) | 26 (43.3%) |
| Personal Care & Service | 0 (0.0%) | 13 (100.0%) |
| Total (Category) | 128 (59.3%) | 88 (40.7%) |
| Total (Overall) | 728 (54.6%) | 604 (45.4%) |
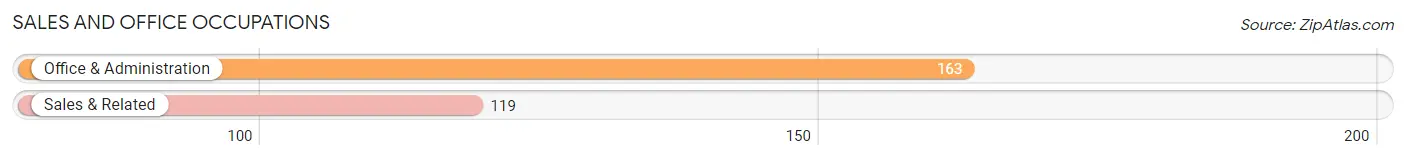
Sales and Office Occupations
The most common Sales and Office occupations in Brinckerhoff are Office & Administration (163 | 12.2%), and Sales & Related (119 | 8.9%).
Sales and Office Occupations by Sex
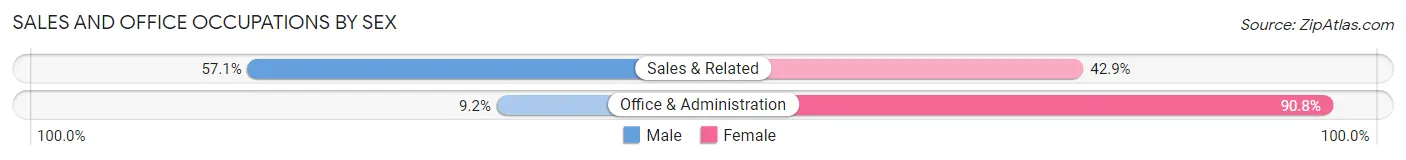
| Occupation | Male | Female |
| Sales & Related | 68 (57.1%) | 51 (42.9%) |
| Office & Administration | 15 (9.2%) | 148 (90.8%) |
| Total (Category) | 83 (29.4%) | 199 (70.6%) |
| Total (Overall) | 728 (54.6%) | 604 (45.4%) |
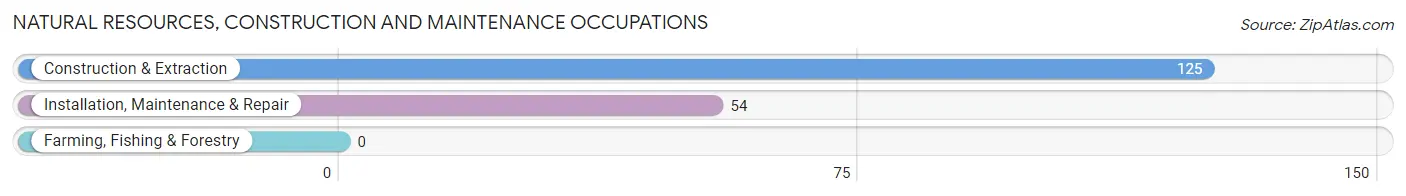
Natural Resources, Construction and Maintenance Occupations
The most common Natural Resources, Construction and Maintenance occupations in Brinckerhoff are Construction & Extraction (125 | 9.4%), and Installation, Maintenance & Repair (54 | 4.1%).
Natural Resources, Construction and Maintenance Occupations by Sex
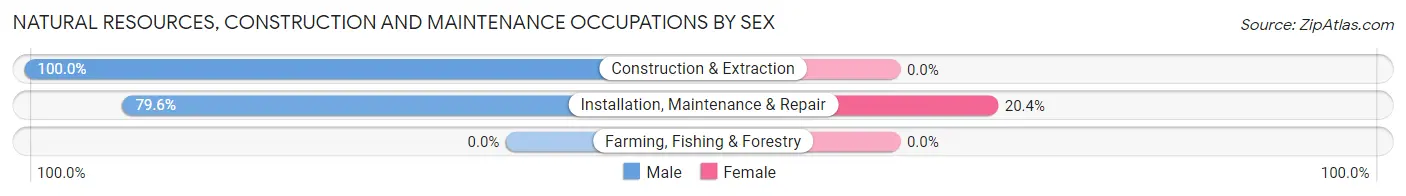
| Occupation | Male | Female |
| Farming, Fishing & Forestry | 0 (0.0%) | 0 (0.0%) |
| Construction & Extraction | 125 (100.0%) | 0 (0.0%) |
| Installation, Maintenance & Repair | 43 (79.6%) | 11 (20.4%) |
| Total (Category) | 168 (93.9%) | 11 (6.1%) |
| Total (Overall) | 728 (54.6%) | 604 (45.4%) |
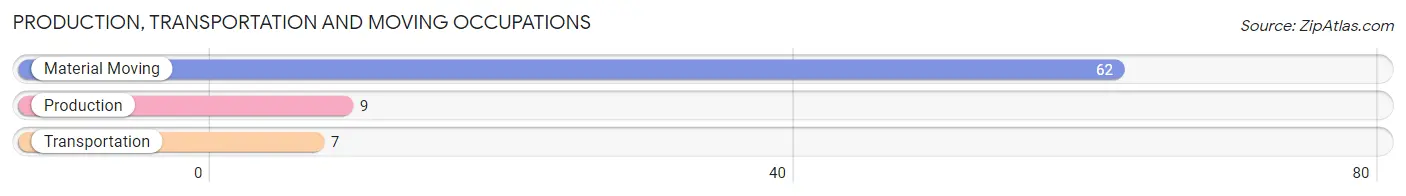
Production, Transportation and Moving Occupations
The most common Production, Transportation and Moving occupations in Brinckerhoff are Material Moving (62 | 4.6%), Production (9 | 0.7%), and Transportation (7 | 0.5%).
Production, Transportation and Moving Occupations by Sex
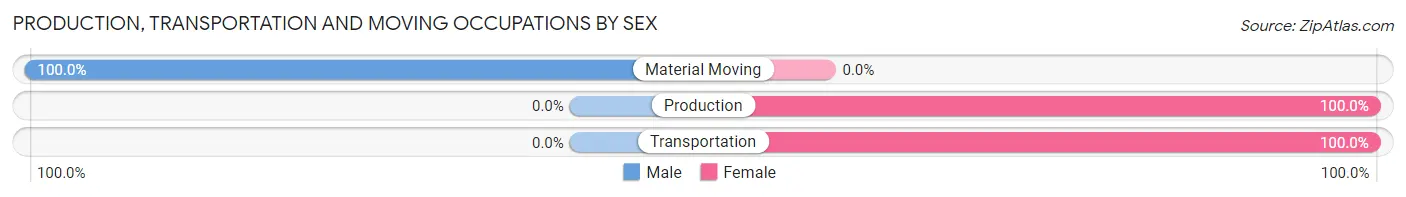
| Occupation | Male | Female |
| Production | 0 (0.0%) | 9 (100.0%) |
| Transportation | 0 (0.0%) | 7 (100.0%) |
| Material Moving | 62 (100.0%) | 0 (0.0%) |
| Total (Category) | 62 (79.5%) | 16 (20.5%) |
| Total (Overall) | 728 (54.6%) | 604 (45.4%) |
Employment Industries by Sex in Brinckerhoff
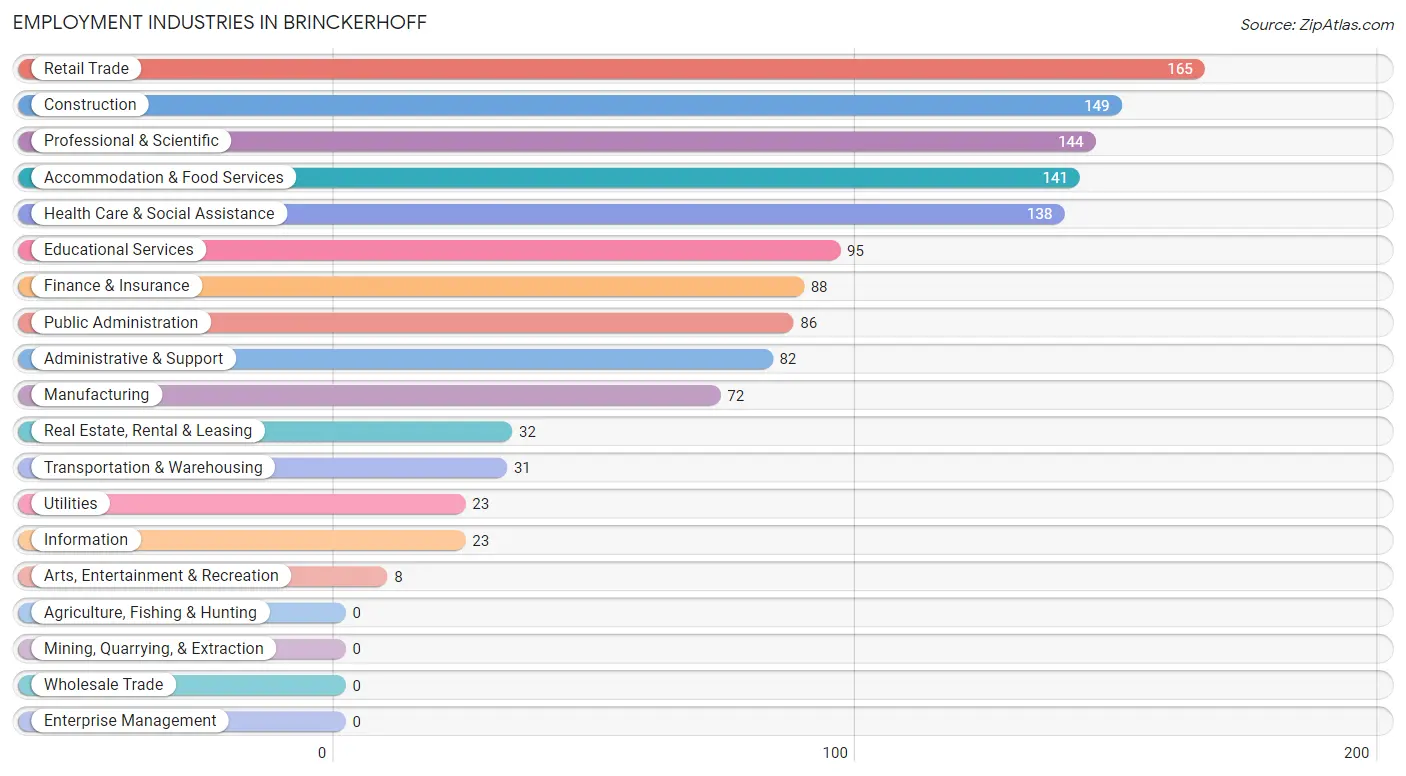
Employment Industries in Brinckerhoff
The major employment industries in Brinckerhoff include Retail Trade (165 | 12.4%), Construction (149 | 11.2%), Professional & Scientific (144 | 10.8%), Accommodation & Food Services (141 | 10.6%), and Health Care & Social Assistance (138 | 10.4%).
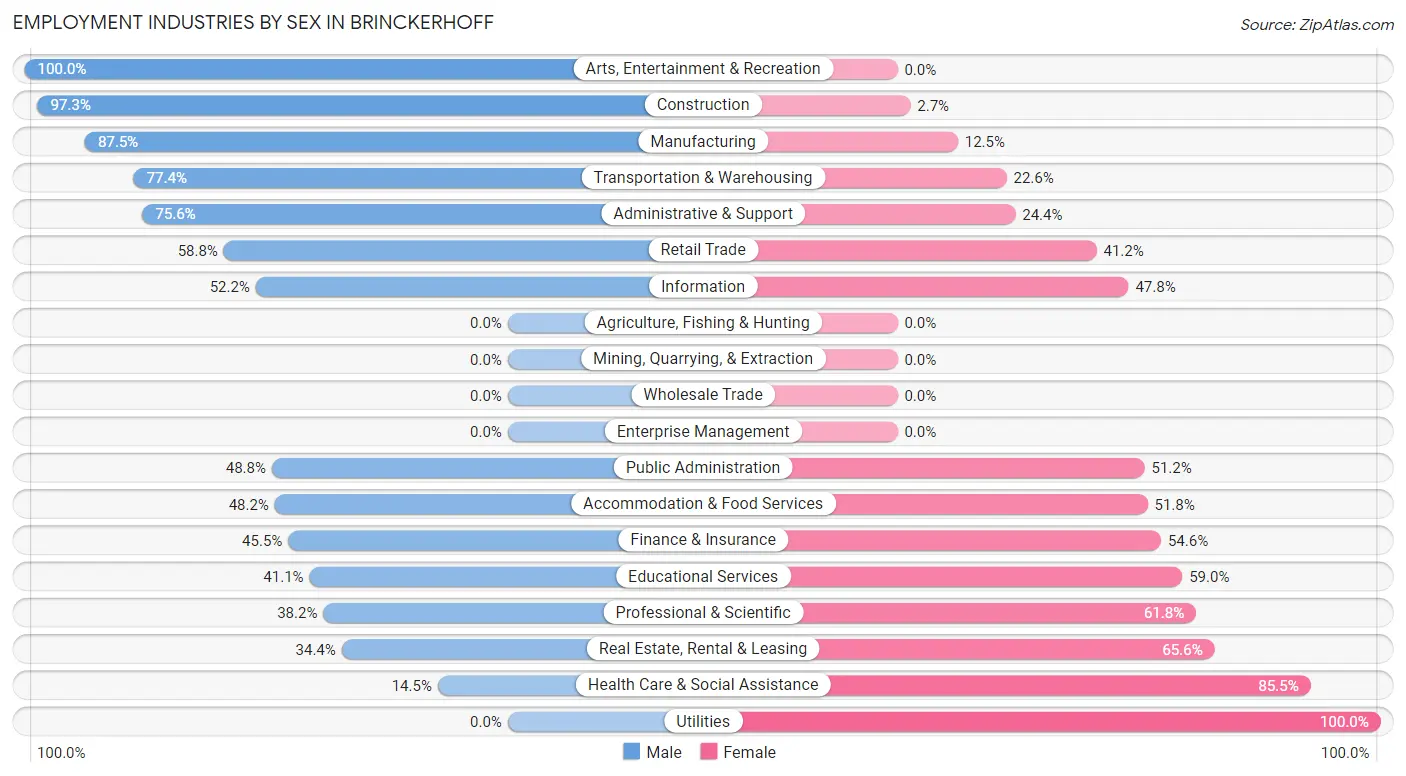
Employment Industries by Sex in Brinckerhoff
The Brinckerhoff industries that see more men than women are Arts, Entertainment & Recreation (100.0%), Construction (97.3%), and Manufacturing (87.5%), whereas the industries that tend to have a higher number of women are Utilities (100.0%), Health Care & Social Assistance (85.5%), and Real Estate, Rental & Leasing (65.6%).
| Industry | Male | Female |
| Agriculture, Fishing & Hunting | 0 (0.0%) | 0 (0.0%) |
| Mining, Quarrying, & Extraction | 0 (0.0%) | 0 (0.0%) |
| Construction | 145 (97.3%) | 4 (2.7%) |
| Manufacturing | 63 (87.5%) | 9 (12.5%) |
| Wholesale Trade | 0 (0.0%) | 0 (0.0%) |
| Retail Trade | 97 (58.8%) | 68 (41.2%) |
| Transportation & Warehousing | 24 (77.4%) | 7 (22.6%) |
| Utilities | 0 (0.0%) | 23 (100.0%) |
| Information | 12 (52.2%) | 11 (47.8%) |
| Finance & Insurance | 40 (45.5%) | 48 (54.5%) |
| Real Estate, Rental & Leasing | 11 (34.4%) | 21 (65.6%) |
| Professional & Scientific | 55 (38.2%) | 89 (61.8%) |
| Enterprise Management | 0 (0.0%) | 0 (0.0%) |
| Administrative & Support | 62 (75.6%) | 20 (24.4%) |
| Educational Services | 39 (41.0%) | 56 (59.0%) |
| Health Care & Social Assistance | 20 (14.5%) | 118 (85.5%) |
| Arts, Entertainment & Recreation | 8 (100.0%) | 0 (0.0%) |
| Accommodation & Food Services | 68 (48.2%) | 73 (51.8%) |
| Public Administration | 42 (48.8%) | 44 (51.2%) |
| Total | 728 (54.6%) | 604 (45.4%) |
Education in Brinckerhoff
School Enrollment in Brinckerhoff
The most common levels of schooling among the 419 students in Brinckerhoff are middle school (140 | 33.4%), college / undergraduate (101 | 24.1%), and high school (72 | 17.2%).
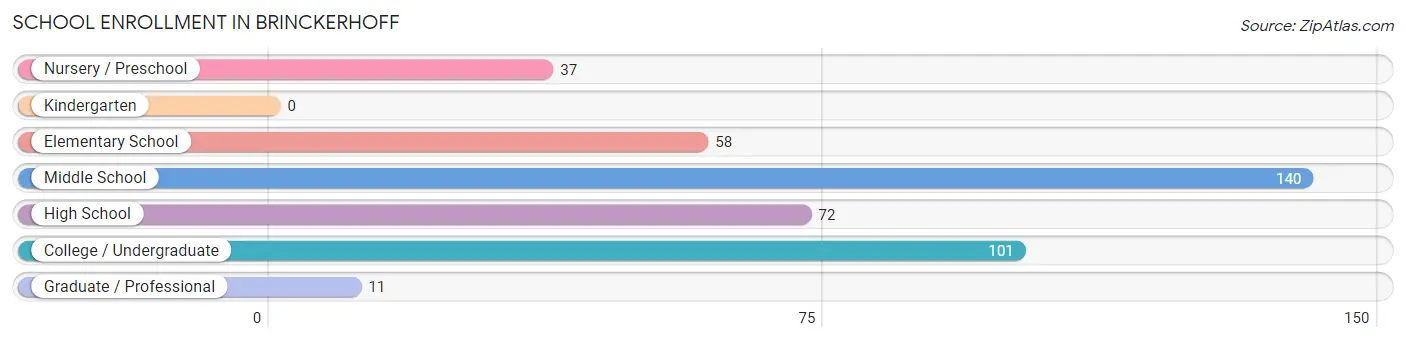
| School Level | # Students | % Students |
| Nursery / Preschool | 37 | 8.8% |
| Kindergarten | 0 | 0.0% |
| Elementary School | 58 | 13.8% |
| Middle School | 140 | 33.4% |
| High School | 72 | 17.2% |
| College / Undergraduate | 101 | 24.1% |
| Graduate / Professional | 11 | 2.6% |
| Total | 419 | 100.0% |
School Enrollment by Age by Funding Source in Brinckerhoff
Out of a total of 419 students who are enrolled in schools in Brinckerhoff, 133 (31.7%) attend a private institution, while the remaining 286 (68.3%) are enrolled in public schools. The age group of 3 to 4 year olds has the highest likelihood of being enrolled in private schools, with 37 (100.0% in the age bracket) enrolled. Conversely, the age group of 5 to 9 year old has the lowest likelihood of being enrolled in a private school, with 46 (100.0% in the age bracket) attending a public institution.
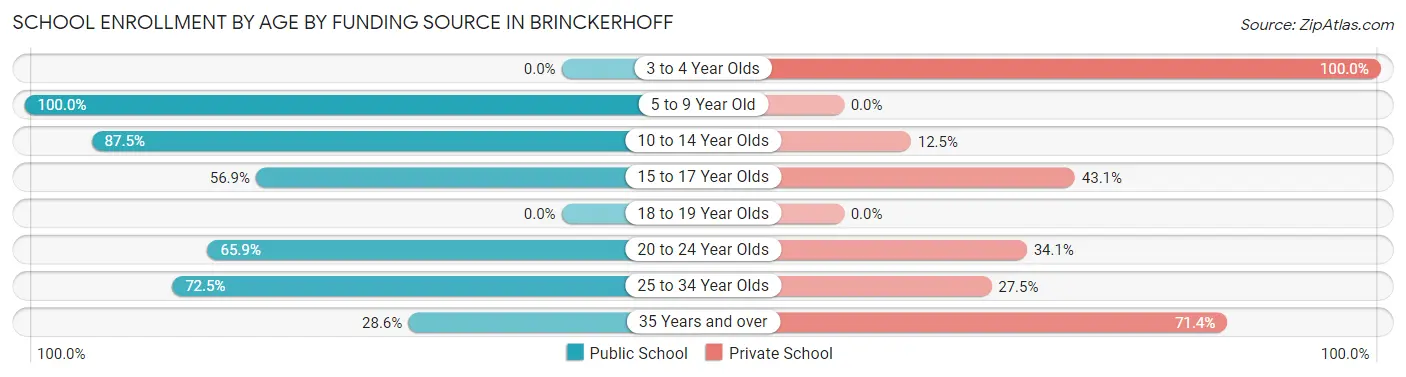
| Age Bracket | Public School | Private School |
| 3 to 4 Year Olds | 0 (0.0%) | 37 (100.0%) |
| 5 to 9 Year Old | 46 (100.0%) | 0 (0.0%) |
| 10 to 14 Year Olds | 133 (87.5%) | 19 (12.5%) |
| 15 to 17 Year Olds | 41 (56.9%) | 31 (43.1%) |
| 18 to 19 Year Olds | 0 (0.0%) | 0 (0.0%) |
| 20 to 24 Year Olds | 29 (65.9%) | 15 (34.1%) |
| 25 to 34 Year Olds | 29 (72.5%) | 11 (27.5%) |
| 35 Years and over | 8 (28.6%) | 20 (71.4%) |
| Total | 286 (68.3%) | 133 (31.7%) |
Educational Attainment by Field of Study in Brinckerhoff
Business (175 | 26.9%), education (77 | 11.8%), psychology (76 | 11.7%), physical & health sciences (47 | 7.2%), and bio, nature & agricultural (46 | 7.1%) are the most common fields of study among 651 individuals in Brinckerhoff who have obtained a bachelor's degree or higher.
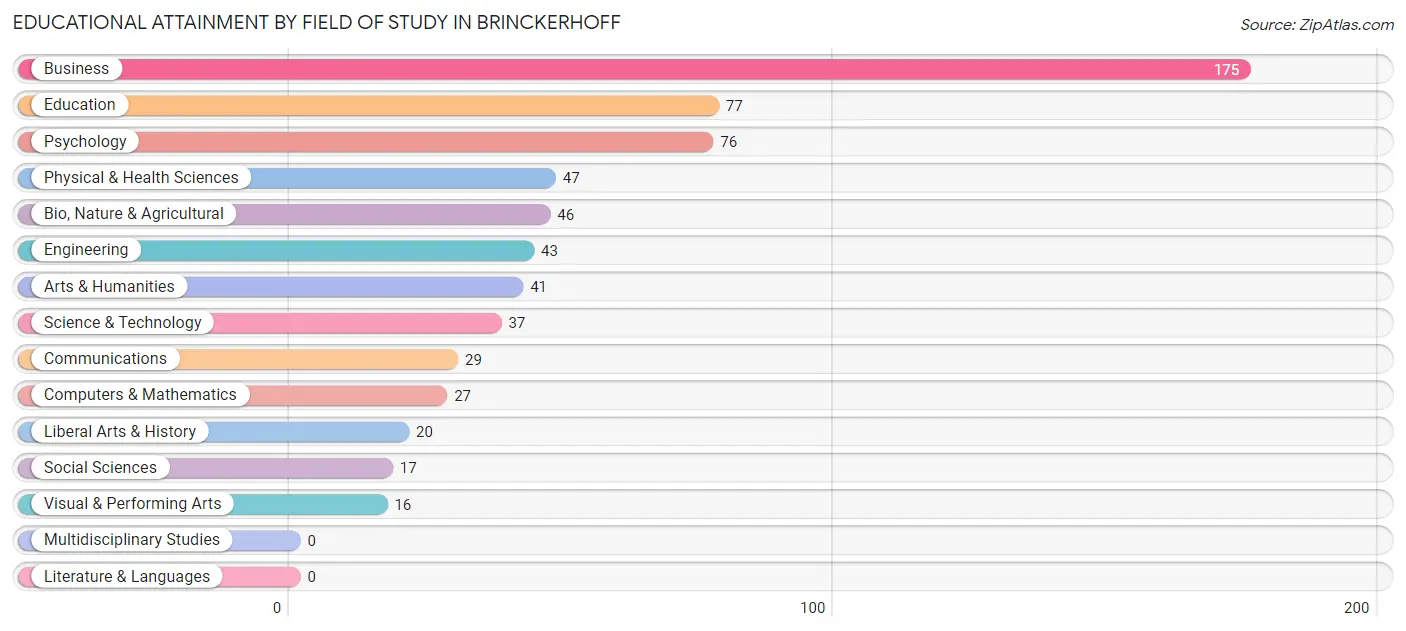
| Field of Study | # Graduates | % Graduates |
| Computers & Mathematics | 27 | 4.2% |
| Bio, Nature & Agricultural | 46 | 7.1% |
| Physical & Health Sciences | 47 | 7.2% |
| Psychology | 76 | 11.7% |
| Social Sciences | 17 | 2.6% |
| Engineering | 43 | 6.6% |
| Multidisciplinary Studies | 0 | 0.0% |
| Science & Technology | 37 | 5.7% |
| Business | 175 | 26.9% |
| Education | 77 | 11.8% |
| Literature & Languages | 0 | 0.0% |
| Liberal Arts & History | 20 | 3.1% |
| Visual & Performing Arts | 16 | 2.5% |
| Communications | 29 | 4.4% |
| Arts & Humanities | 41 | 6.3% |
| Total | 651 | 100.0% |
Transportation & Commute in Brinckerhoff
Vehicle Availability by Sex in Brinckerhoff
The most prevalent vehicle ownership categories in Brinckerhoff are males with 2 vehicles (195, accounting for 28.1%) and females with 2 vehicles (227, making up 32.6%).
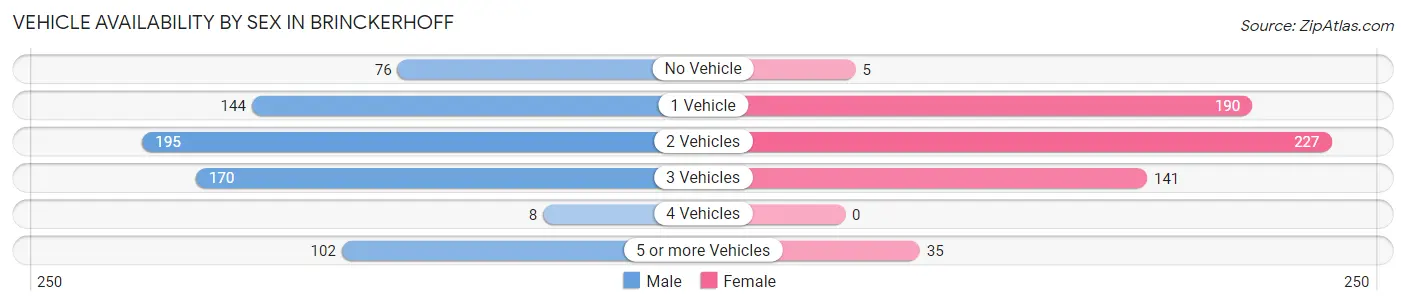
| Vehicles Available | Male | Female |
| No Vehicle | 76 (10.9%) | 5 (0.8%) |
| 1 Vehicle | 144 (20.7%) | 190 (31.8%) |
| 2 Vehicles | 195 (28.1%) | 227 (38.0%) |
| 3 Vehicles | 170 (24.5%) | 141 (23.6%) |
| 4 Vehicles | 8 (1.1%) | 0 (0.0%) |
| 5 or more Vehicles | 102 (14.7%) | 35 (5.9%) |
| Total | 695 (100.0%) | 598 (100.0%) |
Commute Time in Brinckerhoff
The most frequently occuring commute durations in Brinckerhoff are 10 to 14 minutes (318 commuters, 28.3%), 20 to 24 minutes (160 commuters, 14.3%), and 60 to 89 minutes (95 commuters, 8.5%).
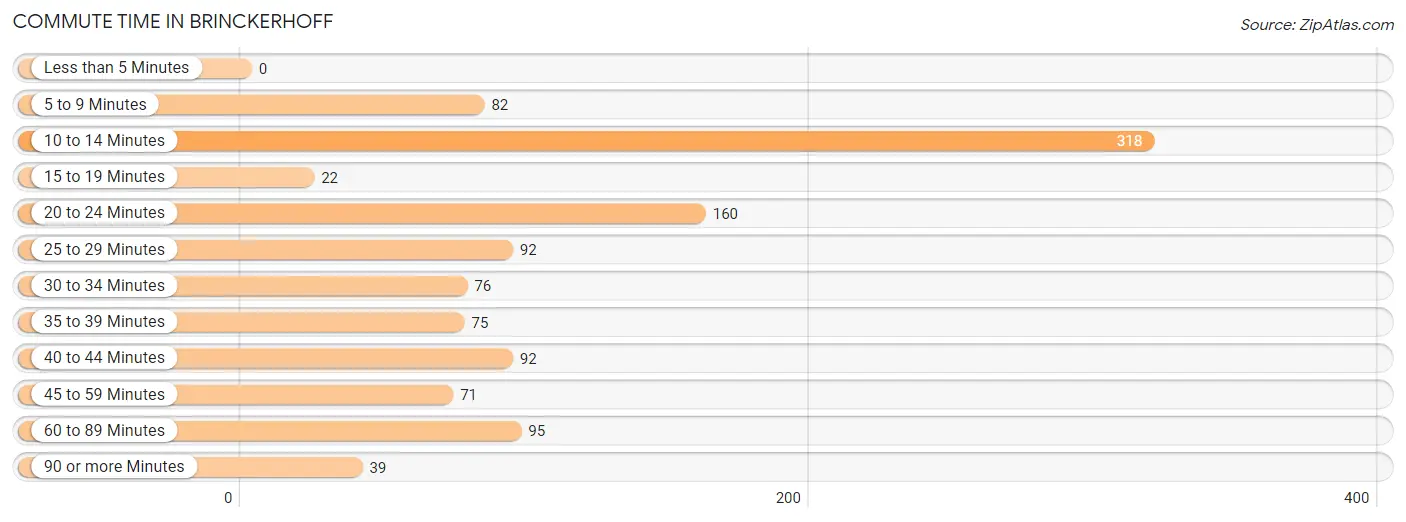
| Commute Time | # Commuters | % Commuters |
| Less than 5 Minutes | 0 | 0.0% |
| 5 to 9 Minutes | 82 | 7.3% |
| 10 to 14 Minutes | 318 | 28.3% |
| 15 to 19 Minutes | 22 | 2.0% |
| 20 to 24 Minutes | 160 | 14.3% |
| 25 to 29 Minutes | 92 | 8.2% |
| 30 to 34 Minutes | 76 | 6.8% |
| 35 to 39 Minutes | 75 | 6.7% |
| 40 to 44 Minutes | 92 | 8.2% |
| 45 to 59 Minutes | 71 | 6.3% |
| 60 to 89 Minutes | 95 | 8.5% |
| 90 or more Minutes | 39 | 3.5% |
Commute Time by Sex in Brinckerhoff
The most common commute times in Brinckerhoff are 10 to 14 minutes (243 commuters, 39.6%) for males and 20 to 24 minutes (104 commuters, 20.5%) for females.
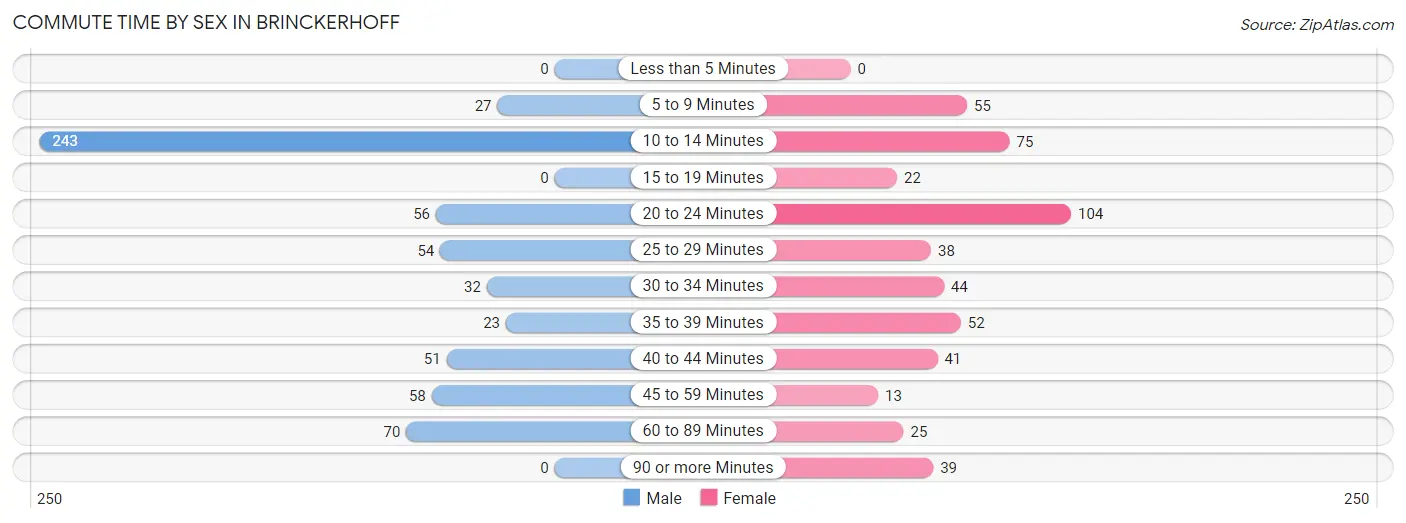
| Commute Time | Male | Female |
| Less than 5 Minutes | 0 (0.0%) | 0 (0.0%) |
| 5 to 9 Minutes | 27 (4.4%) | 55 (10.8%) |
| 10 to 14 Minutes | 243 (39.6%) | 75 (14.8%) |
| 15 to 19 Minutes | 0 (0.0%) | 22 (4.3%) |
| 20 to 24 Minutes | 56 (9.1%) | 104 (20.5%) |
| 25 to 29 Minutes | 54 (8.8%) | 38 (7.5%) |
| 30 to 34 Minutes | 32 (5.2%) | 44 (8.7%) |
| 35 to 39 Minutes | 23 (3.7%) | 52 (10.2%) |
| 40 to 44 Minutes | 51 (8.3%) | 41 (8.1%) |
| 45 to 59 Minutes | 58 (9.5%) | 13 (2.6%) |
| 60 to 89 Minutes | 70 (11.4%) | 25 (4.9%) |
| 90 or more Minutes | 0 (0.0%) | 39 (7.7%) |
Time of Departure to Work by Sex in Brinckerhoff
The most frequent times of departure to work in Brinckerhoff are 6:30 AM to 6:59 AM (166, 27.0%) for males and 8:00 AM to 8:29 AM (105, 20.7%) for females.
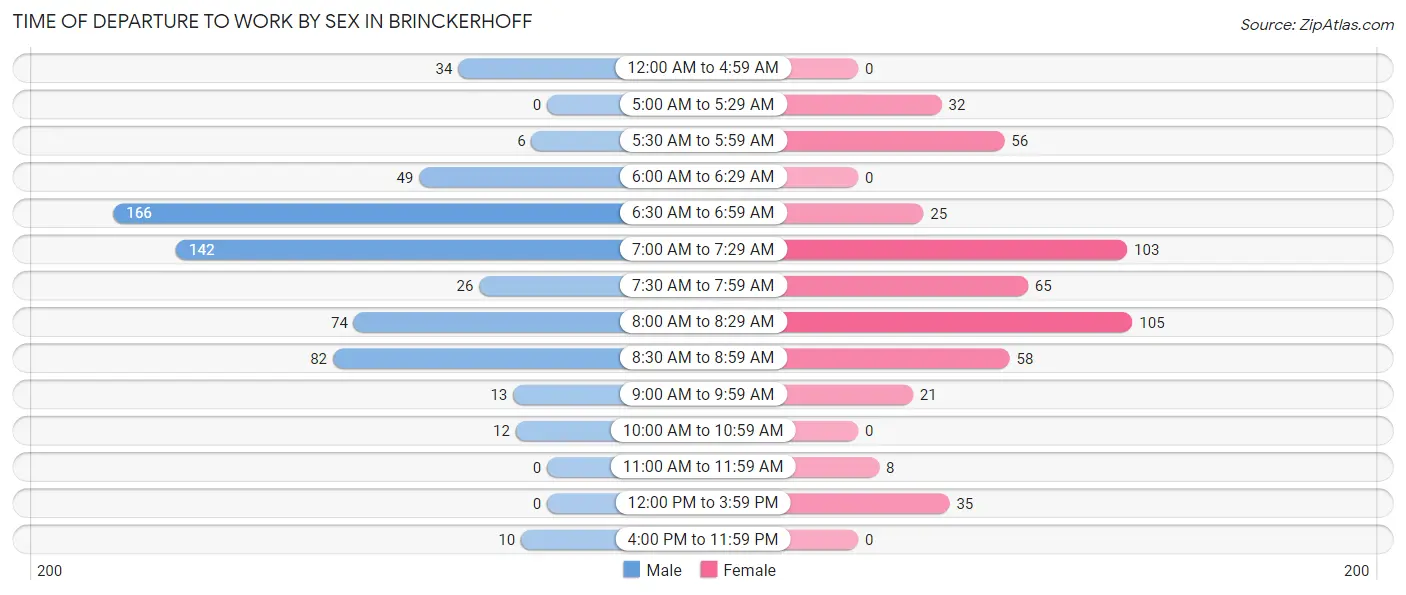
| Time of Departure | Male | Female |
| 12:00 AM to 4:59 AM | 34 (5.5%) | 0 (0.0%) |
| 5:00 AM to 5:29 AM | 0 (0.0%) | 32 (6.3%) |
| 5:30 AM to 5:59 AM | 6 (1.0%) | 56 (11.0%) |
| 6:00 AM to 6:29 AM | 49 (8.0%) | 0 (0.0%) |
| 6:30 AM to 6:59 AM | 166 (27.0%) | 25 (4.9%) |
| 7:00 AM to 7:29 AM | 142 (23.1%) | 103 (20.3%) |
| 7:30 AM to 7:59 AM | 26 (4.2%) | 65 (12.8%) |
| 8:00 AM to 8:29 AM | 74 (12.0%) | 105 (20.7%) |
| 8:30 AM to 8:59 AM | 82 (13.4%) | 58 (11.4%) |
| 9:00 AM to 9:59 AM | 13 (2.1%) | 21 (4.1%) |
| 10:00 AM to 10:59 AM | 12 (1.9%) | 0 (0.0%) |
| 11:00 AM to 11:59 AM | 0 (0.0%) | 8 (1.6%) |
| 12:00 PM to 3:59 PM | 0 (0.0%) | 35 (6.9%) |
| 4:00 PM to 11:59 PM | 10 (1.6%) | 0 (0.0%) |
| Total | 614 (100.0%) | 508 (100.0%) |
Housing Occupancy in Brinckerhoff
Occupancy by Ownership in Brinckerhoff
Of the total 1,212 dwellings in Brinckerhoff, owner-occupied units account for 965 (79.6%), while renter-occupied units make up 247 (20.4%).
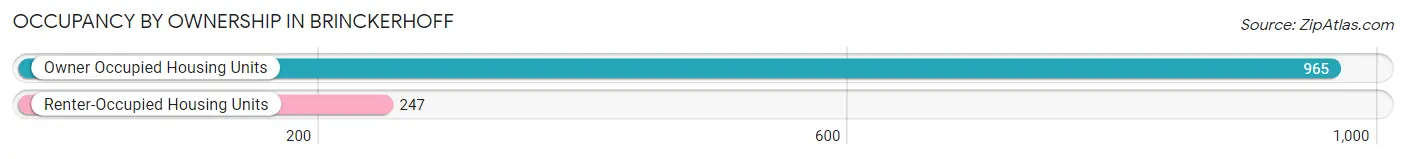
| Occupancy | # Housing Units | % Housing Units |
| Owner Occupied Housing Units | 965 | 79.6% |
| Renter-Occupied Housing Units | 247 | 20.4% |
| Total Occupied Housing Units | 1,212 | 100.0% |
Occupancy by Household Size in Brinckerhoff
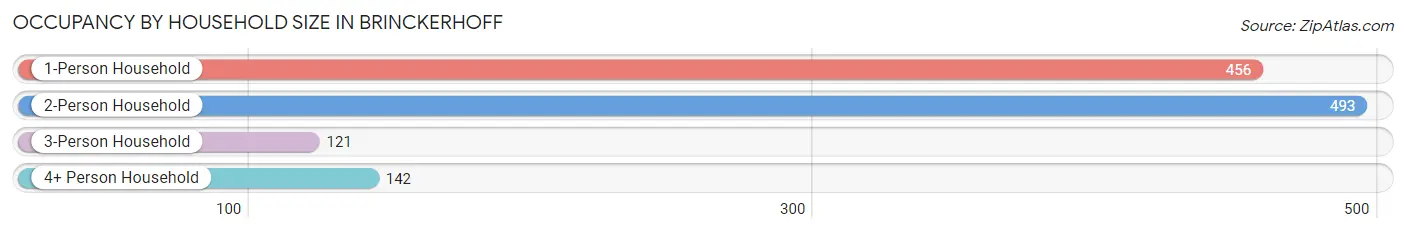
| Household Size | # Housing Units | % Housing Units |
| 1-Person Household | 456 | 37.6% |
| 2-Person Household | 493 | 40.7% |
| 3-Person Household | 121 | 10.0% |
| 4+ Person Household | 142 | 11.7% |
| Total Housing Units | 1,212 | 100.0% |
Occupancy by Ownership by Household Size in Brinckerhoff
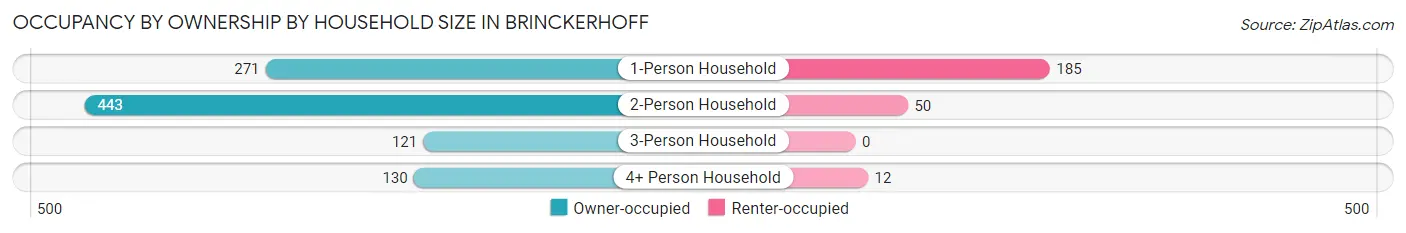
| Household Size | Owner-occupied | Renter-occupied |
| 1-Person Household | 271 (59.4%) | 185 (40.6%) |
| 2-Person Household | 443 (89.9%) | 50 (10.1%) |
| 3-Person Household | 121 (100.0%) | 0 (0.0%) |
| 4+ Person Household | 130 (91.5%) | 12 (8.5%) |
| Total Housing Units | 965 (79.6%) | 247 (20.4%) |
Occupancy by Educational Attainment in Brinckerhoff
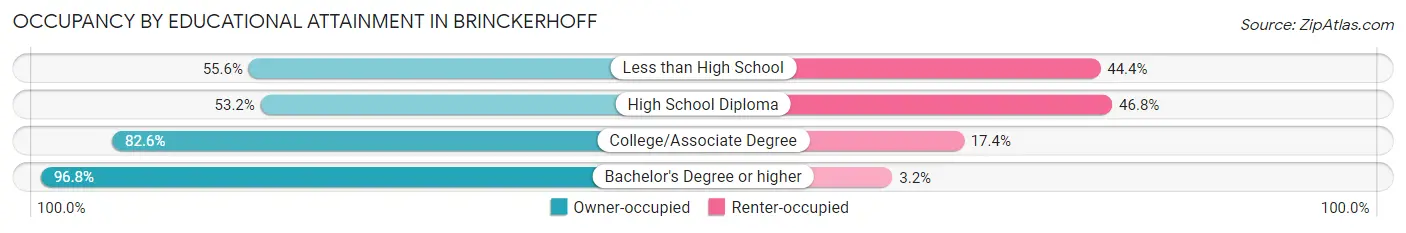
| Household Size | Owner-occupied | Renter-occupied |
| Less than High School | 15 (55.6%) | 12 (44.4%) |
| High School Diploma | 149 (53.2%) | 131 (46.8%) |
| College/Associate Degree | 438 (82.6%) | 92 (17.4%) |
| Bachelor's Degree or higher | 363 (96.8%) | 12 (3.2%) |
Occupancy by Age of Householder in Brinckerhoff
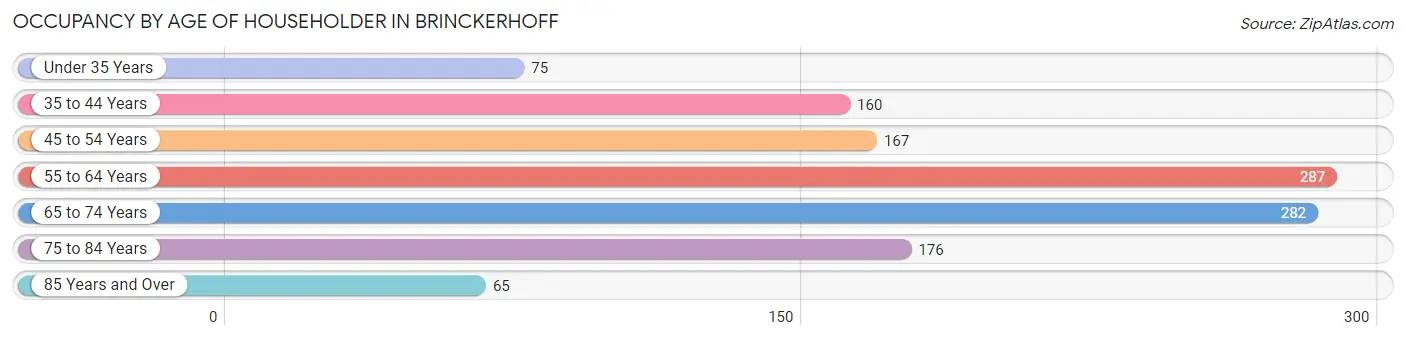
| Age Bracket | # Households | % Households |
| Under 35 Years | 75 | 6.2% |
| 35 to 44 Years | 160 | 13.2% |
| 45 to 54 Years | 167 | 13.8% |
| 55 to 64 Years | 287 | 23.7% |
| 65 to 74 Years | 282 | 23.3% |
| 75 to 84 Years | 176 | 14.5% |
| 85 Years and Over | 65 | 5.4% |
| Total | 1,212 | 100.0% |
Housing Finances in Brinckerhoff
Median Income by Occupancy in Brinckerhoff
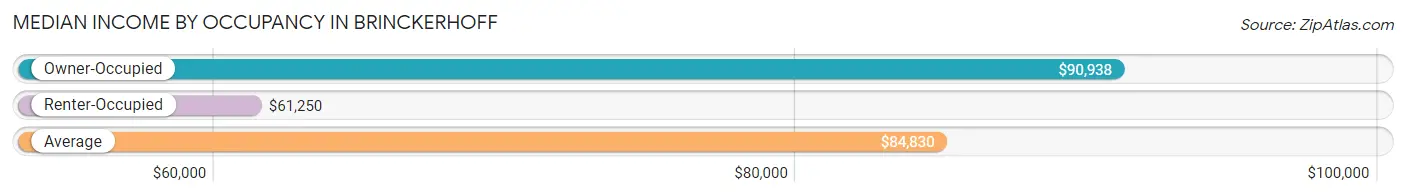
| Occupancy Type | # Households | Median Income |
| Owner-Occupied | 965 (79.6%) | $90,938 |
| Renter-Occupied | 247 (20.4%) | $61,250 |
| Average | 1,212 (100.0%) | $84,830 |
Occupancy by Householder Income Bracket in Brinckerhoff
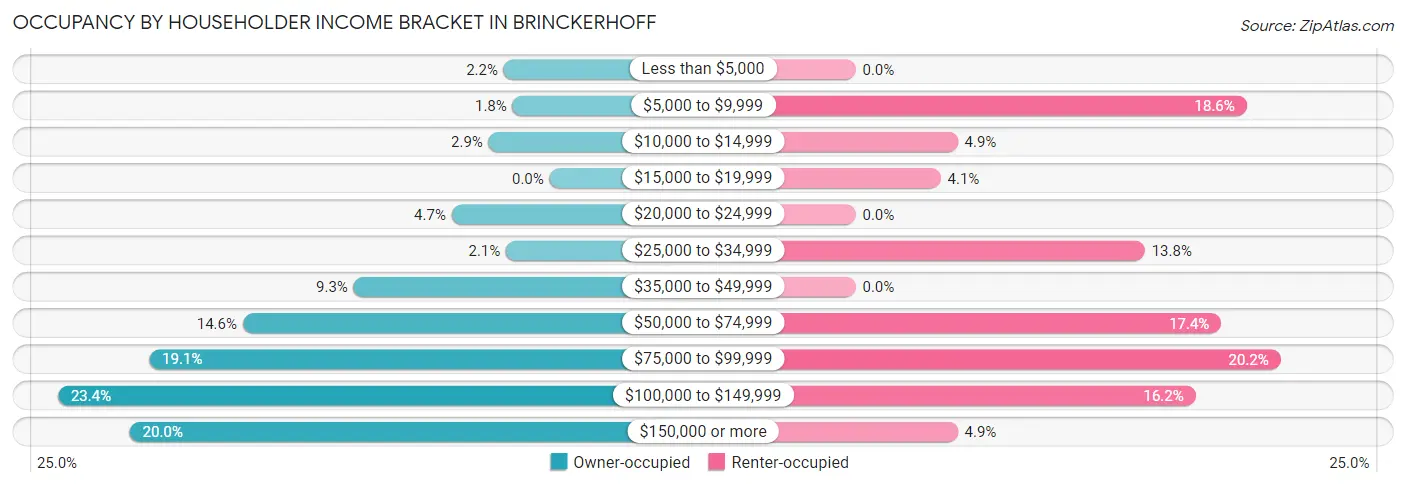
| Income Bracket | Owner-occupied | Renter-occupied |
| Less than $5,000 | 21 (2.2%) | 0 (0.0%) |
| $5,000 to $9,999 | 17 (1.8%) | 46 (18.6%) |
| $10,000 to $14,999 | 28 (2.9%) | 12 (4.9%) |
| $15,000 to $19,999 | 0 (0.0%) | 10 (4.1%) |
| $20,000 to $24,999 | 45 (4.7%) | 0 (0.0%) |
| $25,000 to $34,999 | 20 (2.1%) | 34 (13.8%) |
| $35,000 to $49,999 | 90 (9.3%) | 0 (0.0%) |
| $50,000 to $74,999 | 141 (14.6%) | 43 (17.4%) |
| $75,000 to $99,999 | 184 (19.1%) | 50 (20.2%) |
| $100,000 to $149,999 | 226 (23.4%) | 40 (16.2%) |
| $150,000 or more | 193 (20.0%) | 12 (4.9%) |
| Total | 965 (100.0%) | 247 (100.0%) |
Monthly Housing Cost Tiers in Brinckerhoff
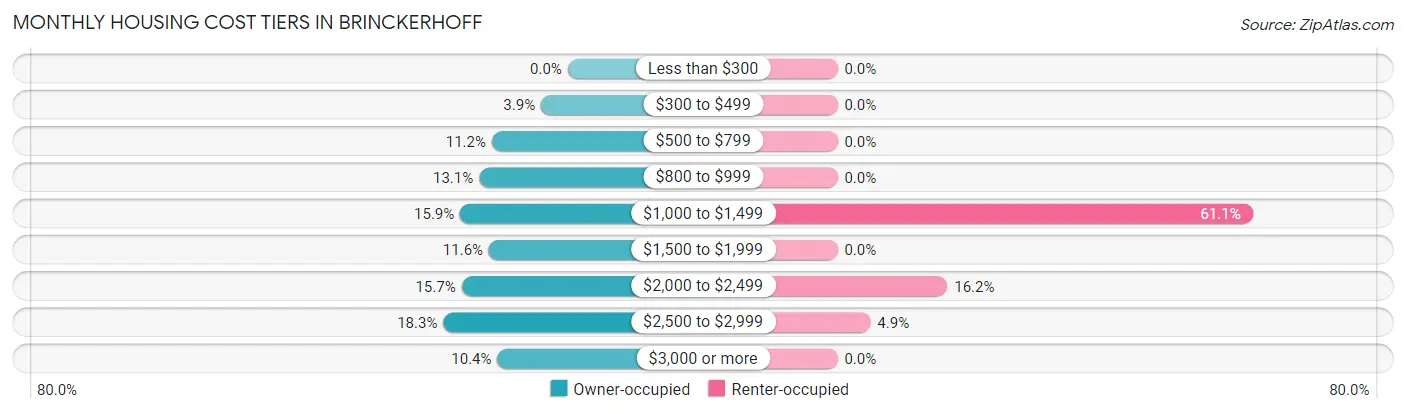
| Monthly Cost | Owner-occupied | Renter-occupied |
| Less than $300 | 0 (0.0%) | 0 (0.0%) |
| $300 to $499 | 38 (3.9%) | 0 (0.0%) |
| $500 to $799 | 108 (11.2%) | 0 (0.0%) |
| $800 to $999 | 126 (13.1%) | 0 (0.0%) |
| $1,000 to $1,499 | 153 (15.9%) | 151 (61.1%) |
| $1,500 to $1,999 | 112 (11.6%) | 0 (0.0%) |
| $2,000 to $2,499 | 151 (15.7%) | 40 (16.2%) |
| $2,500 to $2,999 | 177 (18.3%) | 12 (4.9%) |
| $3,000 or more | 100 (10.4%) | 0 (0.0%) |
| Total | 965 (100.0%) | 247 (100.0%) |
Physical Housing Characteristics in Brinckerhoff
Housing Structures in Brinckerhoff
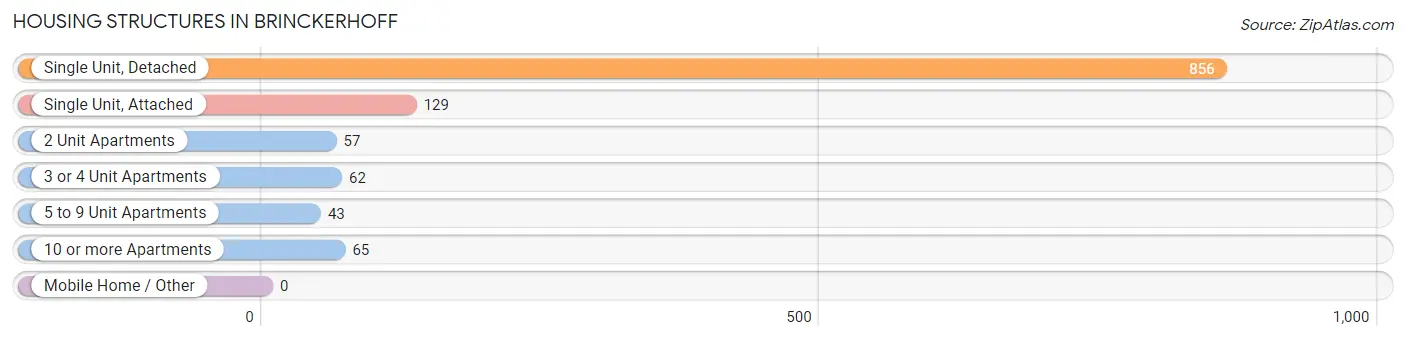
| Structure Type | # Housing Units | % Housing Units |
| Single Unit, Detached | 856 | 70.6% |
| Single Unit, Attached | 129 | 10.6% |
| 2 Unit Apartments | 57 | 4.7% |
| 3 or 4 Unit Apartments | 62 | 5.1% |
| 5 to 9 Unit Apartments | 43 | 3.5% |
| 10 or more Apartments | 65 | 5.4% |
| Mobile Home / Other | 0 | 0.0% |
| Total | 1,212 | 100.0% |
Housing Structures by Occupancy in Brinckerhoff
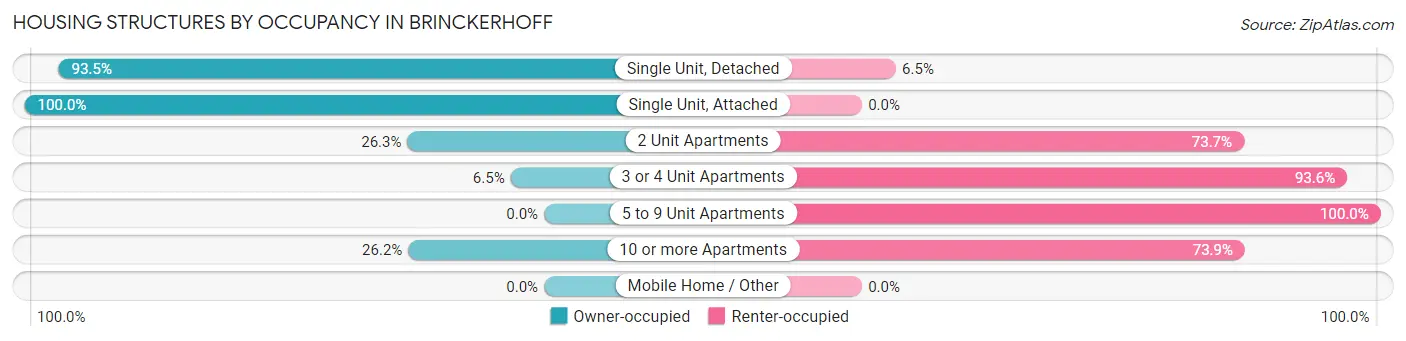
| Structure Type | Owner-occupied | Renter-occupied |
| Single Unit, Detached | 800 (93.5%) | 56 (6.5%) |
| Single Unit, Attached | 129 (100.0%) | 0 (0.0%) |
| 2 Unit Apartments | 15 (26.3%) | 42 (73.7%) |
| 3 or 4 Unit Apartments | 4 (6.5%) | 58 (93.5%) |
| 5 to 9 Unit Apartments | 0 (0.0%) | 43 (100.0%) |
| 10 or more Apartments | 17 (26.2%) | 48 (73.9%) |
| Mobile Home / Other | 0 (0.0%) | 0 (0.0%) |
| Total | 965 (79.6%) | 247 (20.4%) |
Housing Structures by Number of Rooms in Brinckerhoff
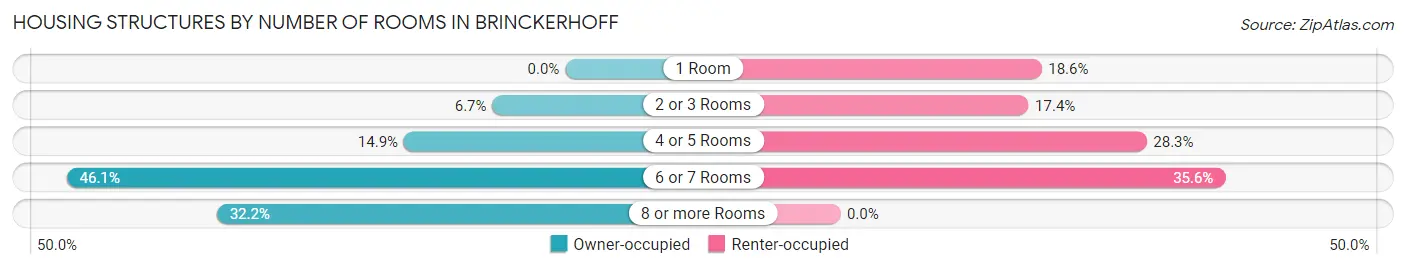
| Number of Rooms | Owner-occupied | Renter-occupied |
| 1 Room | 0 (0.0%) | 46 (18.6%) |
| 2 or 3 Rooms | 65 (6.7%) | 43 (17.4%) |
| 4 or 5 Rooms | 144 (14.9%) | 70 (28.3%) |
| 6 or 7 Rooms | 445 (46.1%) | 88 (35.6%) |
| 8 or more Rooms | 311 (32.2%) | 0 (0.0%) |
| Total | 965 (100.0%) | 247 (100.0%) |
Housing Structure by Heating Type in Brinckerhoff
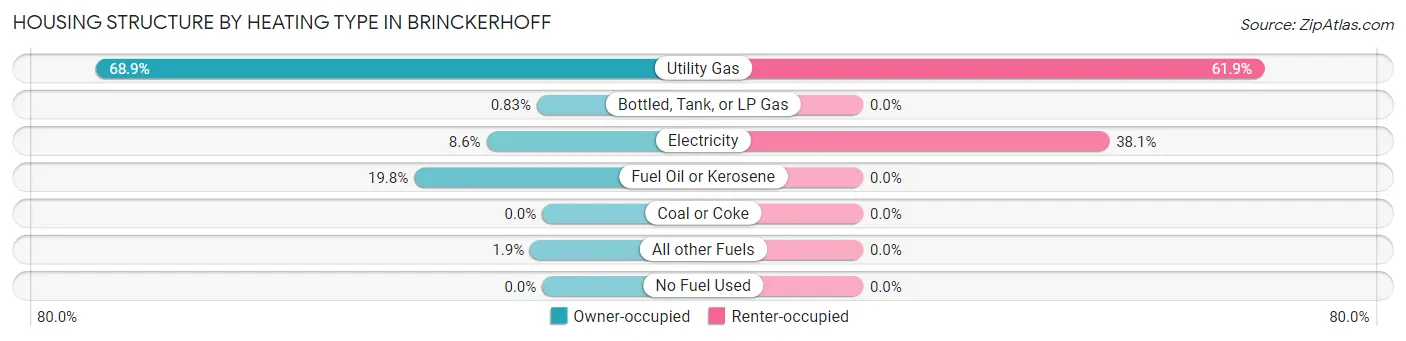
| Heating Type | Owner-occupied | Renter-occupied |
| Utility Gas | 665 (68.9%) | 153 (61.9%) |
| Bottled, Tank, or LP Gas | 8 (0.8%) | 0 (0.0%) |
| Electricity | 83 (8.6%) | 94 (38.1%) |
| Fuel Oil or Kerosene | 191 (19.8%) | 0 (0.0%) |
| Coal or Coke | 0 (0.0%) | 0 (0.0%) |
| All other Fuels | 18 (1.9%) | 0 (0.0%) |
| No Fuel Used | 0 (0.0%) | 0 (0.0%) |
| Total | 965 (100.0%) | 247 (100.0%) |
Household Vehicle Usage in Brinckerhoff
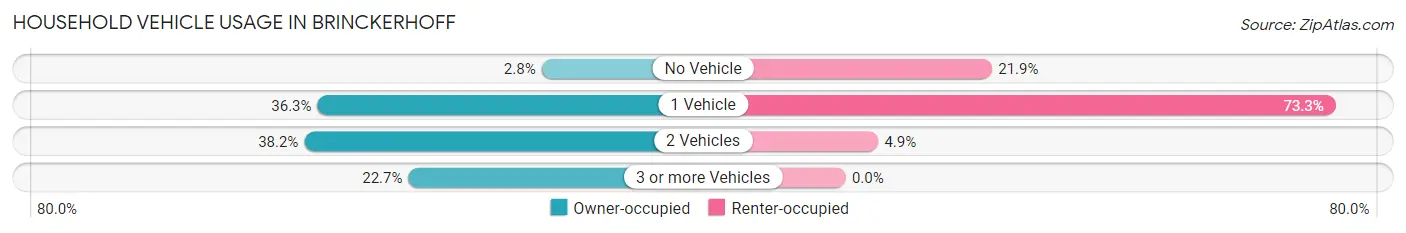
| Vehicles per Household | Owner-occupied | Renter-occupied |
| No Vehicle | 27 (2.8%) | 54 (21.9%) |
| 1 Vehicle | 350 (36.3%) | 181 (73.3%) |
| 2 Vehicles | 369 (38.2%) | 12 (4.9%) |
| 3 or more Vehicles | 219 (22.7%) | 0 (0.0%) |
| Total | 965 (100.0%) | 247 (100.0%) |
Real Estate & Mortgages in Brinckerhoff
Real Estate and Mortgage Overview in Brinckerhoff
| Characteristic | Without Mortgage | With Mortgage |
| Housing Units | 412 | 553 |
| Median Property Value | $320,500 | $353,800 |
| Median Household Income | $86,310 | $140 |
| Monthly Housing Costs | $903 | $100 |
| Real Estate Taxes | $5,917 | $0 |
Property Value by Mortgage Status in Brinckerhoff
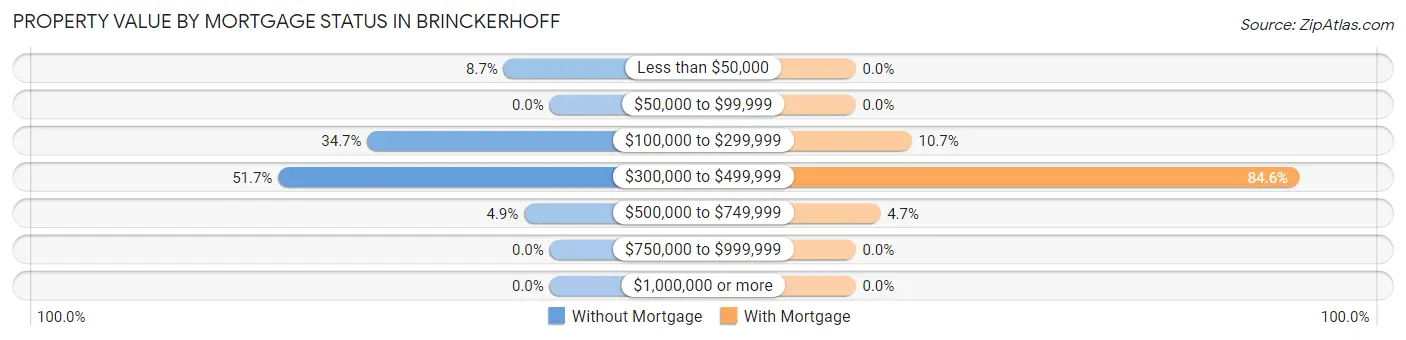
| Property Value | Without Mortgage | With Mortgage |
| Less than $50,000 | 36 (8.7%) | 0 (0.0%) |
| $50,000 to $99,999 | 0 (0.0%) | 0 (0.0%) |
| $100,000 to $299,999 | 143 (34.7%) | 59 (10.7%) |
| $300,000 to $499,999 | 213 (51.7%) | 468 (84.6%) |
| $500,000 to $749,999 | 20 (4.9%) | 26 (4.7%) |
| $750,000 to $999,999 | 0 (0.0%) | 0 (0.0%) |
| $1,000,000 or more | 0 (0.0%) | 0 (0.0%) |
| Total | 412 (100.0%) | 553 (100.0%) |
Household Income by Mortgage Status in Brinckerhoff
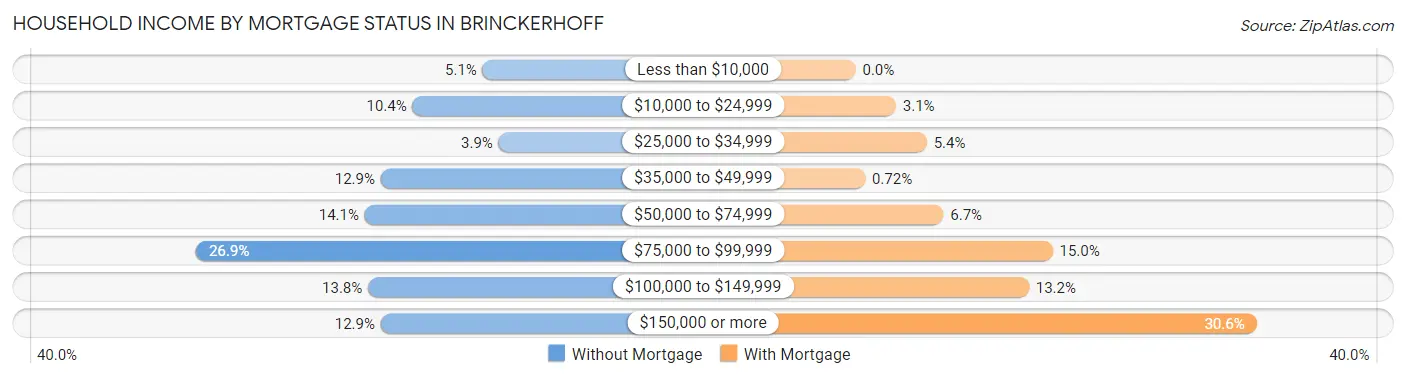
| Household Income | Without Mortgage | With Mortgage |
| Less than $10,000 | 21 (5.1%) | 0 (0.0%) |
| $10,000 to $24,999 | 43 (10.4%) | 17 (3.1%) |
| $25,000 to $34,999 | 16 (3.9%) | 30 (5.4%) |
| $35,000 to $49,999 | 53 (12.9%) | 4 (0.7%) |
| $50,000 to $74,999 | 58 (14.1%) | 37 (6.7%) |
| $75,000 to $99,999 | 111 (26.9%) | 83 (15.0%) |
| $100,000 to $149,999 | 57 (13.8%) | 73 (13.2%) |
| $150,000 or more | 53 (12.9%) | 169 (30.6%) |
| Total | 412 (100.0%) | 553 (100.0%) |
Property Value to Household Income Ratio in Brinckerhoff
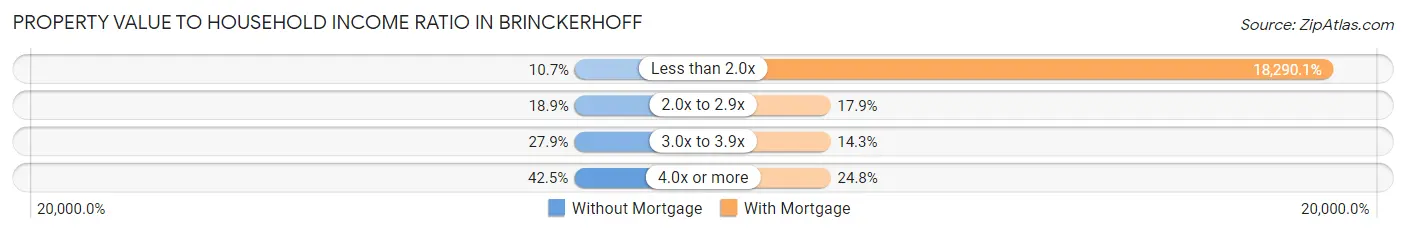
| Value-to-Income Ratio | Without Mortgage | With Mortgage |
| Less than 2.0x | 44 (10.7%) | 101,144 (18,290.0%) |
| 2.0x to 2.9x | 78 (18.9%) | 99 (17.9%) |
| 3.0x to 3.9x | 115 (27.9%) | 79 (14.3%) |
| 4.0x or more | 175 (42.5%) | 137 (24.8%) |
| Total | 412 (100.0%) | 553 (100.0%) |
Real Estate Taxes by Mortgage Status in Brinckerhoff
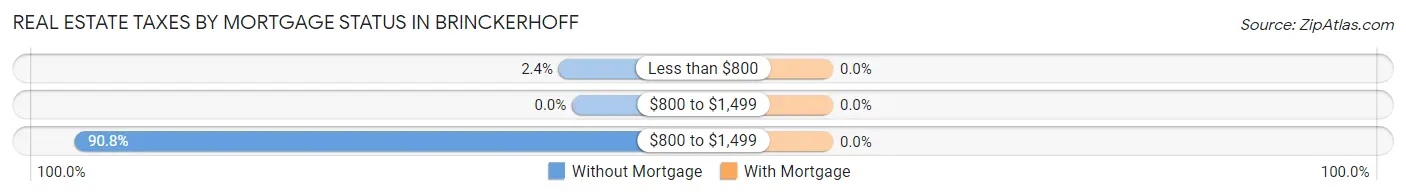
| Property Taxes | Without Mortgage | With Mortgage |
| Less than $800 | 10 (2.4%) | 0 (0.0%) |
| $800 to $1,499 | 0 (0.0%) | 0 (0.0%) |
| $800 to $1,499 | 374 (90.8%) | 0 (0.0%) |
| Total | 412 (100.0%) | 553 (100.0%) |
Health & Disability in Brinckerhoff
Health Insurance Coverage by Age in Brinckerhoff
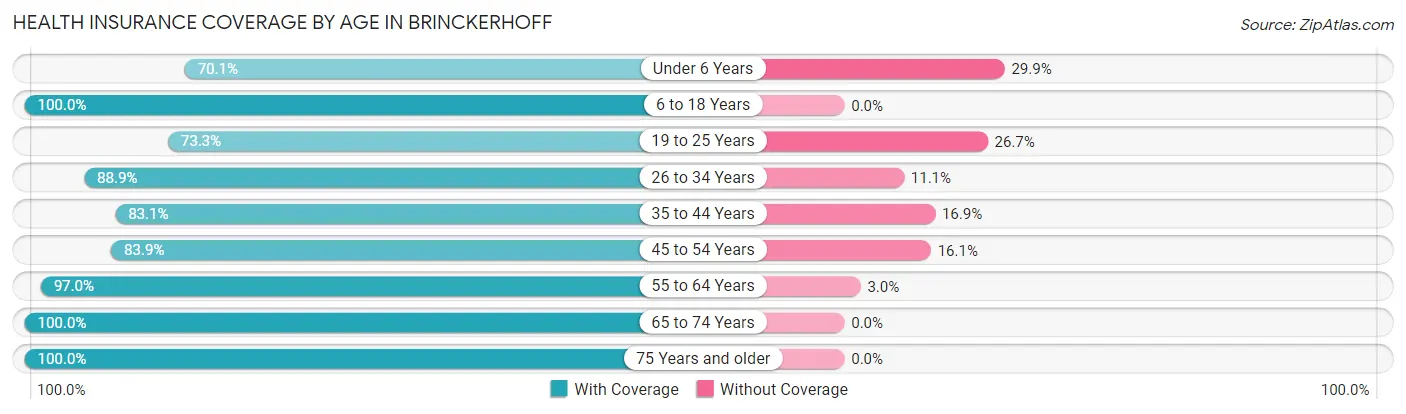
| Age Bracket | With Coverage | Without Coverage |
| Under 6 Years | 54 (70.1%) | 23 (29.9%) |
| 6 to 18 Years | 270 (100.0%) | 0 (0.0%) |
| 19 to 25 Years | 170 (73.3%) | 62 (26.7%) |
| 26 to 34 Years | 136 (88.9%) | 17 (11.1%) |
| 35 to 44 Years | 226 (83.1%) | 46 (16.9%) |
| 45 to 54 Years | 307 (83.9%) | 59 (16.1%) |
| 55 to 64 Years | 419 (97.0%) | 13 (3.0%) |
| 65 to 74 Years | 430 (100.0%) | 0 (0.0%) |
| 75 Years and older | 287 (100.0%) | 0 (0.0%) |
| Total | 2,299 (91.3%) | 220 (8.7%) |
Health Insurance Coverage by Citizenship Status in Brinckerhoff
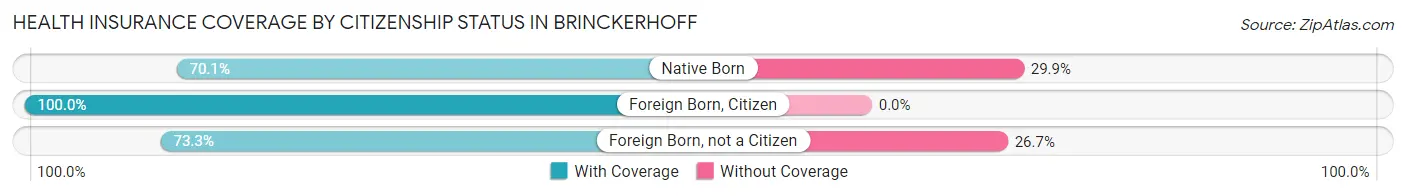
| Citizenship Status | With Coverage | Without Coverage |
| Native Born | 54 (70.1%) | 23 (29.9%) |
| Foreign Born, Citizen | 270 (100.0%) | 0 (0.0%) |
| Foreign Born, not a Citizen | 170 (73.3%) | 62 (26.7%) |
Health Insurance Coverage by Household Income in Brinckerhoff
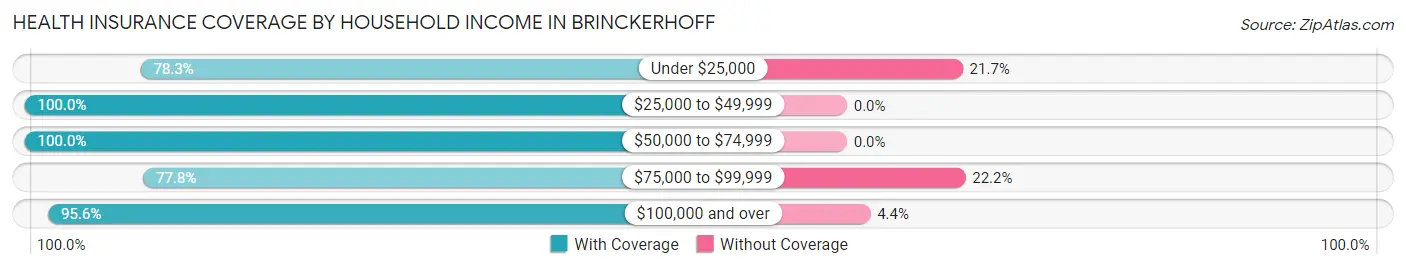
| Household Income | With Coverage | Without Coverage |
| Under $25,000 | 202 (78.3%) | 56 (21.7%) |
| $25,000 to $49,999 | 201 (100.0%) | 0 (0.0%) |
| $50,000 to $74,999 | 317 (100.0%) | 0 (0.0%) |
| $75,000 to $99,999 | 382 (77.8%) | 109 (22.2%) |
| $100,000 and over | 1,197 (95.6%) | 55 (4.4%) |
Public vs Private Health Insurance Coverage by Age in Brinckerhoff
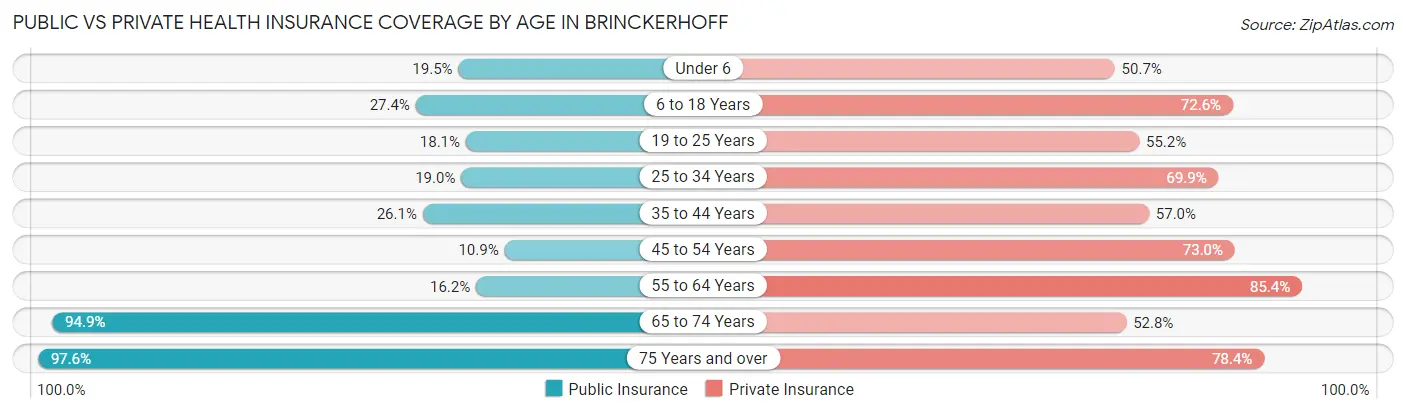
| Age Bracket | Public Insurance | Private Insurance |
| Under 6 | 15 (19.5%) | 39 (50.6%) |
| 6 to 18 Years | 74 (27.4%) | 196 (72.6%) |
| 19 to 25 Years | 42 (18.1%) | 128 (55.2%) |
| 25 to 34 Years | 29 (19.0%) | 107 (69.9%) |
| 35 to 44 Years | 71 (26.1%) | 155 (57.0%) |
| 45 to 54 Years | 40 (10.9%) | 267 (73.0%) |
| 55 to 64 Years | 70 (16.2%) | 369 (85.4%) |
| 65 to 74 Years | 408 (94.9%) | 227 (52.8%) |
| 75 Years and over | 280 (97.6%) | 225 (78.4%) |
| Total | 1,029 (40.8%) | 1,713 (68.0%) |
Disability Status by Sex by Age in Brinckerhoff
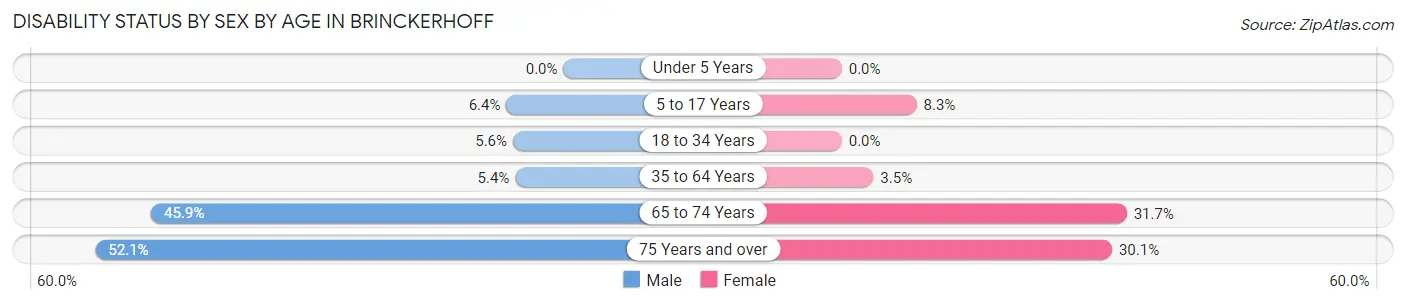
| Age Bracket | Male | Female |
| Under 5 Years | 0 (0.0%) | 0 (0.0%) |
| 5 to 17 Years | 8 (6.4%) | 12 (8.3%) |
| 18 to 34 Years | 14 (5.6%) | 0 (0.0%) |
| 35 to 64 Years | 33 (5.4%) | 16 (3.5%) |
| 65 to 74 Years | 73 (45.9%) | 86 (31.7%) |
| 75 Years and over | 37 (52.1%) | 65 (30.1%) |
Disability Class by Sex by Age in Brinckerhoff
Disability Class: Hearing Difficulty

| Age Bracket | Male | Female |
| Under 5 Years | 0 (0.0%) | 0 (0.0%) |
| 5 to 17 Years | 0 (0.0%) | 0 (0.0%) |
| 18 to 34 Years | 0 (0.0%) | 0 (0.0%) |
| 35 to 64 Years | 16 (2.6%) | 0 (0.0%) |
| 65 to 74 Years | 51 (32.1%) | 42 (15.5%) |
| 75 Years and over | 19 (26.8%) | 51 (23.6%) |
Disability Class: Vision Difficulty
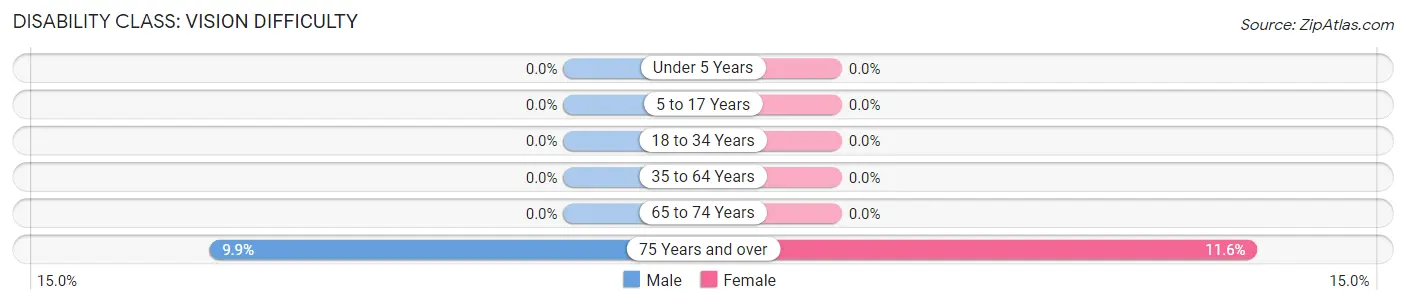
| Age Bracket | Male | Female |
| Under 5 Years | 0 (0.0%) | 0 (0.0%) |
| 5 to 17 Years | 0 (0.0%) | 0 (0.0%) |
| 18 to 34 Years | 0 (0.0%) | 0 (0.0%) |
| 35 to 64 Years | 0 (0.0%) | 0 (0.0%) |
| 65 to 74 Years | 0 (0.0%) | 0 (0.0%) |
| 75 Years and over | 7 (9.9%) | 25 (11.6%) |
Disability Class: Cognitive Difficulty
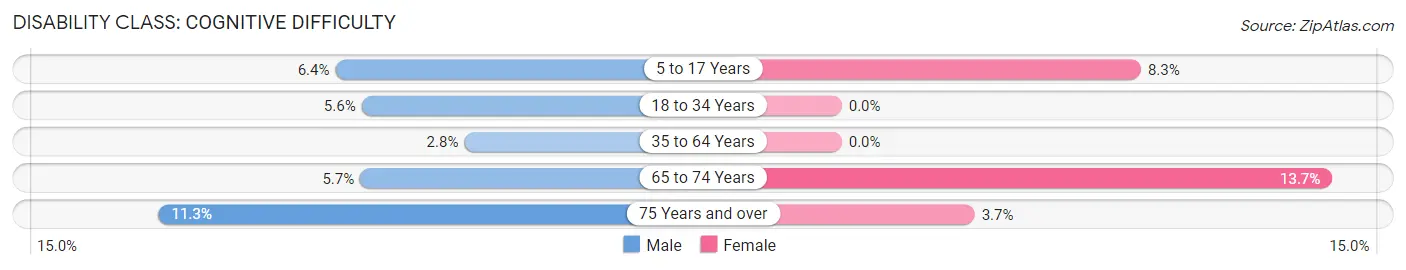
| Age Bracket | Male | Female |
| 5 to 17 Years | 8 (6.4%) | 12 (8.3%) |
| 18 to 34 Years | 14 (5.6%) | 0 (0.0%) |
| 35 to 64 Years | 17 (2.8%) | 0 (0.0%) |
| 65 to 74 Years | 9 (5.7%) | 37 (13.7%) |
| 75 Years and over | 8 (11.3%) | 8 (3.7%) |
Disability Class: Ambulatory Difficulty
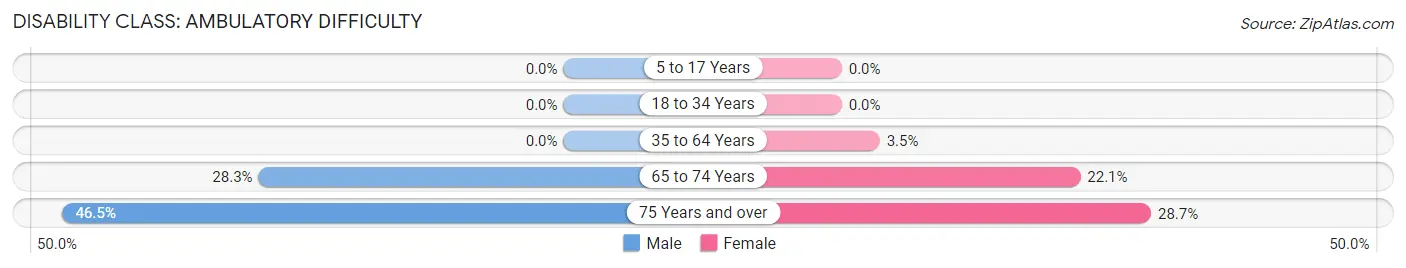
| Age Bracket | Male | Female |
| 5 to 17 Years | 0 (0.0%) | 0 (0.0%) |
| 18 to 34 Years | 0 (0.0%) | 0 (0.0%) |
| 35 to 64 Years | 0 (0.0%) | 16 (3.5%) |
| 65 to 74 Years | 45 (28.3%) | 60 (22.1%) |
| 75 Years and over | 33 (46.5%) | 62 (28.7%) |
Disability Class: Self-Care Difficulty
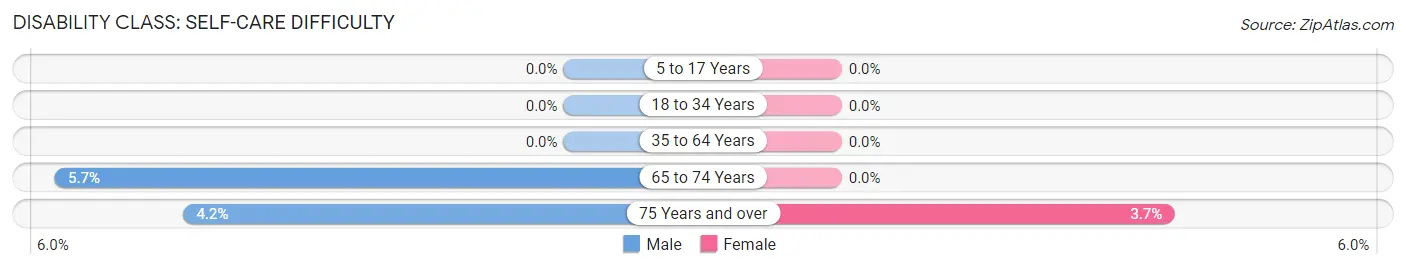
| Age Bracket | Male | Female |
| 5 to 17 Years | 0 (0.0%) | 0 (0.0%) |
| 18 to 34 Years | 0 (0.0%) | 0 (0.0%) |
| 35 to 64 Years | 0 (0.0%) | 0 (0.0%) |
| 65 to 74 Years | 9 (5.7%) | 0 (0.0%) |
| 75 Years and over | 3 (4.2%) | 8 (3.7%) |
Technology Access in Brinckerhoff
Computing Device Access in Brinckerhoff
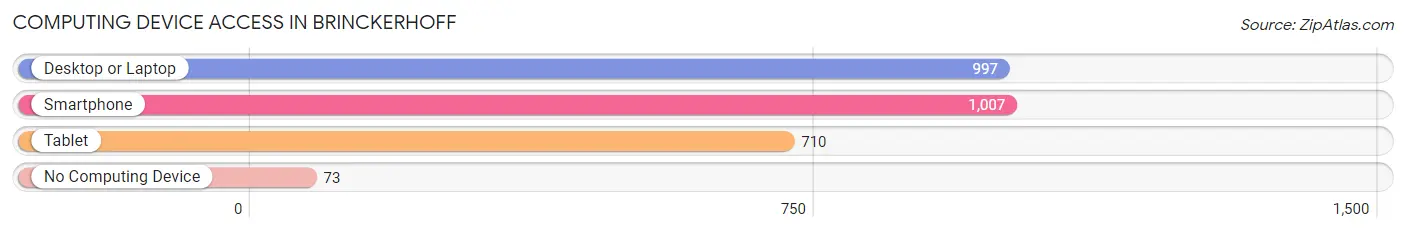
| Device Type | # Households | % Households |
| Desktop or Laptop | 997 | 82.3% |
| Smartphone | 1,007 | 83.1% |
| Tablet | 710 | 58.6% |
| No Computing Device | 73 | 6.0% |
| Total | 1,212 | 100.0% |
Internet Access in Brinckerhoff
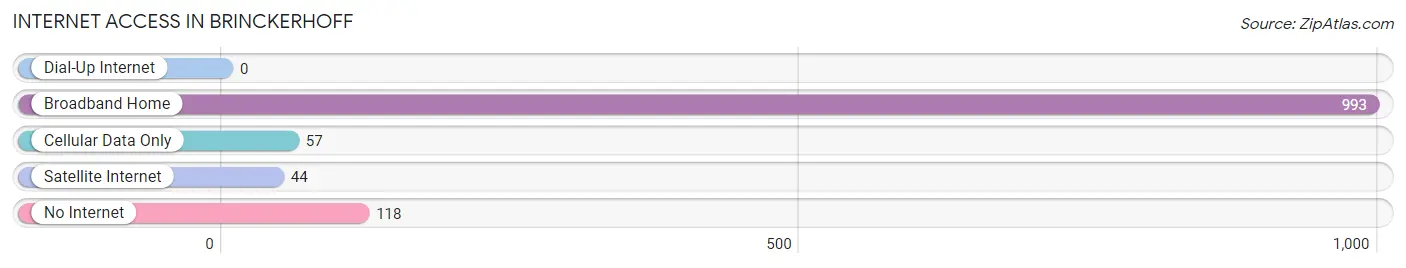
| Internet Type | # Households | % Households |
| Dial-Up Internet | 0 | 0.0% |
| Broadband Home | 993 | 81.9% |
| Cellular Data Only | 57 | 4.7% |
| Satellite Internet | 44 | 3.6% |
| No Internet | 118 | 9.7% |
| Total | 1,212 | 100.0% |
Brinckerhoff Summary
New York is a state located in the Northeastern United States. It is bordered by New Jersey and Pennsylvania to the south, and by Connecticut, Massachusetts, and Vermont to the east. The state has a diverse geography, with the Adirondack Mountains in the north, the Catskill Mountains in the southwest, and the Hudson River running through the middle of the state. The state is home to the largest city in the United States, New York City, as well as many other large cities and towns.
History
The area that is now New York was first inhabited by Native American tribes, including the Iroquois, Algonquin, and Lenape. The first Europeans to explore the area were the Dutch, who established the colony of New Netherland in 1614. The colony was taken over by the English in 1664, and renamed New York. During the American Revolution, New York was a major battleground, and the state was the site of the signing of the United States Constitution in 1787.
Geography
New York is the 27th largest state in the United States, with a total area of 54,556 square miles. The state is divided into two distinct regions: the Adirondack Mountains in the north, and the Catskill Mountains in the southwest. The Hudson River runs through the middle of the state, and is the largest river in the state. The state also has numerous lakes, including Lake Ontario, Lake Erie, and Lake Champlain.
Economy
New York has a diverse economy, with a variety of industries. The state is home to many large corporations, including JPMorgan Chase, Citigroup, and Goldman Sachs. The state is also a major center for finance, media, and entertainment. Tourism is also a major industry in the state, with millions of visitors each year.
Demographics
As of 2019, New York had an estimated population of 19.45 million people. The state is one of the most diverse in the country, with a large population of African Americans, Hispanics, and Asians. The largest cities in the state are New York City, Buffalo, Rochester, and Yonkers. The state also has a large population of immigrants, with over 3 million foreign-born residents.
New York is a state with a rich history, diverse geography, and a vibrant economy. It is home to some of the largest cities in the United States, and is a major center for finance, media, and entertainment. The state is also one of the most diverse in the country, with a large population of African Americans, Hispanics, and Asians. New York is a state with a lot to offer, and is sure to remain an important part of the United States for many years to come.
Common Questions
What is Per Capita Income in Brinckerhoff?
Per Capita income in Brinckerhoff is $49,331.
What is the Median Family Income in Brinckerhoff?
Median Family Income in Brinckerhoff is $100,417.
What is the Median Household income in Brinckerhoff?
Median Household Income in Brinckerhoff is $84,830.
What is Income or Wage Gap in Brinckerhoff?
Income or Wage Gap in Brinckerhoff is 1.8%.
Women in Brinckerhoff earn 98.2 cents for every dollar earned by a man.
What is Inequality or Gini Index in Brinckerhoff?
Inequality or Gini Index in Brinckerhoff is 0.43.
What is the Total Population of Brinckerhoff?
Total Population of Brinckerhoff is 2,519.
What is the Total Male Population of Brinckerhoff?
Total Male Population of Brinckerhoff is 1,255.
What is the Total Female Population of Brinckerhoff?
Total Female Population of Brinckerhoff is 1,264.
What is the Ratio of Males per 100 Females in Brinckerhoff?
There are 99.29 Males per 100 Females in Brinckerhoff.
What is the Ratio of Females per 100 Males in Brinckerhoff?
There are 100.72 Females per 100 Males in Brinckerhoff.
What is the Median Population Age in Brinckerhoff?
Median Population Age in Brinckerhoff is 52.5 Years.
What is the Average Family Size in Brinckerhoff
Average Family Size in Brinckerhoff is 2.7 People.
What is the Average Household Size in Brinckerhoff
Average Household Size in Brinckerhoff is 2.1 People.
How Large is the Labor Force in Brinckerhoff?
There are 1,391 People in the Labor Forcein in Brinckerhoff.
What is the Percentage of People in the Labor Force in Brinckerhoff?
62.5% of People are in the Labor Force in Brinckerhoff.
What is the Unemployment Rate in Brinckerhoff?
Unemployment Rate in Brinckerhoff is 4.2%.