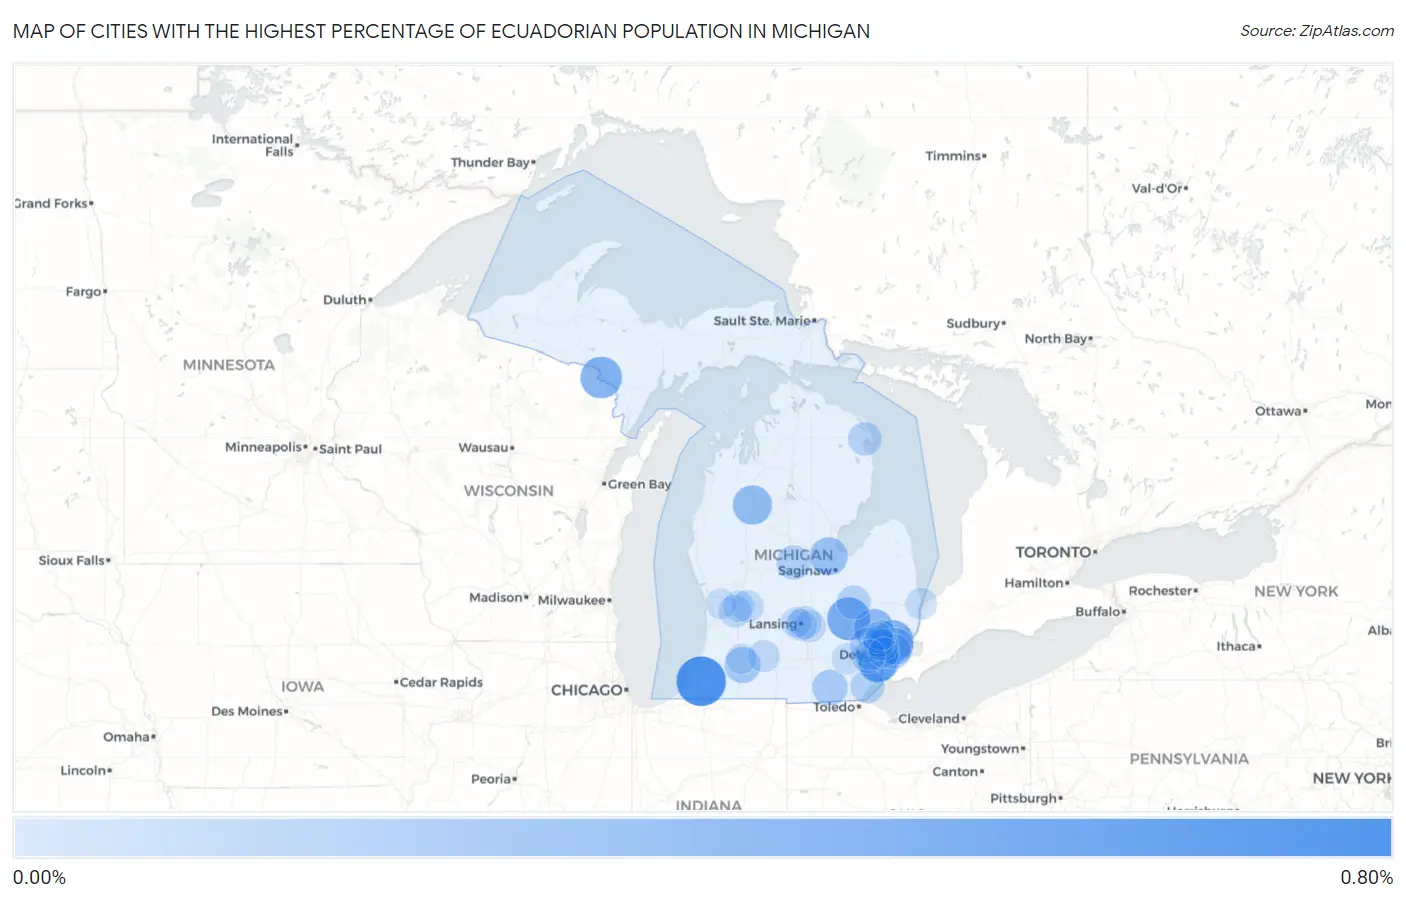
Cities with the Highest Percentage of Ecuadorian Population in Michigan
RELATED REPORTS & OPTIONS
Ecuadorian
Michigan
Compare Cities
Map of Cities with the Highest Percentage of Ecuadorian Population in Michigan
0.00%
0.80%

Cities with the Highest Percentage of Ecuadorian Population in Michigan
| City | Ecuadorian | vs State | vs National | |
| 1. | Eau Claire | 0.66% | 0.022%(+0.640)#1 | 0.24%(+0.419)#800 |
| 2. | Fenton | 0.43% | 0.022%(+0.412)#2 | 0.24%(+0.192)#1,082 |
| 3. | Roseville | 0.40% | 0.022%(+0.380)#3 | 0.24%(+0.160)#1,139 |
| 4. | Iron Mountain | 0.39% | 0.022%(+0.363)#4 | 0.24%(+0.143)#1,180 |
| 5. | Lincoln Park | 0.36% | 0.022%(+0.334)#5 | 0.24%(+0.114)#1,234 |
| 6. | Auburn Hills | 0.33% | 0.022%(+0.303)#6 | 0.24%(+0.083)#1,301 |
| 7. | Cadillac | 0.31% | 0.022%(+0.285)#7 | 0.24%(+0.065)#1,345 |
| 8. | Southgate | 0.26% | 0.022%(+0.238)#8 | 0.24%(+0.018)#1,475 |
| 9. | Auburn | 0.26% | 0.022%(+0.238)#9 | 0.24%(+0.017)#1,476 |
| 10. | Grosse Pointe Woods | 0.21% | 0.022%(+0.192)#10 | 0.24%(-0.029)#1,632 |
| 11. | Portage | 0.20% | 0.022%(+0.180)#11 | 0.24%(-0.040)#1,682 |
| 12. | Adrian | 0.18% | 0.022%(+0.157)#12 | 0.24%(-0.063)#1,777 |
| 13. | Farmington | 0.16% | 0.022%(+0.134)#13 | 0.24%(-0.086)#1,875 |
| 14. | Grosse Pointe Park | 0.15% | 0.022%(+0.125)#14 | 0.24%(-0.095)#1,924 |
| 15. | Shepherd | 0.14% | 0.022%(+0.119)#15 | 0.24%(-0.101)#1,967 |
| 16. | Burton | 0.13% | 0.022%(+0.106)#16 | 0.24%(-0.114)#2,039 |
| 17. | Monroe | 0.13% | 0.022%(+0.105)#17 | 0.24%(-0.115)#2,049 |
| 18. | Westland | 0.12% | 0.022%(+0.099)#18 | 0.24%(-0.121)#2,079 |
| 19. | Alpena | 0.12% | 0.022%(+0.095)#19 | 0.24%(-0.125)#2,110 |
| 20. | East Lansing | 0.084% | 0.022%(+0.061)#20 | 0.24%(-0.159)#2,354 |
| 21. | Wyoming | 0.079% | 0.022%(+0.057)#21 | 0.24%(-0.163)#2,389 |
| 22. | Forest Hills | 0.067% | 0.022%(+0.044)#22 | 0.24%(-0.176)#2,501 |
| 23. | Battle Creek | 0.063% | 0.022%(+0.041)#23 | 0.24%(-0.180)#2,533 |
| 24. | Okemos | 0.063% | 0.022%(+0.040)#24 | 0.24%(-0.180)#2,534 |
| 25. | Oak Park | 0.058% | 0.022%(+0.035)#25 | 0.24%(-0.185)#2,565 |
| 26. | Port Huron | 0.055% | 0.022%(+0.033)#26 | 0.24%(-0.187)#2,582 |
| 27. | Grand Rapids | 0.055% | 0.022%(+0.032)#27 | 0.24%(-0.188)#2,594 |
| 28. | Lansing | 0.053% | 0.022%(+0.031)#28 | 0.24%(-0.190)#2,615 |
| 29. | Ferndale | 0.047% | 0.022%(+0.024)#29 | 0.24%(-0.196)#2,672 |
| 30. | Ann Arbor | 0.044% | 0.022%(+0.022)#30 | 0.24%(-0.199)#2,696 |
| 31. | Berkley | 0.040% | 0.022%(+0.017)#31 | 0.24%(-0.203)#2,733 |
| 32. | Waverly | 0.030% | 0.022%(+0.007)#32 | 0.24%(-0.213)#2,822 |
| 33. | Allendale | 0.028% | 0.022%(+0.005)#33 | 0.24%(-0.215)#2,832 |
| 34. | Birmingham | 0.023% | 0.022%(+0.001)#34 | 0.24%(-0.220)#2,890 |
| 35. | Kalamazoo | 0.019% | 0.022%(-0.003)#35 | 0.24%(-0.224)#2,934 |
| 36. | Garden City | 0.018% | 0.022%(-0.004)#36 | 0.24%(-0.224)#2,940 |
| 37. | Troy | 0.0092% | 0.022%(-0.013)#37 | 0.24%(-0.234)#3,012 |
| 38. | Detroit | 0.0086% | 0.022%(-0.014)#38 | 0.24%(-0.234)#3,019 |
Common Questions
What are the Top 10 Cities with the Highest Percentage of Ecuadorian Population in Michigan?
Top 10 Cities with the Highest Percentage of Ecuadorian Population in Michigan are:
#1
0.66%
#2
0.43%
#3
0.40%
#4
0.39%
#5
0.36%
#6
0.33%
#7
0.31%
#8
0.26%
#9
0.26%
#10
0.21%
What city has the Highest Percentage of Ecuadorian Population in Michigan?
Eau Claire has the Highest Percentage of Ecuadorian Population in Michigan with 0.66%.
What is the Percentage of Ecuadorian Population in the State of Michigan?
Percentage of Ecuadorian Population in Michigan is 0.022%.
What is the Percentage of Ecuadorian Population in the United States?
Percentage of Ecuadorian Population in the United States is 0.24%.