Cities with the Highest Percentage of Ecuadorian Population in Missouri
RELATED REPORTS & OPTIONS
Ecuadorian
Missouri
Compare Cities
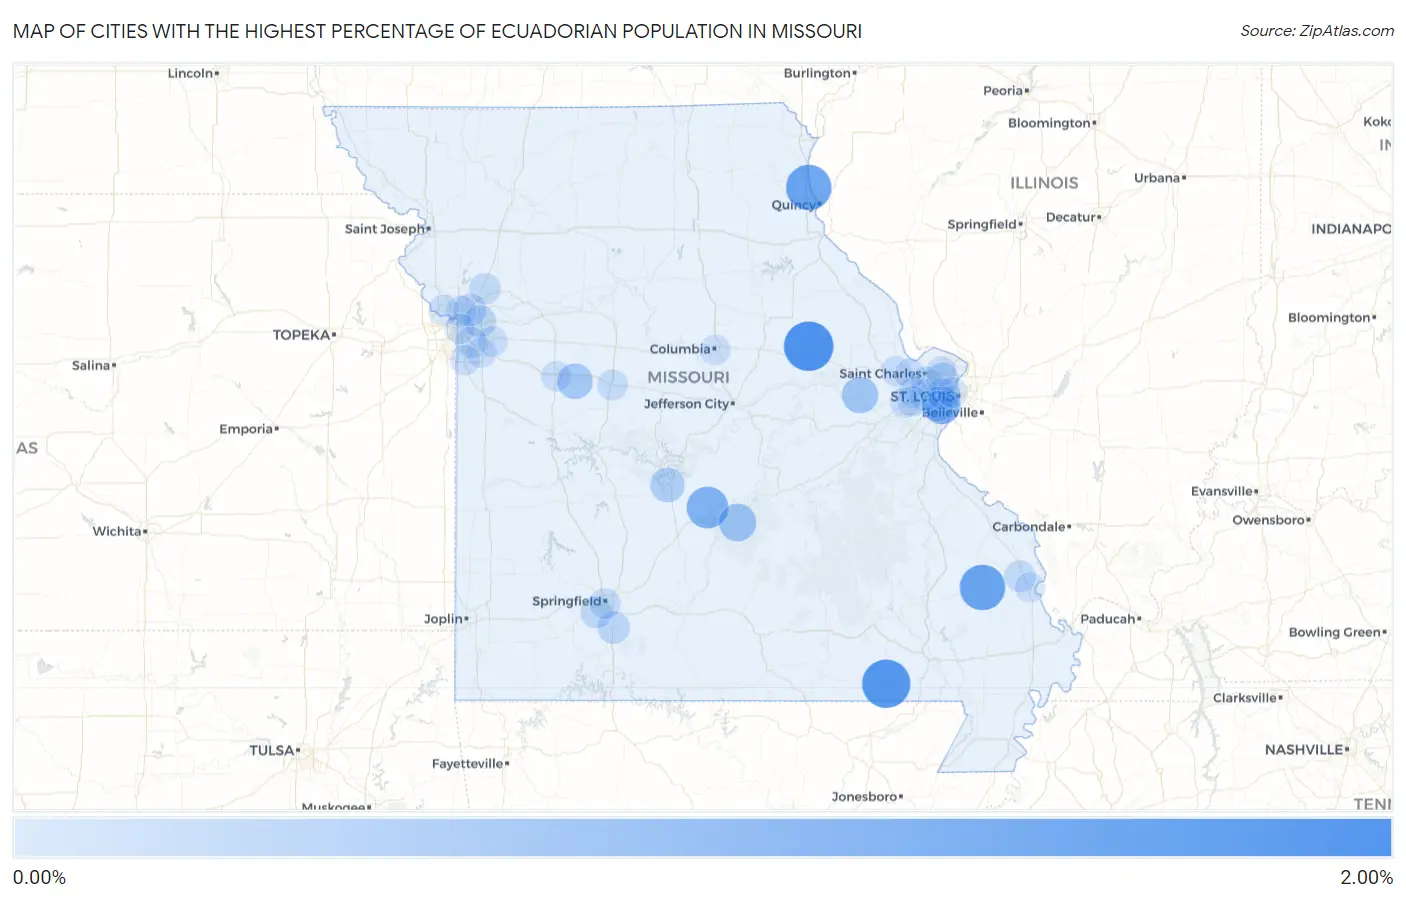
Map of Cities with the Highest Percentage of Ecuadorian Population in Missouri
0.00%
2.00%
Cities with the Highest Percentage of Ecuadorian Population in Missouri
| City | Ecuadorian | vs State | vs National | |
| 1. | Montgomery City | 1.85% | 0.021%(+1.83)#1 | 0.24%(+1.60)#294 |
| 2. | Doniphan | 1.73% | 0.021%(+1.71)#2 | 0.24%(+1.49)#314 |
| 3. | Marble Hill | 1.46% | 0.021%(+1.44)#3 | 0.24%(+1.21)#372 |
| 4. | La Grange | 1.44% | 0.021%(+1.42)#4 | 0.24%(+1.20)#378 |
| 5. | Richland | 1.08% | 0.021%(+1.06)#5 | 0.24%(+0.841)#513 |
| 6. | Marlborough | 0.76% | 0.021%(+0.742)#6 | 0.24%(+0.520)#696 |
| 7. | Fort Leonard Wood | 0.69% | 0.021%(+0.664)#7 | 0.24%(+0.442)#775 |
| 8. | Marthasville | 0.57% | 0.021%(+0.553)#8 | 0.24%(+0.331)#896 |
| 9. | Whiteman Afb | 0.51% | 0.021%(+0.489)#9 | 0.24%(+0.267)#987 |
| 10. | Camdenton | 0.40% | 0.021%(+0.381)#10 | 0.24%(+0.159)#1,140 |
| 11. | Affton | 0.29% | 0.021%(+0.265)#11 | 0.24%(+0.043)#1,401 |
| 12. | Berkeley | 0.24% | 0.021%(+0.222)#12 | 0.24%(+0.000)#1,524 |
| 13. | Pleasant Valley | 0.22% | 0.021%(+0.197)#13 | 0.24%(-0.024)#1,618 |
| 14. | Ozark | 0.21% | 0.021%(+0.189)#14 | 0.24%(-0.033)#1,651 |
| 15. | Sugar Creek | 0.18% | 0.021%(+0.164)#15 | 0.24%(-0.058)#1,760 |
| 16. | Battlefield | 0.15% | 0.021%(+0.128)#16 | 0.24%(-0.094)#1,913 |
| 17. | Kearney | 0.12% | 0.021%(+0.103)#17 | 0.24%(-0.119)#2,063 |
| 18. | Jackson | 0.12% | 0.021%(+0.096)#18 | 0.24%(-0.126)#2,117 |
| 19. | Town And Country | 0.11% | 0.021%(+0.091)#19 | 0.24%(-0.130)#2,155 |
| 20. | Clayton | 0.10% | 0.021%(+0.084)#20 | 0.24%(-0.138)#2,201 |
| 21. | Maryland Heights | 0.10% | 0.021%(+0.082)#21 | 0.24%(-0.140)#2,206 |
| 22. | Raytown | 0.097% | 0.021%(+0.077)#22 | 0.24%(-0.145)#2,245 |
| 23. | Springfield | 0.094% | 0.021%(+0.073)#23 | 0.24%(-0.149)#2,273 |
| 24. | Sedalia | 0.083% | 0.021%(+0.062)#24 | 0.24%(-0.160)#2,362 |
| 25. | Crestwood | 0.073% | 0.021%(+0.052)#25 | 0.24%(-0.170)#2,442 |
| 26. | St Louis | 0.047% | 0.021%(+0.026)#26 | 0.24%(-0.196)#2,669 |
| 27. | O Fallon | 0.047% | 0.021%(+0.026)#27 | 0.24%(-0.196)#2,670 |
| 28. | Columbia | 0.041% | 0.021%(+0.020)#28 | 0.24%(-0.202)#2,713 |
| 29. | Chesterfield | 0.040% | 0.021%(+0.019)#29 | 0.24%(-0.202)#2,725 |
| 30. | Gladstone | 0.037% | 0.021%(+0.016)#30 | 0.24%(-0.206)#2,751 |
| 31. | Warrensburg | 0.036% | 0.021%(+0.015)#31 | 0.24%(-0.207)#2,763 |
| 32. | Lee S Summit | 0.035% | 0.021%(+0.015)#32 | 0.24%(-0.207)#2,769 |
| 33. | St Peters | 0.033% | 0.021%(+0.012)#33 | 0.24%(-0.210)#2,791 |
| 34. | Ellisville | 0.030% | 0.021%(+0.009)#34 | 0.24%(-0.213)#2,818 |
| 35. | Blue Springs | 0.027% | 0.021%(+0.006)#35 | 0.24%(-0.216)#2,841 |
| 36. | Parkville | 0.026% | 0.021%(+0.005)#36 | 0.24%(-0.217)#2,856 |
| 37. | Kansas City | 0.022% | 0.021%(+0.001)#37 | 0.24%(-0.221)#2,906 |
| 38. | Grandview | 0.019% | 0.021%(-0.002)#38 | 0.24%(-0.223)#2,933 |
| 39. | Wildwood | 0.014% | 0.021%(-0.007)#39 | 0.24%(-0.229)#2,977 |
| 40. | Cape Girardeau | 0.0075% | 0.021%(-0.013)#40 | 0.24%(-0.235)#3,025 |
| 41. | Florissant | 0.0019% | 0.021%(-0.019)#41 | 0.24%(-0.241)#3,053 |
Common Questions
What are the Top 10 Cities with the Highest Percentage of Ecuadorian Population in Missouri?
Top 10 Cities with the Highest Percentage of Ecuadorian Population in Missouri are:
#1
1.85%
#2
1.73%
#3
1.46%
#4
1.44%
#5
1.08%
#6
0.76%
#7
0.69%
#8
0.57%
#9
0.51%
#10
0.40%
What city has the Highest Percentage of Ecuadorian Population in Missouri?
Montgomery City has the Highest Percentage of Ecuadorian Population in Missouri with 1.85%.
What is the Percentage of Ecuadorian Population in the State of Missouri?
Percentage of Ecuadorian Population in Missouri is 0.021%.
What is the Percentage of Ecuadorian Population in the United States?
Percentage of Ecuadorian Population in the United States is 0.24%.