Cities with the Highest Percentage of Ecuadorian Population in the United States
RELATED REPORTS & OPTIONS
Ecuadorian
United States
Compare Cities
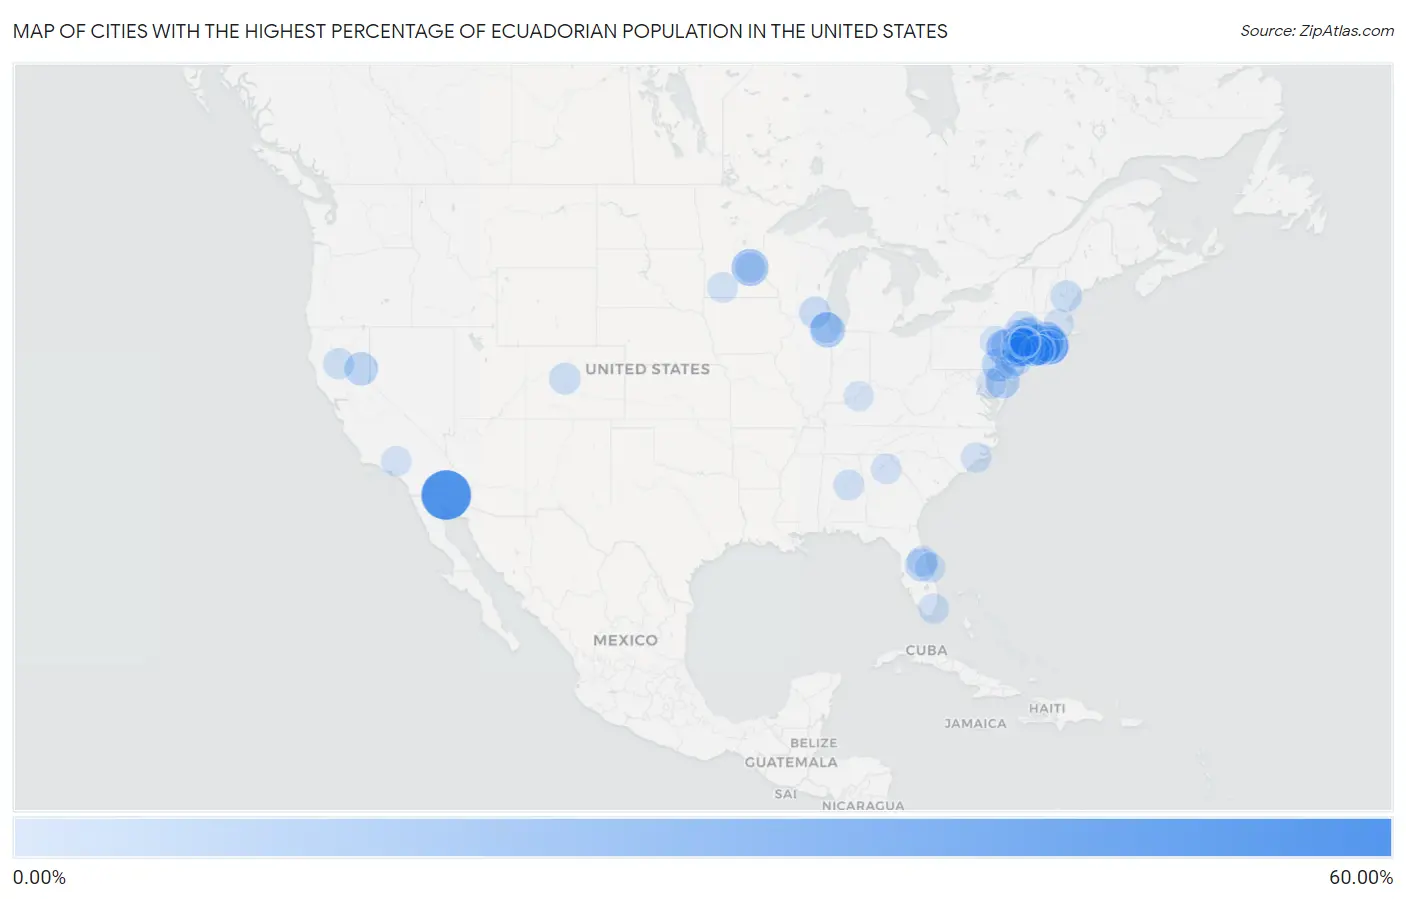
Map of Cities with the Highest Percentage of Ecuadorian Population in the United States
0.00%
60.00%
Cities with the Highest Percentage of Ecuadorian Population in the United States
| City | Ecuadorian | vs State | vs National | |
| 1. | Padre Ranchitos | 59.38% | 0.059%(+59.3)#1 | 0.24%(+59.1)#1 |
| 2. | East Newark Borough | 35.76% | 1.60%(+34.2)#1 | 0.24%(+35.5)#2 |
| 3. | Silver Lake Cdp Essex County | 26.59% | 1.60%(+25.0)#2 | 0.24%(+26.4)#3 |
| 4. | Springs | 24.90% | 1.43%(+23.5)#1 | 0.24%(+24.7)#4 |
| 5. | Hilltop | 23.08% | 0.25%(+22.8)#1 | 0.24%(+22.8)#5 |
| 6. | East Hampton North | 22.68% | 1.43%(+21.3)#2 | 0.24%(+22.4)#6 |
| 7. | Saylorsburg | 22.28% | 0.15%(+22.1)#1 | 0.24%(+22.0)#7 |
| 8. | Ampere North | 22.25% | 1.60%(+20.6)#3 | 0.24%(+22.0)#8 |
| 9. | Saybrook Manor | 21.04% | 1.11%(+19.9)#1 | 0.24%(+20.8)#9 |
| 10. | Forest View | 17.72% | 0.25%(+17.5)#1 | 0.24%(+17.5)#10 |
| 11. | Sleepy Hollow | 17.45% | 1.43%(+16.0)#3 | 0.24%(+17.2)#11 |
| 12. | Dover Base Housing | 15.60% | 0.14%(+15.5)#1 | 0.24%(+15.4)#12 |
| 13. | Hightstown Borough | 15.59% | 1.60%(+14.0)#4 | 0.24%(+15.3)#13 |
| 14. | Ossining | 14.88% | 1.43%(+13.5)#4 | 0.24%(+14.6)#14 |
| 15. | Quogue | 14.84% | 1.43%(+13.4)#5 | 0.24%(+14.6)#15 |
| 16. | Caln | 13.94% | 0.15%(+13.8)#2 | 0.24%(+13.7)#16 |
| 17. | Peekskill | 13.89% | 1.43%(+12.5)#6 | 0.24%(+13.6)#17 |
| 18. | Singac | 13.87% | 1.60%(+12.3)#5 | 0.24%(+13.6)#18 |
| 19. | Hopewell Junction | 13.71% | 1.43%(+12.3)#7 | 0.24%(+13.5)#19 |
| 20. | Flanders | 13.12% | 1.43%(+11.7)#8 | 0.24%(+12.9)#20 |
| 21. | Clio | 13.10% | 0.12%(+13.0)#1 | 0.24%(+12.9)#21 |
| 22. | Greens Farms | 13.08% | 1.11%(+12.0)#2 | 0.24%(+12.8)#22 |
| 23. | Moonachie Borough | 11.99% | 1.60%(+10.4)#6 | 0.24%(+11.8)#23 |
| 24. | Medford | 11.80% | 1.43%(+10.4)#9 | 0.24%(+11.6)#24 |
| 25. | Hillcrest | 11.36% | 1.43%(+9.93)#10 | 0.24%(+11.1)#25 |
| 26. | Lake Hart | 10.85% | 0.39%(+10.5)#1 | 0.24%(+10.6)#26 |
| 27. | Danbury | 10.78% | 1.11%(+9.67)#3 | 0.24%(+10.5)#27 |
| 28. | Hackensack | 10.58% | 1.60%(+8.98)#7 | 0.24%(+10.3)#28 |
| 29. | Spring Valley | 10.20% | 1.43%(+8.77)#11 | 0.24%(+9.95)#29 |
| 30. | Union City | 9.98% | 1.60%(+8.38)#8 | 0.24%(+9.74)#30 |
| 31. | Kearny | 9.92% | 1.60%(+8.32)#9 | 0.24%(+9.68)#31 |
| 32. | Northwest Harbor | 9.91% | 1.43%(+8.49)#12 | 0.24%(+9.67)#32 |
| 33. | Nanuet | 9.73% | 1.43%(+8.30)#13 | 0.24%(+9.48)#33 |
| 34. | Dover Plains | 9.62% | 1.43%(+8.19)#14 | 0.24%(+9.38)#34 |
| 35. | Patchogue | 9.34% | 1.43%(+7.91)#15 | 0.24%(+9.10)#35 |
| 36. | Fairview Cdp Westchester County | 8.86% | 1.43%(+7.43)#16 | 0.24%(+8.61)#36 |
| 37. | Hillburn | 8.84% | 1.43%(+7.41)#17 | 0.24%(+8.60)#37 |
| 38. | Newark | 8.72% | 1.60%(+7.12)#10 | 0.24%(+8.48)#38 |
| 39. | Turtle Lake | 8.58% | 0.033%(+8.55)#1 | 0.24%(+8.34)#39 |
| 40. | Twin Rivers | 8.53% | 1.60%(+6.93)#11 | 0.24%(+8.29)#40 |
| 41. | Juniper Canyon | 8.46% | 0.059%(+8.40)#1 | 0.24%(+8.22)#41 |
| 42. | Jamesburg Borough | 8.42% | 1.60%(+6.82)#12 | 0.24%(+8.18)#42 |
| 43. | Ansonia | 8.38% | 1.11%(+7.28)#4 | 0.24%(+8.14)#43 |
| 44. | Sanbornville | 8.38% | 0.036%(+8.34)#1 | 0.24%(+8.14)#44 |
| 45. | Leadville | 8.28% | 0.064%(+8.21)#1 | 0.24%(+8.03)#45 |
| 46. | Guttenberg | 8.25% | 1.60%(+6.65)#13 | 0.24%(+8.01)#46 |
| 47. | Fawn Grove Borough | 8.22% | 0.15%(+8.07)#3 | 0.24%(+7.98)#47 |
| 48. | Rosemont | 7.97% | 0.25%(+7.72)#2 | 0.24%(+7.73)#48 |
| 49. | Le Raysville Borough | 7.61% | 0.15%(+7.46)#4 | 0.24%(+7.37)#49 |
| 50. | Port Chester | 7.44% | 1.43%(+6.01)#18 | 0.24%(+7.20)#50 |
| 51. | Bellerose | 7.41% | 1.43%(+5.98)#19 | 0.24%(+7.16)#51 |
| 52. | Essex Fells Borough | 7.38% | 1.60%(+5.78)#14 | 0.24%(+7.14)#52 |
| 53. | West New York | 7.27% | 1.60%(+5.67)#15 | 0.24%(+7.03)#53 |
| 54. | Elizabeth | 7.24% | 1.60%(+5.64)#16 | 0.24%(+7.00)#54 |
| 55. | Gerber | 7.10% | 0.12%(+6.99)#2 | 0.24%(+6.86)#55 |
| 56. | Little Ferry Borough | 7.06% | 1.60%(+5.46)#17 | 0.24%(+6.81)#56 |
| 57. | Ridgefield Park | 6.98% | 1.60%(+5.38)#18 | 0.24%(+6.74)#57 |
| 58. | Bogota Borough | 6.92% | 1.60%(+5.32)#19 | 0.24%(+6.68)#58 |
| 59. | Baxter Estates | 6.79% | 1.43%(+5.37)#20 | 0.24%(+6.55)#59 |
| 60. | North Arlington Borough | 6.68% | 1.60%(+5.08)#20 | 0.24%(+6.44)#60 |
| 61. | Danielson Borough | 6.68% | 1.11%(+5.57)#5 | 0.24%(+6.44)#61 |
| 62. | Brewster Heights | 6.42% | 1.43%(+4.99)#21 | 0.24%(+6.18)#62 |
| 63. | Noyack | 6.38% | 1.43%(+4.95)#22 | 0.24%(+6.14)#63 |
| 64. | Florida | 6.33% | 1.43%(+4.91)#23 | 0.24%(+6.09)#64 |
| 65. | Penn Estates | 6.23% | 0.15%(+6.08)#5 | 0.24%(+5.99)#65 |
| 66. | Cornwells Heights | 6.20% | 0.15%(+6.05)#6 | 0.24%(+5.96)#66 |
| 67. | Zena | 6.20% | 1.43%(+4.77)#24 | 0.24%(+5.96)#67 |
| 68. | Chuluota | 6.00% | 0.39%(+5.60)#2 | 0.24%(+5.76)#68 |
| 69. | North Plainfield Borough | 5.97% | 1.60%(+4.37)#21 | 0.24%(+5.73)#69 |
| 70. | Mignon | 5.87% | 0.017%(+5.86)#1 | 0.24%(+5.63)#70 |
| 71. | Strawberry Cdp Marin County | 5.86% | 0.12%(+5.74)#3 | 0.24%(+5.62)#71 |
| 72. | Elmsford | 5.80% | 1.43%(+4.37)#25 | 0.24%(+5.55)#72 |
| 73. | West Nanticoke | 5.68% | 0.15%(+5.53)#7 | 0.24%(+5.44)#73 |
| 74. | Mount Ivy | 5.61% | 1.43%(+4.19)#26 | 0.24%(+5.37)#74 |
| 75. | Jeffers | 5.56% | 0.25%(+5.30)#2 | 0.24%(+5.31)#75 |
| 76. | West Perrine | 5.54% | 0.39%(+5.15)#3 | 0.24%(+5.30)#76 |
| 77. | Patrick Afb | 5.48% | 0.39%(+5.09)#4 | 0.24%(+5.24)#77 |
| 78. | Wurtsboro | 5.25% | 1.43%(+3.83)#27 | 0.24%(+5.01)#78 |
| 79. | Columbia Heights | 5.18% | 0.25%(+4.93)#3 | 0.24%(+4.94)#79 |
| 80. | Pendergrass | 5.10% | 0.063%(+5.04)#1 | 0.24%(+4.86)#80 |
| 81. | Plainfield | 5.09% | 1.60%(+3.49)#22 | 0.24%(+4.85)#81 |
| 82. | Sloatsburg | 5.07% | 1.43%(+3.64)#28 | 0.24%(+4.82)#82 |
| 83. | Cliffside Park Borough | 5.06% | 1.60%(+3.46)#23 | 0.24%(+4.82)#83 |
| 84. | Pumpkin Center | 5.02% | 0.12%(+4.90)#1 | 0.24%(+4.78)#84 |
| 85. | Moriches | 4.99% | 1.43%(+3.56)#29 | 0.24%(+4.75)#85 |
| 86. | Desert View Highlands | 4.98% | 0.12%(+4.86)#4 | 0.24%(+4.73)#86 |
| 87. | Lawnside Borough | 4.97% | 1.60%(+3.37)#24 | 0.24%(+4.73)#87 |
| 88. | Harrison | 4.93% | 1.60%(+3.33)#25 | 0.24%(+4.69)#88 |
| 89. | Milford | 4.93% | 0.26%(+4.66)#1 | 0.24%(+4.68)#89 |
| 90. | Manor Creek | 4.73% | 0.012%(+4.72)#1 | 0.24%(+4.48)#90 |
| 91. | Chester | 4.65% | 0.17%(+4.48)#1 | 0.24%(+4.40)#91 |
| 92. | Haverstraw | 4.64% | 1.43%(+3.21)#30 | 0.24%(+4.40)#92 |
| 93. | North Bellport | 4.54% | 1.43%(+3.11)#31 | 0.24%(+4.30)#93 |
| 94. | Croton On Hudson | 4.53% | 1.43%(+3.10)#32 | 0.24%(+4.29)#94 |
| 95. | Dover | 4.52% | 1.60%(+2.92)#26 | 0.24%(+4.28)#95 |
| 96. | East Islip | 4.50% | 1.43%(+3.07)#33 | 0.24%(+4.26)#96 |
| 97. | West Nyack | 4.49% | 1.43%(+3.06)#34 | 0.24%(+4.24)#97 |
| 98. | Beesleys Point | 4.39% | 1.60%(+2.79)#27 | 0.24%(+4.15)#98 |
| 99. | Buchanan | 4.36% | 1.43%(+2.93)#35 | 0.24%(+4.11)#99 |
| 100. | Victory Gardens Borough | 4.32% | 1.60%(+2.71)#28 | 0.24%(+4.07)#100 |
Common Questions
What are the Top 10 Cities with the Highest Percentage of Ecuadorian Population in the United States?
Top 10 Cities with the Highest Percentage of Ecuadorian Population in the United States are:
#1
59.38%
#2
24.90%
#3
23.08%
#4
22.68%
#5
22.28%
#6
21.04%
#7
17.72%
#8
17.45%
#9
15.60%
#10
14.88%
What city has the Highest Percentage of Ecuadorian Population in the United States?
Padre Ranchitos has the Highest Percentage of Ecuadorian Population in the United States with 59.38%.
What is the Percentage of Ecuadorian Population in the United States?
Percentage of Ecuadorian Population in the United States is 0.24%.