Zip Codes with the Highest Percentage of Population Employed in Computer & Mathematics in Massachusetts
RELATED REPORTS & OPTIONS
Computer & Mathematics
Massachusetts
Compare Zip Codes
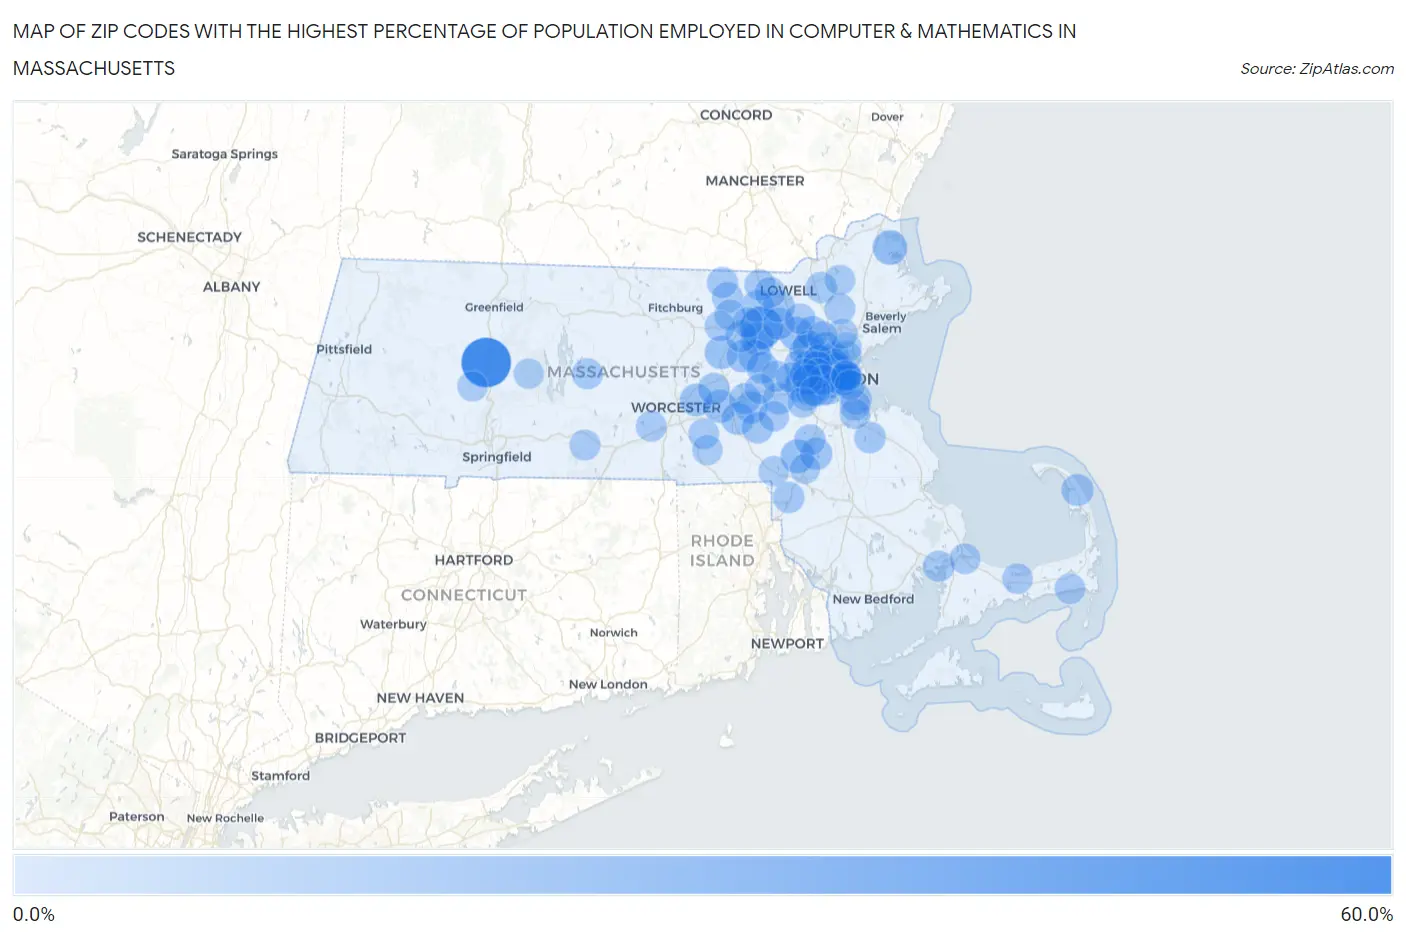
Map of Zip Codes with the Highest Percentage of Population Employed in Computer & Mathematics in Massachusetts
0.0%
60.0%
Zip Codes with the Highest Percentage of Population Employed in Computer & Mathematics in Massachusetts
| Zip Code | % Employed | vs State | vs National | |
| 1. | 01066 | 53.8% | 4.8%(+49.0)#1 | 3.5%(+50.3)#10 |
| 2. | 01718 | 35.9% | 4.8%(+31.1)#2 | 3.5%(+32.4)#30 |
| 3. | 01951 | 16.3% | 4.8%(+11.5)#3 | 3.5%(+12.8)#208 |
| 4. | 02071 | 15.0% | 4.8%(+10.2)#4 | 3.5%(+11.5)#253 |
| 5. | 01730 | 14.5% | 4.8%(+9.70)#5 | 3.5%(+11.0)#278 |
| 6. | 01720 | 14.5% | 4.8%(+9.69)#6 | 3.5%(+11.0)#281 |
| 7. | 02141 | 14.4% | 4.8%(+9.61)#7 | 3.5%(+10.9)#284 |
| 8. | 02421 | 14.0% | 4.8%(+9.24)#8 | 3.5%(+10.5)#307 |
| 9. | 02140 | 13.5% | 4.8%(+8.72)#9 | 3.5%(+10.00)#330 |
| 10. | 01740 | 13.3% | 4.8%(+8.51)#10 | 3.5%(+9.78)#343 |
| 11. | 02142 | 13.3% | 4.8%(+8.46)#11 | 3.5%(+9.74)#348 |
| 12. | 01581 | 13.0% | 4.8%(+8.16)#12 | 3.5%(+9.43)#365 |
| 13. | 02474 | 12.6% | 4.8%(+7.77)#13 | 3.5%(+9.05)#392 |
| 14. | 02144 | 12.3% | 4.8%(+7.48)#14 | 3.5%(+8.75)#415 |
| 15. | 01754 | 12.0% | 4.8%(+7.23)#15 | 3.5%(+8.50)#437 |
| 16. | 01803 | 11.9% | 4.8%(+7.14)#16 | 3.5%(+8.42)#448 |
| 17. | 01545 | 11.9% | 4.8%(+7.12)#17 | 3.5%(+8.40)#450 |
| 18. | 02466 | 11.9% | 4.8%(+7.06)#18 | 3.5%(+8.33)#454 |
| 19. | 01748 | 11.5% | 4.8%(+6.70)#19 | 3.5%(+7.97)#494 |
| 20. | 01721 | 11.5% | 4.8%(+6.65)#20 | 3.5%(+7.93)#500 |
| 21. | 01886 | 11.4% | 4.8%(+6.57)#21 | 3.5%(+7.84)#511 |
| 22. | 01775 | 11.1% | 4.8%(+6.27)#22 | 3.5%(+7.54)#557 |
| 23. | 02067 | 11.0% | 4.8%(+6.18)#23 | 3.5%(+7.45)#560 |
| 24. | 02666 | 10.8% | 4.8%(+6.03)#24 | 3.5%(+7.31)#582 |
| 25. | 01741 | 10.7% | 4.8%(+5.88)#25 | 3.5%(+7.15)#608 |
| 26. | 02139 | 10.5% | 4.8%(+5.70)#26 | 3.5%(+6.98)#631 |
| 27. | 01824 | 10.5% | 4.8%(+5.67)#27 | 3.5%(+6.94)#639 |
| 28. | 02420 | 10.2% | 4.8%(+5.38)#28 | 3.5%(+6.65)#677 |
| 29. | 02445 | 10.1% | 4.8%(+5.32)#29 | 3.5%(+6.59)#690 |
| 30. | 02143 | 10.0% | 4.8%(+5.22)#30 | 3.5%(+6.49)#707 |
| 31. | 01719 | 9.9% | 4.8%(+5.07)#31 | 3.5%(+6.34)#728 |
| 32. | 01776 | 9.9% | 4.8%(+5.06)#32 | 3.5%(+6.33)#732 |
| 33. | 01746 | 9.7% | 4.8%(+4.94)#33 | 3.5%(+6.21)#750 |
| 34. | 02134 | 9.7% | 4.8%(+4.94)#34 | 3.5%(+6.21)#751 |
| 35. | 01532 | 9.6% | 4.8%(+4.80)#35 | 3.5%(+6.08)#775 |
| 36. | 01760 | 9.3% | 4.8%(+4.53)#36 | 3.5%(+5.81)#830 |
| 37. | 02114 | 9.3% | 4.8%(+4.50)#37 | 3.5%(+5.78)#838 |
| 38. | 02452 | 9.1% | 4.8%(+4.34)#38 | 3.5%(+5.62)#871 |
| 39. | 01810 | 9.1% | 4.8%(+4.31)#39 | 3.5%(+5.58)#882 |
| 40. | 02190 | 9.0% | 4.8%(+4.25)#40 | 3.5%(+5.53)#896 |
| 41. | 02451 | 8.9% | 4.8%(+4.13)#41 | 3.5%(+5.40)#920 |
| 42. | 02462 | 8.8% | 4.8%(+4.00)#42 | 3.5%(+5.28)#952 |
| 43. | 02763 | 8.7% | 4.8%(+3.93)#43 | 3.5%(+5.20)#978 |
| 44. | 02032 | 8.7% | 4.8%(+3.86)#44 | 3.5%(+5.13)#1,006 |
| 45. | 01890 | 8.6% | 4.8%(+3.81)#45 | 3.5%(+5.08)#1,021 |
| 46. | 02446 | 8.6% | 4.8%(+3.80)#46 | 3.5%(+5.07)#1,024 |
| 47. | 01879 | 8.5% | 4.8%(+3.74)#47 | 3.5%(+5.01)#1,041 |
| 48. | 02171 | 8.5% | 4.8%(+3.72)#48 | 3.5%(+4.99)#1,047 |
| 49. | 01745 | 8.5% | 4.8%(+3.66)#49 | 3.5%(+4.93)#1,066 |
| 50. | 02558 | 8.4% | 4.8%(+3.61)#50 | 3.5%(+4.88)#1,078 |
| 51. | 01450 | 8.4% | 4.8%(+3.56)#51 | 3.5%(+4.83)#1,092 |
| 52. | 02494 | 8.3% | 4.8%(+3.51)#52 | 3.5%(+4.79)#1,115 |
| 53. | 02110 | 8.3% | 4.8%(+3.48)#53 | 3.5%(+4.75)#1,125 |
| 54. | 01463 | 8.3% | 4.8%(+3.47)#54 | 3.5%(+4.75)#1,128 |
| 55. | 02467 | 8.3% | 4.8%(+3.46)#55 | 3.5%(+4.73)#1,134 |
| 56. | 02155 | 8.2% | 4.8%(+3.35)#56 | 3.5%(+4.63)#1,165 |
| 57. | 02145 | 8.1% | 4.8%(+3.34)#57 | 3.5%(+4.61)#1,167 |
| 58. | 02476 | 8.1% | 4.8%(+3.32)#58 | 3.5%(+4.60)#1,168 |
| 59. | 02461 | 8.1% | 4.8%(+3.32)#59 | 3.5%(+4.60)#1,170 |
| 60. | 01778 | 8.1% | 4.8%(+3.32)#60 | 3.5%(+4.60)#1,171 |
| 61. | 02478 | 8.1% | 4.8%(+3.30)#61 | 3.5%(+4.58)#1,180 |
| 62. | 02116 | 8.0% | 4.8%(+3.19)#62 | 3.5%(+4.47)#1,208 |
| 63. | 01863 | 7.9% | 4.8%(+3.15)#63 | 3.5%(+4.42)#1,221 |
| 64. | 02111 | 7.9% | 4.8%(+3.13)#64 | 3.5%(+4.40)#1,227 |
| 65. | 02148 | 7.9% | 4.8%(+3.10)#65 | 3.5%(+4.37)#1,238 |
| 66. | 01037 | 7.7% | 4.8%(+2.93)#66 | 3.5%(+4.20)#1,309 |
| 67. | 01432 | 7.7% | 4.8%(+2.87)#67 | 3.5%(+4.15)#1,329 |
| 68. | 01010 | 7.6% | 4.8%(+2.79)#68 | 3.5%(+4.06)#1,354 |
| 69. | 01542 | 7.5% | 4.8%(+2.71)#69 | 3.5%(+3.98)#1,387 |
| 70. | 02170 | 7.5% | 4.8%(+2.69)#70 | 3.5%(+3.97)#1,391 |
| 71. | 02472 | 7.5% | 4.8%(+2.69)#71 | 3.5%(+3.96)#1,392 |
| 72. | 02113 | 7.4% | 4.8%(+2.62)#72 | 3.5%(+3.90)#1,419 |
| 73. | 01821 | 7.3% | 4.8%(+2.53)#73 | 3.5%(+3.81)#1,447 |
| 74. | 02493 | 7.2% | 4.8%(+2.38)#74 | 3.5%(+3.65)#1,528 |
| 75. | 01560 | 7.2% | 4.8%(+2.36)#75 | 3.5%(+3.63)#1,539 |
| 76. | 02630 | 7.1% | 4.8%(+2.29)#76 | 3.5%(+3.56)#1,579 |
| 77. | 02135 | 7.1% | 4.8%(+2.28)#77 | 3.5%(+3.55)#1,582 |
| 78. | 01460 | 7.0% | 4.8%(+2.24)#78 | 3.5%(+3.52)#1,601 |
| 79. | 02561 | 7.0% | 4.8%(+2.24)#79 | 3.5%(+3.51)#1,604 |
| 80. | 01434 | 7.0% | 4.8%(+2.23)#80 | 3.5%(+3.50)#1,610 |
| 81. | 02465 | 7.0% | 4.8%(+2.22)#81 | 3.5%(+3.50)#1,613 |
| 82. | 01770 | 7.0% | 4.8%(+2.18)#82 | 3.5%(+3.45)#1,633 |
| 83. | 02646 | 6.9% | 4.8%(+2.10)#83 | 3.5%(+3.38)#1,679 |
| 84. | 01701 | 6.9% | 4.8%(+2.10)#84 | 3.5%(+3.37)#1,680 |
| 85. | 01864 | 6.9% | 4.8%(+2.08)#85 | 3.5%(+3.35)#1,691 |
| 86. | 02169 | 6.9% | 4.8%(+2.06)#86 | 3.5%(+3.33)#1,704 |
| 87. | 02176 | 6.9% | 4.8%(+2.06)#87 | 3.5%(+3.33)#1,705 |
| 88. | 02109 | 6.8% | 4.8%(+2.00)#88 | 3.5%(+3.27)#1,736 |
| 89. | 01880 | 6.7% | 4.8%(+1.93)#89 | 3.5%(+3.21)#1,769 |
| 90. | 02093 | 6.7% | 4.8%(+1.92)#90 | 3.5%(+3.20)#1,780 |
| 91. | 01845 | 6.7% | 4.8%(+1.90)#91 | 3.5%(+3.17)#1,799 |
| 92. | 02453 | 6.5% | 4.8%(+1.70)#92 | 3.5%(+2.97)#1,927 |
| 93. | 02492 | 6.5% | 4.8%(+1.70)#93 | 3.5%(+2.97)#1,931 |
| 94. | 01588 | 6.4% | 4.8%(+1.63)#94 | 3.5%(+2.90)#1,984 |
| 95. | 02459 | 6.4% | 4.8%(+1.59)#95 | 3.5%(+2.86)#2,006 |
| 96. | 01801 | 6.3% | 4.8%(+1.52)#96 | 3.5%(+2.79)#2,066 |
| 97. | 02035 | 6.3% | 4.8%(+1.51)#97 | 3.5%(+2.79)#2,073 |
| 98. | 01002 | 6.3% | 4.8%(+1.51)#98 | 3.5%(+2.78)#2,080 |
| 99. | 01062 | 6.3% | 4.8%(+1.48)#99 | 3.5%(+2.76)#2,096 |
| 100. | 02127 | 6.3% | 4.8%(+1.47)#100 | 3.5%(+2.74)#2,105 |
Common Questions
What are the Top 10 Zip Codes with the Highest Percentage of Population Employed in Computer & Mathematics in Massachusetts?
Top 10 Zip Codes with the Highest Percentage of Population Employed in Computer & Mathematics in Massachusetts are:
What zip code has the Highest Percentage of Population Employed in Computer & Mathematics in Massachusetts?
01066 has the Highest Percentage of Population Employed in Computer & Mathematics in Massachusetts with 53.8%.
What is the Percentage of Population Employed in Computer & Mathematics in the State of Massachusetts?
Percentage of Population Employed in Computer & Mathematics in Massachusetts is 4.8%.
What is the Percentage of Population Employed in Computer & Mathematics in the United States?
Percentage of Population Employed in Computer & Mathematics in the United States is 3.5%.