Zip Codes with the Highest Percentage of Population Employed in Architecture & Engineering in Lowell, MA
RELATED REPORTS & OPTIONS
Architecture & Engineering
Lowell
Compare Zip Codes
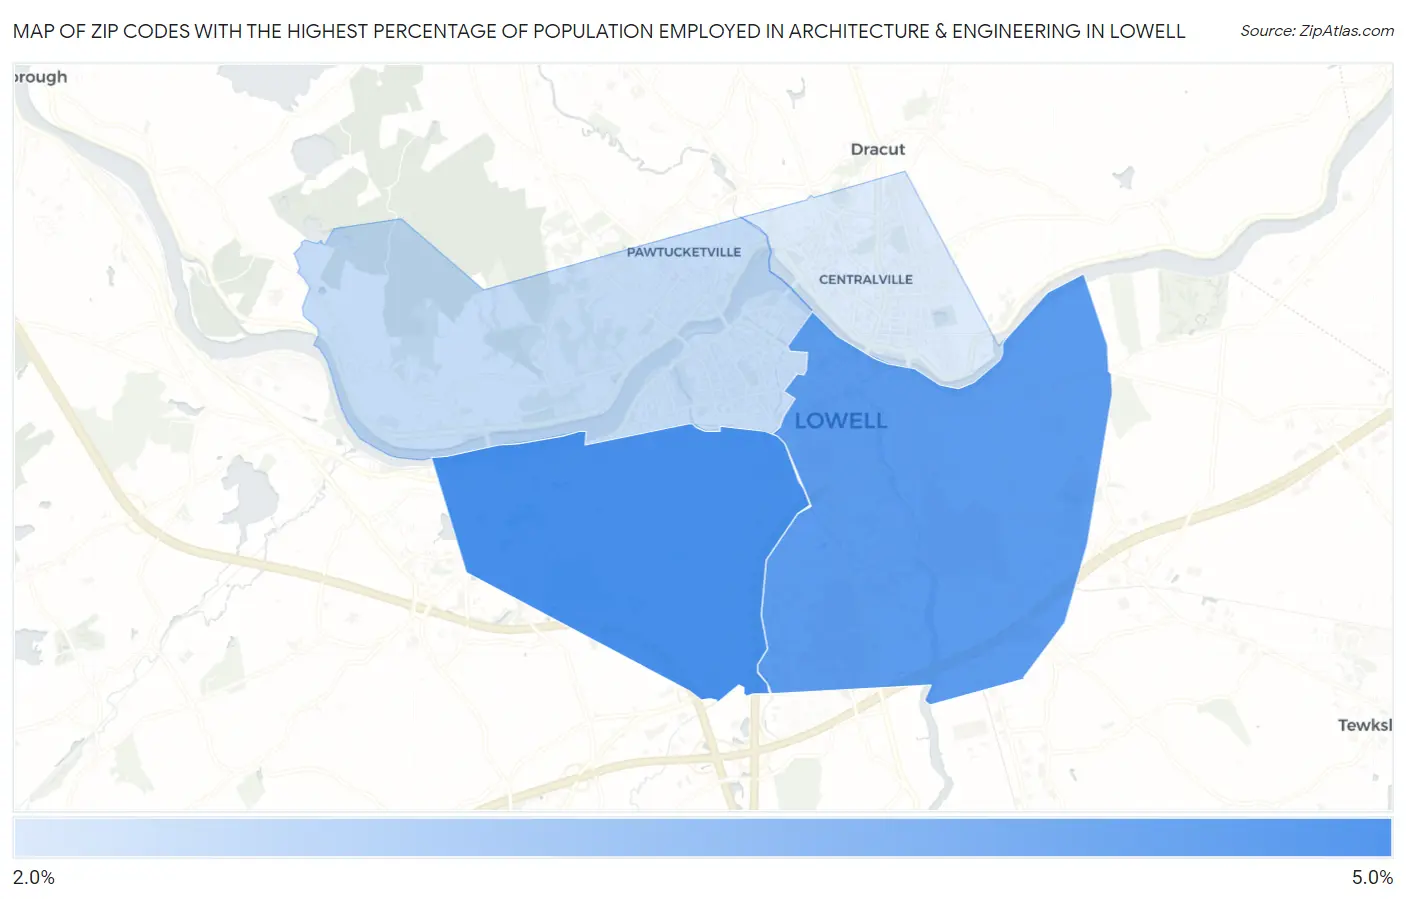
Map of Zip Codes with the Highest Percentage of Population Employed in Architecture & Engineering in Lowell
2.7%
4.4%
Zip Codes with the Highest Percentage of Population Employed in Architecture & Engineering in Lowell, MA
| Zip Code | % Employed | vs State | vs National | |
| 1. | 01851 | 4.4% | 2.7%(+1.73)#74 | 2.1%(+2.26)#2,250 |
| 2. | 01852 | 4.2% | 2.7%(+1.49)#83 | 2.1%(+2.01)#2,535 |
| 3. | 01854 | 3.0% | 2.7%(+0.315)#166 | 2.1%(+0.839)#5,094 |
| 4. | 01850 | 2.7% | 2.7%(+0.059)#194 | 2.1%(+0.584)#6,029 |
1
Common Questions
What are the Top 3 Zip Codes with the Highest Percentage of Population Employed in Architecture & Engineering in Lowell, MA?
Top 3 Zip Codes with the Highest Percentage of Population Employed in Architecture & Engineering in Lowell, MA are:
What zip code has the Highest Percentage of Population Employed in Architecture & Engineering in Lowell, MA?
01851 has the Highest Percentage of Population Employed in Architecture & Engineering in Lowell, MA with 4.4%.
What is the Percentage of Population Employed in Architecture & Engineering in Lowell, MA?
Percentage of Population Employed in Architecture & Engineering in Lowell is 3.8%.
What is the Percentage of Population Employed in Architecture & Engineering in Massachusetts?
Percentage of Population Employed in Architecture & Engineering in Massachusetts is 2.7%.
What is the Percentage of Population Employed in Architecture & Engineering in the United States?
Percentage of Population Employed in Architecture & Engineering in the United States is 2.1%.