Zip Codes with the Highest Percentage of Population Employed in Architecture & Engineering in Lawrence, MA
RELATED REPORTS & OPTIONS
Architecture & Engineering
Lawrence
Compare Zip Codes
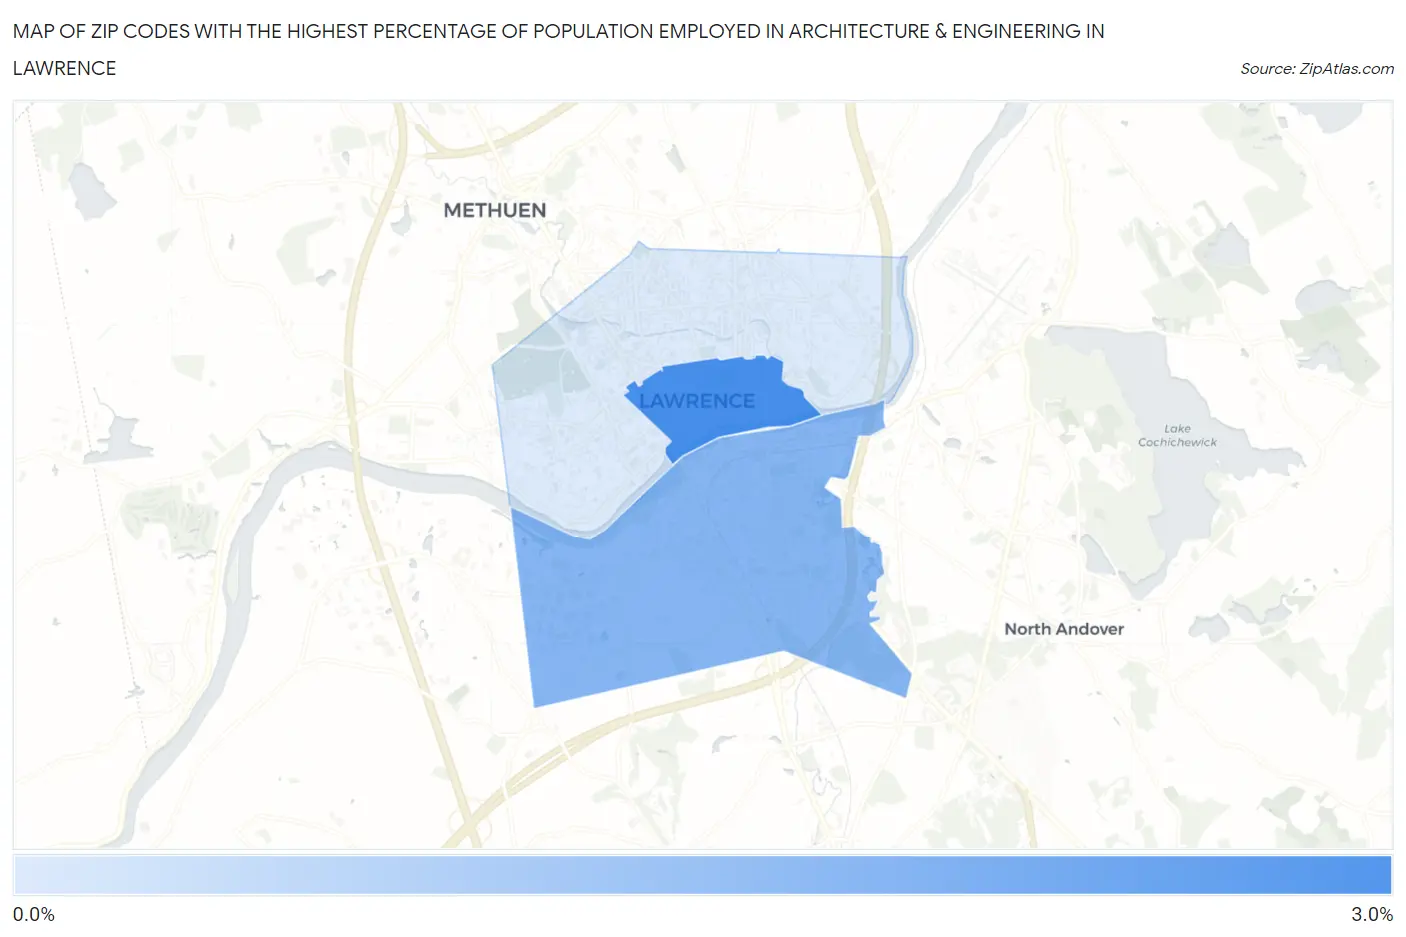
Map of Zip Codes with the Highest Percentage of Population Employed in Architecture & Engineering in Lawrence
0.39%
3.0%
Zip Codes with the Highest Percentage of Population Employed in Architecture & Engineering in Lawrence, MA
| Zip Code | % Employed | vs State | vs National | |
| 1. | 01840 | 3.0% | 2.7%(+0.300)#168 | 2.1%(+0.824)#5,145 |
| 2. | 01843 | 1.9% | 2.7%(-0.777)#306 | 2.1%(-0.253)#10,266 |
| 3. | 01841 | 0.39% | 2.7%(-2.28)#461 | 2.1%(-1.76)#21,037 |
1
Common Questions
What are the Top Zip Codes with the Highest Percentage of Population Employed in Architecture & Engineering in Lawrence, MA?
Top Zip Codes with the Highest Percentage of Population Employed in Architecture & Engineering in Lawrence, MA are:
What zip code has the Highest Percentage of Population Employed in Architecture & Engineering in Lawrence, MA?
01840 has the Highest Percentage of Population Employed in Architecture & Engineering in Lawrence, MA with 3.0%.
What is the Percentage of Population Employed in Architecture & Engineering in Lawrence, MA?
Percentage of Population Employed in Architecture & Engineering in Lawrence is 1.1%.
What is the Percentage of Population Employed in Architecture & Engineering in Massachusetts?
Percentage of Population Employed in Architecture & Engineering in Massachusetts is 2.7%.
What is the Percentage of Population Employed in Architecture & Engineering in the United States?
Percentage of Population Employed in Architecture & Engineering in the United States is 2.1%.