Zip Codes with the Highest Percentage of Population Employed in Architecture & Engineering in Lynn, MA
RELATED REPORTS & OPTIONS
Architecture & Engineering
Lynn
Compare Zip Codes
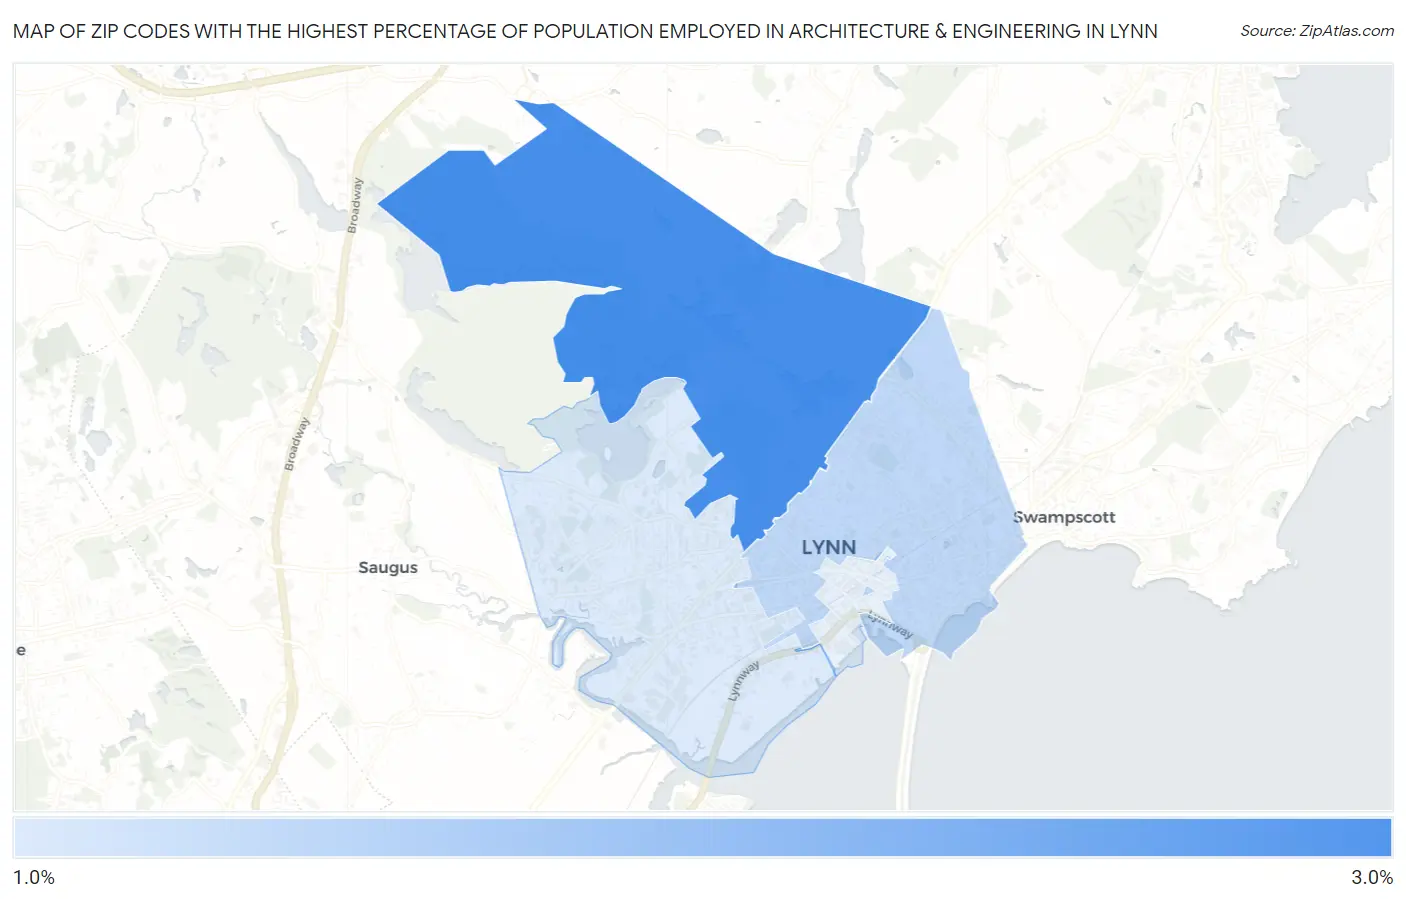
Map of Zip Codes with the Highest Percentage of Population Employed in Architecture & Engineering in Lynn
1.0%
2.6%
Zip Codes with the Highest Percentage of Population Employed in Architecture & Engineering in Lynn, MA
| Zip Code | % Employed | vs State | vs National | |
| 1. | 01904 | 2.6% | 2.7%(-0.106)#223 | 2.1%(+0.418)#6,714 |
| 2. | 01902 | 1.3% | 2.7%(-1.36)#390 | 2.1%(-0.834)#14,219 |
| 3. | 01905 | 1.0% | 2.7%(-1.66)#418 | 2.1%(-1.14)#16,537 |
1
Common Questions
What are the Top 3 Zip Codes with the Highest Percentage of Population Employed in Architecture & Engineering in Lynn, MA?
Top 3 Zip Codes with the Highest Percentage of Population Employed in Architecture & Engineering in Lynn, MA are:
What zip code has the Highest Percentage of Population Employed in Architecture & Engineering in Lynn, MA?
01904 has the Highest Percentage of Population Employed in Architecture & Engineering in Lynn, MA with 2.6%.
What is the Percentage of Population Employed in Architecture & Engineering in Lynn, MA?
Percentage of Population Employed in Architecture & Engineering in Lynn is 1.5%.
What is the Percentage of Population Employed in Architecture & Engineering in Massachusetts?
Percentage of Population Employed in Architecture & Engineering in Massachusetts is 2.7%.
What is the Percentage of Population Employed in Architecture & Engineering in the United States?
Percentage of Population Employed in Architecture & Engineering in the United States is 2.1%.