Norridge, IL Map & Demographics
Norridge Map
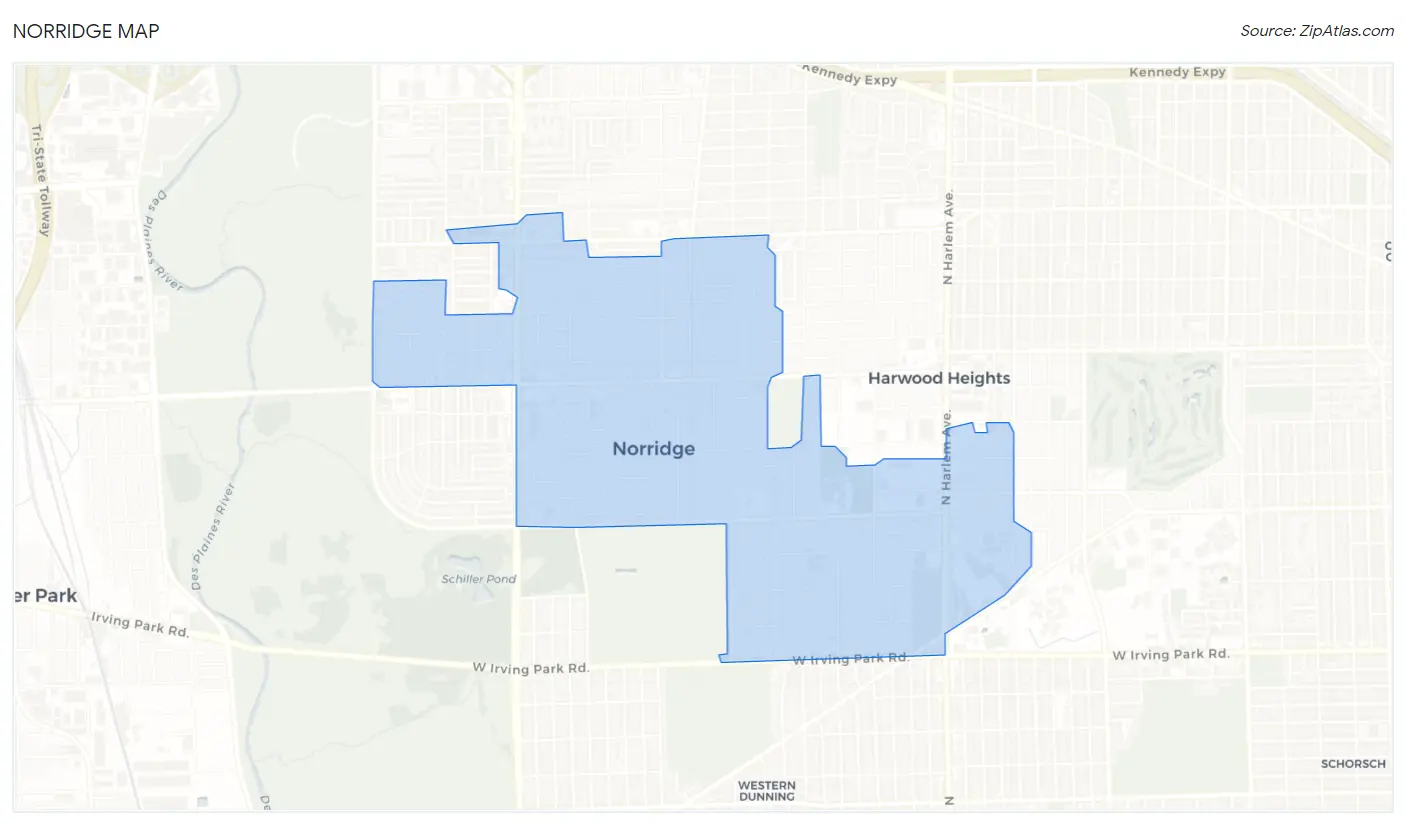
Norridge Overview
$45,038
PER CAPITA INCOME
$102,188
AVG FAMILY INCOME
$84,539
AVG HOUSEHOLD INCOME
23.5%
WAGE / INCOME GAP [ % ]
76.5¢/ $1
WAGE / INCOME GAP [ $ ]
0.45
INEQUALITY / GINI INDEX
15,291
TOTAL POPULATION
7,278
MALE POPULATION
8,013
FEMALE POPULATION
90.83
MALES / 100 FEMALES
110.10
FEMALES / 100 MALES
47.2
MEDIAN AGE
3.1
AVG FAMILY SIZE
2.5
AVG HOUSEHOLD SIZE
7,689
LABOR FORCE [ PEOPLE ]
60.1%
PERCENT IN LABOR FORCE
6.3%
UNEMPLOYMENT RATE
Income in Norridge
Income Overview in Norridge
Per Capita Income in Norridge is $45,038, while median incomes of families and households are $102,188 and $84,539 respectively.
| Characteristic | Number | Measure |
| Per Capita Income | 15,291 | $45,038 |
| Median Family Income | 3,969 | $102,188 |
| Mean Family Income | 3,969 | $133,355 |
| Median Household Income | 5,865 | $84,539 |
| Mean Household Income | 5,865 | $114,580 |
| Income Deficit | 3,969 | $0 |
| Wage / Income Gap (%) | 15,291 | 23.53% |
| Wage / Income Gap ($) | 15,291 | 76.47¢ per $1 |
| Gini / Inequality Index | 15,291 | 0.45 |
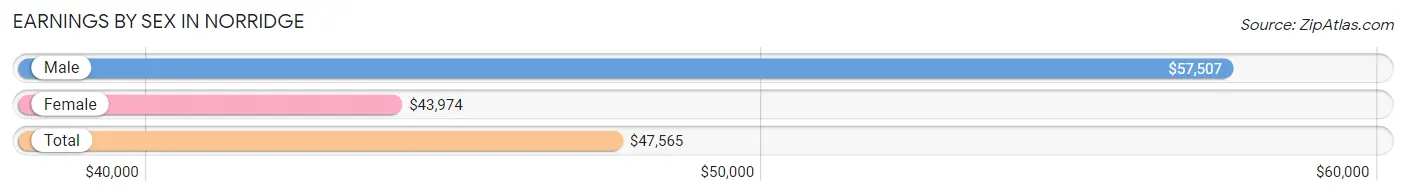
Earnings by Sex in Norridge
Average Earnings in Norridge are $47,565, $57,507 for men and $43,974 for women, a difference of 23.5%.
| Sex | Number | Average Earnings |
| Male | 4,255 (54.0%) | $57,507 |
| Female | 3,629 (46.0%) | $43,974 |
| Total | 7,884 (100.0%) | $47,565 |
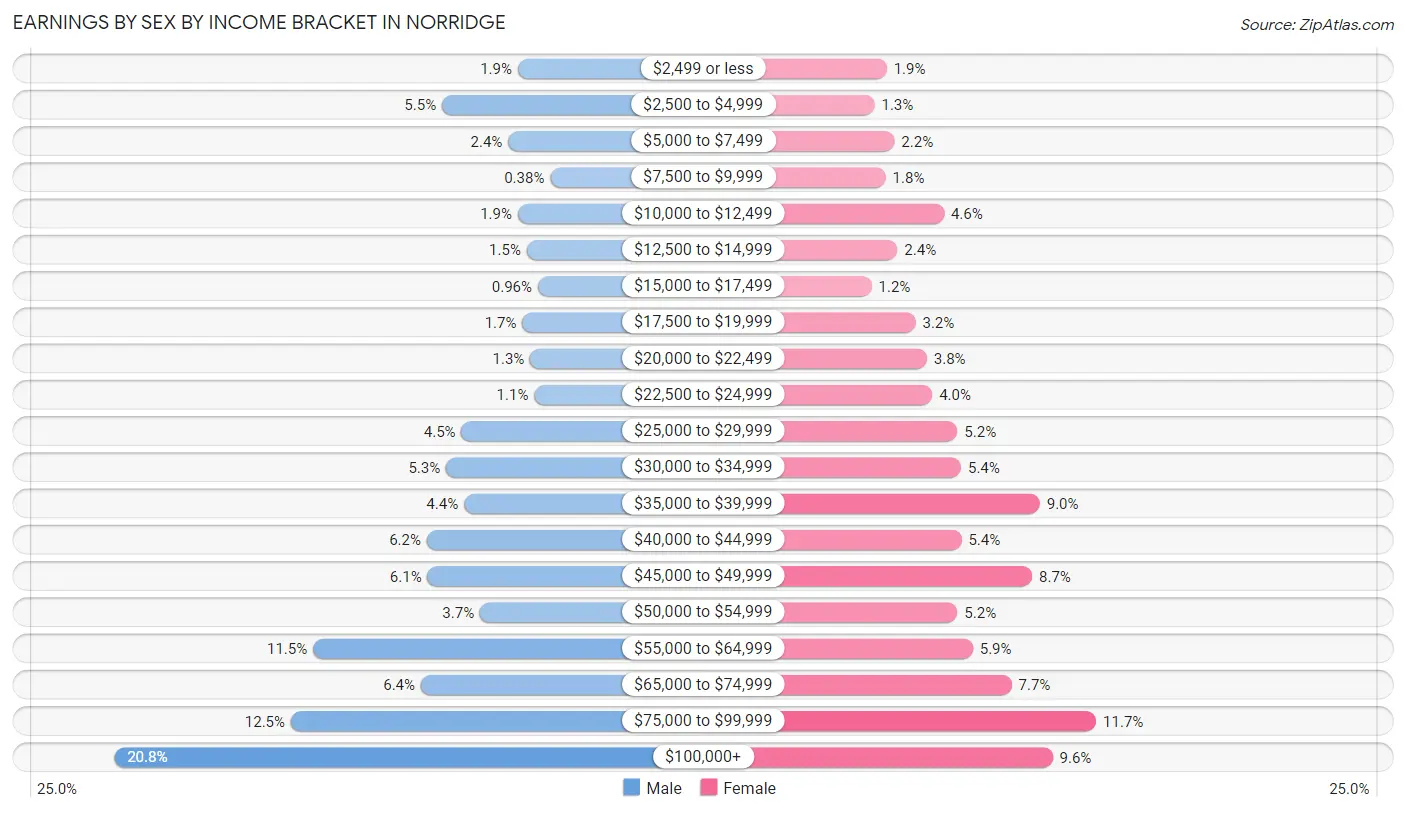
Earnings by Sex by Income Bracket in Norridge
The most common earnings brackets in Norridge are $100,000+ for men (885 | 20.8%) and $75,000 to $99,999 for women (424 | 11.7%).
| Income | Male | Female |
| $2,499 or less | 81 (1.9%) | 68 (1.9%) |
| $2,500 to $4,999 | 232 (5.4%) | 47 (1.3%) |
| $5,000 to $7,499 | 100 (2.4%) | 81 (2.2%) |
| $7,500 to $9,999 | 16 (0.4%) | 66 (1.8%) |
| $10,000 to $12,499 | 81 (1.9%) | 165 (4.5%) |
| $12,500 to $14,999 | 63 (1.5%) | 86 (2.4%) |
| $15,000 to $17,499 | 41 (1.0%) | 42 (1.2%) |
| $17,500 to $19,999 | 72 (1.7%) | 117 (3.2%) |
| $20,000 to $22,499 | 56 (1.3%) | 136 (3.7%) |
| $22,500 to $24,999 | 48 (1.1%) | 145 (4.0%) |
| $25,000 to $29,999 | 193 (4.5%) | 188 (5.2%) |
| $30,000 to $34,999 | 224 (5.3%) | 194 (5.3%) |
| $35,000 to $39,999 | 188 (4.4%) | 328 (9.0%) |
| $40,000 to $44,999 | 262 (6.2%) | 195 (5.4%) |
| $45,000 to $49,999 | 261 (6.1%) | 315 (8.7%) |
| $50,000 to $54,999 | 156 (3.7%) | 188 (5.2%) |
| $55,000 to $64,999 | 489 (11.5%) | 214 (5.9%) |
| $65,000 to $74,999 | 274 (6.4%) | 280 (7.7%) |
| $75,000 to $99,999 | 533 (12.5%) | 424 (11.7%) |
| $100,000+ | 885 (20.8%) | 350 (9.6%) |
| Total | 4,255 (100.0%) | 3,629 (100.0%) |
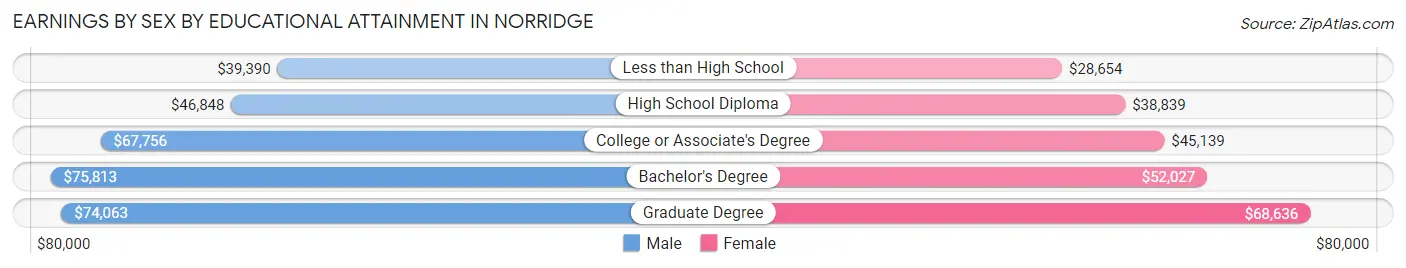
Earnings by Sex by Educational Attainment in Norridge
Average earnings in Norridge are $60,218 for men and $45,682 for women, a difference of 24.1%. Men with an educational attainment of bachelor's degree enjoy the highest average annual earnings of $75,813, while those with less than high school education earn the least with $39,390. Women with an educational attainment of graduate degree earn the most with the average annual earnings of $68,636, while those with less than high school education have the smallest earnings of $28,654.
| Educational Attainment | Male Income | Female Income |
| Less than High School | $39,390 | $28,654 |
| High School Diploma | $46,848 | $38,839 |
| College or Associate's Degree | $67,756 | $45,139 |
| Bachelor's Degree | $75,813 | $52,027 |
| Graduate Degree | $74,063 | $68,636 |
| Total | $60,218 | $45,682 |
Family Income in Norridge
Family Income Brackets in Norridge
According to the Norridge family income data, there are 893 families falling into the $100,000 to $149,999 income range, which is the most common income bracket and makes up 22.5% of all families. Conversely, the $10,000 to $14,999 income bracket is the least frequent group with only 28 families (0.7%) belonging to this category.
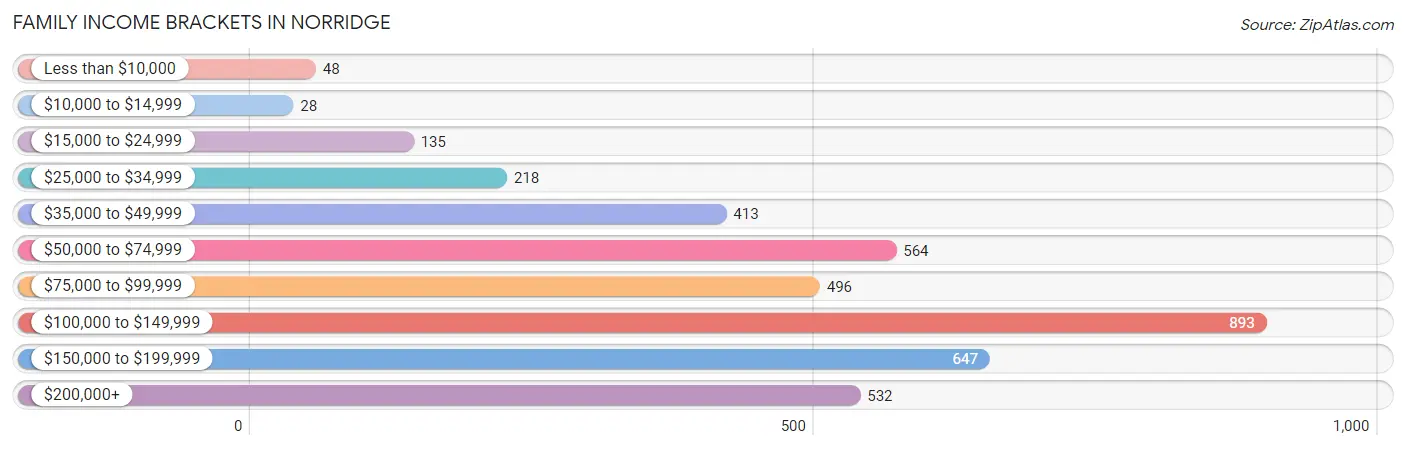
| Income Bracket | # Families | % Families |
| Less than $10,000 | 48 | 1.2% |
| $10,000 to $14,999 | 28 | 0.7% |
| $15,000 to $24,999 | 135 | 3.4% |
| $25,000 to $34,999 | 218 | 5.5% |
| $35,000 to $49,999 | 413 | 10.4% |
| $50,000 to $74,999 | 564 | 14.2% |
| $75,000 to $99,999 | 496 | 12.5% |
| $100,000 to $149,999 | 893 | 22.5% |
| $150,000 to $199,999 | 647 | 16.3% |
| $200,000+ | 532 | 13.4% |
Family Income by Famaliy Size in Norridge
7+ person families (77 | 1.9%) account for the highest median family income in Norridge with $225,260 per family, while 2-person families (1,848 | 46.6%) have the highest median income of $44,302 per family member.
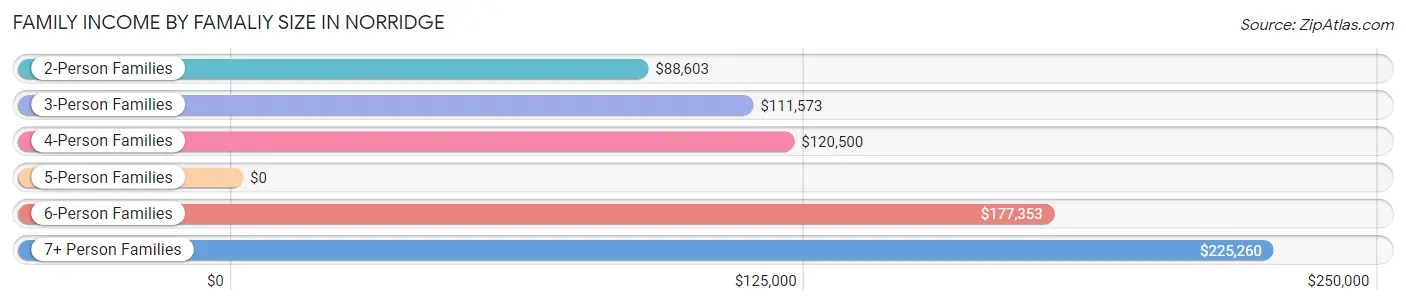
| Income Bracket | # Families | Median Income |
| 2-Person Families | 1,848 (46.6%) | $88,603 |
| 3-Person Families | 899 (22.7%) | $111,573 |
| 4-Person Families | 780 (19.7%) | $120,500 |
| 5-Person Families | 237 (6.0%) | $0 |
| 6-Person Families | 128 (3.2%) | $177,353 |
| 7+ Person Families | 77 (1.9%) | $225,260 |
| Total | 3,969 (100.0%) | $102,188 |
Family Income by Number of Earners in Norridge
The median family income in Norridge is $102,188, with families comprising 3+ earners (673) having the highest median family income of $181,660, while families with no earners (651) have the lowest median family income of $53,787, accounting for 17.0% and 16.4% of families, respectively.
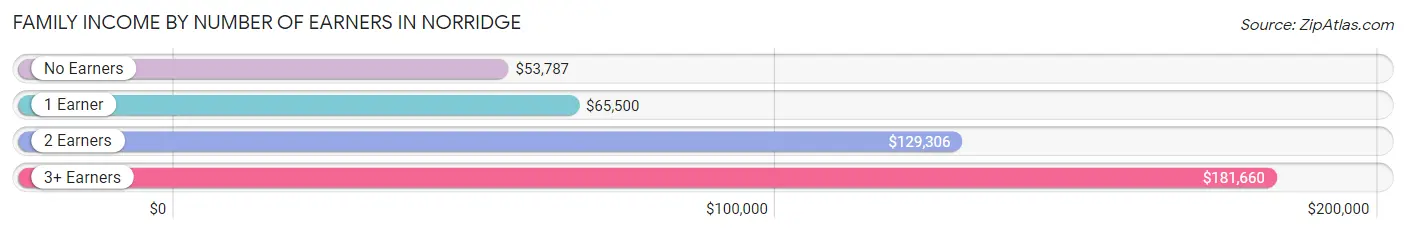
| Number of Earners | # Families | Median Income |
| No Earners | 651 (16.4%) | $53,787 |
| 1 Earner | 1,372 (34.6%) | $65,500 |
| 2 Earners | 1,273 (32.1%) | $129,306 |
| 3+ Earners | 673 (17.0%) | $181,660 |
| Total | 3,969 (100.0%) | $102,188 |
Household Income in Norridge
Household Income Brackets in Norridge
With 1,079 households falling in the category, the $100,000 to $149,999 income range is the most frequent in Norridge, accounting for 18.4% of all households. In contrast, only 70 households (1.2%) fall into the $10,000 to $14,999 income bracket, making it the least populous group.
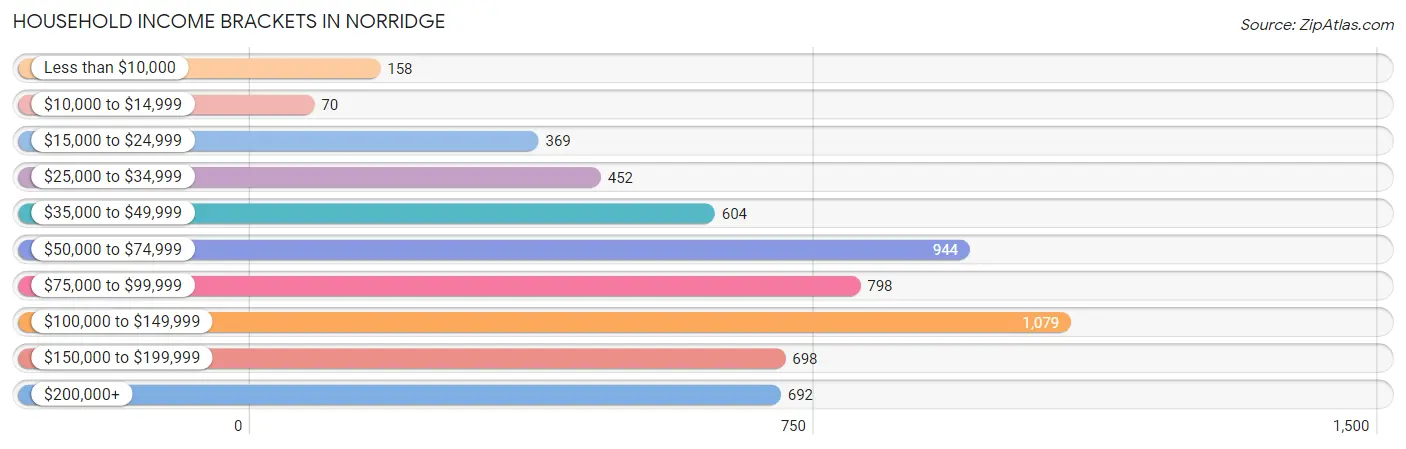
| Income Bracket | # Households | % Households |
| Less than $10,000 | 158 | 2.7% |
| $10,000 to $14,999 | 70 | 1.2% |
| $15,000 to $24,999 | 369 | 6.3% |
| $25,000 to $34,999 | 452 | 7.7% |
| $35,000 to $49,999 | 604 | 10.3% |
| $50,000 to $74,999 | 944 | 16.1% |
| $75,000 to $99,999 | 798 | 13.6% |
| $100,000 to $149,999 | 1,079 | 18.4% |
| $150,000 to $199,999 | 698 | 11.9% |
| $200,000+ | 692 | 11.8% |
Household Income by Householder Age in Norridge
The median household income in Norridge is $84,539, with the highest median household income of $113,196 found in the 45 to 64 years age bracket for the primary householder. A total of 2,429 households (41.4%) fall into this category. Meanwhile, the 15 to 24 years age bracket for the primary householder has the lowest median household income of $0, with 9 households (0.2%) in this group.
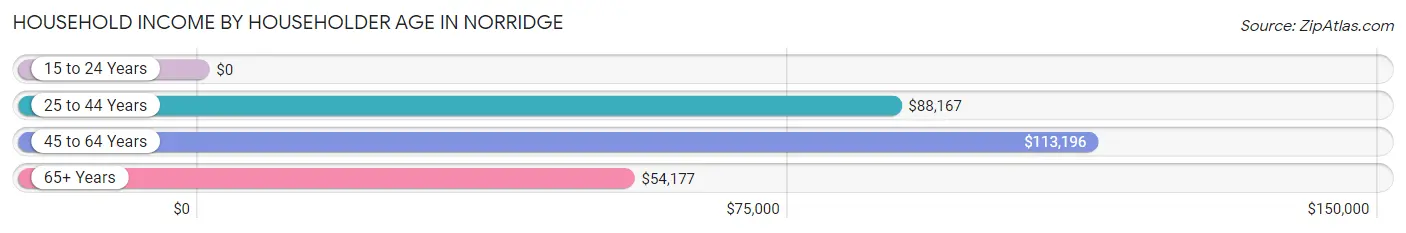
| Income Bracket | # Households | Median Income |
| 15 to 24 Years | 9 (0.2%) | $0 |
| 25 to 44 Years | 1,480 (25.2%) | $88,167 |
| 45 to 64 Years | 2,429 (41.4%) | $113,196 |
| 65+ Years | 1,947 (33.2%) | $54,177 |
| Total | 5,865 (100.0%) | $84,539 |
Poverty in Norridge
Income Below Poverty by Sex and Age in Norridge
With 2.9% poverty level for males and 4.5% for females among the residents of Norridge, 16 and 17 year old males and under 5 year old females are the most vulnerable to poverty, with 17 males (14.5%) and 38 females (11.8%) in their respective age groups living below the poverty level.
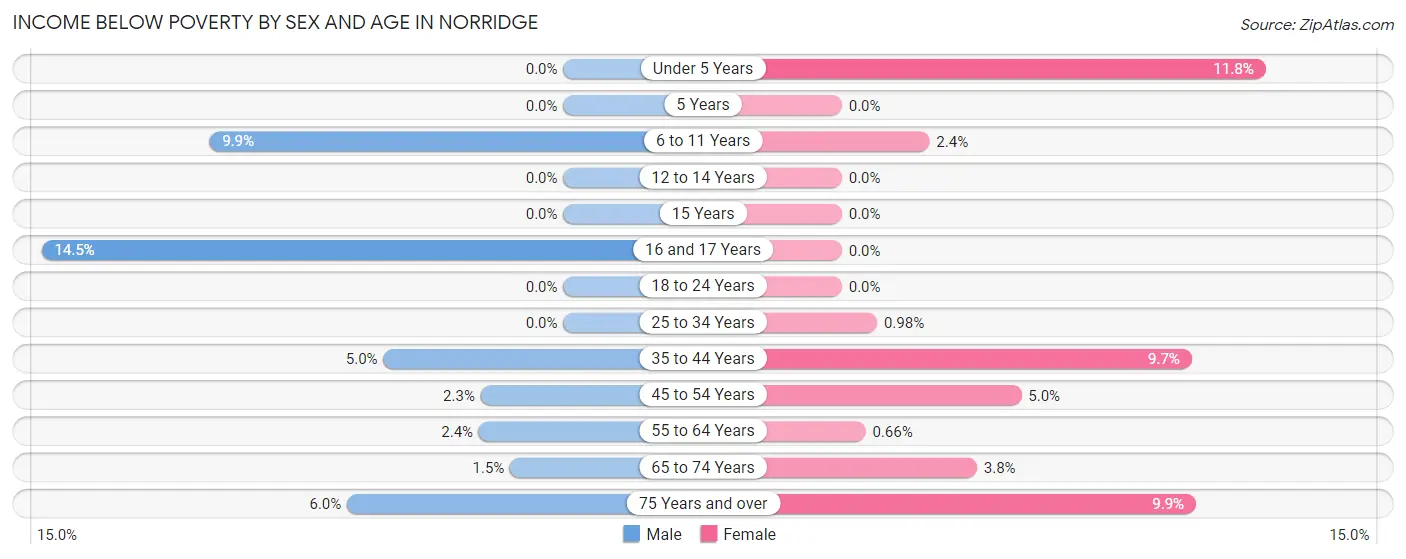
| Age Bracket | Male | Female |
| Under 5 Years | 0 (0.0%) | 38 (11.8%) |
| 5 Years | 0 (0.0%) | 0 (0.0%) |
| 6 to 11 Years | 34 (9.9%) | 18 (2.4%) |
| 12 to 14 Years | 0 (0.0%) | 0 (0.0%) |
| 15 Years | 0 (0.0%) | 0 (0.0%) |
| 16 and 17 Years | 17 (14.5%) | 0 (0.0%) |
| 18 to 24 Years | 0 (0.0%) | 0 (0.0%) |
| 25 to 34 Years | 0 (0.0%) | 9 (1.0%) |
| 35 to 44 Years | 50 (5.0%) | 89 (9.7%) |
| 45 to 54 Years | 21 (2.3%) | 51 (5.0%) |
| 55 to 64 Years | 32 (2.4%) | 7 (0.7%) |
| 65 to 74 Years | 10 (1.5%) | 32 (3.8%) |
| 75 Years and over | 44 (6.0%) | 105 (9.9%) |
| Total | 208 (2.9%) | 349 (4.5%) |
Income Above Poverty by Sex and Age in Norridge
According to the poverty statistics in Norridge, males aged under 5 years and females aged 5 years are the age groups that are most secure financially, with 100.0% of males and 100.0% of females in these age groups living above the poverty line.
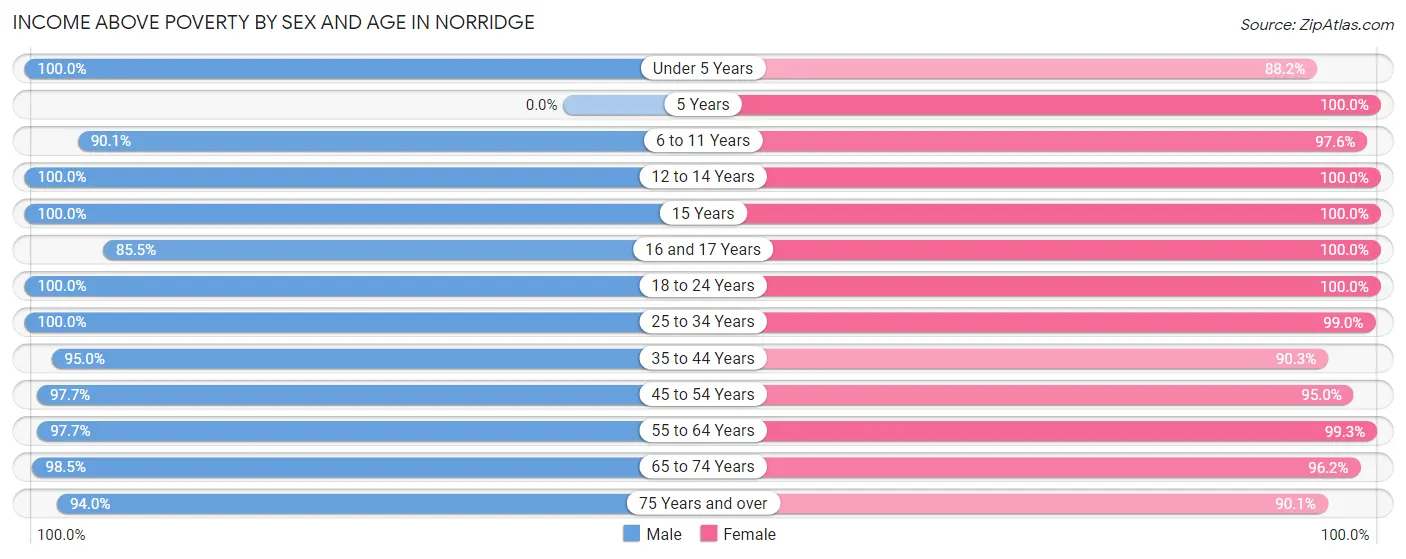
| Age Bracket | Male | Female |
| Under 5 Years | 360 (100.0%) | 284 (88.2%) |
| 5 Years | 0 (0.0%) | 86 (100.0%) |
| 6 to 11 Years | 311 (90.1%) | 719 (97.6%) |
| 12 to 14 Years | 337 (100.0%) | 177 (100.0%) |
| 15 Years | 81 (100.0%) | 17 (100.0%) |
| 16 and 17 Years | 100 (85.5%) | 135 (100.0%) |
| 18 to 24 Years | 499 (100.0%) | 404 (100.0%) |
| 25 to 34 Years | 702 (100.0%) | 907 (99.0%) |
| 35 to 44 Years | 948 (95.0%) | 825 (90.3%) |
| 45 to 54 Years | 891 (97.7%) | 969 (95.0%) |
| 55 to 64 Years | 1,330 (97.7%) | 1,049 (99.3%) |
| 65 to 74 Years | 667 (98.5%) | 820 (96.2%) |
| 75 Years and over | 687 (94.0%) | 960 (90.1%) |
| Total | 6,913 (97.1%) | 7,352 (95.5%) |
Income Below Poverty Among Married-Couple Families in Norridge
The poverty statistics for married-couple families in Norridge show that 2.5% or 75 of the total 2,990 families live below the poverty line. Families with 3 or 4 children have the highest poverty rate of 10.8%, comprising of 17 families. On the other hand, families with no children have the lowest poverty rate of 1.3%, which includes 26 families.
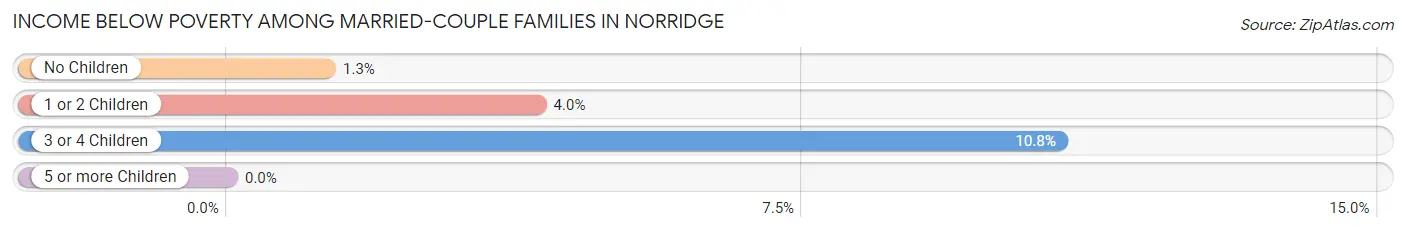
| Children | Above Poverty | Below Poverty |
| No Children | 2,012 (98.7%) | 26 (1.3%) |
| 1 or 2 Children | 763 (96.0%) | 32 (4.0%) |
| 3 or 4 Children | 140 (89.2%) | 17 (10.8%) |
| 5 or more Children | 0 (0.0%) | 0 (0.0%) |
| Total | 2,915 (97.5%) | 75 (2.5%) |
Income Below Poverty Among Single-Parent Households in Norridge
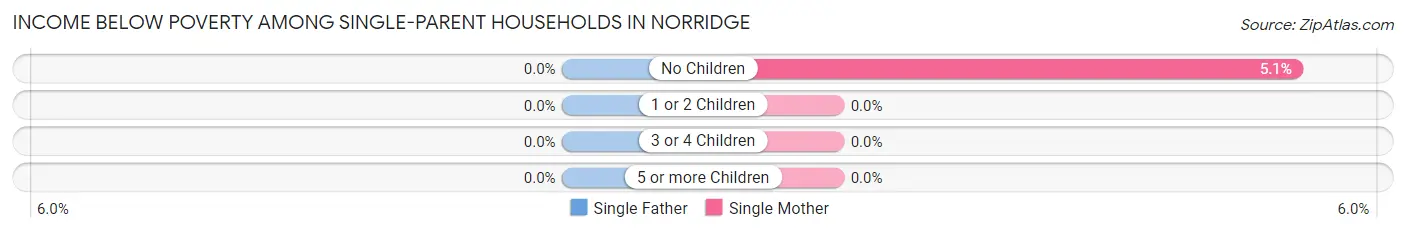
| Children | Single Father | Single Mother |
| No Children | 0 (0.0%) | 16 (5.1%) |
| 1 or 2 Children | 0 (0.0%) | 0 (0.0%) |
| 3 or 4 Children | 0 (0.0%) | 0 (0.0%) |
| 5 or more Children | 0 (0.0%) | 0 (0.0%) |
| Total | 0 (0.0%) | 16 (2.5%) |
Income Below Poverty Among Married-Couple vs Single-Parent Households in Norridge
The poverty data for Norridge shows that 75 of the married-couple family households (2.5%) and 16 of the single-parent households (1.6%) are living below the poverty level. Within the married-couple family households, those with 3 or 4 children have the highest poverty rate, with 17 households (10.8%) falling below the poverty line. Among the single-parent households, those with no children have the highest poverty rate, with 16 household (3.1%) living below poverty.
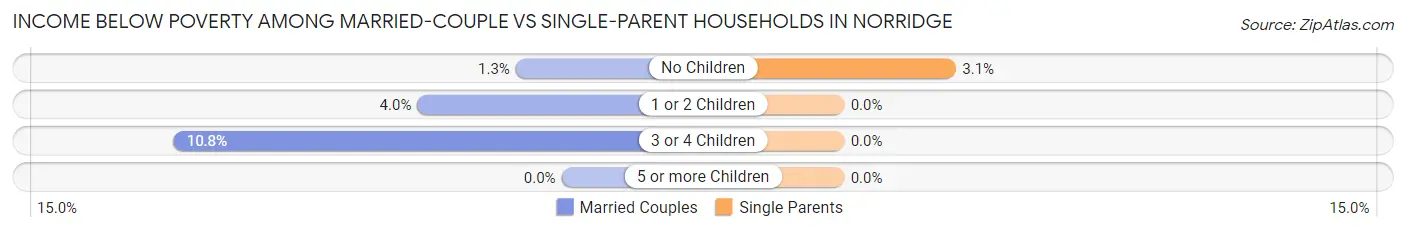
| Children | Married-Couple Families | Single-Parent Households |
| No Children | 26 (1.3%) | 16 (3.1%) |
| 1 or 2 Children | 32 (4.0%) | 0 (0.0%) |
| 3 or 4 Children | 17 (10.8%) | 0 (0.0%) |
| 5 or more Children | 0 (0.0%) | 0 (0.0%) |
| Total | 75 (2.5%) | 16 (1.6%) |
Race in Norridge
The most populous races in Norridge are White / Caucasian (12,717 | 83.2%), Hispanic or Latino (1,888 | 12.3%), and Some other Race (899 | 5.9%).
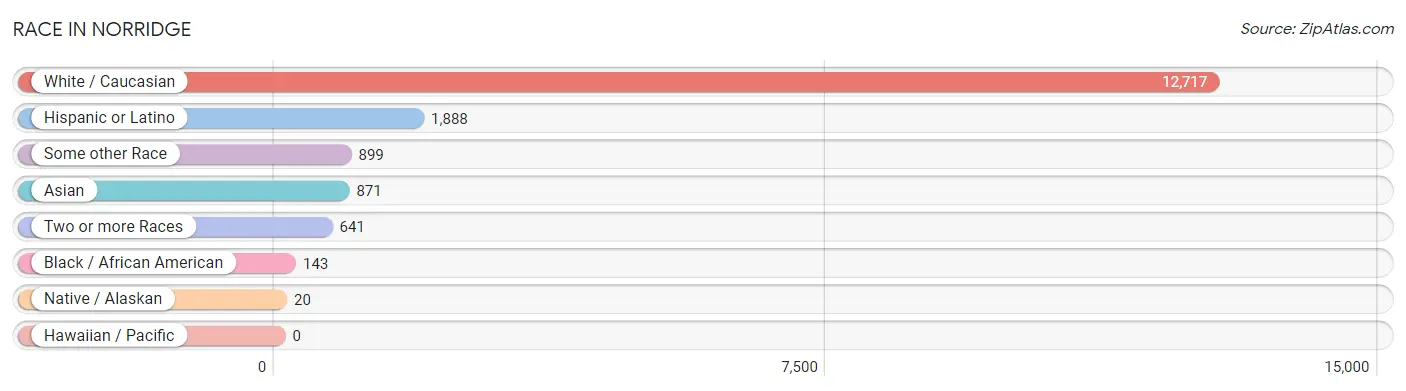
| Race | # Population | % Population |
| Asian | 871 | 5.7% |
| Black / African American | 143 | 0.9% |
| Hawaiian / Pacific | 0 | 0.0% |
| Hispanic or Latino | 1,888 | 12.3% |
| Native / Alaskan | 20 | 0.1% |
| White / Caucasian | 12,717 | 83.2% |
| Two or more Races | 641 | 4.2% |
| Some other Race | 899 | 5.9% |
| Total | 15,291 | 100.0% |
Ancestry in Norridge
The most populous ancestries reported in Norridge are Polish (3,880 | 25.4%), Italian (1,994 | 13.0%), Irish (1,263 | 8.3%), German (1,255 | 8.2%), and Mexican (971 | 6.4%), together accounting for 61.2% of all Norridge residents.
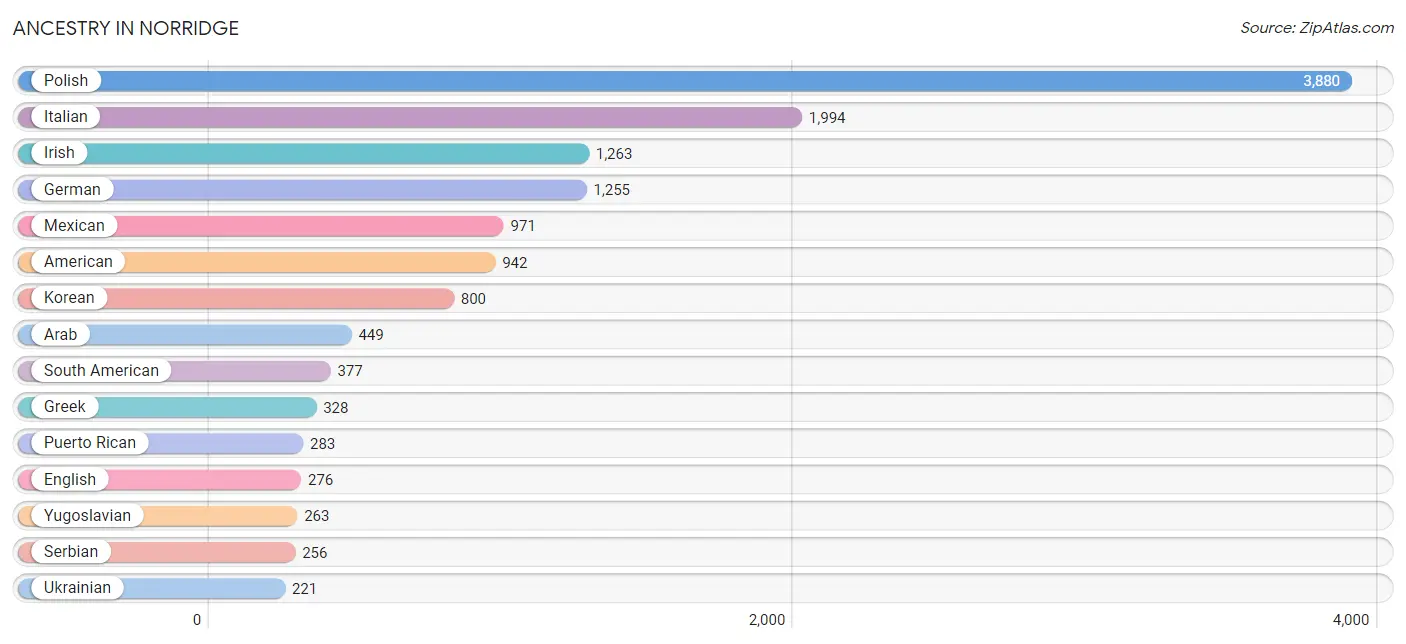
| Ancestry | # Population | % Population |
| Albanian | 21 | 0.1% |
| American | 942 | 6.2% |
| Arab | 449 | 2.9% |
| Argentinean | 116 | 0.8% |
| Assyrian / Chaldean / Syriac | 22 | 0.1% |
| Austrian | 61 | 0.4% |
| Belgian | 9 | 0.1% |
| Bhutanese | 16 | 0.1% |
| British | 22 | 0.1% |
| Canadian | 10 | 0.1% |
| Central American | 124 | 0.8% |
| Cherokee | 67 | 0.4% |
| Colombian | 70 | 0.5% |
| Croatian | 29 | 0.2% |
| Cuban | 1 | 0.0% |
| Czech | 95 | 0.6% |
| Czechoslovakian | 10 | 0.1% |
| Dutch | 141 | 0.9% |
| Ecuadorian | 102 | 0.7% |
| English | 276 | 1.8% |
| European | 16 | 0.1% |
| French | 118 | 0.8% |
| French Canadian | 20 | 0.1% |
| German | 1,255 | 8.2% |
| Greek | 328 | 2.1% |
| Guatemalan | 124 | 0.8% |
| Hungarian | 30 | 0.2% |
| Indian (Asian) | 31 | 0.2% |
| Iraqi | 10 | 0.1% |
| Irish | 1,263 | 8.3% |
| Italian | 1,994 | 13.0% |
| Korean | 800 | 5.2% |
| Lithuanian | 37 | 0.2% |
| Macedonian | 20 | 0.1% |
| Menominee | 8 | 0.1% |
| Mexican | 971 | 6.4% |
| Mexican American Indian | 11 | 0.1% |
| Norwegian | 164 | 1.1% |
| Palestinian | 71 | 0.5% |
| Polish | 3,880 | 25.4% |
| Puerto Rican | 283 | 1.8% |
| Romanian | 98 | 0.6% |
| Russian | 9 | 0.1% |
| Scandinavian | 32 | 0.2% |
| Scotch-Irish | 4 | 0.0% |
| Scottish | 67 | 0.4% |
| Serbian | 256 | 1.7% |
| Slovak | 46 | 0.3% |
| South American | 377 | 2.5% |
| Spaniard | 13 | 0.1% |
| Sri Lankan | 40 | 0.3% |
| Swedish | 109 | 0.7% |
| Swiss | 9 | 0.1% |
| Syrian | 175 | 1.1% |
| Thai | 112 | 0.7% |
| Ukrainian | 221 | 1.5% |
| Venezuelan | 7 | 0.1% |
| Yugoslavian | 263 | 1.7% | View All 58 Rows |
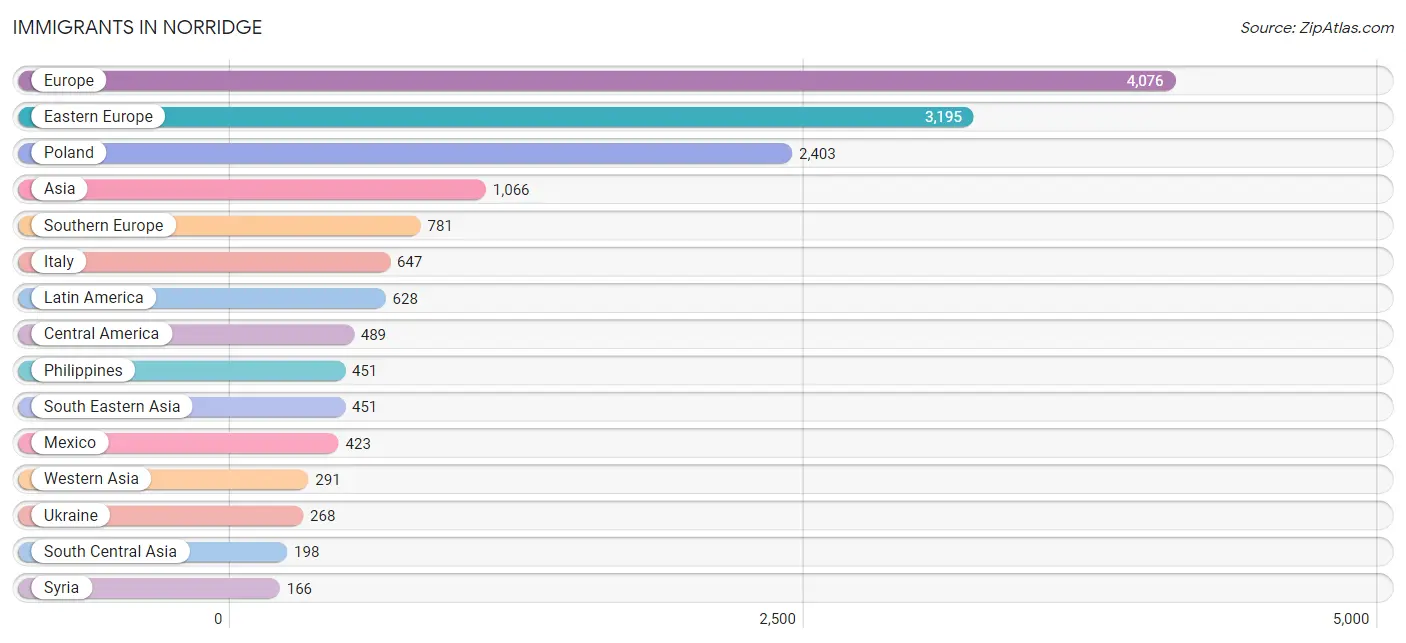
Immigrants in Norridge
The most numerous immigrant groups reported in Norridge came from Europe (4,076 | 26.7%), Eastern Europe (3,195 | 20.9%), Poland (2,403 | 15.7%), Asia (1,066 | 7.0%), and Southern Europe (781 | 5.1%), together accounting for 75.4% of all Norridge residents.
| Immigration Origin | # Population | % Population |
| Albania | 32 | 0.2% |
| Argentina | 37 | 0.2% |
| Asia | 1,066 | 7.0% |
| Austria | 24 | 0.2% |
| Bosnia and Herzegovina | 157 | 1.0% |
| Canada | 24 | 0.2% |
| Caribbean | 12 | 0.1% |
| Central America | 489 | 3.2% |
| China | 20 | 0.1% |
| Croatia | 6 | 0.0% |
| Cuba | 12 | 0.1% |
| Czechoslovakia | 51 | 0.3% |
| Eastern Asia | 20 | 0.1% |
| Eastern Europe | 3,195 | 20.9% |
| Ecuador | 90 | 0.6% |
| Europe | 4,076 | 26.7% |
| Germany | 37 | 0.2% |
| Greece | 134 | 0.9% |
| Guatemala | 66 | 0.4% |
| India | 118 | 0.8% |
| Iraq | 26 | 0.2% |
| Ireland | 22 | 0.1% |
| Italy | 647 | 4.2% |
| Jordan | 56 | 0.4% |
| Latin America | 628 | 4.1% |
| Mexico | 423 | 2.8% |
| Netherlands | 17 | 0.1% |
| Northern Europe | 22 | 0.1% |
| Oceania | 15 | 0.1% |
| Philippines | 451 | 2.9% |
| Poland | 2,403 | 15.7% |
| Romania | 62 | 0.4% |
| Saudi Arabia | 29 | 0.2% |
| Serbia | 123 | 0.8% |
| South America | 127 | 0.8% |
| South Central Asia | 198 | 1.3% |
| South Eastern Asia | 451 | 2.9% |
| Southern Europe | 781 | 5.1% |
| Syria | 166 | 1.1% |
| Taiwan | 19 | 0.1% |
| Turkey | 14 | 0.1% |
| Ukraine | 268 | 1.8% |
| Uzbekistan | 80 | 0.5% |
| Western Asia | 291 | 1.9% |
| Western Europe | 78 | 0.5% | View All 45 Rows |
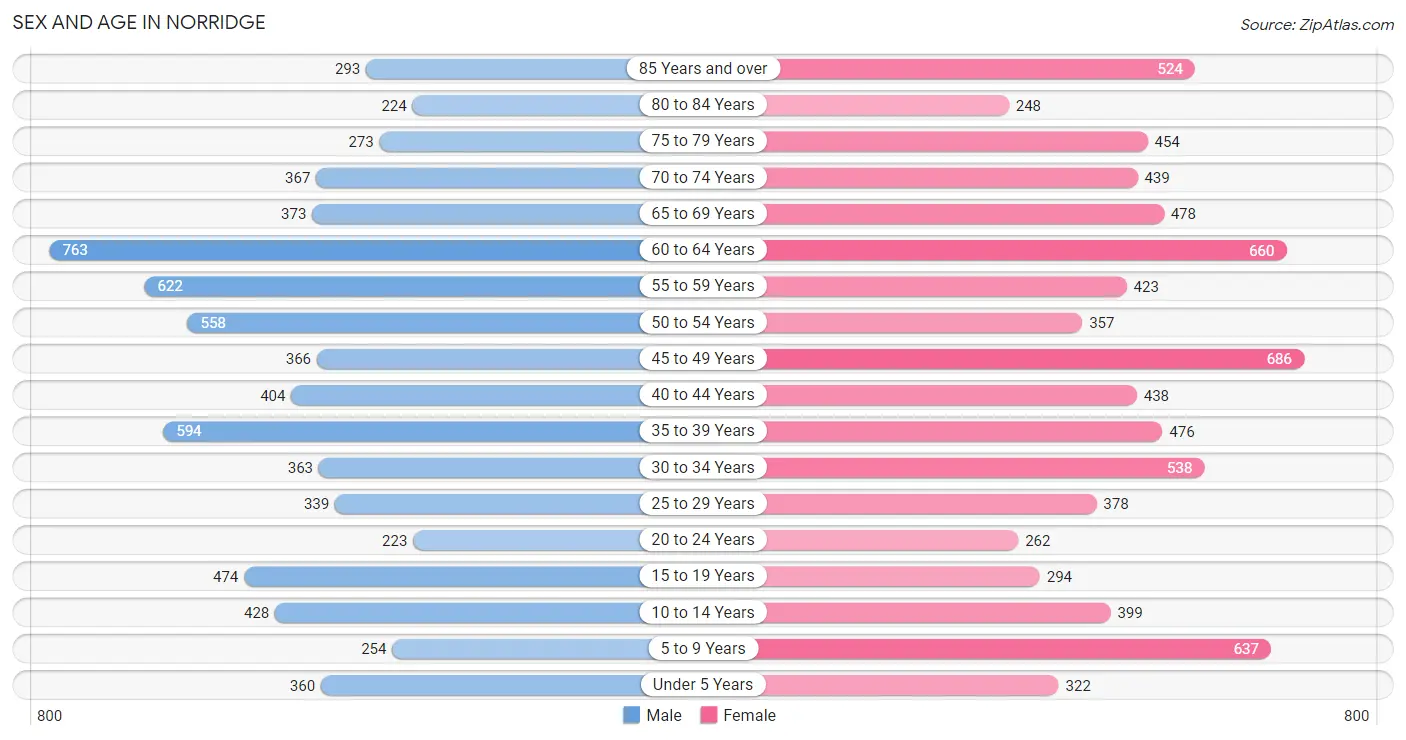
Sex and Age in Norridge
Sex and Age in Norridge
The most populous age groups in Norridge are 60 to 64 Years (763 | 10.5%) for men and 45 to 49 Years (686 | 8.6%) for women.
| Age Bracket | Male | Female |
| Under 5 Years | 360 (5.0%) | 322 (4.0%) |
| 5 to 9 Years | 254 (3.5%) | 637 (8.0%) |
| 10 to 14 Years | 428 (5.9%) | 399 (5.0%) |
| 15 to 19 Years | 474 (6.5%) | 294 (3.7%) |
| 20 to 24 Years | 223 (3.1%) | 262 (3.3%) |
| 25 to 29 Years | 339 (4.7%) | 378 (4.7%) |
| 30 to 34 Years | 363 (5.0%) | 538 (6.7%) |
| 35 to 39 Years | 594 (8.2%) | 476 (5.9%) |
| 40 to 44 Years | 404 (5.6%) | 438 (5.5%) |
| 45 to 49 Years | 366 (5.0%) | 686 (8.6%) |
| 50 to 54 Years | 558 (7.7%) | 357 (4.5%) |
| 55 to 59 Years | 622 (8.6%) | 423 (5.3%) |
| 60 to 64 Years | 763 (10.5%) | 660 (8.2%) |
| 65 to 69 Years | 373 (5.1%) | 478 (6.0%) |
| 70 to 74 Years | 367 (5.0%) | 439 (5.5%) |
| 75 to 79 Years | 273 (3.7%) | 454 (5.7%) |
| 80 to 84 Years | 224 (3.1%) | 248 (3.1%) |
| 85 Years and over | 293 (4.0%) | 524 (6.5%) |
| Total | 7,278 (100.0%) | 8,013 (100.0%) |
Families and Households in Norridge
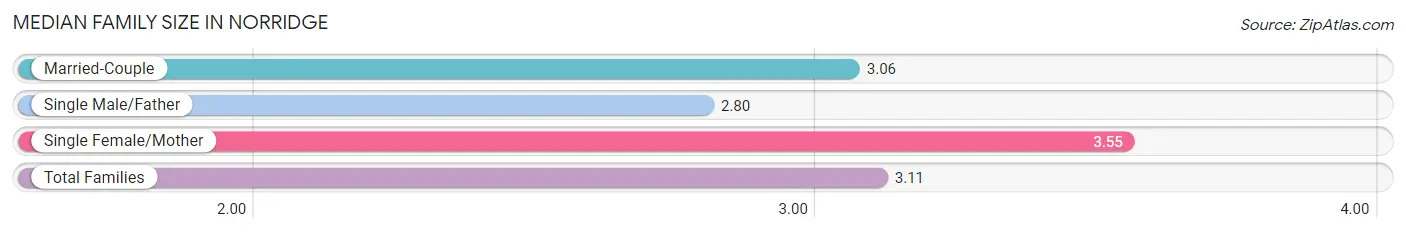
Median Family Size in Norridge
The median family size in Norridge is 3.11 persons per family, with single female/mother families (631 | 15.9%) accounting for the largest median family size of 3.55 persons per family. On the other hand, single male/father families (348 | 8.8%) represent the smallest median family size with 2.80 persons per family.
| Family Type | # Families | Family Size |
| Married-Couple | 2,990 (75.3%) | 3.06 |
| Single Male/Father | 348 (8.8%) | 2.80 |
| Single Female/Mother | 631 (15.9%) | 3.55 |
| Total Families | 3,969 (100.0%) | 3.11 |
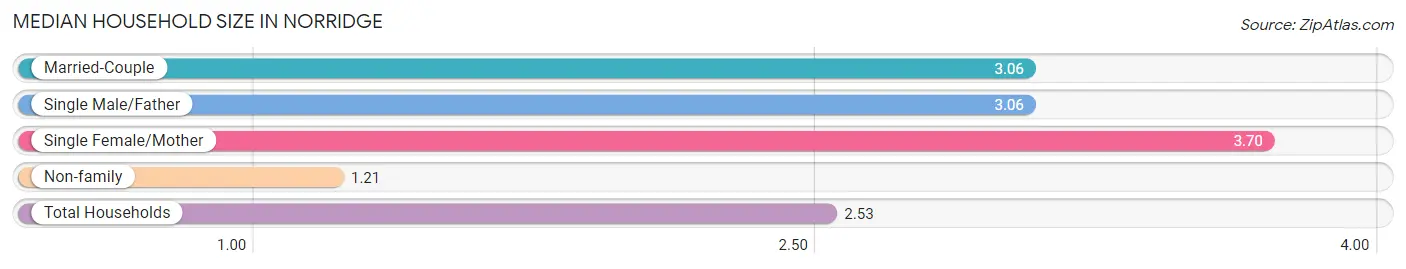
Median Household Size in Norridge
The median household size in Norridge is 2.53 persons per household, with single female/mother households (631 | 10.8%) accounting for the largest median household size of 3.7 persons per household. non-family households (1,896 | 32.3%) represent the smallest median household size with 1.21 persons per household.
| Household Type | # Households | Household Size |
| Married-Couple | 2,990 (51.0%) | 3.06 |
| Single Male/Father | 348 (5.9%) | 3.06 |
| Single Female/Mother | 631 (10.8%) | 3.70 |
| Non-family | 1,896 (32.3%) | 1.21 |
| Total Households | 5,865 (100.0%) | 2.53 |
Household Size by Marriage Status in Norridge
Out of a total of 5,865 households in Norridge, 3,969 (67.7%) are family households, while 1,896 (32.3%) are nonfamily households. The most numerous type of family households are 2-person households, comprising 1,753, and the most common type of nonfamily households are 1-person households, comprising 1,591.
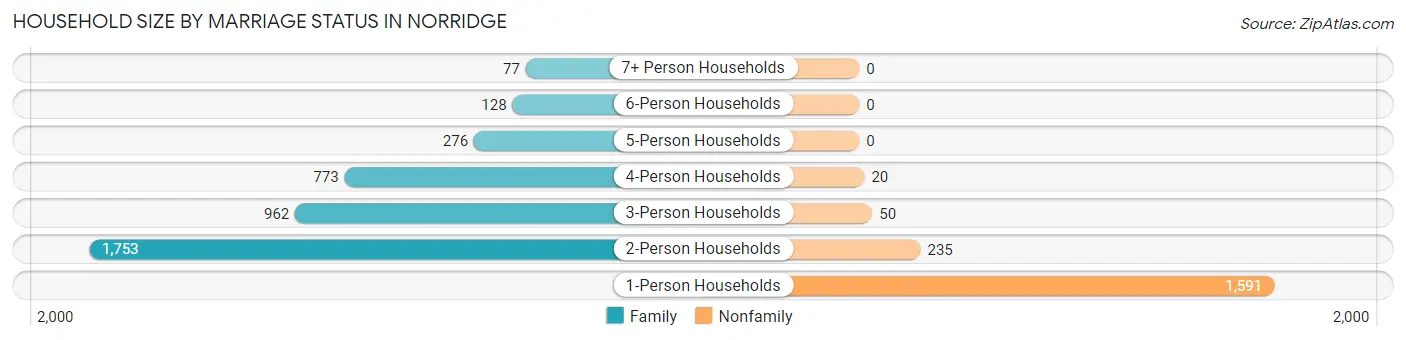
| Household Size | Family Households | Nonfamily Households |
| 1-Person Households | - | 1,591 (27.1%) |
| 2-Person Households | 1,753 (29.9%) | 235 (4.0%) |
| 3-Person Households | 962 (16.4%) | 50 (0.9%) |
| 4-Person Households | 773 (13.2%) | 20 (0.3%) |
| 5-Person Households | 276 (4.7%) | 0 (0.0%) |
| 6-Person Households | 128 (2.2%) | 0 (0.0%) |
| 7+ Person Households | 77 (1.3%) | 0 (0.0%) |
| Total | 3,969 (67.7%) | 1,896 (32.3%) |
Female Fertility in Norridge
Fertility by Age in Norridge
Average fertility rate in Norridge is 35.0 births per 1,000 women. Women in the age bracket of 20 to 34 years have the highest fertility rate with 47.0 births per 1,000 women. Women in the age bracket of 20 to 34 years acount for 50.0% of all women with births.
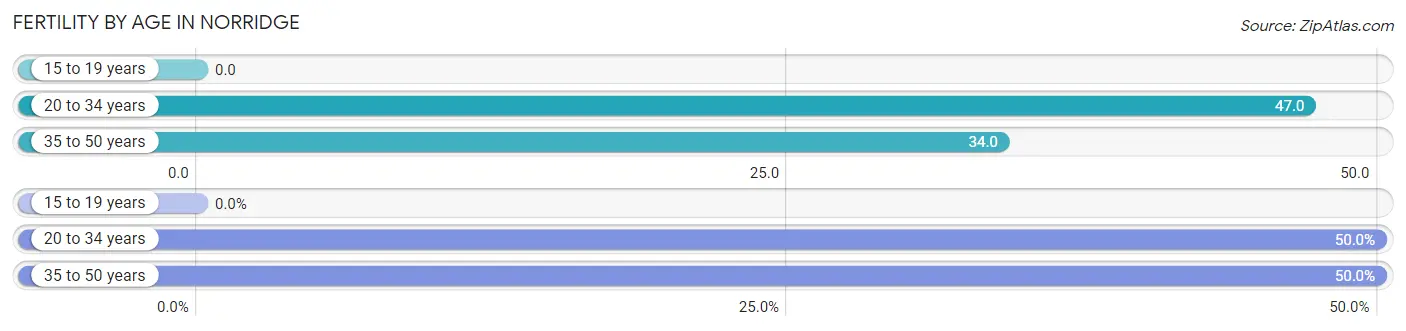
| Age Bracket | Women with Births | Births / 1,000 Women |
| 15 to 19 years | 0 (0.0%) | 0.0 |
| 20 to 34 years | 55 (50.0%) | 47.0 |
| 35 to 50 years | 55 (50.0%) | 34.0 |
| Total | 110 (100.0%) | 35.0 |
Fertility by Age by Marriage Status in Norridge
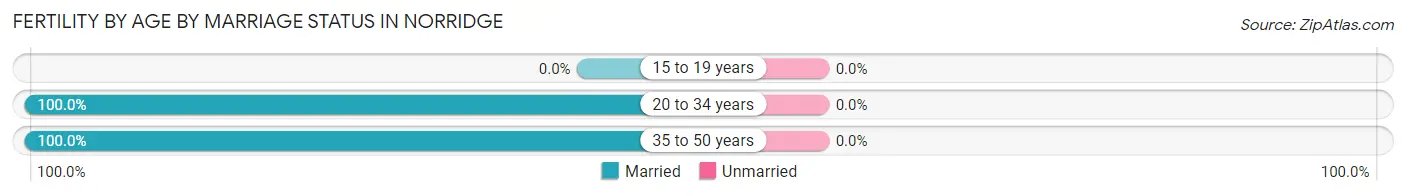
| Age Bracket | Married | Unmarried |
| 15 to 19 years | 0 (0.0%) | 0 (0.0%) |
| 20 to 34 years | 55 (100.0%) | 0 (0.0%) |
| 35 to 50 years | 55 (100.0%) | 0 (0.0%) |
| Total | 110 (100.0%) | 0 (0.0%) |
Fertility by Education in Norridge
Average fertility rate in Norridge is 35.0 births per 1,000 women. Women with the education attainment of bachelor's degree have the highest fertility rate of 66.0 births per 1,000 women, while women with the education attainment of college or associate's degree have the lowest fertility at 15.0 births per 1,000 women. Women with the education attainment of bachelor's degree represent 47.3% of all women with births.
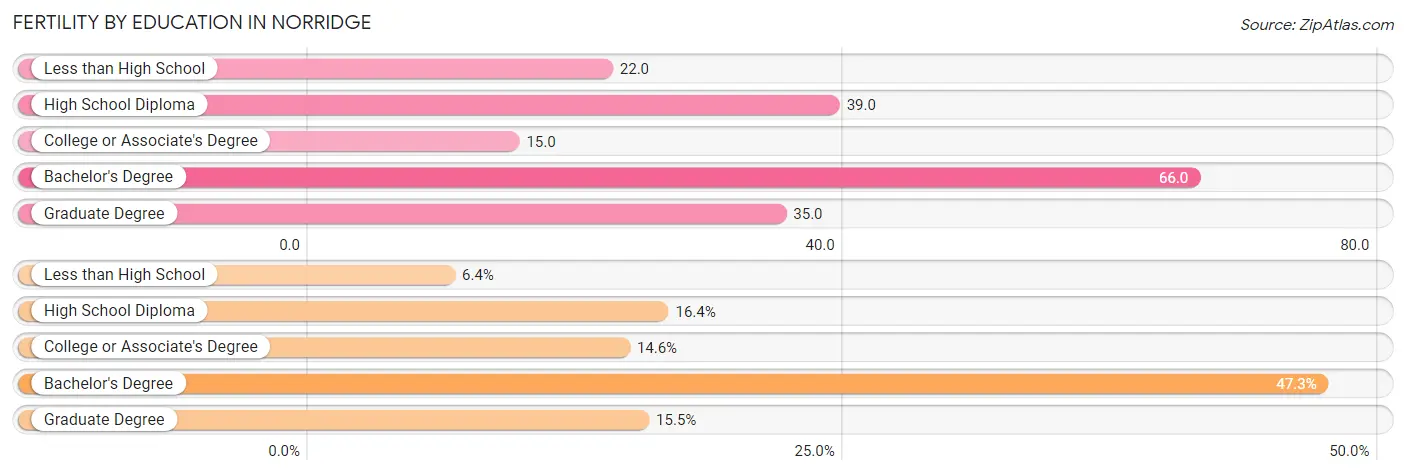
| Educational Attainment | Women with Births | Births / 1,000 Women |
| Less than High School | 7 (6.4%) | 22.0 |
| High School Diploma | 18 (16.4%) | 39.0 |
| College or Associate's Degree | 16 (14.5%) | 15.0 |
| Bachelor's Degree | 52 (47.3%) | 66.0 |
| Graduate Degree | 17 (15.4%) | 35.0 |
| Total | 110 (100.0%) | 35.0 |
Fertility by Education by Marriage Status in Norridge
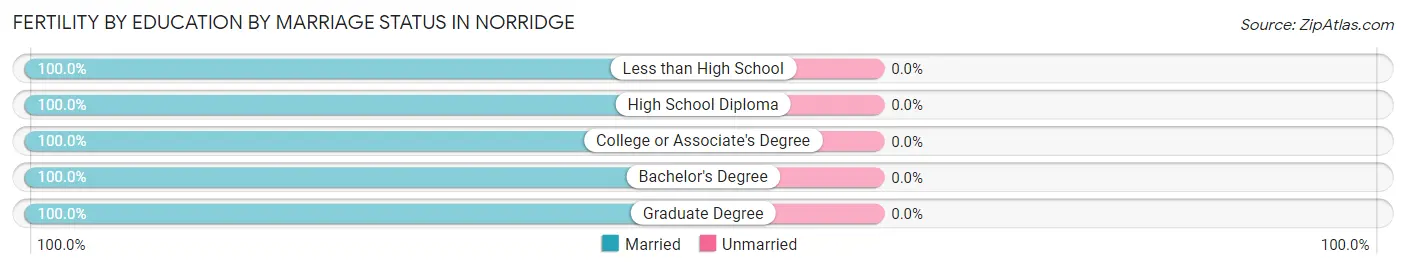
| Educational Attainment | Married | Unmarried |
| Less than High School | 7 (100.0%) | 0 (0.0%) |
| High School Diploma | 18 (100.0%) | 0 (0.0%) |
| College or Associate's Degree | 16 (100.0%) | 0 (0.0%) |
| Bachelor's Degree | 52 (100.0%) | 0 (0.0%) |
| Graduate Degree | 17 (100.0%) | 0 (0.0%) |
| Total | 110 (100.0%) | 0 (0.0%) |
Employment Characteristics in Norridge
Employment by Class of Employer in Norridge
Among the 7,151 employed individuals in Norridge, private company employees (4,905 | 68.6%), self-employed (not incorporated) (682 | 9.5%), and not-for-profit organizations (562 | 7.9%) make up the most common classes of employment.
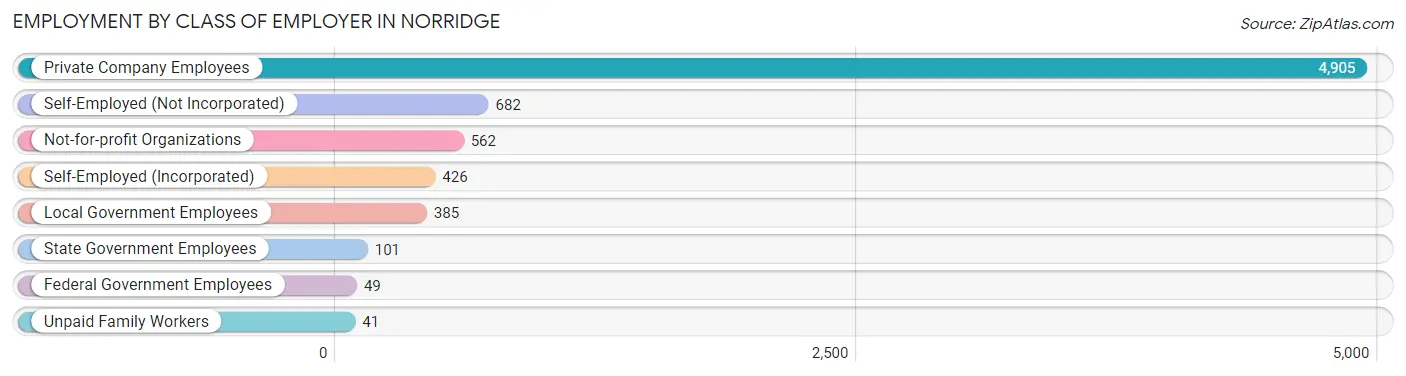
| Employer Class | # Employees | % Employees |
| Private Company Employees | 4,905 | 68.6% |
| Self-Employed (Incorporated) | 426 | 6.0% |
| Self-Employed (Not Incorporated) | 682 | 9.5% |
| Not-for-profit Organizations | 562 | 7.9% |
| Local Government Employees | 385 | 5.4% |
| State Government Employees | 101 | 1.4% |
| Federal Government Employees | 49 | 0.7% |
| Unpaid Family Workers | 41 | 0.6% |
| Total | 7,151 | 100.0% |
Employment Status by Age in Norridge
According to the labor force statistics for Norridge, out of the total population over 16 years of age (12,793), 60.1% or 7,689 individuals are in the labor force, with 6.3% or 484 of them unemployed. The age group with the highest labor force participation rate is 55 to 59 years, with 90.5% or 946 individuals in the labor force. Within the labor force, the 65 to 74 years age range has the highest percentage of unemployed individuals, with 19.4% or 61 of them being unemployed.
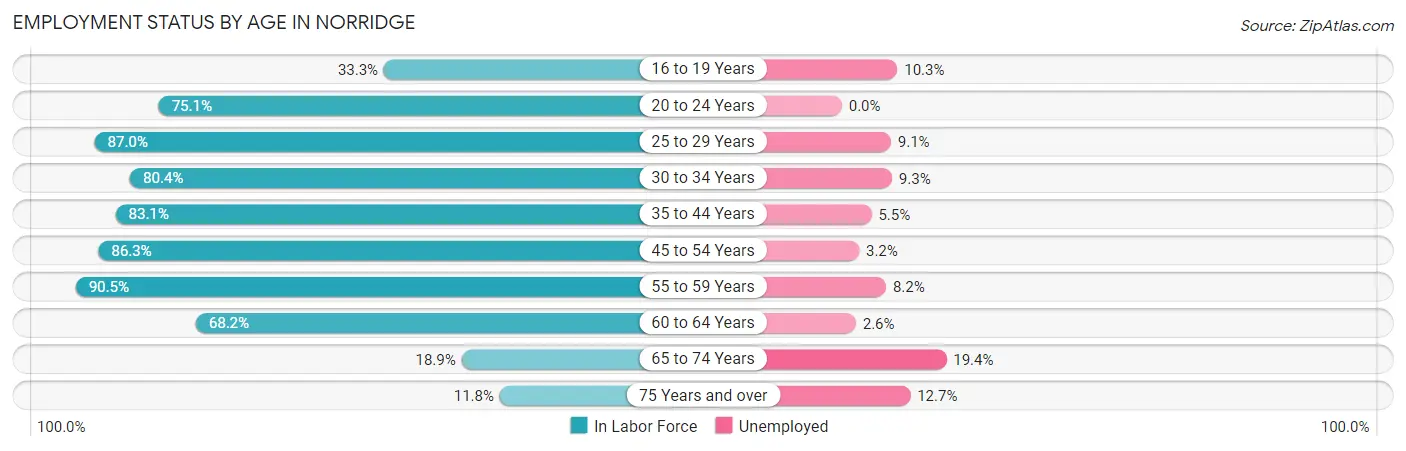
| Age Bracket | In Labor Force | Unemployed |
| 16 to 19 Years | 223 (33.3%) | 23 (10.3%) |
| 20 to 24 Years | 364 (75.1%) | 0 (0.0%) |
| 25 to 29 Years | 624 (87.0%) | 57 (9.1%) |
| 30 to 34 Years | 724 (80.4%) | 67 (9.3%) |
| 35 to 44 Years | 1,589 (83.1%) | 87 (5.5%) |
| 45 to 54 Years | 1,698 (86.3%) | 54 (3.2%) |
| 55 to 59 Years | 946 (90.5%) | 78 (8.2%) |
| 60 to 64 Years | 970 (68.2%) | 25 (2.6%) |
| 65 to 74 Years | 313 (18.9%) | 61 (19.4%) |
| 75 Years and over | 238 (11.8%) | 30 (12.7%) |
| Total | 7,689 (60.1%) | 484 (6.3%) |
Employment Status by Educational Attainment in Norridge
According to labor force statistics for Norridge, 82.2% of individuals (6,547) out of the total population between 25 and 64 years of age (7,965) are in the labor force, with 5.6% or 367 of them being unemployed. The group with the highest labor force participation rate are those with the educational attainment of bachelor's degree or higher, with 88.1% or 2,484 individuals in the labor force. Within the labor force, individuals with less than high school education have the highest percentage of unemployment, with 13.8% or 62 of them being unemployed.
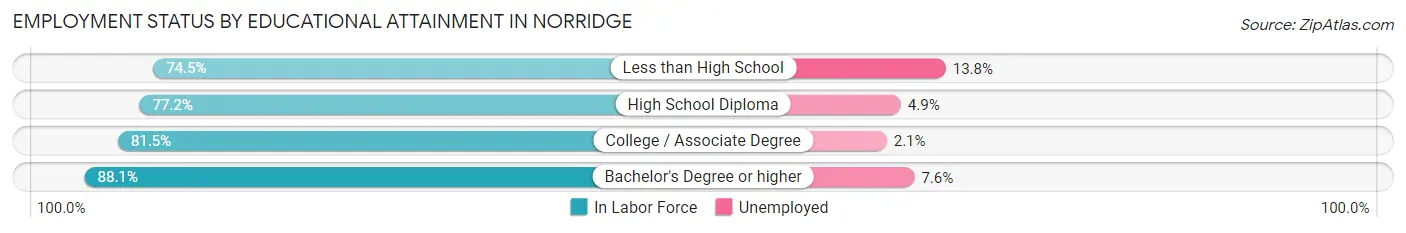
| Educational Attainment | In Labor Force | Unemployed |
| Less than High School | 449 (74.5%) | 83 (13.8%) |
| High School Diploma | 1,525 (77.2%) | 97 (4.9%) |
| College / Associate Degree | 2,091 (81.5%) | 54 (2.1%) |
| Bachelor's Degree or higher | 2,484 (88.1%) | 214 (7.6%) |
| Total | 6,547 (82.2%) | 446 (5.6%) |
Employment Occupations by Sex in Norridge
Management, Business, Science and Arts Occupations
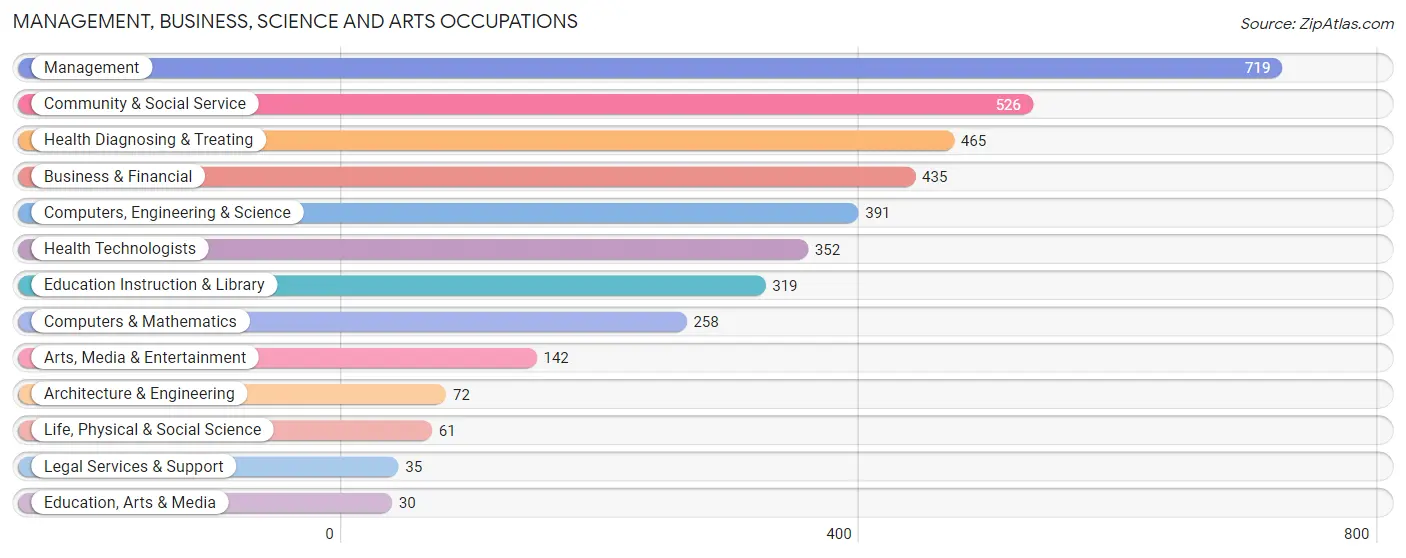
The most common Management, Business, Science and Arts occupations in Norridge are Management (719 | 10.0%), Community & Social Service (526 | 7.3%), Health Diagnosing & Treating (465 | 6.5%), Business & Financial (435 | 6.0%), and Computers, Engineering & Science (391 | 5.4%).
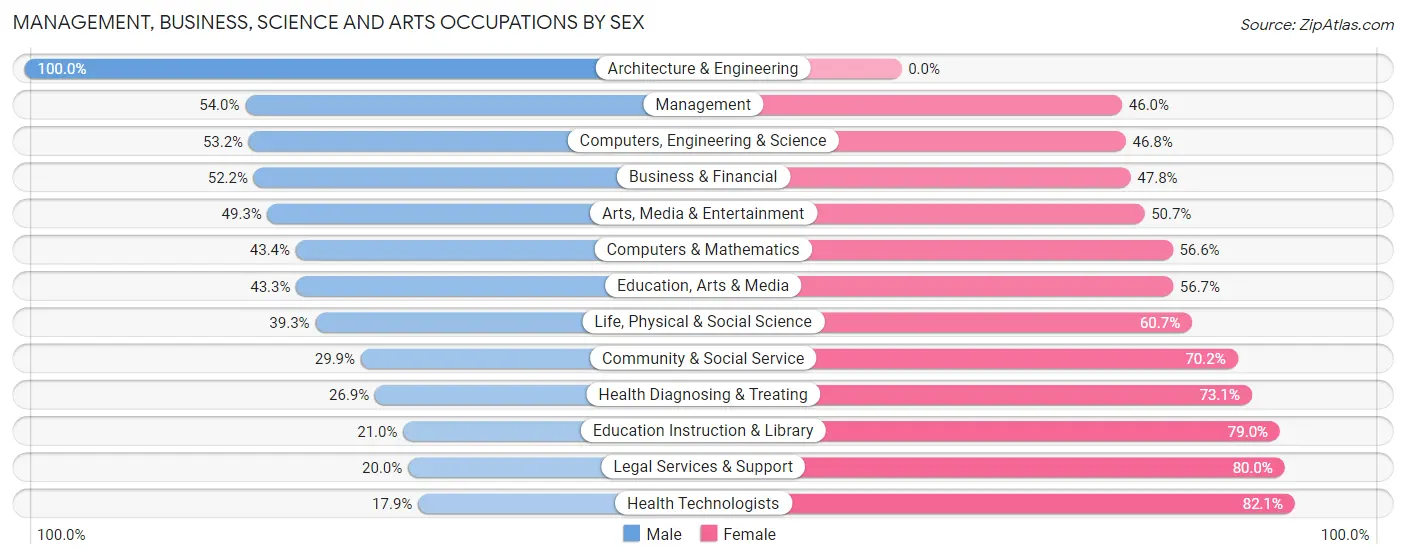
Management, Business, Science and Arts Occupations by Sex
Within the Management, Business, Science and Arts occupations in Norridge, the most male-oriented occupations are Architecture & Engineering (100.0%), Management (54.0%), and Computers, Engineering & Science (53.2%), while the most female-oriented occupations are Health Technologists (82.1%), Legal Services & Support (80.0%), and Education Instruction & Library (79.0%).
| Occupation | Male | Female |
| Management | 388 (54.0%) | 331 (46.0%) |
| Business & Financial | 227 (52.2%) | 208 (47.8%) |
| Computers, Engineering & Science | 208 (53.2%) | 183 (46.8%) |
| Computers & Mathematics | 112 (43.4%) | 146 (56.6%) |
| Architecture & Engineering | 72 (100.0%) | 0 (0.0%) |
| Life, Physical & Social Science | 24 (39.3%) | 37 (60.7%) |
| Community & Social Service | 157 (29.8%) | 369 (70.2%) |
| Education, Arts & Media | 13 (43.3%) | 17 (56.7%) |
| Legal Services & Support | 7 (20.0%) | 28 (80.0%) |
| Education Instruction & Library | 67 (21.0%) | 252 (79.0%) |
| Arts, Media & Entertainment | 70 (49.3%) | 72 (50.7%) |
| Health Diagnosing & Treating | 125 (26.9%) | 340 (73.1%) |
| Health Technologists | 63 (17.9%) | 289 (82.1%) |
| Total (Category) | 1,105 (43.6%) | 1,431 (56.4%) |
| Total (Overall) | 3,775 (52.4%) | 3,431 (47.6%) |
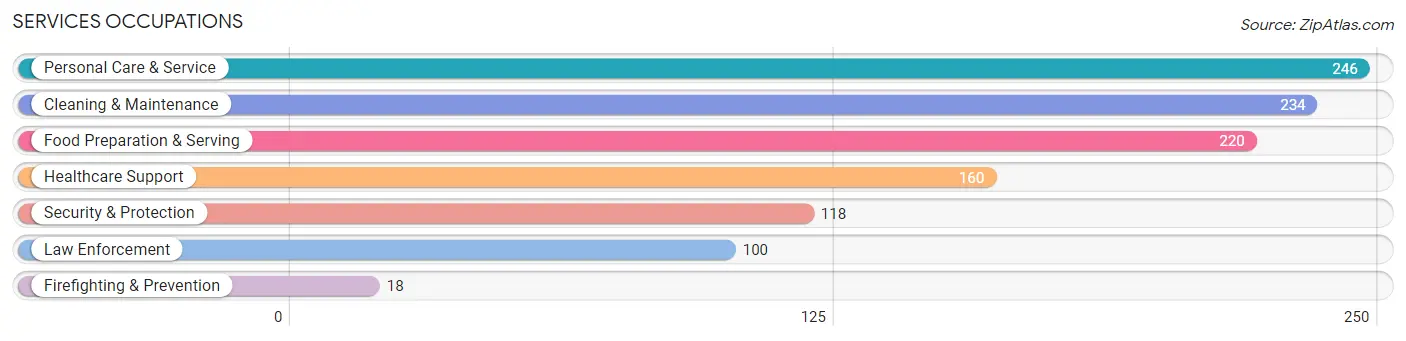
Services Occupations
The most common Services occupations in Norridge are Personal Care & Service (246 | 3.4%), Cleaning & Maintenance (234 | 3.3%), Food Preparation & Serving (220 | 3.0%), Healthcare Support (160 | 2.2%), and Security & Protection (118 | 1.6%).
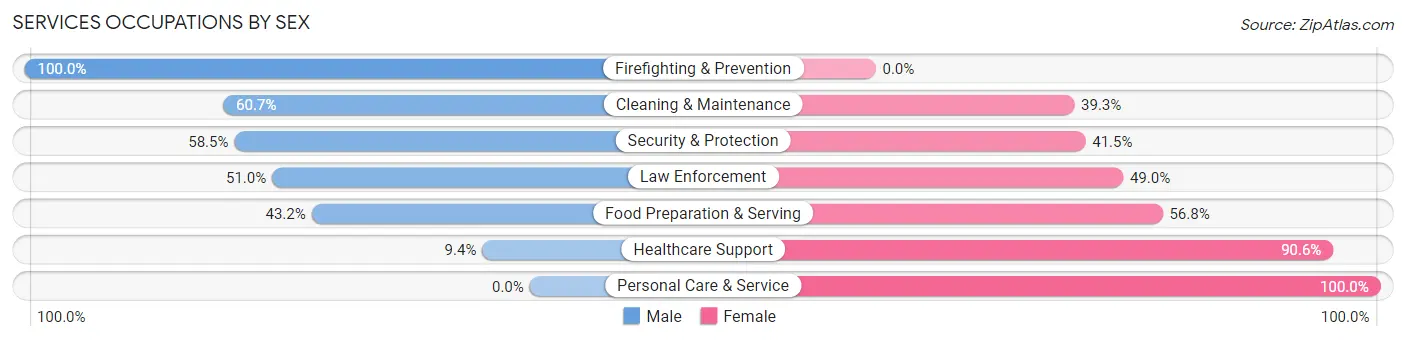
Services Occupations by Sex
Within the Services occupations in Norridge, the most male-oriented occupations are Firefighting & Prevention (100.0%), Cleaning & Maintenance (60.7%), and Security & Protection (58.5%), while the most female-oriented occupations are Personal Care & Service (100.0%), Healthcare Support (90.6%), and Food Preparation & Serving (56.8%).
| Occupation | Male | Female |
| Healthcare Support | 15 (9.4%) | 145 (90.6%) |
| Security & Protection | 69 (58.5%) | 49 (41.5%) |
| Firefighting & Prevention | 18 (100.0%) | 0 (0.0%) |
| Law Enforcement | 51 (51.0%) | 49 (49.0%) |
| Food Preparation & Serving | 95 (43.2%) | 125 (56.8%) |
| Cleaning & Maintenance | 142 (60.7%) | 92 (39.3%) |
| Personal Care & Service | 0 (0.0%) | 246 (100.0%) |
| Total (Category) | 321 (32.8%) | 657 (67.2%) |
| Total (Overall) | 3,775 (52.4%) | 3,431 (47.6%) |
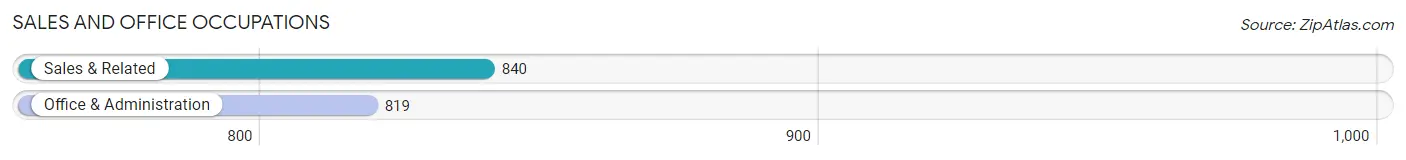
Sales and Office Occupations
The most common Sales and Office occupations in Norridge are Sales & Related (840 | 11.7%), and Office & Administration (819 | 11.4%).
Sales and Office Occupations by Sex
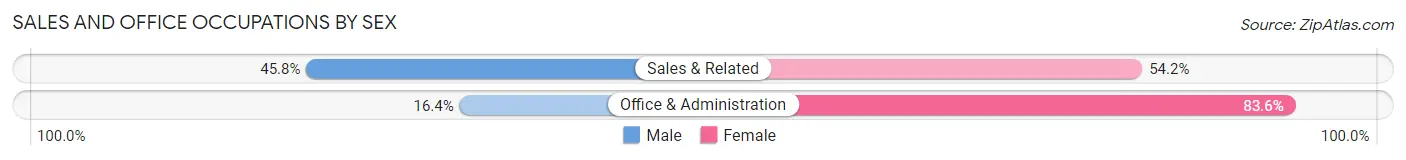
| Occupation | Male | Female |
| Sales & Related | 385 (45.8%) | 455 (54.2%) |
| Office & Administration | 134 (16.4%) | 685 (83.6%) |
| Total (Category) | 519 (31.3%) | 1,140 (68.7%) |
| Total (Overall) | 3,775 (52.4%) | 3,431 (47.6%) |
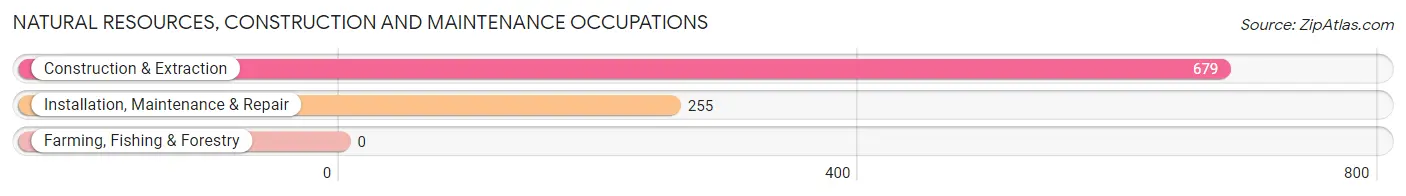
Natural Resources, Construction and Maintenance Occupations
The most common Natural Resources, Construction and Maintenance occupations in Norridge are Construction & Extraction (679 | 9.4%), and Installation, Maintenance & Repair (255 | 3.5%).
Natural Resources, Construction and Maintenance Occupations by Sex
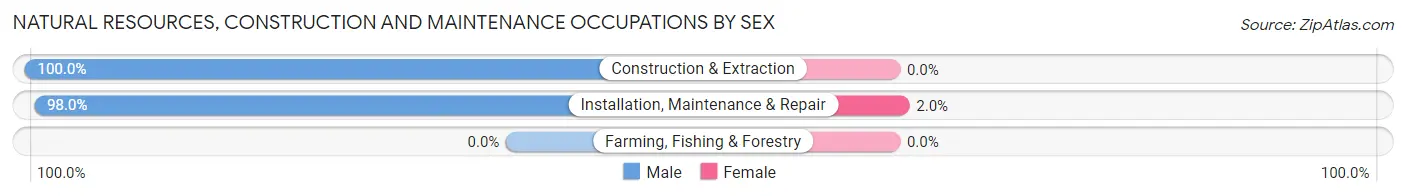
| Occupation | Male | Female |
| Farming, Fishing & Forestry | 0 (0.0%) | 0 (0.0%) |
| Construction & Extraction | 679 (100.0%) | 0 (0.0%) |
| Installation, Maintenance & Repair | 250 (98.0%) | 5 (2.0%) |
| Total (Category) | 929 (99.5%) | 5 (0.5%) |
| Total (Overall) | 3,775 (52.4%) | 3,431 (47.6%) |
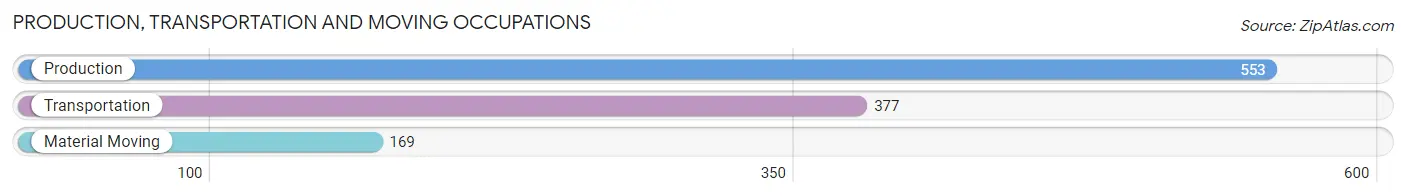
Production, Transportation and Moving Occupations
The most common Production, Transportation and Moving occupations in Norridge are Production (553 | 7.7%), Transportation (377 | 5.2%), and Material Moving (169 | 2.4%).
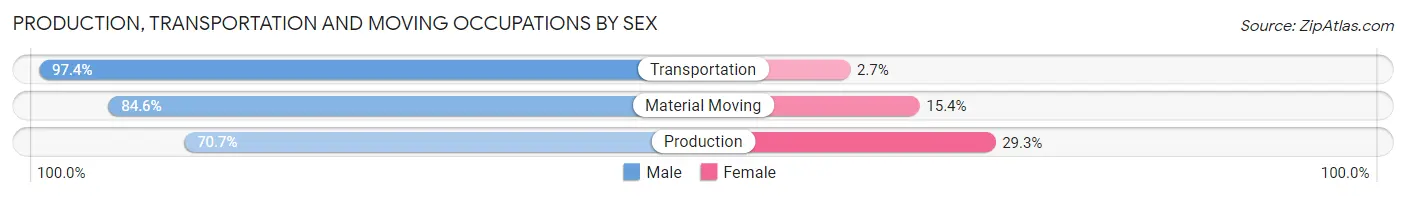
Production, Transportation and Moving Occupations by Sex
| Occupation | Male | Female |
| Production | 391 (70.7%) | 162 (29.3%) |
| Transportation | 367 (97.4%) | 10 (2.6%) |
| Material Moving | 143 (84.6%) | 26 (15.4%) |
| Total (Category) | 901 (82.0%) | 198 (18.0%) |
| Total (Overall) | 3,775 (52.4%) | 3,431 (47.6%) |
Employment Industries by Sex in Norridge
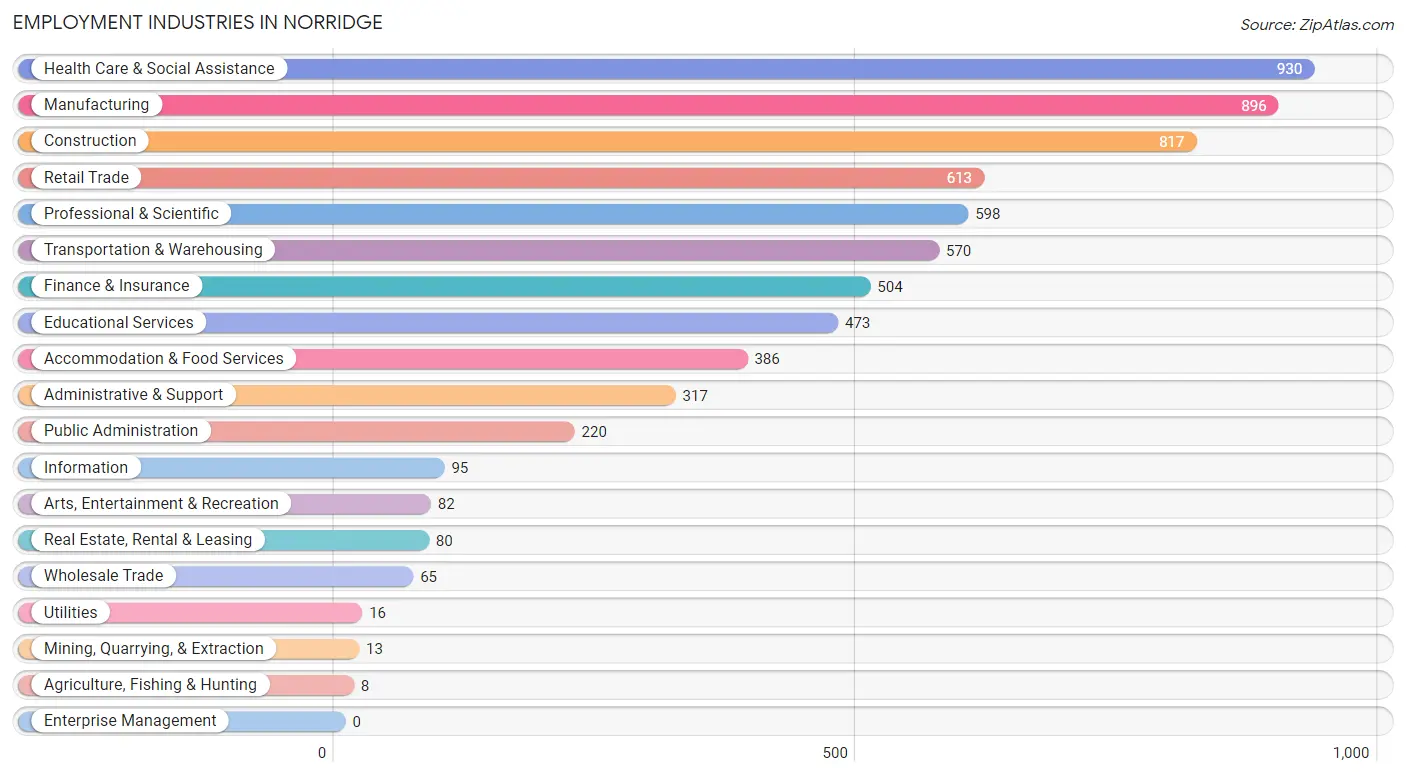
Employment Industries in Norridge
The major employment industries in Norridge include Health Care & Social Assistance (930 | 12.9%), Manufacturing (896 | 12.4%), Construction (817 | 11.3%), Retail Trade (613 | 8.5%), and Professional & Scientific (598 | 8.3%).
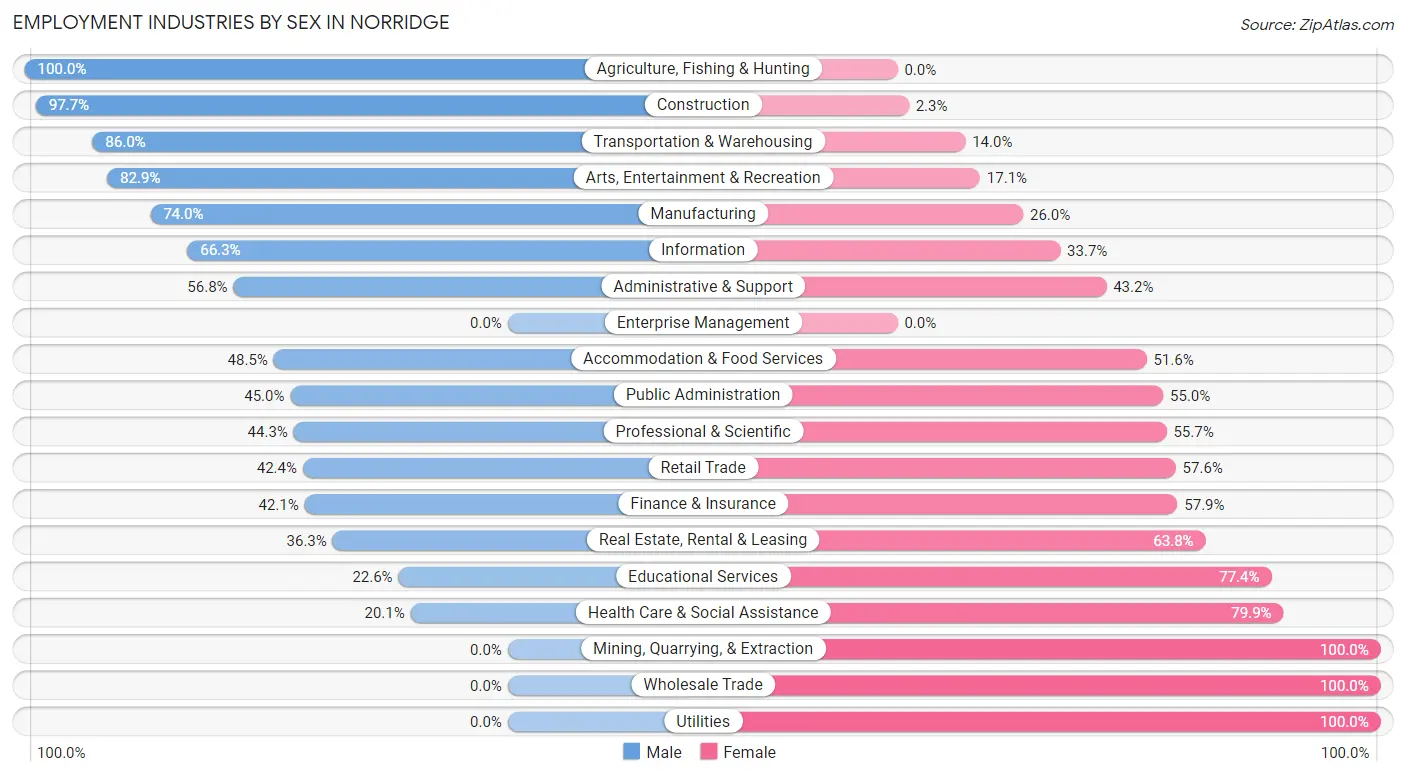
Employment Industries by Sex in Norridge
The Norridge industries that see more men than women are Agriculture, Fishing & Hunting (100.0%), Construction (97.7%), and Transportation & Warehousing (86.0%), whereas the industries that tend to have a higher number of women are Mining, Quarrying, & Extraction (100.0%), Wholesale Trade (100.0%), and Utilities (100.0%).
| Industry | Male | Female |
| Agriculture, Fishing & Hunting | 8 (100.0%) | 0 (0.0%) |
| Mining, Quarrying, & Extraction | 0 (0.0%) | 13 (100.0%) |
| Construction | 798 (97.7%) | 19 (2.3%) |
| Manufacturing | 663 (74.0%) | 233 (26.0%) |
| Wholesale Trade | 0 (0.0%) | 65 (100.0%) |
| Retail Trade | 260 (42.4%) | 353 (57.6%) |
| Transportation & Warehousing | 490 (86.0%) | 80 (14.0%) |
| Utilities | 0 (0.0%) | 16 (100.0%) |
| Information | 63 (66.3%) | 32 (33.7%) |
| Finance & Insurance | 212 (42.1%) | 292 (57.9%) |
| Real Estate, Rental & Leasing | 29 (36.2%) | 51 (63.7%) |
| Professional & Scientific | 265 (44.3%) | 333 (55.7%) |
| Enterprise Management | 0 (0.0%) | 0 (0.0%) |
| Administrative & Support | 180 (56.8%) | 137 (43.2%) |
| Educational Services | 107 (22.6%) | 366 (77.4%) |
| Health Care & Social Assistance | 187 (20.1%) | 743 (79.9%) |
| Arts, Entertainment & Recreation | 68 (82.9%) | 14 (17.1%) |
| Accommodation & Food Services | 187 (48.4%) | 199 (51.5%) |
| Public Administration | 99 (45.0%) | 121 (55.0%) |
| Total | 3,775 (52.4%) | 3,431 (47.6%) |
Education in Norridge
School Enrollment in Norridge
The most common levels of schooling among the 3,050 students in Norridge are high school (642 | 21.0%), elementary school (619 | 20.3%), and middle school (589 | 19.3%).
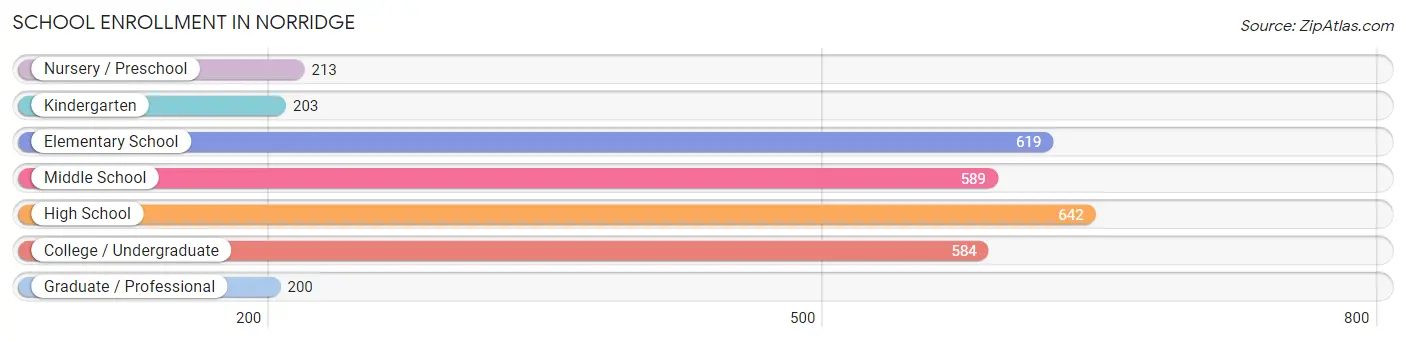
| School Level | # Students | % Students |
| Nursery / Preschool | 213 | 7.0% |
| Kindergarten | 203 | 6.7% |
| Elementary School | 619 | 20.3% |
| Middle School | 589 | 19.3% |
| High School | 642 | 21.0% |
| College / Undergraduate | 584 | 19.2% |
| Graduate / Professional | 200 | 6.6% |
| Total | 3,050 | 100.0% |
School Enrollment by Age by Funding Source in Norridge
Out of a total of 3,050 students who are enrolled in schools in Norridge, 619 (20.3%) attend a private institution, while the remaining 2,431 (79.7%) are enrolled in public schools. The age group of 20 to 24 year olds has the highest likelihood of being enrolled in private schools, with 133 (56.4% in the age bracket) enrolled. Conversely, the age group of 15 to 17 year olds has the lowest likelihood of being enrolled in a private school, with 343 (100.0% in the age bracket) attending a public institution.
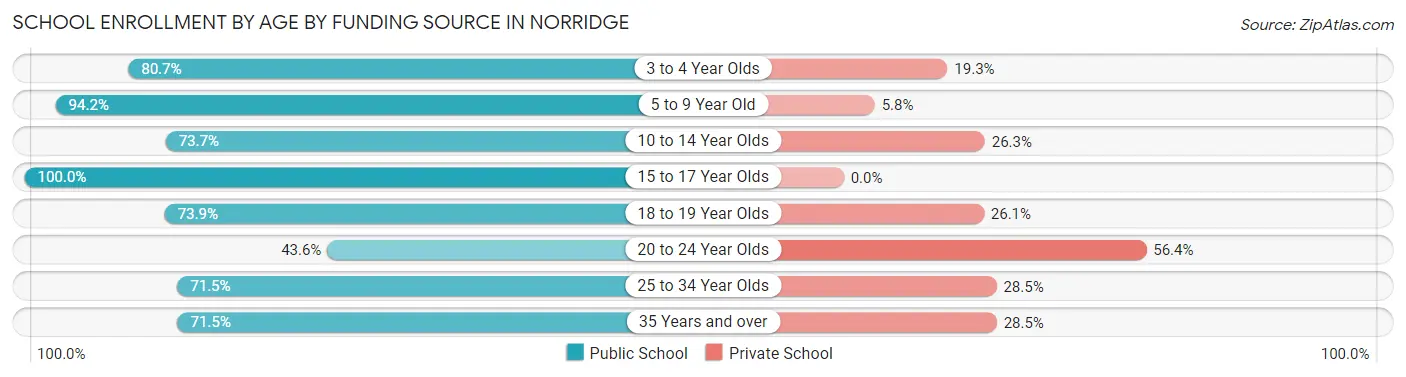
| Age Bracket | Public School | Private School |
| 3 to 4 Year Olds | 142 (80.7%) | 34 (19.3%) |
| 5 to 9 Year Old | 732 (94.2%) | 45 (5.8%) |
| 10 to 14 Year Olds | 600 (73.7%) | 214 (26.3%) |
| 15 to 17 Year Olds | 343 (100.0%) | 0 (0.0%) |
| 18 to 19 Year Olds | 266 (73.9%) | 94 (26.1%) |
| 20 to 24 Year Olds | 103 (43.6%) | 133 (56.4%) |
| 25 to 34 Year Olds | 93 (71.5%) | 37 (28.5%) |
| 35 Years and over | 153 (71.5%) | 61 (28.5%) |
| Total | 2,431 (79.7%) | 619 (20.3%) |
Educational Attainment by Field of Study in Norridge
Business (912 | 25.5%), education (485 | 13.6%), science & technology (465 | 13.0%), computers & mathematics (238 | 6.7%), and physical & health sciences (206 | 5.8%) are the most common fields of study among 3,580 individuals in Norridge who have obtained a bachelor's degree or higher.
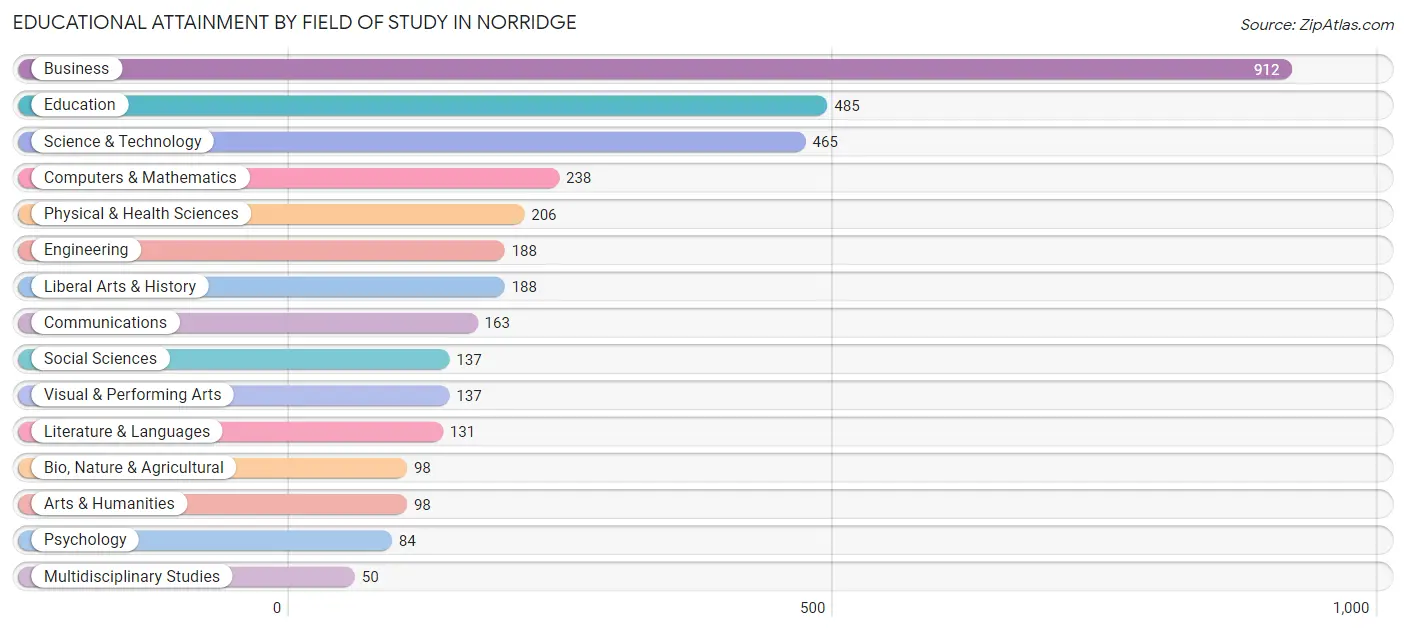
| Field of Study | # Graduates | % Graduates |
| Computers & Mathematics | 238 | 6.7% |
| Bio, Nature & Agricultural | 98 | 2.7% |
| Physical & Health Sciences | 206 | 5.8% |
| Psychology | 84 | 2.4% |
| Social Sciences | 137 | 3.8% |
| Engineering | 188 | 5.2% |
| Multidisciplinary Studies | 50 | 1.4% |
| Science & Technology | 465 | 13.0% |
| Business | 912 | 25.5% |
| Education | 485 | 13.6% |
| Literature & Languages | 131 | 3.7% |
| Liberal Arts & History | 188 | 5.2% |
| Visual & Performing Arts | 137 | 3.8% |
| Communications | 163 | 4.5% |
| Arts & Humanities | 98 | 2.7% |
| Total | 3,580 | 100.0% |
Transportation & Commute in Norridge
Vehicle Availability by Sex in Norridge
The most prevalent vehicle ownership categories in Norridge are males with 2 vehicles (1,834, accounting for 48.8%) and females with 2 vehicles (1,435, making up 54.2%).
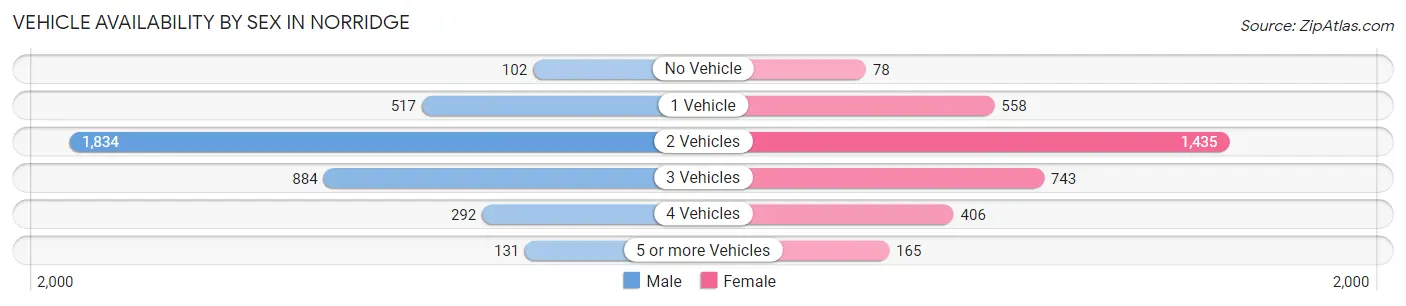
| Vehicles Available | Male | Female |
| No Vehicle | 102 (2.7%) | 78 (2.3%) |
| 1 Vehicle | 517 (13.8%) | 558 (16.5%) |
| 2 Vehicles | 1,834 (48.8%) | 1,435 (42.4%) |
| 3 Vehicles | 884 (23.5%) | 743 (22.0%) |
| 4 Vehicles | 292 (7.8%) | 406 (12.0%) |
| 5 or more Vehicles | 131 (3.5%) | 165 (4.9%) |
| Total | 3,760 (100.0%) | 3,385 (100.0%) |
Commute Time in Norridge
The most frequently occuring commute durations in Norridge are 30 to 34 minutes (1,291 commuters, 19.5%), 45 to 59 minutes (1,092 commuters, 16.5%), and 15 to 19 minutes (762 commuters, 11.5%).
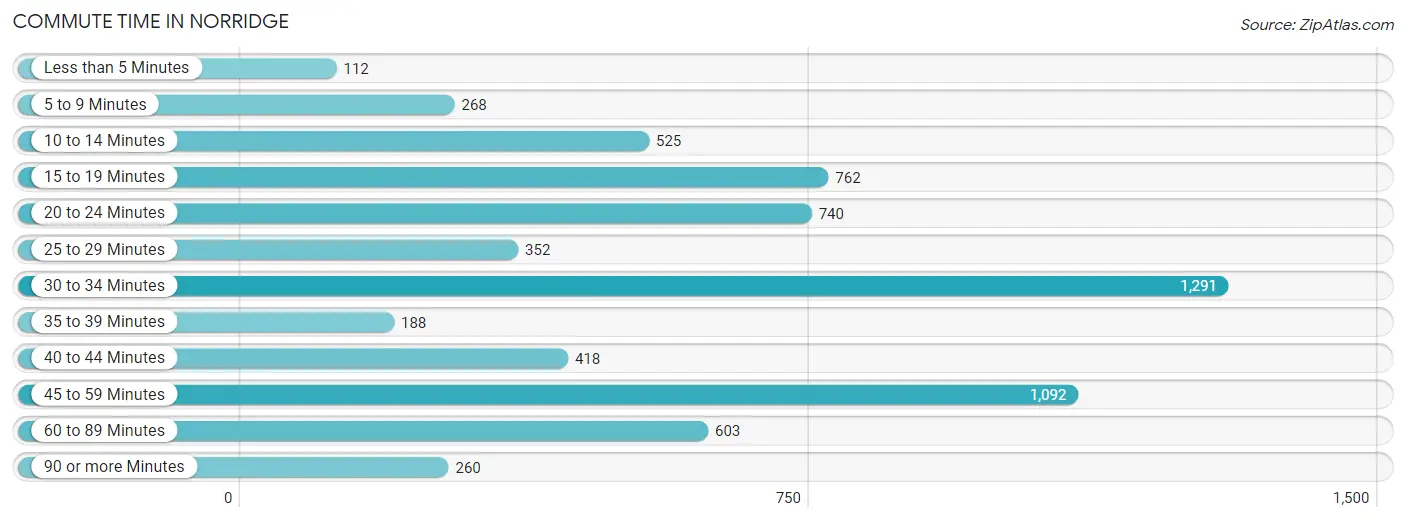
| Commute Time | # Commuters | % Commuters |
| Less than 5 Minutes | 112 | 1.7% |
| 5 to 9 Minutes | 268 | 4.1% |
| 10 to 14 Minutes | 525 | 7.9% |
| 15 to 19 Minutes | 762 | 11.5% |
| 20 to 24 Minutes | 740 | 11.2% |
| 25 to 29 Minutes | 352 | 5.3% |
| 30 to 34 Minutes | 1,291 | 19.5% |
| 35 to 39 Minutes | 188 | 2.8% |
| 40 to 44 Minutes | 418 | 6.3% |
| 45 to 59 Minutes | 1,092 | 16.5% |
| 60 to 89 Minutes | 603 | 9.1% |
| 90 or more Minutes | 260 | 3.9% |
Commute Time by Sex in Norridge
The most common commute times in Norridge are 30 to 34 minutes (864 commuters, 24.2%) for males and 45 to 59 minutes (678 commuters, 22.3%) for females.
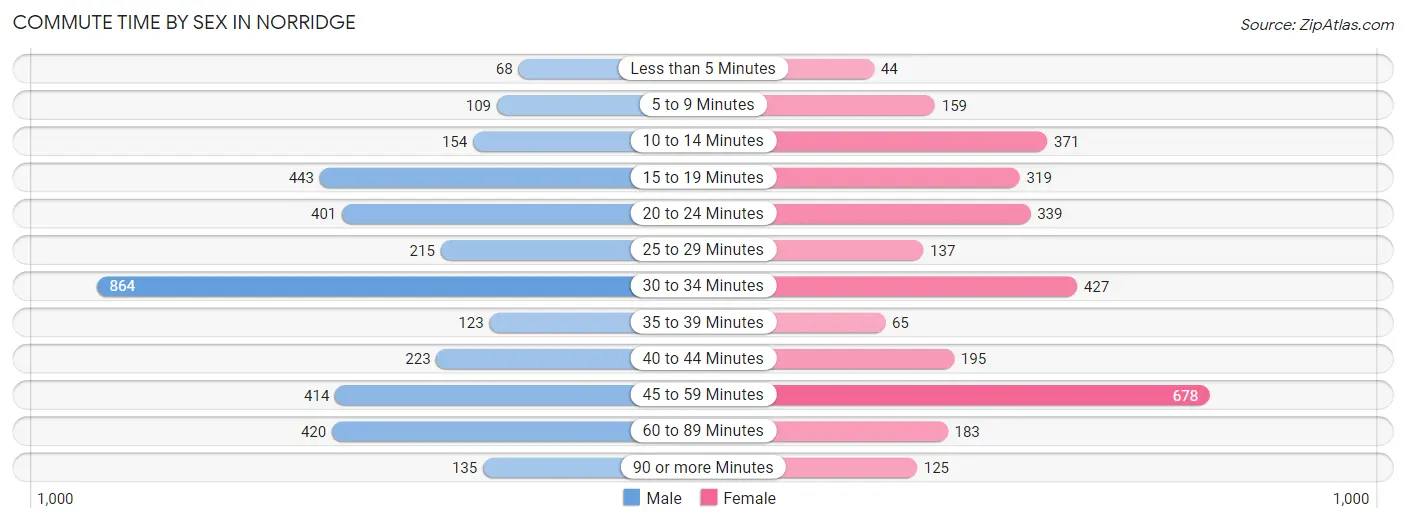
| Commute Time | Male | Female |
| Less than 5 Minutes | 68 (1.9%) | 44 (1.5%) |
| 5 to 9 Minutes | 109 (3.0%) | 159 (5.2%) |
| 10 to 14 Minutes | 154 (4.3%) | 371 (12.2%) |
| 15 to 19 Minutes | 443 (12.4%) | 319 (10.5%) |
| 20 to 24 Minutes | 401 (11.2%) | 339 (11.1%) |
| 25 to 29 Minutes | 215 (6.0%) | 137 (4.5%) |
| 30 to 34 Minutes | 864 (24.2%) | 427 (14.0%) |
| 35 to 39 Minutes | 123 (3.5%) | 65 (2.1%) |
| 40 to 44 Minutes | 223 (6.2%) | 195 (6.4%) |
| 45 to 59 Minutes | 414 (11.6%) | 678 (22.3%) |
| 60 to 89 Minutes | 420 (11.8%) | 183 (6.0%) |
| 90 or more Minutes | 135 (3.8%) | 125 (4.1%) |
Time of Departure to Work by Sex in Norridge
The most frequent times of departure to work in Norridge are 6:00 AM to 6:29 AM (570, 16.0%) for males and 7:00 AM to 7:29 AM (569, 18.7%) for females.
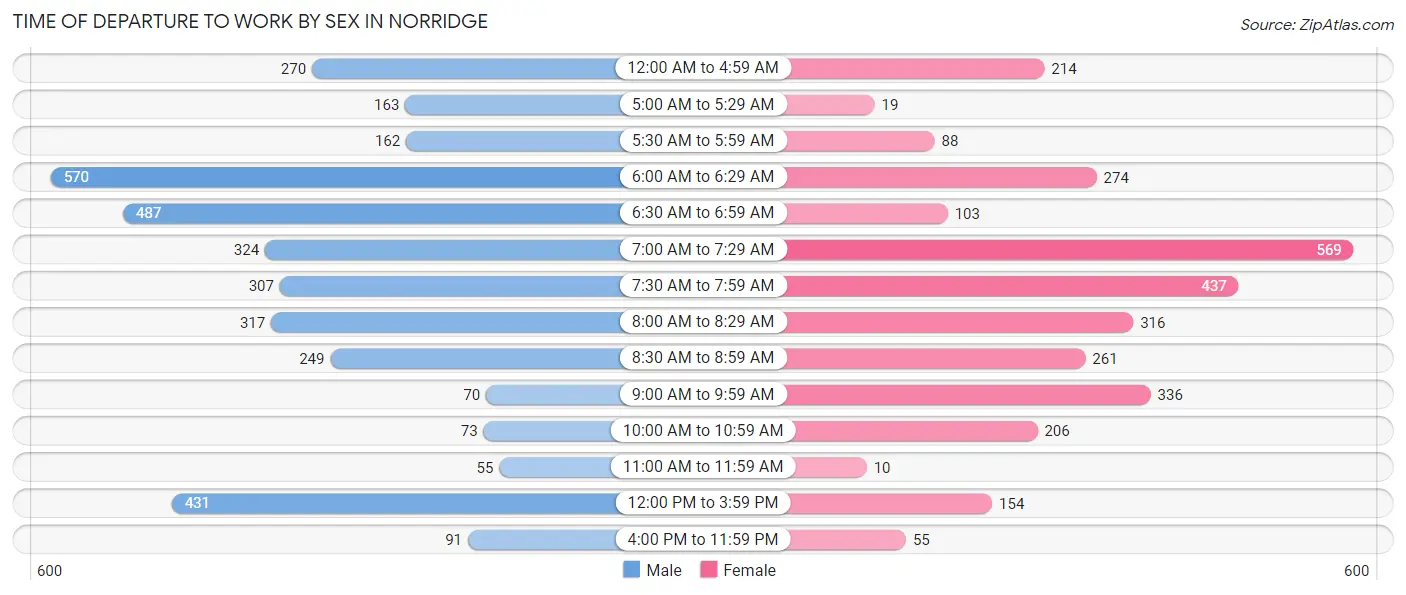
| Time of Departure | Male | Female |
| 12:00 AM to 4:59 AM | 270 (7.6%) | 214 (7.0%) |
| 5:00 AM to 5:29 AM | 163 (4.6%) | 19 (0.6%) |
| 5:30 AM to 5:59 AM | 162 (4.5%) | 88 (2.9%) |
| 6:00 AM to 6:29 AM | 570 (16.0%) | 274 (9.0%) |
| 6:30 AM to 6:59 AM | 487 (13.7%) | 103 (3.4%) |
| 7:00 AM to 7:29 AM | 324 (9.1%) | 569 (18.7%) |
| 7:30 AM to 7:59 AM | 307 (8.6%) | 437 (14.4%) |
| 8:00 AM to 8:29 AM | 317 (8.9%) | 316 (10.4%) |
| 8:30 AM to 8:59 AM | 249 (7.0%) | 261 (8.6%) |
| 9:00 AM to 9:59 AM | 70 (2.0%) | 336 (11.1%) |
| 10:00 AM to 10:59 AM | 73 (2.1%) | 206 (6.8%) |
| 11:00 AM to 11:59 AM | 55 (1.5%) | 10 (0.3%) |
| 12:00 PM to 3:59 PM | 431 (12.1%) | 154 (5.1%) |
| 4:00 PM to 11:59 PM | 91 (2.5%) | 55 (1.8%) |
| Total | 3,569 (100.0%) | 3,042 (100.0%) |
Housing Occupancy in Norridge
Occupancy by Ownership in Norridge
Of the total 5,865 dwellings in Norridge, owner-occupied units account for 4,867 (83.0%), while renter-occupied units make up 998 (17.0%).
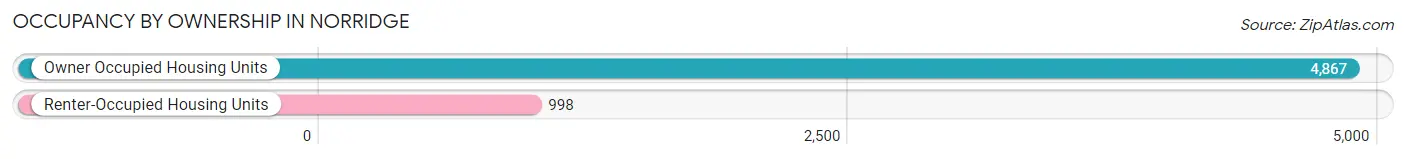
| Occupancy | # Housing Units | % Housing Units |
| Owner Occupied Housing Units | 4,867 | 83.0% |
| Renter-Occupied Housing Units | 998 | 17.0% |
| Total Occupied Housing Units | 5,865 | 100.0% |
Occupancy by Household Size in Norridge
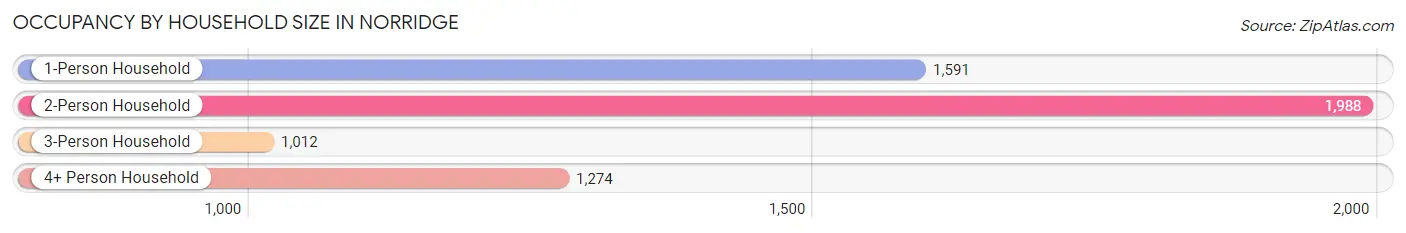
| Household Size | # Housing Units | % Housing Units |
| 1-Person Household | 1,591 | 27.1% |
| 2-Person Household | 1,988 | 33.9% |
| 3-Person Household | 1,012 | 17.2% |
| 4+ Person Household | 1,274 | 21.7% |
| Total Housing Units | 5,865 | 100.0% |
Occupancy by Ownership by Household Size in Norridge
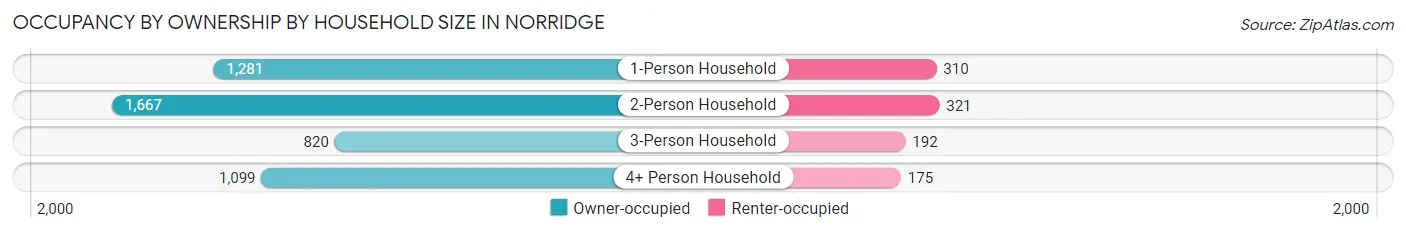
| Household Size | Owner-occupied | Renter-occupied |
| 1-Person Household | 1,281 (80.5%) | 310 (19.5%) |
| 2-Person Household | 1,667 (83.9%) | 321 (16.2%) |
| 3-Person Household | 820 (81.0%) | 192 (19.0%) |
| 4+ Person Household | 1,099 (86.3%) | 175 (13.7%) |
| Total Housing Units | 4,867 (83.0%) | 998 (17.0%) |
Occupancy by Educational Attainment in Norridge
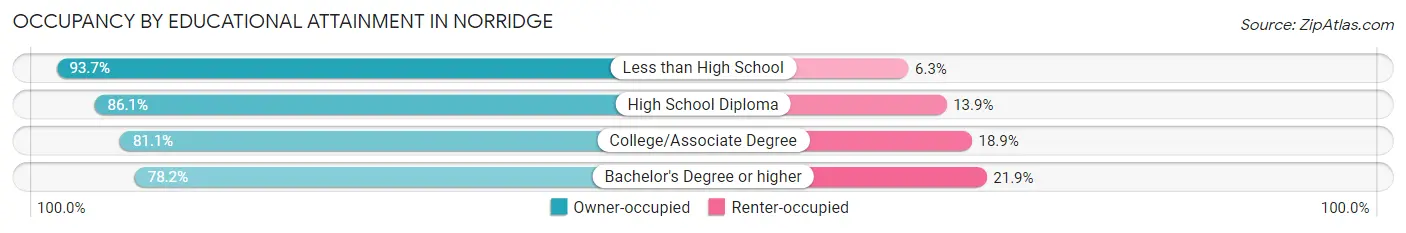
| Household Size | Owner-occupied | Renter-occupied |
| Less than High School | 518 (93.7%) | 35 (6.3%) |
| High School Diploma | 1,556 (86.1%) | 251 (13.9%) |
| College/Associate Degree | 1,484 (81.1%) | 346 (18.9%) |
| Bachelor's Degree or higher | 1,309 (78.1%) | 366 (21.8%) |
Occupancy by Age of Householder in Norridge
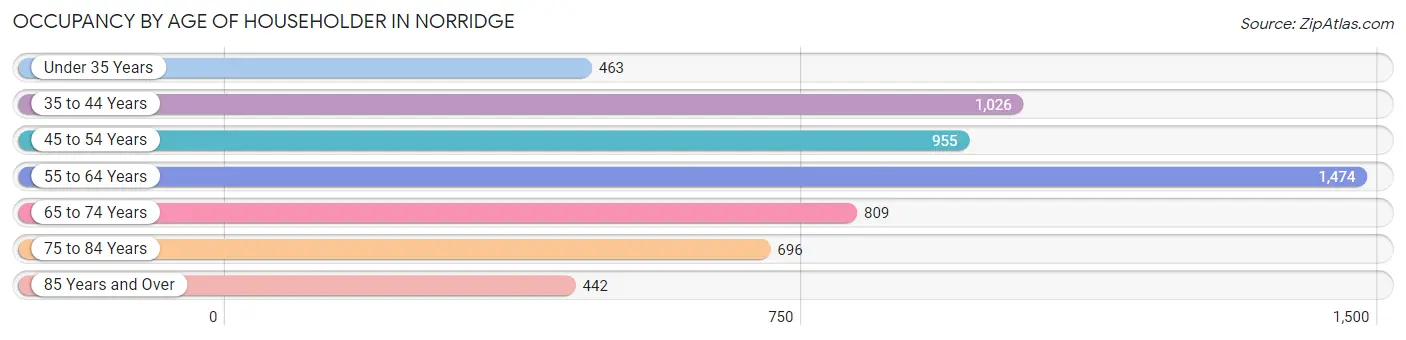
| Age Bracket | # Households | % Households |
| Under 35 Years | 463 | 7.9% |
| 35 to 44 Years | 1,026 | 17.5% |
| 45 to 54 Years | 955 | 16.3% |
| 55 to 64 Years | 1,474 | 25.1% |
| 65 to 74 Years | 809 | 13.8% |
| 75 to 84 Years | 696 | 11.9% |
| 85 Years and Over | 442 | 7.5% |
| Total | 5,865 | 100.0% |
Housing Finances in Norridge
Median Income by Occupancy in Norridge
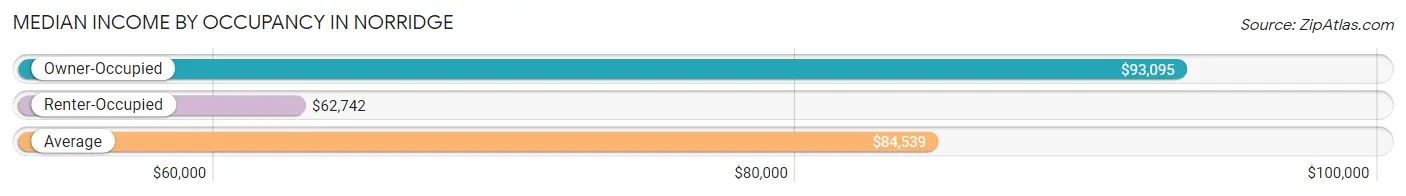
| Occupancy Type | # Households | Median Income |
| Owner-Occupied | 4,867 (83.0%) | $93,095 |
| Renter-Occupied | 998 (17.0%) | $62,742 |
| Average | 5,865 (100.0%) | $84,539 |
Occupancy by Householder Income Bracket in Norridge
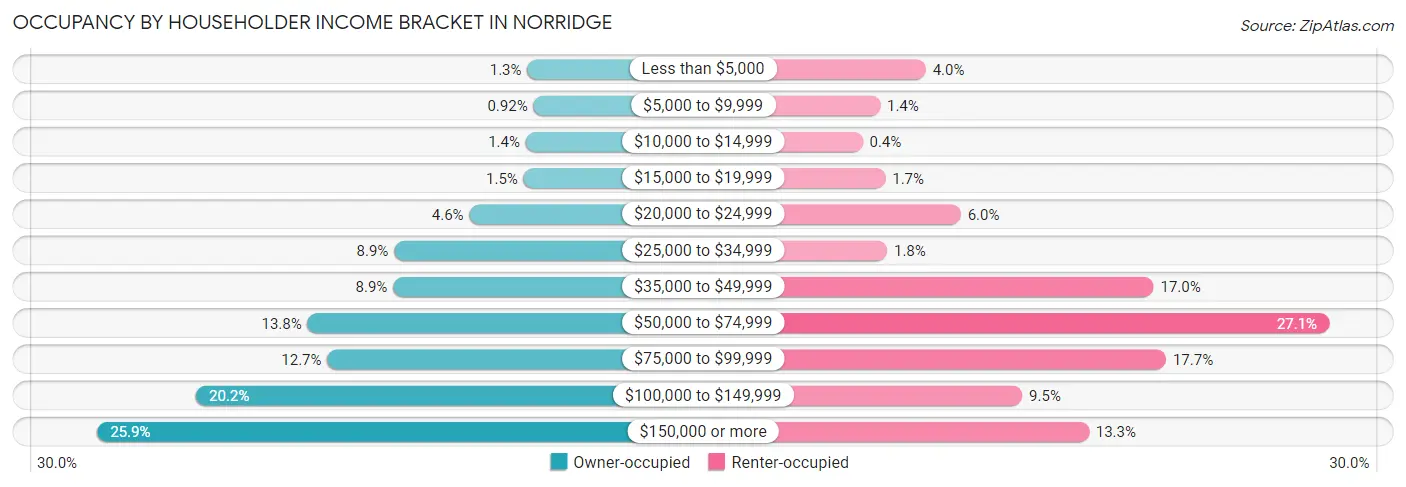
| Income Bracket | Owner-occupied | Renter-occupied |
| Less than $5,000 | 62 (1.3%) | 40 (4.0%) |
| $5,000 to $9,999 | 45 (0.9%) | 14 (1.4%) |
| $10,000 to $14,999 | 66 (1.4%) | 4 (0.4%) |
| $15,000 to $19,999 | 72 (1.5%) | 17 (1.7%) |
| $20,000 to $24,999 | 223 (4.6%) | 60 (6.0%) |
| $25,000 to $34,999 | 432 (8.9%) | 18 (1.8%) |
| $35,000 to $49,999 | 435 (8.9%) | 170 (17.0%) |
| $50,000 to $74,999 | 673 (13.8%) | 270 (27.1%) |
| $75,000 to $99,999 | 618 (12.7%) | 177 (17.7%) |
| $100,000 to $149,999 | 983 (20.2%) | 95 (9.5%) |
| $150,000 or more | 1,258 (25.9%) | 133 (13.3%) |
| Total | 4,867 (100.0%) | 998 (100.0%) |
Monthly Housing Cost Tiers in Norridge
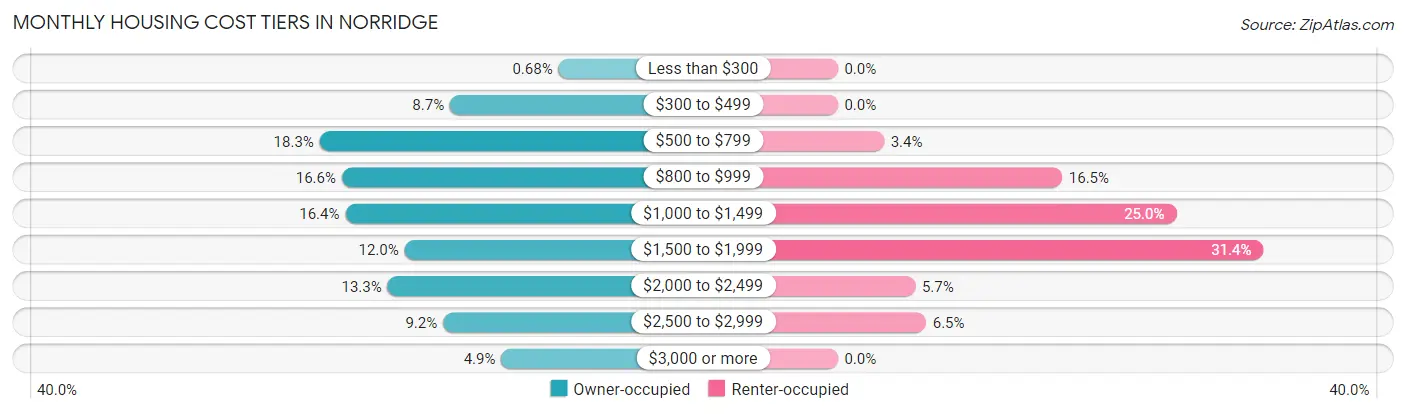
| Monthly Cost | Owner-occupied | Renter-occupied |
| Less than $300 | 33 (0.7%) | 0 (0.0%) |
| $300 to $499 | 422 (8.7%) | 0 (0.0%) |
| $500 to $799 | 889 (18.3%) | 34 (3.4%) |
| $800 to $999 | 810 (16.6%) | 165 (16.5%) |
| $1,000 to $1,499 | 797 (16.4%) | 249 (24.9%) |
| $1,500 to $1,999 | 585 (12.0%) | 313 (31.4%) |
| $2,000 to $2,499 | 646 (13.3%) | 57 (5.7%) |
| $2,500 to $2,999 | 447 (9.2%) | 65 (6.5%) |
| $3,000 or more | 238 (4.9%) | 0 (0.0%) |
| Total | 4,867 (100.0%) | 998 (100.0%) |
Physical Housing Characteristics in Norridge
Housing Structures in Norridge
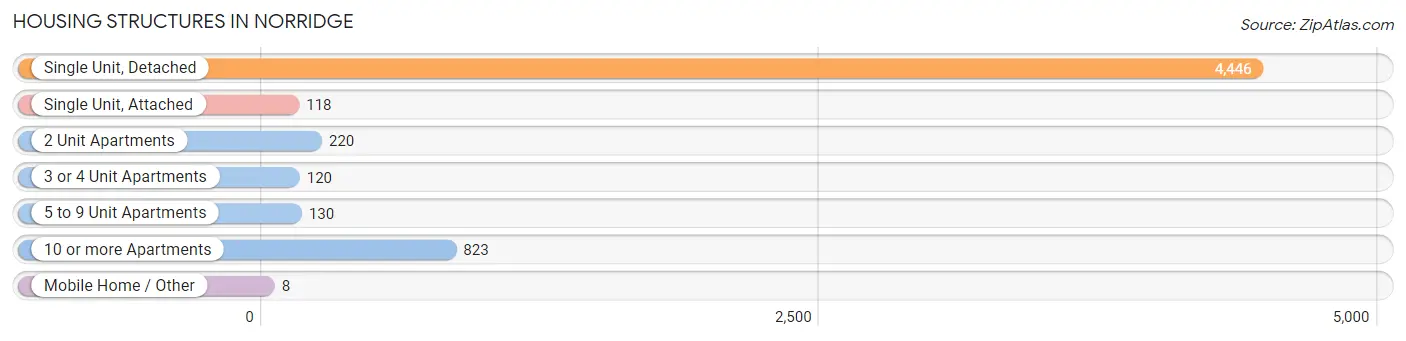
| Structure Type | # Housing Units | % Housing Units |
| Single Unit, Detached | 4,446 | 75.8% |
| Single Unit, Attached | 118 | 2.0% |
| 2 Unit Apartments | 220 | 3.7% |
| 3 or 4 Unit Apartments | 120 | 2.1% |
| 5 to 9 Unit Apartments | 130 | 2.2% |
| 10 or more Apartments | 823 | 14.0% |
| Mobile Home / Other | 8 | 0.1% |
| Total | 5,865 | 100.0% |
Housing Structures by Occupancy in Norridge
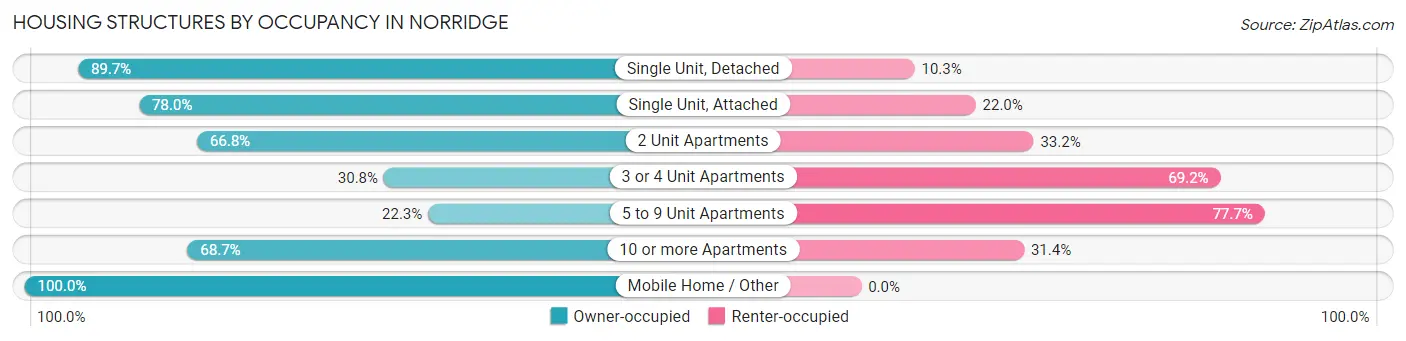
| Structure Type | Owner-occupied | Renter-occupied |
| Single Unit, Detached | 3,989 (89.7%) | 457 (10.3%) |
| Single Unit, Attached | 92 (78.0%) | 26 (22.0%) |
| 2 Unit Apartments | 147 (66.8%) | 73 (33.2%) |
| 3 or 4 Unit Apartments | 37 (30.8%) | 83 (69.2%) |
| 5 to 9 Unit Apartments | 29 (22.3%) | 101 (77.7%) |
| 10 or more Apartments | 565 (68.6%) | 258 (31.4%) |
| Mobile Home / Other | 8 (100.0%) | 0 (0.0%) |
| Total | 4,867 (83.0%) | 998 (17.0%) |
Housing Structures by Number of Rooms in Norridge
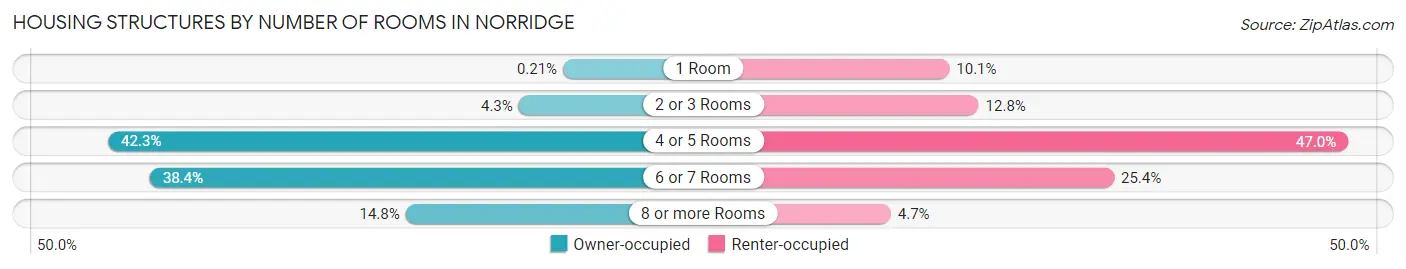
| Number of Rooms | Owner-occupied | Renter-occupied |
| 1 Room | 10 (0.2%) | 101 (10.1%) |
| 2 or 3 Rooms | 210 (4.3%) | 128 (12.8%) |
| 4 or 5 Rooms | 2,058 (42.3%) | 469 (47.0%) |
| 6 or 7 Rooms | 1,870 (38.4%) | 253 (25.4%) |
| 8 or more Rooms | 719 (14.8%) | 47 (4.7%) |
| Total | 4,867 (100.0%) | 998 (100.0%) |
Housing Structure by Heating Type in Norridge
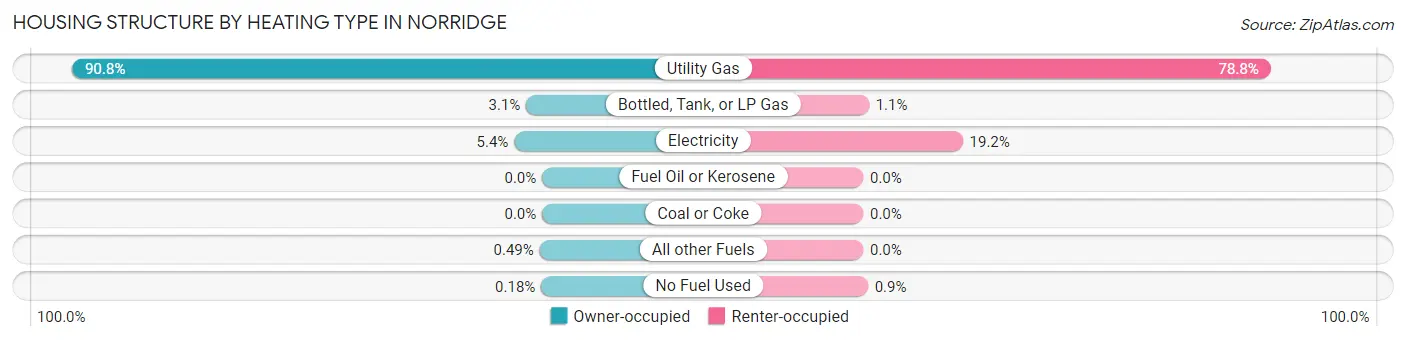
| Heating Type | Owner-occupied | Renter-occupied |
| Utility Gas | 4,421 (90.8%) | 786 (78.8%) |
| Bottled, Tank, or LP Gas | 150 (3.1%) | 11 (1.1%) |
| Electricity | 263 (5.4%) | 192 (19.2%) |
| Fuel Oil or Kerosene | 0 (0.0%) | 0 (0.0%) |
| Coal or Coke | 0 (0.0%) | 0 (0.0%) |
| All other Fuels | 24 (0.5%) | 0 (0.0%) |
| No Fuel Used | 9 (0.2%) | 9 (0.9%) |
| Total | 4,867 (100.0%) | 998 (100.0%) |
Household Vehicle Usage in Norridge
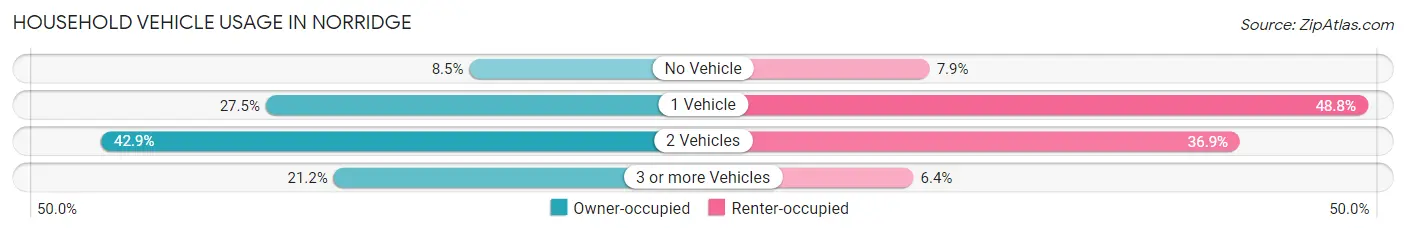
| Vehicles per Household | Owner-occupied | Renter-occupied |
| No Vehicle | 413 (8.5%) | 79 (7.9%) |
| 1 Vehicle | 1,338 (27.5%) | 487 (48.8%) |
| 2 Vehicles | 2,086 (42.9%) | 368 (36.9%) |
| 3 or more Vehicles | 1,030 (21.2%) | 64 (6.4%) |
| Total | 4,867 (100.0%) | 998 (100.0%) |
Real Estate & Mortgages in Norridge
Real Estate and Mortgage Overview in Norridge
| Characteristic | Without Mortgage | With Mortgage |
| Housing Units | 2,634 | 2,233 |
| Median Property Value | $341,300 | $343,100 |
| Median Household Income | $67,988 | $699 |
| Monthly Housing Costs | $801 | $238 |
| Real Estate Taxes | $5,589 | $32 |
Property Value by Mortgage Status in Norridge
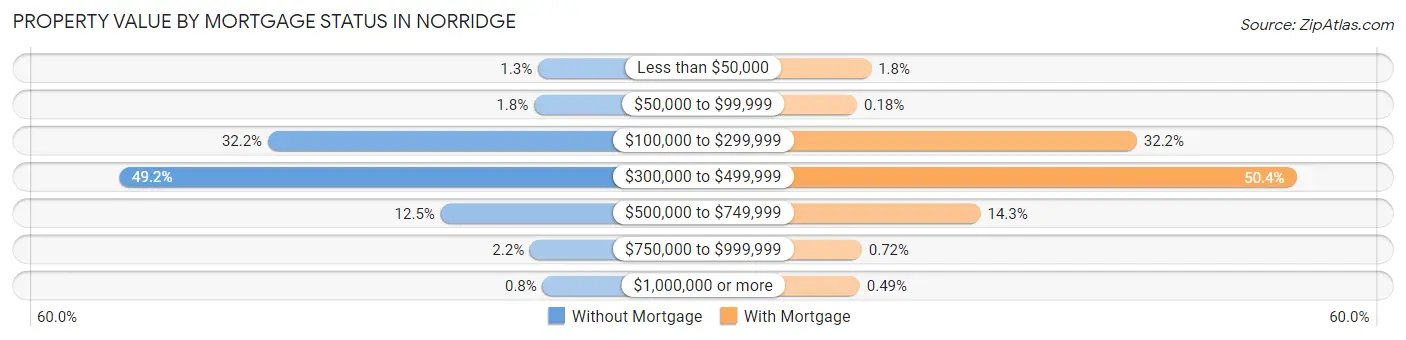
| Property Value | Without Mortgage | With Mortgage |
| Less than $50,000 | 35 (1.3%) | 40 (1.8%) |
| $50,000 to $99,999 | 47 (1.8%) | 4 (0.2%) |
| $100,000 to $299,999 | 848 (32.2%) | 718 (32.2%) |
| $300,000 to $499,999 | 1,296 (49.2%) | 1,125 (50.4%) |
| $500,000 to $749,999 | 328 (12.4%) | 319 (14.3%) |
| $750,000 to $999,999 | 59 (2.2%) | 16 (0.7%) |
| $1,000,000 or more | 21 (0.8%) | 11 (0.5%) |
| Total | 2,634 (100.0%) | 2,233 (100.0%) |
Household Income by Mortgage Status in Norridge
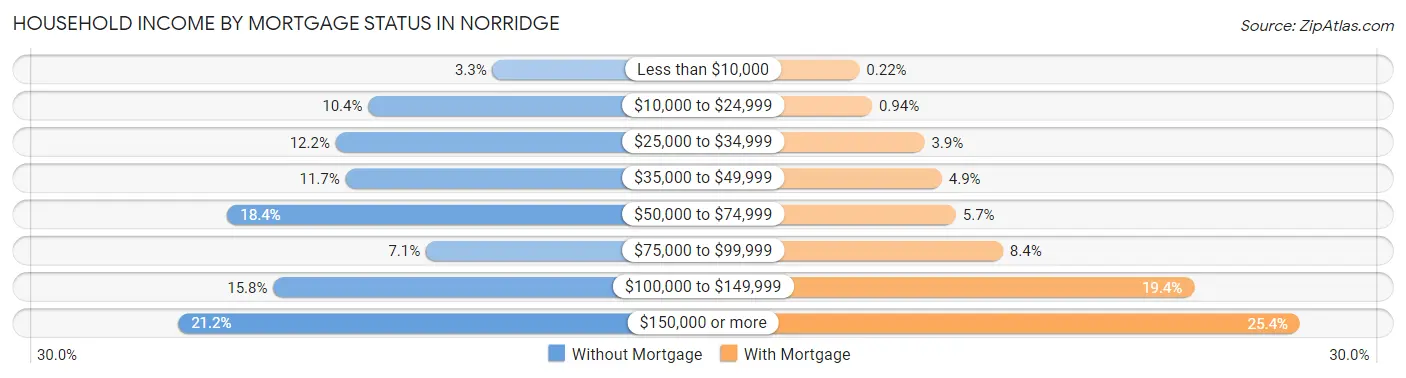
| Household Income | Without Mortgage | With Mortgage |
| Less than $10,000 | 86 (3.3%) | 5 (0.2%) |
| $10,000 to $24,999 | 273 (10.4%) | 21 (0.9%) |
| $25,000 to $34,999 | 322 (12.2%) | 88 (3.9%) |
| $35,000 to $49,999 | 307 (11.7%) | 110 (4.9%) |
| $50,000 to $74,999 | 485 (18.4%) | 128 (5.7%) |
| $75,000 to $99,999 | 186 (7.1%) | 188 (8.4%) |
| $100,000 to $149,999 | 416 (15.8%) | 432 (19.4%) |
| $150,000 or more | 559 (21.2%) | 567 (25.4%) |
| Total | 2,634 (100.0%) | 2,233 (100.0%) |
Property Value to Household Income Ratio in Norridge
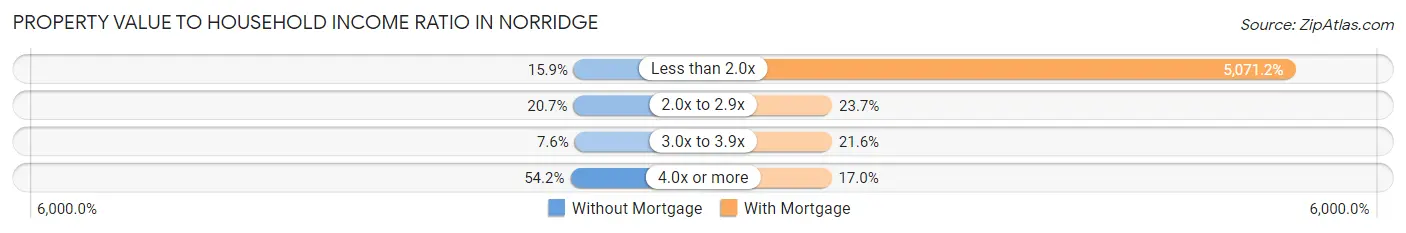
| Value-to-Income Ratio | Without Mortgage | With Mortgage |
| Less than 2.0x | 419 (15.9%) | 113,240 (5,071.2%) |
| 2.0x to 2.9x | 546 (20.7%) | 528 (23.6%) |
| 3.0x to 3.9x | 200 (7.6%) | 483 (21.6%) |
| 4.0x or more | 1,427 (54.2%) | 379 (17.0%) |
| Total | 2,634 (100.0%) | 2,233 (100.0%) |
Real Estate Taxes by Mortgage Status in Norridge
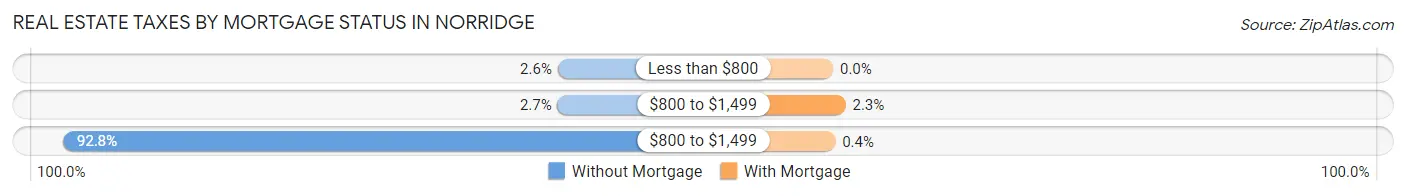
| Property Taxes | Without Mortgage | With Mortgage |
| Less than $800 | 69 (2.6%) | 0 (0.0%) |
| $800 to $1,499 | 70 (2.7%) | 51 (2.3%) |
| $800 to $1,499 | 2,445 (92.8%) | 9 (0.4%) |
| Total | 2,634 (100.0%) | 2,233 (100.0%) |
Health & Disability in Norridge
Health Insurance Coverage by Age in Norridge
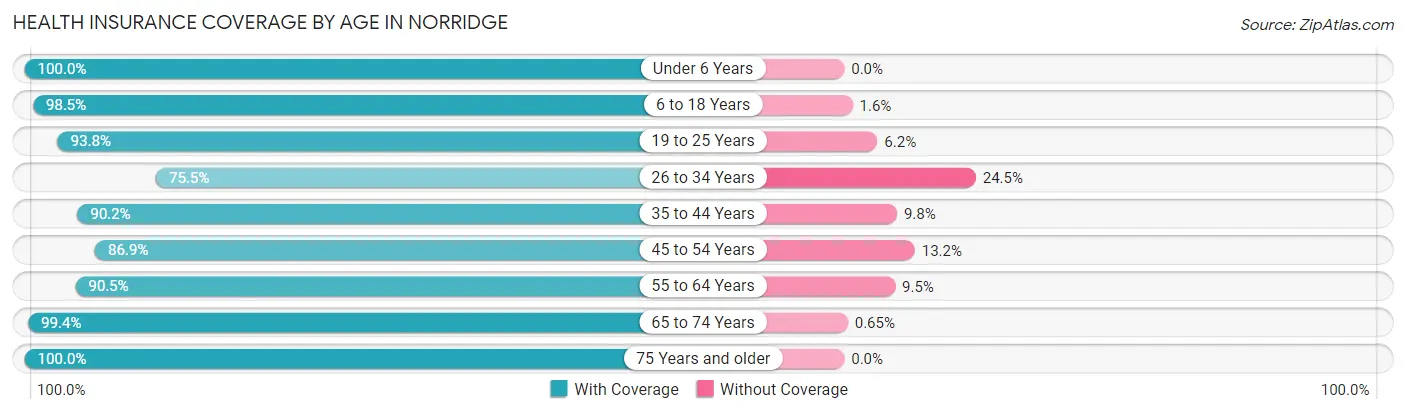
| Age Bracket | With Coverage | Without Coverage |
| Under 6 Years | 768 (100.0%) | 0 (0.0%) |
| 6 to 18 Years | 2,293 (98.5%) | 36 (1.5%) |
| 19 to 25 Years | 624 (93.8%) | 41 (6.2%) |
| 26 to 34 Years | 1,139 (75.5%) | 370 (24.5%) |
| 35 to 44 Years | 1,724 (90.2%) | 188 (9.8%) |
| 45 to 54 Years | 1,678 (86.9%) | 254 (13.2%) |
| 55 to 64 Years | 2,189 (90.5%) | 229 (9.5%) |
| 65 to 74 Years | 1,519 (99.4%) | 10 (0.6%) |
| 75 Years and older | 1,796 (100.0%) | 0 (0.0%) |
| Total | 13,730 (92.4%) | 1,128 (7.6%) |
Health Insurance Coverage by Citizenship Status in Norridge
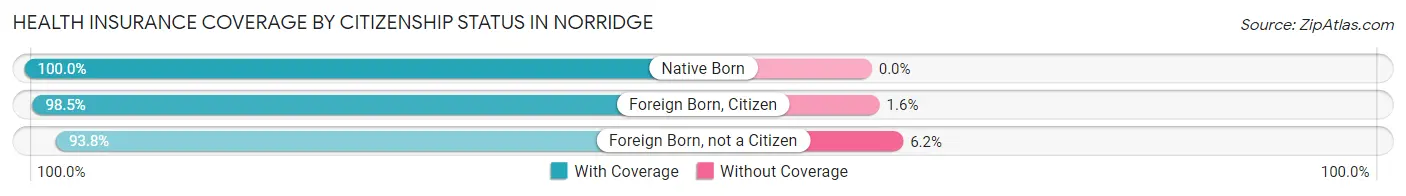
| Citizenship Status | With Coverage | Without Coverage |
| Native Born | 768 (100.0%) | 0 (0.0%) |
| Foreign Born, Citizen | 2,293 (98.5%) | 36 (1.5%) |
| Foreign Born, not a Citizen | 624 (93.8%) | 41 (6.2%) |
Health Insurance Coverage by Household Income in Norridge
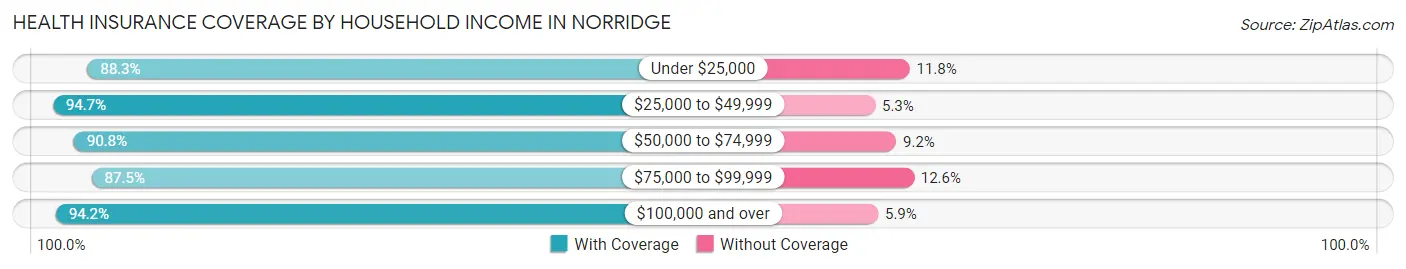
| Household Income | With Coverage | Without Coverage |
| Under $25,000 | 834 (88.2%) | 111 (11.7%) |
| $25,000 to $49,999 | 1,953 (94.7%) | 109 (5.3%) |
| $50,000 to $74,999 | 1,898 (90.8%) | 193 (9.2%) |
| $75,000 to $99,999 | 1,874 (87.5%) | 269 (12.6%) |
| $100,000 and over | 7,161 (94.2%) | 445 (5.9%) |
Public vs Private Health Insurance Coverage by Age in Norridge
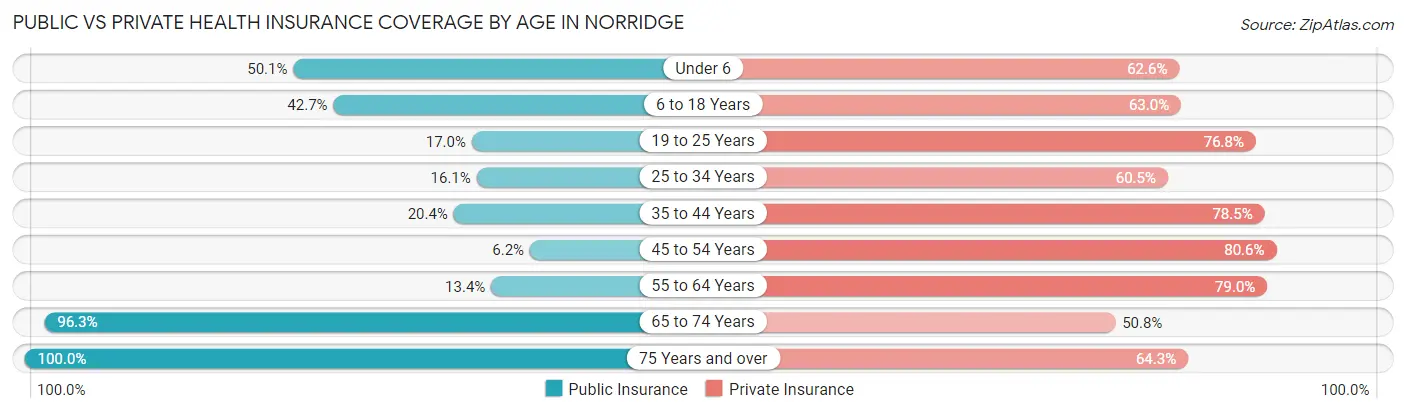
| Age Bracket | Public Insurance | Private Insurance |
| Under 6 | 385 (50.1%) | 481 (62.6%) |
| 6 to 18 Years | 994 (42.7%) | 1,466 (62.9%) |
| 19 to 25 Years | 113 (17.0%) | 511 (76.8%) |
| 25 to 34 Years | 243 (16.1%) | 913 (60.5%) |
| 35 to 44 Years | 389 (20.3%) | 1,500 (78.4%) |
| 45 to 54 Years | 120 (6.2%) | 1,558 (80.6%) |
| 55 to 64 Years | 324 (13.4%) | 1,909 (78.9%) |
| 65 to 74 Years | 1,473 (96.3%) | 776 (50.7%) |
| 75 Years and over | 1,796 (100.0%) | 1,154 (64.2%) |
| Total | 5,837 (39.3%) | 10,268 (69.1%) |
Disability Status by Sex by Age in Norridge
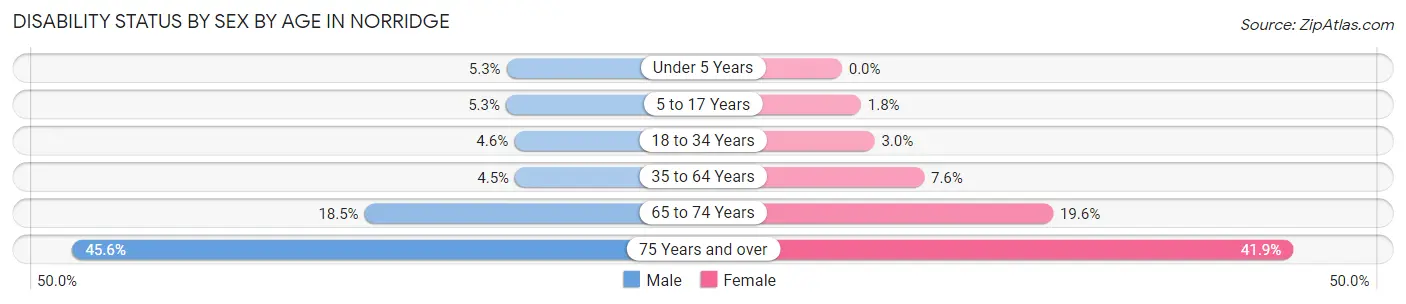
| Age Bracket | Male | Female |
| Under 5 Years | 19 (5.3%) | 0 (0.0%) |
| 5 to 17 Years | 47 (5.3%) | 21 (1.8%) |
| 18 to 34 Years | 55 (4.6%) | 40 (3.0%) |
| 35 to 64 Years | 147 (4.5%) | 228 (7.6%) |
| 65 to 74 Years | 125 (18.5%) | 167 (19.6%) |
| 75 Years and over | 333 (45.6%) | 446 (41.9%) |
Disability Class by Sex by Age in Norridge
Disability Class: Hearing Difficulty
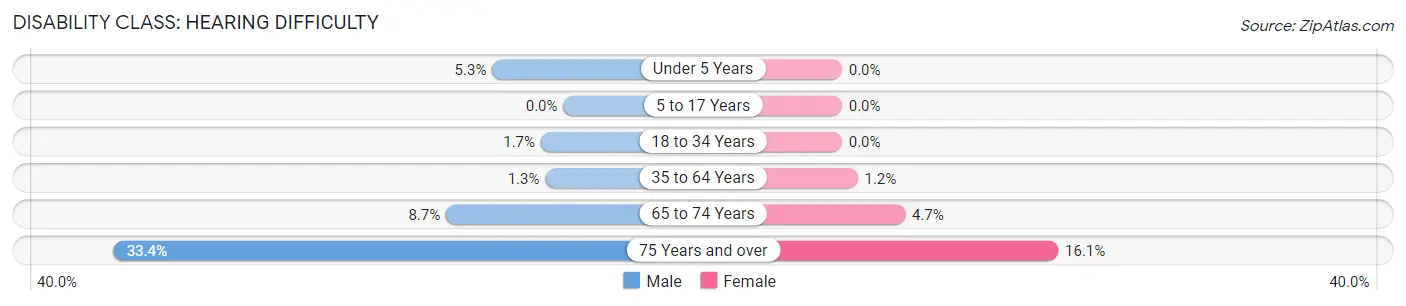
| Age Bracket | Male | Female |
| Under 5 Years | 19 (5.3%) | 0 (0.0%) |
| 5 to 17 Years | 0 (0.0%) | 0 (0.0%) |
| 18 to 34 Years | 20 (1.7%) | 0 (0.0%) |
| 35 to 64 Years | 44 (1.3%) | 35 (1.2%) |
| 65 to 74 Years | 59 (8.7%) | 40 (4.7%) |
| 75 Years and over | 244 (33.4%) | 171 (16.1%) |
Disability Class: Vision Difficulty
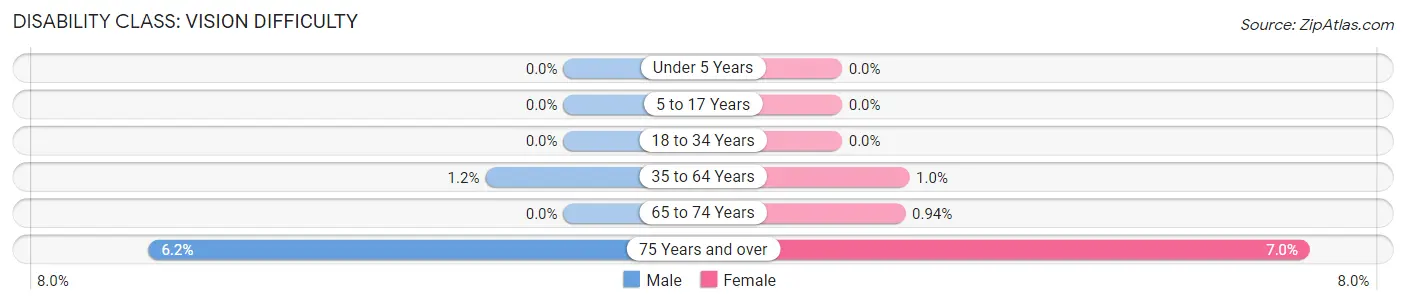
| Age Bracket | Male | Female |
| Under 5 Years | 0 (0.0%) | 0 (0.0%) |
| 5 to 17 Years | 0 (0.0%) | 0 (0.0%) |
| 18 to 34 Years | 0 (0.0%) | 0 (0.0%) |
| 35 to 64 Years | 38 (1.2%) | 30 (1.0%) |
| 65 to 74 Years | 0 (0.0%) | 8 (0.9%) |
| 75 Years and over | 45 (6.2%) | 74 (7.0%) |
Disability Class: Cognitive Difficulty
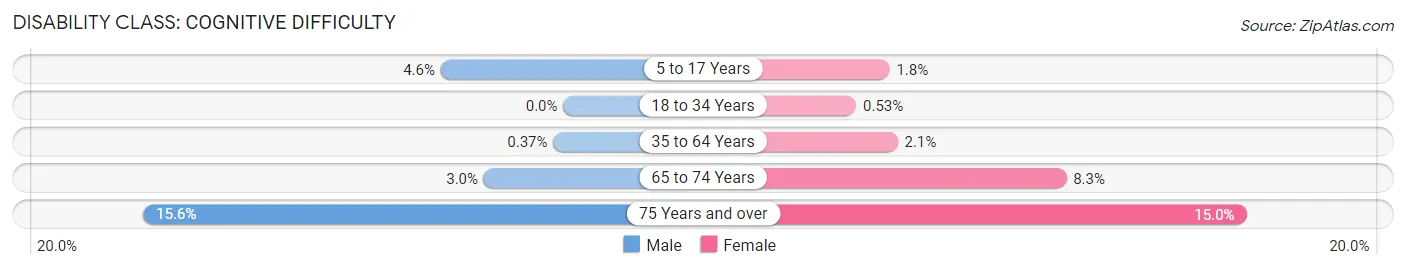
| Age Bracket | Male | Female |
| 5 to 17 Years | 40 (4.5%) | 21 (1.8%) |
| 18 to 34 Years | 0 (0.0%) | 7 (0.5%) |
| 35 to 64 Years | 12 (0.4%) | 62 (2.1%) |
| 65 to 74 Years | 20 (2.9%) | 71 (8.3%) |
| 75 Years and over | 114 (15.6%) | 160 (15.0%) |
Disability Class: Ambulatory Difficulty
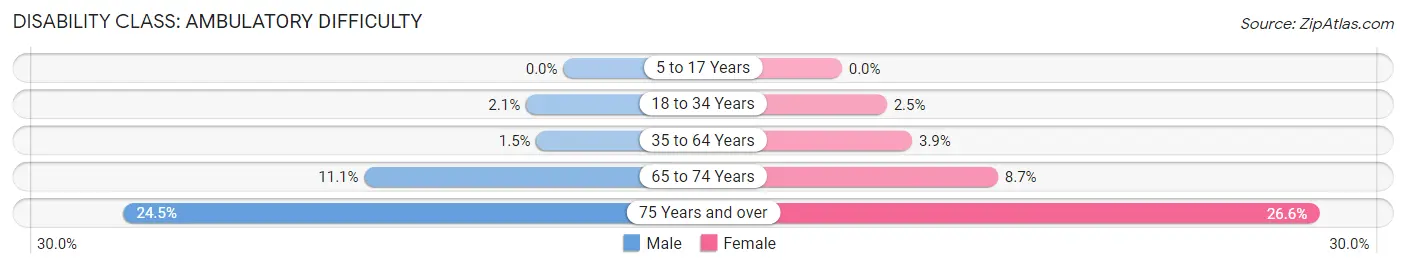
| Age Bracket | Male | Female |
| 5 to 17 Years | 0 (0.0%) | 0 (0.0%) |
| 18 to 34 Years | 25 (2.1%) | 33 (2.5%) |
| 35 to 64 Years | 49 (1.5%) | 117 (3.9%) |
| 65 to 74 Years | 75 (11.1%) | 74 (8.7%) |
| 75 Years and over | 179 (24.5%) | 283 (26.6%) |
Disability Class: Self-Care Difficulty
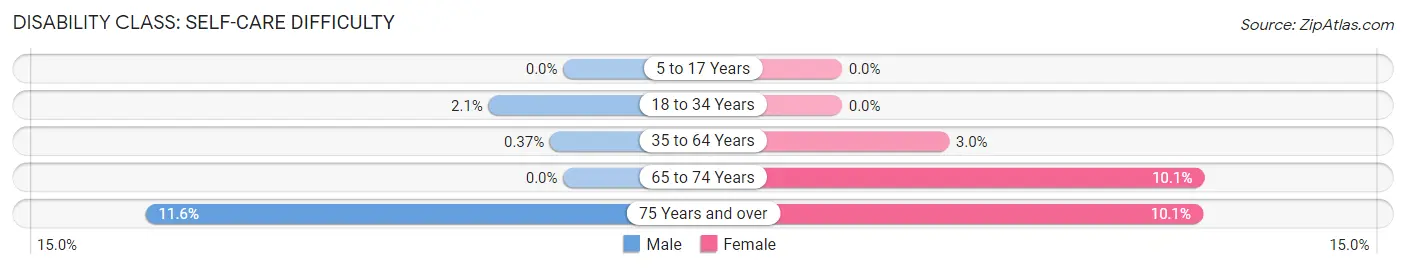
| Age Bracket | Male | Female |
| 5 to 17 Years | 0 (0.0%) | 0 (0.0%) |
| 18 to 34 Years | 25 (2.1%) | 0 (0.0%) |
| 35 to 64 Years | 12 (0.4%) | 89 (3.0%) |
| 65 to 74 Years | 0 (0.0%) | 86 (10.1%) |
| 75 Years and over | 85 (11.6%) | 107 (10.1%) |
Technology Access in Norridge
Computing Device Access in Norridge
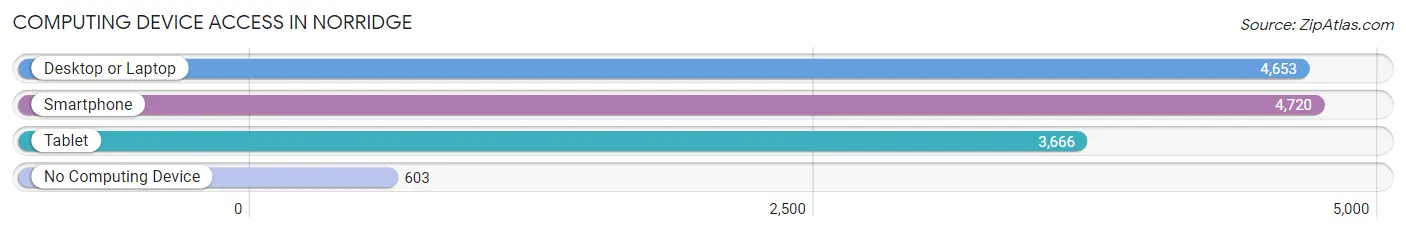
| Device Type | # Households | % Households |
| Desktop or Laptop | 4,653 | 79.3% |
| Smartphone | 4,720 | 80.5% |
| Tablet | 3,666 | 62.5% |
| No Computing Device | 603 | 10.3% |
| Total | 5,865 | 100.0% |
Internet Access in Norridge
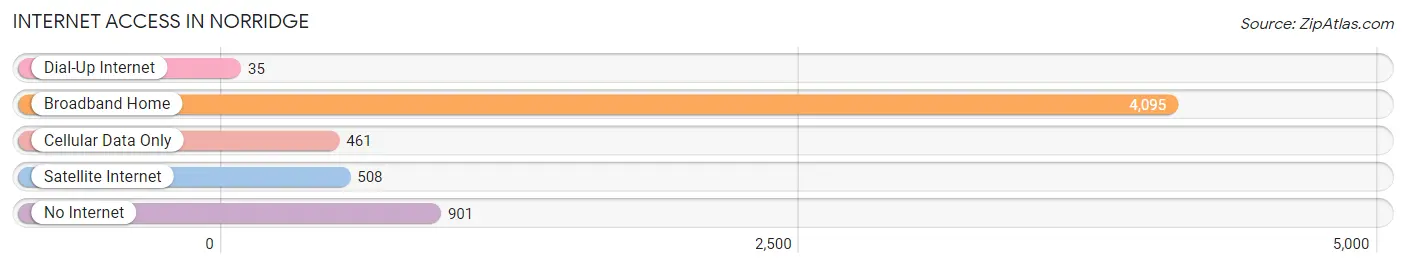
| Internet Type | # Households | % Households |
| Dial-Up Internet | 35 | 0.6% |
| Broadband Home | 4,095 | 69.8% |
| Cellular Data Only | 461 | 7.9% |
| Satellite Internet | 508 | 8.7% |
| No Internet | 901 | 15.4% |
| Total | 5,865 | 100.0% |
Norridge Summary
Norridge, Illinois is a village located in Cook County, Illinois, United States. It is a suburb of Chicago, located approximately 13 miles northwest of the city's downtown. As of the 2010 census, the village had a population of 14,572.
History
Norridge was first settled in the late 19th century by German and Irish immigrants. The village was originally known as "Johnsons Grove" after the Johnson family, who were among the first settlers. The village was officially incorporated in 1948, and the name was changed to Norridge in 1949. The name is derived from the combination of the names of two of the village's original subdivisions, Norwood Park and Ridge Park.
Geography
Norridge is located at 41°59'25"N 87°48'17"W (41.990278, -87.804608). According to the 2010 census, the village has a total area of 2.2 square miles, all land.
Economy
The economy of Norridge is largely based on retail and services. The village is home to a variety of shopping centers, including the Harlem Irving Plaza, the Norridge Shopping Center, and the Norridge Commons. The village is also home to a variety of restaurants, including Italian, Mexican, and Chinese cuisine.
Demographics
As of the 2010 census, there were 14,572 people, 5,845 households, and 3,845 families residing in the village. The population density was 6,637.2 people per square mile. The racial makeup of the village was 79.2% White, 1.2% African American, 0.2% Native American, 11.7% Asian, 0.1% Pacific Islander, 5.2% from other races, and 2.6% from two or more races. Hispanic or Latino of any race were 13.3% of the population.
The median income for a household in the village was $54,945, and the median income for a family was $63,945. The per capita income for the village was $25,945. About 4.2% of families and 5.7% of the population were below the poverty line, including 7.2% of those under age 18 and 4.2% of those age 65 or over.
Common Questions
What is Per Capita Income in Norridge?
Per Capita income in Norridge is $45,038.
What is the Median Family Income in Norridge?
Median Family Income in Norridge is $102,188.
What is the Median Household income in Norridge?
Median Household Income in Norridge is $84,539.
What is Income or Wage Gap in Norridge?
Income or Wage Gap in Norridge is 23.5%.
Women in Norridge earn 76.5 cents for every dollar earned by a man.
What is Inequality or Gini Index in Norridge?
Inequality or Gini Index in Norridge is 0.45.
What is the Total Population of Norridge?
Total Population of Norridge is 15,291.
What is the Total Male Population of Norridge?
Total Male Population of Norridge is 7,278.
What is the Total Female Population of Norridge?
Total Female Population of Norridge is 8,013.
What is the Ratio of Males per 100 Females in Norridge?
There are 90.83 Males per 100 Females in Norridge.
What is the Ratio of Females per 100 Males in Norridge?
There are 110.10 Females per 100 Males in Norridge.
What is the Median Population Age in Norridge?
Median Population Age in Norridge is 47.2 Years.
What is the Average Family Size in Norridge
Average Family Size in Norridge is 3.1 People.
What is the Average Household Size in Norridge
Average Household Size in Norridge is 2.5 People.
How Large is the Labor Force in Norridge?
There are 7,689 People in the Labor Forcein in Norridge.
What is the Percentage of People in the Labor Force in Norridge?
60.1% of People are in the Labor Force in Norridge.
What is the Unemployment Rate in Norridge?
Unemployment Rate in Norridge is 6.3%.