Lockport, IL Map & Demographics
Lockport Map
Lockport Overview
$43,957
PER CAPITA INCOME
$120,740
AVG FAMILY INCOME
$106,923
AVG HOUSEHOLD INCOME
23.0%
WAGE / INCOME GAP [ % ]
77.0¢/ $1
WAGE / INCOME GAP [ $ ]
$11,578
FAMILY INCOME DEFICIT
0.36
INEQUALITY / GINI INDEX
26,119
TOTAL POPULATION
12,788
MALE POPULATION
13,331
FEMALE POPULATION
95.93
MALES / 100 FEMALES
104.25
FEMALES / 100 MALES
38.0
MEDIAN AGE
3.2
AVG FAMILY SIZE
2.7
AVG HOUSEHOLD SIZE
14,964
LABOR FORCE [ PEOPLE ]
73.0%
PERCENT IN LABOR FORCE
4.6%
UNEMPLOYMENT RATE
Lockport Zip Codes
Income in Lockport
Income Overview in Lockport
Per Capita Income in Lockport is $43,957, while median incomes of families and households are $120,740 and $106,923 respectively.
| Characteristic | Number | Measure |
| Per Capita Income | 26,119 | $43,957 |
| Median Family Income | 6,842 | $120,740 |
| Mean Family Income | 6,842 | $131,951 |
| Median Household Income | 9,507 | $106,923 |
| Mean Household Income | 9,507 | $119,521 |
| Income Deficit | 6,842 | $11,578 |
| Wage / Income Gap (%) | 26,119 | 22.96% |
| Wage / Income Gap ($) | 26,119 | 77.04¢ per $1 |
| Gini / Inequality Index | 26,119 | 0.36 |
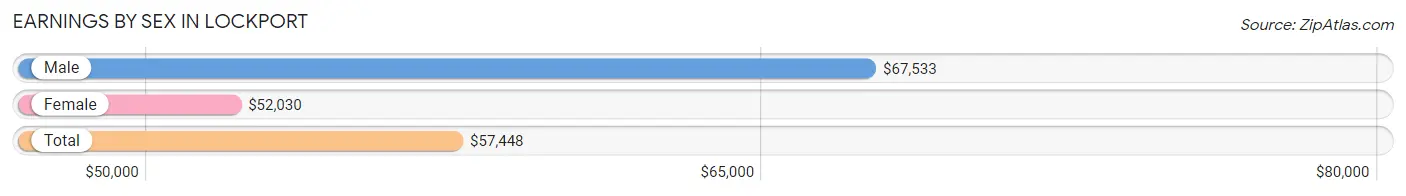
Earnings by Sex in Lockport
Average Earnings in Lockport are $57,448, $67,533 for men and $52,030 for women, a difference of 23.0%.
| Sex | Number | Average Earnings |
| Male | 8,016 (52.9%) | $67,533 |
| Female | 7,122 (47.0%) | $52,030 |
| Total | 15,138 (100.0%) | $57,448 |
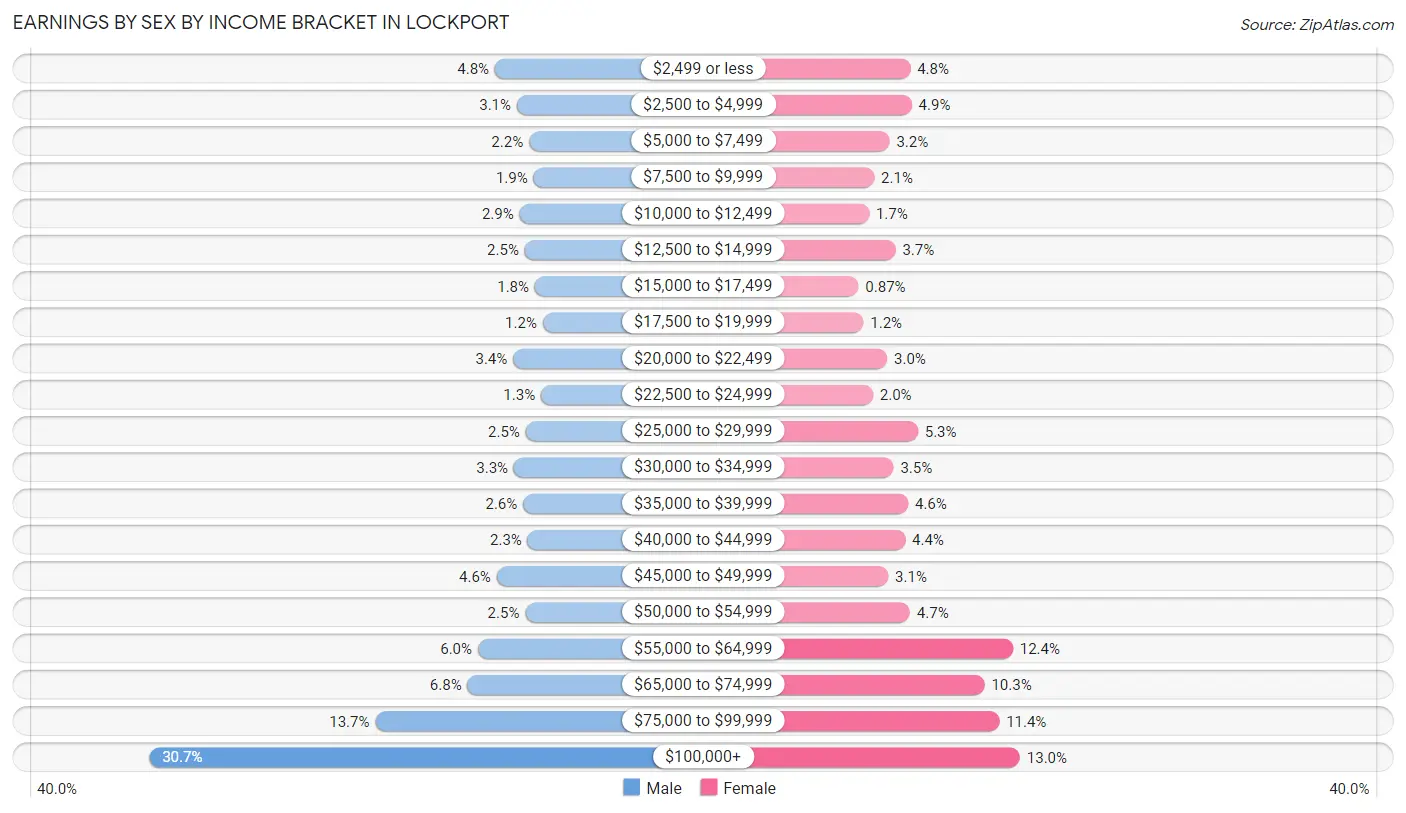
Earnings by Sex by Income Bracket in Lockport
The most common earnings brackets in Lockport are $100,000+ for men (2,458 | 30.7%) and $100,000+ for women (924 | 13.0%).
| Income | Male | Female |
| $2,499 or less | 381 (4.8%) | 338 (4.8%) |
| $2,500 to $4,999 | 249 (3.1%) | 346 (4.9%) |
| $5,000 to $7,499 | 176 (2.2%) | 228 (3.2%) |
| $7,500 to $9,999 | 149 (1.9%) | 146 (2.1%) |
| $10,000 to $12,499 | 233 (2.9%) | 118 (1.7%) |
| $12,500 to $14,999 | 202 (2.5%) | 260 (3.6%) |
| $15,000 to $17,499 | 141 (1.8%) | 62 (0.9%) |
| $17,500 to $19,999 | 94 (1.2%) | 88 (1.2%) |
| $20,000 to $22,499 | 272 (3.4%) | 215 (3.0%) |
| $22,500 to $24,999 | 104 (1.3%) | 139 (1.9%) |
| $25,000 to $29,999 | 196 (2.5%) | 379 (5.3%) |
| $30,000 to $34,999 | 267 (3.3%) | 249 (3.5%) |
| $35,000 to $39,999 | 212 (2.6%) | 327 (4.6%) |
| $40,000 to $44,999 | 184 (2.3%) | 311 (4.4%) |
| $45,000 to $49,999 | 370 (4.6%) | 221 (3.1%) |
| $50,000 to $54,999 | 199 (2.5%) | 337 (4.7%) |
| $55,000 to $64,999 | 483 (6.0%) | 886 (12.4%) |
| $65,000 to $74,999 | 546 (6.8%) | 735 (10.3%) |
| $75,000 to $99,999 | 1,100 (13.7%) | 813 (11.4%) |
| $100,000+ | 2,458 (30.7%) | 924 (13.0%) |
| Total | 8,016 (100.0%) | 7,122 (100.0%) |
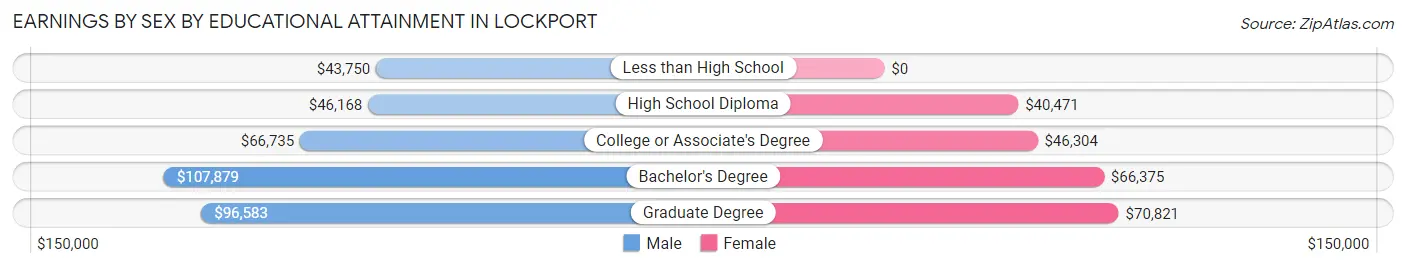
Earnings by Sex by Educational Attainment in Lockport
Average earnings in Lockport are $76,388 for men and $58,108 for women, a difference of 23.9%. Men with an educational attainment of bachelor's degree enjoy the highest average annual earnings of $107,879, while those with less than high school education earn the least with $43,750. Women with an educational attainment of graduate degree earn the most with the average annual earnings of $70,821, while those with high school diploma education have the smallest earnings of $40,471.
| Educational Attainment | Male Income | Female Income |
| Less than High School | $43,750 | $0 |
| High School Diploma | $46,168 | $40,471 |
| College or Associate's Degree | $66,735 | $46,304 |
| Bachelor's Degree | $107,879 | $66,375 |
| Graduate Degree | $96,583 | $70,821 |
| Total | $76,388 | $58,108 |
Family Income in Lockport
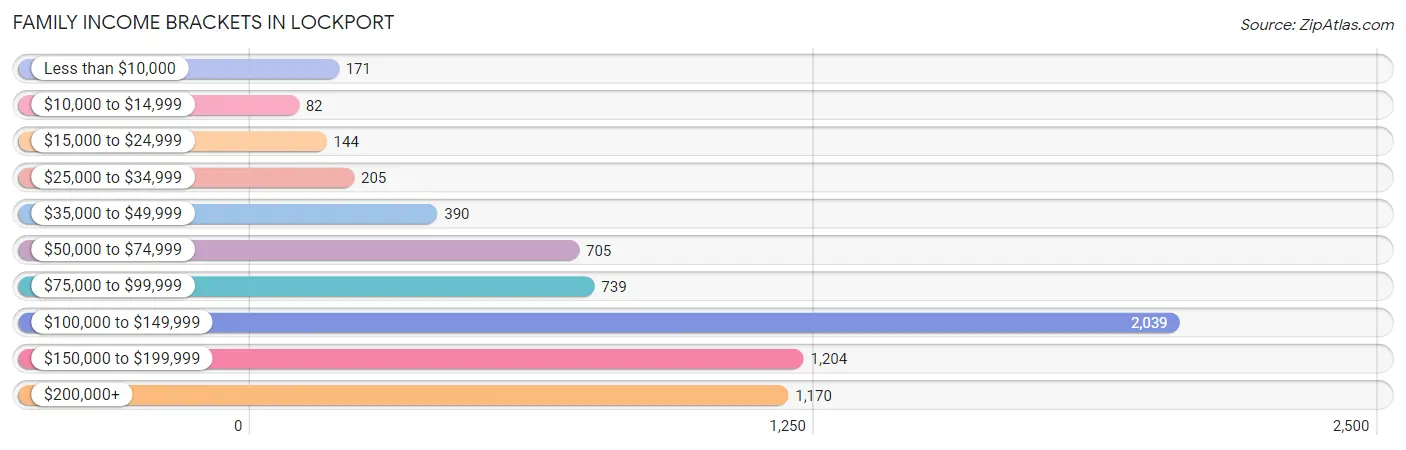
Family Income Brackets in Lockport
According to the Lockport family income data, there are 2,039 families falling into the $100,000 to $149,999 income range, which is the most common income bracket and makes up 29.8% of all families. Conversely, the $10,000 to $14,999 income bracket is the least frequent group with only 82 families (1.2%) belonging to this category.
| Income Bracket | # Families | % Families |
| Less than $10,000 | 171 | 2.5% |
| $10,000 to $14,999 | 82 | 1.2% |
| $15,000 to $24,999 | 144 | 2.1% |
| $25,000 to $34,999 | 205 | 3.0% |
| $35,000 to $49,999 | 390 | 5.7% |
| $50,000 to $74,999 | 705 | 10.3% |
| $75,000 to $99,999 | 739 | 10.8% |
| $100,000 to $149,999 | 2,039 | 29.8% |
| $150,000 to $199,999 | 1,204 | 17.6% |
| $200,000+ | 1,170 | 17.1% |
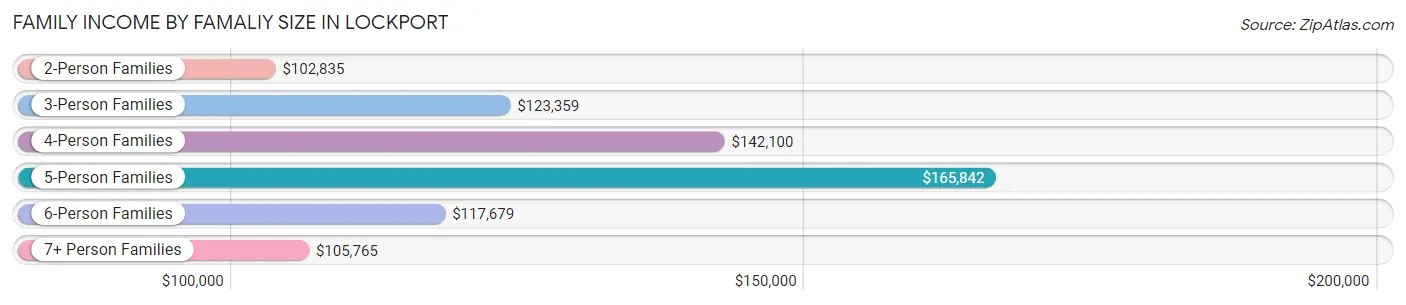
Family Income by Famaliy Size in Lockport
5-person families (669 | 9.8%) account for the highest median family income in Lockport with $165,842 per family, while 2-person families (2,811 | 41.1%) have the highest median income of $51,418 per family member.
| Income Bracket | # Families | Median Income |
| 2-Person Families | 2,811 (41.1%) | $102,835 |
| 3-Person Families | 1,929 (28.2%) | $123,359 |
| 4-Person Families | 1,158 (16.9%) | $142,100 |
| 5-Person Families | 669 (9.8%) | $165,842 |
| 6-Person Families | 117 (1.7%) | $117,679 |
| 7+ Person Families | 158 (2.3%) | $105,765 |
| Total | 6,842 (100.0%) | $120,740 |
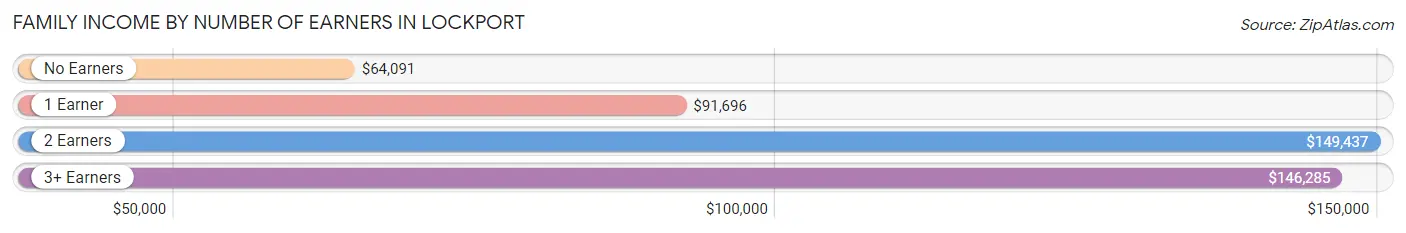
Family Income by Number of Earners in Lockport
The median family income in Lockport is $120,740, with families comprising 2 earners (3,224) having the highest median family income of $149,437, while families with no earners (642) have the lowest median family income of $64,091, accounting for 47.1% and 9.4% of families, respectively.
| Number of Earners | # Families | Median Income |
| No Earners | 642 (9.4%) | $64,091 |
| 1 Earner | 1,919 (28.1%) | $91,696 |
| 2 Earners | 3,224 (47.1%) | $149,437 |
| 3+ Earners | 1,057 (15.4%) | $146,285 |
| Total | 6,842 (100.0%) | $120,740 |
Household Income in Lockport
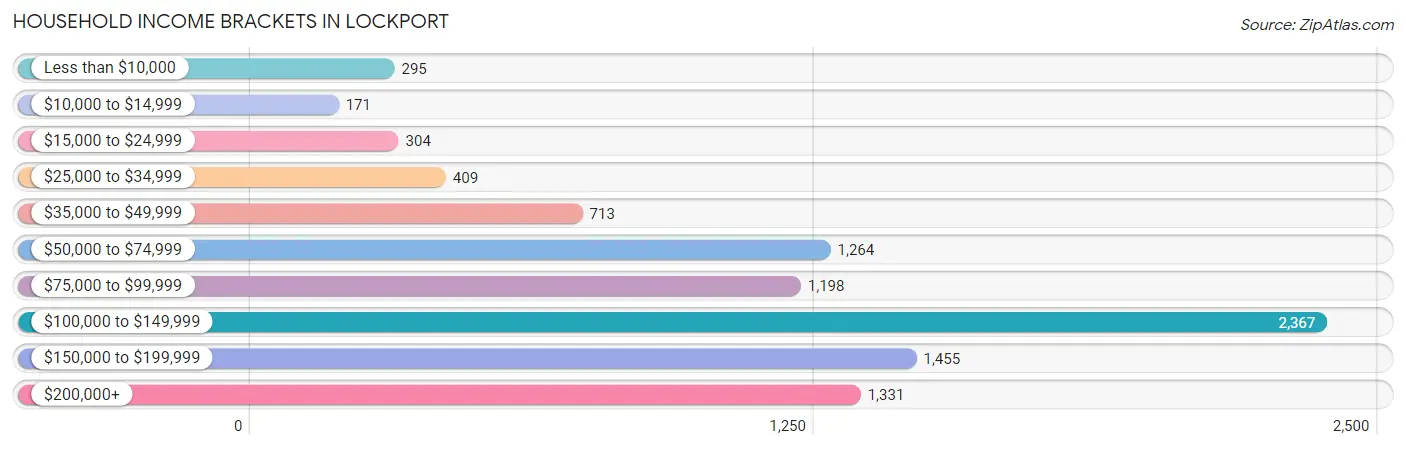
Household Income Brackets in Lockport
With 2,367 households falling in the category, the $100,000 to $149,999 income range is the most frequent in Lockport, accounting for 24.9% of all households. In contrast, only 171 households (1.8%) fall into the $10,000 to $14,999 income bracket, making it the least populous group.
| Income Bracket | # Households | % Households |
| Less than $10,000 | 295 | 3.1% |
| $10,000 to $14,999 | 171 | 1.8% |
| $15,000 to $24,999 | 304 | 3.2% |
| $25,000 to $34,999 | 409 | 4.3% |
| $35,000 to $49,999 | 713 | 7.5% |
| $50,000 to $74,999 | 1,264 | 13.3% |
| $75,000 to $99,999 | 1,198 | 12.6% |
| $100,000 to $149,999 | 2,367 | 24.9% |
| $150,000 to $199,999 | 1,455 | 15.3% |
| $200,000+ | 1,331 | 14.0% |
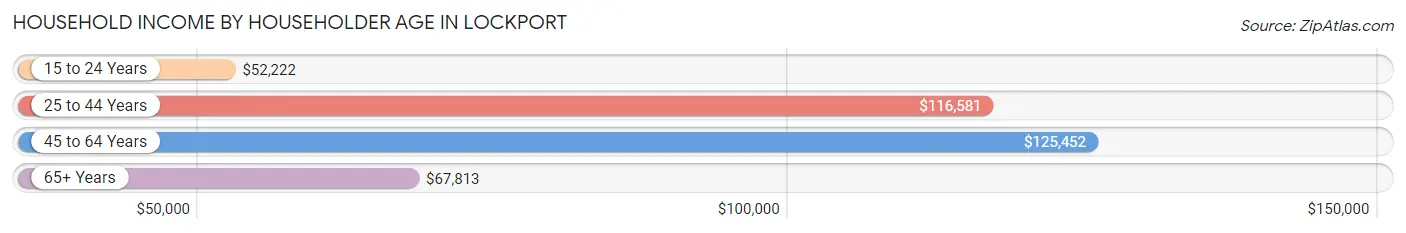
Household Income by Householder Age in Lockport
The median household income in Lockport is $106,923, with the highest median household income of $125,452 found in the 45 to 64 years age bracket for the primary householder. A total of 4,065 households (42.8%) fall into this category. Meanwhile, the 15 to 24 years age bracket for the primary householder has the lowest median household income of $52,222, with 116 households (1.2%) in this group.
| Income Bracket | # Households | Median Income |
| 15 to 24 Years | 116 (1.2%) | $52,222 |
| 25 to 44 Years | 3,469 (36.5%) | $116,581 |
| 45 to 64 Years | 4,065 (42.8%) | $125,452 |
| 65+ Years | 1,857 (19.5%) | $67,813 |
| Total | 9,507 (100.0%) | $106,923 |
Poverty in Lockport
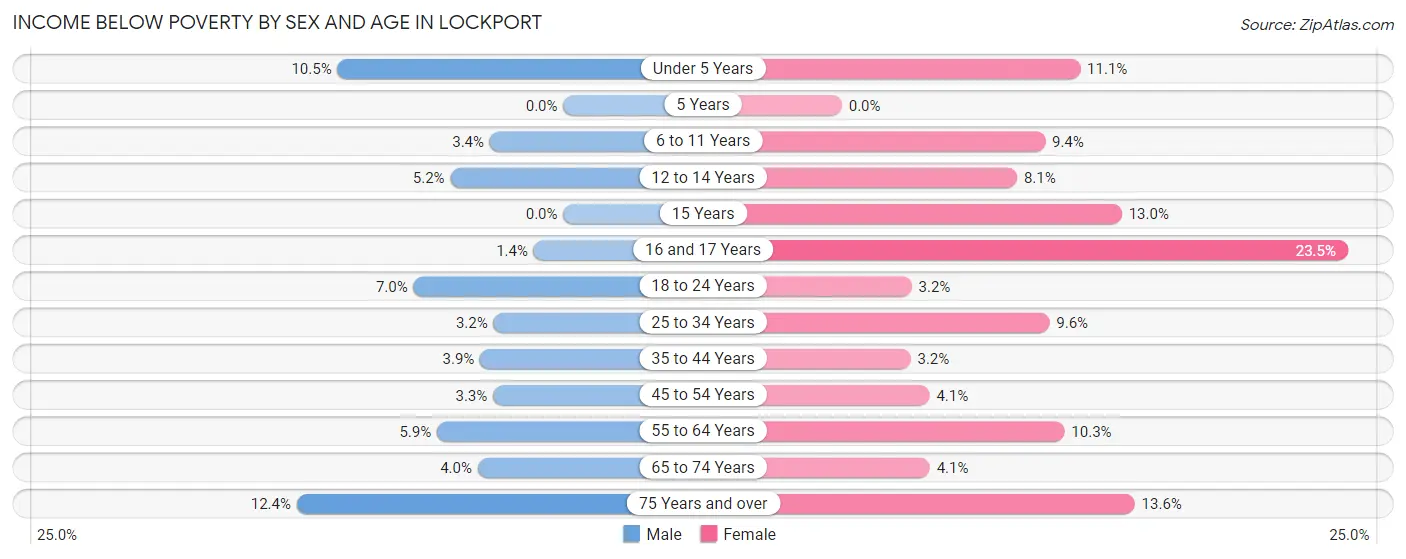
Income Below Poverty by Sex and Age in Lockport
With 4.6% poverty level for males and 8.0% for females among the residents of Lockport, 75 year old and over males and 16 and 17 year old females are the most vulnerable to poverty, with 37 males (12.4%) and 162 females (23.5%) in their respective age groups living below the poverty level.
| Age Bracket | Male | Female |
| Under 5 Years | 74 (10.5%) | 66 (11.1%) |
| 5 Years | 0 (0.0%) | 0 (0.0%) |
| 6 to 11 Years | 35 (3.4%) | 105 (9.4%) |
| 12 to 14 Years | 27 (5.2%) | 59 (8.1%) |
| 15 Years | 0 (0.0%) | 33 (13.0%) |
| 16 and 17 Years | 5 (1.4%) | 162 (23.5%) |
| 18 to 24 Years | 73 (7.0%) | 29 (3.2%) |
| 25 to 34 Years | 52 (3.2%) | 172 (9.6%) |
| 35 to 44 Years | 73 (3.9%) | 57 (3.2%) |
| 45 to 54 Years | 73 (3.3%) | 80 (4.1%) |
| 55 to 64 Years | 96 (5.9%) | 154 (10.3%) |
| 65 to 74 Years | 37 (4.0%) | 45 (4.1%) |
| 75 Years and over | 37 (12.4%) | 101 (13.6%) |
| Total | 582 (4.6%) | 1,063 (8.0%) |
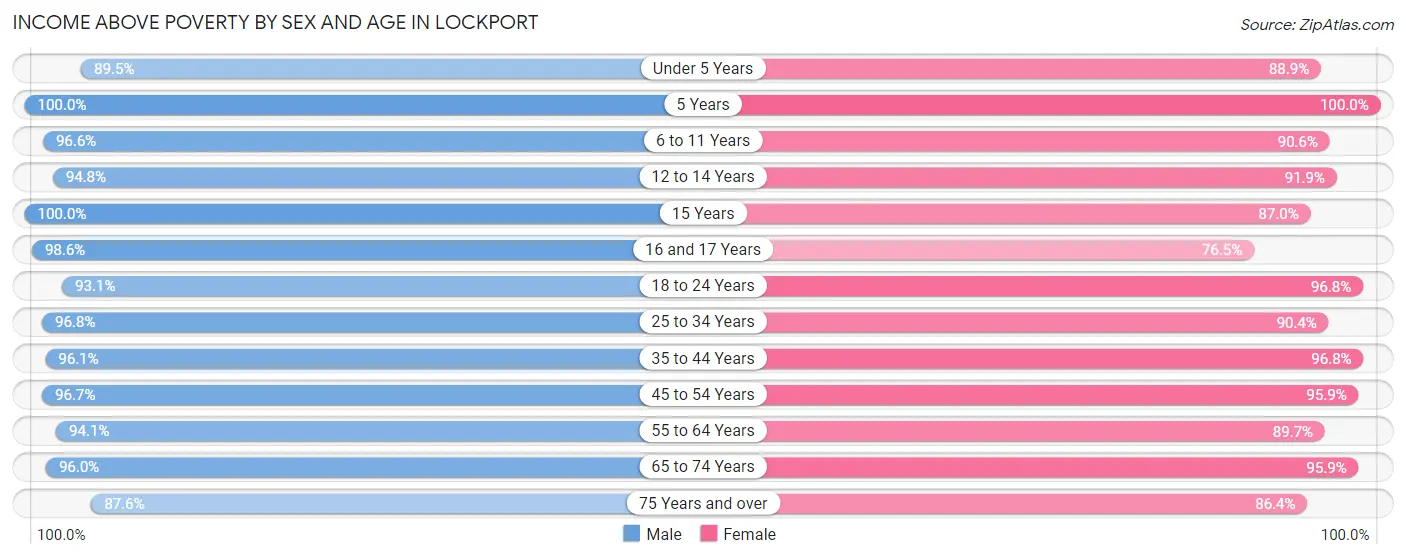
Income Above Poverty by Sex and Age in Lockport
According to the poverty statistics in Lockport, males aged 5 years and females aged 5 years are the age groups that are most secure financially, with 100.0% of males and 100.0% of females in these age groups living above the poverty line.
| Age Bracket | Male | Female |
| Under 5 Years | 632 (89.5%) | 531 (88.9%) |
| 5 Years | 184 (100.0%) | 116 (100.0%) |
| 6 to 11 Years | 991 (96.6%) | 1,008 (90.6%) |
| 12 to 14 Years | 488 (94.8%) | 667 (91.9%) |
| 15 Years | 230 (100.0%) | 221 (87.0%) |
| 16 and 17 Years | 361 (98.6%) | 528 (76.5%) |
| 18 to 24 Years | 978 (93.0%) | 866 (96.8%) |
| 25 to 34 Years | 1,552 (96.8%) | 1,614 (90.4%) |
| 35 to 44 Years | 1,819 (96.1%) | 1,730 (96.8%) |
| 45 to 54 Years | 2,163 (96.7%) | 1,887 (95.9%) |
| 55 to 64 Years | 1,543 (94.1%) | 1,337 (89.7%) |
| 65 to 74 Years | 894 (96.0%) | 1,059 (95.9%) |
| 75 Years and over | 262 (87.6%) | 642 (86.4%) |
| Total | 12,097 (95.4%) | 12,206 (92.0%) |
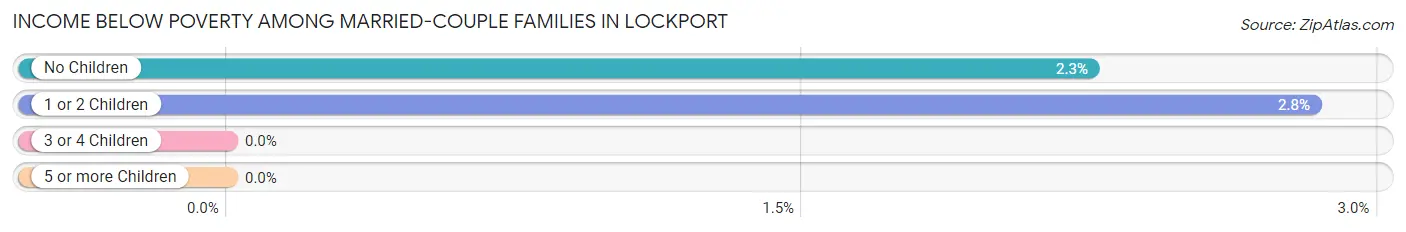
Income Below Poverty Among Married-Couple Families in Lockport
The poverty statistics for married-couple families in Lockport show that 2.2% or 119 of the total 5,451 families live below the poverty line. Families with 1 or 2 children have the highest poverty rate of 2.8%, comprising of 55 families. On the other hand, families with 3 or 4 children have the lowest poverty rate of 0.0%, which includes 0 families.
| Children | Above Poverty | Below Poverty |
| No Children | 2,776 (97.8%) | 64 (2.2%) |
| 1 or 2 Children | 1,891 (97.2%) | 55 (2.8%) |
| 3 or 4 Children | 584 (100.0%) | 0 (0.0%) |
| 5 or more Children | 81 (100.0%) | 0 (0.0%) |
| Total | 5,332 (97.8%) | 119 (2.2%) |
Income Below Poverty Among Single-Parent Households in Lockport
According to the poverty data in Lockport, 13.1% or 49 single-father households and 15.9% or 162 single-mother households are living below the poverty line. Among single-father households, those with 1 or 2 children have the highest poverty rate, with 49 households (35.5%) experiencing poverty. Likewise, among single-mother households, those with 3 or 4 children have the highest poverty rate, with 25 households (36.2%) falling below the poverty line.
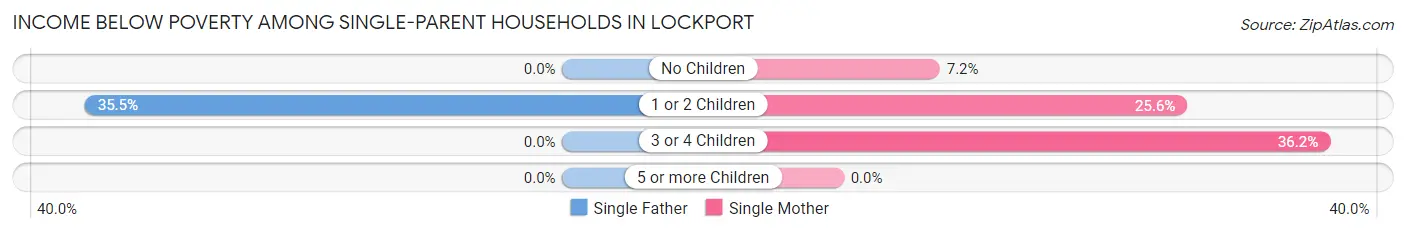
| Children | Single Father | Single Mother |
| No Children | 0 (0.0%) | 39 (7.2%) |
| 1 or 2 Children | 49 (35.5%) | 98 (25.6%) |
| 3 or 4 Children | 0 (0.0%) | 25 (36.2%) |
| 5 or more Children | 0 (0.0%) | 0 (0.0%) |
| Total | 49 (13.1%) | 162 (15.9%) |
Income Below Poverty Among Married-Couple vs Single-Parent Households in Lockport
The poverty data for Lockport shows that 119 of the married-couple family households (2.2%) and 211 of the single-parent households (15.2%) are living below the poverty level. Within the married-couple family households, those with 1 or 2 children have the highest poverty rate, with 55 households (2.8%) falling below the poverty line. Among the single-parent households, those with 3 or 4 children have the highest poverty rate, with 25 household (28.7%) living below poverty.
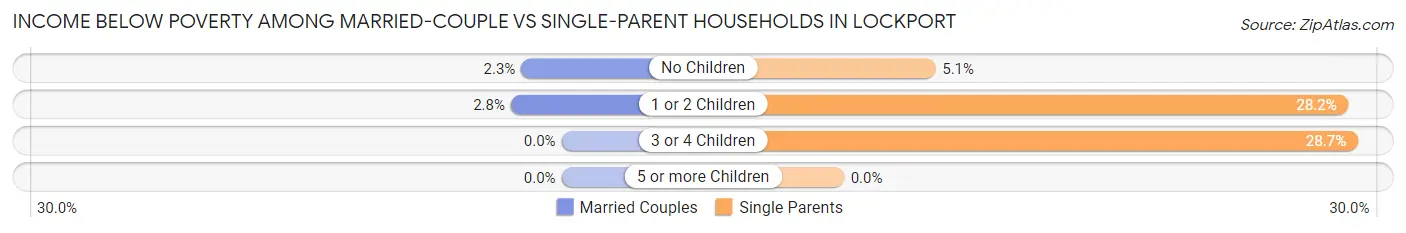
| Children | Married-Couple Families | Single-Parent Households |
| No Children | 64 (2.2%) | 39 (5.1%) |
| 1 or 2 Children | 55 (2.8%) | 147 (28.2%) |
| 3 or 4 Children | 0 (0.0%) | 25 (28.7%) |
| 5 or more Children | 0 (0.0%) | 0 (0.0%) |
| Total | 119 (2.2%) | 211 (15.2%) |
Race in Lockport
The most populous races in Lockport are White / Caucasian (23,285 | 89.1%), Hispanic or Latino (2,601 | 10.0%), and Two or more Races (1,666 | 6.4%).
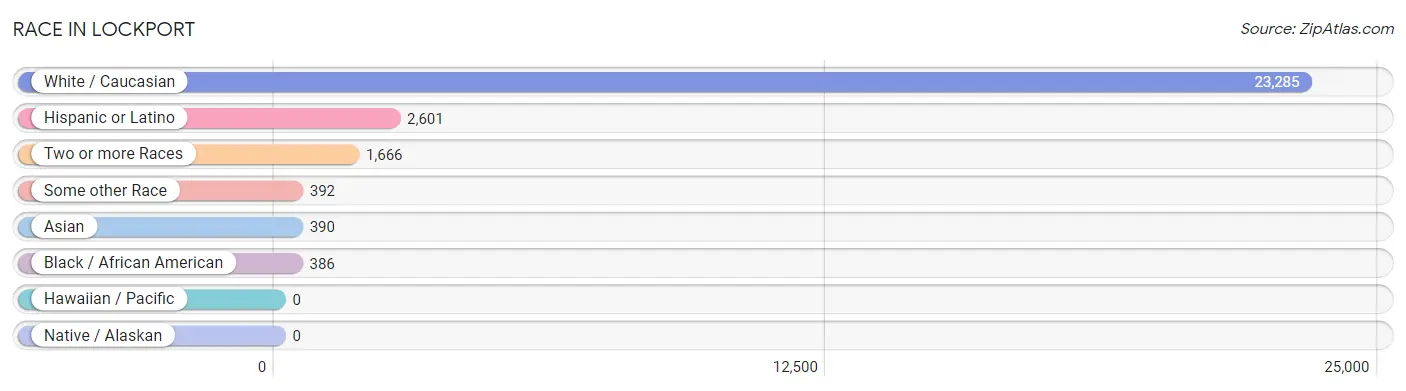
| Race | # Population | % Population |
| Asian | 390 | 1.5% |
| Black / African American | 386 | 1.5% |
| Hawaiian / Pacific | 0 | 0.0% |
| Hispanic or Latino | 2,601 | 10.0% |
| Native / Alaskan | 0 | 0.0% |
| White / Caucasian | 23,285 | 89.1% |
| Two or more Races | 1,666 | 6.4% |
| Some other Race | 392 | 1.5% |
| Total | 26,119 | 100.0% |
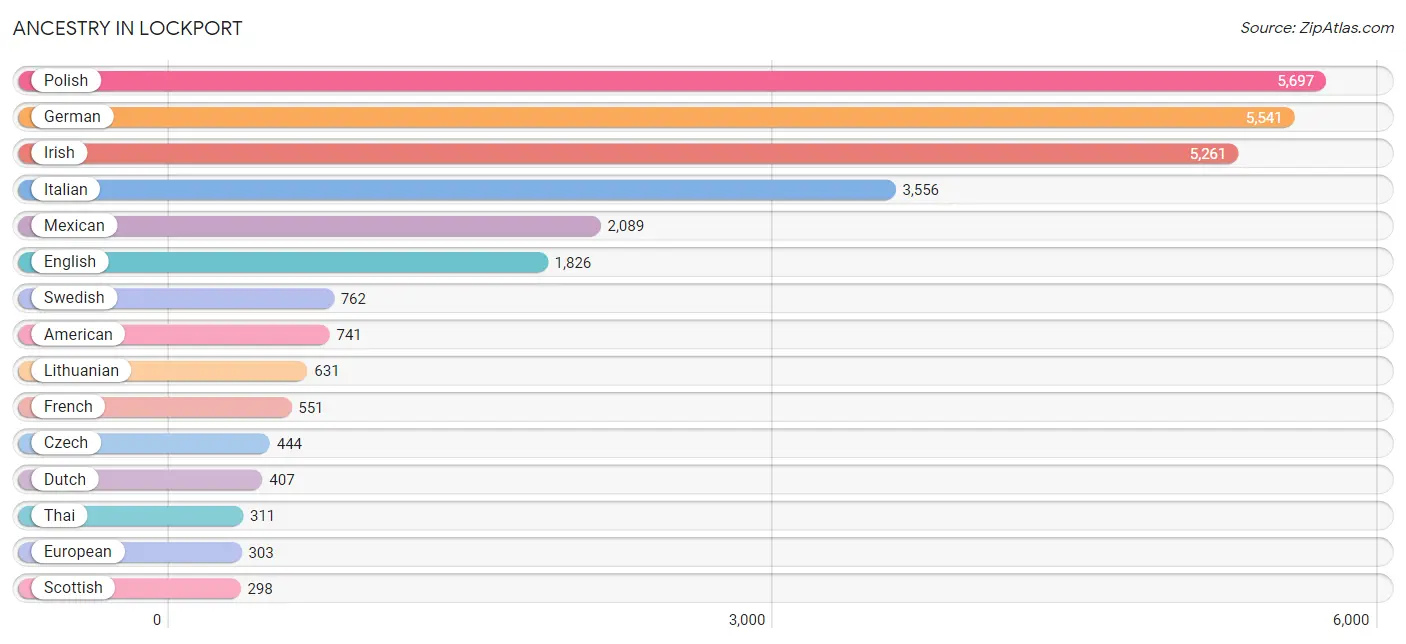
Ancestry in Lockport
The most populous ancestries reported in Lockport are Polish (5,697 | 21.8%), German (5,541 | 21.2%), Irish (5,261 | 20.1%), Italian (3,556 | 13.6%), and Mexican (2,089 | 8.0%), together accounting for 84.8% of all Lockport residents.
| Ancestry | # Population | % Population |
| African | 41 | 0.2% |
| American | 741 | 2.8% |
| Arab | 235 | 0.9% |
| Argentinean | 24 | 0.1% |
| Armenian | 68 | 0.3% |
| Austrian | 17 | 0.1% |
| Bhutanese | 92 | 0.4% |
| British | 88 | 0.3% |
| Burmese | 77 | 0.3% |
| Canadian | 54 | 0.2% |
| Central American | 77 | 0.3% |
| Cherokee | 138 | 0.5% |
| Choctaw | 21 | 0.1% |
| Croatian | 216 | 0.8% |
| Cuban | 73 | 0.3% |
| Czech | 444 | 1.7% |
| Czechoslovakian | 8 | 0.0% |
| Danish | 49 | 0.2% |
| Dutch | 407 | 1.6% |
| Eastern European | 88 | 0.3% |
| Ecuadorian | 18 | 0.1% |
| English | 1,826 | 7.0% |
| European | 303 | 1.2% |
| French | 551 | 2.1% |
| French Canadian | 26 | 0.1% |
| German | 5,541 | 21.2% |
| Greek | 250 | 1.0% |
| Honduran | 77 | 0.3% |
| Hungarian | 243 | 0.9% |
| Indian (Asian) | 45 | 0.2% |
| Irish | 5,261 | 20.1% |
| Italian | 3,556 | 13.6% |
| Jordanian | 72 | 0.3% |
| Korean | 38 | 0.2% |
| Latvian | 7 | 0.0% |
| Lebanese | 95 | 0.4% |
| Lithuanian | 631 | 2.4% |
| Mexican | 2,089 | 8.0% |
| Mexican American Indian | 4 | 0.0% |
| Norwegian | 144 | 0.5% |
| Pakistani | 9 | 0.0% |
| Palestinian | 21 | 0.1% |
| Polish | 5,697 | 21.8% |
| Puerto Rican | 105 | 0.4% |
| Romanian | 49 | 0.2% |
| Russian | 222 | 0.9% |
| Scandinavian | 28 | 0.1% |
| Scotch-Irish | 157 | 0.6% |
| Scottish | 298 | 1.1% |
| Serbian | 9 | 0.0% |
| Slavic | 91 | 0.4% |
| Slovak | 191 | 0.7% |
| Slovene | 109 | 0.4% |
| South American | 42 | 0.2% |
| Spaniard | 203 | 0.8% |
| Spanish | 12 | 0.1% |
| Subsaharan African | 53 | 0.2% |
| Swedish | 762 | 2.9% |
| Swiss | 42 | 0.2% |
| Thai | 311 | 1.2% |
| Ukrainian | 176 | 0.7% |
| Welsh | 86 | 0.3% |
| Yugoslavian | 34 | 0.1% | View All 63 Rows |
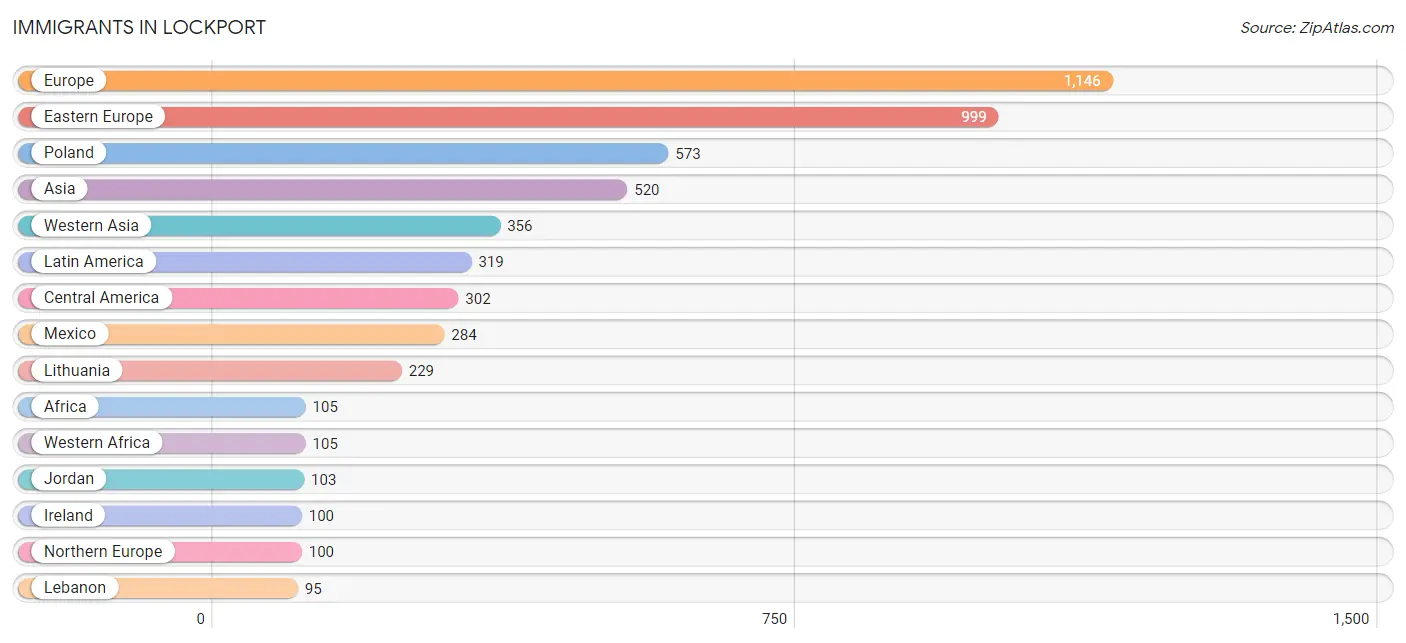
Immigrants in Lockport
The most numerous immigrant groups reported in Lockport came from Europe (1,146 | 4.4%), Eastern Europe (999 | 3.8%), Poland (573 | 2.2%), Asia (520 | 2.0%), and Western Asia (356 | 1.4%), together accounting for 13.8% of all Lockport residents.
| Immigration Origin | # Population | % Population |
| Africa | 105 | 0.4% |
| Argentina | 11 | 0.0% |
| Asia | 520 | 2.0% |
| Bosnia and Herzegovina | 34 | 0.1% |
| Central America | 302 | 1.2% |
| China | 22 | 0.1% |
| Eastern Asia | 53 | 0.2% |
| Eastern Europe | 999 | 3.8% |
| Ecuador | 6 | 0.0% |
| Europe | 1,146 | 4.4% |
| Germany | 24 | 0.1% |
| Ghana | 68 | 0.3% |
| Greece | 15 | 0.1% |
| Honduras | 18 | 0.1% |
| India | 37 | 0.1% |
| Ireland | 100 | 0.4% |
| Israel | 29 | 0.1% |
| Italy | 8 | 0.0% |
| Japan | 21 | 0.1% |
| Jordan | 103 | 0.4% |
| Korea | 10 | 0.0% |
| Kuwait | 8 | 0.0% |
| Latin America | 319 | 1.2% |
| Lebanon | 95 | 0.4% |
| Lithuania | 229 | 0.9% |
| Mexico | 284 | 1.1% |
| Moldova | 79 | 0.3% |
| Northern Europe | 100 | 0.4% |
| Philippines | 24 | 0.1% |
| Poland | 573 | 2.2% |
| South America | 17 | 0.1% |
| South Central Asia | 37 | 0.1% |
| South Eastern Asia | 74 | 0.3% |
| Southern Europe | 23 | 0.1% |
| Ukraine | 84 | 0.3% |
| Vietnam | 50 | 0.2% |
| Western Africa | 105 | 0.4% |
| Western Asia | 356 | 1.4% |
| Western Europe | 24 | 0.1% | View All 39 Rows |
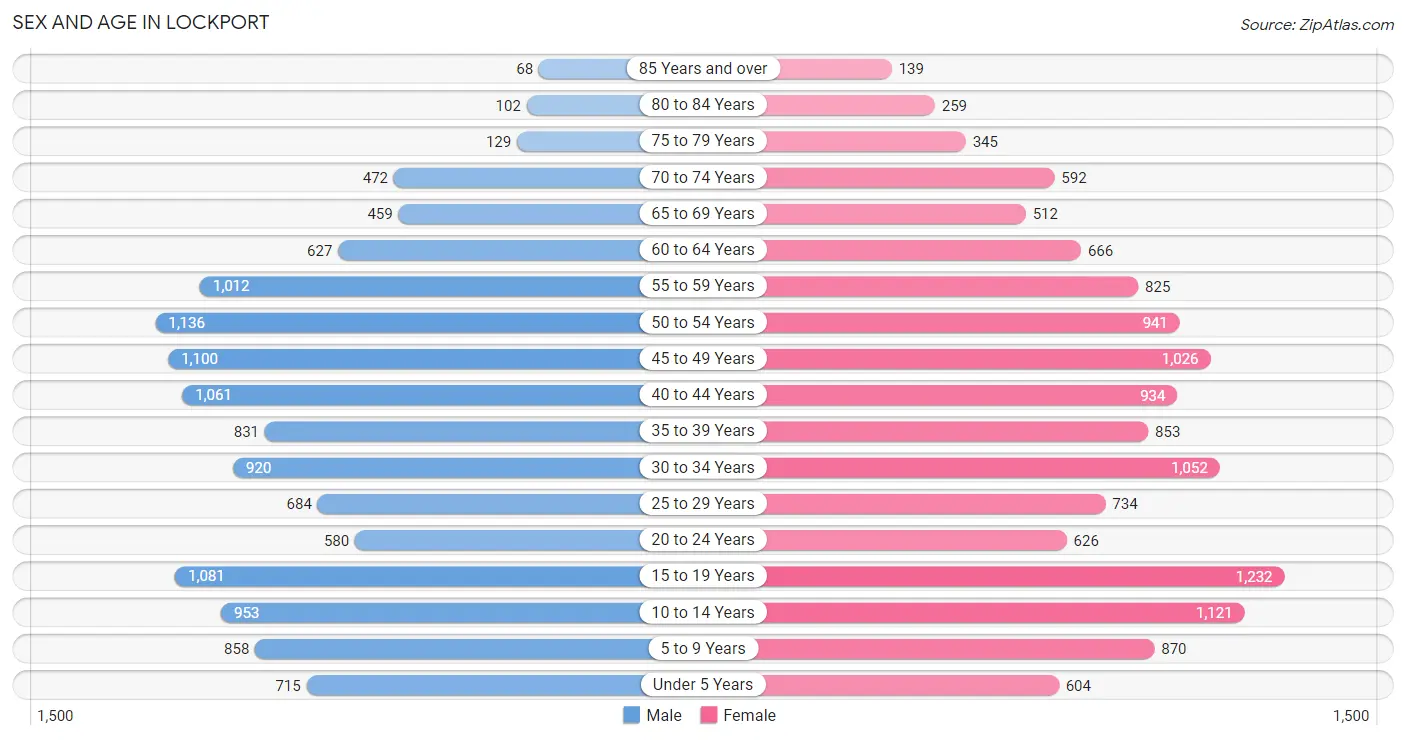
Sex and Age in Lockport
Sex and Age in Lockport
The most populous age groups in Lockport are 50 to 54 Years (1,136 | 8.9%) for men and 15 to 19 Years (1,232 | 9.2%) for women.
| Age Bracket | Male | Female |
| Under 5 Years | 715 (5.6%) | 604 (4.5%) |
| 5 to 9 Years | 858 (6.7%) | 870 (6.5%) |
| 10 to 14 Years | 953 (7.4%) | 1,121 (8.4%) |
| 15 to 19 Years | 1,081 (8.5%) | 1,232 (9.2%) |
| 20 to 24 Years | 580 (4.5%) | 626 (4.7%) |
| 25 to 29 Years | 684 (5.3%) | 734 (5.5%) |
| 30 to 34 Years | 920 (7.2%) | 1,052 (7.9%) |
| 35 to 39 Years | 831 (6.5%) | 853 (6.4%) |
| 40 to 44 Years | 1,061 (8.3%) | 934 (7.0%) |
| 45 to 49 Years | 1,100 (8.6%) | 1,026 (7.7%) |
| 50 to 54 Years | 1,136 (8.9%) | 941 (7.1%) |
| 55 to 59 Years | 1,012 (7.9%) | 825 (6.2%) |
| 60 to 64 Years | 627 (4.9%) | 666 (5.0%) |
| 65 to 69 Years | 459 (3.6%) | 512 (3.8%) |
| 70 to 74 Years | 472 (3.7%) | 592 (4.4%) |
| 75 to 79 Years | 129 (1.0%) | 345 (2.6%) |
| 80 to 84 Years | 102 (0.8%) | 259 (1.9%) |
| 85 Years and over | 68 (0.5%) | 139 (1.0%) |
| Total | 12,788 (100.0%) | 13,331 (100.0%) |
Families and Households in Lockport
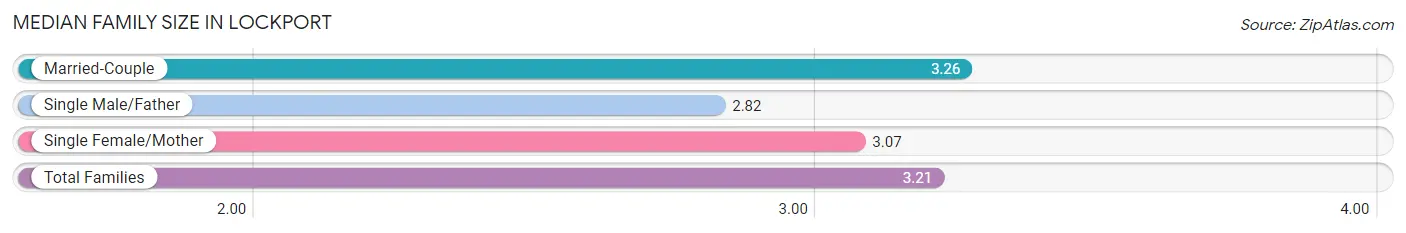
Median Family Size in Lockport
The median family size in Lockport is 3.21 persons per family, with married-couple families (5,451 | 79.7%) accounting for the largest median family size of 3.26 persons per family. On the other hand, single male/father families (373 | 5.4%) represent the smallest median family size with 2.82 persons per family.
| Family Type | # Families | Family Size |
| Married-Couple | 5,451 (79.7%) | 3.26 |
| Single Male/Father | 373 (5.4%) | 2.82 |
| Single Female/Mother | 1,018 (14.9%) | 3.07 |
| Total Families | 6,842 (100.0%) | 3.21 |
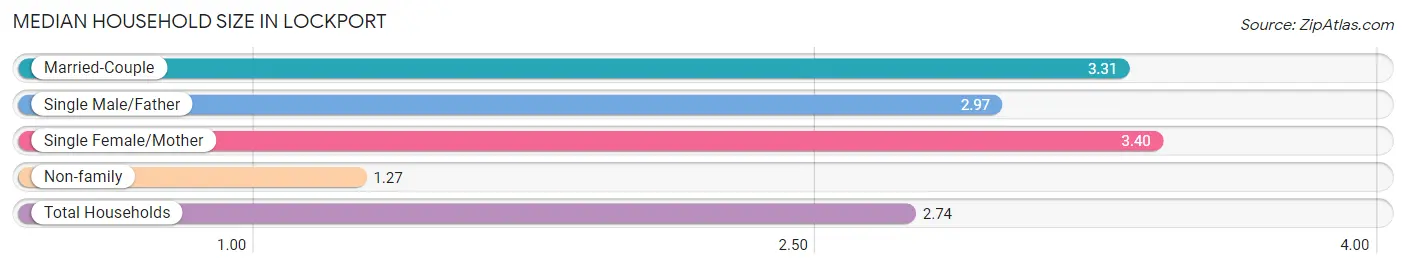
Median Household Size in Lockport
The median household size in Lockport is 2.74 persons per household, with single female/mother households (1,018 | 10.7%) accounting for the largest median household size of 3.4 persons per household. non-family households (2,665 | 28.0%) represent the smallest median household size with 1.27 persons per household.
| Household Type | # Households | Household Size |
| Married-Couple | 5,451 (57.3%) | 3.31 |
| Single Male/Father | 373 (3.9%) | 2.97 |
| Single Female/Mother | 1,018 (10.7%) | 3.40 |
| Non-family | 2,665 (28.0%) | 1.27 |
| Total Households | 9,507 (100.0%) | 2.74 |
Household Size by Marriage Status in Lockport
Out of a total of 9,507 households in Lockport, 6,842 (72.0%) are family households, while 2,665 (28.0%) are nonfamily households. The most numerous type of family households are 2-person households, comprising 2,637, and the most common type of nonfamily households are 1-person households, comprising 2,121.
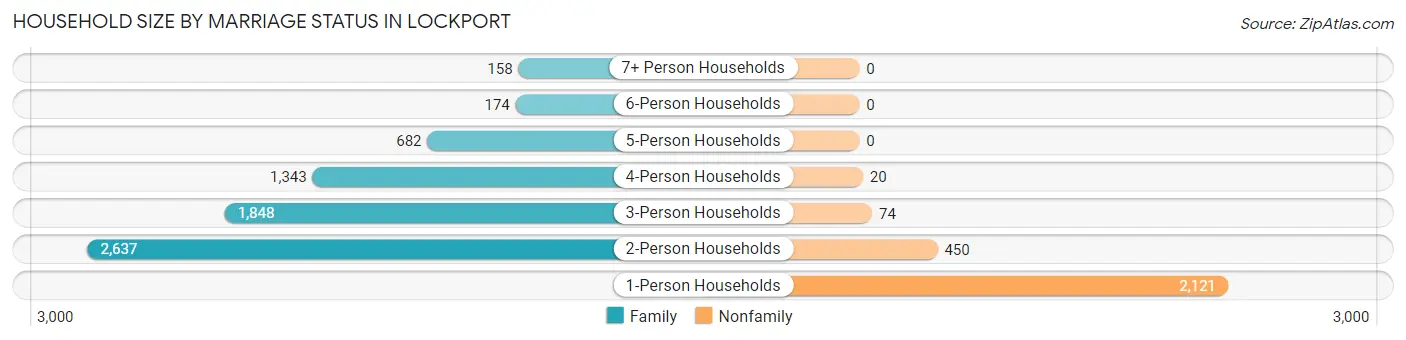
| Household Size | Family Households | Nonfamily Households |
| 1-Person Households | - | 2,121 (22.3%) |
| 2-Person Households | 2,637 (27.7%) | 450 (4.7%) |
| 3-Person Households | 1,848 (19.4%) | 74 (0.8%) |
| 4-Person Households | 1,343 (14.1%) | 20 (0.2%) |
| 5-Person Households | 682 (7.2%) | 0 (0.0%) |
| 6-Person Households | 174 (1.8%) | 0 (0.0%) |
| 7+ Person Households | 158 (1.7%) | 0 (0.0%) |
| Total | 6,842 (72.0%) | 2,665 (28.0%) |
Female Fertility in Lockport
Fertility by Age in Lockport
Average fertility rate in Lockport is 48.0 births per 1,000 women. Women in the age bracket of 20 to 34 years have the highest fertility rate with 106.0 births per 1,000 women. Women in the age bracket of 20 to 34 years acount for 79.0% of all women with births.
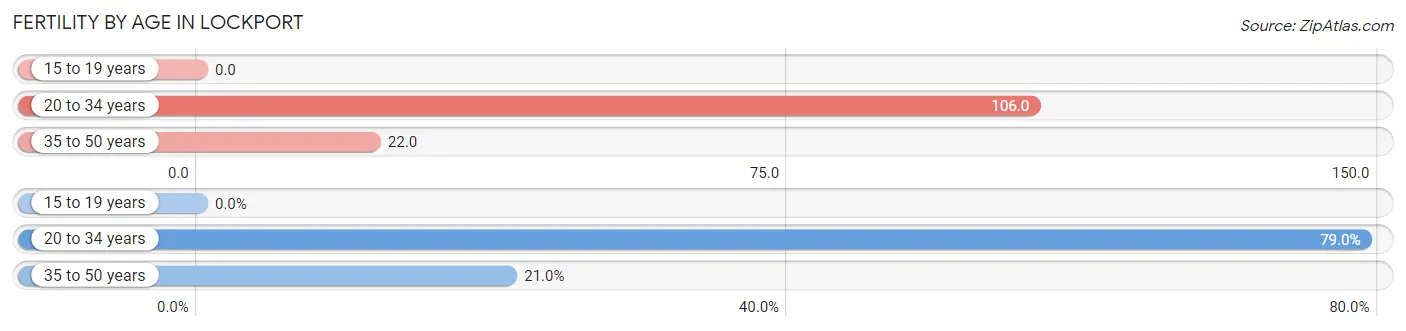
| Age Bracket | Women with Births | Births / 1,000 Women |
| 15 to 19 years | 0 (0.0%) | 0.0 |
| 20 to 34 years | 256 (79.0%) | 106.0 |
| 35 to 50 years | 68 (21.0%) | 22.0 |
| Total | 324 (100.0%) | 48.0 |
Fertility by Age by Marriage Status in Lockport
75.0% of women with births (324) in Lockport are married. The highest percentage of unmarried women with births falls into 20 to 34 years age bracket with 31.6% of them unmarried at the time of birth, while the lowest percentage of unmarried women with births belong to 35 to 50 years age bracket with 0.0% of them unmarried.
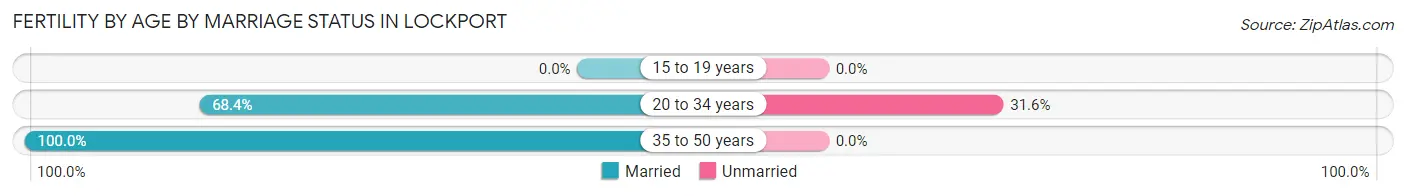
| Age Bracket | Married | Unmarried |
| 15 to 19 years | 0 (0.0%) | 0 (0.0%) |
| 20 to 34 years | 175 (68.4%) | 81 (31.6%) |
| 35 to 50 years | 68 (100.0%) | 0 (0.0%) |
| Total | 243 (75.0%) | 81 (25.0%) |
Fertility by Education in Lockport
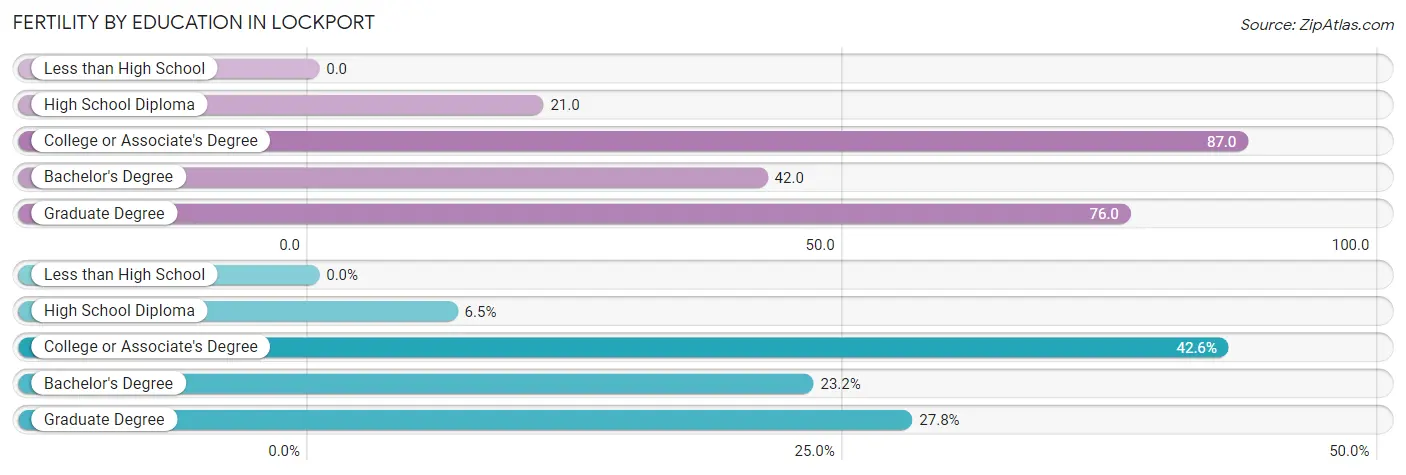
| Educational Attainment | Women with Births | Births / 1,000 Women |
| Less than High School | 0 (0.0%) | 0.0 |
| High School Diploma | 21 (6.5%) | 21.0 |
| College or Associate's Degree | 138 (42.6%) | 87.0 |
| Bachelor's Degree | 75 (23.2%) | 42.0 |
| Graduate Degree | 90 (27.8%) | 76.0 |
| Total | 324 (100.0%) | 48.0 |
Fertility by Education by Marriage Status in Lockport
25.0% of women with births in Lockport are unmarried. Women with the educational attainment of high school diploma are most likely to be married with 100.0% of them married at childbirth, while women with the educational attainment of college or associate's degree are least likely to be married with 58.7% of them unmarried at childbirth.
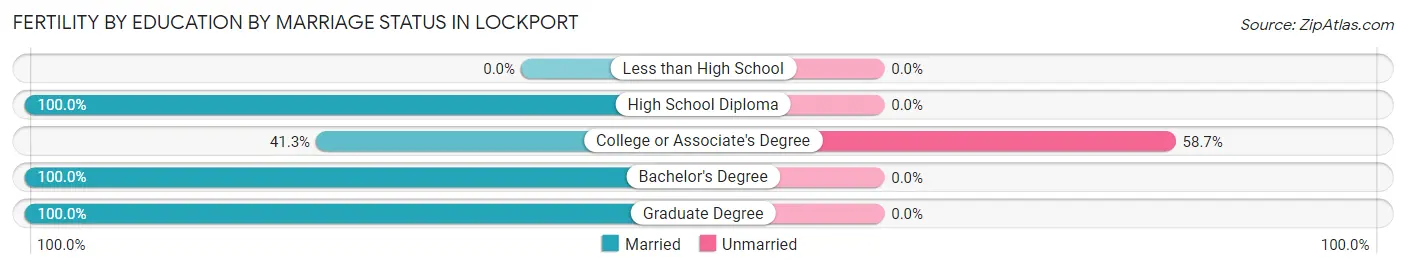
| Educational Attainment | Married | Unmarried |
| Less than High School | 0 (0.0%) | 0 (0.0%) |
| High School Diploma | 21 (100.0%) | 0 (0.0%) |
| College or Associate's Degree | 57 (41.3%) | 81 (58.7%) |
| Bachelor's Degree | 75 (100.0%) | 0 (0.0%) |
| Graduate Degree | 90 (100.0%) | 0 (0.0%) |
| Total | 243 (75.0%) | 81 (25.0%) |
Employment Characteristics in Lockport
Employment by Class of Employer in Lockport
Among the 14,040 employed individuals in Lockport, private company employees (10,015 | 71.3%), local government employees (1,382 | 9.8%), and self-employed (incorporated) (834 | 5.9%) make up the most common classes of employment.
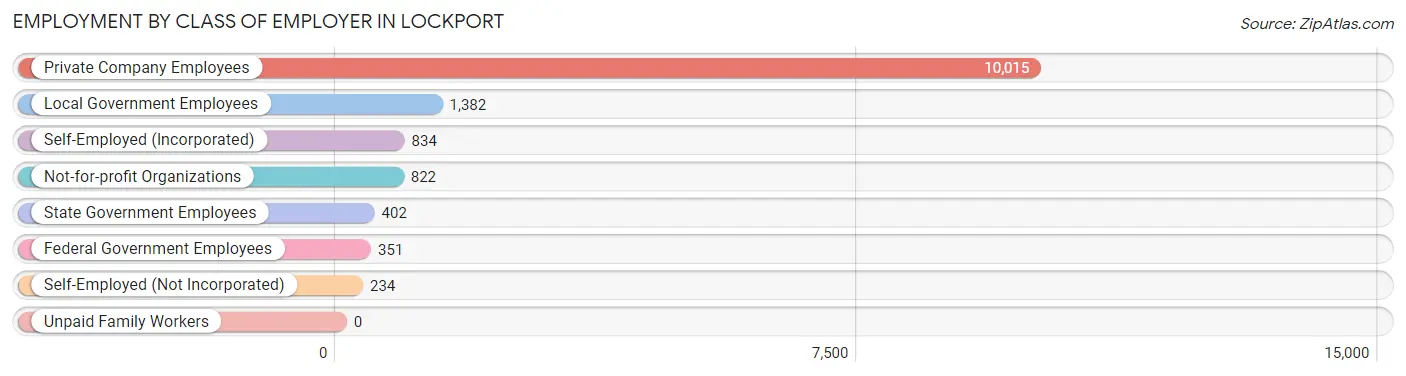
| Employer Class | # Employees | % Employees |
| Private Company Employees | 10,015 | 71.3% |
| Self-Employed (Incorporated) | 834 | 5.9% |
| Self-Employed (Not Incorporated) | 234 | 1.7% |
| Not-for-profit Organizations | 822 | 5.9% |
| Local Government Employees | 1,382 | 9.8% |
| State Government Employees | 402 | 2.9% |
| Federal Government Employees | 351 | 2.5% |
| Unpaid Family Workers | 0 | 0.0% |
| Total | 14,040 | 100.0% |
Employment Status by Age in Lockport
According to the labor force statistics for Lockport, out of the total population over 16 years of age (20,498), 73.0% or 14,964 individuals are in the labor force, with 4.6% or 688 of them unemployed. The age group with the highest labor force participation rate is 25 to 29 years, with 95.6% or 1,356 individuals in the labor force. Within the labor force, the 16 to 19 years age range has the highest percentage of unemployed individuals, with 21.8% or 188 of them being unemployed.
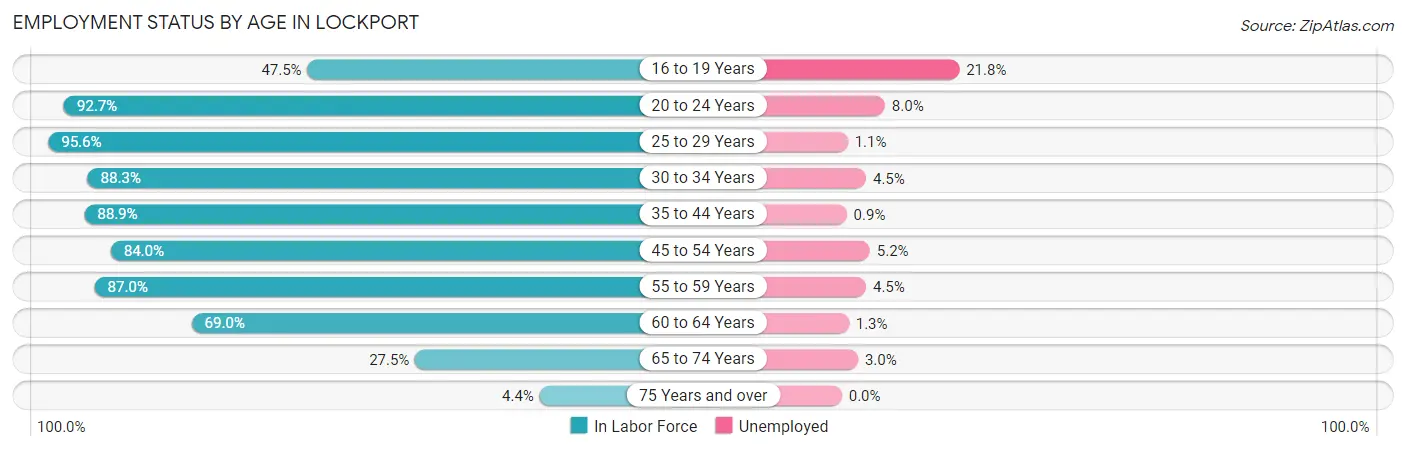
| Age Bracket | In Labor Force | Unemployed |
| 16 to 19 Years | 861 (47.5%) | 188 (21.8%) |
| 20 to 24 Years | 1,118 (92.7%) | 89 (8.0%) |
| 25 to 29 Years | 1,356 (95.6%) | 15 (1.1%) |
| 30 to 34 Years | 1,741 (88.3%) | 78 (4.5%) |
| 35 to 44 Years | 3,271 (88.9%) | 29 (0.9%) |
| 45 to 54 Years | 3,531 (84.0%) | 184 (5.2%) |
| 55 to 59 Years | 1,598 (87.0%) | 72 (4.5%) |
| 60 to 64 Years | 892 (69.0%) | 12 (1.3%) |
| 65 to 74 Years | 560 (27.5%) | 17 (3.0%) |
| 75 Years and over | 46 (4.4%) | 0 (0.0%) |
| Total | 14,964 (73.0%) | 688 (4.6%) |
Employment Status by Educational Attainment in Lockport
According to labor force statistics for Lockport, 86.0% of individuals (12,386) out of the total population between 25 and 64 years of age (14,402) are in the labor force, with 3.2% or 396 of them being unemployed. The group with the highest labor force participation rate are those with the educational attainment of bachelor's degree or higher, with 92.2% or 6,197 individuals in the labor force. Within the labor force, individuals with high school diploma education have the highest percentage of unemployment, with 6.1% or 147 of them being unemployed.
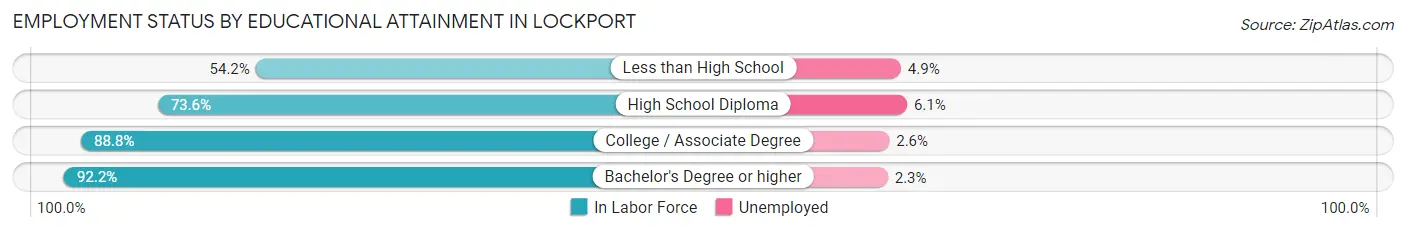
| Educational Attainment | In Labor Force | Unemployed |
| Less than High School | 206 (54.2%) | 19 (4.9%) |
| High School Diploma | 2,410 (73.6%) | 200 (6.1%) |
| College / Associate Degree | 3,576 (88.8%) | 105 (2.6%) |
| Bachelor's Degree or higher | 6,197 (92.2%) | 155 (2.3%) |
| Total | 12,386 (86.0%) | 461 (3.2%) |
Employment Occupations by Sex in Lockport
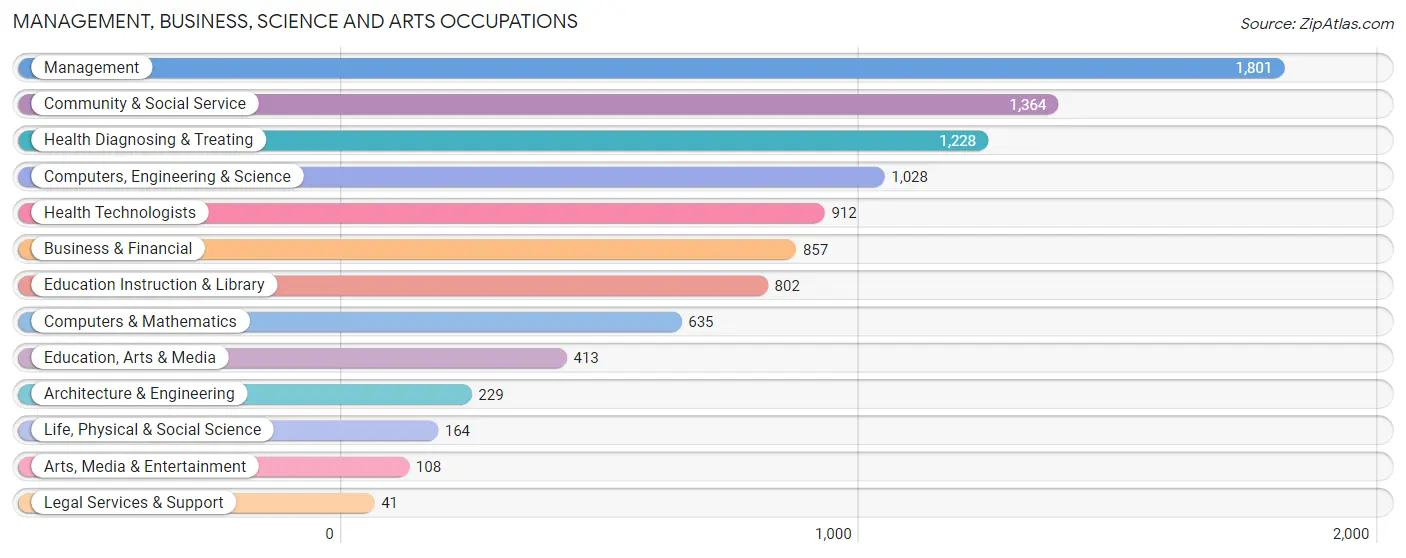
Management, Business, Science and Arts Occupations
The most common Management, Business, Science and Arts occupations in Lockport are Management (1,801 | 12.6%), Community & Social Service (1,364 | 9.6%), Health Diagnosing & Treating (1,228 | 8.6%), Computers, Engineering & Science (1,028 | 7.2%), and Health Technologists (912 | 6.4%).
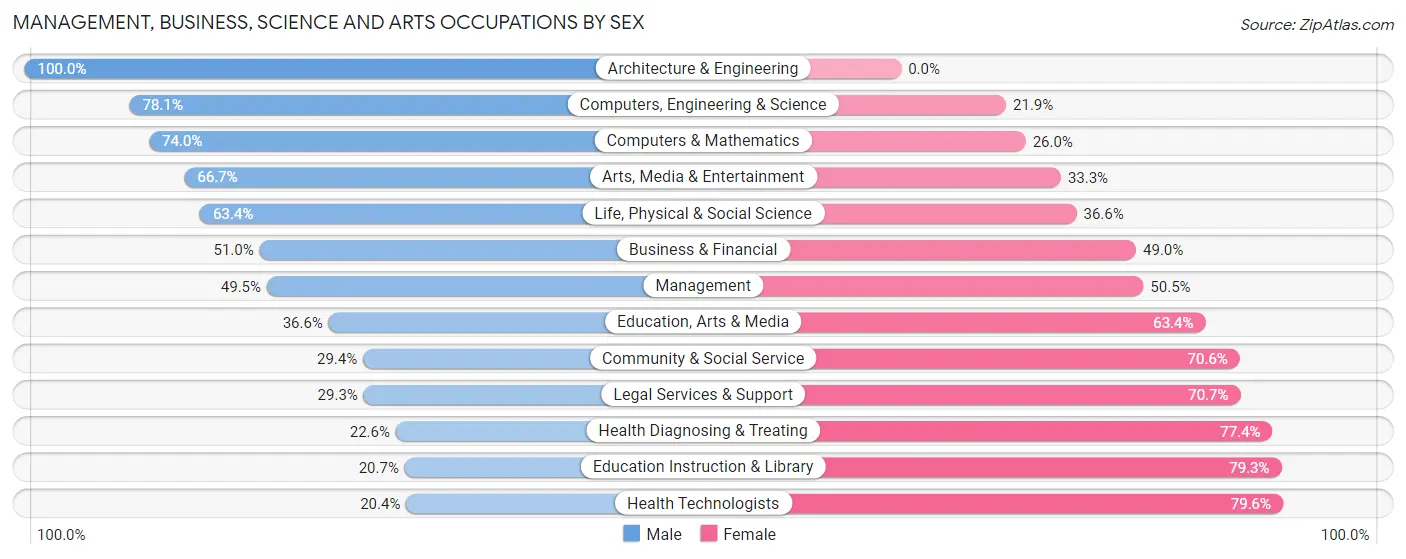
Management, Business, Science and Arts Occupations by Sex
Within the Management, Business, Science and Arts occupations in Lockport, the most male-oriented occupations are Architecture & Engineering (100.0%), Computers, Engineering & Science (78.1%), and Computers & Mathematics (74.0%), while the most female-oriented occupations are Health Technologists (79.6%), Education Instruction & Library (79.3%), and Health Diagnosing & Treating (77.4%).
| Occupation | Male | Female |
| Management | 891 (49.5%) | 910 (50.5%) |
| Business & Financial | 437 (51.0%) | 420 (49.0%) |
| Computers, Engineering & Science | 803 (78.1%) | 225 (21.9%) |
| Computers & Mathematics | 470 (74.0%) | 165 (26.0%) |
| Architecture & Engineering | 229 (100.0%) | 0 (0.0%) |
| Life, Physical & Social Science | 104 (63.4%) | 60 (36.6%) |
| Community & Social Service | 401 (29.4%) | 963 (70.6%) |
| Education, Arts & Media | 151 (36.6%) | 262 (63.4%) |
| Legal Services & Support | 12 (29.3%) | 29 (70.7%) |
| Education Instruction & Library | 166 (20.7%) | 636 (79.3%) |
| Arts, Media & Entertainment | 72 (66.7%) | 36 (33.3%) |
| Health Diagnosing & Treating | 277 (22.6%) | 951 (77.4%) |
| Health Technologists | 186 (20.4%) | 726 (79.6%) |
| Total (Category) | 2,809 (44.7%) | 3,469 (55.3%) |
| Total (Overall) | 7,537 (52.8%) | 6,734 (47.2%) |
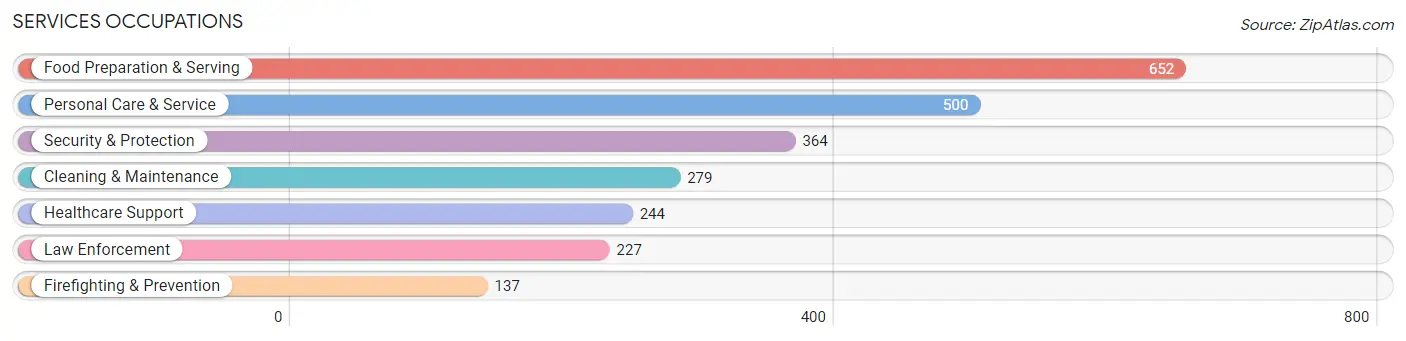
Services Occupations
The most common Services occupations in Lockport are Food Preparation & Serving (652 | 4.6%), Personal Care & Service (500 | 3.5%), Security & Protection (364 | 2.5%), Cleaning & Maintenance (279 | 2.0%), and Healthcare Support (244 | 1.7%).
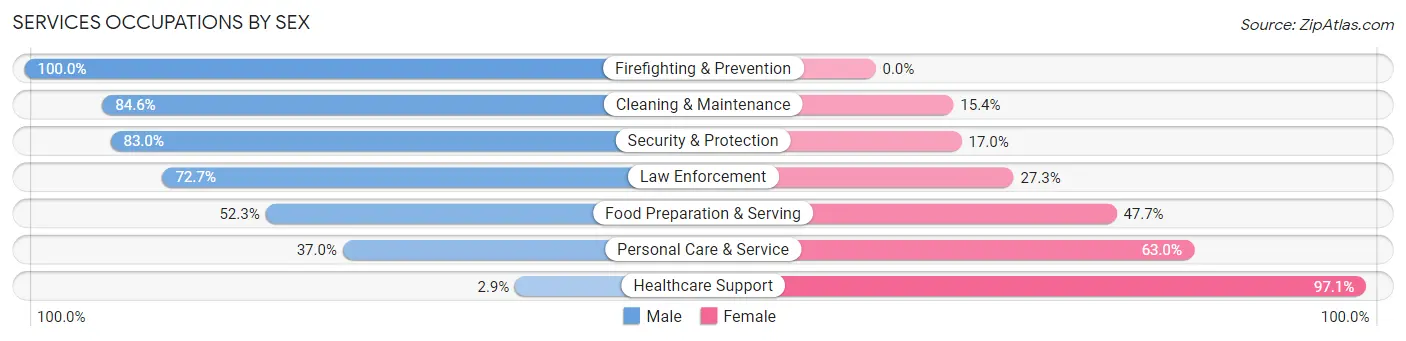
Services Occupations by Sex
Within the Services occupations in Lockport, the most male-oriented occupations are Firefighting & Prevention (100.0%), Cleaning & Maintenance (84.6%), and Security & Protection (83.0%), while the most female-oriented occupations are Healthcare Support (97.1%), Personal Care & Service (63.0%), and Food Preparation & Serving (47.7%).
| Occupation | Male | Female |
| Healthcare Support | 7 (2.9%) | 237 (97.1%) |
| Security & Protection | 302 (83.0%) | 62 (17.0%) |
| Firefighting & Prevention | 137 (100.0%) | 0 (0.0%) |
| Law Enforcement | 165 (72.7%) | 62 (27.3%) |
| Food Preparation & Serving | 341 (52.3%) | 311 (47.7%) |
| Cleaning & Maintenance | 236 (84.6%) | 43 (15.4%) |
| Personal Care & Service | 185 (37.0%) | 315 (63.0%) |
| Total (Category) | 1,071 (52.5%) | 968 (47.5%) |
| Total (Overall) | 7,537 (52.8%) | 6,734 (47.2%) |
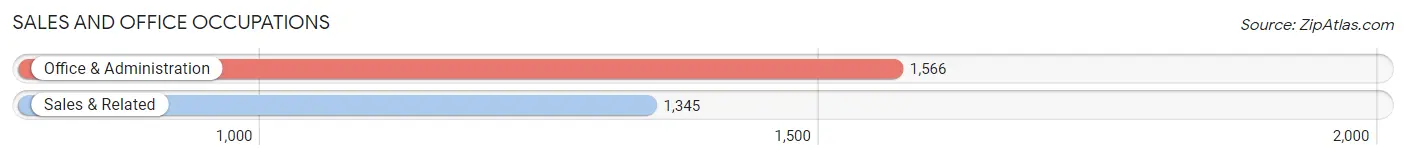
Sales and Office Occupations
The most common Sales and Office occupations in Lockport are Office & Administration (1,566 | 11.0%), and Sales & Related (1,345 | 9.4%).
Sales and Office Occupations by Sex

| Occupation | Male | Female |
| Sales & Related | 622 (46.3%) | 723 (53.7%) |
| Office & Administration | 273 (17.4%) | 1,293 (82.6%) |
| Total (Category) | 895 (30.7%) | 2,016 (69.3%) |
| Total (Overall) | 7,537 (52.8%) | 6,734 (47.2%) |
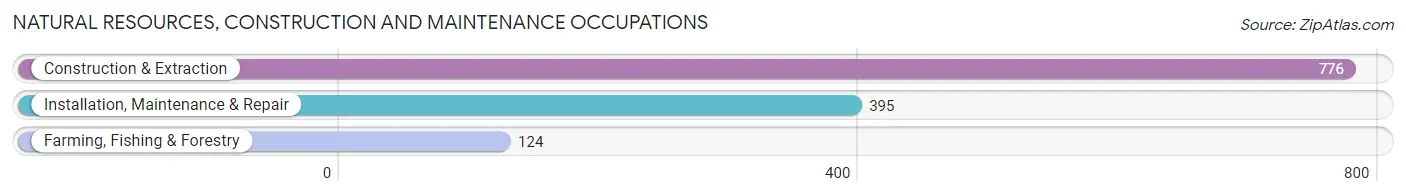
Natural Resources, Construction and Maintenance Occupations
The most common Natural Resources, Construction and Maintenance occupations in Lockport are Construction & Extraction (776 | 5.4%), Installation, Maintenance & Repair (395 | 2.8%), and Farming, Fishing & Forestry (124 | 0.9%).
Natural Resources, Construction and Maintenance Occupations by Sex
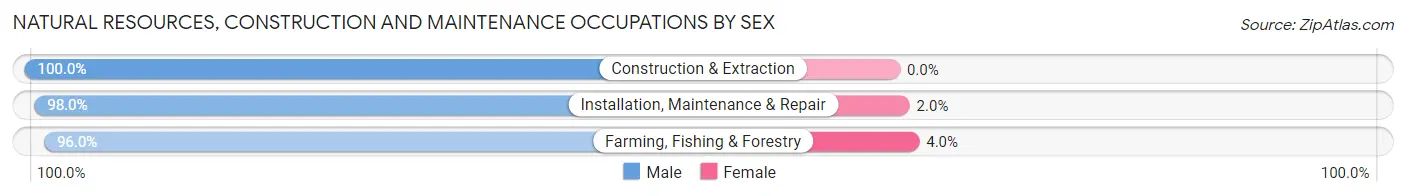
| Occupation | Male | Female |
| Farming, Fishing & Forestry | 119 (96.0%) | 5 (4.0%) |
| Construction & Extraction | 776 (100.0%) | 0 (0.0%) |
| Installation, Maintenance & Repair | 387 (98.0%) | 8 (2.0%) |
| Total (Category) | 1,282 (99.0%) | 13 (1.0%) |
| Total (Overall) | 7,537 (52.8%) | 6,734 (47.2%) |
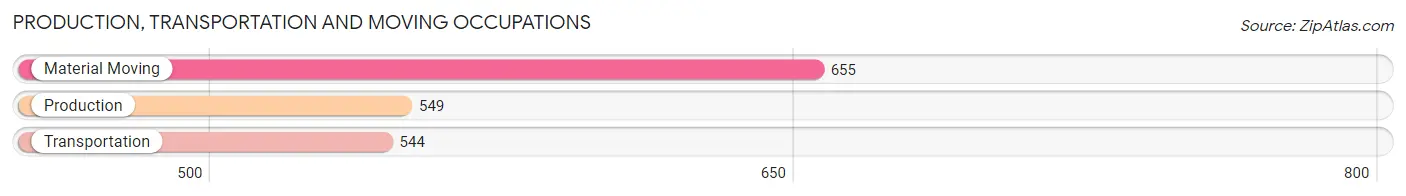
Production, Transportation and Moving Occupations
The most common Production, Transportation and Moving occupations in Lockport are Material Moving (655 | 4.6%), Production (549 | 3.8%), and Transportation (544 | 3.8%).
Production, Transportation and Moving Occupations by Sex
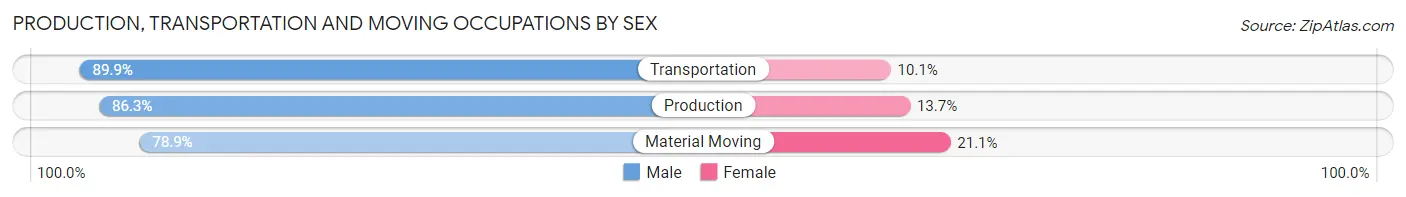
| Occupation | Male | Female |
| Production | 474 (86.3%) | 75 (13.7%) |
| Transportation | 489 (89.9%) | 55 (10.1%) |
| Material Moving | 517 (78.9%) | 138 (21.1%) |
| Total (Category) | 1,480 (84.7%) | 268 (15.3%) |
| Total (Overall) | 7,537 (52.8%) | 6,734 (47.2%) |
Employment Industries by Sex in Lockport
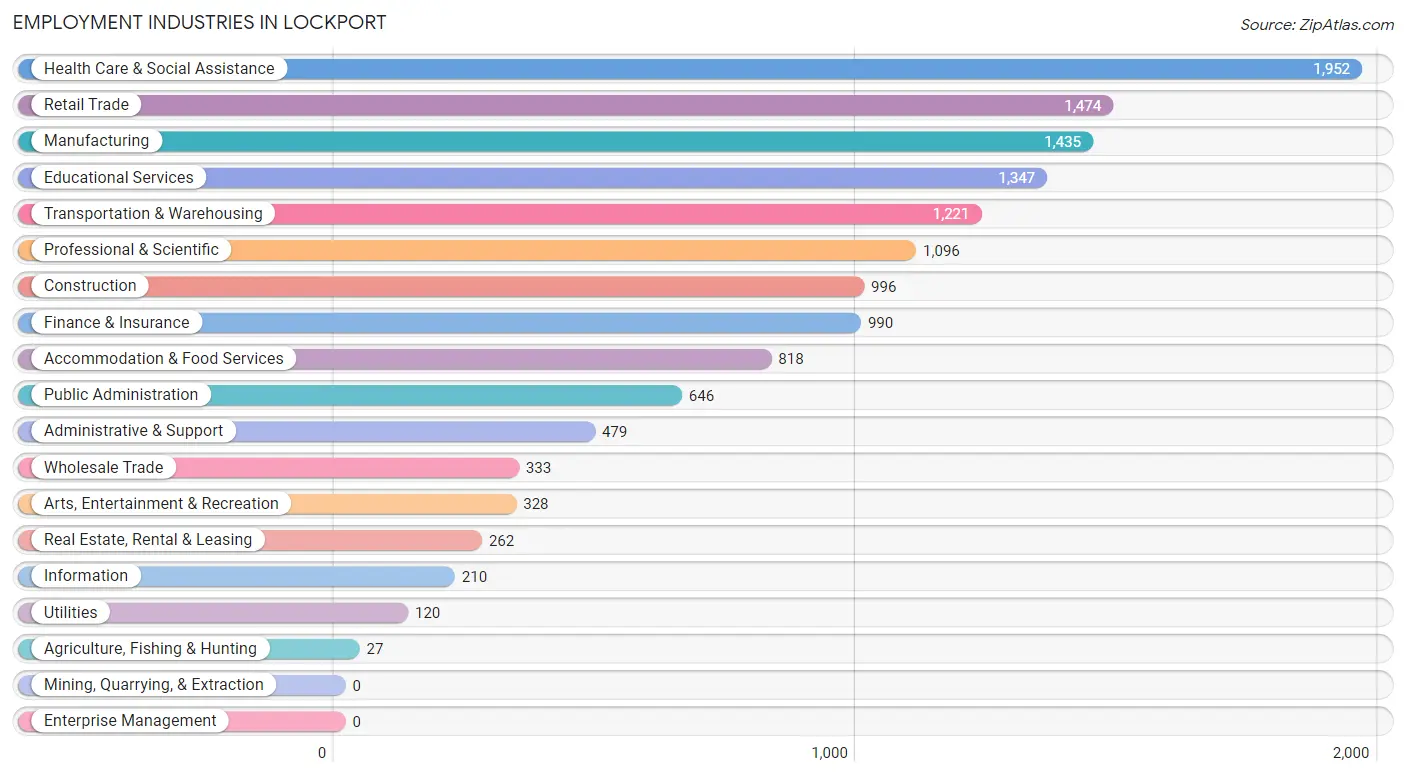
Employment Industries in Lockport
The major employment industries in Lockport include Health Care & Social Assistance (1,952 | 13.7%), Retail Trade (1,474 | 10.3%), Manufacturing (1,435 | 10.1%), Educational Services (1,347 | 9.4%), and Transportation & Warehousing (1,221 | 8.6%).
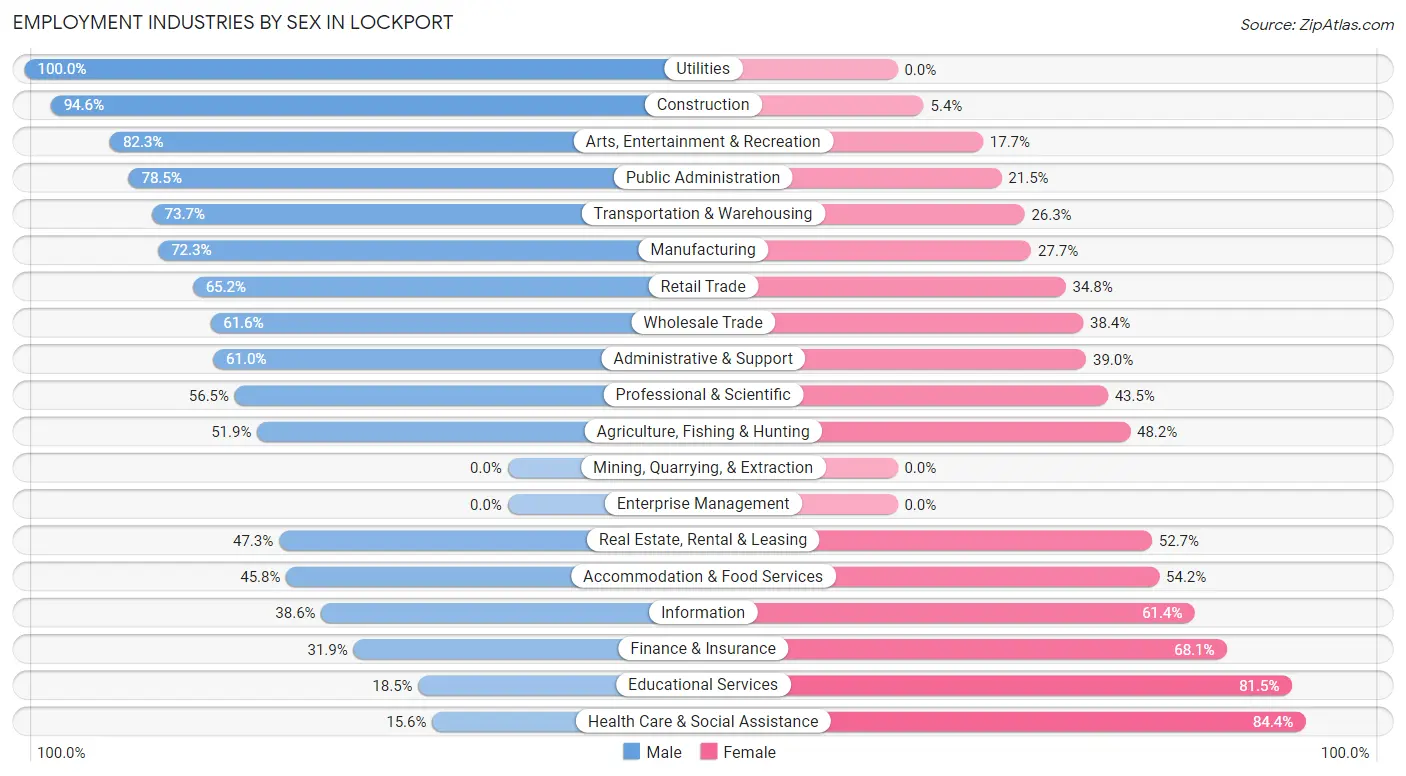
Employment Industries by Sex in Lockport
The Lockport industries that see more men than women are Utilities (100.0%), Construction (94.6%), and Arts, Entertainment & Recreation (82.3%), whereas the industries that tend to have a higher number of women are Health Care & Social Assistance (84.4%), Educational Services (81.5%), and Finance & Insurance (68.1%).
| Industry | Male | Female |
| Agriculture, Fishing & Hunting | 14 (51.8%) | 13 (48.1%) |
| Mining, Quarrying, & Extraction | 0 (0.0%) | 0 (0.0%) |
| Construction | 942 (94.6%) | 54 (5.4%) |
| Manufacturing | 1,038 (72.3%) | 397 (27.7%) |
| Wholesale Trade | 205 (61.6%) | 128 (38.4%) |
| Retail Trade | 961 (65.2%) | 513 (34.8%) |
| Transportation & Warehousing | 900 (73.7%) | 321 (26.3%) |
| Utilities | 120 (100.0%) | 0 (0.0%) |
| Information | 81 (38.6%) | 129 (61.4%) |
| Finance & Insurance | 316 (31.9%) | 674 (68.1%) |
| Real Estate, Rental & Leasing | 124 (47.3%) | 138 (52.7%) |
| Professional & Scientific | 619 (56.5%) | 477 (43.5%) |
| Enterprise Management | 0 (0.0%) | 0 (0.0%) |
| Administrative & Support | 292 (61.0%) | 187 (39.0%) |
| Educational Services | 249 (18.5%) | 1,098 (81.5%) |
| Health Care & Social Assistance | 305 (15.6%) | 1,647 (84.4%) |
| Arts, Entertainment & Recreation | 270 (82.3%) | 58 (17.7%) |
| Accommodation & Food Services | 375 (45.8%) | 443 (54.2%) |
| Public Administration | 507 (78.5%) | 139 (21.5%) |
| Total | 7,537 (52.8%) | 6,734 (47.2%) |
Education in Lockport
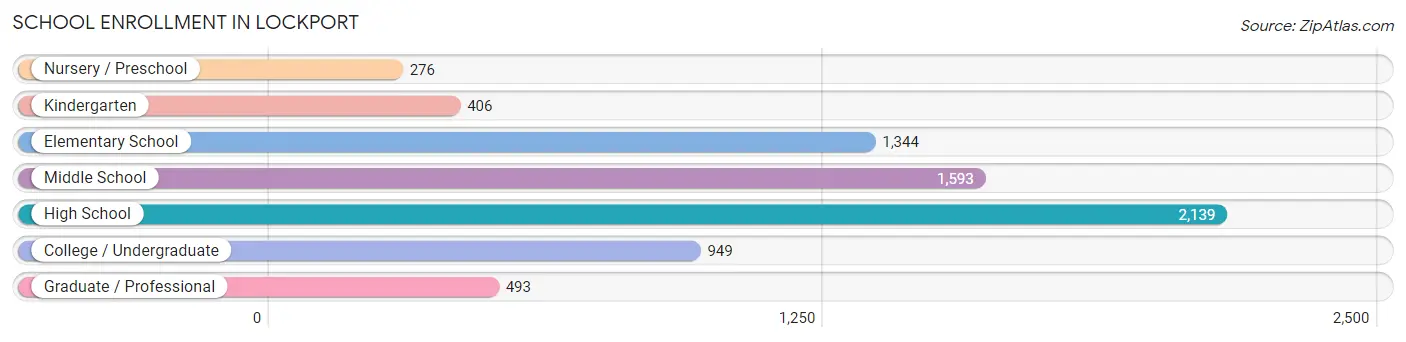
School Enrollment in Lockport
The most common levels of schooling among the 7,200 students in Lockport are high school (2,139 | 29.7%), middle school (1,593 | 22.1%), and elementary school (1,344 | 18.7%).
| School Level | # Students | % Students |
| Nursery / Preschool | 276 | 3.8% |
| Kindergarten | 406 | 5.6% |
| Elementary School | 1,344 | 18.7% |
| Middle School | 1,593 | 22.1% |
| High School | 2,139 | 29.7% |
| College / Undergraduate | 949 | 13.2% |
| Graduate / Professional | 493 | 6.9% |
| Total | 7,200 | 100.0% |
School Enrollment by Age by Funding Source in Lockport
Out of a total of 7,200 students who are enrolled in schools in Lockport, 936 (13.0%) attend a private institution, while the remaining 6,264 (87.0%) are enrolled in public schools. The age group of 3 to 4 year olds has the highest likelihood of being enrolled in private schools, with 93 (56.4% in the age bracket) enrolled. Conversely, the age group of 15 to 17 year olds has the lowest likelihood of being enrolled in a private school, with 1,465 (95.5% in the age bracket) attending a public institution.
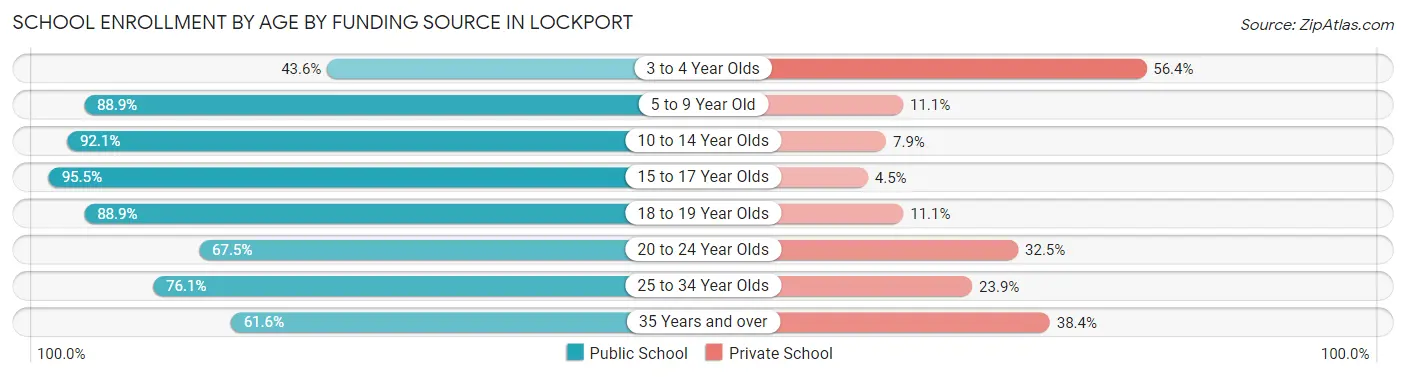
| Age Bracket | Public School | Private School |
| 3 to 4 Year Olds | 72 (43.6%) | 93 (56.4%) |
| 5 to 9 Year Old | 1,480 (88.9%) | 184 (11.1%) |
| 10 to 14 Year Olds | 1,901 (92.1%) | 163 (7.9%) |
| 15 to 17 Year Olds | 1,465 (95.5%) | 69 (4.5%) |
| 18 to 19 Year Olds | 544 (88.9%) | 68 (11.1%) |
| 20 to 24 Year Olds | 347 (67.5%) | 167 (32.5%) |
| 25 to 34 Year Olds | 302 (76.1%) | 95 (23.9%) |
| 35 Years and over | 154 (61.6%) | 96 (38.4%) |
| Total | 6,264 (87.0%) | 936 (13.0%) |
Educational Attainment by Field of Study in Lockport
Business (1,712 | 20.9%), science & technology (1,183 | 14.4%), education (1,110 | 13.5%), arts & humanities (785 | 9.6%), and engineering (691 | 8.4%) are the most common fields of study among 8,195 individuals in Lockport who have obtained a bachelor's degree or higher.
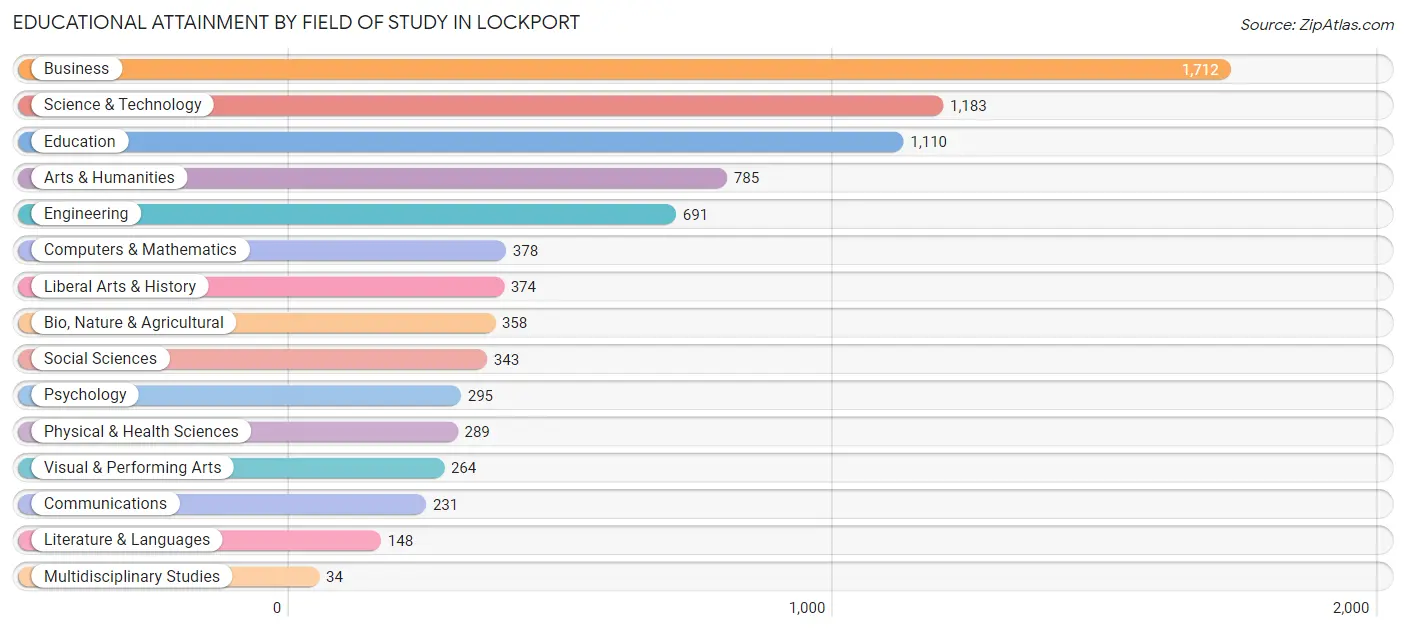
| Field of Study | # Graduates | % Graduates |
| Computers & Mathematics | 378 | 4.6% |
| Bio, Nature & Agricultural | 358 | 4.4% |
| Physical & Health Sciences | 289 | 3.5% |
| Psychology | 295 | 3.6% |
| Social Sciences | 343 | 4.2% |
| Engineering | 691 | 8.4% |
| Multidisciplinary Studies | 34 | 0.4% |
| Science & Technology | 1,183 | 14.4% |
| Business | 1,712 | 20.9% |
| Education | 1,110 | 13.5% |
| Literature & Languages | 148 | 1.8% |
| Liberal Arts & History | 374 | 4.6% |
| Visual & Performing Arts | 264 | 3.2% |
| Communications | 231 | 2.8% |
| Arts & Humanities | 785 | 9.6% |
| Total | 8,195 | 100.0% |
Transportation & Commute in Lockport
Vehicle Availability by Sex in Lockport
The most prevalent vehicle ownership categories in Lockport are males with 2 vehicles (3,796, accounting for 51.0%) and females with 2 vehicles (3,011, making up 57.7%).
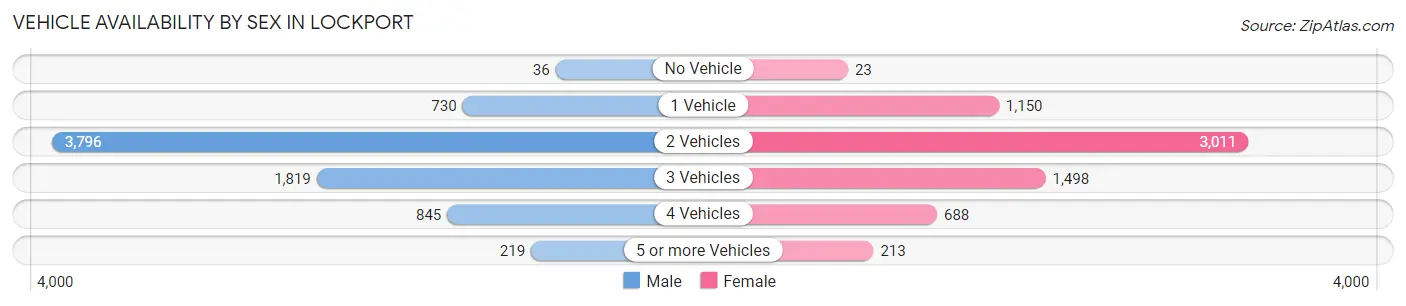
| Vehicles Available | Male | Female |
| No Vehicle | 36 (0.5%) | 23 (0.4%) |
| 1 Vehicle | 730 (9.8%) | 1,150 (17.5%) |
| 2 Vehicles | 3,796 (51.0%) | 3,011 (45.7%) |
| 3 Vehicles | 1,819 (24.4%) | 1,498 (22.8%) |
| 4 Vehicles | 845 (11.4%) | 688 (10.4%) |
| 5 or more Vehicles | 219 (2.9%) | 213 (3.2%) |
| Total | 7,445 (100.0%) | 6,583 (100.0%) |
Commute Time in Lockport
The most frequently occuring commute durations in Lockport are 45 to 59 minutes (1,574 commuters, 12.7%), 60 to 89 minutes (1,481 commuters, 11.9%), and 15 to 19 minutes (1,380 commuters, 11.1%).
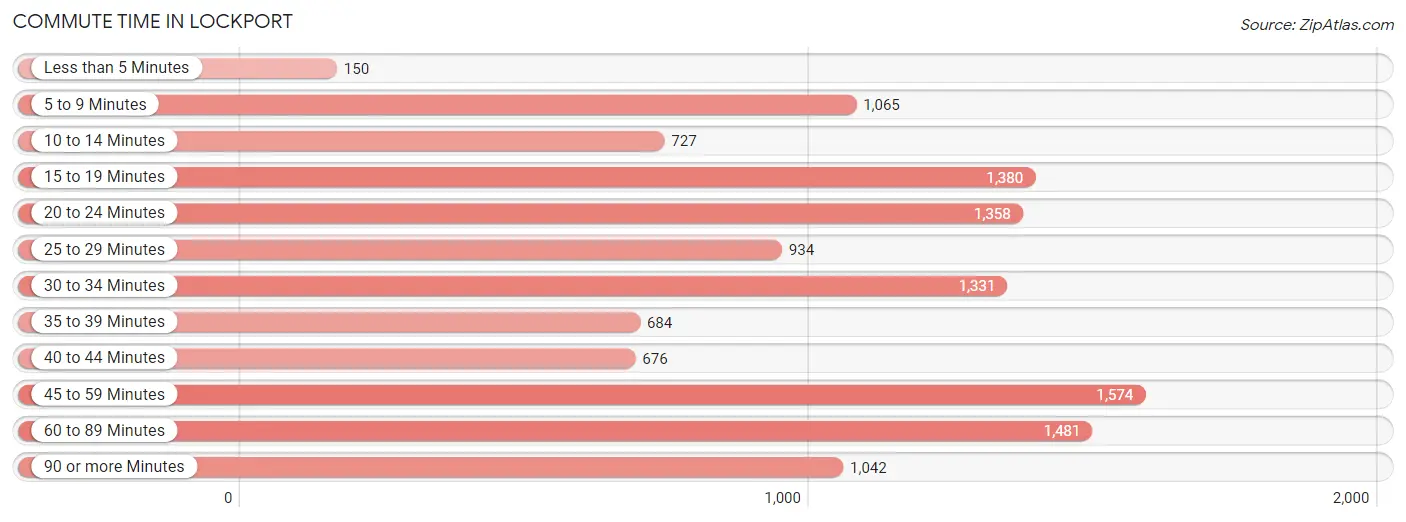
| Commute Time | # Commuters | % Commuters |
| Less than 5 Minutes | 150 | 1.2% |
| 5 to 9 Minutes | 1,065 | 8.6% |
| 10 to 14 Minutes | 727 | 5.9% |
| 15 to 19 Minutes | 1,380 | 11.1% |
| 20 to 24 Minutes | 1,358 | 11.0% |
| 25 to 29 Minutes | 934 | 7.5% |
| 30 to 34 Minutes | 1,331 | 10.7% |
| 35 to 39 Minutes | 684 | 5.5% |
| 40 to 44 Minutes | 676 | 5.4% |
| 45 to 59 Minutes | 1,574 | 12.7% |
| 60 to 89 Minutes | 1,481 | 11.9% |
| 90 or more Minutes | 1,042 | 8.4% |
Commute Time by Sex in Lockport
The most common commute times in Lockport are 60 to 89 minutes (966 commuters, 14.9%) for males and 15 to 19 minutes (844 commuters, 14.2%) for females.
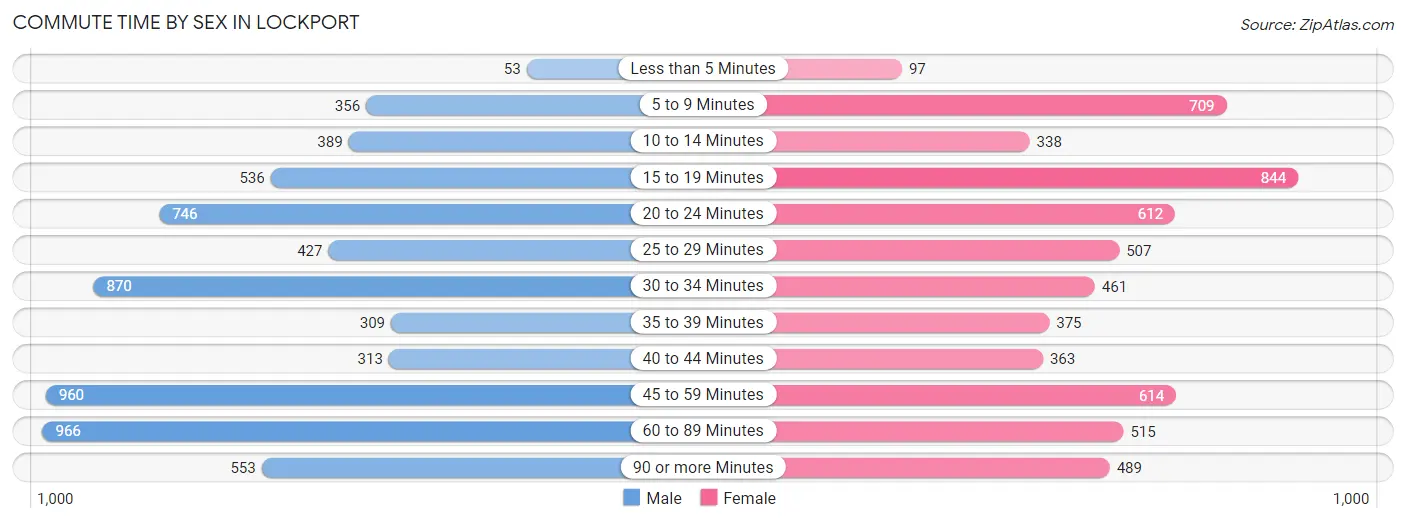
| Commute Time | Male | Female |
| Less than 5 Minutes | 53 (0.8%) | 97 (1.6%) |
| 5 to 9 Minutes | 356 (5.5%) | 709 (12.0%) |
| 10 to 14 Minutes | 389 (6.0%) | 338 (5.7%) |
| 15 to 19 Minutes | 536 (8.3%) | 844 (14.2%) |
| 20 to 24 Minutes | 746 (11.5%) | 612 (10.3%) |
| 25 to 29 Minutes | 427 (6.6%) | 507 (8.6%) |
| 30 to 34 Minutes | 870 (13.4%) | 461 (7.8%) |
| 35 to 39 Minutes | 309 (4.8%) | 375 (6.3%) |
| 40 to 44 Minutes | 313 (4.8%) | 363 (6.1%) |
| 45 to 59 Minutes | 960 (14.8%) | 614 (10.4%) |
| 60 to 89 Minutes | 966 (14.9%) | 515 (8.7%) |
| 90 or more Minutes | 553 (8.5%) | 489 (8.3%) |
Time of Departure to Work by Sex in Lockport
The most frequent times of departure to work in Lockport are 12:00 AM to 4:59 AM (909, 14.0%) for males and 7:00 AM to 7:29 AM (942, 15.9%) for females.
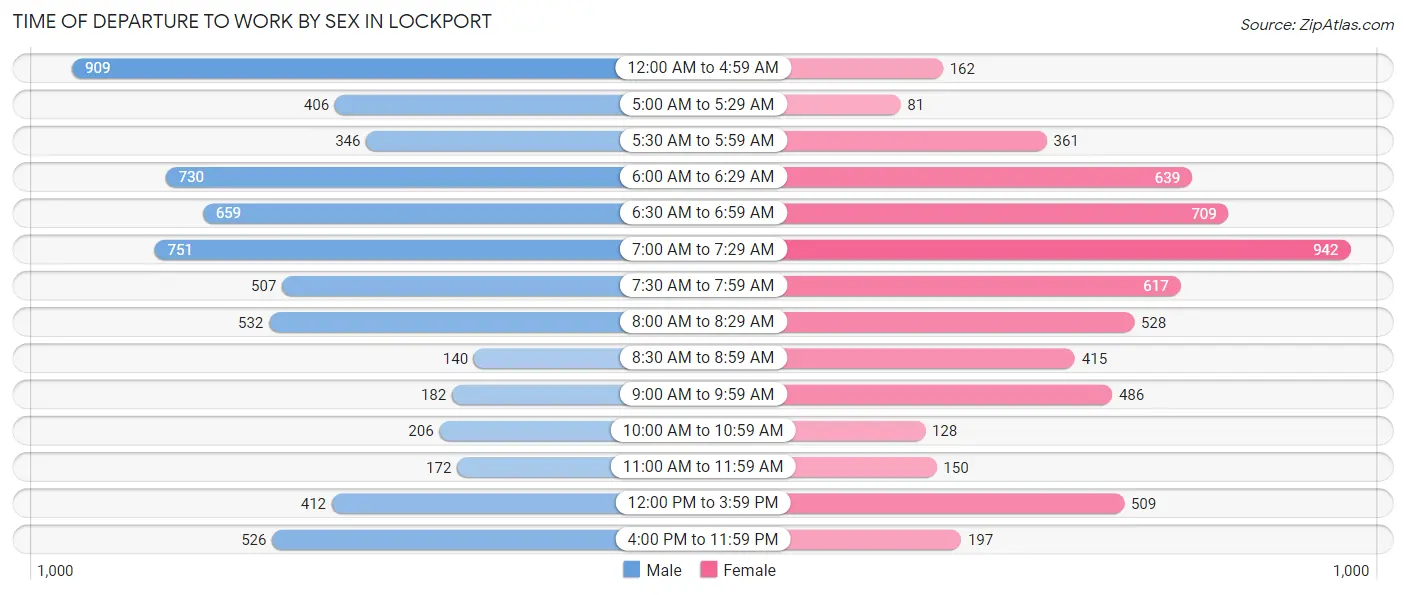
| Time of Departure | Male | Female |
| 12:00 AM to 4:59 AM | 909 (14.0%) | 162 (2.7%) |
| 5:00 AM to 5:29 AM | 406 (6.3%) | 81 (1.4%) |
| 5:30 AM to 5:59 AM | 346 (5.3%) | 361 (6.1%) |
| 6:00 AM to 6:29 AM | 730 (11.3%) | 639 (10.8%) |
| 6:30 AM to 6:59 AM | 659 (10.2%) | 709 (12.0%) |
| 7:00 AM to 7:29 AM | 751 (11.6%) | 942 (15.9%) |
| 7:30 AM to 7:59 AM | 507 (7.8%) | 617 (10.4%) |
| 8:00 AM to 8:29 AM | 532 (8.2%) | 528 (8.9%) |
| 8:30 AM to 8:59 AM | 140 (2.2%) | 415 (7.0%) |
| 9:00 AM to 9:59 AM | 182 (2.8%) | 486 (8.2%) |
| 10:00 AM to 10:59 AM | 206 (3.2%) | 128 (2.2%) |
| 11:00 AM to 11:59 AM | 172 (2.7%) | 150 (2.5%) |
| 12:00 PM to 3:59 PM | 412 (6.4%) | 509 (8.6%) |
| 4:00 PM to 11:59 PM | 526 (8.1%) | 197 (3.3%) |
| Total | 6,478 (100.0%) | 5,924 (100.0%) |
Housing Occupancy in Lockport
Occupancy by Ownership in Lockport
Of the total 9,507 dwellings in Lockport, owner-occupied units account for 7,819 (82.2%), while renter-occupied units make up 1,688 (17.8%).
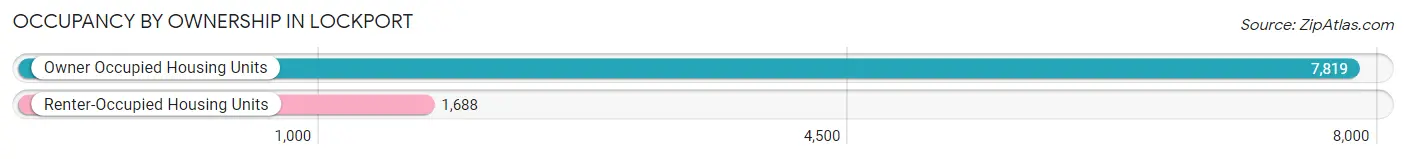
| Occupancy | # Housing Units | % Housing Units |
| Owner Occupied Housing Units | 7,819 | 82.2% |
| Renter-Occupied Housing Units | 1,688 | 17.8% |
| Total Occupied Housing Units | 9,507 | 100.0% |
Occupancy by Household Size in Lockport
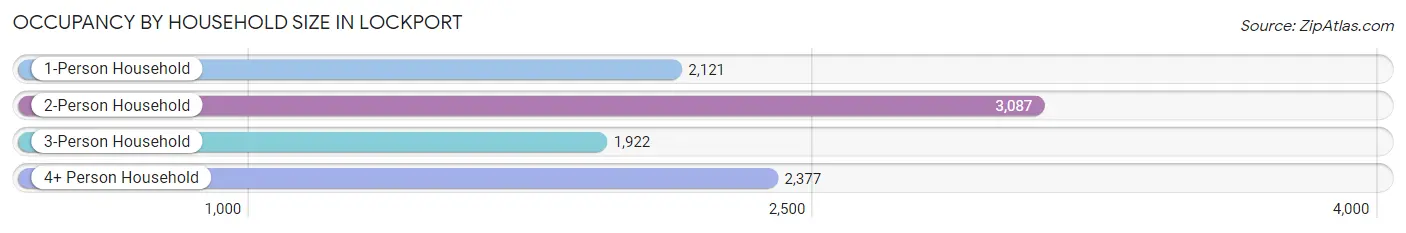
| Household Size | # Housing Units | % Housing Units |
| 1-Person Household | 2,121 | 22.3% |
| 2-Person Household | 3,087 | 32.5% |
| 3-Person Household | 1,922 | 20.2% |
| 4+ Person Household | 2,377 | 25.0% |
| Total Housing Units | 9,507 | 100.0% |
Occupancy by Ownership by Household Size in Lockport
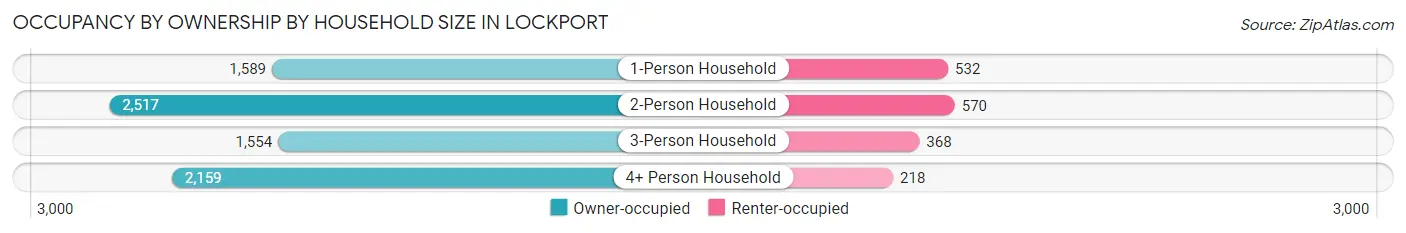
| Household Size | Owner-occupied | Renter-occupied |
| 1-Person Household | 1,589 (74.9%) | 532 (25.1%) |
| 2-Person Household | 2,517 (81.5%) | 570 (18.5%) |
| 3-Person Household | 1,554 (80.8%) | 368 (19.2%) |
| 4+ Person Household | 2,159 (90.8%) | 218 (9.2%) |
| Total Housing Units | 7,819 (82.2%) | 1,688 (17.8%) |
Occupancy by Educational Attainment in Lockport
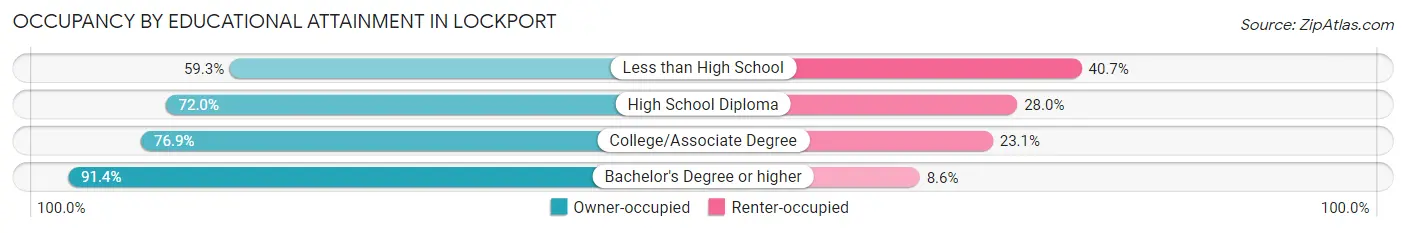
| Household Size | Owner-occupied | Renter-occupied |
| Less than High School | 131 (59.3%) | 90 (40.7%) |
| High School Diploma | 1,530 (72.0%) | 594 (28.0%) |
| College/Associate Degree | 2,048 (76.9%) | 616 (23.1%) |
| Bachelor's Degree or higher | 4,110 (91.4%) | 388 (8.6%) |
Occupancy by Age of Householder in Lockport
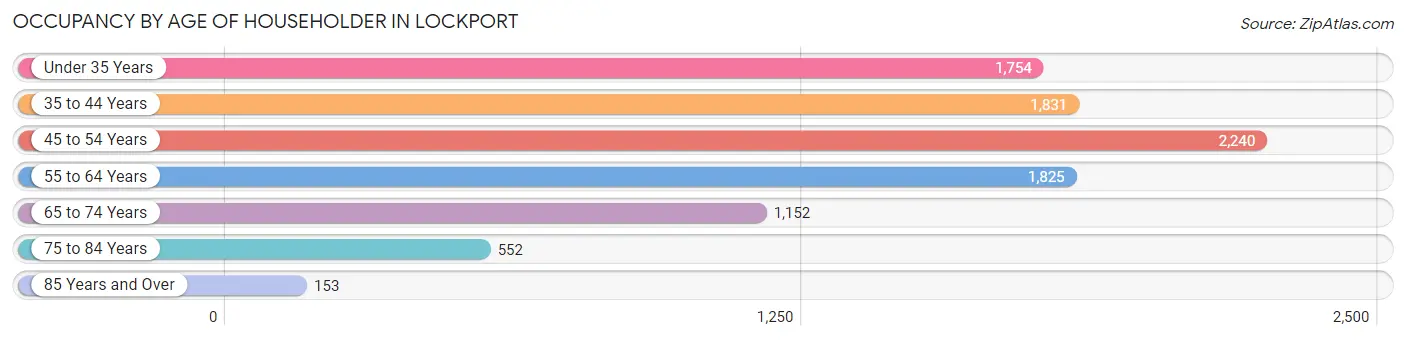
| Age Bracket | # Households | % Households |
| Under 35 Years | 1,754 | 18.4% |
| 35 to 44 Years | 1,831 | 19.3% |
| 45 to 54 Years | 2,240 | 23.6% |
| 55 to 64 Years | 1,825 | 19.2% |
| 65 to 74 Years | 1,152 | 12.1% |
| 75 to 84 Years | 552 | 5.8% |
| 85 Years and Over | 153 | 1.6% |
| Total | 9,507 | 100.0% |
Housing Finances in Lockport
Median Income by Occupancy in Lockport
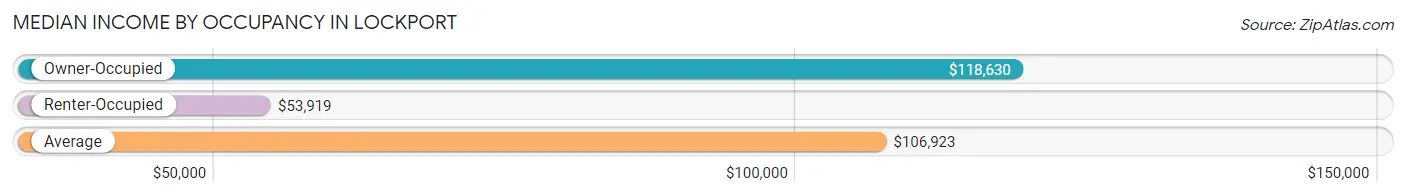
| Occupancy Type | # Households | Median Income |
| Owner-Occupied | 7,819 (82.2%) | $118,630 |
| Renter-Occupied | 1,688 (17.8%) | $53,919 |
| Average | 9,507 (100.0%) | $106,923 |
Occupancy by Householder Income Bracket in Lockport
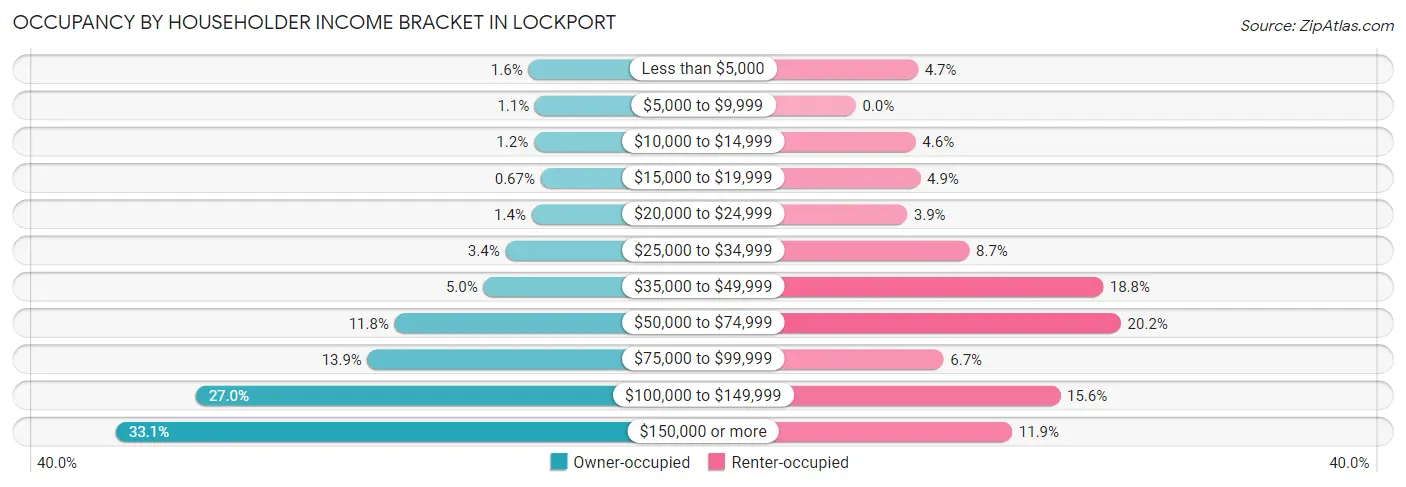
| Income Bracket | Owner-occupied | Renter-occupied |
| Less than $5,000 | 126 (1.6%) | 80 (4.7%) |
| $5,000 to $9,999 | 87 (1.1%) | 0 (0.0%) |
| $10,000 to $14,999 | 93 (1.2%) | 77 (4.6%) |
| $15,000 to $19,999 | 52 (0.7%) | 83 (4.9%) |
| $20,000 to $24,999 | 106 (1.4%) | 66 (3.9%) |
| $25,000 to $34,999 | 263 (3.4%) | 146 (8.6%) |
| $35,000 to $49,999 | 393 (5.0%) | 318 (18.8%) |
| $50,000 to $74,999 | 923 (11.8%) | 341 (20.2%) |
| $75,000 to $99,999 | 1,084 (13.9%) | 113 (6.7%) |
| $100,000 to $149,999 | 2,108 (27.0%) | 263 (15.6%) |
| $150,000 or more | 2,584 (33.1%) | 201 (11.9%) |
| Total | 7,819 (100.0%) | 1,688 (100.0%) |
Monthly Housing Cost Tiers in Lockport
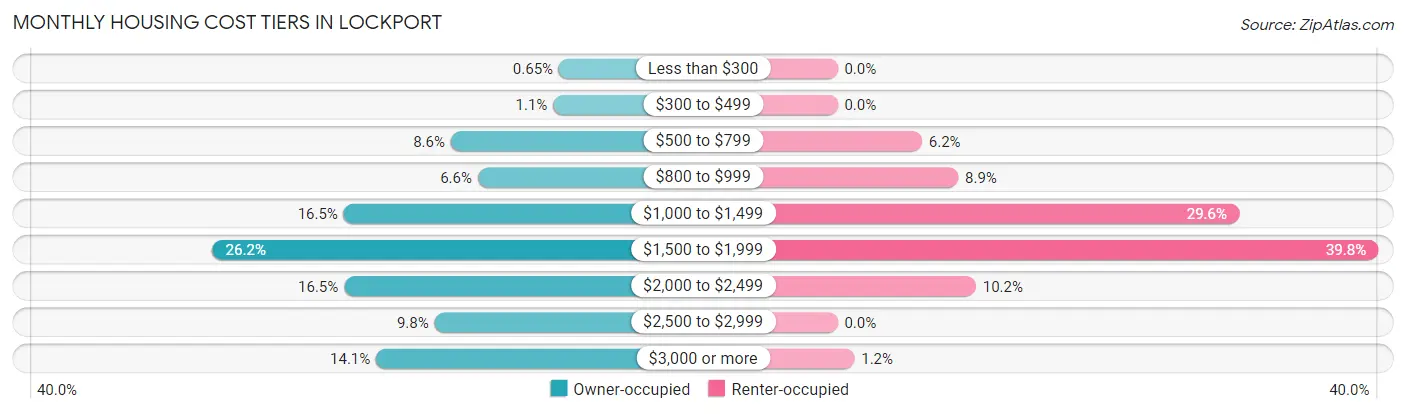
| Monthly Cost | Owner-occupied | Renter-occupied |
| Less than $300 | 51 (0.6%) | 0 (0.0%) |
| $300 to $499 | 84 (1.1%) | 0 (0.0%) |
| $500 to $799 | 673 (8.6%) | 105 (6.2%) |
| $800 to $999 | 518 (6.6%) | 150 (8.9%) |
| $1,000 to $1,499 | 1,290 (16.5%) | 499 (29.6%) |
| $1,500 to $1,999 | 2,045 (26.2%) | 672 (39.8%) |
| $2,000 to $2,499 | 1,288 (16.5%) | 172 (10.2%) |
| $2,500 to $2,999 | 767 (9.8%) | 0 (0.0%) |
| $3,000 or more | 1,103 (14.1%) | 21 (1.2%) |
| Total | 7,819 (100.0%) | 1,688 (100.0%) |
Physical Housing Characteristics in Lockport
Housing Structures in Lockport
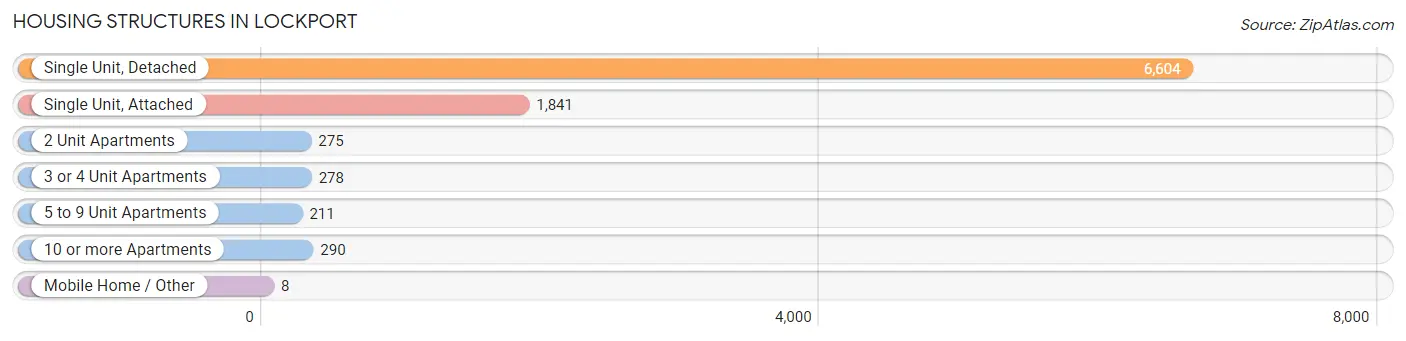
| Structure Type | # Housing Units | % Housing Units |
| Single Unit, Detached | 6,604 | 69.5% |
| Single Unit, Attached | 1,841 | 19.4% |
| 2 Unit Apartments | 275 | 2.9% |
| 3 or 4 Unit Apartments | 278 | 2.9% |
| 5 to 9 Unit Apartments | 211 | 2.2% |
| 10 or more Apartments | 290 | 3.0% |
| Mobile Home / Other | 8 | 0.1% |
| Total | 9,507 | 100.0% |
Housing Structures by Occupancy in Lockport
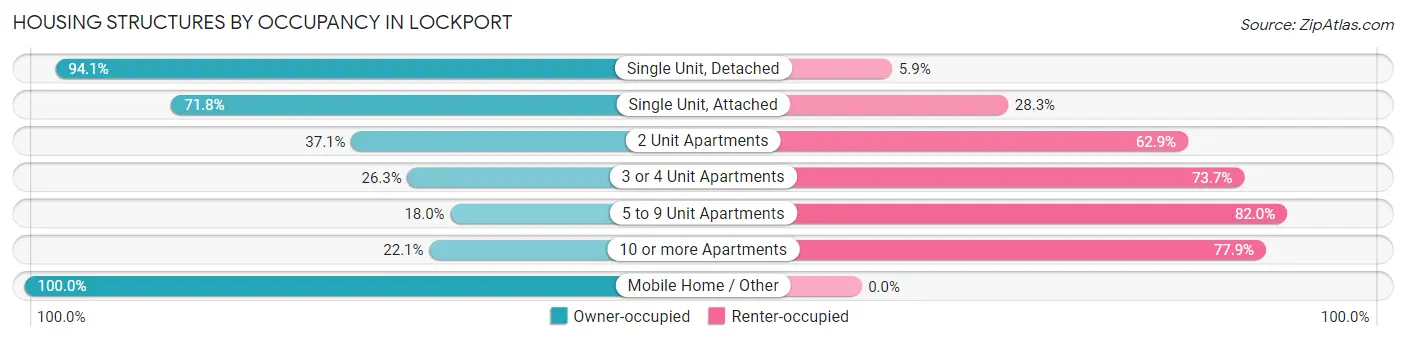
| Structure Type | Owner-occupied | Renter-occupied |
| Single Unit, Detached | 6,213 (94.1%) | 391 (5.9%) |
| Single Unit, Attached | 1,321 (71.8%) | 520 (28.2%) |
| 2 Unit Apartments | 102 (37.1%) | 173 (62.9%) |
| 3 or 4 Unit Apartments | 73 (26.3%) | 205 (73.7%) |
| 5 to 9 Unit Apartments | 38 (18.0%) | 173 (82.0%) |
| 10 or more Apartments | 64 (22.1%) | 226 (77.9%) |
| Mobile Home / Other | 8 (100.0%) | 0 (0.0%) |
| Total | 7,819 (82.2%) | 1,688 (17.8%) |
Housing Structures by Number of Rooms in Lockport
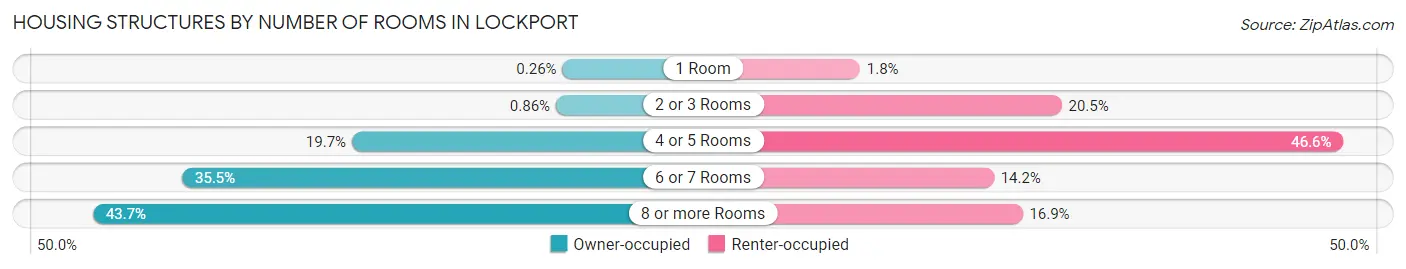
| Number of Rooms | Owner-occupied | Renter-occupied |
| 1 Room | 20 (0.3%) | 31 (1.8%) |
| 2 or 3 Rooms | 67 (0.9%) | 346 (20.5%) |
| 4 or 5 Rooms | 1,543 (19.7%) | 786 (46.6%) |
| 6 or 7 Rooms | 2,772 (35.4%) | 240 (14.2%) |
| 8 or more Rooms | 3,417 (43.7%) | 285 (16.9%) |
| Total | 7,819 (100.0%) | 1,688 (100.0%) |
Housing Structure by Heating Type in Lockport
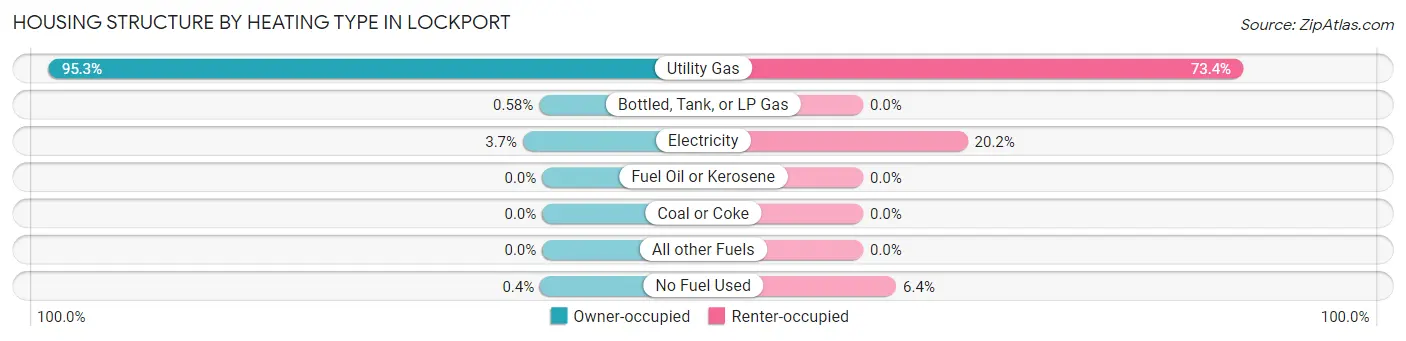
| Heating Type | Owner-occupied | Renter-occupied |
| Utility Gas | 7,452 (95.3%) | 1,239 (73.4%) |
| Bottled, Tank, or LP Gas | 45 (0.6%) | 0 (0.0%) |
| Electricity | 291 (3.7%) | 341 (20.2%) |
| Fuel Oil or Kerosene | 0 (0.0%) | 0 (0.0%) |
| Coal or Coke | 0 (0.0%) | 0 (0.0%) |
| All other Fuels | 0 (0.0%) | 0 (0.0%) |
| No Fuel Used | 31 (0.4%) | 108 (6.4%) |
| Total | 7,819 (100.0%) | 1,688 (100.0%) |
Household Vehicle Usage in Lockport
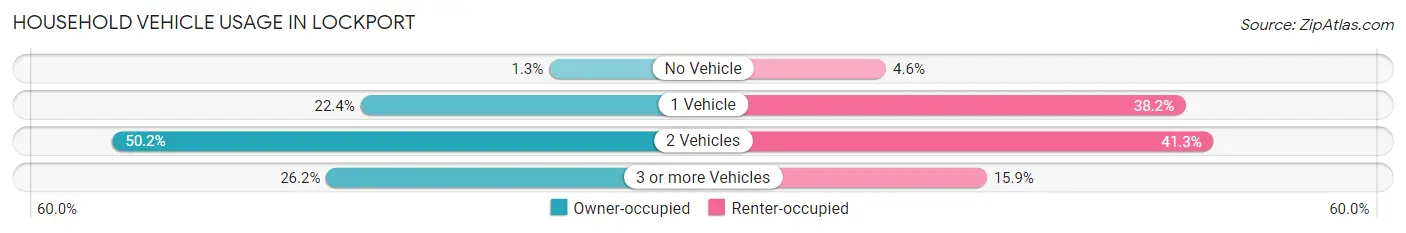
| Vehicles per Household | Owner-occupied | Renter-occupied |
| No Vehicle | 98 (1.3%) | 78 (4.6%) |
| 1 Vehicle | 1,749 (22.4%) | 645 (38.2%) |
| 2 Vehicles | 3,923 (50.2%) | 697 (41.3%) |
| 3 or more Vehicles | 2,049 (26.2%) | 268 (15.9%) |
| Total | 7,819 (100.0%) | 1,688 (100.0%) |
Real Estate & Mortgages in Lockport
Real Estate and Mortgage Overview in Lockport
| Characteristic | Without Mortgage | With Mortgage |
| Housing Units | 2,294 | 5,525 |
| Median Property Value | $271,000 | $293,000 |
| Median Household Income | $81,613 | $2,095 |
| Monthly Housing Costs | $951 | $1,096 |
| Real Estate Taxes | $7,083 | $127 |
Property Value by Mortgage Status in Lockport
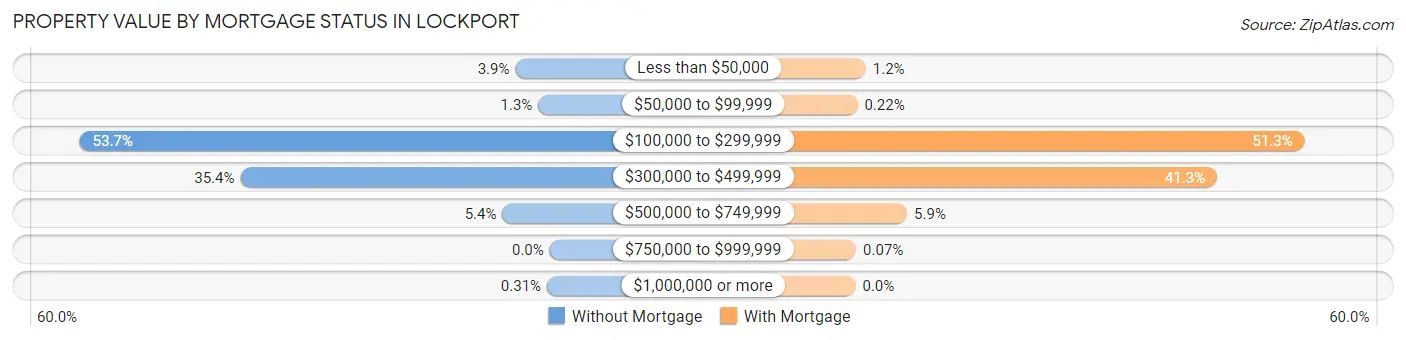
| Property Value | Without Mortgage | With Mortgage |
| Less than $50,000 | 90 (3.9%) | 65 (1.2%) |
| $50,000 to $99,999 | 30 (1.3%) | 12 (0.2%) |
| $100,000 to $299,999 | 1,232 (53.7%) | 2,835 (51.3%) |
| $300,000 to $499,999 | 811 (35.3%) | 2,283 (41.3%) |
| $500,000 to $749,999 | 124 (5.4%) | 326 (5.9%) |
| $750,000 to $999,999 | 0 (0.0%) | 4 (0.1%) |
| $1,000,000 or more | 7 (0.3%) | 0 (0.0%) |
| Total | 2,294 (100.0%) | 5,525 (100.0%) |
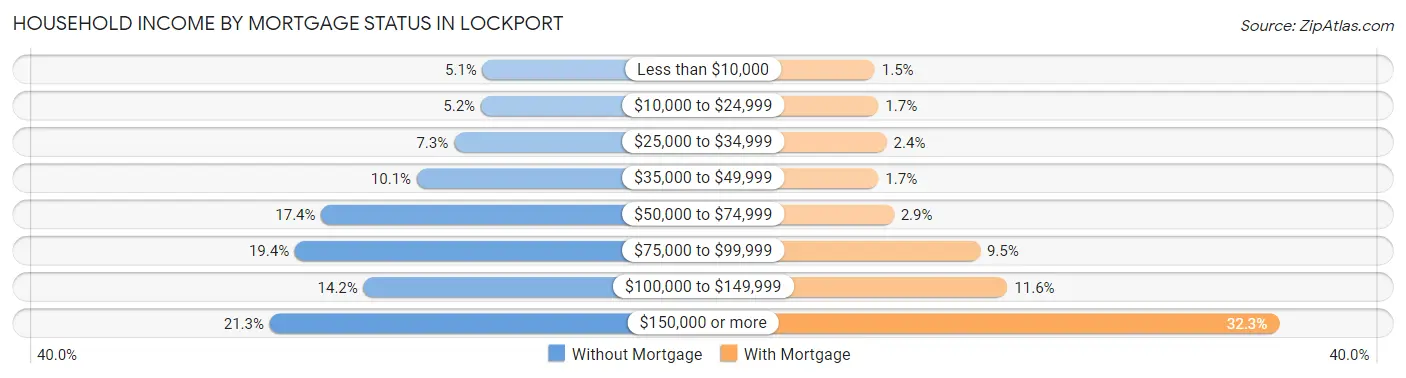
Household Income by Mortgage Status in Lockport
| Household Income | Without Mortgage | With Mortgage |
| Less than $10,000 | 117 (5.1%) | 81 (1.5%) |
| $10,000 to $24,999 | 120 (5.2%) | 96 (1.7%) |
| $25,000 to $34,999 | 167 (7.3%) | 131 (2.4%) |
| $35,000 to $49,999 | 232 (10.1%) | 96 (1.7%) |
| $50,000 to $74,999 | 399 (17.4%) | 161 (2.9%) |
| $75,000 to $99,999 | 445 (19.4%) | 524 (9.5%) |
| $100,000 to $149,999 | 325 (14.2%) | 639 (11.6%) |
| $150,000 or more | 489 (21.3%) | 1,783 (32.3%) |
| Total | 2,294 (100.0%) | 5,525 (100.0%) |
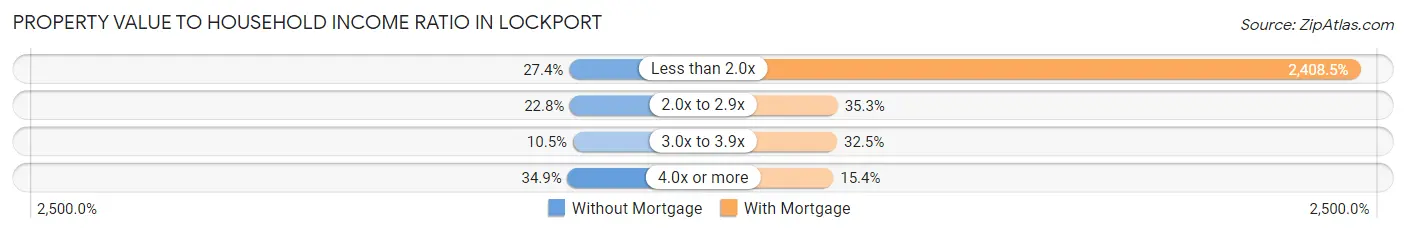
Property Value to Household Income Ratio in Lockport
| Value-to-Income Ratio | Without Mortgage | With Mortgage |
| Less than 2.0x | 628 (27.4%) | 133,072 (2,408.5%) |
| 2.0x to 2.9x | 524 (22.8%) | 1,950 (35.3%) |
| 3.0x to 3.9x | 241 (10.5%) | 1,796 (32.5%) |
| 4.0x or more | 800 (34.9%) | 853 (15.4%) |
| Total | 2,294 (100.0%) | 5,525 (100.0%) |
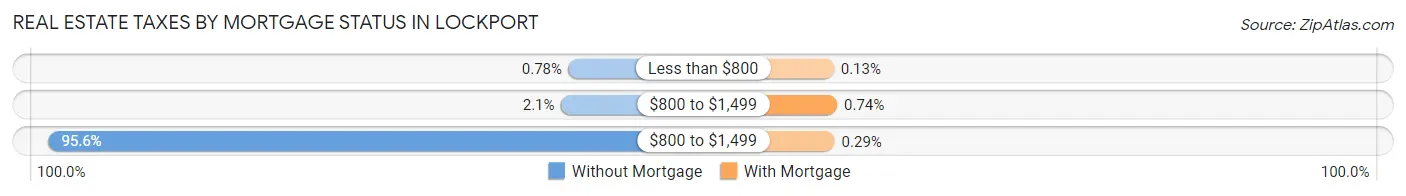
Real Estate Taxes by Mortgage Status in Lockport
| Property Taxes | Without Mortgage | With Mortgage |
| Less than $800 | 18 (0.8%) | 7 (0.1%) |
| $800 to $1,499 | 49 (2.1%) | 41 (0.7%) |
| $800 to $1,499 | 2,194 (95.6%) | 16 (0.3%) |
| Total | 2,294 (100.0%) | 5,525 (100.0%) |
Health & Disability in Lockport
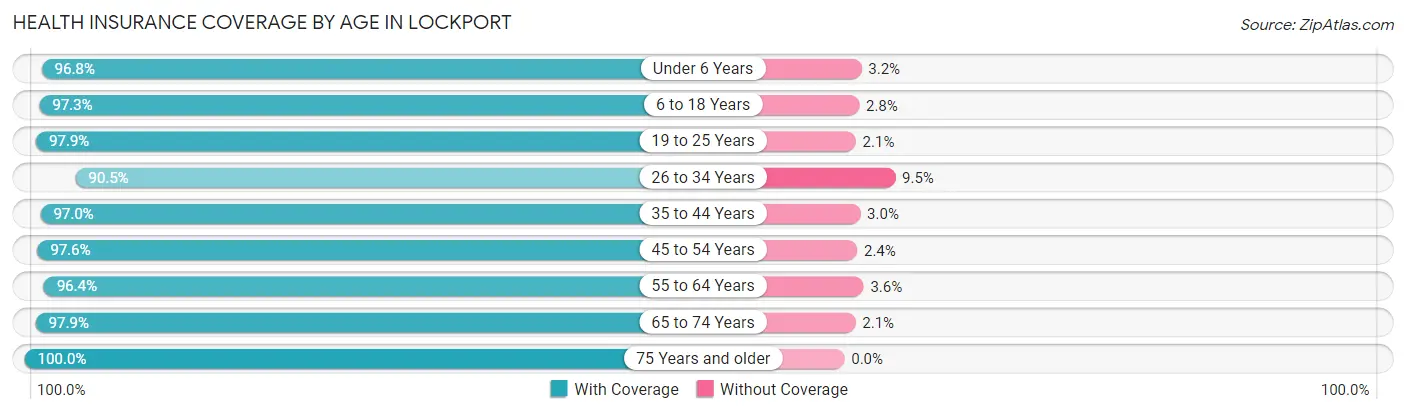
Health Insurance Coverage by Age in Lockport
| Age Bracket | With Coverage | Without Coverage |
| Under 6 Years | 1,552 (96.8%) | 51 (3.2%) |
| 6 to 18 Years | 5,313 (97.3%) | 150 (2.8%) |
| 19 to 25 Years | 1,664 (97.9%) | 36 (2.1%) |
| 26 to 34 Years | 2,865 (90.5%) | 300 (9.5%) |
| 35 to 44 Years | 3,570 (97.0%) | 109 (3.0%) |
| 45 to 54 Years | 4,103 (97.6%) | 100 (2.4%) |
| 55 to 64 Years | 3,018 (96.4%) | 112 (3.6%) |
| 65 to 74 Years | 1,993 (97.9%) | 42 (2.1%) |
| 75 Years and older | 1,042 (100.0%) | 0 (0.0%) |
| Total | 25,120 (96.5%) | 900 (3.5%) |
Health Insurance Coverage by Citizenship Status in Lockport
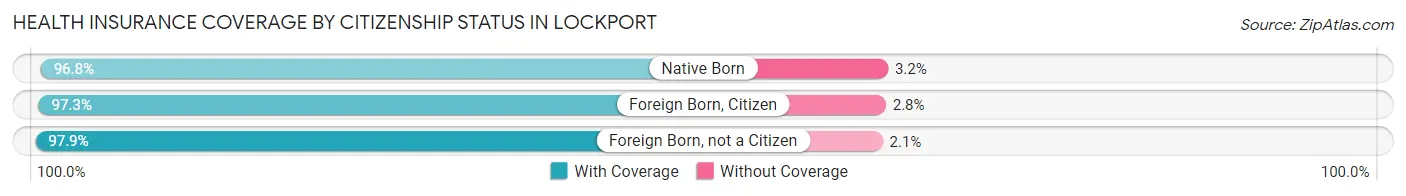
| Citizenship Status | With Coverage | Without Coverage |
| Native Born | 1,552 (96.8%) | 51 (3.2%) |
| Foreign Born, Citizen | 5,313 (97.3%) | 150 (2.8%) |
| Foreign Born, not a Citizen | 1,664 (97.9%) | 36 (2.1%) |
Health Insurance Coverage by Household Income in Lockport
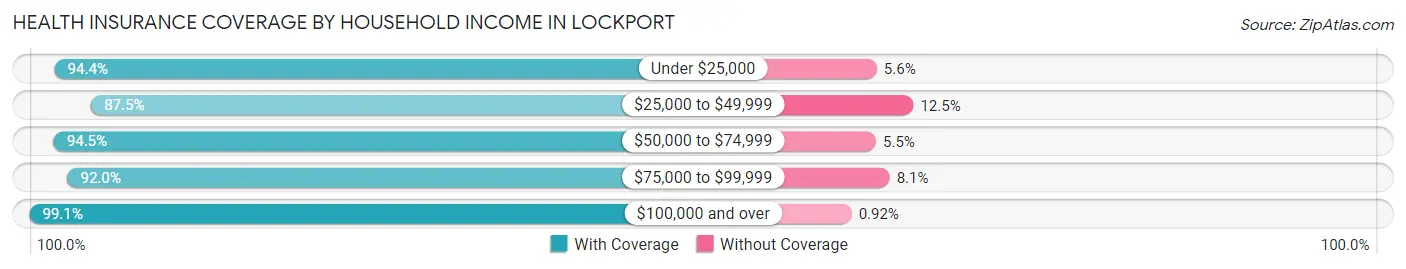
| Household Income | With Coverage | Without Coverage |
| Under $25,000 | 1,272 (94.4%) | 76 (5.6%) |
| $25,000 to $49,999 | 2,039 (87.5%) | 291 (12.5%) |
| $50,000 to $74,999 | 2,582 (94.5%) | 150 (5.5%) |
| $75,000 to $99,999 | 2,593 (91.9%) | 227 (8.1%) |
| $100,000 and over | 16,602 (99.1%) | 155 (0.9%) |
Public vs Private Health Insurance Coverage by Age in Lockport
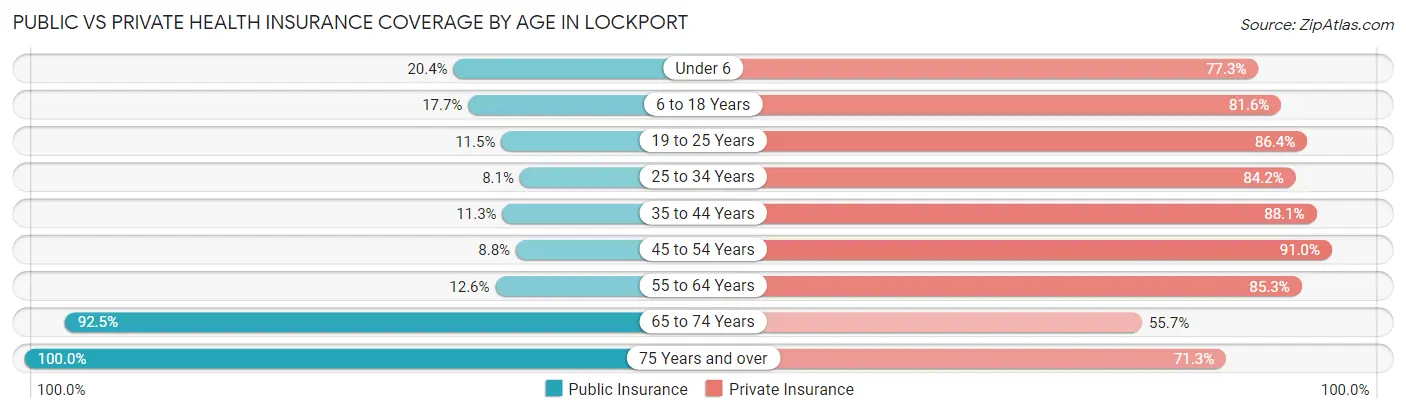
| Age Bracket | Public Insurance | Private Insurance |
| Under 6 | 327 (20.4%) | 1,239 (77.3%) |
| 6 to 18 Years | 965 (17.7%) | 4,455 (81.6%) |
| 19 to 25 Years | 196 (11.5%) | 1,468 (86.4%) |
| 25 to 34 Years | 256 (8.1%) | 2,666 (84.2%) |
| 35 to 44 Years | 416 (11.3%) | 3,241 (88.1%) |
| 45 to 54 Years | 370 (8.8%) | 3,823 (91.0%) |
| 55 to 64 Years | 395 (12.6%) | 2,671 (85.3%) |
| 65 to 74 Years | 1,883 (92.5%) | 1,134 (55.7%) |
| 75 Years and over | 1,042 (100.0%) | 743 (71.3%) |
| Total | 5,850 (22.5%) | 21,440 (82.4%) |
Disability Status by Sex by Age in Lockport
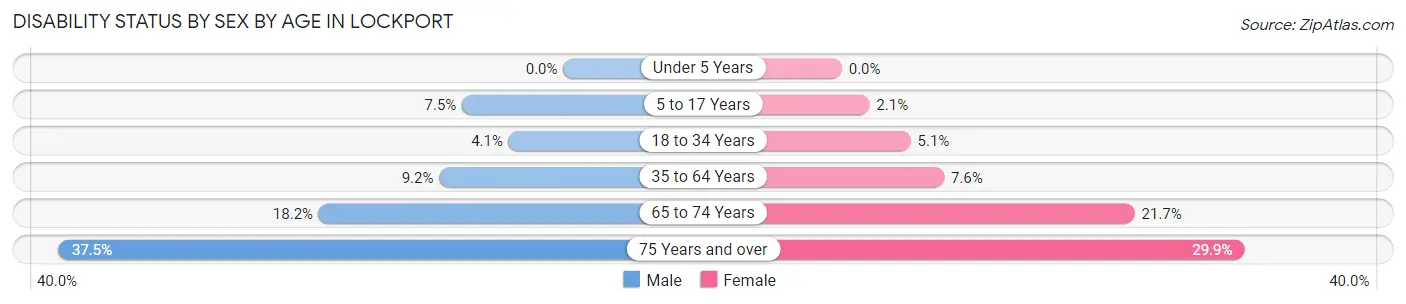
| Age Bracket | Male | Female |
| Under 5 Years | 0 (0.0%) | 0 (0.0%) |
| 5 to 17 Years | 179 (7.5%) | 60 (2.1%) |
| 18 to 34 Years | 107 (4.1%) | 137 (5.1%) |
| 35 to 64 Years | 531 (9.2%) | 398 (7.6%) |
| 65 to 74 Years | 169 (18.1%) | 240 (21.7%) |
| 75 Years and over | 112 (37.5%) | 222 (29.9%) |
Disability Class by Sex by Age in Lockport
Disability Class: Hearing Difficulty
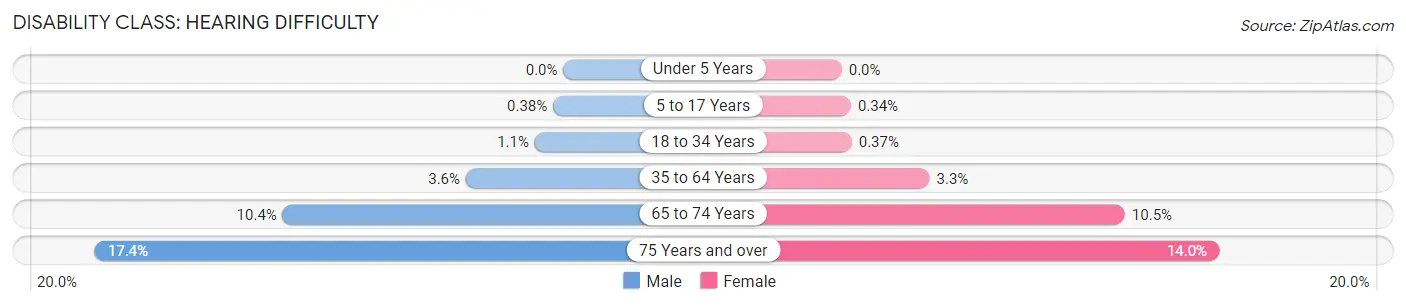
| Age Bracket | Male | Female |
| Under 5 Years | 0 (0.0%) | 0 (0.0%) |
| 5 to 17 Years | 9 (0.4%) | 10 (0.3%) |
| 18 to 34 Years | 28 (1.1%) | 10 (0.4%) |
| 35 to 64 Years | 209 (3.6%) | 171 (3.3%) |
| 65 to 74 Years | 97 (10.4%) | 116 (10.5%) |
| 75 Years and over | 52 (17.4%) | 104 (14.0%) |
Disability Class: Vision Difficulty
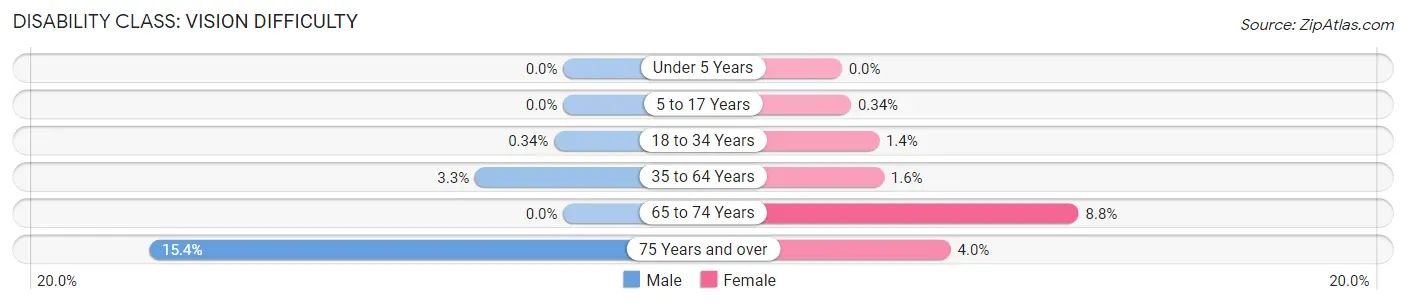
| Age Bracket | Male | Female |
| Under 5 Years | 0 (0.0%) | 0 (0.0%) |
| 5 to 17 Years | 0 (0.0%) | 10 (0.3%) |
| 18 to 34 Years | 9 (0.3%) | 37 (1.4%) |
| 35 to 64 Years | 189 (3.3%) | 82 (1.6%) |
| 65 to 74 Years | 0 (0.0%) | 97 (8.8%) |
| 75 Years and over | 46 (15.4%) | 30 (4.0%) |
Disability Class: Cognitive Difficulty
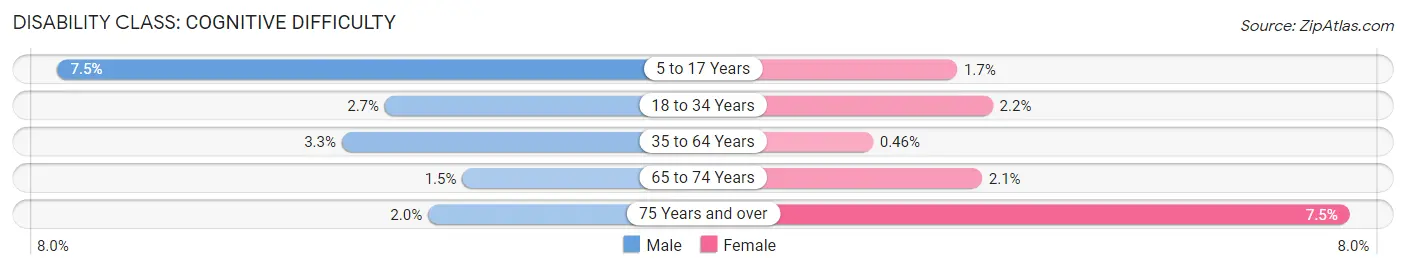
| Age Bracket | Male | Female |
| 5 to 17 Years | 179 (7.5%) | 50 (1.7%) |
| 18 to 34 Years | 70 (2.6%) | 60 (2.2%) |
| 35 to 64 Years | 190 (3.3%) | 24 (0.5%) |
| 65 to 74 Years | 14 (1.5%) | 23 (2.1%) |
| 75 Years and over | 6 (2.0%) | 56 (7.5%) |
Disability Class: Ambulatory Difficulty
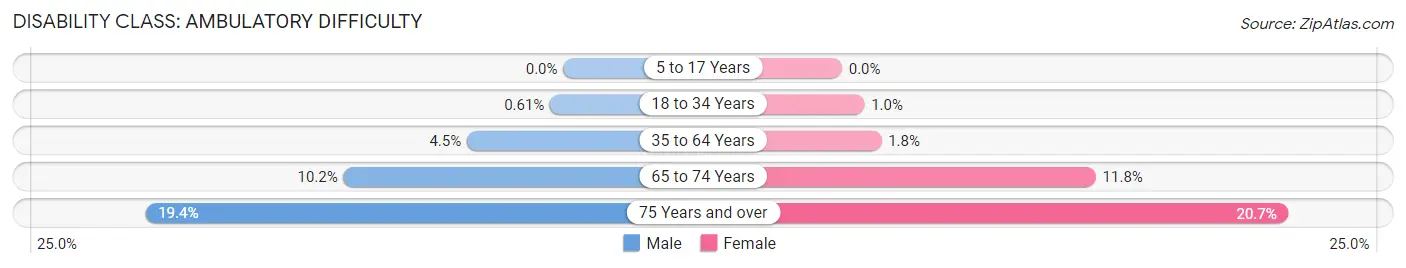
| Age Bracket | Male | Female |
| 5 to 17 Years | 0 (0.0%) | 0 (0.0%) |
| 18 to 34 Years | 16 (0.6%) | 28 (1.0%) |
| 35 to 64 Years | 258 (4.5%) | 96 (1.8%) |
| 65 to 74 Years | 95 (10.2%) | 130 (11.8%) |
| 75 Years and over | 58 (19.4%) | 154 (20.7%) |
Disability Class: Self-Care Difficulty
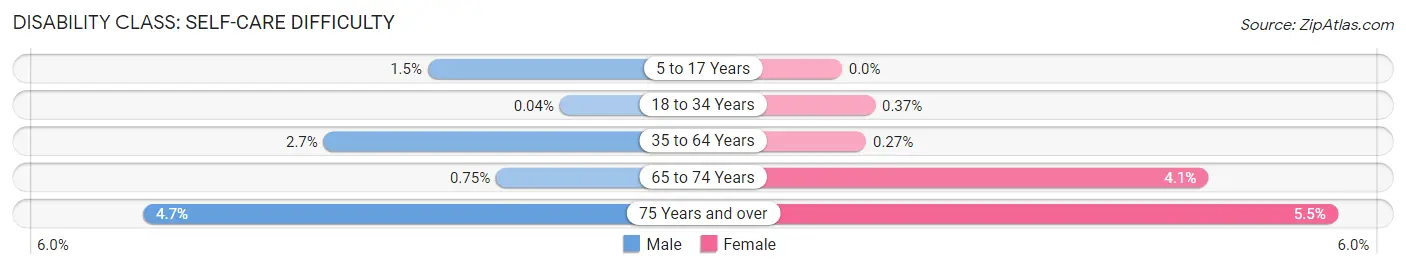
| Age Bracket | Male | Female |
| 5 to 17 Years | 36 (1.5%) | 0 (0.0%) |
| 18 to 34 Years | 1 (0.0%) | 10 (0.4%) |
| 35 to 64 Years | 154 (2.7%) | 14 (0.3%) |
| 65 to 74 Years | 7 (0.7%) | 45 (4.1%) |
| 75 Years and over | 14 (4.7%) | 41 (5.5%) |
Technology Access in Lockport
Computing Device Access in Lockport
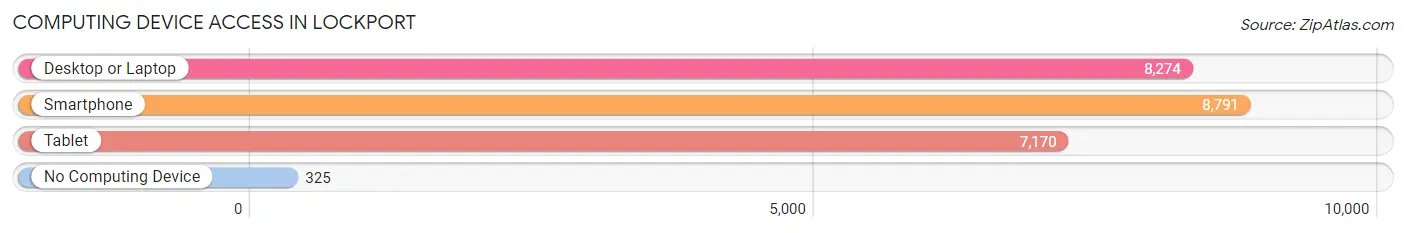
| Device Type | # Households | % Households |
| Desktop or Laptop | 8,274 | 87.0% |
| Smartphone | 8,791 | 92.5% |
| Tablet | 7,170 | 75.4% |
| No Computing Device | 325 | 3.4% |
| Total | 9,507 | 100.0% |
Internet Access in Lockport
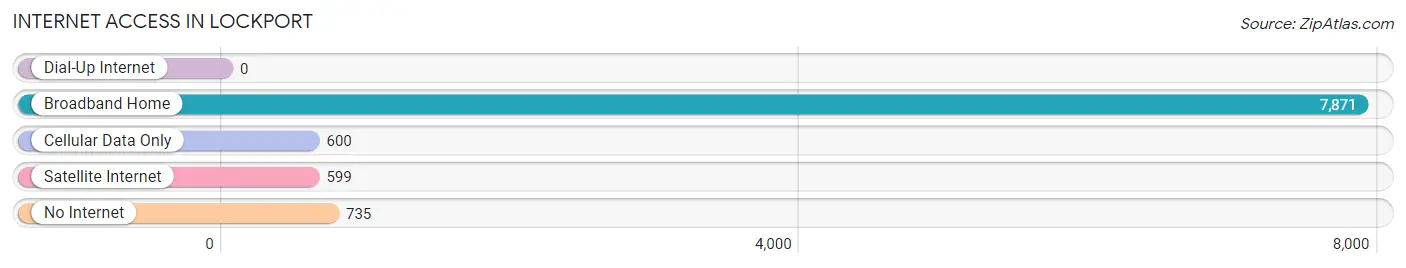
| Internet Type | # Households | % Households |
| Dial-Up Internet | 0 | 0.0% |
| Broadband Home | 7,871 | 82.8% |
| Cellular Data Only | 600 | 6.3% |
| Satellite Internet | 599 | 6.3% |
| No Internet | 735 | 7.7% |
| Total | 9,507 | 100.0% |
Lockport Summary
Lockport, Illinois is a city located in Will County, Illinois, United States. It is located approximately 30 miles southwest of Chicago and is part of the Chicago metropolitan area. The population of Lockport was 24,839 at the 2010 census, making it the largest city in Will County.
History
The area that is now Lockport was first settled in the 1830s by settlers from New York. The city was named after the locks on the Illinois and Michigan Canal, which were built in the area in the 1830s. The locks were used to raise and lower boats between the Des Plaines and Illinois rivers. The locks were eventually replaced by the Chicago Sanitary and Ship Canal in 1900.
The city of Lockport was officially incorporated in 1853. The city grew rapidly in the late 19th and early 20th centuries, due to its proximity to Chicago and its access to the Illinois and Michigan Canal. The city was also home to several industries, including the Lockport Manufacturing Company, which produced agricultural equipment.
Geography
Lockport is located in northeastern Illinois, approximately 30 miles southwest of Chicago. The city is situated on the Des Plaines River, which flows through the city from east to west. The city is bordered by Homer Township to the north, Lemont Township to the east, Lockport Township to the south, and Joliet Township to the west.
The city has a total area of 8.9 square miles, of which 8.7 square miles is land and 0.2 square miles is water. The city is located in the Chicago metropolitan area and is part of the Chicago-Naperville-Joliet metropolitan statistical area.
Economy
The economy of Lockport is largely based on manufacturing and retail. The city is home to several large manufacturing companies, including the Lockport Manufacturing Company, which produces agricultural equipment, and the Lockport Tool and Die Company, which produces industrial tools and dies. The city is also home to several retail stores, including Walmart, Target, and Kohl's.
The city is also home to several educational institutions, including Lewis University, Joliet Junior College, and the University of St. Francis. The city is also home to several healthcare facilities, including Silver Cross Hospital and the Lockport Medical Center.
Demographics
As of the 2010 census, the population of Lockport was 24,839. The racial makeup of the city was 87.2% White, 5.3% African American, 0.3% Native American, 2.2% Asian, 0.1% Pacific Islander, 2.7% from other races, and 2.4% from two or more races. Hispanic or Latino of any race were 8.3% of the population.
The median income for a household in the city was $60,945, and the median income for a family was $71,945. The per capita income for the city was $27,945. About 5.2% of families and 7.2% of the population were below the poverty line, including 9.2% of those under age 18 and 5.2% of those age 65 or over.
Common Questions
What is Per Capita Income in Lockport?
Per Capita income in Lockport is $43,957.
What is the Median Family Income in Lockport?
Median Family Income in Lockport is $120,740.
What is the Median Household income in Lockport?
Median Household Income in Lockport is $106,923.
What is Income or Wage Gap in Lockport?
Income or Wage Gap in Lockport is 23.0%.
Women in Lockport earn 77.0 cents for every dollar earned by a man.
What is Family Income Deficit in Lockport?
Family Income Deficit in Lockport is $11,578.
Families that are below poverty line in Lockport earn $11,578 less on average than the poverty threshold level.
What is Inequality or Gini Index in Lockport?
Inequality or Gini Index in Lockport is 0.36.
What is the Total Population of Lockport?
Total Population of Lockport is 26,119.
What is the Total Male Population of Lockport?
Total Male Population of Lockport is 12,788.
What is the Total Female Population of Lockport?
Total Female Population of Lockport is 13,331.
What is the Ratio of Males per 100 Females in Lockport?
There are 95.93 Males per 100 Females in Lockport.
What is the Ratio of Females per 100 Males in Lockport?
There are 104.25 Females per 100 Males in Lockport.
What is the Median Population Age in Lockport?
Median Population Age in Lockport is 38.0 Years.
What is the Average Family Size in Lockport
Average Family Size in Lockport is 3.2 People.
What is the Average Household Size in Lockport
Average Household Size in Lockport is 2.7 People.
How Large is the Labor Force in Lockport?
There are 14,964 People in the Labor Forcein in Lockport.
What is the Percentage of People in the Labor Force in Lockport?
73.0% of People are in the Labor Force in Lockport.
What is the Unemployment Rate in Lockport?
Unemployment Rate in Lockport is 4.6%.