Monmouth, IL Map & Demographics
Monmouth Map
Monmouth Overview
$27,553
PER CAPITA INCOME
$70,726
AVG FAMILY INCOME
$58,991
AVG HOUSEHOLD INCOME
39.3%
WAGE / INCOME GAP [ % ]
60.7¢/ $1
WAGE / INCOME GAP [ $ ]
0.43
INEQUALITY / GINI INDEX
8,764
TOTAL POPULATION
4,196
MALE POPULATION
4,568
FEMALE POPULATION
91.86
MALES / 100 FEMALES
108.87
FEMALES / 100 MALES
36.0
MEDIAN AGE
2.9
AVG FAMILY SIZE
2.4
AVG HOUSEHOLD SIZE
4,303
LABOR FORCE [ PEOPLE ]
61.8%
PERCENT IN LABOR FORCE
10.7%
UNEMPLOYMENT RATE
Monmouth Zip Codes
Monmouth Area Codes
Income in Monmouth
Income Overview in Monmouth
Per Capita Income in Monmouth is $27,553, while median incomes of families and households are $70,726 and $58,991 respectively.
| Characteristic | Number | Measure |
| Per Capita Income | 8,764 | $27,553 |
| Median Family Income | 2,160 | $70,726 |
| Mean Family Income | 2,160 | $78,780 |
| Median Household Income | 3,319 | $58,991 |
| Mean Household Income | 3,319 | $72,895 |
| Income Deficit | 2,160 | $0 |
| Wage / Income Gap (%) | 8,764 | 39.34% |
| Wage / Income Gap ($) | 8,764 | 60.66¢ per $1 |
| Gini / Inequality Index | 8,764 | 0.43 |
Earnings by Sex in Monmouth
Average Earnings in Monmouth are $29,690, $38,482 for men and $23,343 for women, a difference of 39.3%.
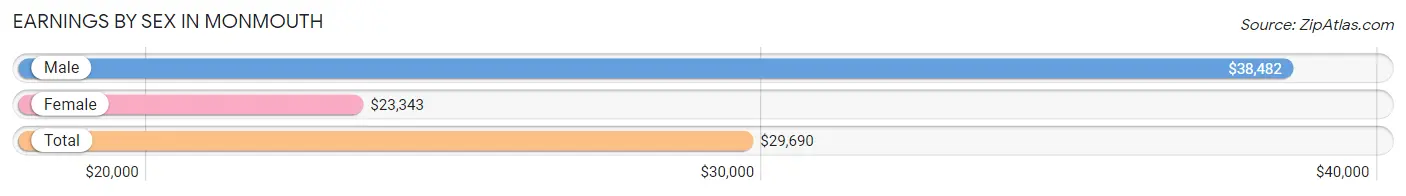
| Sex | Number | Average Earnings |
| Male | 2,251 (48.9%) | $38,482 |
| Female | 2,356 (51.1%) | $23,343 |
| Total | 4,607 (100.0%) | $29,690 |
Earnings by Sex by Income Bracket in Monmouth
The most common earnings brackets in Monmouth are $2,499 or less for men (263 | 11.7%) and $2,499 or less for women (328 | 13.9%).
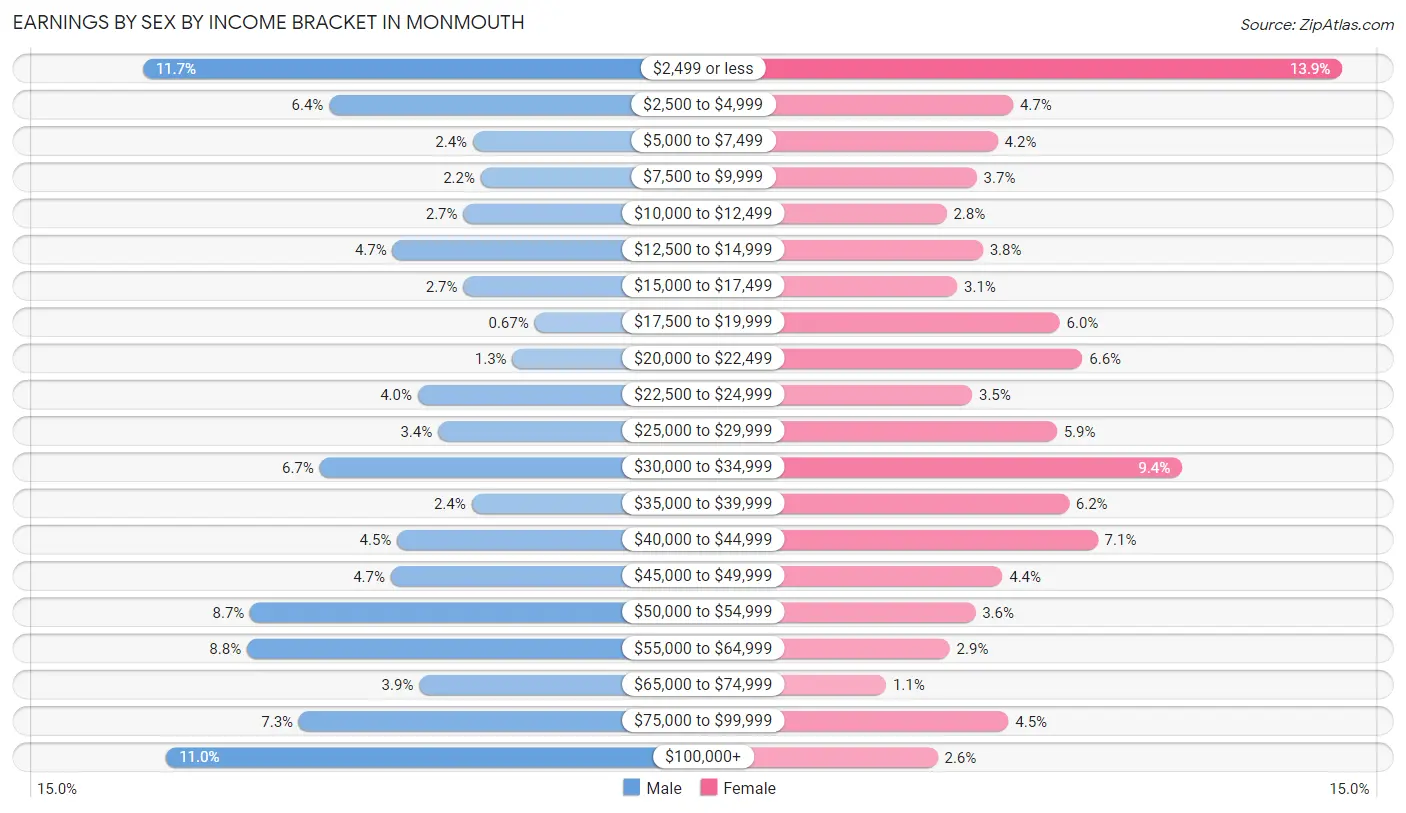
| Income | Male | Female |
| $2,499 or less | 263 (11.7%) | 328 (13.9%) |
| $2,500 to $4,999 | 145 (6.4%) | 110 (4.7%) |
| $5,000 to $7,499 | 54 (2.4%) | 100 (4.2%) |
| $7,500 to $9,999 | 49 (2.2%) | 86 (3.6%) |
| $10,000 to $12,499 | 60 (2.7%) | 66 (2.8%) |
| $12,500 to $14,999 | 105 (4.7%) | 90 (3.8%) |
| $15,000 to $17,499 | 60 (2.7%) | 73 (3.1%) |
| $17,500 to $19,999 | 15 (0.7%) | 141 (6.0%) |
| $20,000 to $22,499 | 29 (1.3%) | 156 (6.6%) |
| $22,500 to $24,999 | 89 (4.0%) | 83 (3.5%) |
| $25,000 to $29,999 | 76 (3.4%) | 139 (5.9%) |
| $30,000 to $34,999 | 151 (6.7%) | 222 (9.4%) |
| $35,000 to $39,999 | 55 (2.4%) | 147 (6.2%) |
| $40,000 to $44,999 | 102 (4.5%) | 166 (7.0%) |
| $45,000 to $49,999 | 106 (4.7%) | 103 (4.4%) |
| $50,000 to $54,999 | 195 (8.7%) | 85 (3.6%) |
| $55,000 to $64,999 | 197 (8.7%) | 68 (2.9%) |
| $65,000 to $74,999 | 88 (3.9%) | 26 (1.1%) |
| $75,000 to $99,999 | 164 (7.3%) | 107 (4.5%) |
| $100,000+ | 248 (11.0%) | 60 (2.5%) |
| Total | 2,251 (100.0%) | 2,356 (100.0%) |
Earnings by Sex by Educational Attainment in Monmouth
Average earnings in Monmouth are $50,464 for men and $31,000 for women, a difference of 38.6%. Men with an educational attainment of graduate degree enjoy the highest average annual earnings of $76,319, while those with less than high school education earn the least with $30,865. Women with an educational attainment of graduate degree earn the most with the average annual earnings of $48,173, while those with college or associate's degree education have the smallest earnings of $24,274.
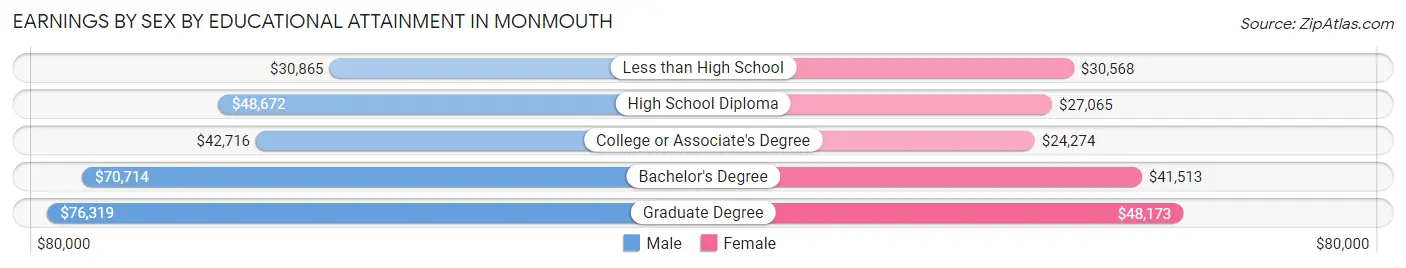
| Educational Attainment | Male Income | Female Income |
| Less than High School | $30,865 | $30,568 |
| High School Diploma | $48,672 | $27,065 |
| College or Associate's Degree | $42,716 | $24,274 |
| Bachelor's Degree | $70,714 | $41,513 |
| Graduate Degree | $76,319 | $48,173 |
| Total | $50,464 | $31,000 |
Family Income in Monmouth
Family Income Brackets in Monmouth
According to the Monmouth family income data, there are 557 families falling into the $50,000 to $74,999 income range, which is the most common income bracket and makes up 25.8% of all families. Conversely, the $10,000 to $14,999 income bracket is the least frequent group with only 50 families (2.3%) belonging to this category.
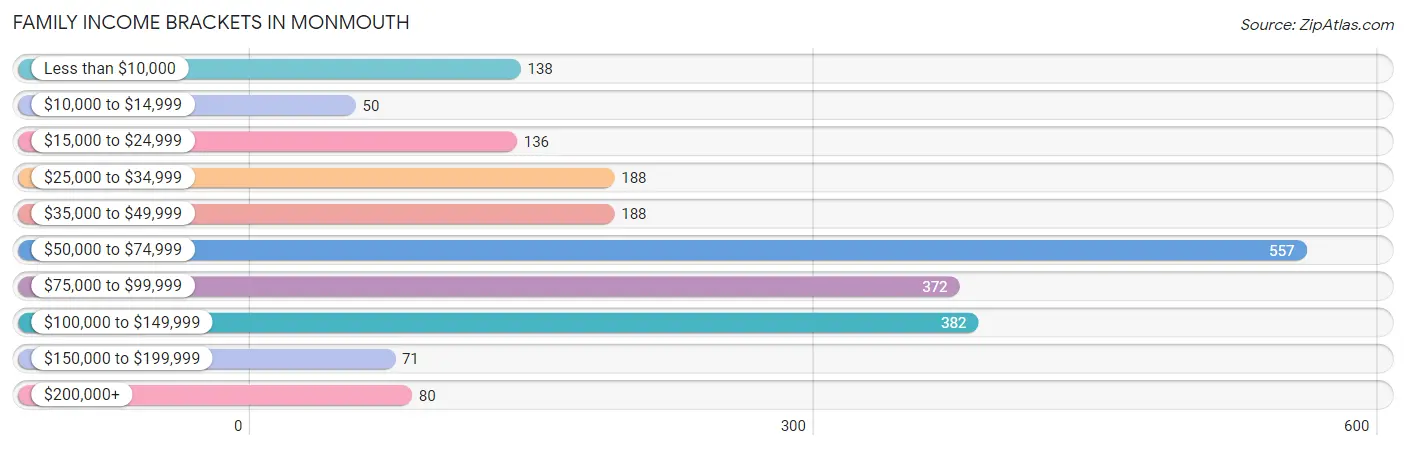
| Income Bracket | # Families | % Families |
| Less than $10,000 | 138 | 6.4% |
| $10,000 to $14,999 | 50 | 2.3% |
| $15,000 to $24,999 | 136 | 6.3% |
| $25,000 to $34,999 | 188 | 8.7% |
| $35,000 to $49,999 | 188 | 8.7% |
| $50,000 to $74,999 | 557 | 25.8% |
| $75,000 to $99,999 | 372 | 17.2% |
| $100,000 to $149,999 | 382 | 17.7% |
| $150,000 to $199,999 | 71 | 3.3% |
| $200,000+ | 80 | 3.7% |
Family Income by Famaliy Size in Monmouth
6-person families (25 | 1.2%) account for the highest median family income in Monmouth with $79,107 per family, while 2-person families (1,179 | 54.6%) have the highest median income of $36,823 per family member.
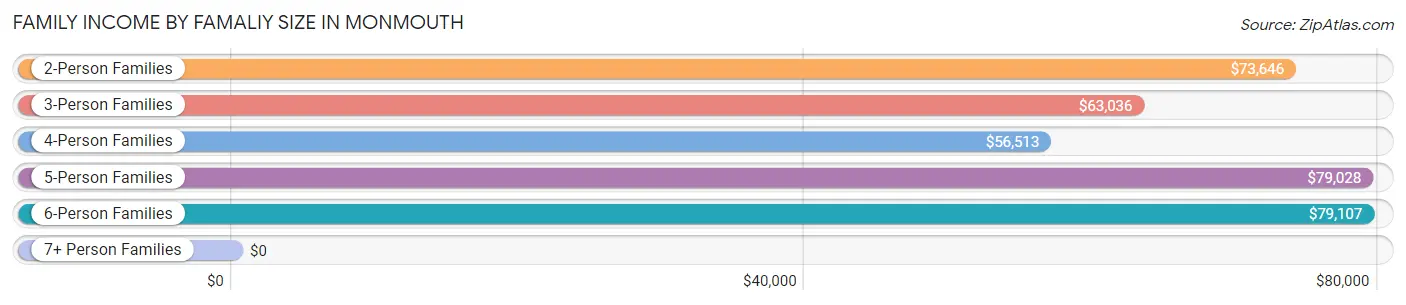
| Income Bracket | # Families | Median Income |
| 2-Person Families | 1,179 (54.6%) | $73,646 |
| 3-Person Families | 273 (12.6%) | $63,036 |
| 4-Person Families | 485 (22.5%) | $56,513 |
| 5-Person Families | 198 (9.2%) | $79,028 |
| 6-Person Families | 25 (1.2%) | $79,107 |
| 7+ Person Families | 0 (0.0%) | $0 |
| Total | 2,160 (100.0%) | $70,726 |
Family Income by Number of Earners in Monmouth
The median family income in Monmouth is $70,726, with families comprising 3+ earners (200) having the highest median family income of $91,563, while families with no earners (357) have the lowest median family income of $27,234, accounting for 9.3% and 16.5% of families, respectively.
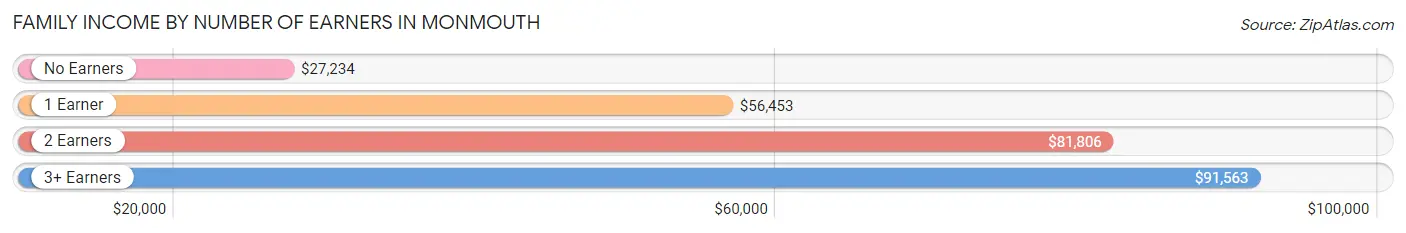
| Number of Earners | # Families | Median Income |
| No Earners | 357 (16.5%) | $27,234 |
| 1 Earner | 778 (36.0%) | $56,453 |
| 2 Earners | 825 (38.2%) | $81,806 |
| 3+ Earners | 200 (9.3%) | $91,563 |
| Total | 2,160 (100.0%) | $70,726 |
Household Income in Monmouth
Household Income Brackets in Monmouth
With 651 households falling in the category, the $50,000 to $74,999 income range is the most frequent in Monmouth, accounting for 19.6% of all households. In contrast, only 70 households (2.1%) fall into the $150,000 to $199,999 income bracket, making it the least populous group.
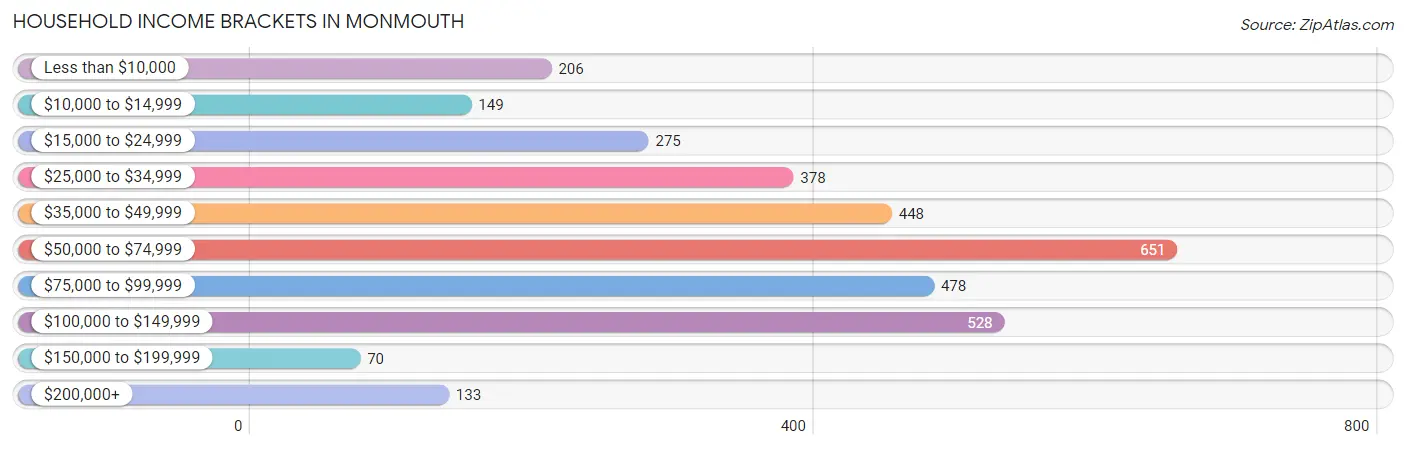
| Income Bracket | # Households | % Households |
| Less than $10,000 | 206 | 6.2% |
| $10,000 to $14,999 | 149 | 4.5% |
| $15,000 to $24,999 | 275 | 8.3% |
| $25,000 to $34,999 | 378 | 11.4% |
| $35,000 to $49,999 | 448 | 13.5% |
| $50,000 to $74,999 | 651 | 19.6% |
| $75,000 to $99,999 | 478 | 14.4% |
| $100,000 to $149,999 | 528 | 15.9% |
| $150,000 to $199,999 | 70 | 2.1% |
| $200,000+ | 133 | 4.0% |
Household Income by Householder Age in Monmouth
The median household income in Monmouth is $58,991, with the highest median household income of $69,133 found in the 45 to 64 years age bracket for the primary householder. A total of 1,380 households (41.6%) fall into this category. Meanwhile, the 65+ years age bracket for the primary householder has the lowest median household income of $42,781, with 985 households (29.7%) in this group.
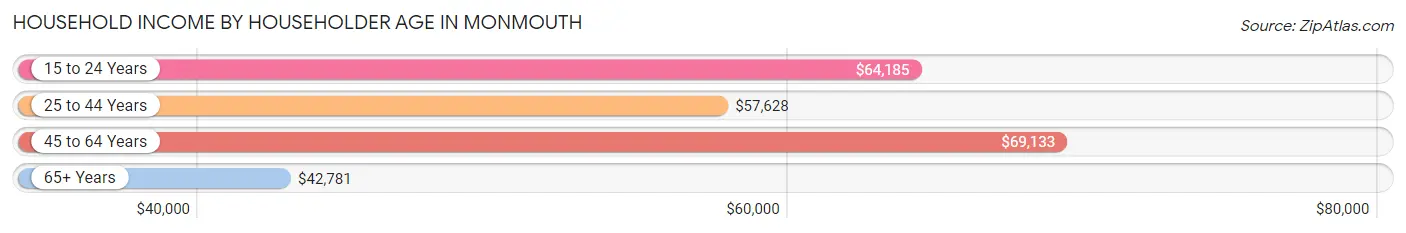
| Income Bracket | # Households | Median Income |
| 15 to 24 Years | 194 (5.9%) | $64,185 |
| 25 to 44 Years | 760 (22.9%) | $57,628 |
| 45 to 64 Years | 1,380 (41.6%) | $69,133 |
| 65+ Years | 985 (29.7%) | $42,781 |
| Total | 3,319 (100.0%) | $58,991 |
Poverty in Monmouth
Income Below Poverty by Sex and Age in Monmouth
With 18.1% poverty level for males and 18.8% for females among the residents of Monmouth, 5 year old males and 5 year old females are the most vulnerable to poverty, with 39 males (100.0%) and 45 females (83.3%) in their respective age groups living below the poverty level.
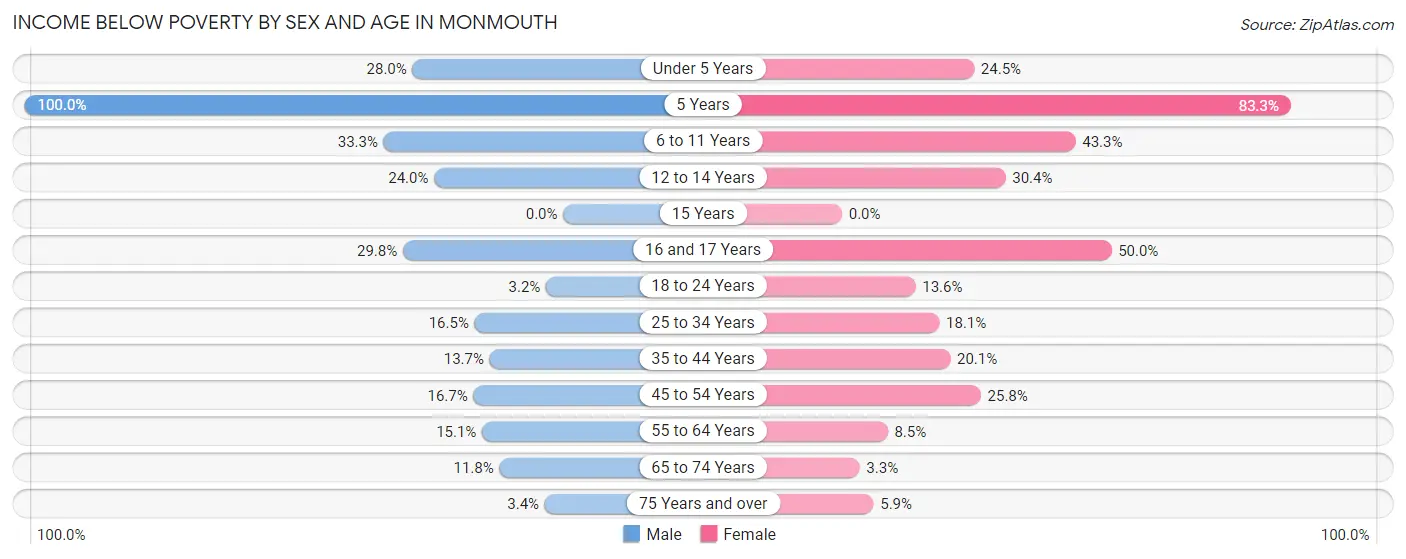
| Age Bracket | Male | Female |
| Under 5 Years | 61 (28.0%) | 38 (24.5%) |
| 5 Years | 39 (100.0%) | 45 (83.3%) |
| 6 to 11 Years | 164 (33.3%) | 140 (43.3%) |
| 12 to 14 Years | 46 (24.0%) | 61 (30.3%) |
| 15 Years | 0 (0.0%) | 0 (0.0%) |
| 16 and 17 Years | 47 (29.7%) | 35 (50.0%) |
| 18 to 24 Years | 11 (3.2%) | 42 (13.6%) |
| 25 to 34 Years | 62 (16.5%) | 78 (18.1%) |
| 35 to 44 Years | 52 (13.7%) | 89 (20.1%) |
| 45 to 54 Years | 74 (16.7%) | 150 (25.8%) |
| 55 to 64 Years | 81 (15.1%) | 50 (8.5%) |
| 65 to 74 Years | 45 (11.8%) | 15 (3.3%) |
| 75 Years and over | 8 (3.4%) | 19 (5.9%) |
| Total | 690 (18.1%) | 762 (18.8%) |
Income Above Poverty by Sex and Age in Monmouth
According to the poverty statistics in Monmouth, males aged 15 years and females aged 15 years are the age groups that are most secure financially, with 100.0% of males and 100.0% of females in these age groups living above the poverty line.
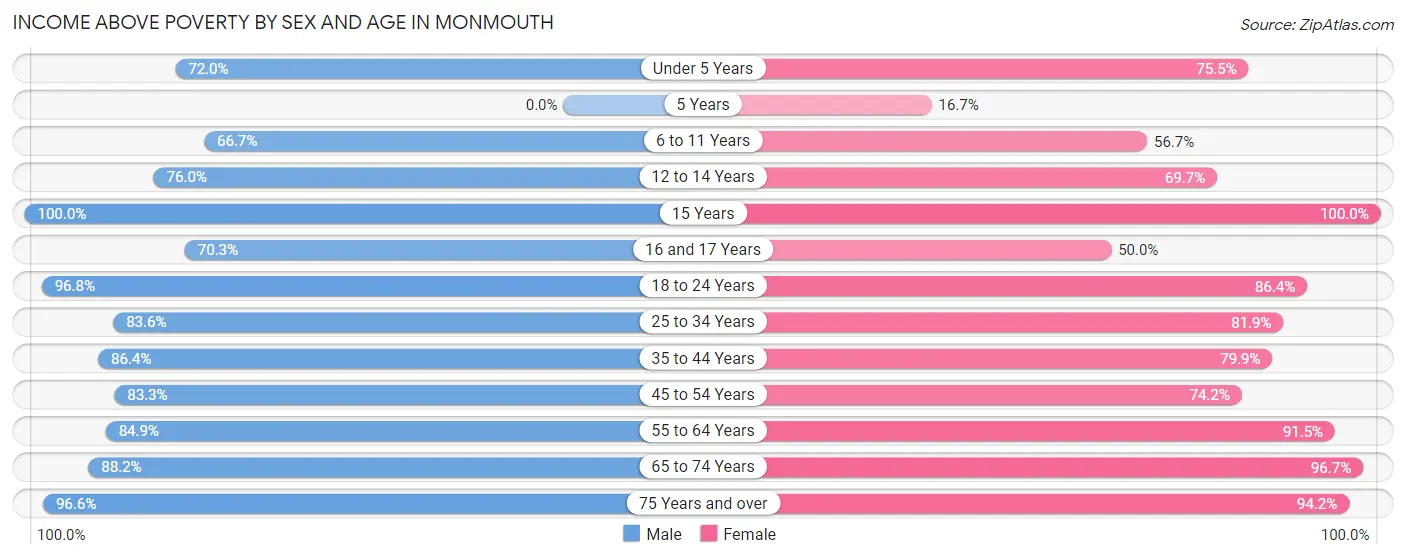
| Age Bracket | Male | Female |
| Under 5 Years | 157 (72.0%) | 117 (75.5%) |
| 5 Years | 0 (0.0%) | 9 (16.7%) |
| 6 to 11 Years | 328 (66.7%) | 183 (56.7%) |
| 12 to 14 Years | 146 (76.0%) | 140 (69.7%) |
| 15 Years | 12 (100.0%) | 113 (100.0%) |
| 16 and 17 Years | 111 (70.3%) | 35 (50.0%) |
| 18 to 24 Years | 334 (96.8%) | 266 (86.4%) |
| 25 to 34 Years | 315 (83.6%) | 354 (81.9%) |
| 35 to 44 Years | 329 (86.4%) | 354 (79.9%) |
| 45 to 54 Years | 370 (83.3%) | 432 (74.2%) |
| 55 to 64 Years | 457 (84.9%) | 540 (91.5%) |
| 65 to 74 Years | 335 (88.2%) | 444 (96.7%) |
| 75 Years and over | 226 (96.6%) | 306 (94.2%) |
| Total | 3,120 (81.9%) | 3,293 (81.2%) |
Income Below Poverty Among Married-Couple Families in Monmouth
The poverty statistics for married-couple families in Monmouth show that 7.6% or 100 of the total 1,320 families live below the poverty line. Families with 3 or 4 children have the highest poverty rate of 39.1%, comprising of 41 families. On the other hand, families with no children have the lowest poverty rate of 2.3%, which includes 20 families.
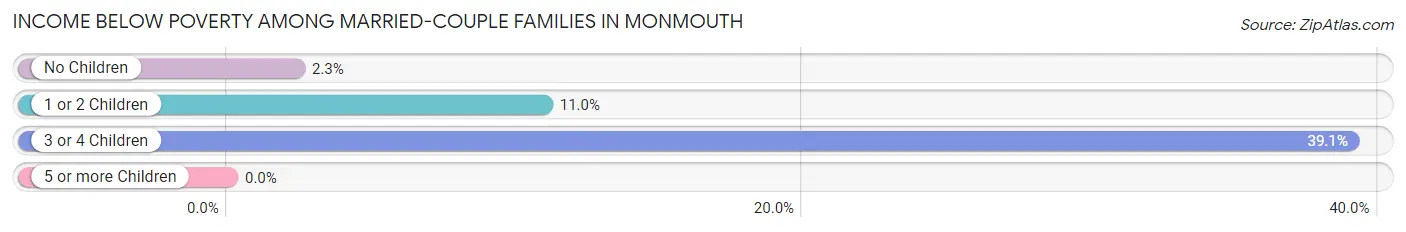
| Children | Above Poverty | Below Poverty |
| No Children | 839 (97.7%) | 20 (2.3%) |
| 1 or 2 Children | 317 (89.0%) | 39 (11.0%) |
| 3 or 4 Children | 64 (61.0%) | 41 (39.1%) |
| 5 or more Children | 0 (0.0%) | 0 (0.0%) |
| Total | 1,220 (92.4%) | 100 (7.6%) |
Income Below Poverty Among Single-Parent Households in Monmouth
According to the poverty data in Monmouth, 15.5% or 37 single-father households and 29.1% or 175 single-mother households are living below the poverty line. Among single-father households, those with 1 or 2 children have the highest poverty rate, with 37 households (44.1%) experiencing poverty. Likewise, among single-mother households, those with 1 or 2 children have the highest poverty rate, with 153 households (46.0%) falling below the poverty line.
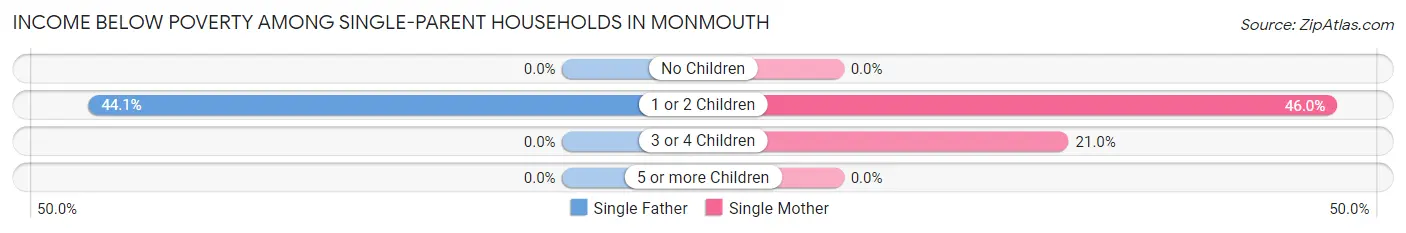
| Children | Single Father | Single Mother |
| No Children | 0 (0.0%) | 0 (0.0%) |
| 1 or 2 Children | 37 (44.1%) | 153 (46.0%) |
| 3 or 4 Children | 0 (0.0%) | 22 (20.9%) |
| 5 or more Children | 0 (0.0%) | 0 (0.0%) |
| Total | 37 (15.5%) | 175 (29.1%) |
Income Below Poverty Among Married-Couple vs Single-Parent Households in Monmouth
The poverty data for Monmouth shows that 100 of the married-couple family households (7.6%) and 212 of the single-parent households (25.2%) are living below the poverty level. Within the married-couple family households, those with 3 or 4 children have the highest poverty rate, with 41 households (39.1%) falling below the poverty line. Among the single-parent households, those with 1 or 2 children have the highest poverty rate, with 190 household (45.6%) living below poverty.
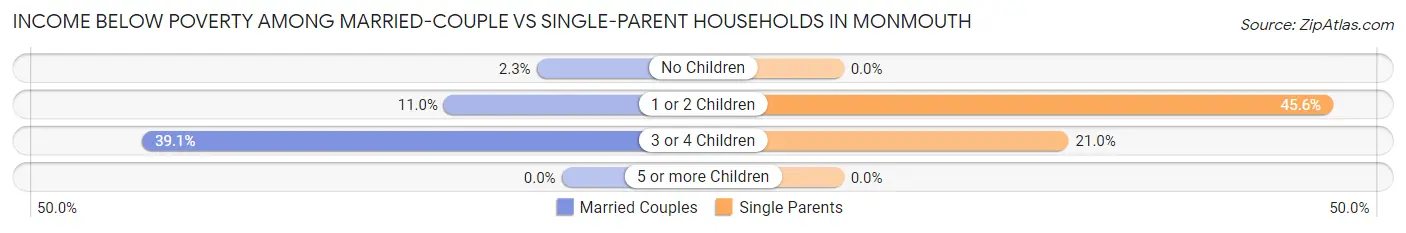
| Children | Married-Couple Families | Single-Parent Households |
| No Children | 20 (2.3%) | 0 (0.0%) |
| 1 or 2 Children | 39 (11.0%) | 190 (45.6%) |
| 3 or 4 Children | 41 (39.1%) | 22 (20.9%) |
| 5 or more Children | 0 (0.0%) | 0 (0.0%) |
| Total | 100 (7.6%) | 212 (25.2%) |
Race in Monmouth
The most populous races in Monmouth are White / Caucasian (6,540 | 74.6%), Hispanic or Latino (1,593 | 18.2%), and Some other Race (851 | 9.7%).
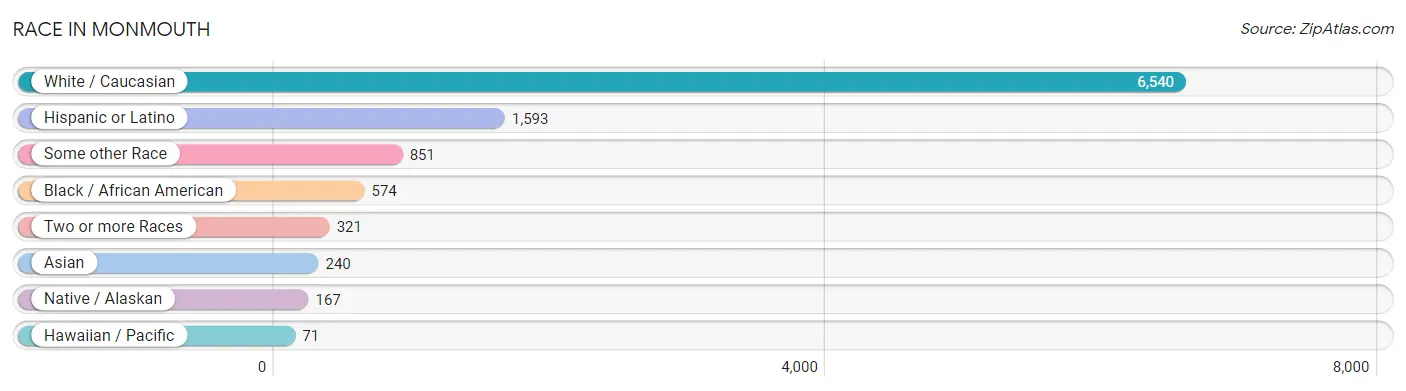
| Race | # Population | % Population |
| Asian | 240 | 2.7% |
| Black / African American | 574 | 6.6% |
| Hawaiian / Pacific | 71 | 0.8% |
| Hispanic or Latino | 1,593 | 18.2% |
| Native / Alaskan | 167 | 1.9% |
| White / Caucasian | 6,540 | 74.6% |
| Two or more Races | 321 | 3.7% |
| Some other Race | 851 | 9.7% |
| Total | 8,764 | 100.0% |
Ancestry in Monmouth
The most populous ancestries reported in Monmouth are German (1,476 | 16.8%), Mexican (1,302 | 14.9%), Irish (1,160 | 13.2%), English (533 | 6.1%), and American (355 | 4.1%), together accounting for 55.1% of all Monmouth residents.
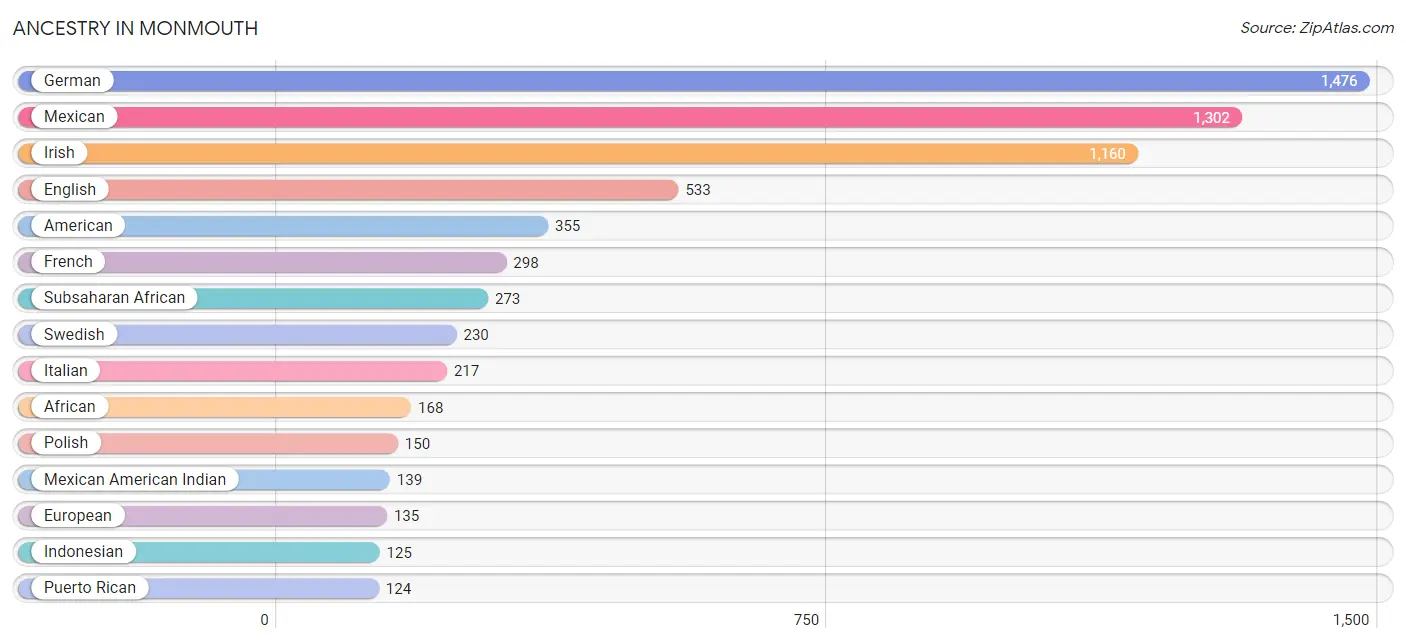
| Ancestry | # Population | % Population |
| African | 168 | 1.9% |
| American | 355 | 4.1% |
| Arab | 12 | 0.1% |
| Belgian | 16 | 0.2% |
| Bhutanese | 73 | 0.8% |
| British | 12 | 0.1% |
| Burmese | 9 | 0.1% |
| Central American | 43 | 0.5% |
| Central American Indian | 117 | 1.3% |
| Cherokee | 8 | 0.1% |
| Chippewa | 6 | 0.1% |
| Comanche | 3 | 0.0% |
| Cuban | 11 | 0.1% |
| Czech | 6 | 0.1% |
| Danish | 8 | 0.1% |
| Dutch | 89 | 1.0% |
| Egyptian | 12 | 0.1% |
| English | 533 | 6.1% |
| Ethiopian | 20 | 0.2% |
| European | 135 | 1.5% |
| Finnish | 12 | 0.1% |
| French | 298 | 3.4% |
| French Canadian | 10 | 0.1% |
| German | 1,476 | 16.8% |
| Guamanian / Chamorro | 71 | 0.8% |
| Guatemalan | 43 | 0.5% |
| Hungarian | 6 | 0.1% |
| Indian (Asian) | 24 | 0.3% |
| Indonesian | 125 | 1.4% |
| Irish | 1,160 | 13.2% |
| Iroquois | 3 | 0.0% |
| Italian | 217 | 2.5% |
| Jamaican | 1 | 0.0% |
| Japanese | 15 | 0.2% |
| Lithuanian | 3 | 0.0% |
| Mexican | 1,302 | 14.9% |
| Mexican American Indian | 139 | 1.6% |
| Norwegian | 40 | 0.5% |
| Pennsylvania German | 37 | 0.4% |
| Peruvian | 15 | 0.2% |
| Polish | 150 | 1.7% |
| Portuguese | 5 | 0.1% |
| Puerto Rican | 124 | 1.4% |
| Samoan | 71 | 0.8% |
| Scandinavian | 4 | 0.1% |
| Scotch-Irish | 117 | 1.3% |
| Scottish | 69 | 0.8% |
| South American | 15 | 0.2% |
| Subsaharan African | 273 | 3.1% |
| Swedish | 230 | 2.6% |
| Swiss | 7 | 0.1% |
| Welsh | 93 | 1.1% | View All 52 Rows |
Immigrants in Monmouth
The most numerous immigrant groups reported in Monmouth came from Latin America (610 | 7.0%), Central America (595 | 6.8%), Mexico (595 | 6.8%), Asia (235 | 2.7%), and Africa (154 | 1.8%), together accounting for 25.0% of all Monmouth residents.
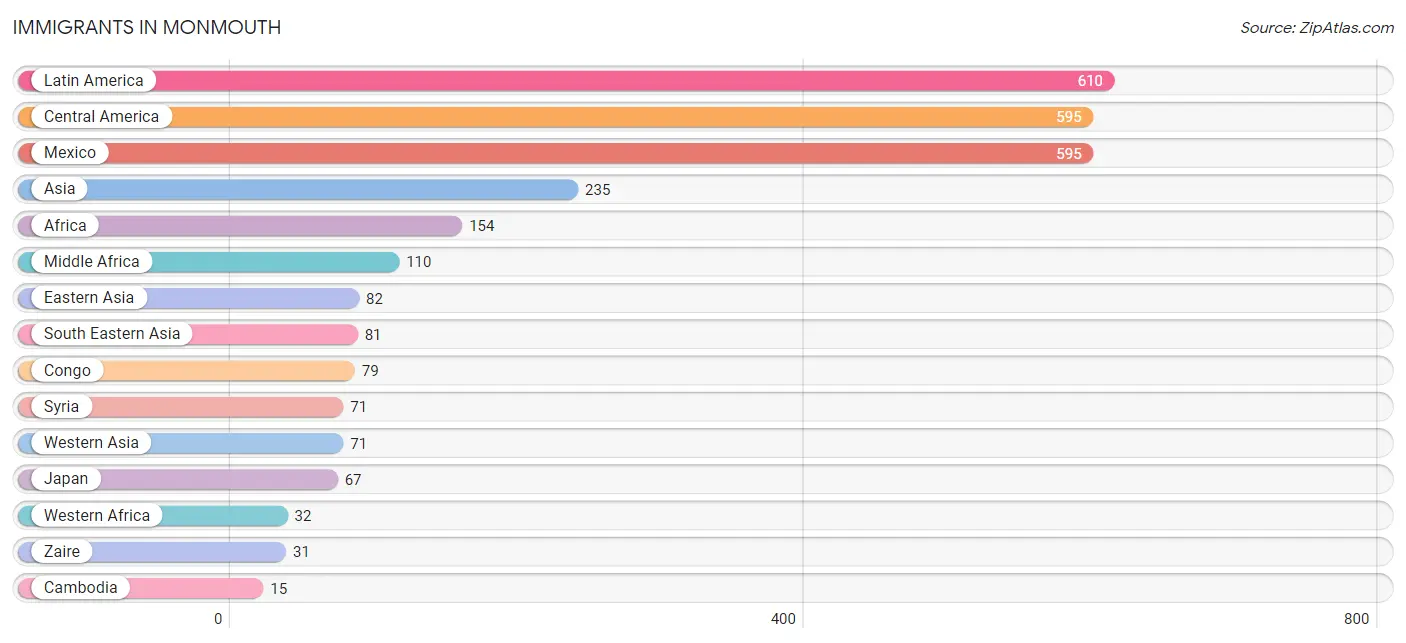
| Immigration Origin | # Population | % Population |
| Africa | 154 | 1.8% |
| Asia | 235 | 2.7% |
| Cambodia | 15 | 0.2% |
| Canada | 2 | 0.0% |
| Caribbean | 1 | 0.0% |
| Central America | 595 | 6.8% |
| China | 15 | 0.2% |
| Congo | 79 | 0.9% |
| Eastern Asia | 82 | 0.9% |
| Egypt | 12 | 0.1% |
| Europe | 4 | 0.1% |
| Germany | 4 | 0.1% |
| Jamaica | 1 | 0.0% |
| Japan | 67 | 0.8% |
| Latin America | 610 | 7.0% |
| Mexico | 595 | 6.8% |
| Middle Africa | 110 | 1.3% |
| Northern Africa | 12 | 0.1% |
| Pakistan | 1 | 0.0% |
| Peru | 14 | 0.2% |
| South America | 14 | 0.2% |
| South Central Asia | 1 | 0.0% |
| South Eastern Asia | 81 | 0.9% |
| Syria | 71 | 0.8% |
| Western Africa | 32 | 0.4% |
| Western Asia | 71 | 0.8% |
| Western Europe | 4 | 0.1% |
| Zaire | 31 | 0.4% | View All 28 Rows |
Sex and Age in Monmouth
Sex and Age in Monmouth
The most populous age groups in Monmouth are 20 to 24 Years (514 | 12.2%) for men and 15 to 19 Years (513 | 11.2%) for women.
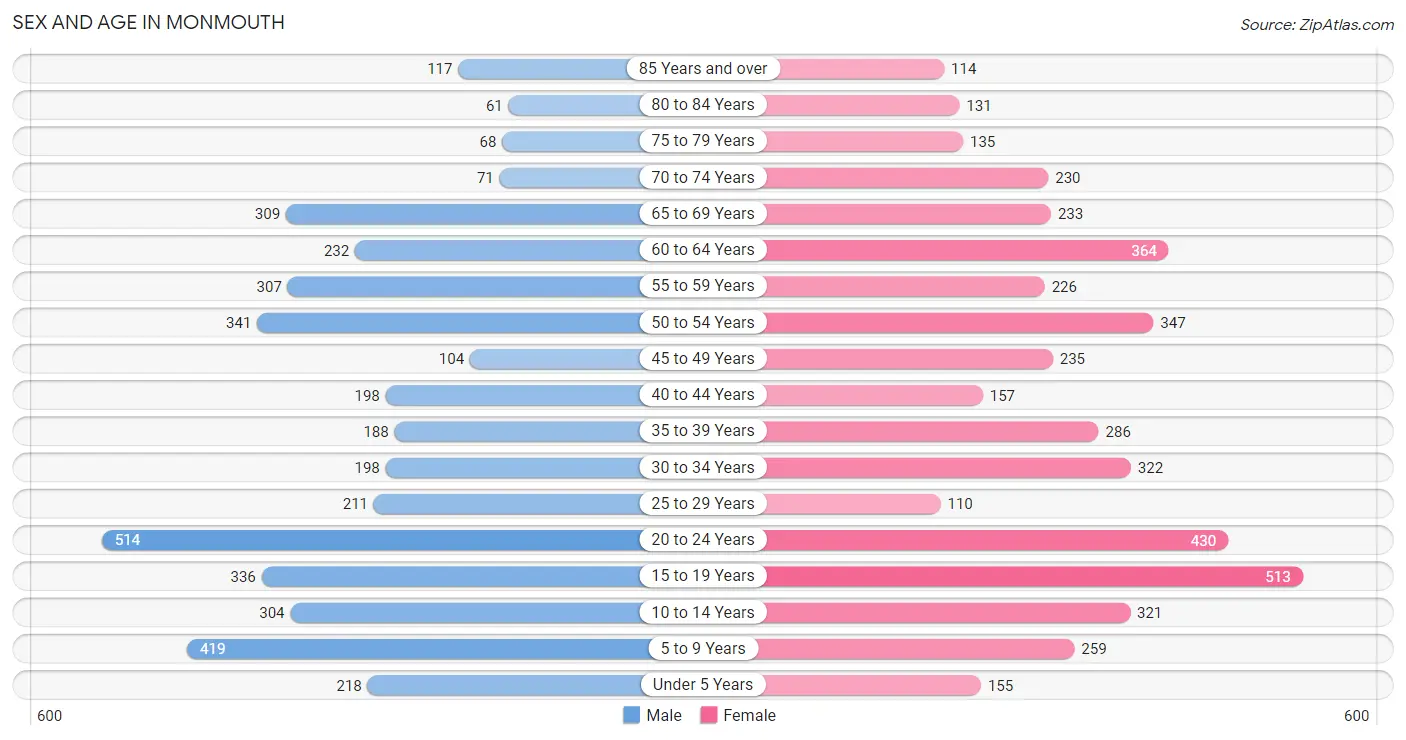
| Age Bracket | Male | Female |
| Under 5 Years | 218 (5.2%) | 155 (3.4%) |
| 5 to 9 Years | 419 (10.0%) | 259 (5.7%) |
| 10 to 14 Years | 304 (7.2%) | 321 (7.0%) |
| 15 to 19 Years | 336 (8.0%) | 513 (11.2%) |
| 20 to 24 Years | 514 (12.2%) | 430 (9.4%) |
| 25 to 29 Years | 211 (5.0%) | 110 (2.4%) |
| 30 to 34 Years | 198 (4.7%) | 322 (7.0%) |
| 35 to 39 Years | 188 (4.5%) | 286 (6.3%) |
| 40 to 44 Years | 198 (4.7%) | 157 (3.4%) |
| 45 to 49 Years | 104 (2.5%) | 235 (5.1%) |
| 50 to 54 Years | 341 (8.1%) | 347 (7.6%) |
| 55 to 59 Years | 307 (7.3%) | 226 (5.0%) |
| 60 to 64 Years | 232 (5.5%) | 364 (8.0%) |
| 65 to 69 Years | 309 (7.4%) | 233 (5.1%) |
| 70 to 74 Years | 71 (1.7%) | 230 (5.0%) |
| 75 to 79 Years | 68 (1.6%) | 135 (3.0%) |
| 80 to 84 Years | 61 (1.5%) | 131 (2.9%) |
| 85 Years and over | 117 (2.8%) | 114 (2.5%) |
| Total | 4,196 (100.0%) | 4,568 (100.0%) |
Families and Households in Monmouth
Median Family Size in Monmouth
The median family size in Monmouth is 2.90 persons per family, with single female/mother families (602 | 27.9%) accounting for the largest median family size of 3.17 persons per family. On the other hand, single male/father families (238 | 11.0%) represent the smallest median family size with 1.97 persons per family.
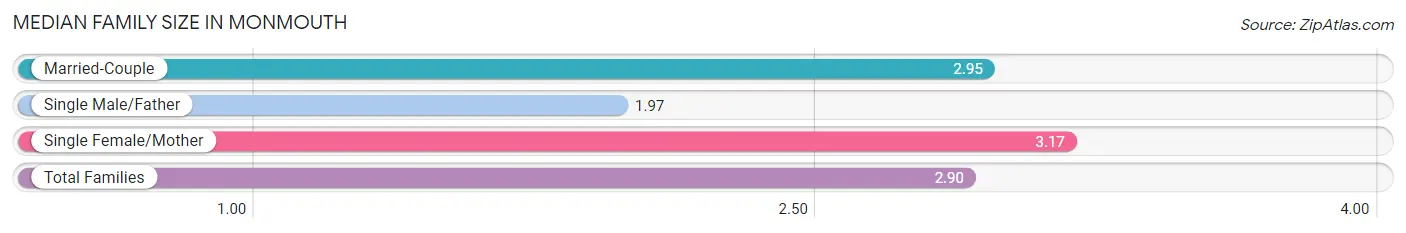
| Family Type | # Families | Family Size |
| Married-Couple | 1,320 (61.1%) | 2.95 |
| Single Male/Father | 238 (11.0%) | 1.97 |
| Single Female/Mother | 602 (27.9%) | 3.17 |
| Total Families | 2,160 (100.0%) | 2.90 |
Median Household Size in Monmouth
The median household size in Monmouth is 2.36 persons per household, with single female/mother households (602 | 18.1%) accounting for the largest median household size of 3.32 persons per household. non-family households (1,159 | 34.9%) represent the smallest median household size with 1.15 persons per household.
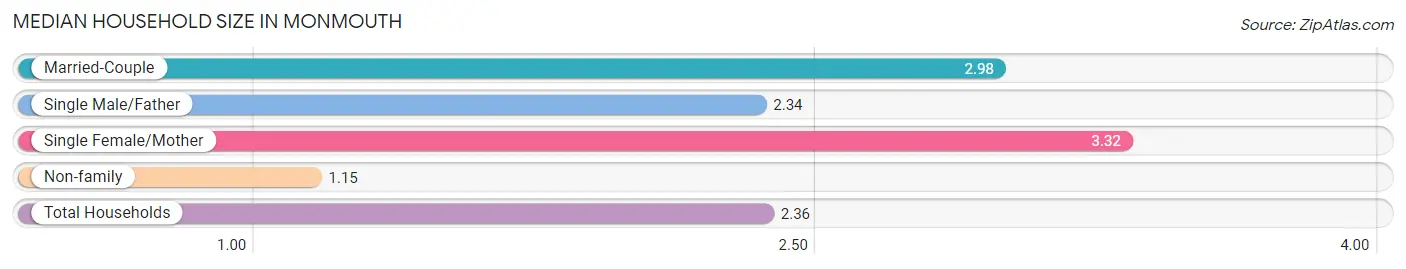
| Household Type | # Households | Household Size |
| Married-Couple | 1,320 (39.8%) | 2.98 |
| Single Male/Father | 238 (7.2%) | 2.34 |
| Single Female/Mother | 602 (18.1%) | 3.32 |
| Non-family | 1,159 (34.9%) | 1.15 |
| Total Households | 3,319 (100.0%) | 2.36 |
Household Size by Marriage Status in Monmouth
Out of a total of 3,319 households in Monmouth, 2,160 (65.1%) are family households, while 1,159 (34.9%) are nonfamily households. The most numerous type of family households are 2-person households, comprising 1,031, and the most common type of nonfamily households are 1-person households, comprising 967.
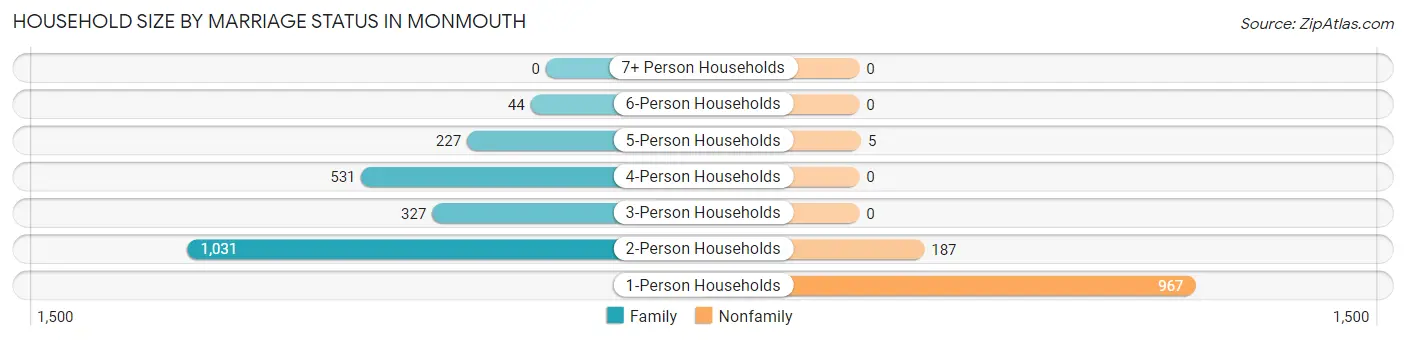
| Household Size | Family Households | Nonfamily Households |
| 1-Person Households | - | 967 (29.1%) |
| 2-Person Households | 1,031 (31.1%) | 187 (5.6%) |
| 3-Person Households | 327 (9.9%) | 0 (0.0%) |
| 4-Person Households | 531 (16.0%) | 0 (0.0%) |
| 5-Person Households | 227 (6.8%) | 5 (0.2%) |
| 6-Person Households | 44 (1.3%) | 0 (0.0%) |
| 7+ Person Households | 0 (0.0%) | 0 (0.0%) |
| Total | 2,160 (65.1%) | 1,159 (34.9%) |
Female Fertility in Monmouth
Fertility by Age in Monmouth
Average fertility rate in Monmouth is 26.0 births per 1,000 women. Women in the age bracket of 35 to 50 years have the highest fertility rate with 44.0 births per 1,000 women. Women in the age bracket of 35 to 50 years acount for 60.7% of all women with births.
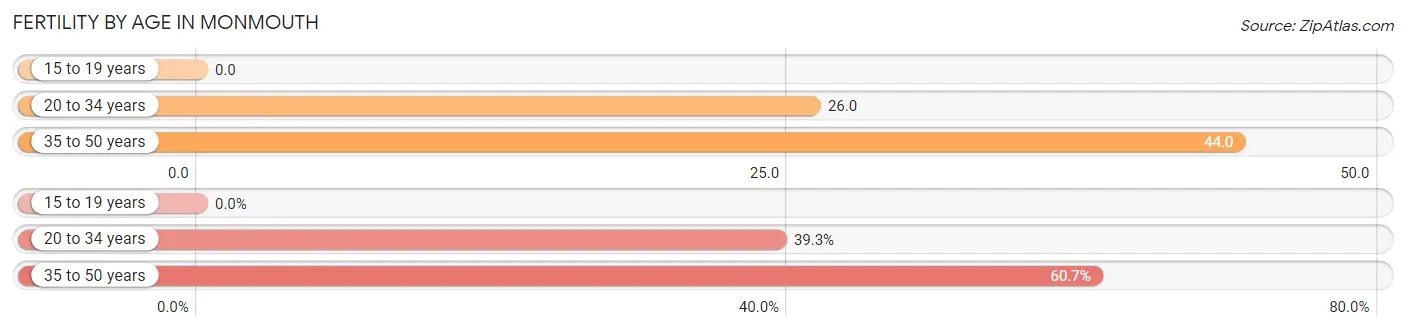
| Age Bracket | Women with Births | Births / 1,000 Women |
| 15 to 19 years | 0 (0.0%) | 0.0 |
| 20 to 34 years | 22 (39.3%) | 26.0 |
| 35 to 50 years | 34 (60.7%) | 44.0 |
| Total | 56 (100.0%) | 26.0 |
Fertility by Age by Marriage Status in Monmouth
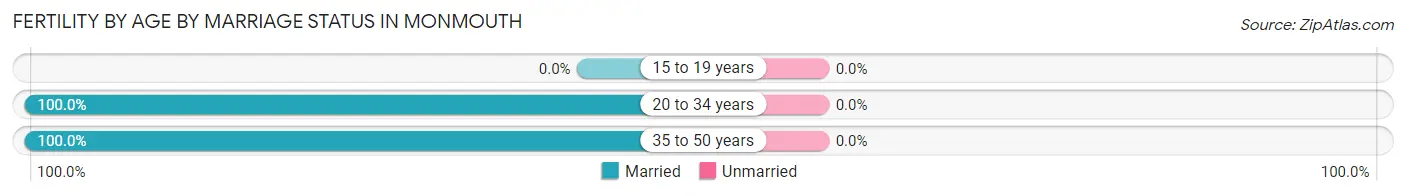
| Age Bracket | Married | Unmarried |
| 15 to 19 years | 0 (0.0%) | 0 (0.0%) |
| 20 to 34 years | 22 (100.0%) | 0 (0.0%) |
| 35 to 50 years | 34 (100.0%) | 0 (0.0%) |
| Total | 56 (100.0%) | 0 (0.0%) |
Fertility by Education in Monmouth
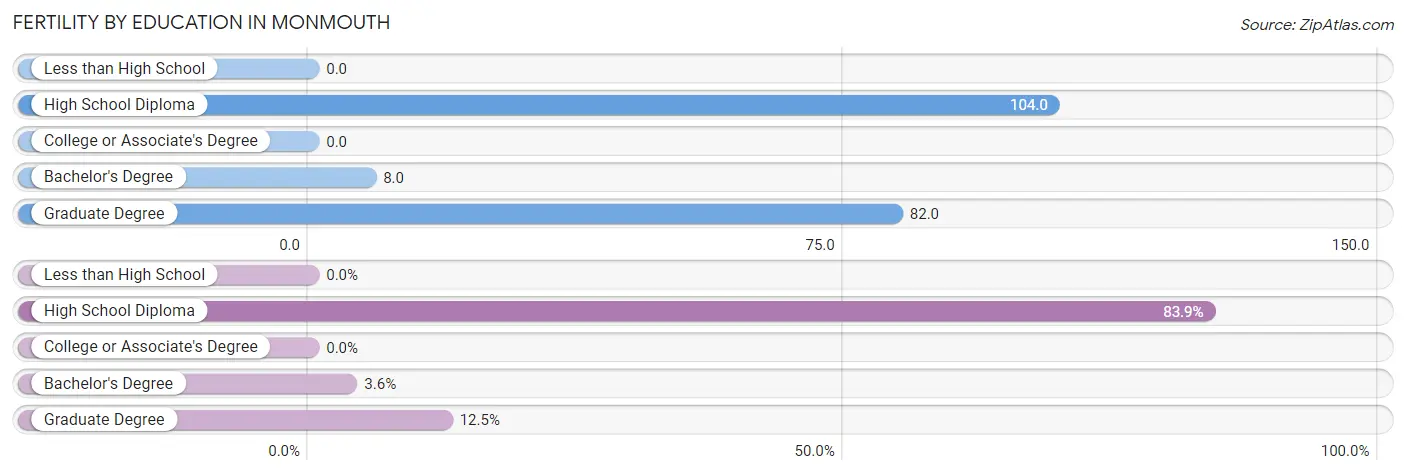
| Educational Attainment | Women with Births | Births / 1,000 Women |
| Less than High School | 0 (0.0%) | 0.0 |
| High School Diploma | 47 (83.9%) | 104.0 |
| College or Associate's Degree | 0 (0.0%) | 0.0 |
| Bachelor's Degree | 2 (3.6%) | 8.0 |
| Graduate Degree | 7 (12.5%) | 82.0 |
| Total | 56 (100.0%) | 26.0 |
Fertility by Education by Marriage Status in Monmouth
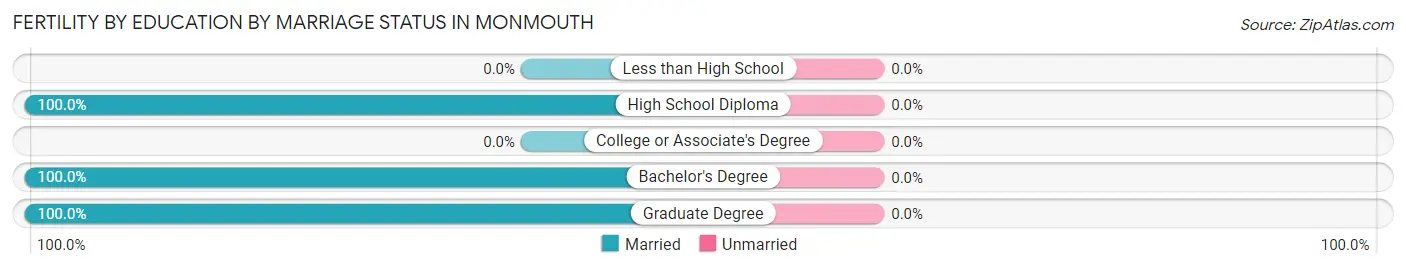
| Educational Attainment | Married | Unmarried |
| Less than High School | 0 (0.0%) | 0 (0.0%) |
| High School Diploma | 47 (100.0%) | 0 (0.0%) |
| College or Associate's Degree | 0 (0.0%) | 0 (0.0%) |
| Bachelor's Degree | 2 (100.0%) | 0 (0.0%) |
| Graduate Degree | 7 (100.0%) | 0 (0.0%) |
| Total | 56 (100.0%) | 0 (0.0%) |
Employment Characteristics in Monmouth
Employment by Class of Employer in Monmouth
Among the 3,786 employed individuals in Monmouth, private company employees (2,395 | 63.3%), not-for-profit organizations (702 | 18.5%), and local government employees (375 | 9.9%) make up the most common classes of employment.
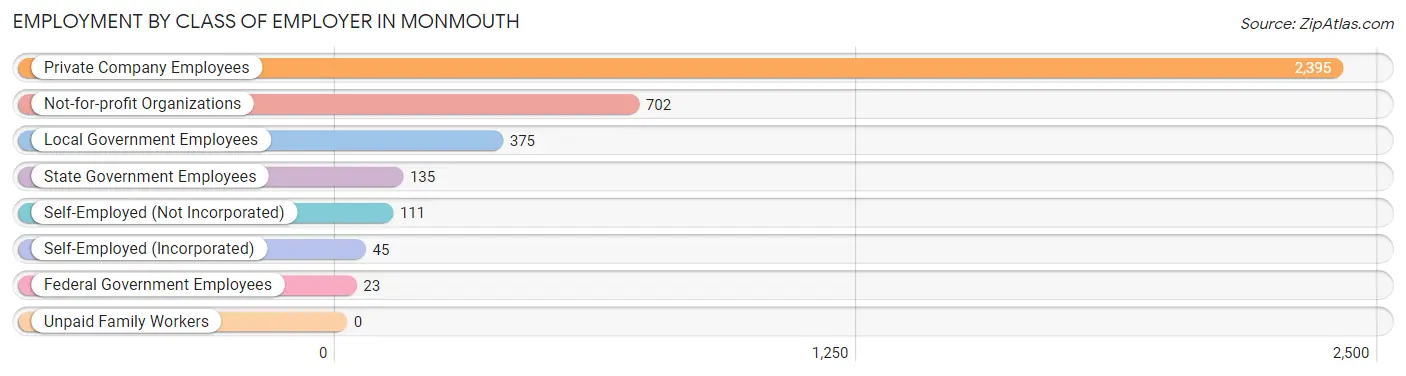
| Employer Class | # Employees | % Employees |
| Private Company Employees | 2,395 | 63.3% |
| Self-Employed (Incorporated) | 45 | 1.2% |
| Self-Employed (Not Incorporated) | 111 | 2.9% |
| Not-for-profit Organizations | 702 | 18.5% |
| Local Government Employees | 375 | 9.9% |
| State Government Employees | 135 | 3.6% |
| Federal Government Employees | 23 | 0.6% |
| Unpaid Family Workers | 0 | 0.0% |
| Total | 3,786 | 100.0% |
Employment Status by Age in Monmouth
According to the labor force statistics for Monmouth, out of the total population over 16 years of age (6,963), 61.8% or 4,303 individuals are in the labor force, with 10.7% or 460 of them unemployed. The age group with the highest labor force participation rate is 30 to 34 years, with 82.7% or 430 individuals in the labor force. Within the labor force, the 16 to 19 years age range has the highest percentage of unemployed individuals, with 28.3% or 69 of them being unemployed.
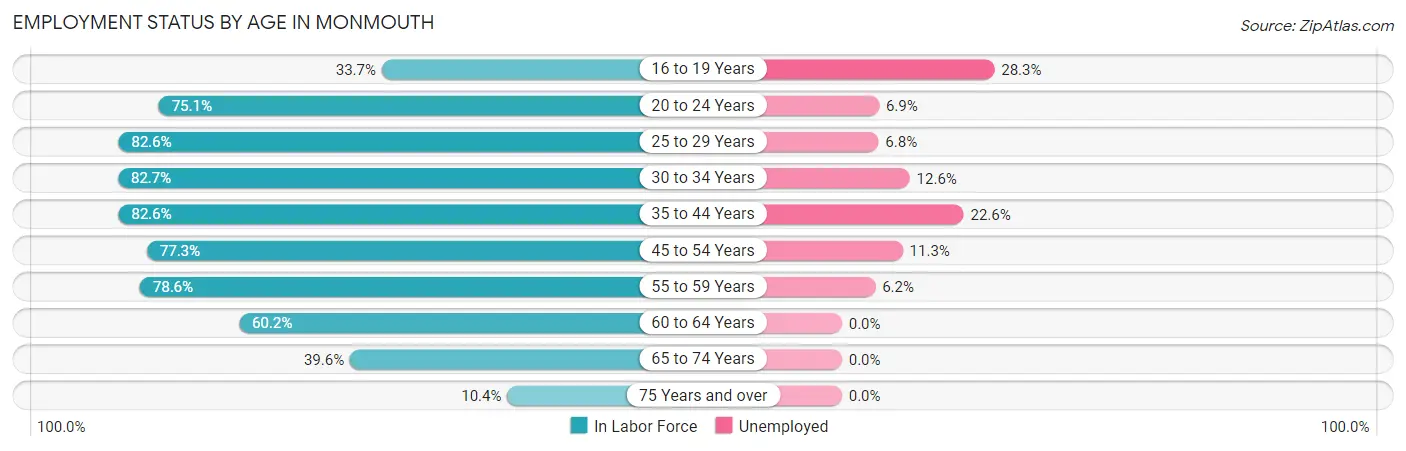
| Age Bracket | In Labor Force | Unemployed |
| 16 to 19 Years | 244 (33.7%) | 69 (28.3%) |
| 20 to 24 Years | 709 (75.1%) | 49 (6.9%) |
| 25 to 29 Years | 265 (82.6%) | 18 (6.8%) |
| 30 to 34 Years | 430 (82.7%) | 54 (12.6%) |
| 35 to 44 Years | 685 (82.6%) | 155 (22.6%) |
| 45 to 54 Years | 794 (77.3%) | 90 (11.3%) |
| 55 to 59 Years | 419 (78.6%) | 26 (6.2%) |
| 60 to 64 Years | 359 (60.2%) | 0 (0.0%) |
| 65 to 74 Years | 334 (39.6%) | 0 (0.0%) |
| 75 Years and over | 65 (10.4%) | 0 (0.0%) |
| Total | 4,303 (61.8%) | 460 (10.7%) |
Employment Status by Educational Attainment in Monmouth
According to labor force statistics for Monmouth, 77.2% of individuals (2,954) out of the total population between 25 and 64 years of age (3,826) are in the labor force, with 11.6% or 343 of them being unemployed. The group with the highest labor force participation rate are those with the educational attainment of bachelor's degree or higher, with 93.6% or 730 individuals in the labor force. Within the labor force, individuals with less than high school education have the highest percentage of unemployment, with 31.8% or 110 of them being unemployed.
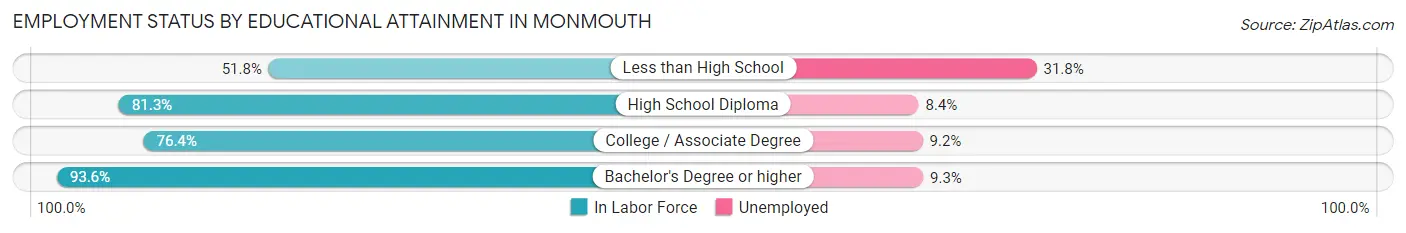
| Educational Attainment | In Labor Force | Unemployed |
| Less than High School | 346 (51.8%) | 212 (31.8%) |
| High School Diploma | 978 (81.3%) | 101 (8.4%) |
| College / Associate Degree | 898 (76.4%) | 108 (9.2%) |
| Bachelor's Degree or higher | 730 (93.6%) | 73 (9.3%) |
| Total | 2,954 (77.2%) | 444 (11.6%) |
Employment Occupations by Sex in Monmouth
Management, Business, Science and Arts Occupations
The most common Management, Business, Science and Arts occupations in Monmouth are Community & Social Service (531 | 13.8%), Education Instruction & Library (406 | 10.6%), Management (361 | 9.4%), Health Diagnosing & Treating (109 | 2.8%), and Computers, Engineering & Science (83 | 2.2%).
Management, Business, Science and Arts Occupations by Sex
Within the Management, Business, Science and Arts occupations in Monmouth, the most male-oriented occupations are Computers & Mathematics (100.0%), Architecture & Engineering (100.0%), and Legal Services & Support (100.0%), while the most female-oriented occupations are Life, Physical & Social Science (100.0%), Arts, Media & Entertainment (100.0%), and Health Diagnosing & Treating (88.1%).
| Occupation | Male | Female |
| Management | 200 (55.4%) | 161 (44.6%) |
| Business & Financial | 34 (51.5%) | 32 (48.5%) |
| Computers, Engineering & Science | 74 (89.2%) | 9 (10.8%) |
| Computers & Mathematics | 55 (100.0%) | 0 (0.0%) |
| Architecture & Engineering | 19 (100.0%) | 0 (0.0%) |
| Life, Physical & Social Science | 0 (0.0%) | 9 (100.0%) |
| Community & Social Service | 139 (26.2%) | 392 (73.8%) |
| Education, Arts & Media | 16 (19.3%) | 67 (80.7%) |
| Legal Services & Support | 32 (100.0%) | 0 (0.0%) |
| Education Instruction & Library | 91 (22.4%) | 315 (77.6%) |
| Arts, Media & Entertainment | 0 (0.0%) | 10 (100.0%) |
| Health Diagnosing & Treating | 13 (11.9%) | 96 (88.1%) |
| Health Technologists | 13 (20.3%) | 51 (79.7%) |
| Total (Category) | 460 (40.0%) | 690 (60.0%) |
| Total (Overall) | 1,825 (47.5%) | 2,018 (52.5%) |
Services Occupations
The most common Services occupations in Monmouth are Cleaning & Maintenance (259 | 6.7%), Security & Protection (230 | 6.0%), Firefighting & Prevention (221 | 5.8%), Healthcare Support (190 | 4.9%), and Food Preparation & Serving (140 | 3.6%).
Services Occupations by Sex
Within the Services occupations in Monmouth, the most male-oriented occupations are Law Enforcement (100.0%), Cleaning & Maintenance (73.0%), and Food Preparation & Serving (32.9%), while the most female-oriented occupations are Healthcare Support (100.0%), Personal Care & Service (82.0%), and Firefighting & Prevention (76.0%).
| Occupation | Male | Female |
| Healthcare Support | 0 (0.0%) | 190 (100.0%) |
| Security & Protection | 62 (27.0%) | 168 (73.0%) |
| Firefighting & Prevention | 53 (24.0%) | 168 (76.0%) |
| Law Enforcement | 9 (100.0%) | 0 (0.0%) |
| Food Preparation & Serving | 46 (32.9%) | 94 (67.1%) |
| Cleaning & Maintenance | 189 (73.0%) | 70 (27.0%) |
| Personal Care & Service | 16 (18.0%) | 73 (82.0%) |
| Total (Category) | 313 (34.5%) | 595 (65.5%) |
| Total (Overall) | 1,825 (47.5%) | 2,018 (52.5%) |
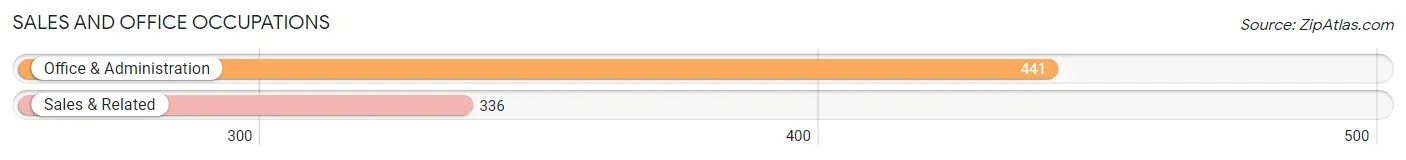
Sales and Office Occupations
The most common Sales and Office occupations in Monmouth are Office & Administration (441 | 11.5%), and Sales & Related (336 | 8.7%).
Sales and Office Occupations by Sex
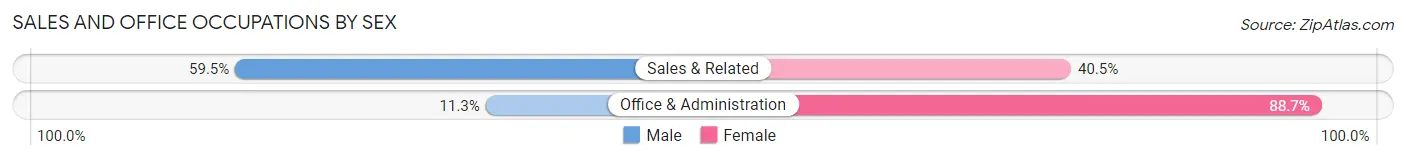
| Occupation | Male | Female |
| Sales & Related | 200 (59.5%) | 136 (40.5%) |
| Office & Administration | 50 (11.3%) | 391 (88.7%) |
| Total (Category) | 250 (32.2%) | 527 (67.8%) |
| Total (Overall) | 1,825 (47.5%) | 2,018 (52.5%) |
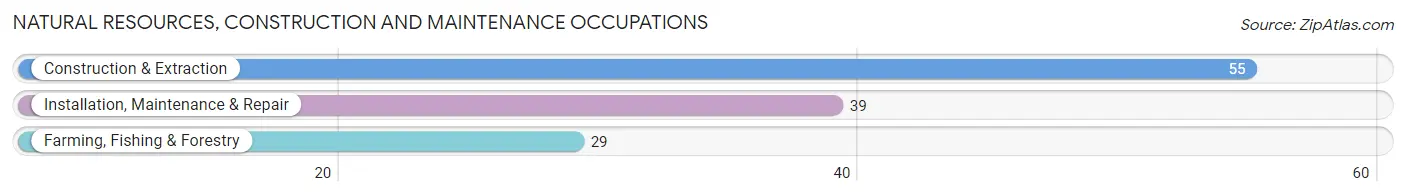
Natural Resources, Construction and Maintenance Occupations
The most common Natural Resources, Construction and Maintenance occupations in Monmouth are Construction & Extraction (55 | 1.4%), Installation, Maintenance & Repair (39 | 1.0%), and Farming, Fishing & Forestry (29 | 0.7%).
Natural Resources, Construction and Maintenance Occupations by Sex
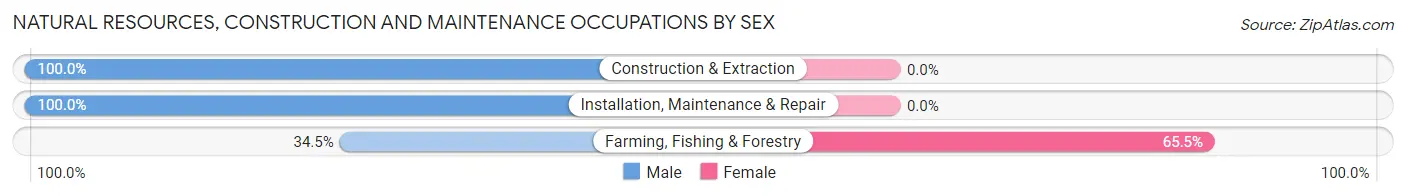
| Occupation | Male | Female |
| Farming, Fishing & Forestry | 10 (34.5%) | 19 (65.5%) |
| Construction & Extraction | 55 (100.0%) | 0 (0.0%) |
| Installation, Maintenance & Repair | 39 (100.0%) | 0 (0.0%) |
| Total (Category) | 104 (84.6%) | 19 (15.4%) |
| Total (Overall) | 1,825 (47.5%) | 2,018 (52.5%) |
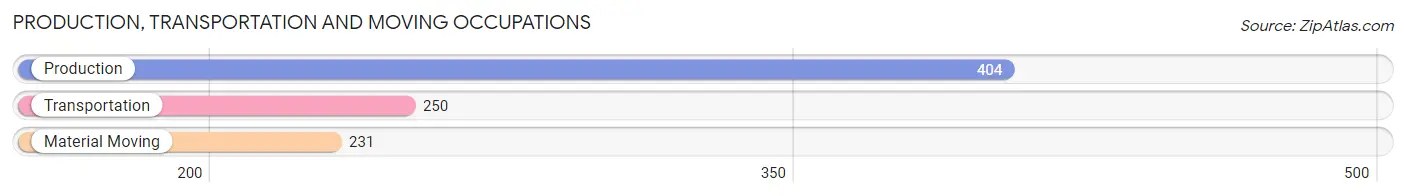
Production, Transportation and Moving Occupations
The most common Production, Transportation and Moving occupations in Monmouth are Production (404 | 10.5%), Transportation (250 | 6.5%), and Material Moving (231 | 6.0%).
Production, Transportation and Moving Occupations by Sex
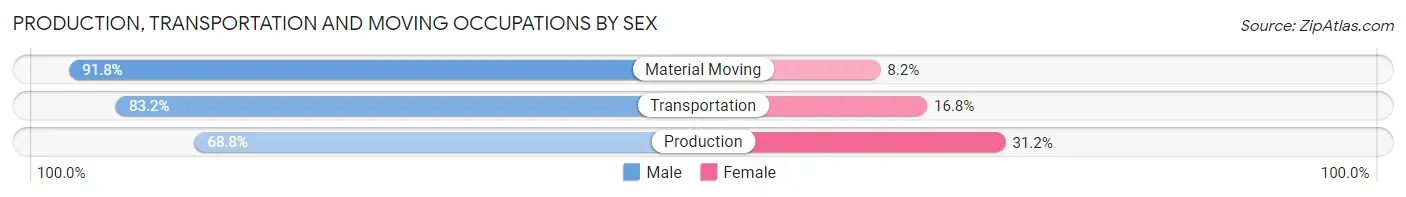
| Occupation | Male | Female |
| Production | 278 (68.8%) | 126 (31.2%) |
| Transportation | 208 (83.2%) | 42 (16.8%) |
| Material Moving | 212 (91.8%) | 19 (8.2%) |
| Total (Category) | 698 (78.9%) | 187 (21.1%) |
| Total (Overall) | 1,825 (47.5%) | 2,018 (52.5%) |
Employment Industries by Sex in Monmouth
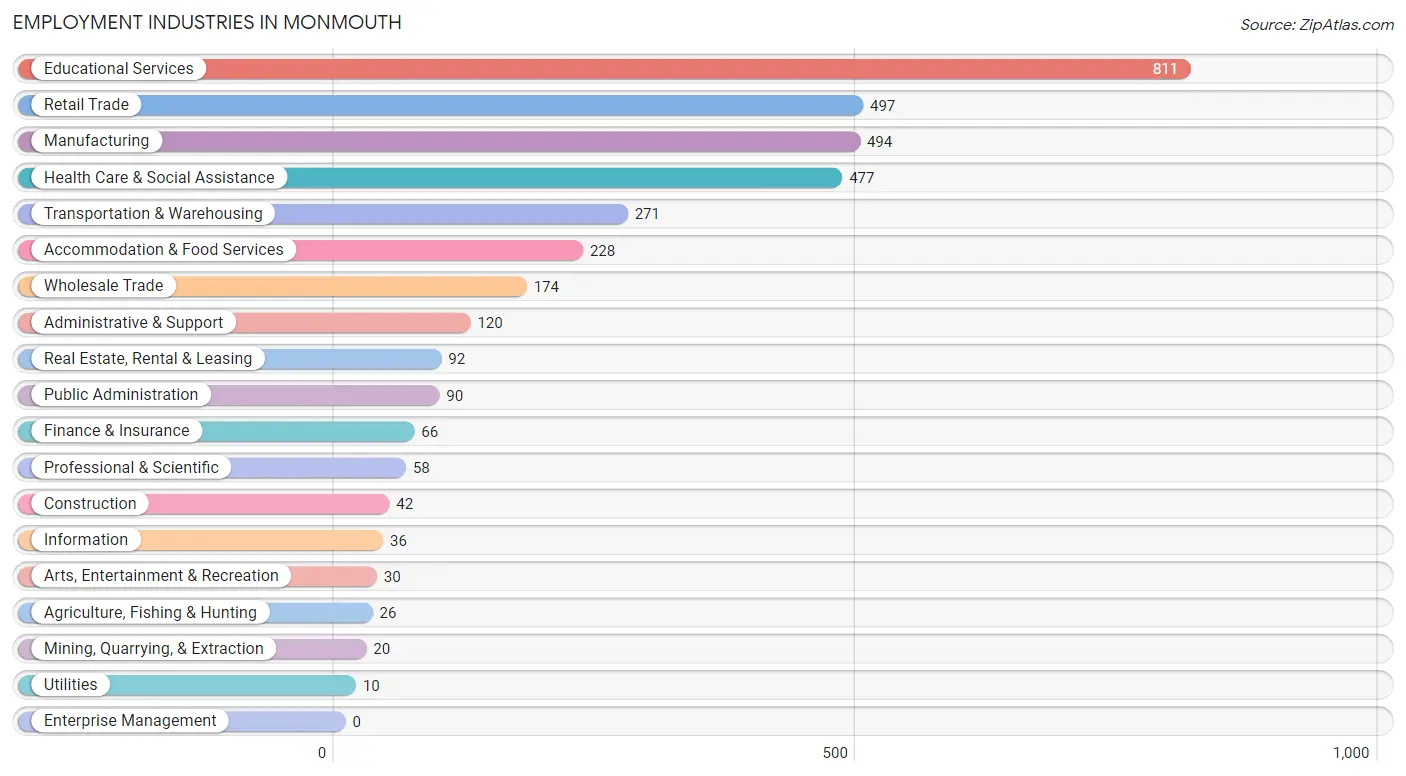
Employment Industries in Monmouth
The major employment industries in Monmouth include Educational Services (811 | 21.1%), Retail Trade (497 | 12.9%), Manufacturing (494 | 12.9%), Health Care & Social Assistance (477 | 12.4%), and Transportation & Warehousing (271 | 7.0%).
Employment Industries by Sex in Monmouth
The Monmouth industries that see more men than women are Mining, Quarrying, & Extraction (100.0%), Construction (100.0%), and Utilities (100.0%), whereas the industries that tend to have a higher number of women are Health Care & Social Assistance (84.5%), Information (69.4%), and Accommodation & Food Services (68.0%).
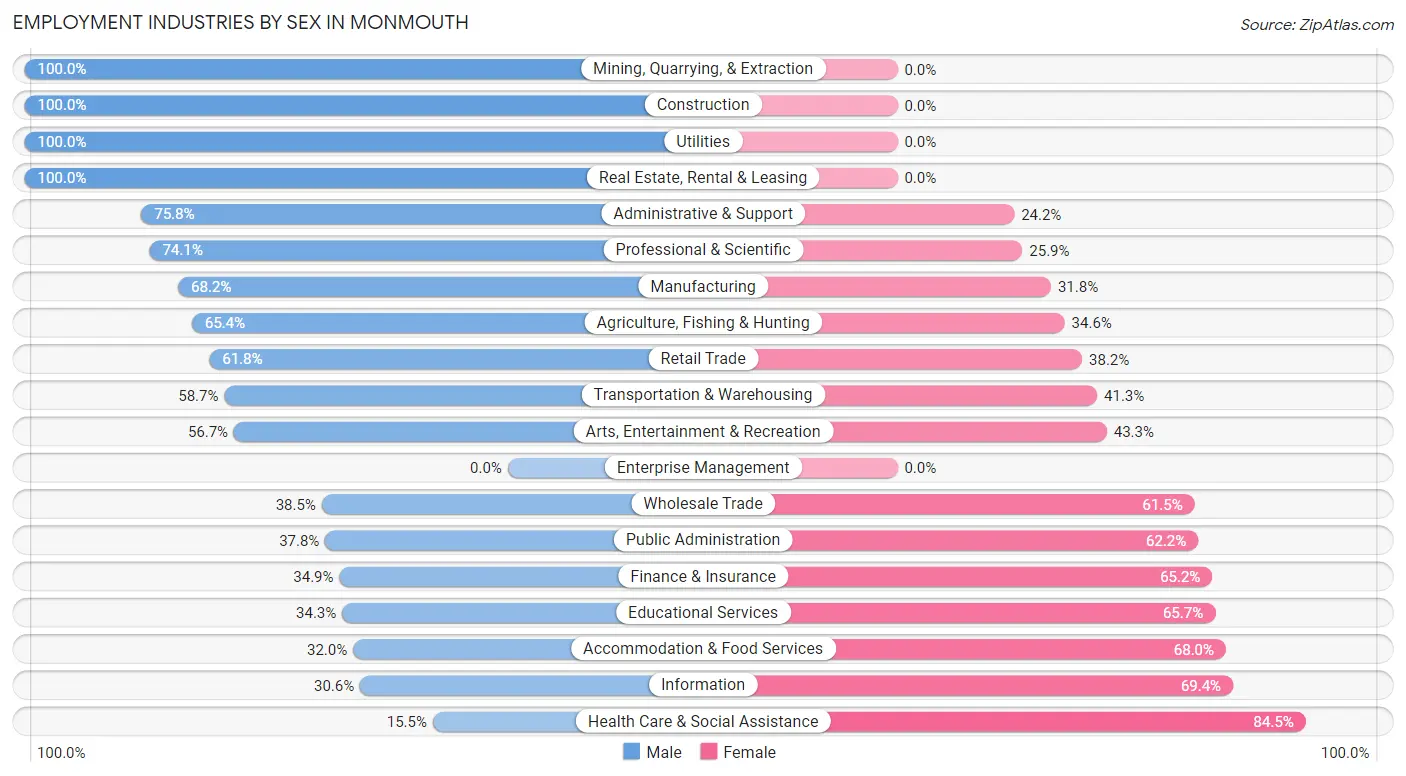
| Industry | Male | Female |
| Agriculture, Fishing & Hunting | 17 (65.4%) | 9 (34.6%) |
| Mining, Quarrying, & Extraction | 20 (100.0%) | 0 (0.0%) |
| Construction | 42 (100.0%) | 0 (0.0%) |
| Manufacturing | 337 (68.2%) | 157 (31.8%) |
| Wholesale Trade | 67 (38.5%) | 107 (61.5%) |
| Retail Trade | 307 (61.8%) | 190 (38.2%) |
| Transportation & Warehousing | 159 (58.7%) | 112 (41.3%) |
| Utilities | 10 (100.0%) | 0 (0.0%) |
| Information | 11 (30.6%) | 25 (69.4%) |
| Finance & Insurance | 23 (34.8%) | 43 (65.1%) |
| Real Estate, Rental & Leasing | 92 (100.0%) | 0 (0.0%) |
| Professional & Scientific | 43 (74.1%) | 15 (25.9%) |
| Enterprise Management | 0 (0.0%) | 0 (0.0%) |
| Administrative & Support | 91 (75.8%) | 29 (24.2%) |
| Educational Services | 278 (34.3%) | 533 (65.7%) |
| Health Care & Social Assistance | 74 (15.5%) | 403 (84.5%) |
| Arts, Entertainment & Recreation | 17 (56.7%) | 13 (43.3%) |
| Accommodation & Food Services | 73 (32.0%) | 155 (68.0%) |
| Public Administration | 34 (37.8%) | 56 (62.2%) |
| Total | 1,825 (47.5%) | 2,018 (52.5%) |
Education in Monmouth
School Enrollment in Monmouth
The most common levels of schooling among the 2,836 students in Monmouth are college / undergraduate (964 | 34.0%), high school (484 | 17.1%), and elementary school (479 | 16.9%).
| School Level | # Students | % Students |
| Nursery / Preschool | 167 | 5.9% |
| Kindergarten | 227 | 8.0% |
| Elementary School | 479 | 16.9% |
| Middle School | 429 | 15.1% |
| High School | 484 | 17.1% |
| College / Undergraduate | 964 | 34.0% |
| Graduate / Professional | 86 | 3.0% |
| Total | 2,836 | 100.0% |
School Enrollment by Age by Funding Source in Monmouth
Out of a total of 2,836 students who are enrolled in schools in Monmouth, 1,072 (37.8%) attend a private institution, while the remaining 1,764 (62.2%) are enrolled in public schools. The age group of 20 to 24 year olds has the highest likelihood of being enrolled in private schools, with 465 (89.6% in the age bracket) enrolled. Conversely, the age group of 3 to 4 year olds has the lowest likelihood of being enrolled in a private school, with 132 (100.0% in the age bracket) attending a public institution.
| Age Bracket | Public School | Private School |
| 3 to 4 Year Olds | 132 (100.0%) | 0 (0.0%) |
| 5 to 9 Year Old | 610 (90.0%) | 68 (10.0%) |
| 10 to 14 Year Olds | 515 (82.4%) | 110 (17.6%) |
| 15 to 17 Year Olds | 302 (96.8%) | 10 (3.2%) |
| 18 to 19 Year Olds | 58 (14.0%) | 356 (86.0%) |
| 20 to 24 Year Olds | 54 (10.4%) | 465 (89.6%) |
| 25 to 34 Year Olds | 71 (72.5%) | 27 (27.6%) |
| 35 Years and over | 23 (39.7%) | 35 (60.3%) |
| Total | 1,764 (62.2%) | 1,072 (37.8%) |
Educational Attainment by Field of Study in Monmouth
Education (222 | 20.3%), business (159 | 14.5%), visual & performing arts (122 | 11.1%), liberal arts & history (100 | 9.1%), and bio, nature & agricultural (93 | 8.5%) are the most common fields of study among 1,095 individuals in Monmouth who have obtained a bachelor's degree or higher.
| Field of Study | # Graduates | % Graduates |
| Computers & Mathematics | 16 | 1.5% |
| Bio, Nature & Agricultural | 93 | 8.5% |
| Physical & Health Sciences | 21 | 1.9% |
| Psychology | 23 | 2.1% |
| Social Sciences | 81 | 7.4% |
| Engineering | 10 | 0.9% |
| Multidisciplinary Studies | 0 | 0.0% |
| Science & Technology | 60 | 5.5% |
| Business | 159 | 14.5% |
| Education | 222 | 20.3% |
| Literature & Languages | 65 | 5.9% |
| Liberal Arts & History | 100 | 9.1% |
| Visual & Performing Arts | 122 | 11.1% |
| Communications | 72 | 6.6% |
| Arts & Humanities | 51 | 4.7% |
| Total | 1,095 | 100.0% |
Transportation & Commute in Monmouth
Vehicle Availability by Sex in Monmouth
The most prevalent vehicle ownership categories in Monmouth are males with 2 vehicles (877, accounting for 51.7%) and females with 2 vehicles (699, making up 49.7%).
| Vehicles Available | Male | Female |
| No Vehicle | 49 (2.9%) | 25 (1.4%) |
| 1 Vehicle | 292 (17.2%) | 582 (33.0%) |
| 2 Vehicles | 877 (51.7%) | 699 (39.6%) |
| 3 Vehicles | 311 (18.3%) | 324 (18.4%) |
| 4 Vehicles | 143 (8.4%) | 109 (6.2%) |
| 5 or more Vehicles | 24 (1.4%) | 26 (1.5%) |
| Total | 1,696 (100.0%) | 1,765 (100.0%) |
Commute Time in Monmouth
The most frequently occuring commute durations in Monmouth are 5 to 9 minutes (1,395 commuters, 38.8%), less than 5 minutes (703 commuters, 19.5%), and 10 to 14 minutes (436 commuters, 12.1%).
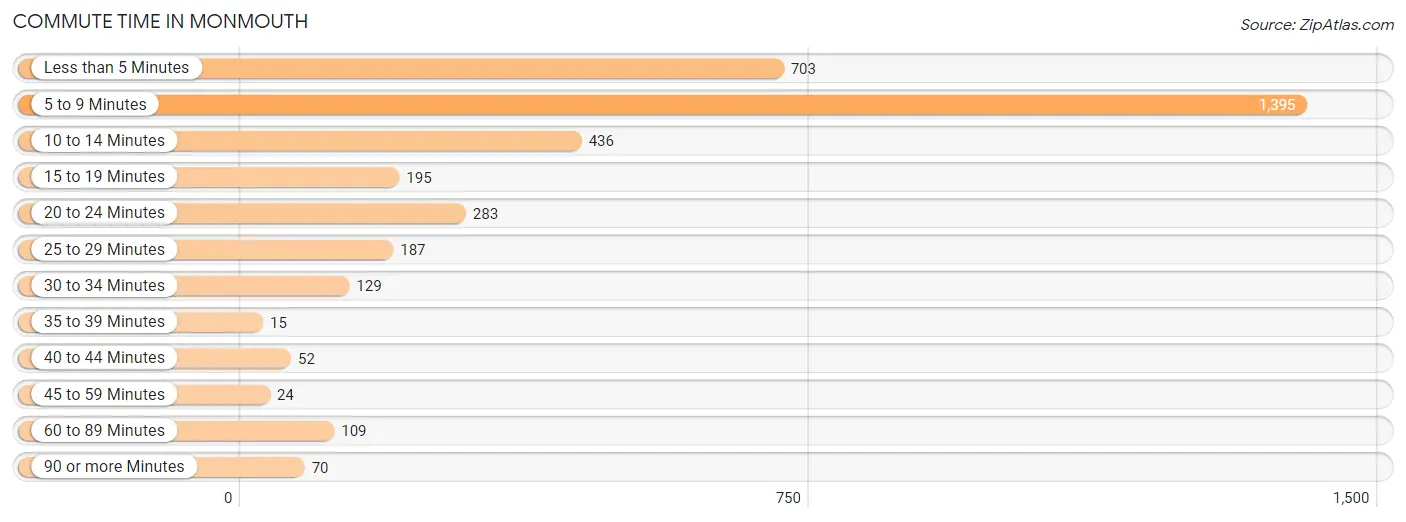
| Commute Time | # Commuters | % Commuters |
| Less than 5 Minutes | 703 | 19.5% |
| 5 to 9 Minutes | 1,395 | 38.8% |
| 10 to 14 Minutes | 436 | 12.1% |
| 15 to 19 Minutes | 195 | 5.4% |
| 20 to 24 Minutes | 283 | 7.9% |
| 25 to 29 Minutes | 187 | 5.2% |
| 30 to 34 Minutes | 129 | 3.6% |
| 35 to 39 Minutes | 15 | 0.4% |
| 40 to 44 Minutes | 52 | 1.5% |
| 45 to 59 Minutes | 24 | 0.7% |
| 60 to 89 Minutes | 109 | 3.0% |
| 90 or more Minutes | 70 | 1.9% |
Commute Time by Sex in Monmouth
The most common commute times in Monmouth are 5 to 9 minutes (651 commuters, 37.6%) for males and 5 to 9 minutes (744 commuters, 39.9%) for females.
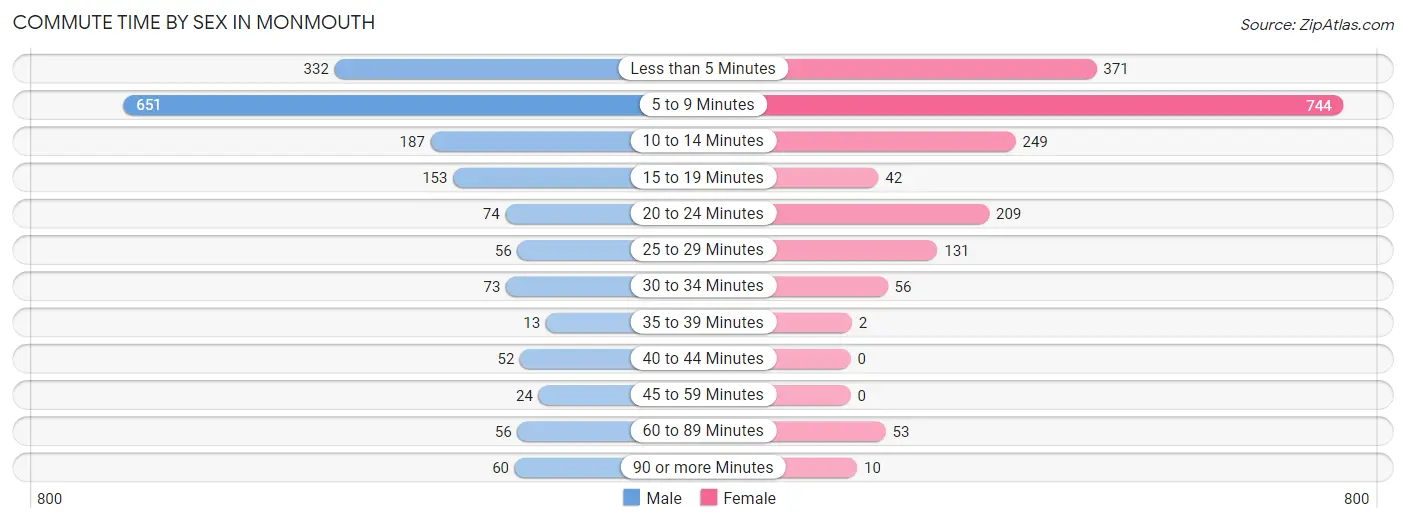
| Commute Time | Male | Female |
| Less than 5 Minutes | 332 (19.2%) | 371 (19.9%) |
| 5 to 9 Minutes | 651 (37.6%) | 744 (39.9%) |
| 10 to 14 Minutes | 187 (10.8%) | 249 (13.3%) |
| 15 to 19 Minutes | 153 (8.8%) | 42 (2.2%) |
| 20 to 24 Minutes | 74 (4.3%) | 209 (11.2%) |
| 25 to 29 Minutes | 56 (3.2%) | 131 (7.0%) |
| 30 to 34 Minutes | 73 (4.2%) | 56 (3.0%) |
| 35 to 39 Minutes | 13 (0.7%) | 2 (0.1%) |
| 40 to 44 Minutes | 52 (3.0%) | 0 (0.0%) |
| 45 to 59 Minutes | 24 (1.4%) | 0 (0.0%) |
| 60 to 89 Minutes | 56 (3.2%) | 53 (2.8%) |
| 90 or more Minutes | 60 (3.5%) | 10 (0.5%) |
Time of Departure to Work by Sex in Monmouth
The most frequent times of departure to work in Monmouth are 6:30 AM to 6:59 AM (258, 14.9%) for males and 7:30 AM to 7:59 AM (319, 17.1%) for females.
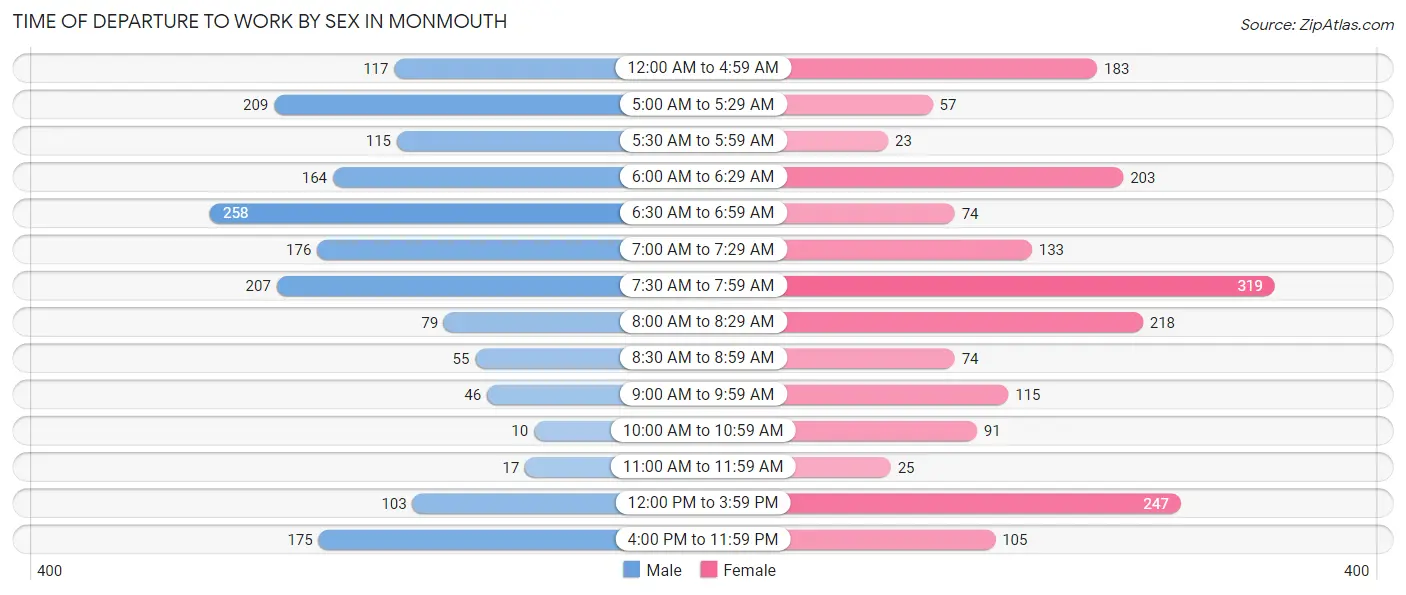
| Time of Departure | Male | Female |
| 12:00 AM to 4:59 AM | 117 (6.8%) | 183 (9.8%) |
| 5:00 AM to 5:29 AM | 209 (12.1%) | 57 (3.0%) |
| 5:30 AM to 5:59 AM | 115 (6.6%) | 23 (1.2%) |
| 6:00 AM to 6:29 AM | 164 (9.5%) | 203 (10.9%) |
| 6:30 AM to 6:59 AM | 258 (14.9%) | 74 (4.0%) |
| 7:00 AM to 7:29 AM | 176 (10.2%) | 133 (7.1%) |
| 7:30 AM to 7:59 AM | 207 (12.0%) | 319 (17.1%) |
| 8:00 AM to 8:29 AM | 79 (4.6%) | 218 (11.7%) |
| 8:30 AM to 8:59 AM | 55 (3.2%) | 74 (4.0%) |
| 9:00 AM to 9:59 AM | 46 (2.7%) | 115 (6.2%) |
| 10:00 AM to 10:59 AM | 10 (0.6%) | 91 (4.9%) |
| 11:00 AM to 11:59 AM | 17 (1.0%) | 25 (1.3%) |
| 12:00 PM to 3:59 PM | 103 (5.9%) | 247 (13.2%) |
| 4:00 PM to 11:59 PM | 175 (10.1%) | 105 (5.6%) |
| Total | 1,731 (100.0%) | 1,867 (100.0%) |
Housing Occupancy in Monmouth
Occupancy by Ownership in Monmouth
Of the total 3,319 dwellings in Monmouth, owner-occupied units account for 2,301 (69.3%), while renter-occupied units make up 1,018 (30.7%).
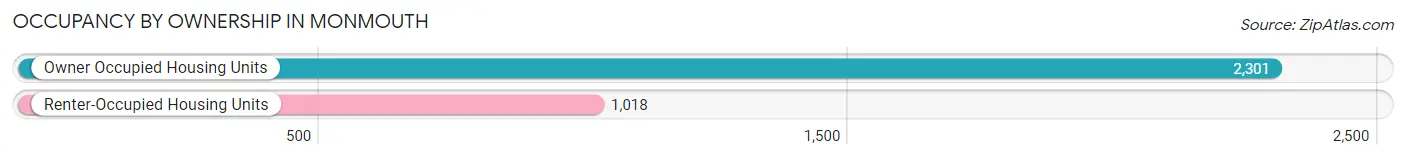
| Occupancy | # Housing Units | % Housing Units |
| Owner Occupied Housing Units | 2,301 | 69.3% |
| Renter-Occupied Housing Units | 1,018 | 30.7% |
| Total Occupied Housing Units | 3,319 | 100.0% |
Occupancy by Household Size in Monmouth
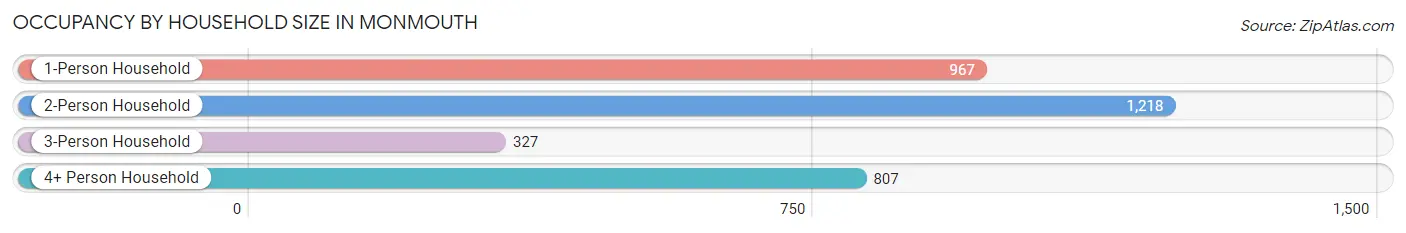
| Household Size | # Housing Units | % Housing Units |
| 1-Person Household | 967 | 29.1% |
| 2-Person Household | 1,218 | 36.7% |
| 3-Person Household | 327 | 9.9% |
| 4+ Person Household | 807 | 24.3% |
| Total Housing Units | 3,319 | 100.0% |
Occupancy by Ownership by Household Size in Monmouth
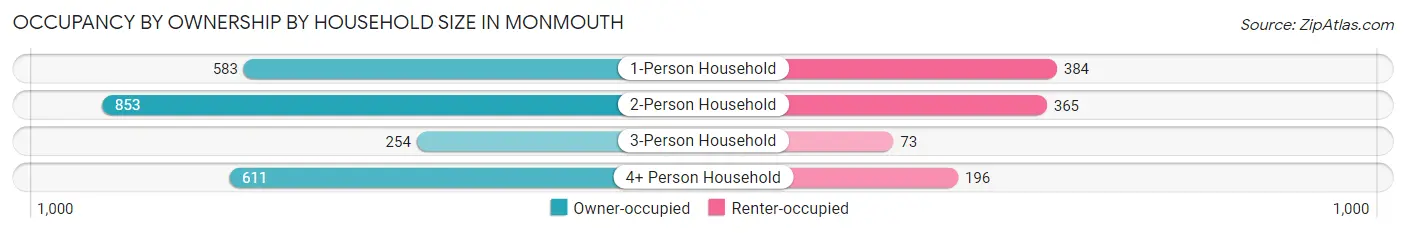
| Household Size | Owner-occupied | Renter-occupied |
| 1-Person Household | 583 (60.3%) | 384 (39.7%) |
| 2-Person Household | 853 (70.0%) | 365 (30.0%) |
| 3-Person Household | 254 (77.7%) | 73 (22.3%) |
| 4+ Person Household | 611 (75.7%) | 196 (24.3%) |
| Total Housing Units | 2,301 (69.3%) | 1,018 (30.7%) |
Occupancy by Educational Attainment in Monmouth
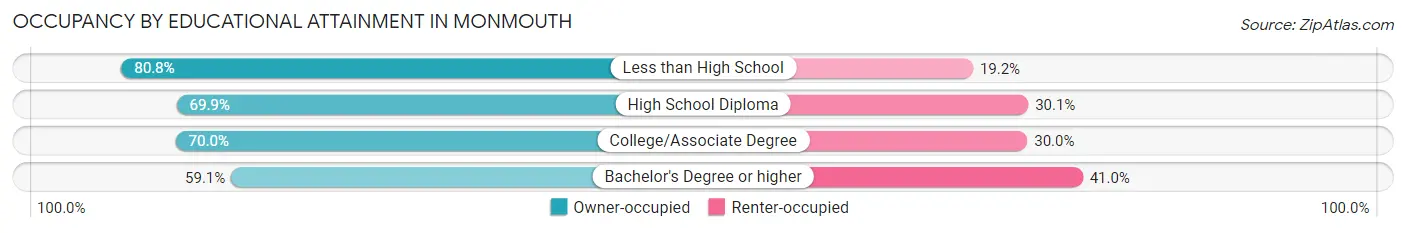
| Household Size | Owner-occupied | Renter-occupied |
| Less than High School | 358 (80.8%) | 85 (19.2%) |
| High School Diploma | 823 (69.9%) | 355 (30.1%) |
| College/Associate Degree | 748 (70.0%) | 320 (30.0%) |
| Bachelor's Degree or higher | 372 (59.1%) | 258 (40.9%) |
Occupancy by Age of Householder in Monmouth
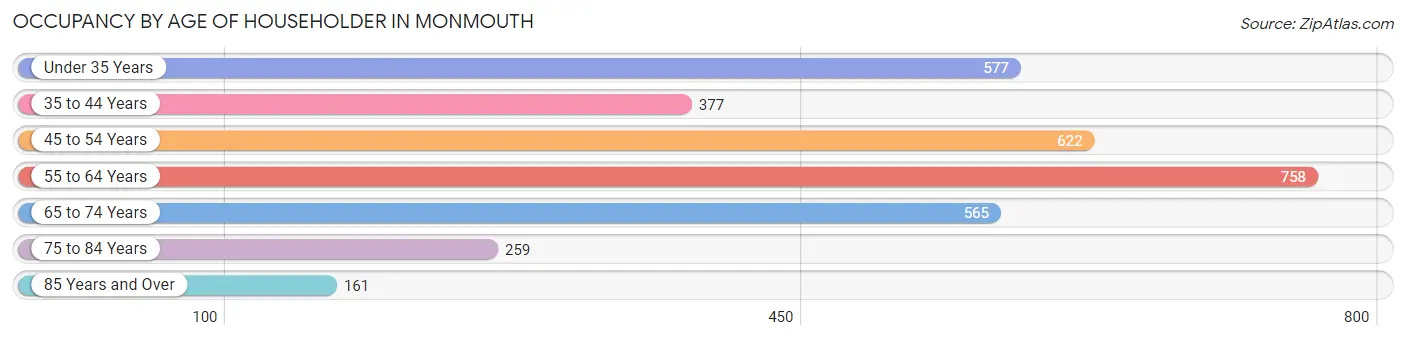
| Age Bracket | # Households | % Households |
| Under 35 Years | 577 | 17.4% |
| 35 to 44 Years | 377 | 11.4% |
| 45 to 54 Years | 622 | 18.7% |
| 55 to 64 Years | 758 | 22.8% |
| 65 to 74 Years | 565 | 17.0% |
| 75 to 84 Years | 259 | 7.8% |
| 85 Years and Over | 161 | 4.9% |
| Total | 3,319 | 100.0% |
Housing Finances in Monmouth
Median Income by Occupancy in Monmouth
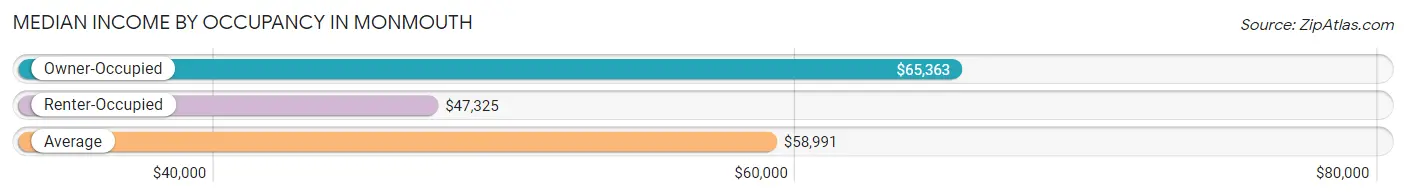
| Occupancy Type | # Households | Median Income |
| Owner-Occupied | 2,301 (69.3%) | $65,363 |
| Renter-Occupied | 1,018 (30.7%) | $47,325 |
| Average | 3,319 (100.0%) | $58,991 |
Occupancy by Householder Income Bracket in Monmouth
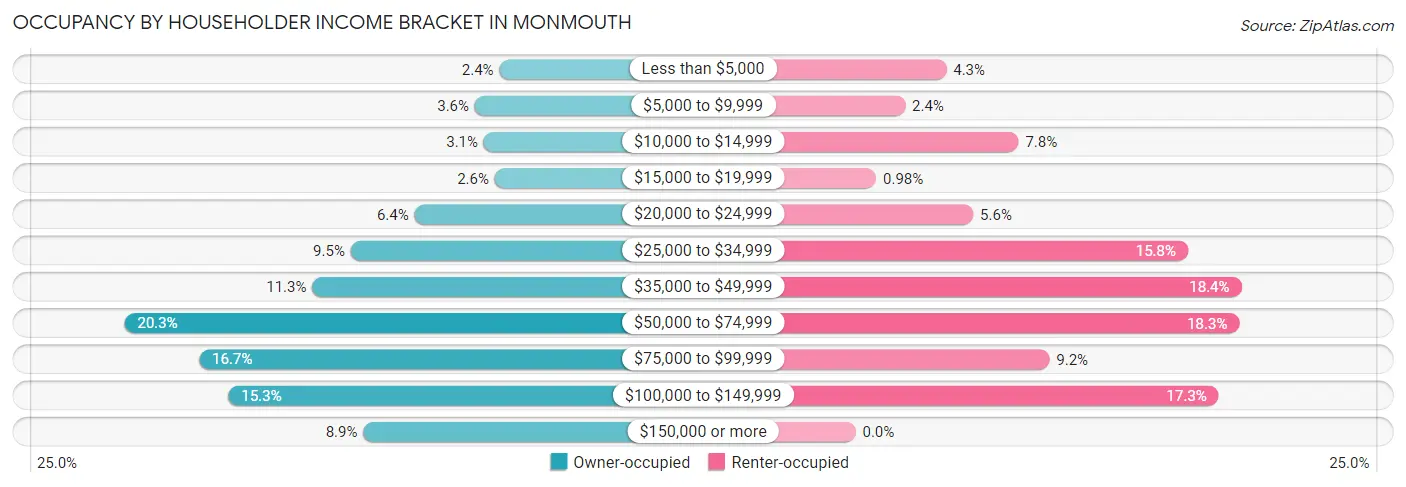
| Income Bracket | Owner-occupied | Renter-occupied |
| Less than $5,000 | 55 (2.4%) | 44 (4.3%) |
| $5,000 to $9,999 | 82 (3.6%) | 24 (2.4%) |
| $10,000 to $14,999 | 72 (3.1%) | 79 (7.8%) |
| $15,000 to $19,999 | 60 (2.6%) | 10 (1.0%) |
| $20,000 to $24,999 | 148 (6.4%) | 57 (5.6%) |
| $25,000 to $34,999 | 218 (9.5%) | 161 (15.8%) |
| $35,000 to $49,999 | 260 (11.3%) | 187 (18.4%) |
| $50,000 to $74,999 | 466 (20.3%) | 186 (18.3%) |
| $75,000 to $99,999 | 384 (16.7%) | 94 (9.2%) |
| $100,000 to $149,999 | 352 (15.3%) | 176 (17.3%) |
| $150,000 or more | 204 (8.9%) | 0 (0.0%) |
| Total | 2,301 (100.0%) | 1,018 (100.0%) |
Monthly Housing Cost Tiers in Monmouth
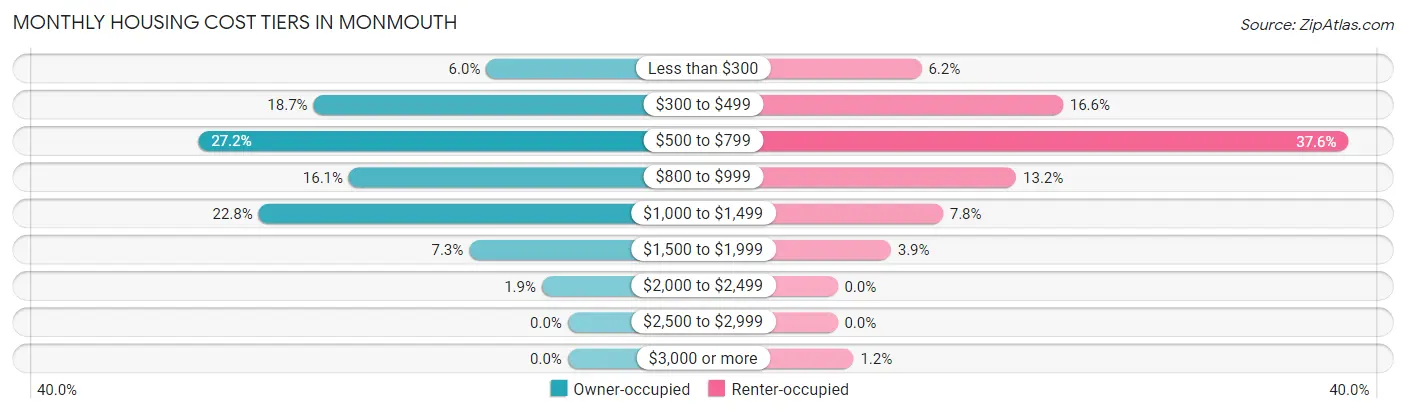
| Monthly Cost | Owner-occupied | Renter-occupied |
| Less than $300 | 138 (6.0%) | 63 (6.2%) |
| $300 to $499 | 431 (18.7%) | 169 (16.6%) |
| $500 to $799 | 626 (27.2%) | 383 (37.6%) |
| $800 to $999 | 371 (16.1%) | 134 (13.2%) |
| $1,000 to $1,499 | 524 (22.8%) | 79 (7.8%) |
| $1,500 to $1,999 | 167 (7.3%) | 40 (3.9%) |
| $2,000 to $2,499 | 44 (1.9%) | 0 (0.0%) |
| $2,500 to $2,999 | 0 (0.0%) | 0 (0.0%) |
| $3,000 or more | 0 (0.0%) | 12 (1.2%) |
| Total | 2,301 (100.0%) | 1,018 (100.0%) |
Physical Housing Characteristics in Monmouth
Housing Structures in Monmouth
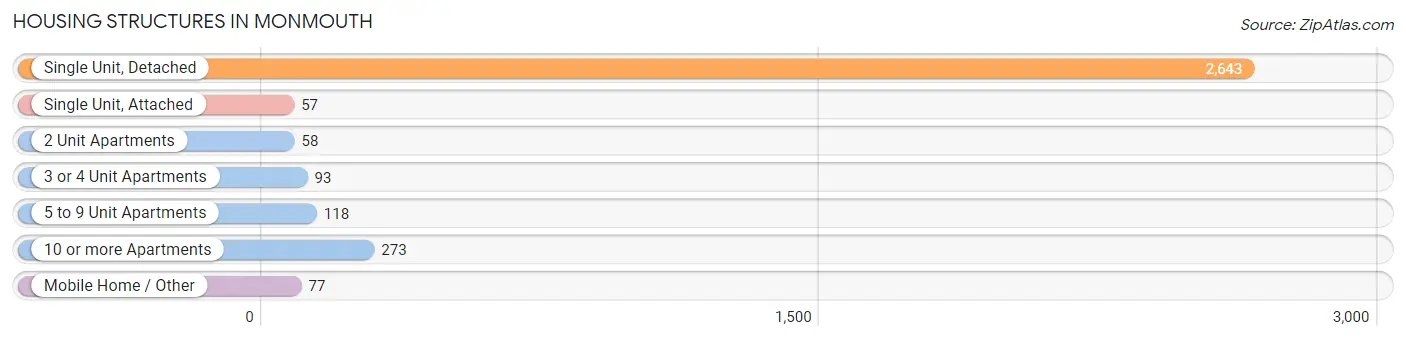
| Structure Type | # Housing Units | % Housing Units |
| Single Unit, Detached | 2,643 | 79.6% |
| Single Unit, Attached | 57 | 1.7% |
| 2 Unit Apartments | 58 | 1.8% |
| 3 or 4 Unit Apartments | 93 | 2.8% |
| 5 to 9 Unit Apartments | 118 | 3.6% |
| 10 or more Apartments | 273 | 8.2% |
| Mobile Home / Other | 77 | 2.3% |
| Total | 3,319 | 100.0% |
Housing Structures by Occupancy in Monmouth
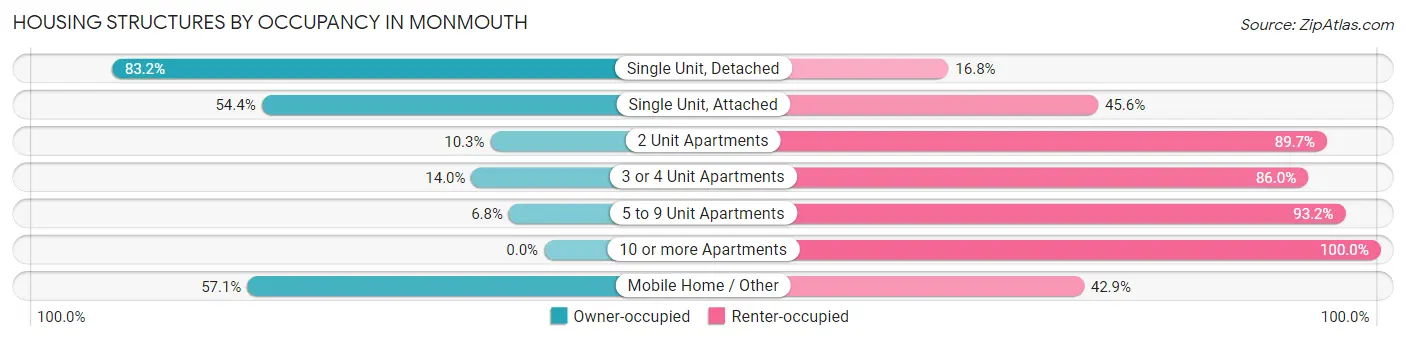
| Structure Type | Owner-occupied | Renter-occupied |
| Single Unit, Detached | 2,199 (83.2%) | 444 (16.8%) |
| Single Unit, Attached | 31 (54.4%) | 26 (45.6%) |
| 2 Unit Apartments | 6 (10.3%) | 52 (89.7%) |
| 3 or 4 Unit Apartments | 13 (14.0%) | 80 (86.0%) |
| 5 to 9 Unit Apartments | 8 (6.8%) | 110 (93.2%) |
| 10 or more Apartments | 0 (0.0%) | 273 (100.0%) |
| Mobile Home / Other | 44 (57.1%) | 33 (42.9%) |
| Total | 2,301 (69.3%) | 1,018 (30.7%) |
Housing Structures by Number of Rooms in Monmouth
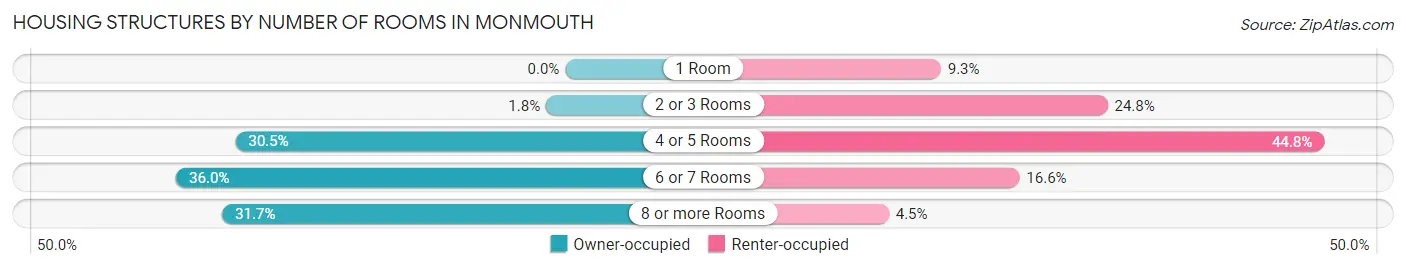
| Number of Rooms | Owner-occupied | Renter-occupied |
| 1 Room | 0 (0.0%) | 95 (9.3%) |
| 2 or 3 Rooms | 41 (1.8%) | 252 (24.7%) |
| 4 or 5 Rooms | 702 (30.5%) | 456 (44.8%) |
| 6 or 7 Rooms | 828 (36.0%) | 169 (16.6%) |
| 8 or more Rooms | 730 (31.7%) | 46 (4.5%) |
| Total | 2,301 (100.0%) | 1,018 (100.0%) |
Housing Structure by Heating Type in Monmouth
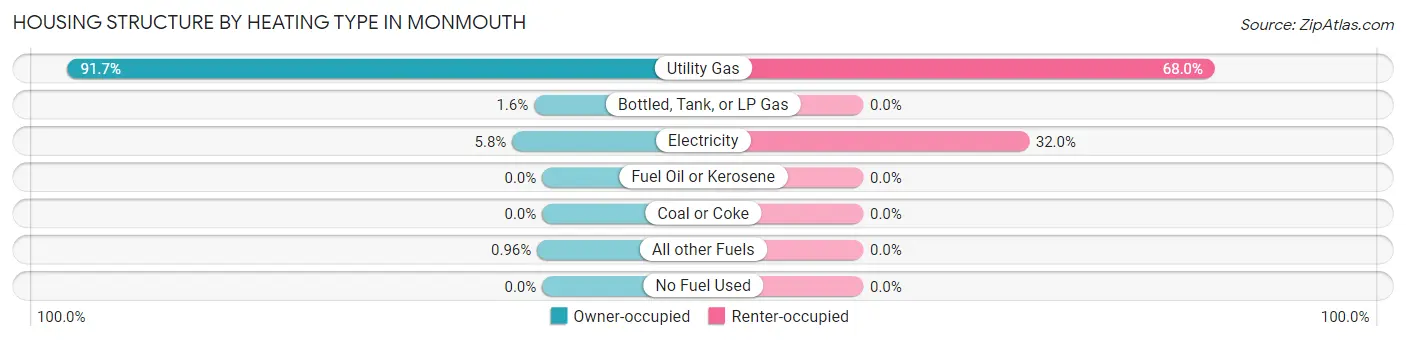
| Heating Type | Owner-occupied | Renter-occupied |
| Utility Gas | 2,110 (91.7%) | 692 (68.0%) |
| Bottled, Tank, or LP Gas | 36 (1.6%) | 0 (0.0%) |
| Electricity | 133 (5.8%) | 326 (32.0%) |
| Fuel Oil or Kerosene | 0 (0.0%) | 0 (0.0%) |
| Coal or Coke | 0 (0.0%) | 0 (0.0%) |
| All other Fuels | 22 (1.0%) | 0 (0.0%) |
| No Fuel Used | 0 (0.0%) | 0 (0.0%) |
| Total | 2,301 (100.0%) | 1,018 (100.0%) |
Household Vehicle Usage in Monmouth
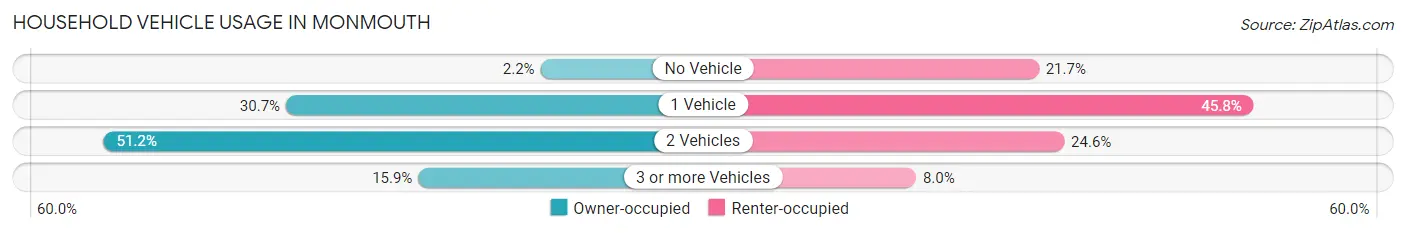
| Vehicles per Household | Owner-occupied | Renter-occupied |
| No Vehicle | 51 (2.2%) | 221 (21.7%) |
| 1 Vehicle | 707 (30.7%) | 466 (45.8%) |
| 2 Vehicles | 1,177 (51.1%) | 250 (24.6%) |
| 3 or more Vehicles | 366 (15.9%) | 81 (8.0%) |
| Total | 2,301 (100.0%) | 1,018 (100.0%) |
Real Estate & Mortgages in Monmouth
Real Estate and Mortgage Overview in Monmouth
| Characteristic | Without Mortgage | With Mortgage |
| Housing Units | 990 | 1,311 |
| Median Property Value | $91,300 | $88,800 |
| Median Household Income | $57,500 | $115 |
| Monthly Housing Costs | $490 | $0 |
| Real Estate Taxes | $1,615 | $0 |
Property Value by Mortgage Status in Monmouth
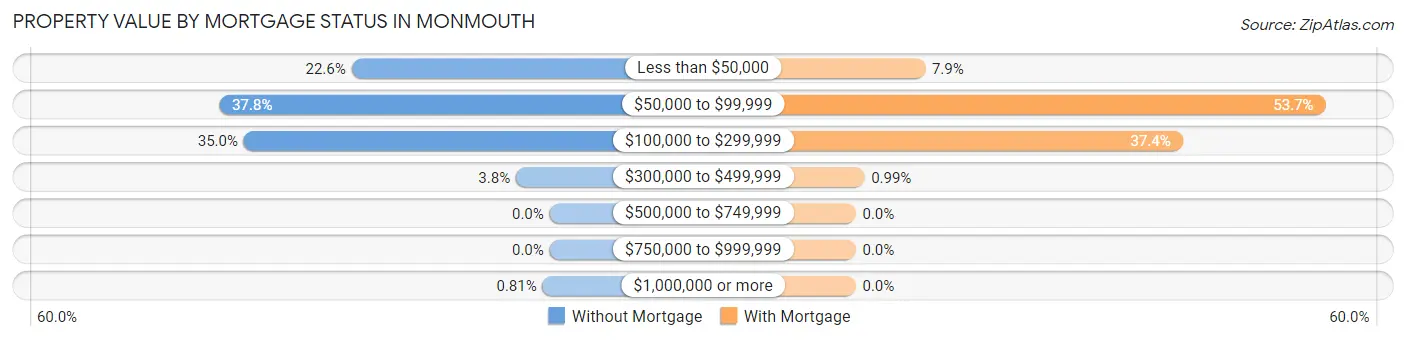
| Property Value | Without Mortgage | With Mortgage |
| Less than $50,000 | 224 (22.6%) | 104 (7.9%) |
| $50,000 to $99,999 | 374 (37.8%) | 704 (53.7%) |
| $100,000 to $299,999 | 346 (34.9%) | 490 (37.4%) |
| $300,000 to $499,999 | 38 (3.8%) | 13 (1.0%) |
| $500,000 to $749,999 | 0 (0.0%) | 0 (0.0%) |
| $750,000 to $999,999 | 0 (0.0%) | 0 (0.0%) |
| $1,000,000 or more | 8 (0.8%) | 0 (0.0%) |
| Total | 990 (100.0%) | 1,311 (100.0%) |
Household Income by Mortgage Status in Monmouth
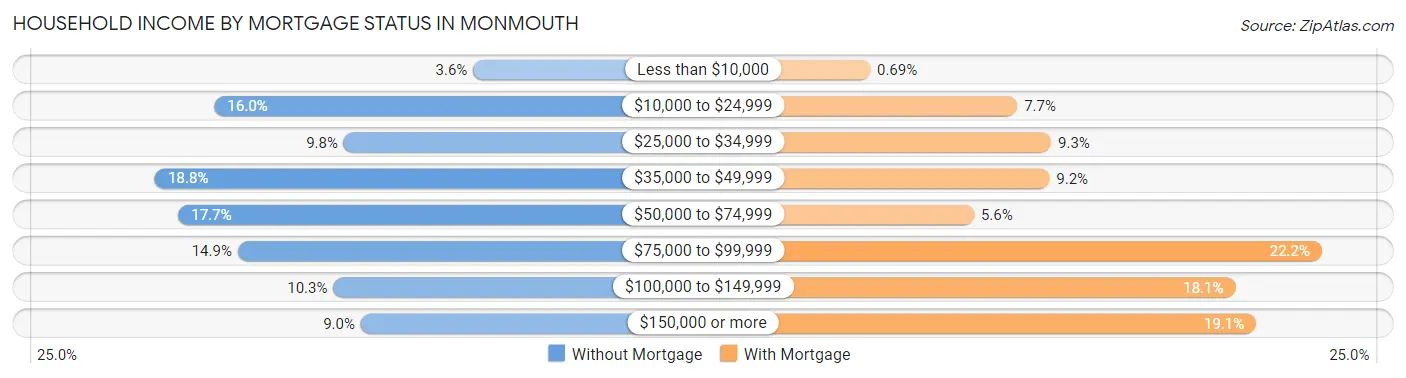
| Household Income | Without Mortgage | With Mortgage |
| Less than $10,000 | 36 (3.6%) | 9 (0.7%) |
| $10,000 to $24,999 | 158 (16.0%) | 101 (7.7%) |
| $25,000 to $34,999 | 97 (9.8%) | 122 (9.3%) |
| $35,000 to $49,999 | 186 (18.8%) | 121 (9.2%) |
| $50,000 to $74,999 | 175 (17.7%) | 74 (5.6%) |
| $75,000 to $99,999 | 147 (14.8%) | 291 (22.2%) |
| $100,000 to $149,999 | 102 (10.3%) | 237 (18.1%) |
| $150,000 or more | 89 (9.0%) | 250 (19.1%) |
| Total | 990 (100.0%) | 1,311 (100.0%) |
Property Value to Household Income Ratio in Monmouth
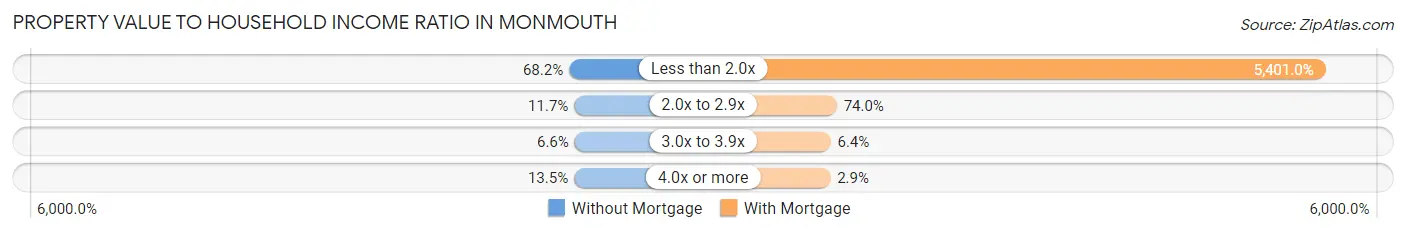
| Value-to-Income Ratio | Without Mortgage | With Mortgage |
| Less than 2.0x | 675 (68.2%) | 70,807 (5,401.0%) |
| 2.0x to 2.9x | 116 (11.7%) | 970 (74.0%) |
| 3.0x to 3.9x | 65 (6.6%) | 84 (6.4%) |
| 4.0x or more | 134 (13.5%) | 38 (2.9%) |
| Total | 990 (100.0%) | 1,311 (100.0%) |
Real Estate Taxes by Mortgage Status in Monmouth
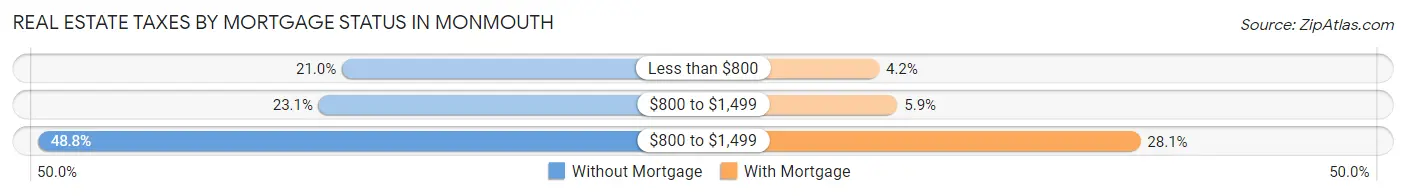
| Property Taxes | Without Mortgage | With Mortgage |
| Less than $800 | 208 (21.0%) | 55 (4.2%) |
| $800 to $1,499 | 229 (23.1%) | 77 (5.9%) |
| $800 to $1,499 | 483 (48.8%) | 368 (28.1%) |
| Total | 990 (100.0%) | 1,311 (100.0%) |
Health & Disability in Monmouth
Health Insurance Coverage by Age in Monmouth
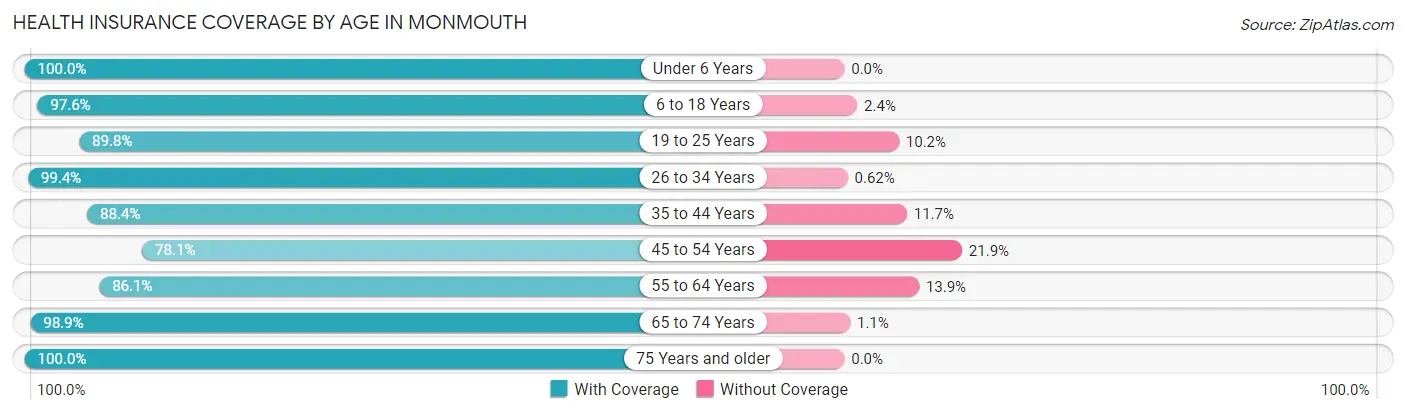
| Age Bracket | With Coverage | Without Coverage |
| Under 6 Years | 466 (100.0%) | 0 (0.0%) |
| 6 to 18 Years | 1,749 (97.6%) | 43 (2.4%) |
| 19 to 25 Years | 1,104 (89.8%) | 125 (10.2%) |
| 26 to 34 Years | 799 (99.4%) | 5 (0.6%) |
| 35 to 44 Years | 728 (88.3%) | 96 (11.7%) |
| 45 to 54 Years | 801 (78.1%) | 225 (21.9%) |
| 55 to 64 Years | 971 (86.1%) | 157 (13.9%) |
| 65 to 74 Years | 830 (98.9%) | 9 (1.1%) |
| 75 Years and older | 559 (100.0%) | 0 (0.0%) |
| Total | 8,007 (92.4%) | 660 (7.6%) |
Health Insurance Coverage by Citizenship Status in Monmouth
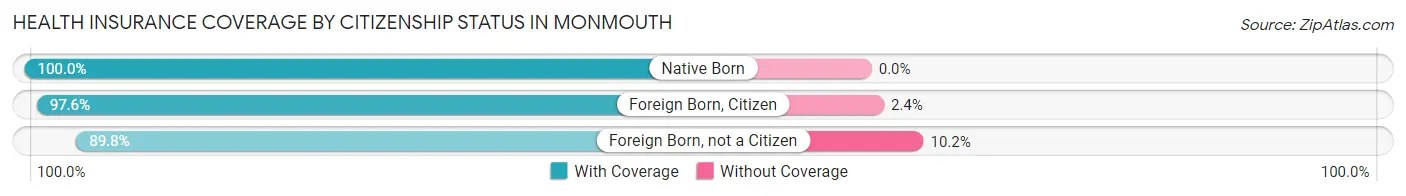
| Citizenship Status | With Coverage | Without Coverage |
| Native Born | 466 (100.0%) | 0 (0.0%) |
| Foreign Born, Citizen | 1,749 (97.6%) | 43 (2.4%) |
| Foreign Born, not a Citizen | 1,104 (89.8%) | 125 (10.2%) |
Health Insurance Coverage by Household Income in Monmouth
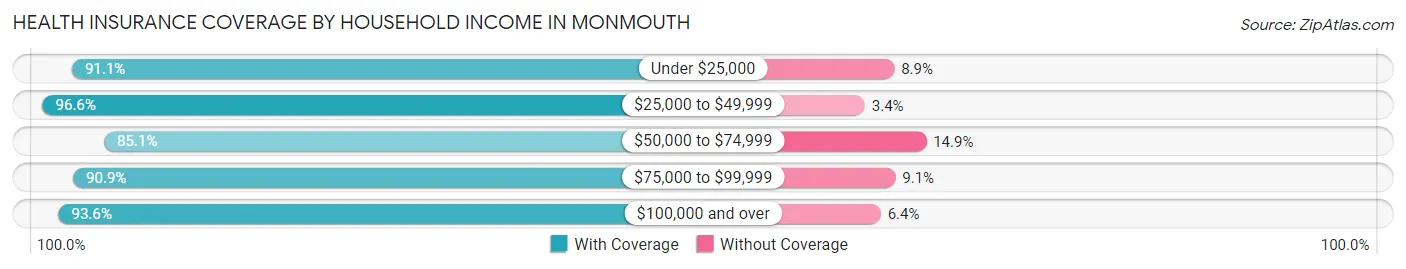
| Household Income | With Coverage | Without Coverage |
| Under $25,000 | 1,057 (91.1%) | 103 (8.9%) |
| $25,000 to $49,999 | 1,742 (96.6%) | 61 (3.4%) |
| $50,000 to $74,999 | 1,201 (85.1%) | 210 (14.9%) |
| $75,000 to $99,999 | 1,270 (90.9%) | 127 (9.1%) |
| $100,000 and over | 1,930 (93.6%) | 131 (6.4%) |
Public vs Private Health Insurance Coverage by Age in Monmouth
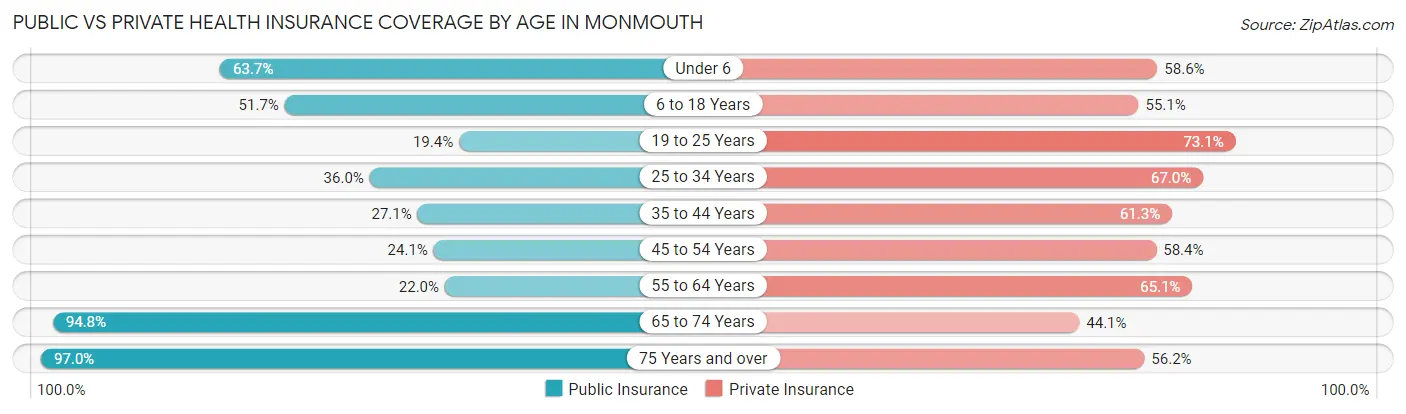
| Age Bracket | Public Insurance | Private Insurance |
| Under 6 | 297 (63.7%) | 273 (58.6%) |
| 6 to 18 Years | 927 (51.7%) | 987 (55.1%) |
| 19 to 25 Years | 238 (19.4%) | 898 (73.1%) |
| 25 to 34 Years | 289 (35.9%) | 539 (67.0%) |
| 35 to 44 Years | 223 (27.1%) | 505 (61.3%) |
| 45 to 54 Years | 247 (24.1%) | 599 (58.4%) |
| 55 to 64 Years | 248 (22.0%) | 734 (65.1%) |
| 65 to 74 Years | 795 (94.8%) | 370 (44.1%) |
| 75 Years and over | 542 (97.0%) | 314 (56.2%) |
| Total | 3,806 (43.9%) | 5,219 (60.2%) |
Disability Status by Sex by Age in Monmouth
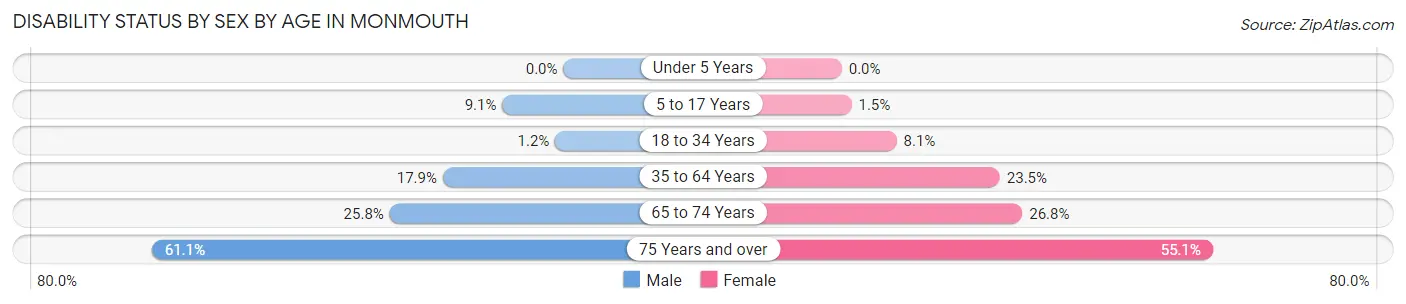
| Age Bracket | Male | Female |
| Under 5 Years | 0 (0.0%) | 0 (0.0%) |
| 5 to 17 Years | 81 (9.1%) | 11 (1.5%) |
| 18 to 34 Years | 13 (1.2%) | 97 (8.1%) |
| 35 to 64 Years | 244 (17.9%) | 379 (23.5%) |
| 65 to 74 Years | 98 (25.8%) | 123 (26.8%) |
| 75 Years and over | 143 (61.1%) | 179 (55.1%) |
Disability Class by Sex by Age in Monmouth
Disability Class: Hearing Difficulty
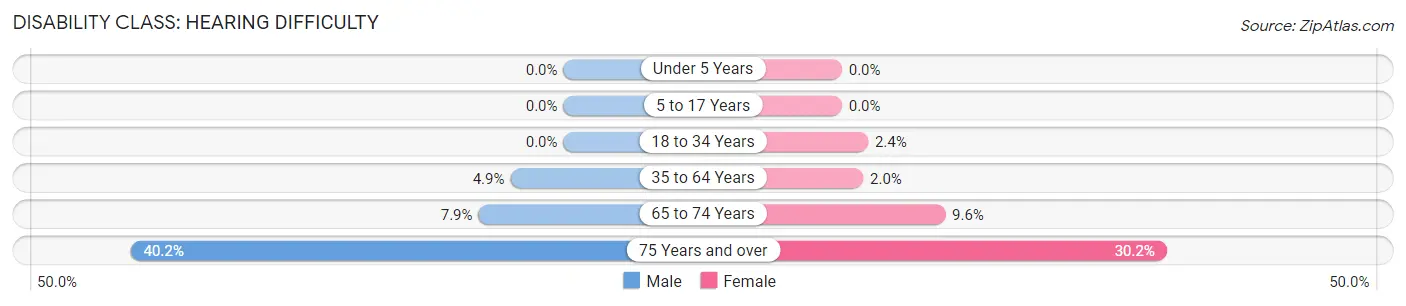
| Age Bracket | Male | Female |
| Under 5 Years | 0 (0.0%) | 0 (0.0%) |
| 5 to 17 Years | 0 (0.0%) | 0 (0.0%) |
| 18 to 34 Years | 0 (0.0%) | 29 (2.4%) |
| 35 to 64 Years | 67 (4.9%) | 32 (2.0%) |
| 65 to 74 Years | 30 (7.9%) | 44 (9.6%) |
| 75 Years and over | 94 (40.2%) | 98 (30.1%) |
Disability Class: Vision Difficulty
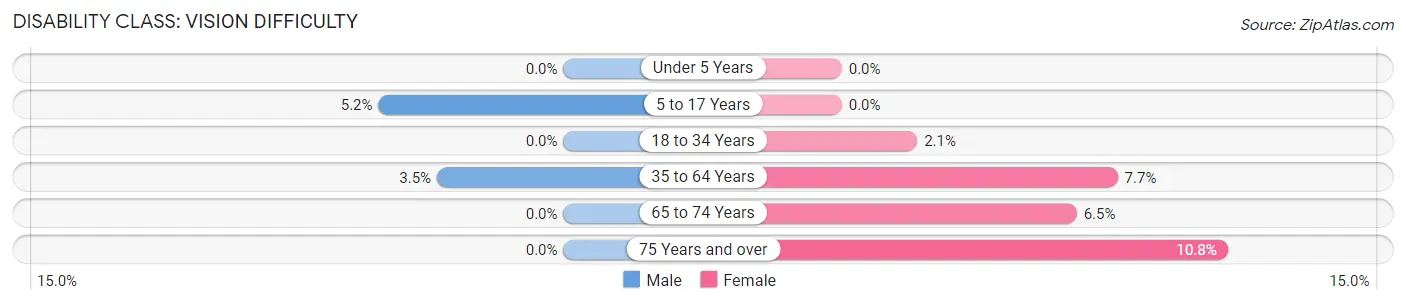
| Age Bracket | Male | Female |
| Under 5 Years | 0 (0.0%) | 0 (0.0%) |
| 5 to 17 Years | 46 (5.1%) | 0 (0.0%) |
| 18 to 34 Years | 0 (0.0%) | 25 (2.1%) |
| 35 to 64 Years | 48 (3.5%) | 124 (7.7%) |
| 65 to 74 Years | 0 (0.0%) | 30 (6.5%) |
| 75 Years and over | 0 (0.0%) | 35 (10.8%) |
Disability Class: Cognitive Difficulty
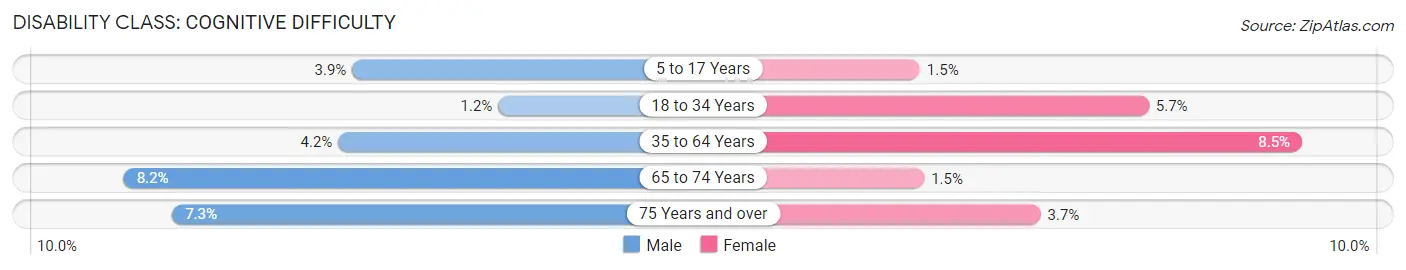
| Age Bracket | Male | Female |
| 5 to 17 Years | 35 (3.9%) | 11 (1.5%) |
| 18 to 34 Years | 13 (1.2%) | 68 (5.7%) |
| 35 to 64 Years | 57 (4.2%) | 138 (8.5%) |
| 65 to 74 Years | 31 (8.2%) | 7 (1.5%) |
| 75 Years and over | 17 (7.3%) | 12 (3.7%) |
Disability Class: Ambulatory Difficulty
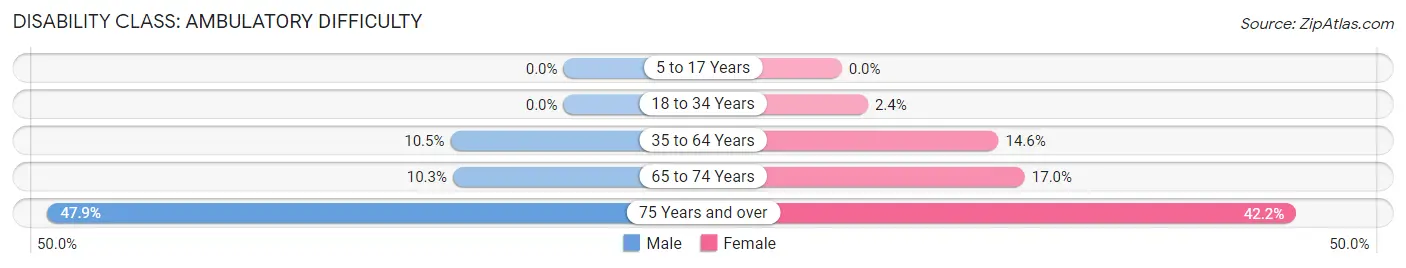
| Age Bracket | Male | Female |
| 5 to 17 Years | 0 (0.0%) | 0 (0.0%) |
| 18 to 34 Years | 0 (0.0%) | 29 (2.4%) |
| 35 to 64 Years | 143 (10.5%) | 235 (14.5%) |
| 65 to 74 Years | 39 (10.3%) | 78 (17.0%) |
| 75 Years and over | 112 (47.9%) | 137 (42.1%) |
Disability Class: Self-Care Difficulty
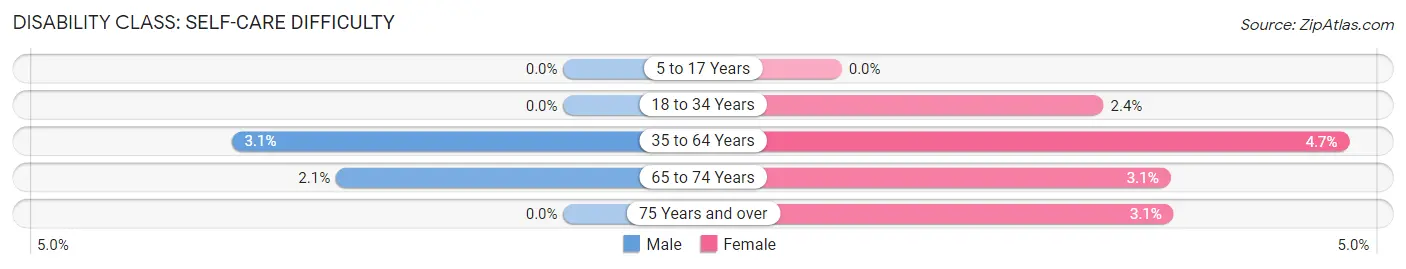
| Age Bracket | Male | Female |
| 5 to 17 Years | 0 (0.0%) | 0 (0.0%) |
| 18 to 34 Years | 0 (0.0%) | 29 (2.4%) |
| 35 to 64 Years | 42 (3.1%) | 76 (4.7%) |
| 65 to 74 Years | 8 (2.1%) | 14 (3.0%) |
| 75 Years and over | 0 (0.0%) | 10 (3.1%) |
Technology Access in Monmouth
Computing Device Access in Monmouth
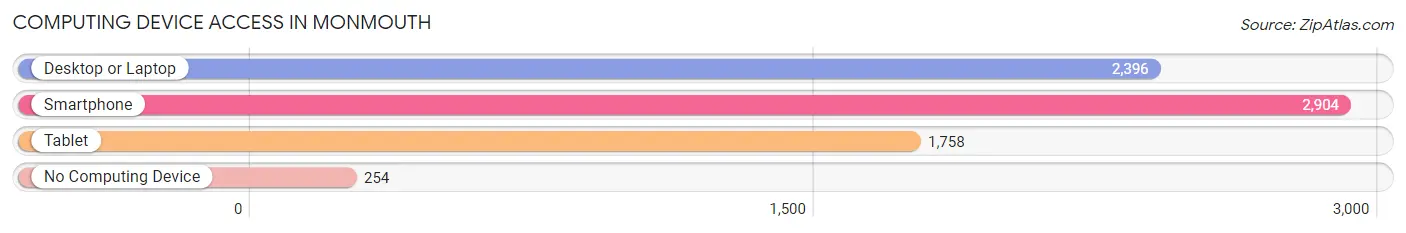
| Device Type | # Households | % Households |
| Desktop or Laptop | 2,396 | 72.2% |
| Smartphone | 2,904 | 87.5% |
| Tablet | 1,758 | 53.0% |
| No Computing Device | 254 | 7.6% |
| Total | 3,319 | 100.0% |
Internet Access in Monmouth
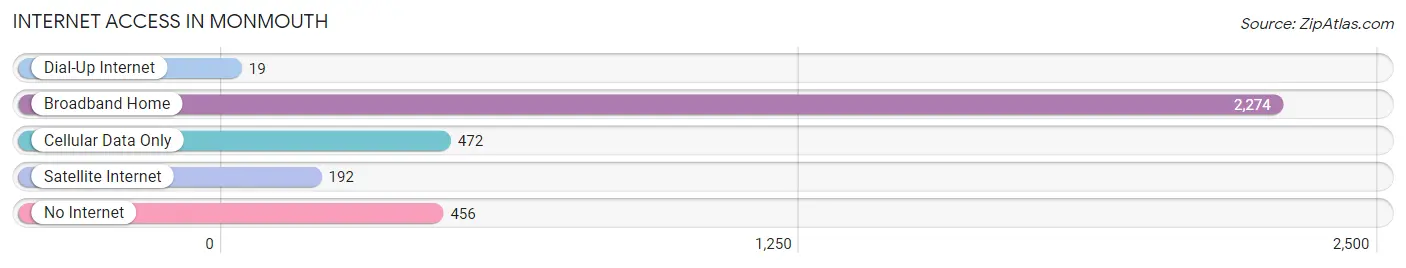
| Internet Type | # Households | % Households |
| Dial-Up Internet | 19 | 0.6% |
| Broadband Home | 2,274 | 68.5% |
| Cellular Data Only | 472 | 14.2% |
| Satellite Internet | 192 | 5.8% |
| No Internet | 456 | 13.7% |
| Total | 3,319 | 100.0% |
Monmouth Summary
Monmouth, Illinois is a small city located in Warren County, Illinois, United States. It is the county seat of Warren County and is located along the banks of the Mississippi River. The city has a population of 9,444 as of the 2010 census.
History
Monmouth was founded in 1831 by settlers from New England. The city was named after Monmouth, Maine, the hometown of one of the settlers. The city was incorporated in 1837 and was designated as the county seat of Warren County in 1839.
Monmouth was an important stop on the Underground Railroad, with many of the city's residents helping to hide and transport escaped slaves. The city was also an important stop on the Chicago, Burlington and Quincy Railroad, which connected Chicago to the Mississippi River.
Geography
Monmouth is located at 40°51'N 90°41'W (40.851, -90.683). It is situated along the banks of the Mississippi River in western Illinois. The city has a total area of 5.2 square miles, all of which is land.
Economy
Monmouth's economy is largely based on agriculture and manufacturing. The city is home to several large manufacturing companies, including Monmouth Plastics, Monmouth Foundry, and Monmouth Tool & Die. The city is also home to several agricultural businesses, including grain elevators, feed mills, and livestock farms.
Demographics
As of the 2010 census, Monmouth had a population of 9,444. The racial makeup of the city was 92.2% White, 4.2% African American, 0.4% Native American, 0.7% Asian, 0.1% Pacific Islander, 1.2% from other races, and 1.2% from two or more races. Hispanic or Latino of any race were 3.2% of the population.
The median income for a household in Monmouth was $41,945, and the median income for a family was $50,945. The per capita income for the city was $20,845. About 11.2% of families and 14.2% of the population were below the poverty line, including 19.2% of those under age 18 and 8.2% of those age 65 or over.
Common Questions
What is Per Capita Income in Monmouth?
Per Capita income in Monmouth is $27,553.
What is the Median Family Income in Monmouth?
Median Family Income in Monmouth is $70,726.
What is the Median Household income in Monmouth?
Median Household Income in Monmouth is $58,991.
What is Income or Wage Gap in Monmouth?
Income or Wage Gap in Monmouth is 39.3%.
Women in Monmouth earn 60.7 cents for every dollar earned by a man.
What is Inequality or Gini Index in Monmouth?
Inequality or Gini Index in Monmouth is 0.43.
What is the Total Population of Monmouth?
Total Population of Monmouth is 8,764.
What is the Total Male Population of Monmouth?
Total Male Population of Monmouth is 4,196.
What is the Total Female Population of Monmouth?
Total Female Population of Monmouth is 4,568.
What is the Ratio of Males per 100 Females in Monmouth?
There are 91.86 Males per 100 Females in Monmouth.
What is the Ratio of Females per 100 Males in Monmouth?
There are 108.87 Females per 100 Males in Monmouth.
What is the Median Population Age in Monmouth?
Median Population Age in Monmouth is 36.0 Years.
What is the Average Family Size in Monmouth
Average Family Size in Monmouth is 2.9 People.
What is the Average Household Size in Monmouth
Average Household Size in Monmouth is 2.4 People.
How Large is the Labor Force in Monmouth?
There are 4,303 People in the Labor Forcein in Monmouth.
What is the Percentage of People in the Labor Force in Monmouth?
61.8% of People are in the Labor Force in Monmouth.
What is the Unemployment Rate in Monmouth?
Unemployment Rate in Monmouth is 10.7%.