Orland Park, IL Map & Demographics
Orland Park Map
Orland Park Overview
$49,989
PER CAPITA INCOME
$118,190
AVG FAMILY INCOME
$97,365
AVG HOUSEHOLD INCOME
31.0%
WAGE / INCOME GAP [ % ]
69.0¢/ $1
WAGE / INCOME GAP [ $ ]
$8,835
FAMILY INCOME DEFICIT
0.44
INEQUALITY / GINI INDEX
58,345
TOTAL POPULATION
29,713
MALE POPULATION
28,632
FEMALE POPULATION
103.78
MALES / 100 FEMALES
96.36
FEMALES / 100 MALES
46.6
MEDIAN AGE
3.1
AVG FAMILY SIZE
2.5
AVG HOUSEHOLD SIZE
29,301
LABOR FORCE [ PEOPLE ]
60.5%
PERCENT IN LABOR FORCE
4.5%
UNEMPLOYMENT RATE
Orland Park Area Codes
Income in Orland Park
Income Overview in Orland Park
Per Capita Income in Orland Park is $49,989, while median incomes of families and households are $118,190 and $97,365 respectively.
| Characteristic | Number | Measure |
| Per Capita Income | 58,345 | $49,989 |
| Median Family Income | 15,925 | $118,190 |
| Mean Family Income | 15,925 | $146,822 |
| Median Household Income | 22,980 | $97,365 |
| Mean Household Income | 22,980 | $124,860 |
| Income Deficit | 15,925 | $8,835 |
| Wage / Income Gap (%) | 58,345 | 30.95% |
| Wage / Income Gap ($) | 58,345 | 69.05¢ per $1 |
| Gini / Inequality Index | 58,345 | 0.44 |
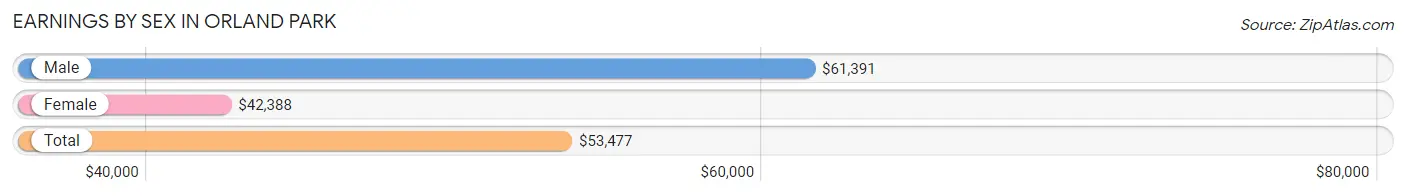
Earnings by Sex in Orland Park
Average Earnings in Orland Park are $53,477, $61,391 for men and $42,388 for women, a difference of 30.9%.
| Sex | Number | Average Earnings |
| Male | 17,181 (56.6%) | $61,391 |
| Female | 13,169 (43.4%) | $42,388 |
| Total | 30,350 (100.0%) | $53,477 |
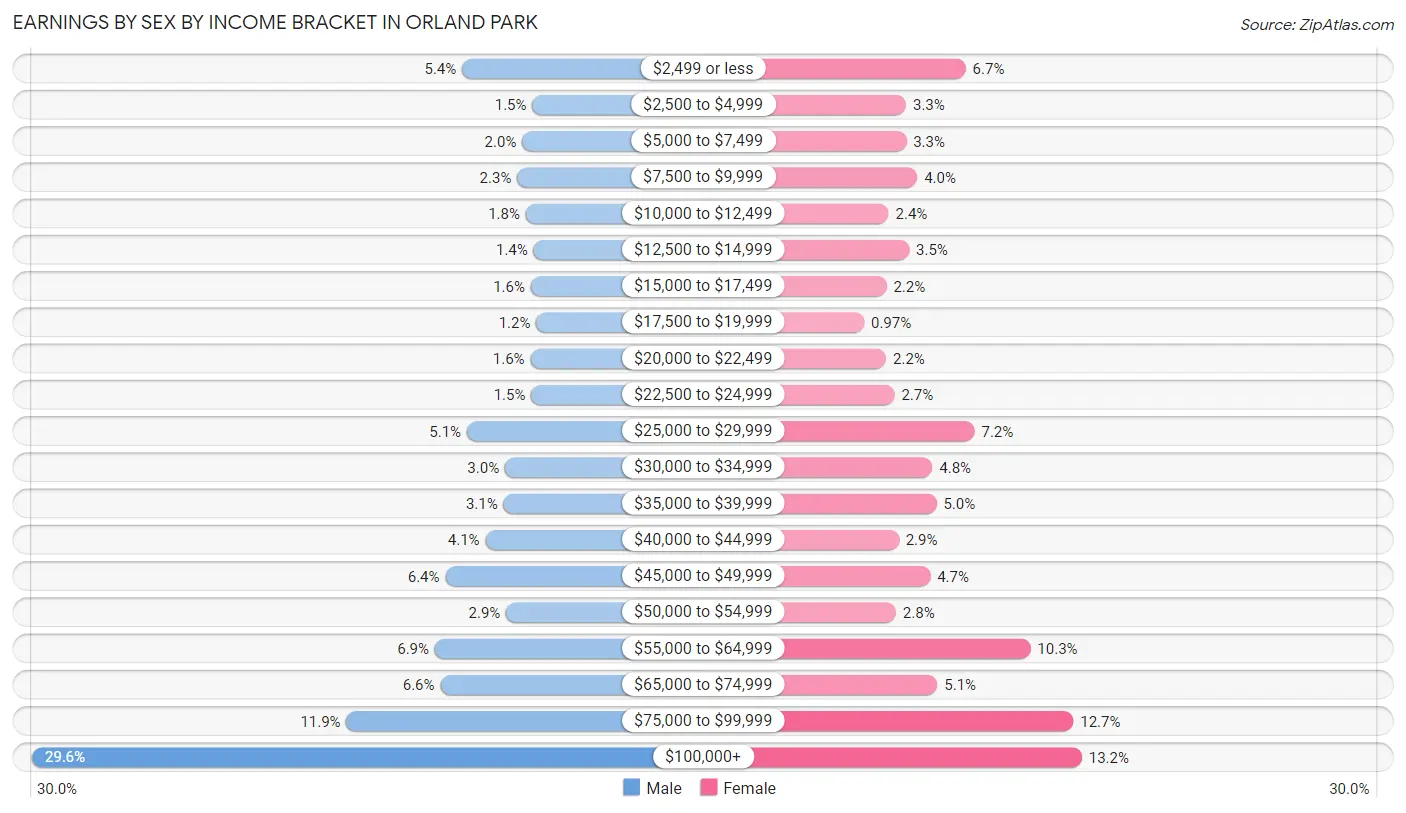
Earnings by Sex by Income Bracket in Orland Park
The most common earnings brackets in Orland Park are $100,000+ for men (5,084 | 29.6%) and $100,000+ for women (1,739 | 13.2%).
| Income | Male | Female |
| $2,499 or less | 930 (5.4%) | 880 (6.7%) |
| $2,500 to $4,999 | 251 (1.5%) | 439 (3.3%) |
| $5,000 to $7,499 | 349 (2.0%) | 440 (3.3%) |
| $7,500 to $9,999 | 397 (2.3%) | 522 (4.0%) |
| $10,000 to $12,499 | 314 (1.8%) | 309 (2.4%) |
| $12,500 to $14,999 | 238 (1.4%) | 461 (3.5%) |
| $15,000 to $17,499 | 267 (1.5%) | 294 (2.2%) |
| $17,500 to $19,999 | 213 (1.2%) | 128 (1.0%) |
| $20,000 to $22,499 | 270 (1.6%) | 291 (2.2%) |
| $22,500 to $24,999 | 262 (1.5%) | 353 (2.7%) |
| $25,000 to $29,999 | 883 (5.1%) | 945 (7.2%) |
| $30,000 to $34,999 | 515 (3.0%) | 634 (4.8%) |
| $35,000 to $39,999 | 530 (3.1%) | 664 (5.0%) |
| $40,000 to $44,999 | 704 (4.1%) | 385 (2.9%) |
| $45,000 to $49,999 | 1,091 (6.4%) | 617 (4.7%) |
| $50,000 to $54,999 | 504 (2.9%) | 363 (2.8%) |
| $55,000 to $64,999 | 1,193 (6.9%) | 1,359 (10.3%) |
| $65,000 to $74,999 | 1,139 (6.6%) | 670 (5.1%) |
| $75,000 to $99,999 | 2,047 (11.9%) | 1,676 (12.7%) |
| $100,000+ | 5,084 (29.6%) | 1,739 (13.2%) |
| Total | 17,181 (100.0%) | 13,169 (100.0%) |
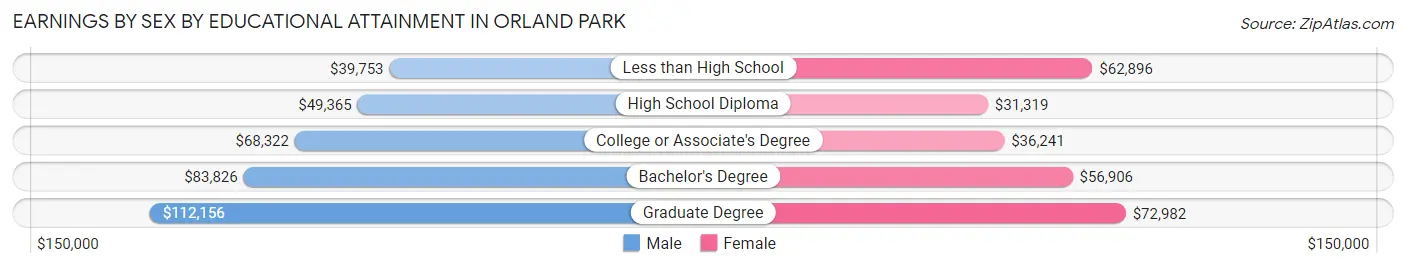
Earnings by Sex by Educational Attainment in Orland Park
Average earnings in Orland Park are $71,088 for men and $48,407 for women, a difference of 31.9%. Men with an educational attainment of graduate degree enjoy the highest average annual earnings of $112,156, while those with less than high school education earn the least with $39,753. Women with an educational attainment of graduate degree earn the most with the average annual earnings of $72,982, while those with high school diploma education have the smallest earnings of $31,319.
| Educational Attainment | Male Income | Female Income |
| Less than High School | $39,753 | $62,896 |
| High School Diploma | $49,365 | $31,319 |
| College or Associate's Degree | $68,322 | $36,241 |
| Bachelor's Degree | $83,826 | $56,906 |
| Graduate Degree | $112,156 | $72,982 |
| Total | $71,088 | $48,407 |
Family Income in Orland Park
Family Income Brackets in Orland Park
According to the Orland Park family income data, there are 3,838 families falling into the $100,000 to $149,999 income range, which is the most common income bracket and makes up 24.1% of all families. Conversely, the less than $10,000 income bracket is the least frequent group with only 143 families (0.9%) belonging to this category.
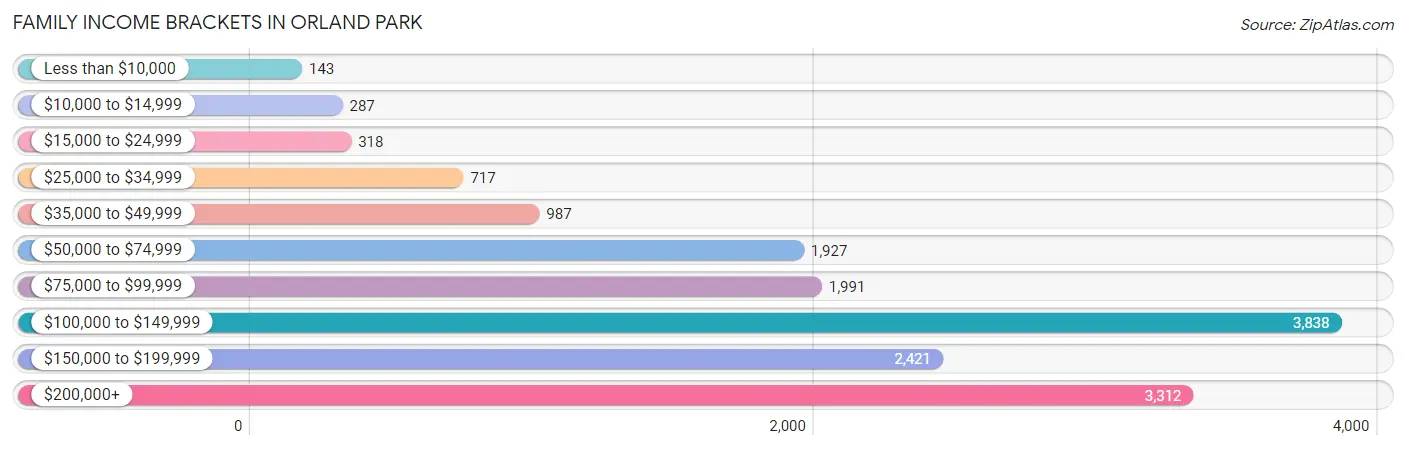
| Income Bracket | # Families | % Families |
| Less than $10,000 | 143 | 0.9% |
| $10,000 to $14,999 | 287 | 1.8% |
| $15,000 to $24,999 | 318 | 2.0% |
| $25,000 to $34,999 | 717 | 4.5% |
| $35,000 to $49,999 | 987 | 6.2% |
| $50,000 to $74,999 | 1,927 | 12.1% |
| $75,000 to $99,999 | 1,991 | 12.5% |
| $100,000 to $149,999 | 3,838 | 24.1% |
| $150,000 to $199,999 | 2,421 | 15.2% |
| $200,000+ | 3,312 | 20.8% |
Family Income by Famaliy Size in Orland Park
4-person families (2,771 | 17.4%) account for the highest median family income in Orland Park with $147,165 per family, while 2-person families (7,353 | 46.2%) have the highest median income of $48,362 per family member.
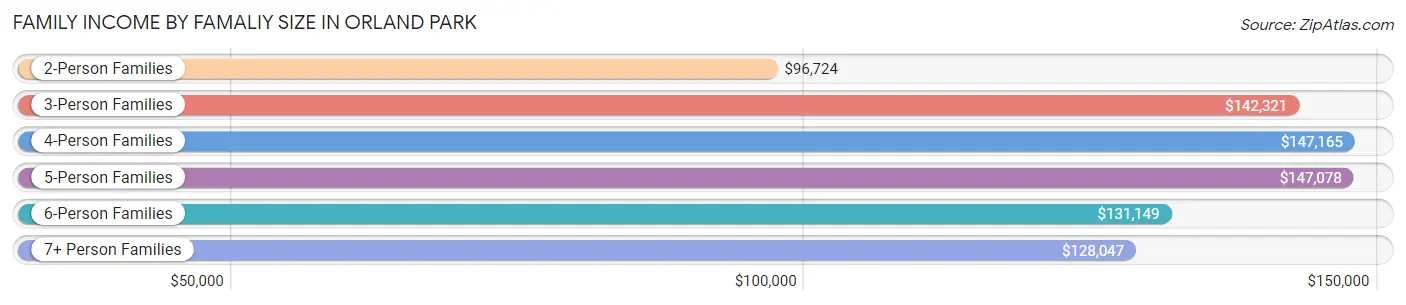
| Income Bracket | # Families | Median Income |
| 2-Person Families | 7,353 (46.2%) | $96,724 |
| 3-Person Families | 3,562 (22.4%) | $142,321 |
| 4-Person Families | 2,771 (17.4%) | $147,165 |
| 5-Person Families | 1,427 (9.0%) | $147,078 |
| 6-Person Families | 723 (4.5%) | $131,149 |
| 7+ Person Families | 89 (0.6%) | $128,047 |
| Total | 15,925 (100.0%) | $118,190 |
Family Income by Number of Earners in Orland Park
The median family income in Orland Park is $118,190, with families comprising 3+ earners (2,421) having the highest median family income of $193,359, while families with no earners (2,839) have the lowest median family income of $71,603, accounting for 15.2% and 17.8% of families, respectively.
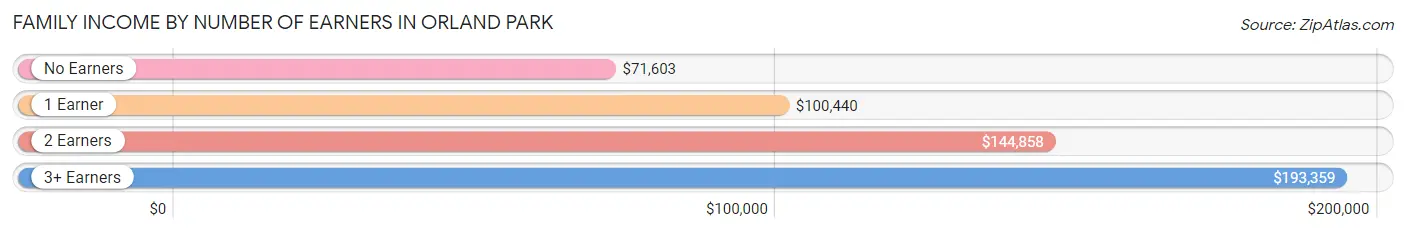
| Number of Earners | # Families | Median Income |
| No Earners | 2,839 (17.8%) | $71,603 |
| 1 Earner | 4,365 (27.4%) | $100,440 |
| 2 Earners | 6,300 (39.6%) | $144,858 |
| 3+ Earners | 2,421 (15.2%) | $193,359 |
| Total | 15,925 (100.0%) | $118,190 |
Household Income in Orland Park
Household Income Brackets in Orland Park
With 4,872 households falling in the category, the $100,000 to $149,999 income range is the most frequent in Orland Park, accounting for 21.2% of all households. In contrast, only 460 households (2.0%) fall into the $10,000 to $14,999 income bracket, making it the least populous group.
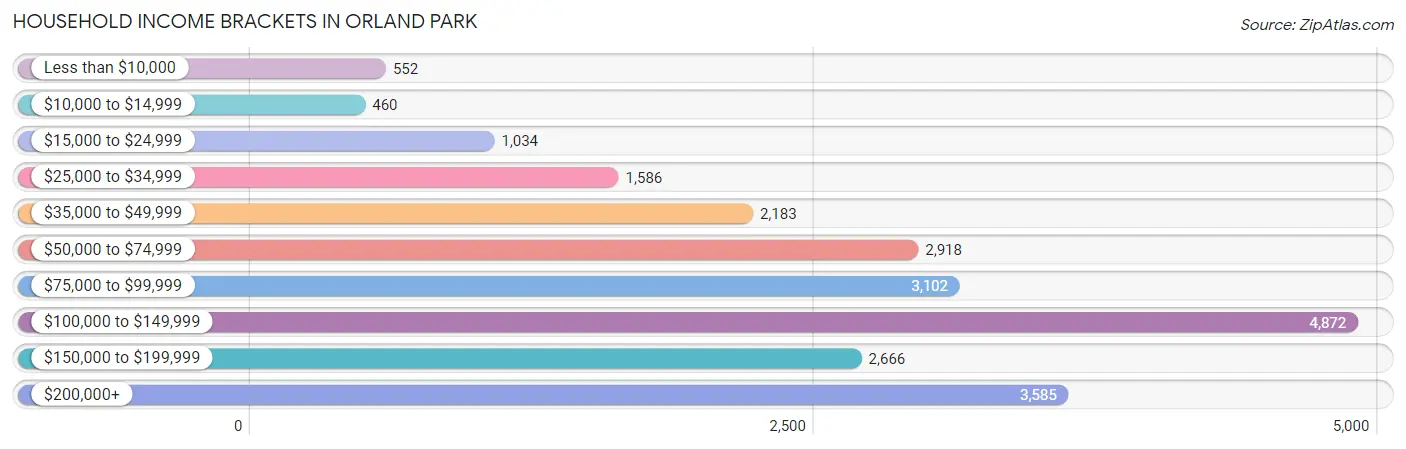
| Income Bracket | # Households | % Households |
| Less than $10,000 | 552 | 2.4% |
| $10,000 to $14,999 | 460 | 2.0% |
| $15,000 to $24,999 | 1,034 | 4.5% |
| $25,000 to $34,999 | 1,586 | 6.9% |
| $35,000 to $49,999 | 2,183 | 9.5% |
| $50,000 to $74,999 | 2,918 | 12.7% |
| $75,000 to $99,999 | 3,102 | 13.5% |
| $100,000 to $149,999 | 4,872 | 21.2% |
| $150,000 to $199,999 | 2,666 | 11.6% |
| $200,000+ | 3,585 | 15.6% |
Household Income by Householder Age in Orland Park
The median household income in Orland Park is $97,365, with the highest median household income of $125,298 found in the 45 to 64 years age bracket for the primary householder. A total of 9,074 households (39.5%) fall into this category. Meanwhile, the 15 to 24 years age bracket for the primary householder has the lowest median household income of $49,429, with 176 households (0.8%) in this group.
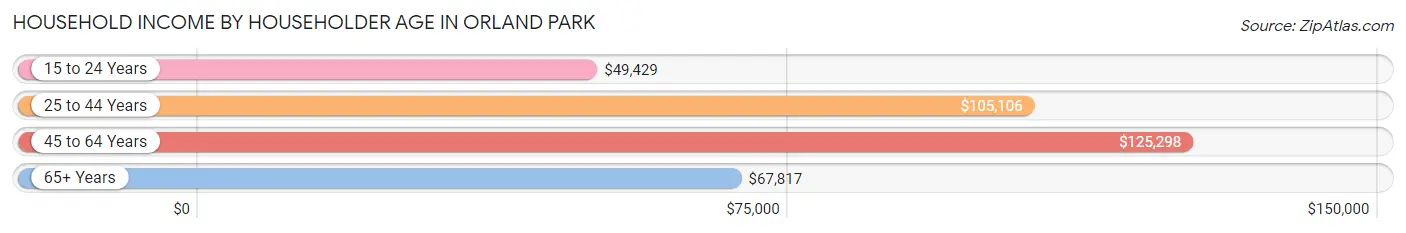
| Income Bracket | # Households | Median Income |
| 15 to 24 Years | 176 (0.8%) | $49,429 |
| 25 to 44 Years | 5,369 (23.4%) | $105,106 |
| 45 to 64 Years | 9,074 (39.5%) | $125,298 |
| 65+ Years | 8,361 (36.4%) | $67,817 |
| Total | 22,980 (100.0%) | $97,365 |
Poverty in Orland Park
Income Below Poverty by Sex and Age in Orland Park
With 4.5% poverty level for males and 6.3% for females among the residents of Orland Park, 75 year old and over males and 75 year old and over females are the most vulnerable to poverty, with 240 males (9.2%) and 426 females (13.9%) in their respective age groups living below the poverty level.
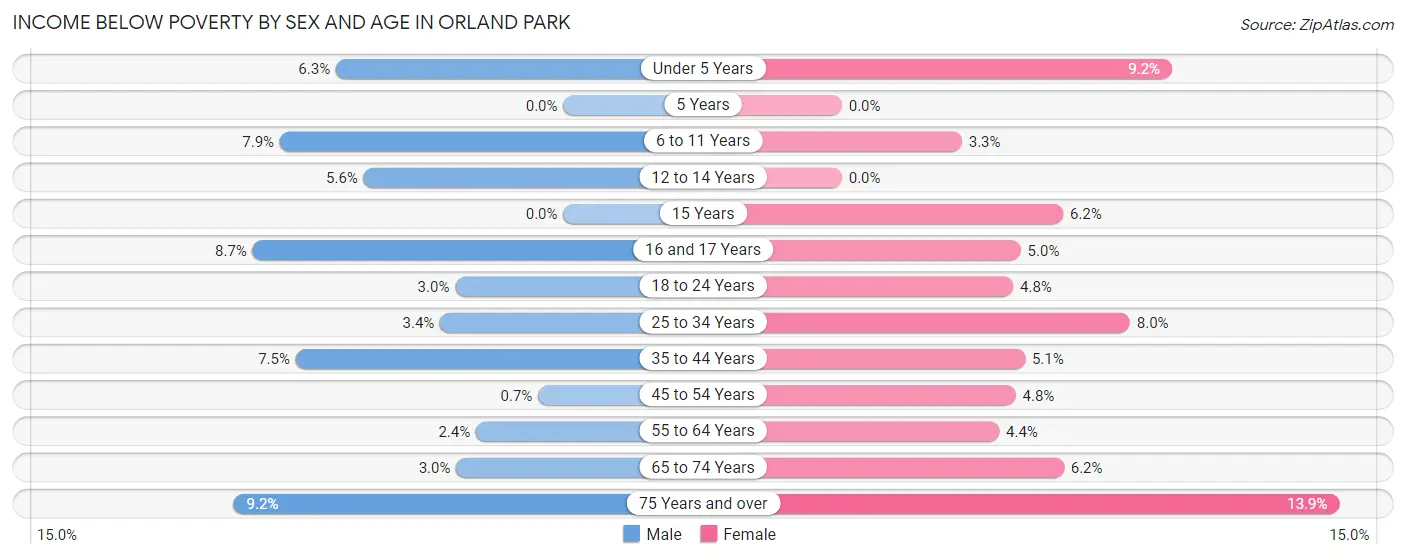
| Age Bracket | Male | Female |
| Under 5 Years | 90 (6.3%) | 131 (9.2%) |
| 5 Years | 0 (0.0%) | 0 (0.0%) |
| 6 to 11 Years | 191 (7.9%) | 47 (3.3%) |
| 12 to 14 Years | 68 (5.6%) | 0 (0.0%) |
| 15 Years | 0 (0.0%) | 17 (6.2%) |
| 16 and 17 Years | 88 (8.6%) | 54 (5.0%) |
| 18 to 24 Years | 65 (3.0%) | 79 (4.8%) |
| 25 to 34 Years | 101 (3.4%) | 217 (8.0%) |
| 35 to 44 Years | 249 (7.4%) | 153 (5.1%) |
| 45 to 54 Years | 27 (0.7%) | 171 (4.8%) |
| 55 to 64 Years | 108 (2.4%) | 204 (4.4%) |
| 65 to 74 Years | 100 (3.0%) | 276 (6.2%) |
| 75 Years and over | 240 (9.2%) | 426 (13.9%) |
| Total | 1,327 (4.5%) | 1,775 (6.3%) |
Income Above Poverty by Sex and Age in Orland Park
According to the poverty statistics in Orland Park, males aged 5 years and females aged 5 years are the age groups that are most secure financially, with 100.0% of males and 100.0% of females in these age groups living above the poverty line.
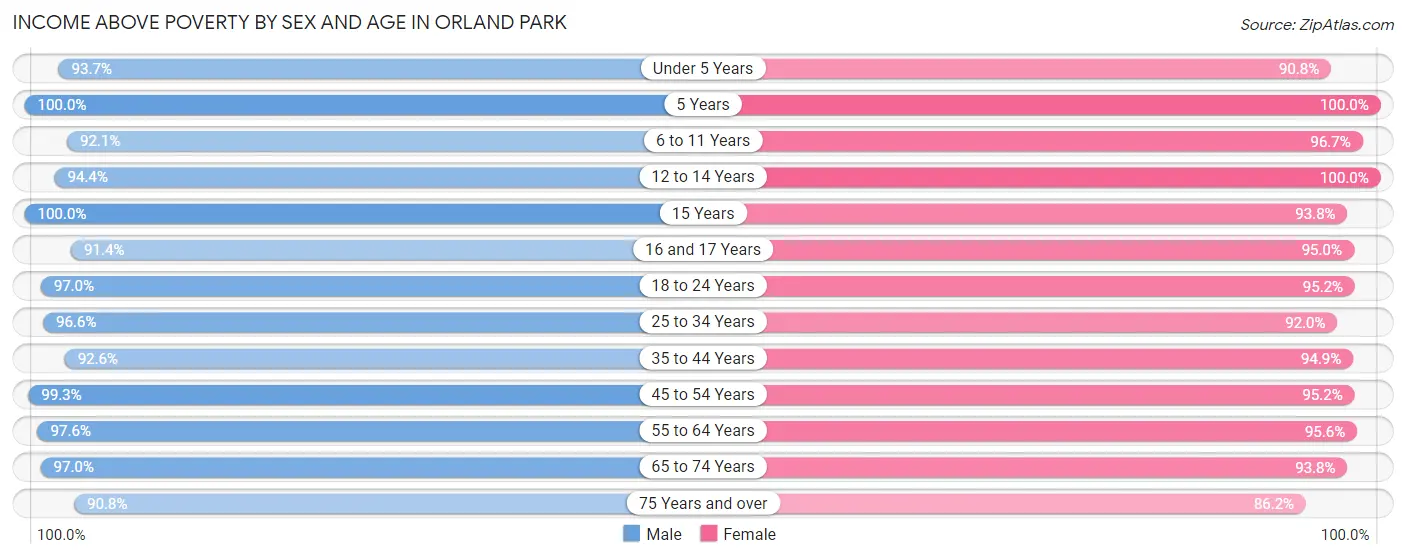
| Age Bracket | Male | Female |
| Under 5 Years | 1,331 (93.7%) | 1,295 (90.8%) |
| 5 Years | 366 (100.0%) | 191 (100.0%) |
| 6 to 11 Years | 2,230 (92.1%) | 1,360 (96.7%) |
| 12 to 14 Years | 1,154 (94.4%) | 773 (100.0%) |
| 15 Years | 335 (100.0%) | 259 (93.8%) |
| 16 and 17 Years | 929 (91.3%) | 1,031 (95.0%) |
| 18 to 24 Years | 2,092 (97.0%) | 1,577 (95.2%) |
| 25 to 34 Years | 2,842 (96.6%) | 2,490 (92.0%) |
| 35 to 44 Years | 3,094 (92.5%) | 2,846 (94.9%) |
| 45 to 54 Years | 3,855 (99.3%) | 3,361 (95.2%) |
| 55 to 64 Years | 4,337 (97.6%) | 4,452 (95.6%) |
| 65 to 74 Years | 3,261 (97.0%) | 4,191 (93.8%) |
| 75 Years and over | 2,375 (90.8%) | 2,650 (86.2%) |
| Total | 28,201 (95.5%) | 26,476 (93.7%) |
Income Below Poverty Among Married-Couple Families in Orland Park
The poverty statistics for married-couple families in Orland Park show that 4.4% or 583 of the total 13,319 families live below the poverty line. Families with 5 or more children have the highest poverty rate of 46.2%, comprising of 12 families. On the other hand, families with 3 or 4 children have the lowest poverty rate of 3.8%, which includes 46 families.
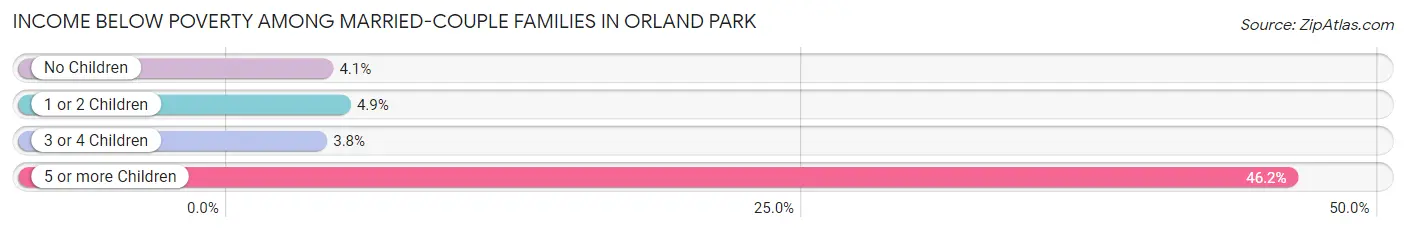
| Children | Above Poverty | Below Poverty |
| No Children | 8,089 (95.9%) | 347 (4.1%) |
| 1 or 2 Children | 3,480 (95.1%) | 178 (4.9%) |
| 3 or 4 Children | 1,153 (96.2%) | 46 (3.8%) |
| 5 or more Children | 14 (53.8%) | 12 (46.2%) |
| Total | 12,736 (95.6%) | 583 (4.4%) |
Income Below Poverty Among Single-Parent Households in Orland Park
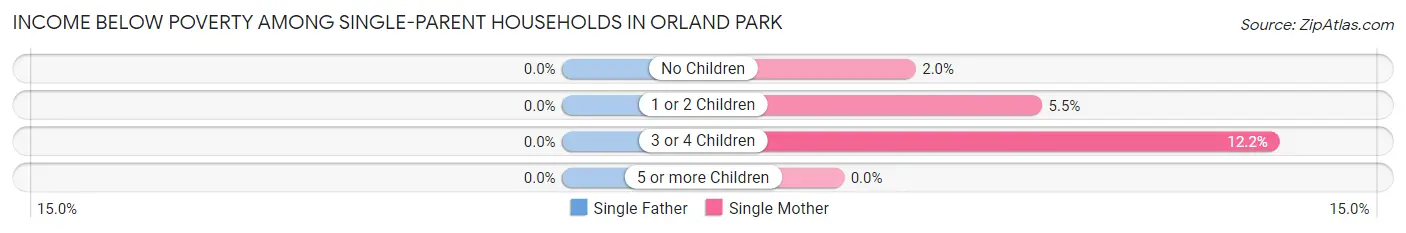
| Children | Single Father | Single Mother |
| No Children | 0 (0.0%) | 17 (2.0%) |
| 1 or 2 Children | 0 (0.0%) | 38 (5.5%) |
| 3 or 4 Children | 0 (0.0%) | 24 (12.2%) |
| 5 or more Children | 0 (0.0%) | 0 (0.0%) |
| Total | 0 (0.0%) | 79 (4.6%) |
Income Below Poverty Among Married-Couple vs Single-Parent Households in Orland Park
The poverty data for Orland Park shows that 583 of the married-couple family households (4.4%) and 79 of the single-parent households (3.0%) are living below the poverty level. Within the married-couple family households, those with 5 or more children have the highest poverty rate, with 12 households (46.2%) falling below the poverty line. Among the single-parent households, those with 3 or 4 children have the highest poverty rate, with 24 household (12.2%) living below poverty.
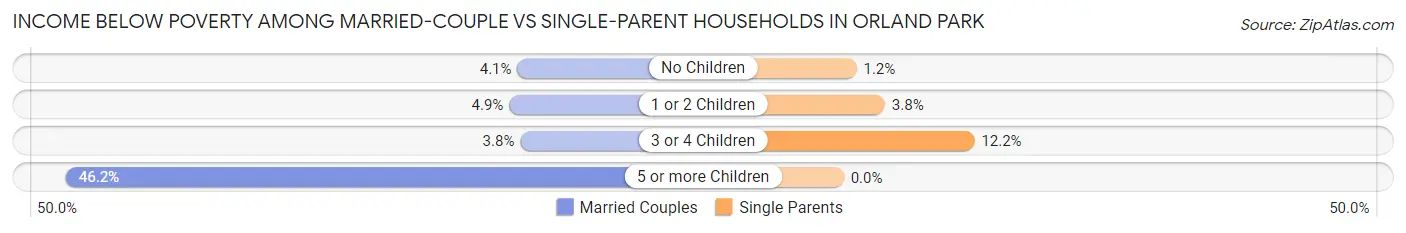
| Children | Married-Couple Families | Single-Parent Households |
| No Children | 347 (4.1%) | 17 (1.2%) |
| 1 or 2 Children | 178 (4.9%) | 38 (3.8%) |
| 3 or 4 Children | 46 (3.8%) | 24 (12.2%) |
| 5 or more Children | 12 (46.2%) | 0 (0.0%) |
| Total | 583 (4.4%) | 79 (3.0%) |
Race in Orland Park
The most populous races in Orland Park are White / Caucasian (48,803 | 83.7%), Hispanic or Latino (5,635 | 9.7%), and Asian (3,068 | 5.3%).
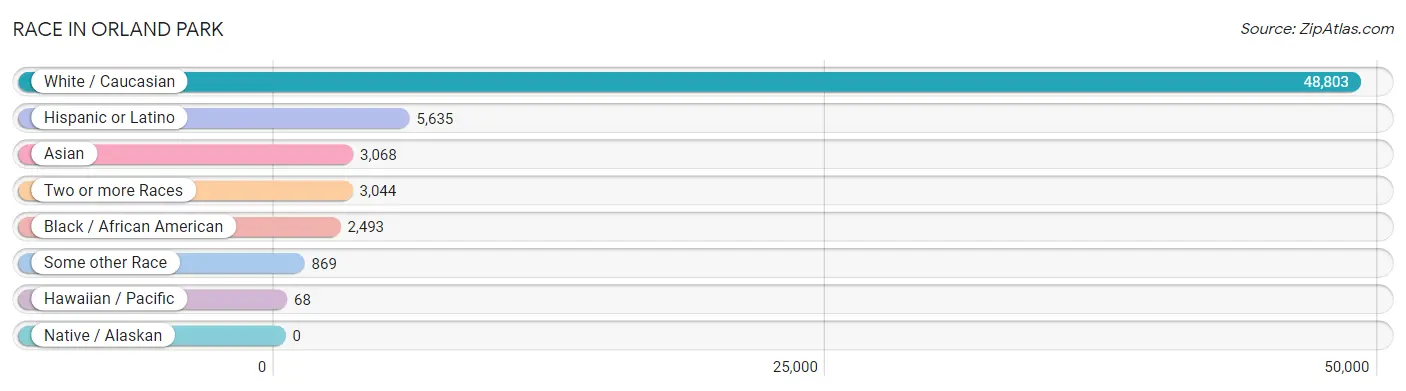
| Race | # Population | % Population |
| Asian | 3,068 | 5.3% |
| Black / African American | 2,493 | 4.3% |
| Hawaiian / Pacific | 68 | 0.1% |
| Hispanic or Latino | 5,635 | 9.7% |
| Native / Alaskan | 0 | 0.0% |
| White / Caucasian | 48,803 | 83.7% |
| Two or more Races | 3,044 | 5.2% |
| Some other Race | 869 | 1.5% |
| Total | 58,345 | 100.0% |
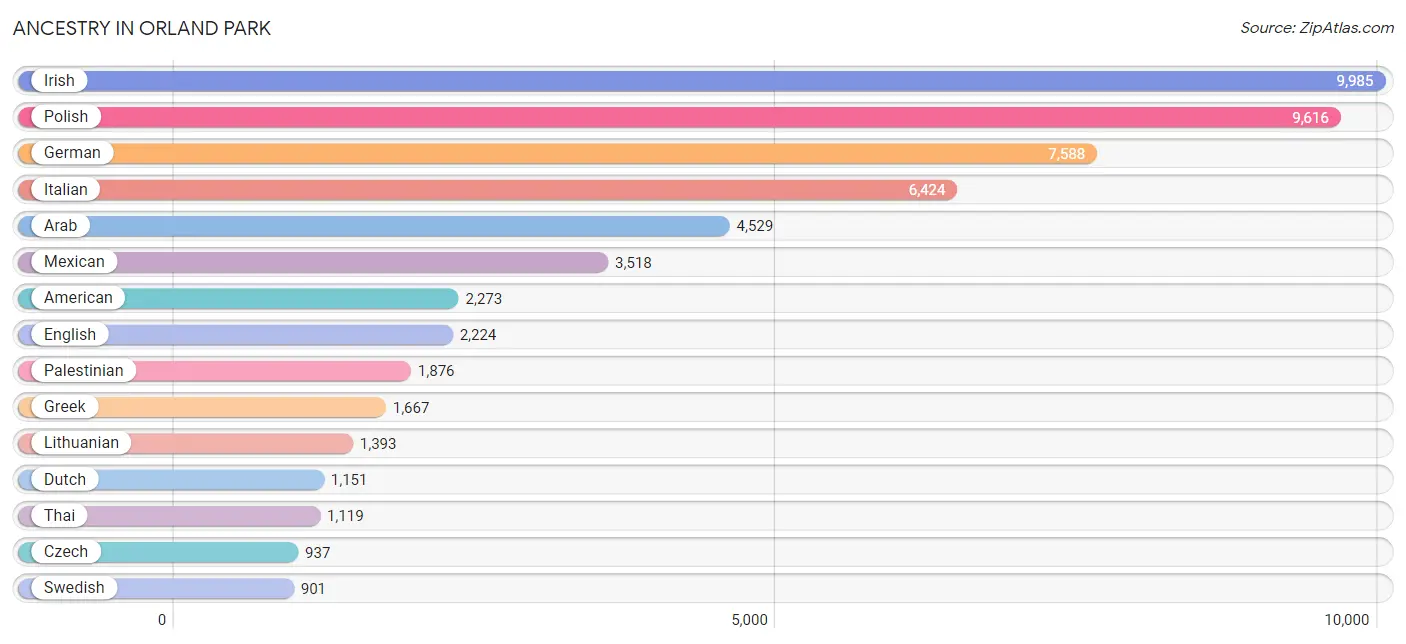
Ancestry in Orland Park
The most populous ancestries reported in Orland Park are Irish (9,985 | 17.1%), Polish (9,616 | 16.5%), German (7,588 | 13.0%), Italian (6,424 | 11.0%), and Arab (4,529 | 7.8%), together accounting for 65.4% of all Orland Park residents.
| Ancestry | # Population | % Population |
| African | 18 | 0.0% |
| Albanian | 124 | 0.2% |
| Alsatian | 12 | 0.0% |
| American | 2,273 | 3.9% |
| Arab | 4,529 | 7.8% |
| Assyrian / Chaldean / Syriac | 14 | 0.0% |
| Austrian | 323 | 0.5% |
| Belgian | 35 | 0.1% |
| Bolivian | 9 | 0.0% |
| Brazilian | 70 | 0.1% |
| British | 185 | 0.3% |
| Burmese | 374 | 0.6% |
| Cambodian | 83 | 0.1% |
| Canadian | 11 | 0.0% |
| Celtic | 9 | 0.0% |
| Central American | 134 | 0.2% |
| Chilean | 16 | 0.0% |
| Chippewa | 38 | 0.1% |
| Colombian | 59 | 0.1% |
| Creek | 18 | 0.0% |
| Croatian | 623 | 1.1% |
| Cuban | 697 | 1.2% |
| Czech | 937 | 1.6% |
| Czechoslovakian | 208 | 0.4% |
| Danish | 103 | 0.2% |
| Dutch | 1,151 | 2.0% |
| Eastern European | 216 | 0.4% |
| Egyptian | 50 | 0.1% |
| English | 2,224 | 3.8% |
| Estonian | 10 | 0.0% |
| Ethiopian | 56 | 0.1% |
| European | 316 | 0.5% |
| Filipino | 31 | 0.1% |
| Finnish | 300 | 0.5% |
| French | 798 | 1.4% |
| French Canadian | 141 | 0.2% |
| German | 7,588 | 13.0% |
| Greek | 1,667 | 2.9% |
| Guatemalan | 62 | 0.1% |
| Haitian | 140 | 0.2% |
| Honduran | 27 | 0.1% |
| Hungarian | 283 | 0.5% |
| Indian (Asian) | 275 | 0.5% |
| Iraqi | 58 | 0.1% |
| Irish | 9,985 | 17.1% |
| Italian | 6,424 | 11.0% |
| Jordanian | 631 | 1.1% |
| Korean | 752 | 1.3% |
| Laotian | 42 | 0.1% |
| Latvian | 9 | 0.0% |
| Lebanese | 101 | 0.2% |
| Lithuanian | 1,393 | 2.4% |
| Luxembourger | 65 | 0.1% |
| Macedonian | 154 | 0.3% |
| Mexican | 3,518 | 6.0% |
| Mexican American Indian | 8 | 0.0% |
| Mongolian | 14 | 0.0% |
| Moroccan | 41 | 0.1% |
| Nigerian | 37 | 0.1% |
| Northern European | 20 | 0.0% |
| Norwegian | 291 | 0.5% |
| Palestinian | 1,876 | 3.2% |
| Panamanian | 14 | 0.0% |
| Polish | 9,616 | 16.5% |
| Portuguese | 5 | 0.0% |
| Puerto Rican | 545 | 0.9% |
| Romanian | 16 | 0.0% |
| Russian | 329 | 0.6% |
| Samoan | 68 | 0.1% |
| Scandinavian | 152 | 0.3% |
| Scotch-Irish | 169 | 0.3% |
| Scottish | 525 | 0.9% |
| Serbian | 273 | 0.5% |
| Slovak | 349 | 0.6% |
| Slovene | 140 | 0.2% |
| South American | 84 | 0.1% |
| Spaniard | 47 | 0.1% |
| Spanish American Indian | 6 | 0.0% |
| Subsaharan African | 135 | 0.2% |
| Swedish | 901 | 1.5% |
| Swiss | 265 | 0.4% |
| Syrian | 25 | 0.0% |
| Thai | 1,119 | 1.9% |
| Turkish | 49 | 0.1% |
| Ukrainian | 373 | 0.6% |
| Welsh | 69 | 0.1% |
| Yakama | 18 | 0.0% | View All 87 Rows |
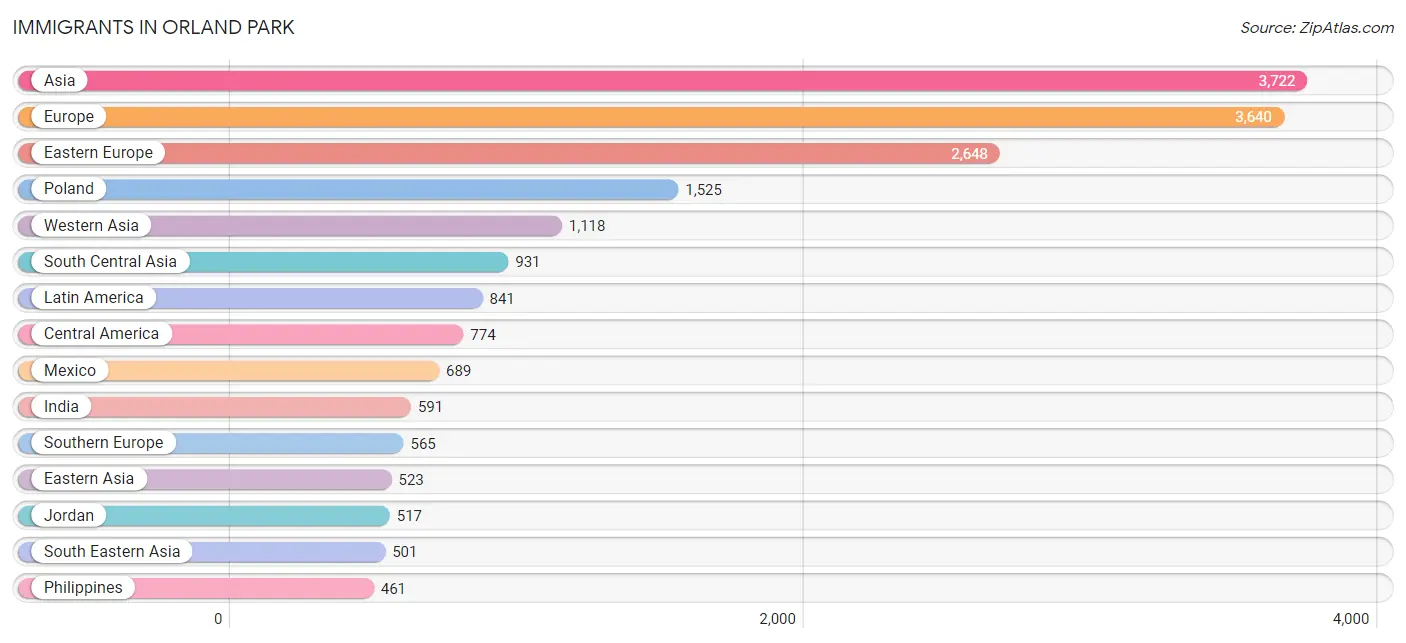
Immigrants in Orland Park
The most numerous immigrant groups reported in Orland Park came from Asia (3,722 | 6.4%), Europe (3,640 | 6.2%), Eastern Europe (2,648 | 4.5%), Poland (1,525 | 2.6%), and Western Asia (1,118 | 1.9%), together accounting for 21.7% of all Orland Park residents.
| Immigration Origin | # Population | % Population |
| Africa | 270 | 0.5% |
| Albania | 90 | 0.2% |
| Asia | 3,722 | 6.4% |
| Australia | 12 | 0.0% |
| Belarus | 234 | 0.4% |
| Brazil | 13 | 0.0% |
| Canada | 42 | 0.1% |
| Caribbean | 25 | 0.0% |
| Central America | 774 | 1.3% |
| China | 138 | 0.2% |
| Colombia | 29 | 0.1% |
| Croatia | 14 | 0.0% |
| Eastern Africa | 71 | 0.1% |
| Eastern Asia | 523 | 0.9% |
| Eastern Europe | 2,648 | 4.5% |
| Egypt | 89 | 0.2% |
| England | 4 | 0.0% |
| Ethiopia | 33 | 0.1% |
| Europe | 3,640 | 6.2% |
| France | 9 | 0.0% |
| Germany | 106 | 0.2% |
| Greece | 321 | 0.5% |
| Guatemala | 62 | 0.1% |
| Haiti | 25 | 0.0% |
| Honduras | 9 | 0.0% |
| Hong Kong | 22 | 0.0% |
| India | 591 | 1.0% |
| Indonesia | 26 | 0.0% |
| Iraq | 32 | 0.1% |
| Ireland | 146 | 0.3% |
| Israel | 25 | 0.0% |
| Italy | 220 | 0.4% |
| Jordan | 517 | 0.9% |
| Korea | 368 | 0.6% |
| Kuwait | 74 | 0.1% |
| Latin America | 841 | 1.4% |
| Latvia | 9 | 0.0% |
| Lebanon | 62 | 0.1% |
| Lithuania | 421 | 0.7% |
| Malaysia | 14 | 0.0% |
| Mexico | 689 | 1.2% |
| Morocco | 41 | 0.1% |
| Netherlands | 3 | 0.0% |
| Nigeria | 44 | 0.1% |
| North Macedonia | 13 | 0.0% |
| Northern Africa | 130 | 0.2% |
| Northern Europe | 309 | 0.5% |
| Oceania | 12 | 0.0% |
| Pakistan | 340 | 0.6% |
| Panama | 14 | 0.0% |
| Philippines | 461 | 0.8% |
| Poland | 1,525 | 2.6% |
| Russia | 39 | 0.1% |
| Saudi Arabia | 207 | 0.4% |
| Scotland | 36 | 0.1% |
| Serbia | 25 | 0.0% |
| South America | 42 | 0.1% |
| South Central Asia | 931 | 1.6% |
| South Eastern Asia | 501 | 0.9% |
| Southern Europe | 565 | 1.0% |
| Spain | 24 | 0.0% |
| Syria | 10 | 0.0% |
| Taiwan | 31 | 0.1% |
| Turkey | 107 | 0.2% |
| Ukraine | 268 | 0.5% |
| Western Africa | 44 | 0.1% |
| Western Asia | 1,118 | 1.9% |
| Western Europe | 118 | 0.2% |
| Yemen | 78 | 0.1% | View All 69 Rows |
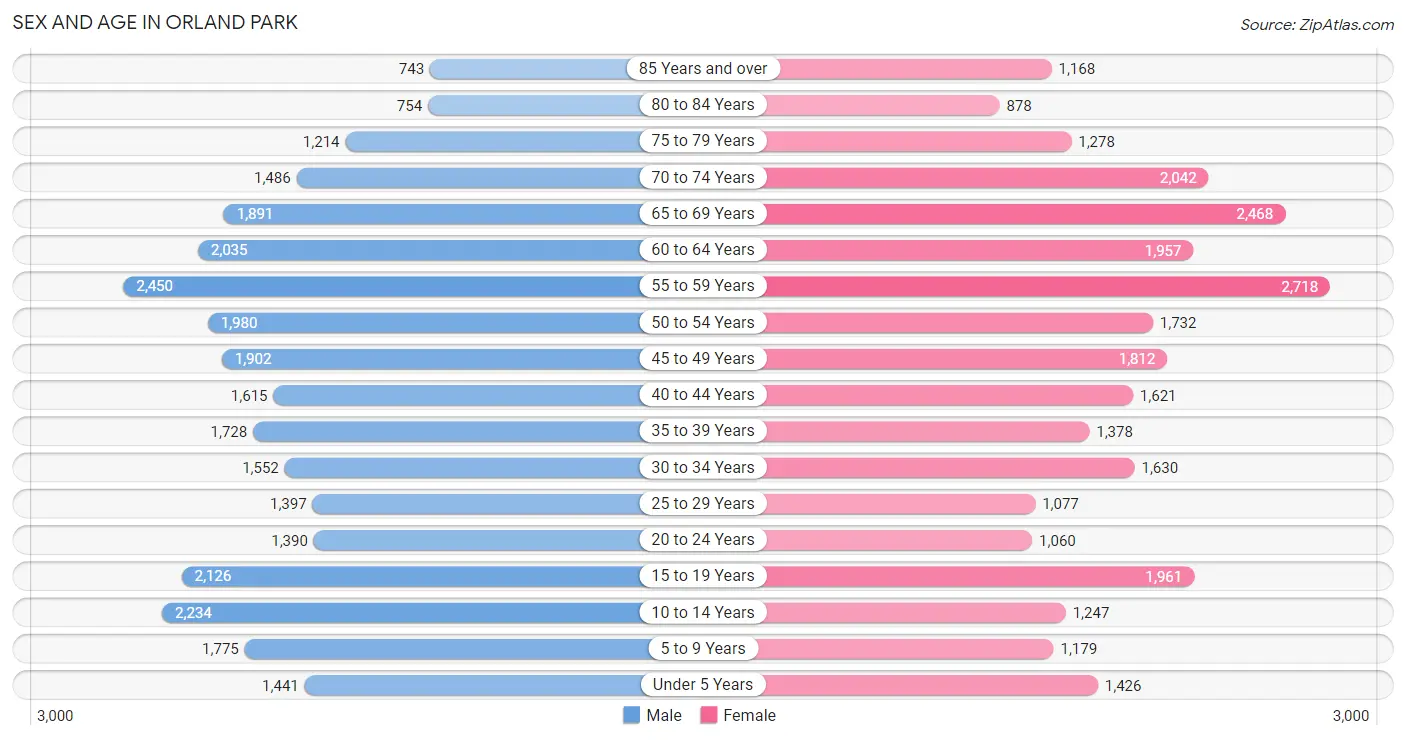
Sex and Age in Orland Park
Sex and Age in Orland Park
The most populous age groups in Orland Park are 55 to 59 Years (2,450 | 8.3%) for men and 55 to 59 Years (2,718 | 9.5%) for women.
| Age Bracket | Male | Female |
| Under 5 Years | 1,441 (4.9%) | 1,426 (5.0%) |
| 5 to 9 Years | 1,775 (6.0%) | 1,179 (4.1%) |
| 10 to 14 Years | 2,234 (7.5%) | 1,247 (4.4%) |
| 15 to 19 Years | 2,126 (7.2%) | 1,961 (6.9%) |
| 20 to 24 Years | 1,390 (4.7%) | 1,060 (3.7%) |
| 25 to 29 Years | 1,397 (4.7%) | 1,077 (3.8%) |
| 30 to 34 Years | 1,552 (5.2%) | 1,630 (5.7%) |
| 35 to 39 Years | 1,728 (5.8%) | 1,378 (4.8%) |
| 40 to 44 Years | 1,615 (5.4%) | 1,621 (5.7%) |
| 45 to 49 Years | 1,902 (6.4%) | 1,812 (6.3%) |
| 50 to 54 Years | 1,980 (6.7%) | 1,732 (6.0%) |
| 55 to 59 Years | 2,450 (8.3%) | 2,718 (9.5%) |
| 60 to 64 Years | 2,035 (6.9%) | 1,957 (6.8%) |
| 65 to 69 Years | 1,891 (6.4%) | 2,468 (8.6%) |
| 70 to 74 Years | 1,486 (5.0%) | 2,042 (7.1%) |
| 75 to 79 Years | 1,214 (4.1%) | 1,278 (4.5%) |
| 80 to 84 Years | 754 (2.5%) | 878 (3.1%) |
| 85 Years and over | 743 (2.5%) | 1,168 (4.1%) |
| Total | 29,713 (100.0%) | 28,632 (100.0%) |
Families and Households in Orland Park
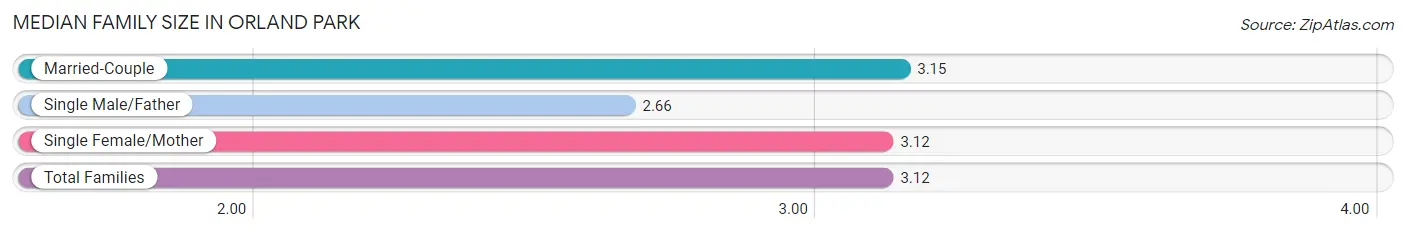
Median Family Size in Orland Park
The median family size in Orland Park is 3.12 persons per family, with married-couple families (13,319 | 83.6%) accounting for the largest median family size of 3.15 persons per family. On the other hand, single male/father families (872 | 5.5%) represent the smallest median family size with 2.66 persons per family.
| Family Type | # Families | Family Size |
| Married-Couple | 13,319 (83.6%) | 3.15 |
| Single Male/Father | 872 (5.5%) | 2.66 |
| Single Female/Mother | 1,734 (10.9%) | 3.12 |
| Total Families | 15,925 (100.0%) | 3.12 |
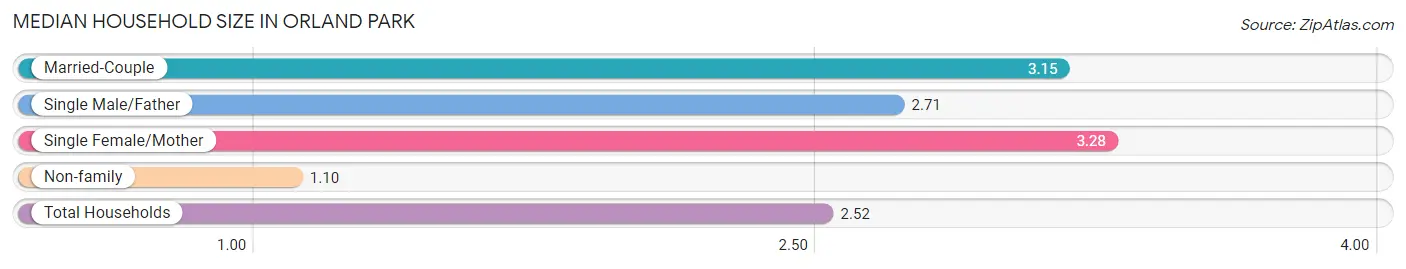
Median Household Size in Orland Park
The median household size in Orland Park is 2.52 persons per household, with single female/mother households (1,734 | 7.5%) accounting for the largest median household size of 3.28 persons per household. non-family households (7,055 | 30.7%) represent the smallest median household size with 1.10 persons per household.
| Household Type | # Households | Household Size |
| Married-Couple | 13,319 (58.0%) | 3.15 |
| Single Male/Father | 872 (3.8%) | 2.71 |
| Single Female/Mother | 1,734 (7.5%) | 3.28 |
| Non-family | 7,055 (30.7%) | 1.10 |
| Total Households | 22,980 (100.0%) | 2.52 |
Household Size by Marriage Status in Orland Park
Out of a total of 22,980 households in Orland Park, 15,925 (69.3%) are family households, while 7,055 (30.7%) are nonfamily households. The most numerous type of family households are 2-person households, comprising 7,225, and the most common type of nonfamily households are 1-person households, comprising 6,453.
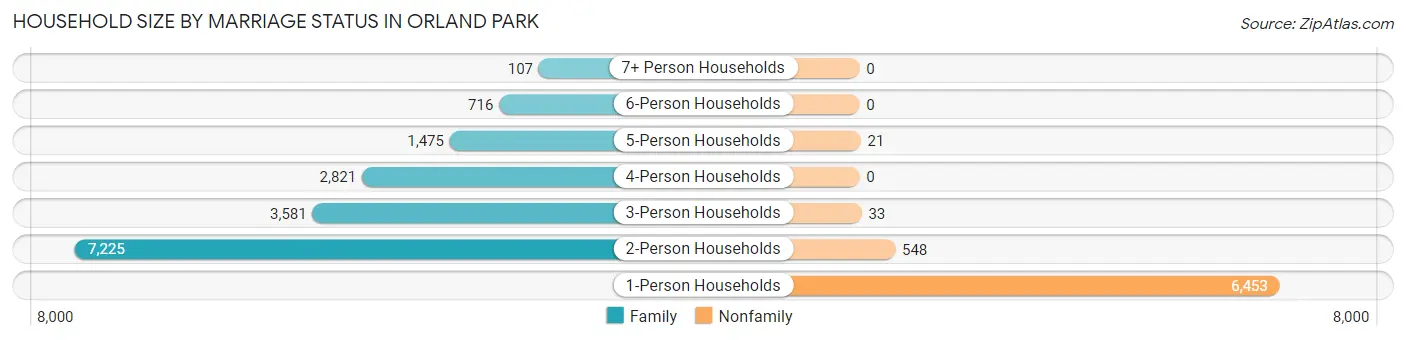
| Household Size | Family Households | Nonfamily Households |
| 1-Person Households | - | 6,453 (28.1%) |
| 2-Person Households | 7,225 (31.4%) | 548 (2.4%) |
| 3-Person Households | 3,581 (15.6%) | 33 (0.1%) |
| 4-Person Households | 2,821 (12.3%) | 0 (0.0%) |
| 5-Person Households | 1,475 (6.4%) | 21 (0.1%) |
| 6-Person Households | 716 (3.1%) | 0 (0.0%) |
| 7+ Person Households | 107 (0.5%) | 0 (0.0%) |
| Total | 15,925 (69.3%) | 7,055 (30.7%) |
Female Fertility in Orland Park
Fertility by Age in Orland Park
Average fertility rate in Orland Park is 31.0 births per 1,000 women. Women in the age bracket of 20 to 34 years have the highest fertility rate with 51.0 births per 1,000 women. Women in the age bracket of 20 to 34 years acount for 56.6% of all women with births.
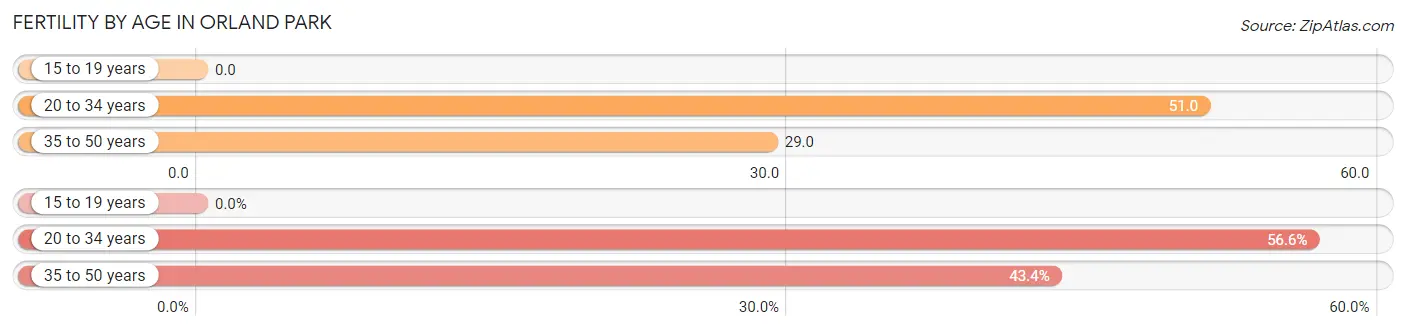
| Age Bracket | Women with Births | Births / 1,000 Women |
| 15 to 19 years | 0 (0.0%) | 0.0 |
| 20 to 34 years | 194 (56.6%) | 51.0 |
| 35 to 50 years | 149 (43.4%) | 29.0 |
| Total | 343 (100.0%) | 31.0 |
Fertility by Age by Marriage Status in Orland Park
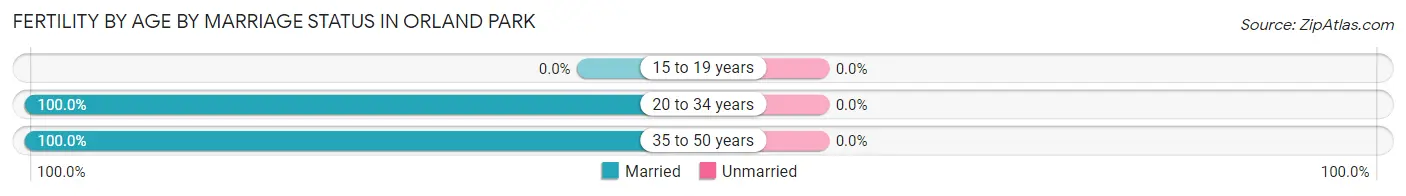
| Age Bracket | Married | Unmarried |
| 15 to 19 years | 0 (0.0%) | 0 (0.0%) |
| 20 to 34 years | 194 (100.0%) | 0 (0.0%) |
| 35 to 50 years | 149 (100.0%) | 0 (0.0%) |
| Total | 343 (100.0%) | 0 (0.0%) |
Fertility by Education in Orland Park
Average fertility rate in Orland Park is 31.0 births per 1,000 women. Women with the education attainment of college or associate's degree have the highest fertility rate of 39.0 births per 1,000 women, while women with the education attainment of less than high school have the lowest fertility at 14.0 births per 1,000 women. Women with the education attainment of college or associate's degree represent 34.7% of all women with births.
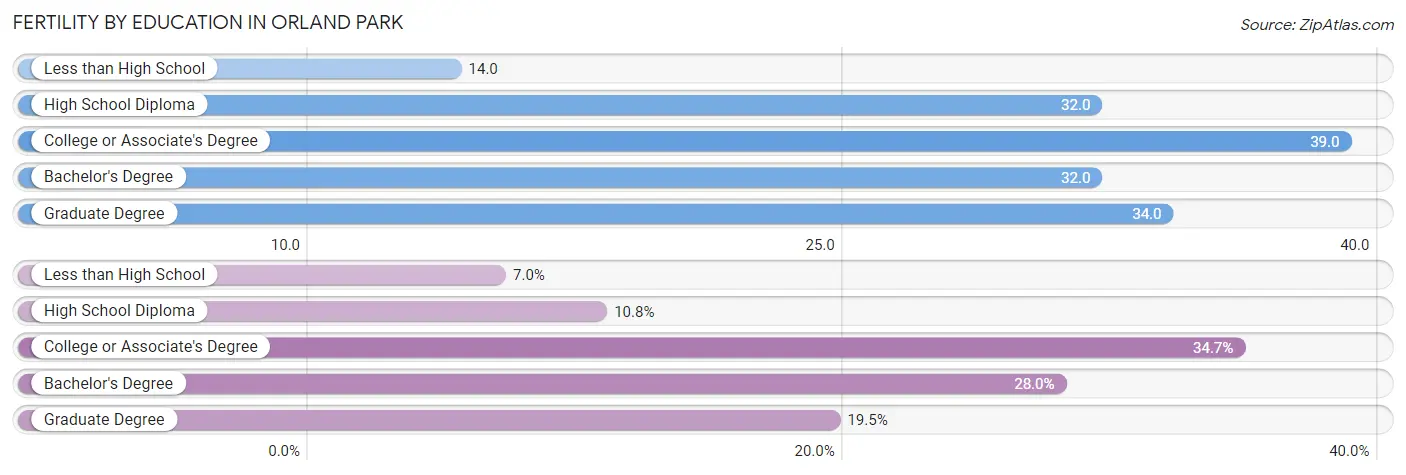
| Educational Attainment | Women with Births | Births / 1,000 Women |
| Less than High School | 24 (7.0%) | 14.0 |
| High School Diploma | 37 (10.8%) | 32.0 |
| College or Associate's Degree | 119 (34.7%) | 39.0 |
| Bachelor's Degree | 96 (28.0%) | 32.0 |
| Graduate Degree | 67 (19.5%) | 34.0 |
| Total | 343 (100.0%) | 31.0 |
Fertility by Education by Marriage Status in Orland Park
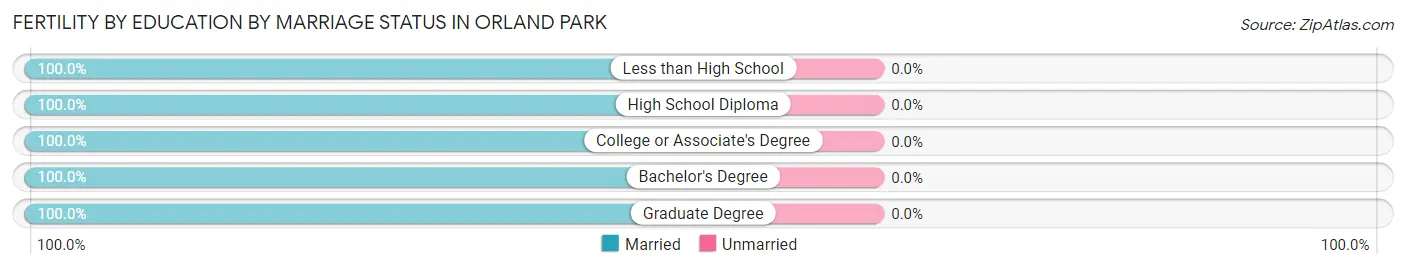
| Educational Attainment | Married | Unmarried |
| Less than High School | 24 (100.0%) | 0 (0.0%) |
| High School Diploma | 37 (100.0%) | 0 (0.0%) |
| College or Associate's Degree | 119 (100.0%) | 0 (0.0%) |
| Bachelor's Degree | 96 (100.0%) | 0 (0.0%) |
| Graduate Degree | 67 (100.0%) | 0 (0.0%) |
| Total | 343 (100.0%) | 0 (0.0%) |
Employment Characteristics in Orland Park
Employment by Class of Employer in Orland Park
Among the 27,396 employed individuals in Orland Park, private company employees (17,020 | 62.1%), not-for-profit organizations (3,366 | 12.3%), and local government employees (2,499 | 9.1%) make up the most common classes of employment.
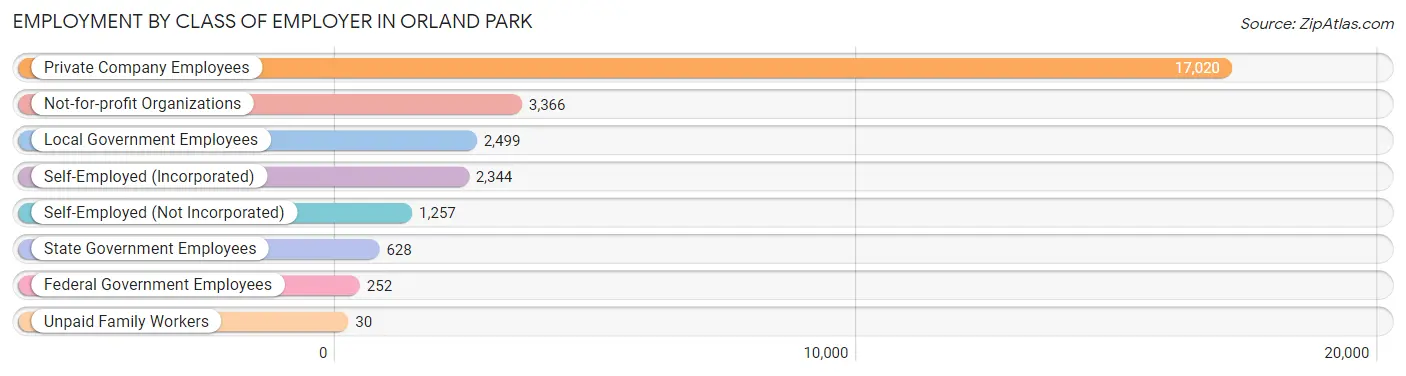
| Employer Class | # Employees | % Employees |
| Private Company Employees | 17,020 | 62.1% |
| Self-Employed (Incorporated) | 2,344 | 8.6% |
| Self-Employed (Not Incorporated) | 1,257 | 4.6% |
| Not-for-profit Organizations | 3,366 | 12.3% |
| Local Government Employees | 2,499 | 9.1% |
| State Government Employees | 628 | 2.3% |
| Federal Government Employees | 252 | 0.9% |
| Unpaid Family Workers | 30 | 0.1% |
| Total | 27,396 | 100.0% |
Employment Status by Age in Orland Park
According to the labor force statistics for Orland Park, out of the total population over 16 years of age (48,432), 60.5% or 29,301 individuals are in the labor force, with 4.5% or 1,319 of them unemployed. The age group with the highest labor force participation rate is 25 to 29 years, with 90.7% or 2,244 individuals in the labor force. Within the labor force, the 16 to 19 years age range has the highest percentage of unemployed individuals, with 21.9% or 245 of them being unemployed.
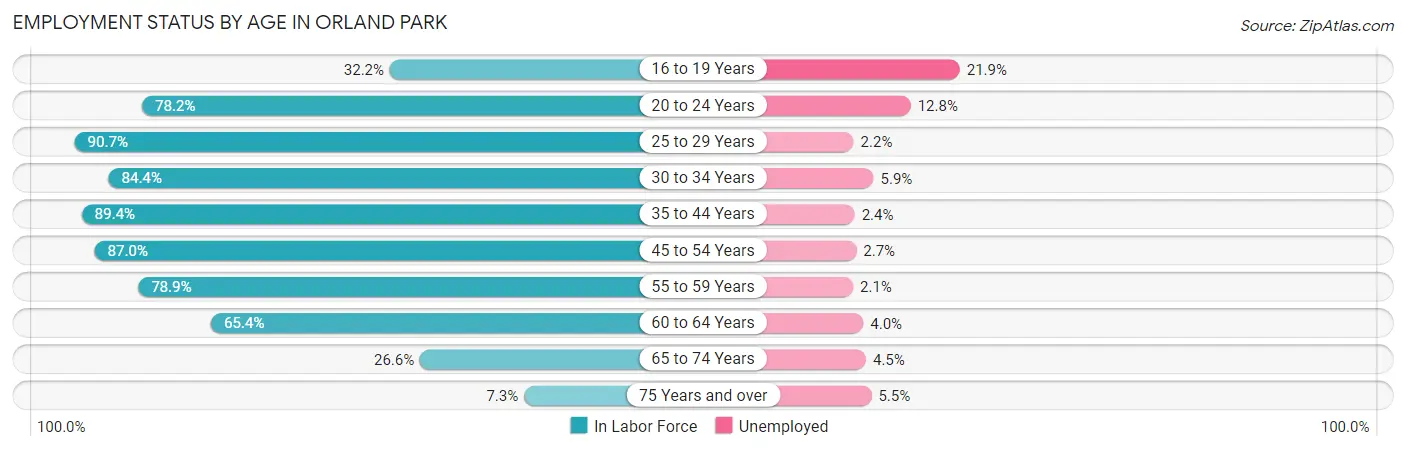
| Age Bracket | In Labor Force | Unemployed |
| 16 to 19 Years | 1,119 (32.2%) | 245 (21.9%) |
| 20 to 24 Years | 1,916 (78.2%) | 245 (12.8%) |
| 25 to 29 Years | 2,244 (90.7%) | 49 (2.2%) |
| 30 to 34 Years | 2,686 (84.4%) | 158 (5.9%) |
| 35 to 44 Years | 5,670 (89.4%) | 136 (2.4%) |
| 45 to 54 Years | 6,461 (87.0%) | 174 (2.7%) |
| 55 to 59 Years | 4,078 (78.9%) | 86 (2.1%) |
| 60 to 64 Years | 2,611 (65.4%) | 104 (4.0%) |
| 65 to 74 Years | 2,098 (26.6%) | 94 (4.5%) |
| 75 Years and over | 441 (7.3%) | 24 (5.5%) |
| Total | 29,301 (60.5%) | 1,319 (4.5%) |
Employment Status by Educational Attainment in Orland Park
According to labor force statistics for Orland Park, 83.1% of individuals (23,753) out of the total population between 25 and 64 years of age (28,584) are in the labor force, with 3.0% or 713 of them being unemployed. The group with the highest labor force participation rate are those with the educational attainment of bachelor's degree or higher, with 87.9% or 12,315 individuals in the labor force. Within the labor force, individuals with less than high school education have the highest percentage of unemployment, with 6.1% or 56 of them being unemployed.
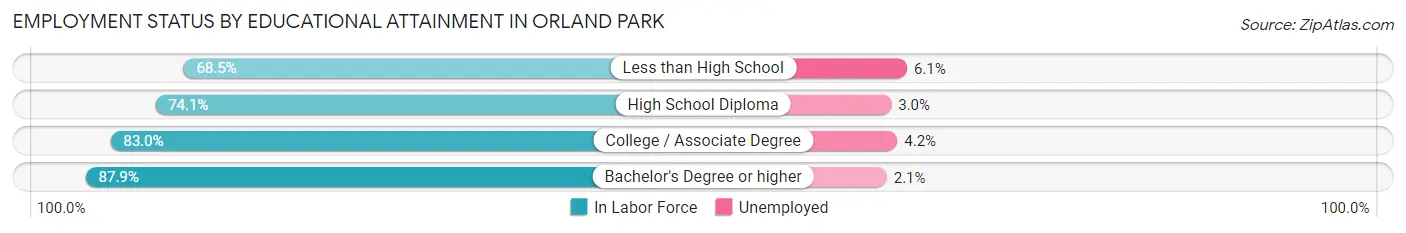
| Educational Attainment | In Labor Force | Unemployed |
| Less than High School | 914 (68.5%) | 81 (6.1%) |
| High School Diploma | 3,857 (74.1%) | 156 (3.0%) |
| College / Associate Degree | 6,668 (83.0%) | 337 (4.2%) |
| Bachelor's Degree or higher | 12,315 (87.9%) | 294 (2.1%) |
| Total | 23,753 (83.1%) | 858 (3.0%) |
Employment Occupations by Sex in Orland Park
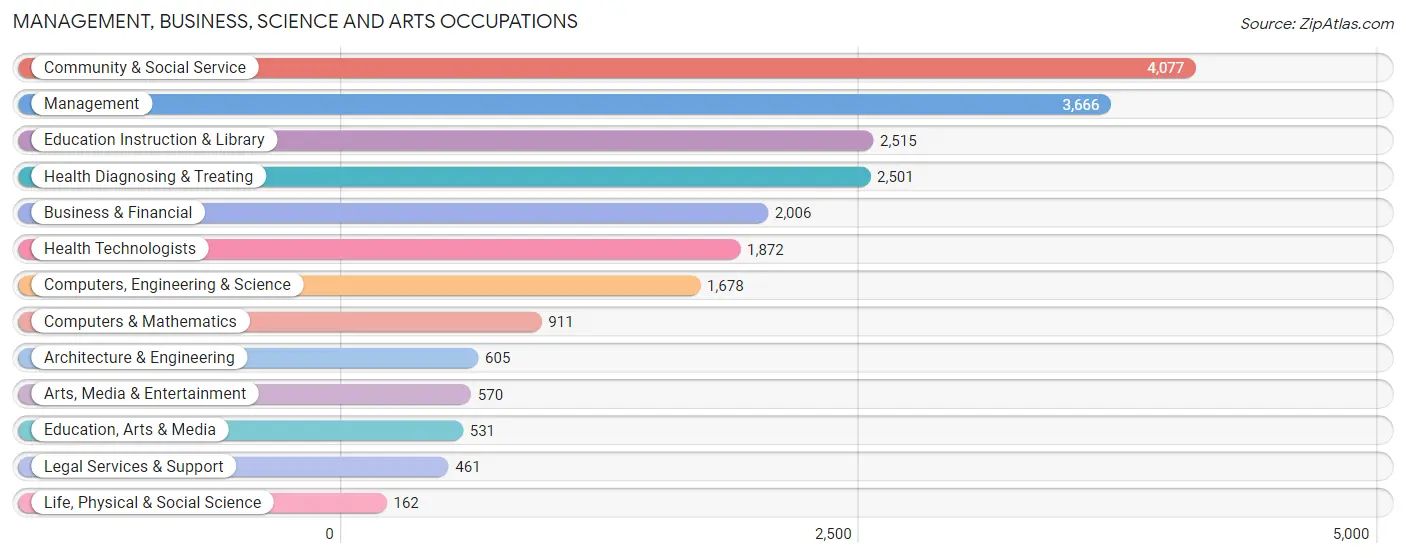
Management, Business, Science and Arts Occupations
The most common Management, Business, Science and Arts occupations in Orland Park are Community & Social Service (4,077 | 14.6%), Management (3,666 | 13.1%), Education Instruction & Library (2,515 | 9.0%), Health Diagnosing & Treating (2,501 | 8.9%), and Business & Financial (2,006 | 7.2%).
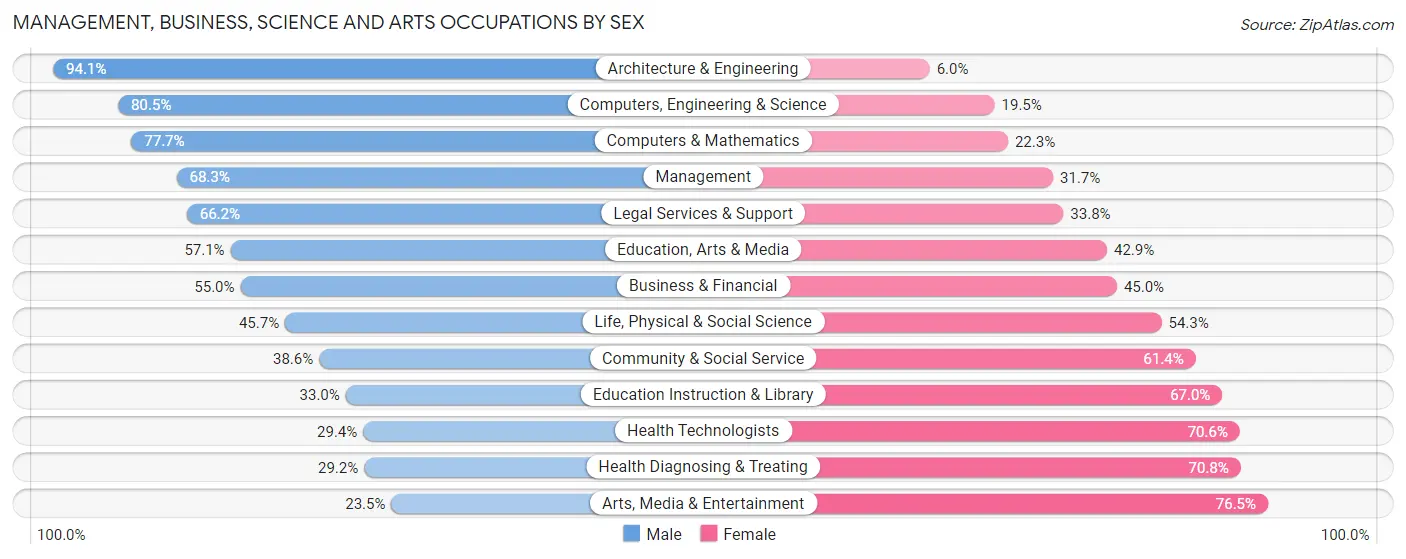
Management, Business, Science and Arts Occupations by Sex
Within the Management, Business, Science and Arts occupations in Orland Park, the most male-oriented occupations are Architecture & Engineering (94.1%), Computers, Engineering & Science (80.5%), and Computers & Mathematics (77.7%), while the most female-oriented occupations are Arts, Media & Entertainment (76.5%), Health Diagnosing & Treating (70.8%), and Health Technologists (70.6%).
| Occupation | Male | Female |
| Management | 2,504 (68.3%) | 1,162 (31.7%) |
| Business & Financial | 1,103 (55.0%) | 903 (45.0%) |
| Computers, Engineering & Science | 1,351 (80.5%) | 327 (19.5%) |
| Computers & Mathematics | 708 (77.7%) | 203 (22.3%) |
| Architecture & Engineering | 569 (94.1%) | 36 (5.9%) |
| Life, Physical & Social Science | 74 (45.7%) | 88 (54.3%) |
| Community & Social Service | 1,573 (38.6%) | 2,504 (61.4%) |
| Education, Arts & Media | 303 (57.1%) | 228 (42.9%) |
| Legal Services & Support | 305 (66.2%) | 156 (33.8%) |
| Education Instruction & Library | 831 (33.0%) | 1,684 (67.0%) |
| Arts, Media & Entertainment | 134 (23.5%) | 436 (76.5%) |
| Health Diagnosing & Treating | 730 (29.2%) | 1,771 (70.8%) |
| Health Technologists | 550 (29.4%) | 1,322 (70.6%) |
| Total (Category) | 7,261 (52.1%) | 6,667 (47.9%) |
| Total (Overall) | 15,909 (56.8%) | 12,085 (43.2%) |
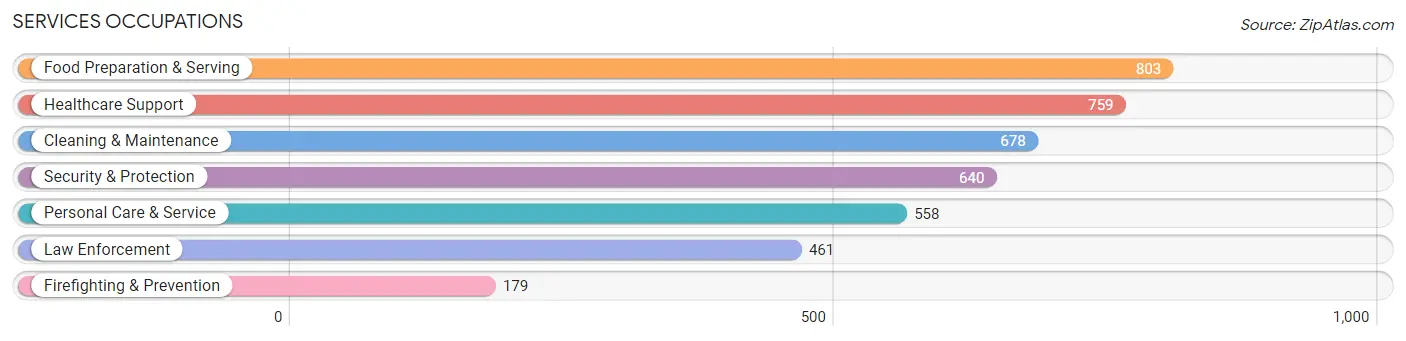
Services Occupations
The most common Services occupations in Orland Park are Food Preparation & Serving (803 | 2.9%), Healthcare Support (759 | 2.7%), Cleaning & Maintenance (678 | 2.4%), Security & Protection (640 | 2.3%), and Personal Care & Service (558 | 2.0%).
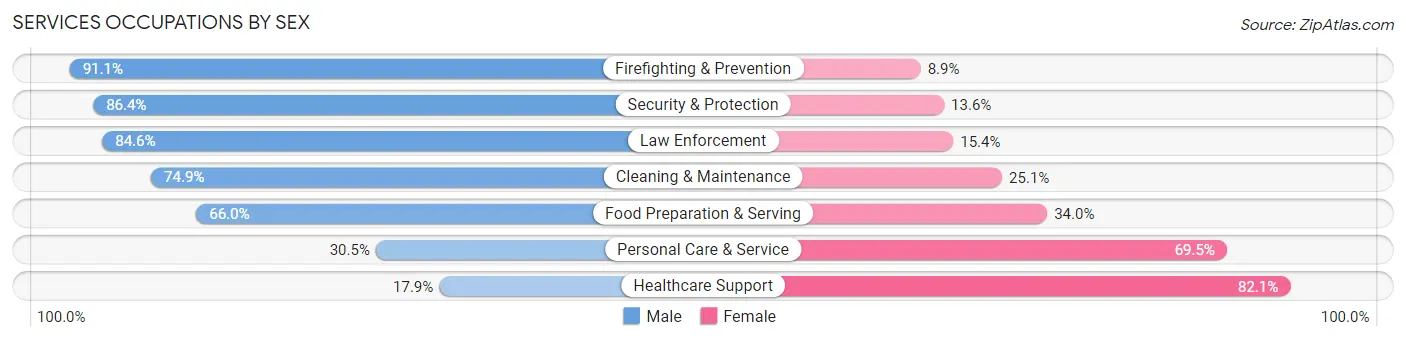
Services Occupations by Sex
Within the Services occupations in Orland Park, the most male-oriented occupations are Firefighting & Prevention (91.1%), Security & Protection (86.4%), and Law Enforcement (84.6%), while the most female-oriented occupations are Healthcare Support (82.1%), Personal Care & Service (69.5%), and Food Preparation & Serving (34.0%).
| Occupation | Male | Female |
| Healthcare Support | 136 (17.9%) | 623 (82.1%) |
| Security & Protection | 553 (86.4%) | 87 (13.6%) |
| Firefighting & Prevention | 163 (91.1%) | 16 (8.9%) |
| Law Enforcement | 390 (84.6%) | 71 (15.4%) |
| Food Preparation & Serving | 530 (66.0%) | 273 (34.0%) |
| Cleaning & Maintenance | 508 (74.9%) | 170 (25.1%) |
| Personal Care & Service | 170 (30.5%) | 388 (69.5%) |
| Total (Category) | 1,897 (55.2%) | 1,541 (44.8%) |
| Total (Overall) | 15,909 (56.8%) | 12,085 (43.2%) |
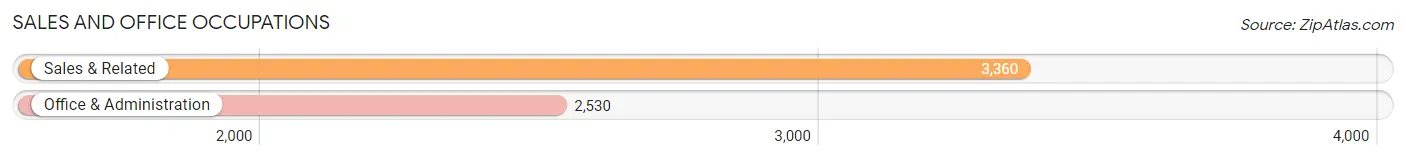
Sales and Office Occupations
The most common Sales and Office occupations in Orland Park are Sales & Related (3,360 | 12.0%), and Office & Administration (2,530 | 9.0%).
Sales and Office Occupations by Sex
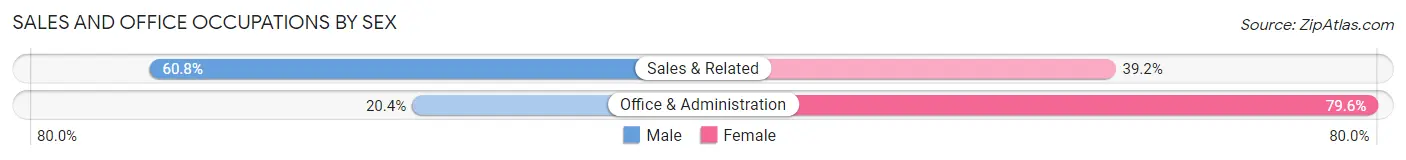
| Occupation | Male | Female |
| Sales & Related | 2,042 (60.8%) | 1,318 (39.2%) |
| Office & Administration | 516 (20.4%) | 2,014 (79.6%) |
| Total (Category) | 2,558 (43.4%) | 3,332 (56.6%) |
| Total (Overall) | 15,909 (56.8%) | 12,085 (43.2%) |
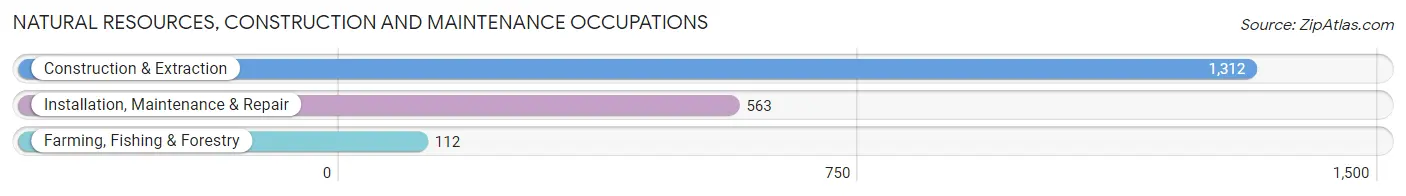
Natural Resources, Construction and Maintenance Occupations
The most common Natural Resources, Construction and Maintenance occupations in Orland Park are Construction & Extraction (1,312 | 4.7%), Installation, Maintenance & Repair (563 | 2.0%), and Farming, Fishing & Forestry (112 | 0.4%).
Natural Resources, Construction and Maintenance Occupations by Sex
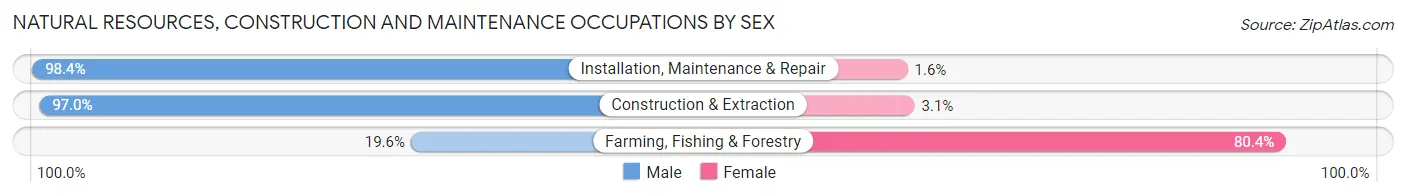
| Occupation | Male | Female |
| Farming, Fishing & Forestry | 22 (19.6%) | 90 (80.4%) |
| Construction & Extraction | 1,272 (97.0%) | 40 (3.0%) |
| Installation, Maintenance & Repair | 554 (98.4%) | 9 (1.6%) |
| Total (Category) | 1,848 (93.0%) | 139 (7.0%) |
| Total (Overall) | 15,909 (56.8%) | 12,085 (43.2%) |
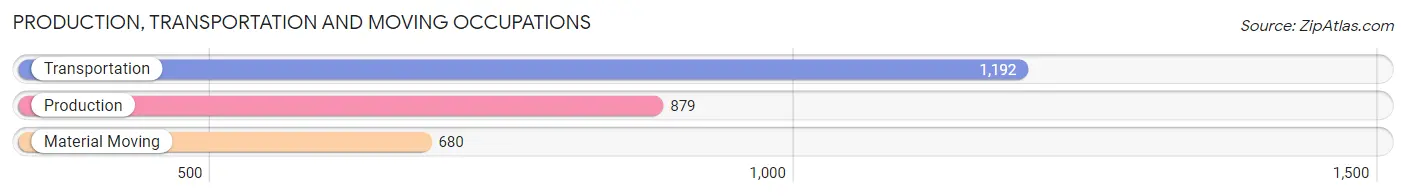
Production, Transportation and Moving Occupations
The most common Production, Transportation and Moving occupations in Orland Park are Transportation (1,192 | 4.3%), Production (879 | 3.1%), and Material Moving (680 | 2.4%).
Production, Transportation and Moving Occupations by Sex
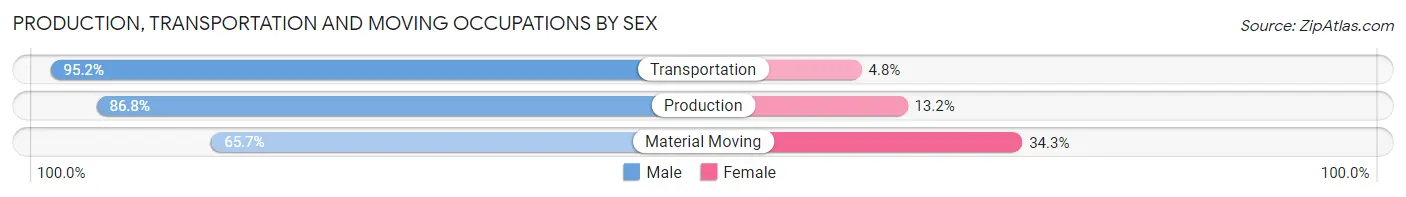
| Occupation | Male | Female |
| Production | 763 (86.8%) | 116 (13.2%) |
| Transportation | 1,135 (95.2%) | 57 (4.8%) |
| Material Moving | 447 (65.7%) | 233 (34.3%) |
| Total (Category) | 2,345 (85.2%) | 406 (14.8%) |
| Total (Overall) | 15,909 (56.8%) | 12,085 (43.2%) |
Employment Industries by Sex in Orland Park
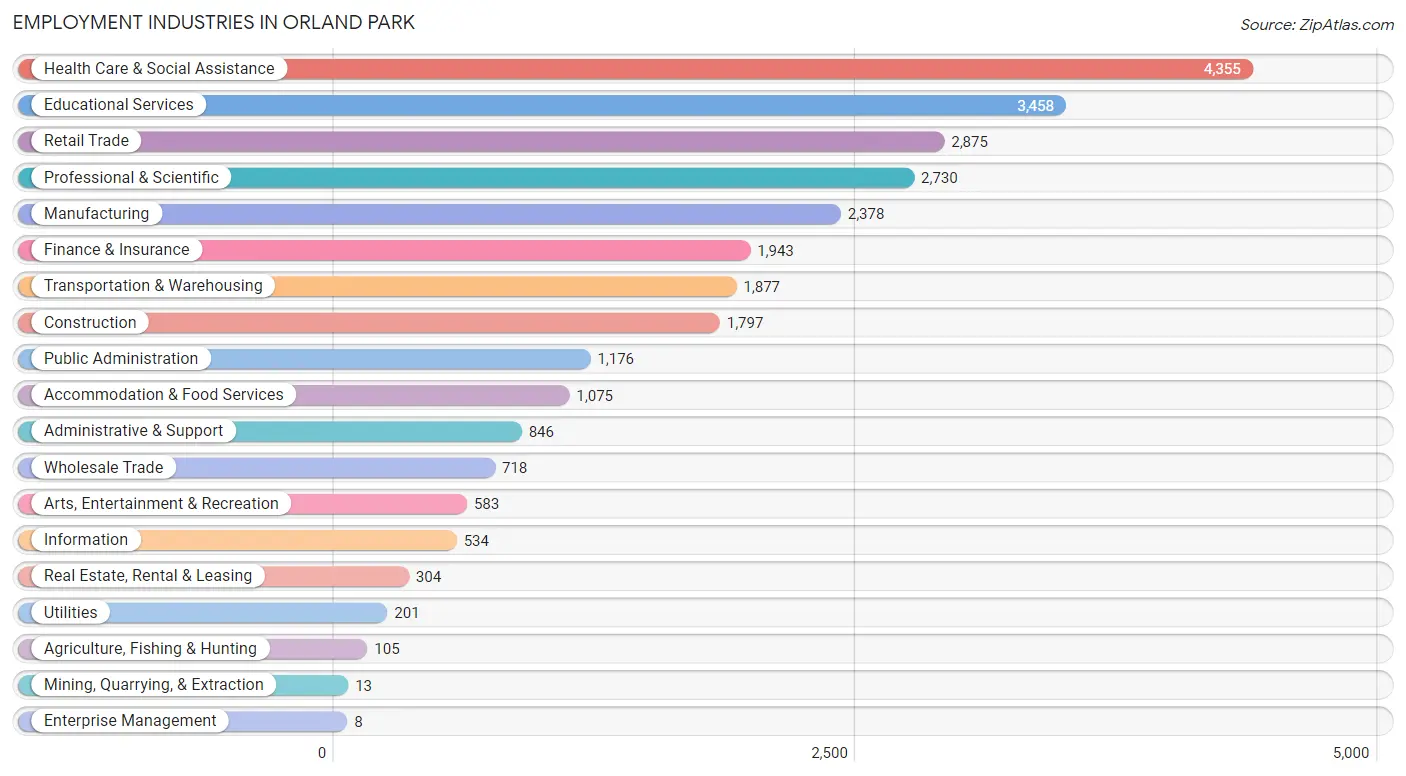
Employment Industries in Orland Park
The major employment industries in Orland Park include Health Care & Social Assistance (4,355 | 15.6%), Educational Services (3,458 | 12.3%), Retail Trade (2,875 | 10.3%), Professional & Scientific (2,730 | 9.8%), and Manufacturing (2,378 | 8.5%).
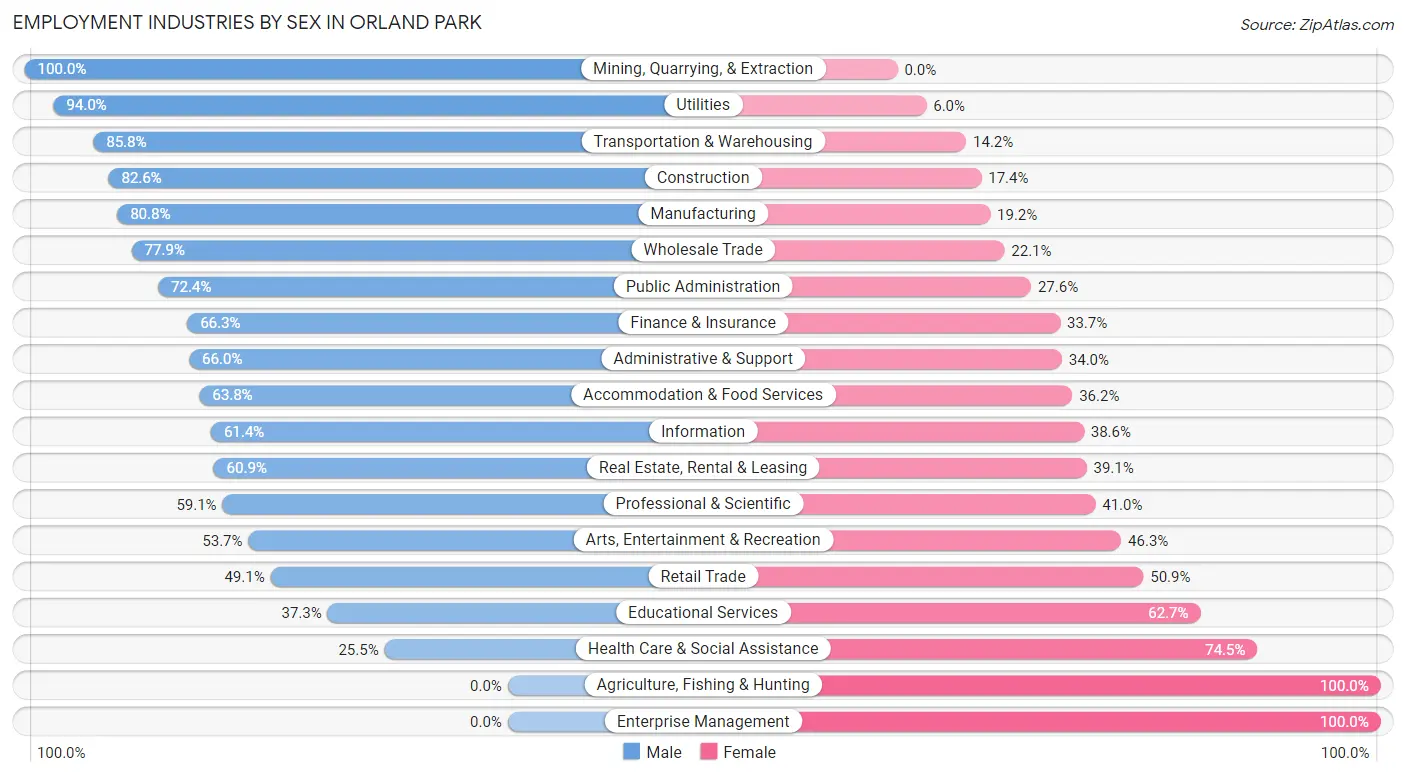
Employment Industries by Sex in Orland Park
The Orland Park industries that see more men than women are Mining, Quarrying, & Extraction (100.0%), Utilities (94.0%), and Transportation & Warehousing (85.8%), whereas the industries that tend to have a higher number of women are Agriculture, Fishing & Hunting (100.0%), Enterprise Management (100.0%), and Health Care & Social Assistance (74.5%).
| Industry | Male | Female |
| Agriculture, Fishing & Hunting | 0 (0.0%) | 105 (100.0%) |
| Mining, Quarrying, & Extraction | 13 (100.0%) | 0 (0.0%) |
| Construction | 1,485 (82.6%) | 312 (17.4%) |
| Manufacturing | 1,922 (80.8%) | 456 (19.2%) |
| Wholesale Trade | 559 (77.9%) | 159 (22.1%) |
| Retail Trade | 1,412 (49.1%) | 1,463 (50.9%) |
| Transportation & Warehousing | 1,610 (85.8%) | 267 (14.2%) |
| Utilities | 189 (94.0%) | 12 (6.0%) |
| Information | 328 (61.4%) | 206 (38.6%) |
| Finance & Insurance | 1,289 (66.3%) | 654 (33.7%) |
| Real Estate, Rental & Leasing | 185 (60.9%) | 119 (39.1%) |
| Professional & Scientific | 1,612 (59.1%) | 1,118 (40.9%) |
| Enterprise Management | 0 (0.0%) | 8 (100.0%) |
| Administrative & Support | 558 (66.0%) | 288 (34.0%) |
| Educational Services | 1,290 (37.3%) | 2,168 (62.7%) |
| Health Care & Social Assistance | 1,111 (25.5%) | 3,244 (74.5%) |
| Arts, Entertainment & Recreation | 313 (53.7%) | 270 (46.3%) |
| Accommodation & Food Services | 686 (63.8%) | 389 (36.2%) |
| Public Administration | 851 (72.4%) | 325 (27.6%) |
| Total | 15,909 (56.8%) | 12,085 (43.2%) |
Education in Orland Park
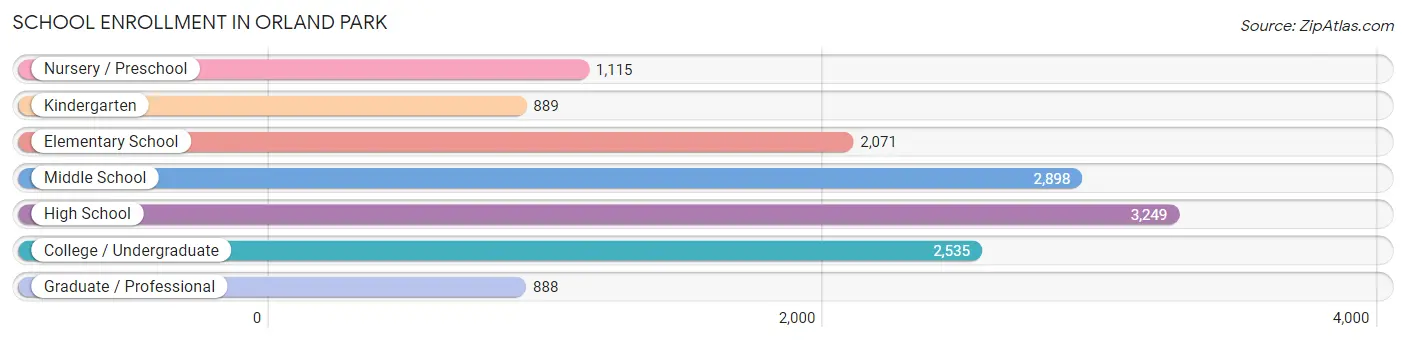
School Enrollment in Orland Park
The most common levels of schooling among the 13,645 students in Orland Park are high school (3,249 | 23.8%), middle school (2,898 | 21.2%), and college / undergraduate (2,535 | 18.6%).
| School Level | # Students | % Students |
| Nursery / Preschool | 1,115 | 8.2% |
| Kindergarten | 889 | 6.5% |
| Elementary School | 2,071 | 15.2% |
| Middle School | 2,898 | 21.2% |
| High School | 3,249 | 23.8% |
| College / Undergraduate | 2,535 | 18.6% |
| Graduate / Professional | 888 | 6.5% |
| Total | 13,645 | 100.0% |
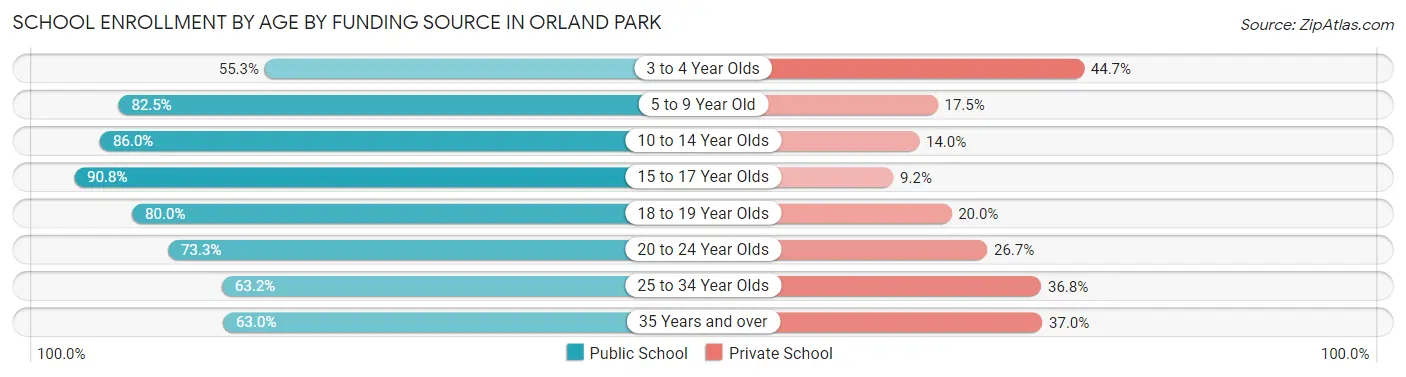
School Enrollment by Age by Funding Source in Orland Park
Out of a total of 13,645 students who are enrolled in schools in Orland Park, 2,661 (19.5%) attend a private institution, while the remaining 10,984 (80.5%) are enrolled in public schools. The age group of 3 to 4 year olds has the highest likelihood of being enrolled in private schools, with 391 (44.7% in the age bracket) enrolled. Conversely, the age group of 15 to 17 year olds has the lowest likelihood of being enrolled in a private school, with 2,452 (90.8% in the age bracket) attending a public institution.
| Age Bracket | Public School | Private School |
| 3 to 4 Year Olds | 483 (55.3%) | 391 (44.7%) |
| 5 to 9 Year Old | 2,368 (82.5%) | 502 (17.5%) |
| 10 to 14 Year Olds | 2,964 (86.0%) | 484 (14.0%) |
| 15 to 17 Year Olds | 2,452 (90.8%) | 249 (9.2%) |
| 18 to 19 Year Olds | 1,030 (80.0%) | 258 (20.0%) |
| 20 to 24 Year Olds | 911 (73.3%) | 332 (26.7%) |
| 25 to 34 Year Olds | 418 (63.2%) | 243 (36.8%) |
| 35 Years and over | 353 (63.0%) | 207 (37.0%) |
| Total | 10,984 (80.5%) | 2,661 (19.5%) |
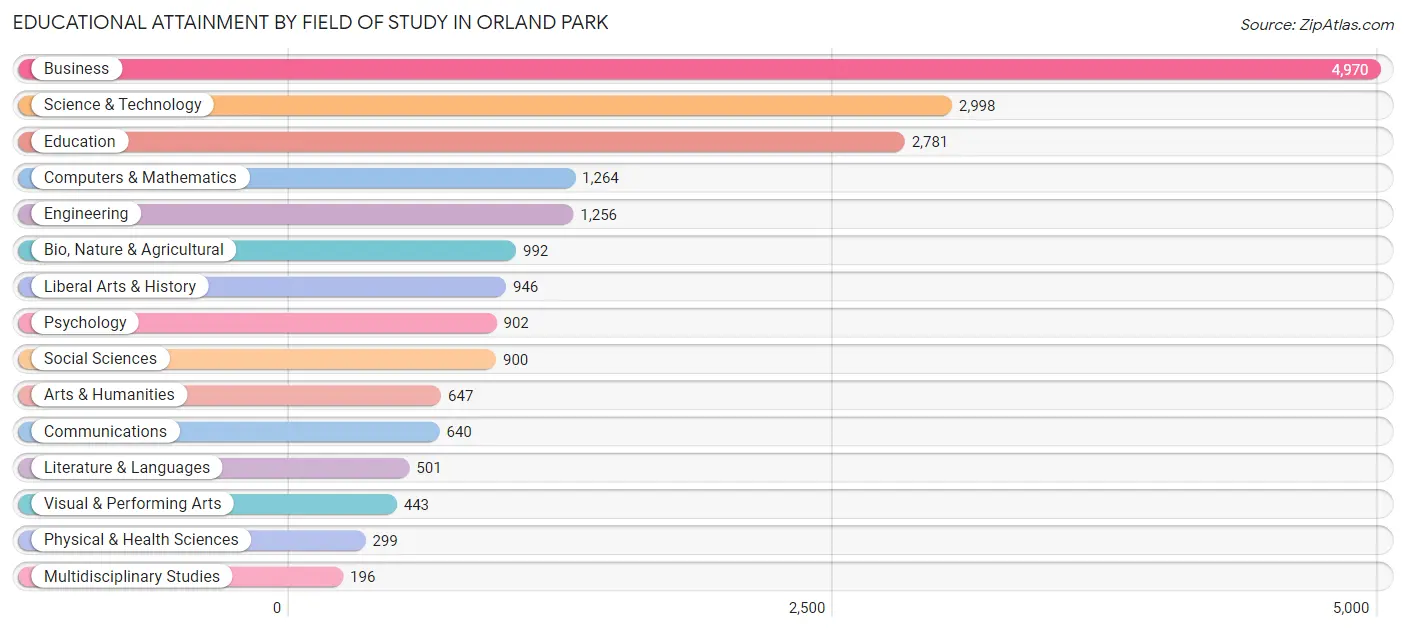
Educational Attainment by Field of Study in Orland Park
Business (4,970 | 25.2%), science & technology (2,998 | 15.2%), education (2,781 | 14.1%), computers & mathematics (1,264 | 6.4%), and engineering (1,256 | 6.4%) are the most common fields of study among 19,735 individuals in Orland Park who have obtained a bachelor's degree or higher.
| Field of Study | # Graduates | % Graduates |
| Computers & Mathematics | 1,264 | 6.4% |
| Bio, Nature & Agricultural | 992 | 5.0% |
| Physical & Health Sciences | 299 | 1.5% |
| Psychology | 902 | 4.6% |
| Social Sciences | 900 | 4.6% |
| Engineering | 1,256 | 6.4% |
| Multidisciplinary Studies | 196 | 1.0% |
| Science & Technology | 2,998 | 15.2% |
| Business | 4,970 | 25.2% |
| Education | 2,781 | 14.1% |
| Literature & Languages | 501 | 2.5% |
| Liberal Arts & History | 946 | 4.8% |
| Visual & Performing Arts | 443 | 2.2% |
| Communications | 640 | 3.2% |
| Arts & Humanities | 647 | 3.3% |
| Total | 19,735 | 100.0% |
Transportation & Commute in Orland Park
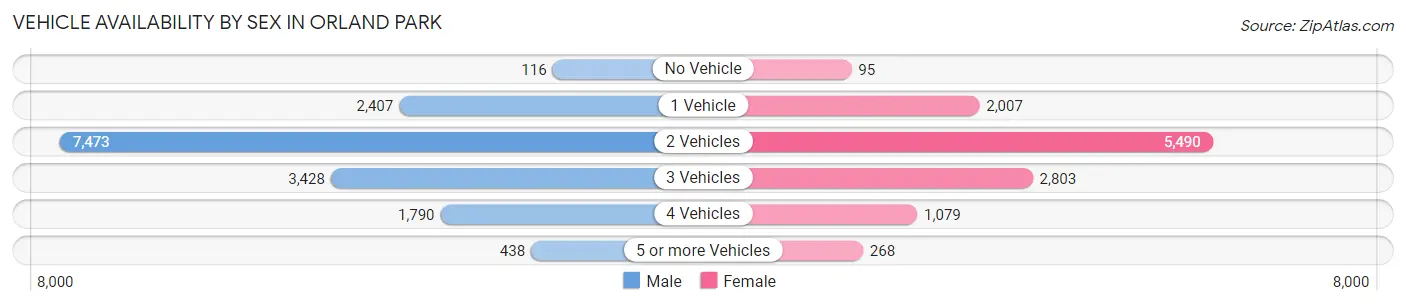
Vehicle Availability by Sex in Orland Park
The most prevalent vehicle ownership categories in Orland Park are males with 2 vehicles (7,473, accounting for 47.7%) and females with 2 vehicles (5,490, making up 63.6%).
| Vehicles Available | Male | Female |
| No Vehicle | 116 (0.7%) | 95 (0.8%) |
| 1 Vehicle | 2,407 (15.4%) | 2,007 (17.1%) |
| 2 Vehicles | 7,473 (47.7%) | 5,490 (46.8%) |
| 3 Vehicles | 3,428 (21.9%) | 2,803 (23.9%) |
| 4 Vehicles | 1,790 (11.4%) | 1,079 (9.2%) |
| 5 or more Vehicles | 438 (2.8%) | 268 (2.3%) |
| Total | 15,652 (100.0%) | 11,742 (100.0%) |
Commute Time in Orland Park
The most frequently occuring commute durations in Orland Park are 45 to 59 minutes (3,532 commuters, 14.9%), 60 to 89 minutes (3,465 commuters, 14.6%), and 30 to 34 minutes (3,135 commuters, 13.3%).
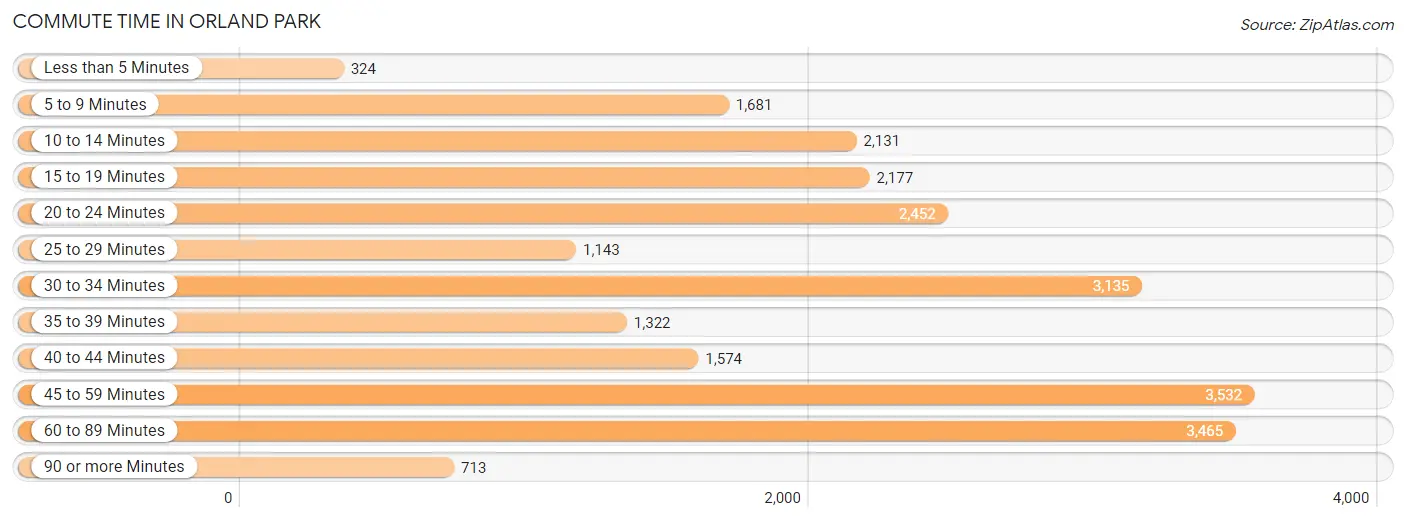
| Commute Time | # Commuters | % Commuters |
| Less than 5 Minutes | 324 | 1.4% |
| 5 to 9 Minutes | 1,681 | 7.1% |
| 10 to 14 Minutes | 2,131 | 9.0% |
| 15 to 19 Minutes | 2,177 | 9.2% |
| 20 to 24 Minutes | 2,452 | 10.4% |
| 25 to 29 Minutes | 1,143 | 4.8% |
| 30 to 34 Minutes | 3,135 | 13.3% |
| 35 to 39 Minutes | 1,322 | 5.6% |
| 40 to 44 Minutes | 1,574 | 6.7% |
| 45 to 59 Minutes | 3,532 | 14.9% |
| 60 to 89 Minutes | 3,465 | 14.6% |
| 90 or more Minutes | 713 | 3.0% |
Commute Time by Sex in Orland Park
The most common commute times in Orland Park are 60 to 89 minutes (2,432 commuters, 17.8%) for males and 45 to 59 minutes (1,296 commuters, 12.9%) for females.
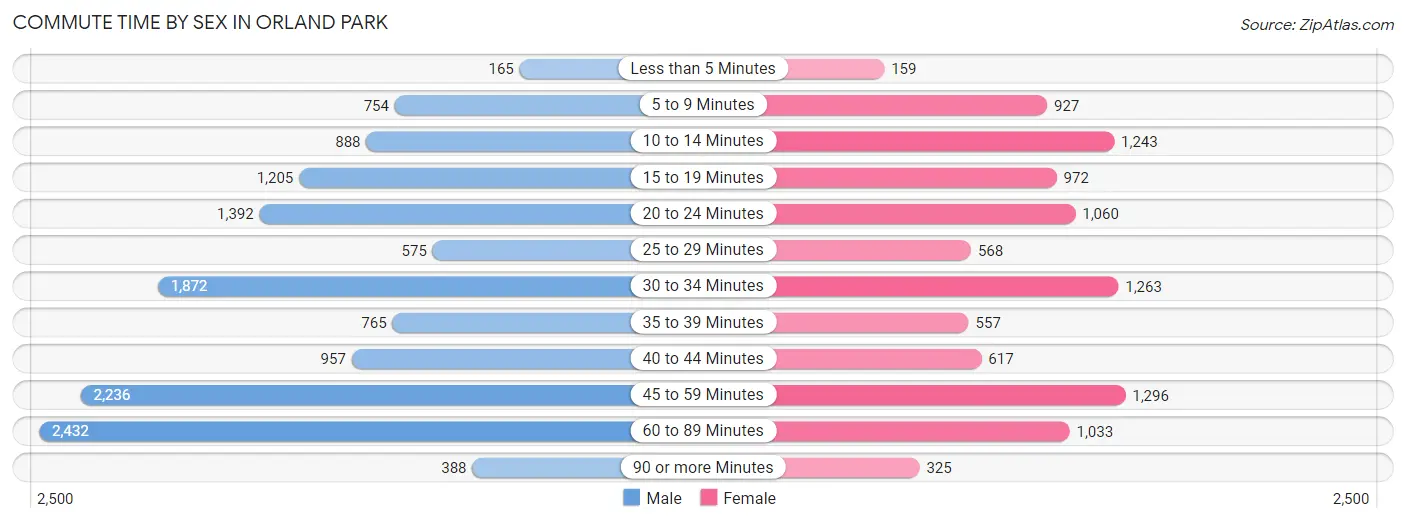
| Commute Time | Male | Female |
| Less than 5 Minutes | 165 (1.2%) | 159 (1.6%) |
| 5 to 9 Minutes | 754 (5.5%) | 927 (9.2%) |
| 10 to 14 Minutes | 888 (6.5%) | 1,243 (12.4%) |
| 15 to 19 Minutes | 1,205 (8.8%) | 972 (9.7%) |
| 20 to 24 Minutes | 1,392 (10.2%) | 1,060 (10.6%) |
| 25 to 29 Minutes | 575 (4.2%) | 568 (5.7%) |
| 30 to 34 Minutes | 1,872 (13.7%) | 1,263 (12.6%) |
| 35 to 39 Minutes | 765 (5.6%) | 557 (5.6%) |
| 40 to 44 Minutes | 957 (7.0%) | 617 (6.2%) |
| 45 to 59 Minutes | 2,236 (16.4%) | 1,296 (12.9%) |
| 60 to 89 Minutes | 2,432 (17.8%) | 1,033 (10.3%) |
| 90 or more Minutes | 388 (2.9%) | 325 (3.2%) |
Time of Departure to Work by Sex in Orland Park
The most frequent times of departure to work in Orland Park are 7:00 AM to 7:29 AM (1,925, 14.1%) for males and 7:00 AM to 7:29 AM (1,551, 15.5%) for females.
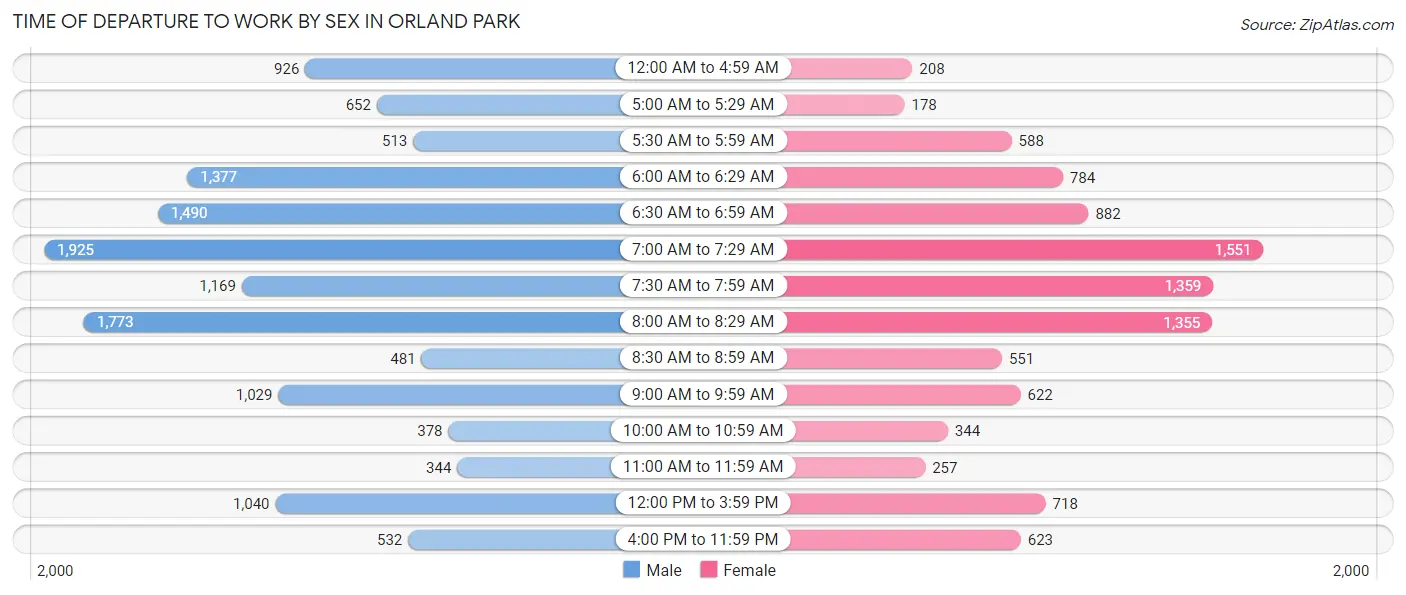
| Time of Departure | Male | Female |
| 12:00 AM to 4:59 AM | 926 (6.8%) | 208 (2.1%) |
| 5:00 AM to 5:29 AM | 652 (4.8%) | 178 (1.8%) |
| 5:30 AM to 5:59 AM | 513 (3.8%) | 588 (5.9%) |
| 6:00 AM to 6:29 AM | 1,377 (10.1%) | 784 (7.8%) |
| 6:30 AM to 6:59 AM | 1,490 (10.9%) | 882 (8.8%) |
| 7:00 AM to 7:29 AM | 1,925 (14.1%) | 1,551 (15.5%) |
| 7:30 AM to 7:59 AM | 1,169 (8.6%) | 1,359 (13.6%) |
| 8:00 AM to 8:29 AM | 1,773 (13.0%) | 1,355 (13.5%) |
| 8:30 AM to 8:59 AM | 481 (3.5%) | 551 (5.5%) |
| 9:00 AM to 9:59 AM | 1,029 (7.5%) | 622 (6.2%) |
| 10:00 AM to 10:59 AM | 378 (2.8%) | 344 (3.4%) |
| 11:00 AM to 11:59 AM | 344 (2.5%) | 257 (2.6%) |
| 12:00 PM to 3:59 PM | 1,040 (7.6%) | 718 (7.2%) |
| 4:00 PM to 11:59 PM | 532 (3.9%) | 623 (6.2%) |
| Total | 13,629 (100.0%) | 10,020 (100.0%) |
Housing Occupancy in Orland Park
Occupancy by Ownership in Orland Park
Of the total 22,980 dwellings in Orland Park, owner-occupied units account for 19,742 (85.9%), while renter-occupied units make up 3,238 (14.1%).
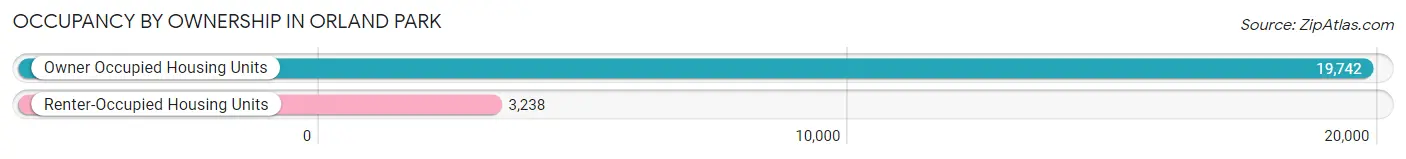
| Occupancy | # Housing Units | % Housing Units |
| Owner Occupied Housing Units | 19,742 | 85.9% |
| Renter-Occupied Housing Units | 3,238 | 14.1% |
| Total Occupied Housing Units | 22,980 | 100.0% |
Occupancy by Household Size in Orland Park
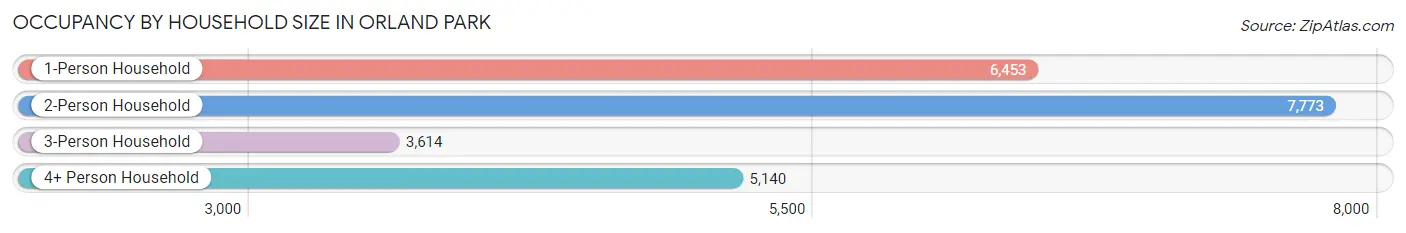
| Household Size | # Housing Units | % Housing Units |
| 1-Person Household | 6,453 | 28.1% |
| 2-Person Household | 7,773 | 33.8% |
| 3-Person Household | 3,614 | 15.7% |
| 4+ Person Household | 5,140 | 22.4% |
| Total Housing Units | 22,980 | 100.0% |
Occupancy by Ownership by Household Size in Orland Park
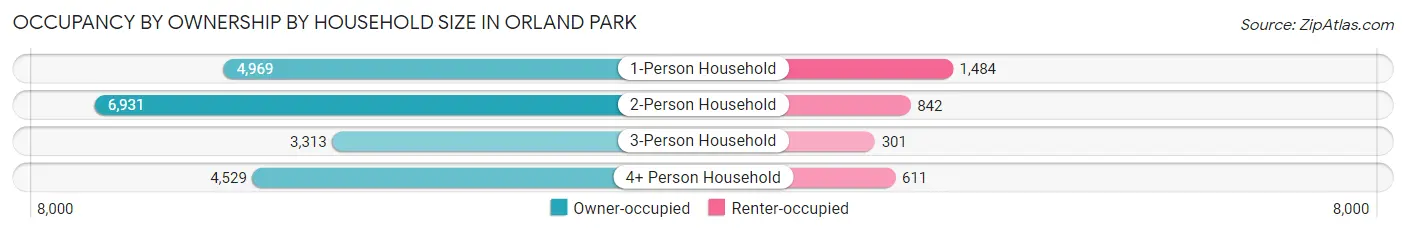
| Household Size | Owner-occupied | Renter-occupied |
| 1-Person Household | 4,969 (77.0%) | 1,484 (23.0%) |
| 2-Person Household | 6,931 (89.2%) | 842 (10.8%) |
| 3-Person Household | 3,313 (91.7%) | 301 (8.3%) |
| 4+ Person Household | 4,529 (88.1%) | 611 (11.9%) |
| Total Housing Units | 19,742 (85.9%) | 3,238 (14.1%) |
Occupancy by Educational Attainment in Orland Park
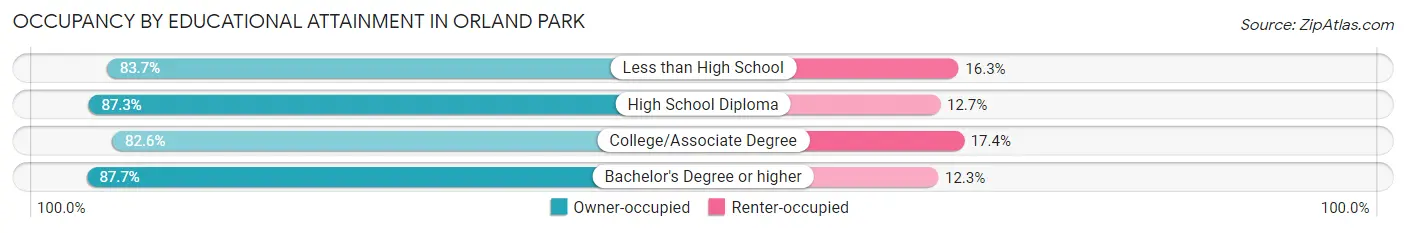
| Household Size | Owner-occupied | Renter-occupied |
| Less than High School | 1,031 (83.7%) | 201 (16.3%) |
| High School Diploma | 3,827 (87.3%) | 555 (12.7%) |
| College/Associate Degree | 5,709 (82.6%) | 1,199 (17.4%) |
| Bachelor's Degree or higher | 9,175 (87.7%) | 1,283 (12.3%) |
Occupancy by Age of Householder in Orland Park
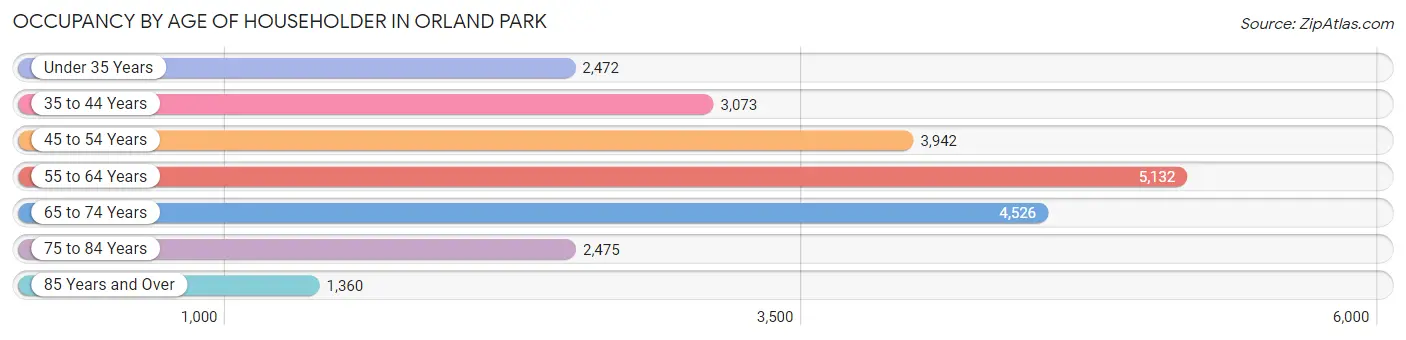
| Age Bracket | # Households | % Households |
| Under 35 Years | 2,472 | 10.8% |
| 35 to 44 Years | 3,073 | 13.4% |
| 45 to 54 Years | 3,942 | 17.2% |
| 55 to 64 Years | 5,132 | 22.3% |
| 65 to 74 Years | 4,526 | 19.7% |
| 75 to 84 Years | 2,475 | 10.8% |
| 85 Years and Over | 1,360 | 5.9% |
| Total | 22,980 | 100.0% |
Housing Finances in Orland Park
Median Income by Occupancy in Orland Park
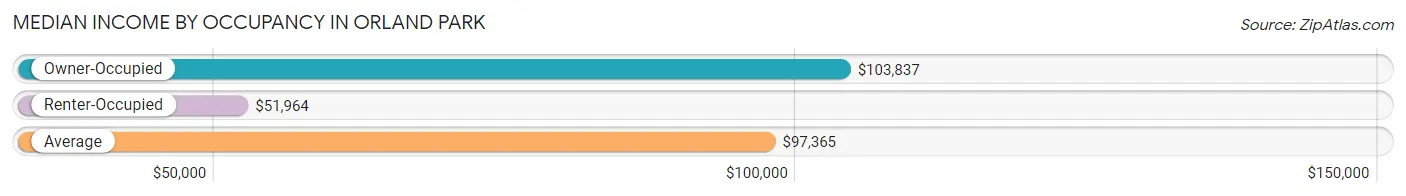
| Occupancy Type | # Households | Median Income |
| Owner-Occupied | 19,742 (85.9%) | $103,837 |
| Renter-Occupied | 3,238 (14.1%) | $51,964 |
| Average | 22,980 (100.0%) | $97,365 |
Occupancy by Householder Income Bracket in Orland Park
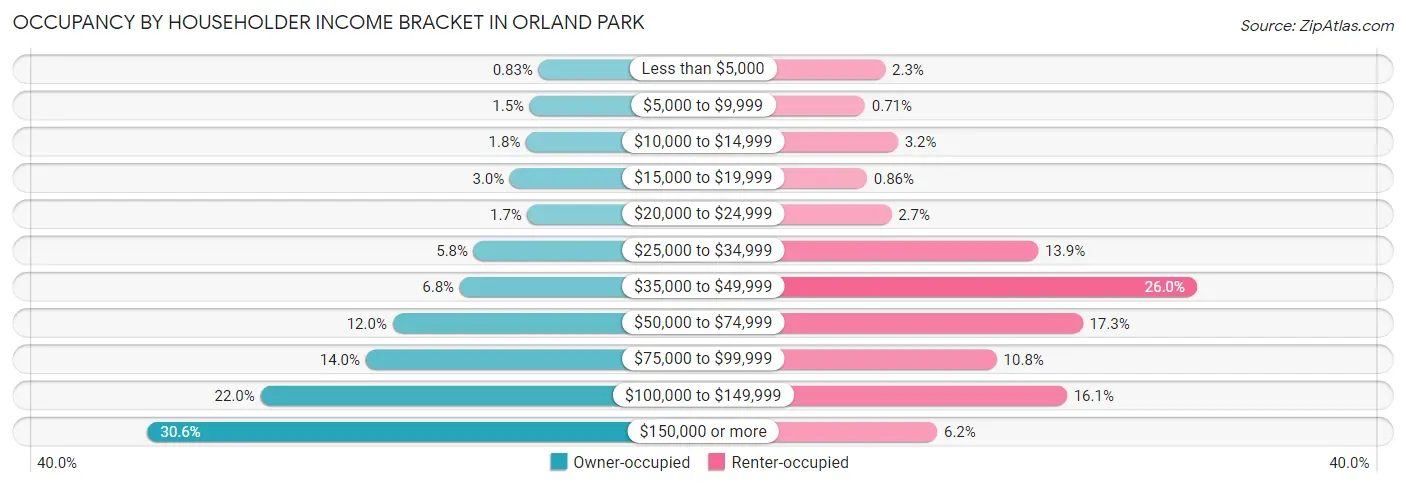
| Income Bracket | Owner-occupied | Renter-occupied |
| Less than $5,000 | 164 (0.8%) | 73 (2.2%) |
| $5,000 to $9,999 | 297 (1.5%) | 23 (0.7%) |
| $10,000 to $14,999 | 352 (1.8%) | 104 (3.2%) |
| $15,000 to $19,999 | 595 (3.0%) | 28 (0.9%) |
| $20,000 to $24,999 | 330 (1.7%) | 88 (2.7%) |
| $25,000 to $34,999 | 1,139 (5.8%) | 450 (13.9%) |
| $35,000 to $49,999 | 1,348 (6.8%) | 842 (26.0%) |
| $50,000 to $74,999 | 2,359 (11.9%) | 560 (17.3%) |
| $75,000 to $99,999 | 2,763 (14.0%) | 348 (10.7%) |
| $100,000 to $149,999 | 4,347 (22.0%) | 521 (16.1%) |
| $150,000 or more | 6,048 (30.6%) | 201 (6.2%) |
| Total | 19,742 (100.0%) | 3,238 (100.0%) |
Monthly Housing Cost Tiers in Orland Park
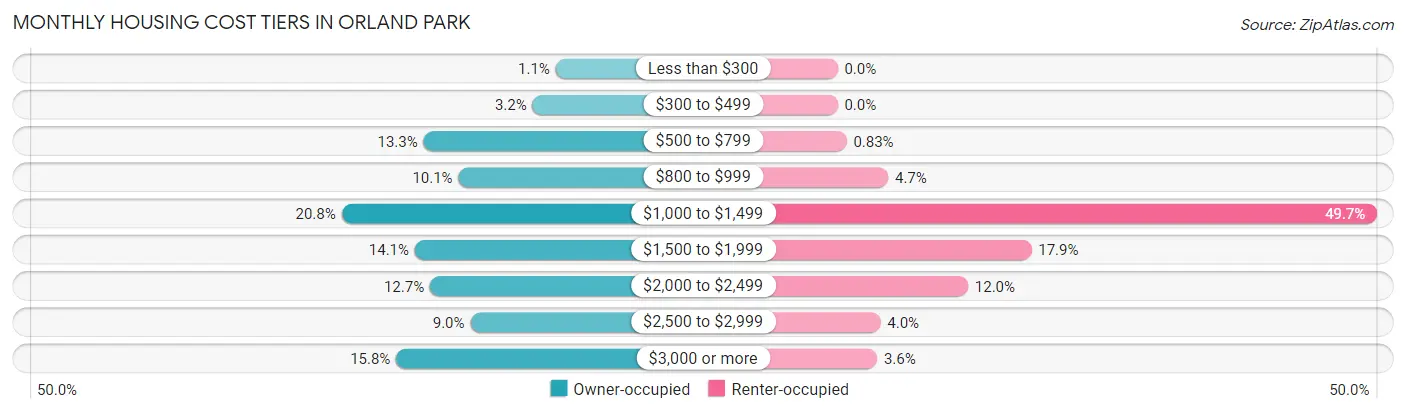
| Monthly Cost | Owner-occupied | Renter-occupied |
| Less than $300 | 219 (1.1%) | 0 (0.0%) |
| $300 to $499 | 639 (3.2%) | 0 (0.0%) |
| $500 to $799 | 2,620 (13.3%) | 27 (0.8%) |
| $800 to $999 | 1,987 (10.1%) | 151 (4.7%) |
| $1,000 to $1,499 | 4,111 (20.8%) | 1,609 (49.7%) |
| $1,500 to $1,999 | 2,778 (14.1%) | 578 (17.8%) |
| $2,000 to $2,499 | 2,503 (12.7%) | 389 (12.0%) |
| $2,500 to $2,999 | 1,768 (9.0%) | 128 (4.0%) |
| $3,000 or more | 3,117 (15.8%) | 118 (3.6%) |
| Total | 19,742 (100.0%) | 3,238 (100.0%) |
Physical Housing Characteristics in Orland Park
Housing Structures in Orland Park
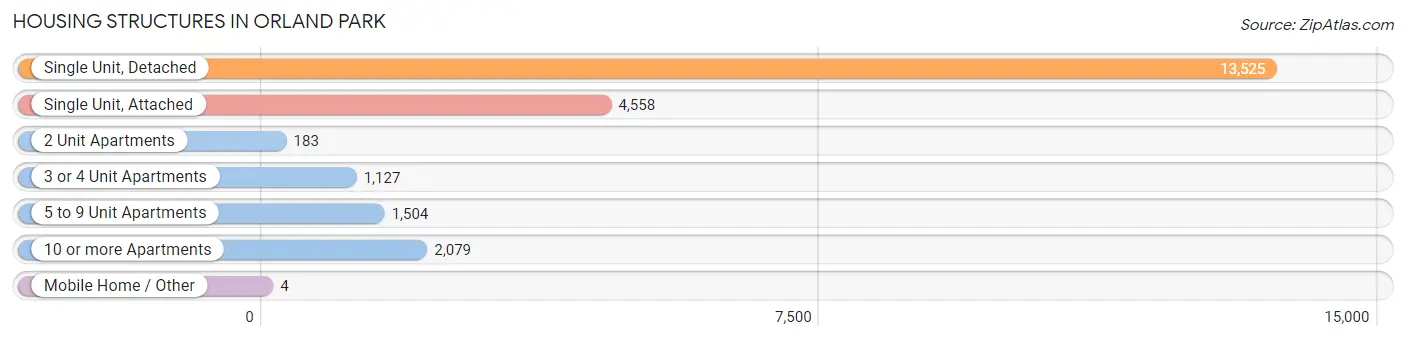
| Structure Type | # Housing Units | % Housing Units |
| Single Unit, Detached | 13,525 | 58.9% |
| Single Unit, Attached | 4,558 | 19.8% |
| 2 Unit Apartments | 183 | 0.8% |
| 3 or 4 Unit Apartments | 1,127 | 4.9% |
| 5 to 9 Unit Apartments | 1,504 | 6.5% |
| 10 or more Apartments | 2,079 | 9.0% |
| Mobile Home / Other | 4 | 0.0% |
| Total | 22,980 | 100.0% |
Housing Structures by Occupancy in Orland Park
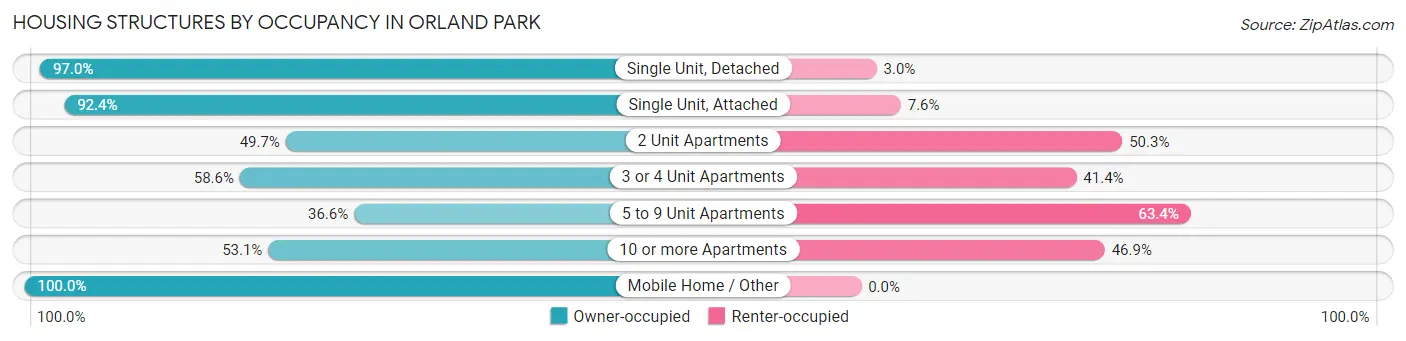
| Structure Type | Owner-occupied | Renter-occupied |
| Single Unit, Detached | 13,123 (97.0%) | 402 (3.0%) |
| Single Unit, Attached | 4,210 (92.4%) | 348 (7.6%) |
| 2 Unit Apartments | 91 (49.7%) | 92 (50.3%) |
| 3 or 4 Unit Apartments | 660 (58.6%) | 467 (41.4%) |
| 5 to 9 Unit Apartments | 550 (36.6%) | 954 (63.4%) |
| 10 or more Apartments | 1,104 (53.1%) | 975 (46.9%) |
| Mobile Home / Other | 4 (100.0%) | 0 (0.0%) |
| Total | 19,742 (85.9%) | 3,238 (14.1%) |
Housing Structures by Number of Rooms in Orland Park
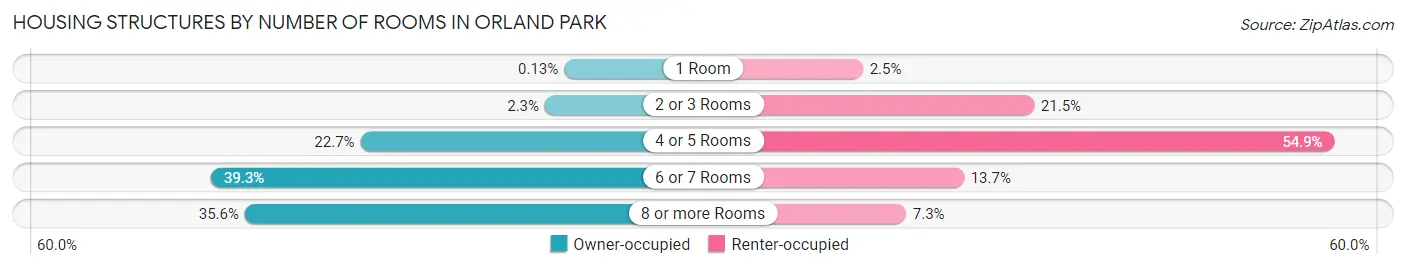
| Number of Rooms | Owner-occupied | Renter-occupied |
| 1 Room | 25 (0.1%) | 82 (2.5%) |
| 2 or 3 Rooms | 446 (2.3%) | 697 (21.5%) |
| 4 or 5 Rooms | 4,487 (22.7%) | 1,777 (54.9%) |
| 6 or 7 Rooms | 7,763 (39.3%) | 445 (13.7%) |
| 8 or more Rooms | 7,021 (35.6%) | 237 (7.3%) |
| Total | 19,742 (100.0%) | 3,238 (100.0%) |
Housing Structure by Heating Type in Orland Park
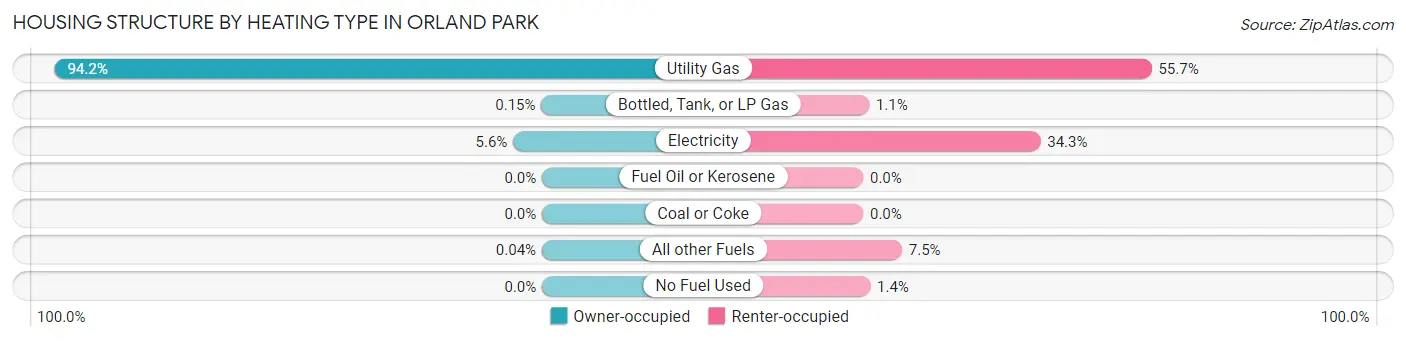
| Heating Type | Owner-occupied | Renter-occupied |
| Utility Gas | 18,601 (94.2%) | 1,805 (55.7%) |
| Bottled, Tank, or LP Gas | 30 (0.2%) | 37 (1.1%) |
| Electricity | 1,104 (5.6%) | 1,109 (34.3%) |
| Fuel Oil or Kerosene | 0 (0.0%) | 0 (0.0%) |
| Coal or Coke | 0 (0.0%) | 0 (0.0%) |
| All other Fuels | 7 (0.0%) | 243 (7.5%) |
| No Fuel Used | 0 (0.0%) | 44 (1.4%) |
| Total | 19,742 (100.0%) | 3,238 (100.0%) |
Household Vehicle Usage in Orland Park
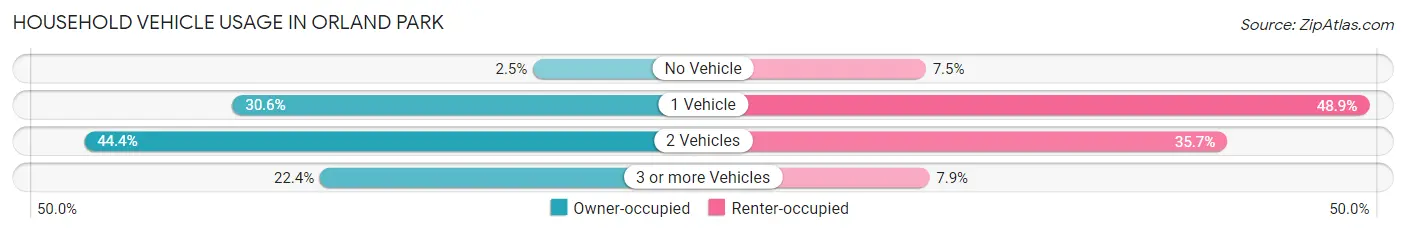
| Vehicles per Household | Owner-occupied | Renter-occupied |
| No Vehicle | 500 (2.5%) | 244 (7.5%) |
| 1 Vehicle | 6,043 (30.6%) | 1,584 (48.9%) |
| 2 Vehicles | 8,772 (44.4%) | 1,155 (35.7%) |
| 3 or more Vehicles | 4,427 (22.4%) | 255 (7.9%) |
| Total | 19,742 (100.0%) | 3,238 (100.0%) |
Real Estate & Mortgages in Orland Park
Real Estate and Mortgage Overview in Orland Park
| Characteristic | Without Mortgage | With Mortgage |
| Housing Units | 8,367 | 11,375 |
| Median Property Value | $319,700 | $351,300 |
| Median Household Income | $82,349 | $4,057 |
| Monthly Housing Costs | $922 | $3,033 |
| Real Estate Taxes | $6,443 | $82 |
Property Value by Mortgage Status in Orland Park
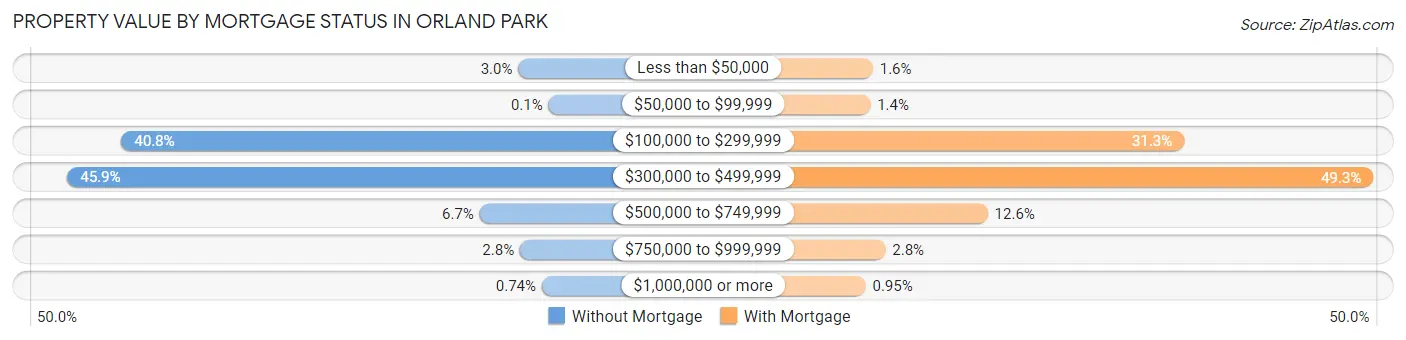
| Property Value | Without Mortgage | With Mortgage |
| Less than $50,000 | 249 (3.0%) | 187 (1.6%) |
| $50,000 to $99,999 | 8 (0.1%) | 159 (1.4%) |
| $100,000 to $299,999 | 3,412 (40.8%) | 3,559 (31.3%) |
| $300,000 to $499,999 | 3,843 (45.9%) | 5,608 (49.3%) |
| $500,000 to $749,999 | 557 (6.7%) | 1,431 (12.6%) |
| $750,000 to $999,999 | 236 (2.8%) | 323 (2.8%) |
| $1,000,000 or more | 62 (0.7%) | 108 (0.9%) |
| Total | 8,367 (100.0%) | 11,375 (100.0%) |
Household Income by Mortgage Status in Orland Park
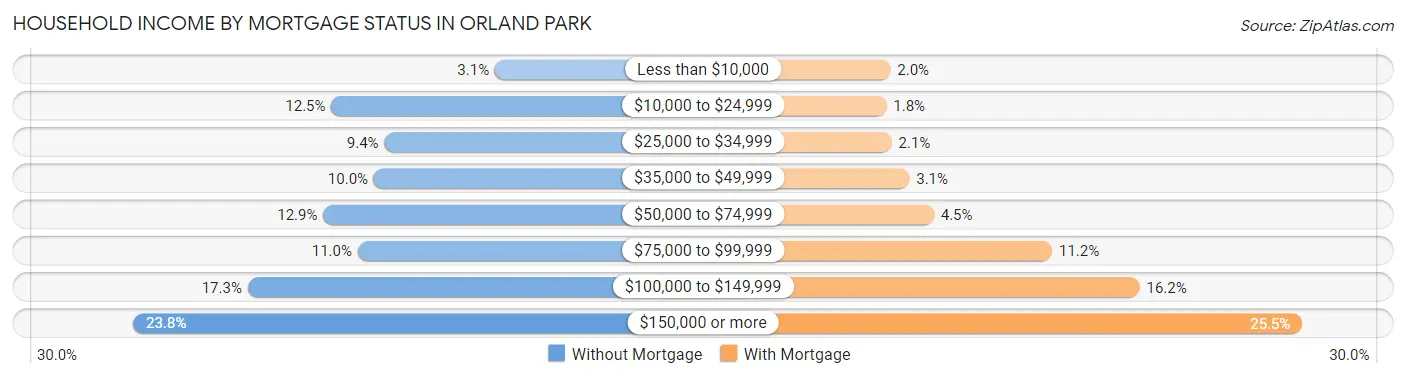
| Household Income | Without Mortgage | With Mortgage |
| Less than $10,000 | 261 (3.1%) | 226 (2.0%) |
| $10,000 to $24,999 | 1,043 (12.5%) | 200 (1.8%) |
| $25,000 to $34,999 | 790 (9.4%) | 234 (2.1%) |
| $35,000 to $49,999 | 840 (10.0%) | 349 (3.1%) |
| $50,000 to $74,999 | 1,082 (12.9%) | 508 (4.5%) |
| $75,000 to $99,999 | 917 (11.0%) | 1,277 (11.2%) |
| $100,000 to $149,999 | 1,443 (17.2%) | 1,846 (16.2%) |
| $150,000 or more | 1,991 (23.8%) | 2,904 (25.5%) |
| Total | 8,367 (100.0%) | 11,375 (100.0%) |
Property Value to Household Income Ratio in Orland Park
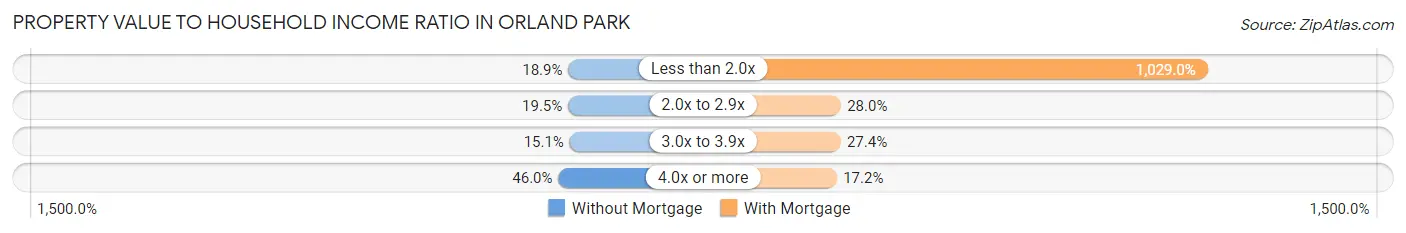
| Value-to-Income Ratio | Without Mortgage | With Mortgage |
| Less than 2.0x | 1,577 (18.9%) | 117,047 (1,029.0%) |
| 2.0x to 2.9x | 1,627 (19.5%) | 3,189 (28.0%) |
| 3.0x to 3.9x | 1,260 (15.1%) | 3,118 (27.4%) |
| 4.0x or more | 3,846 (46.0%) | 1,953 (17.2%) |
| Total | 8,367 (100.0%) | 11,375 (100.0%) |
Real Estate Taxes by Mortgage Status in Orland Park
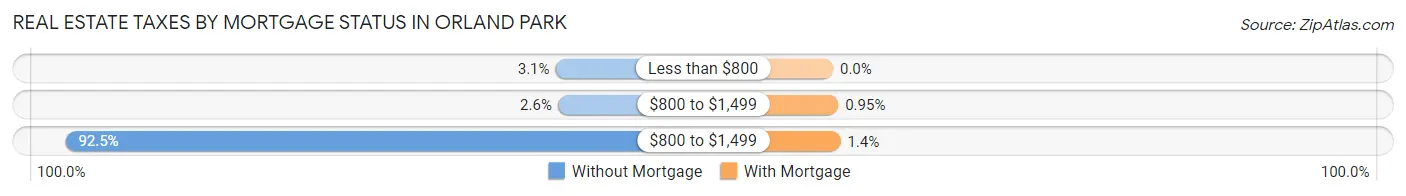
| Property Taxes | Without Mortgage | With Mortgage |
| Less than $800 | 256 (3.1%) | 0 (0.0%) |
| $800 to $1,499 | 219 (2.6%) | 108 (0.9%) |
| $800 to $1,499 | 7,742 (92.5%) | 154 (1.3%) |
| Total | 8,367 (100.0%) | 11,375 (100.0%) |
Health & Disability in Orland Park
Health Insurance Coverage by Age in Orland Park
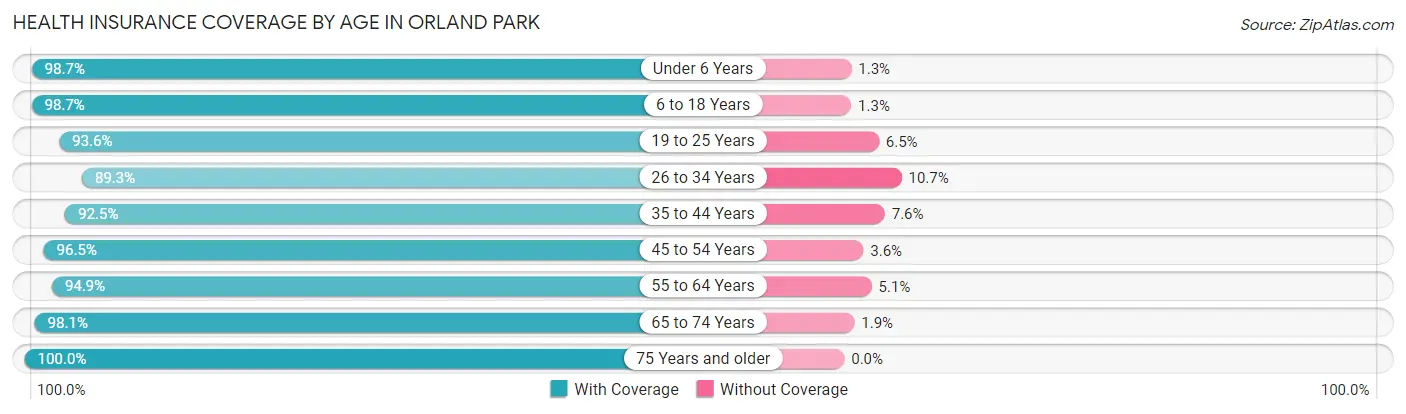
| Age Bracket | With Coverage | Without Coverage |
| Under 6 Years | 3,399 (98.7%) | 45 (1.3%) |
| 6 to 18 Years | 9,012 (98.7%) | 117 (1.3%) |
| 19 to 25 Years | 3,335 (93.5%) | 230 (6.5%) |
| 26 to 34 Years | 4,770 (89.3%) | 570 (10.7%) |
| 35 to 44 Years | 5,854 (92.4%) | 478 (7.5%) |
| 45 to 54 Years | 7,151 (96.5%) | 263 (3.5%) |
| 55 to 64 Years | 8,638 (94.9%) | 463 (5.1%) |
| 65 to 74 Years | 7,681 (98.1%) | 147 (1.9%) |
| 75 Years and older | 5,691 (100.0%) | 0 (0.0%) |
| Total | 55,531 (96.0%) | 2,313 (4.0%) |
Health Insurance Coverage by Citizenship Status in Orland Park
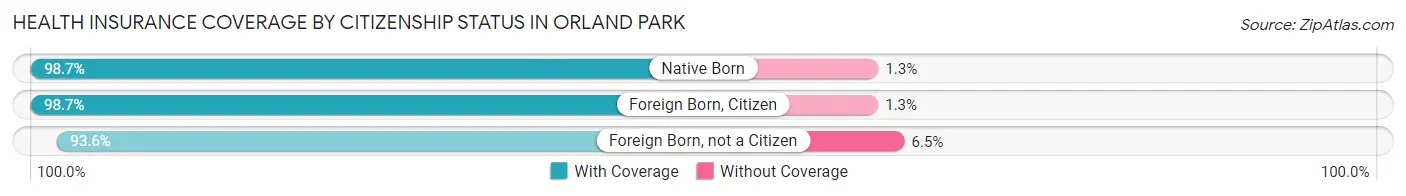
| Citizenship Status | With Coverage | Without Coverage |
| Native Born | 3,399 (98.7%) | 45 (1.3%) |
| Foreign Born, Citizen | 9,012 (98.7%) | 117 (1.3%) |
| Foreign Born, not a Citizen | 3,335 (93.5%) | 230 (6.5%) |
Health Insurance Coverage by Household Income in Orland Park
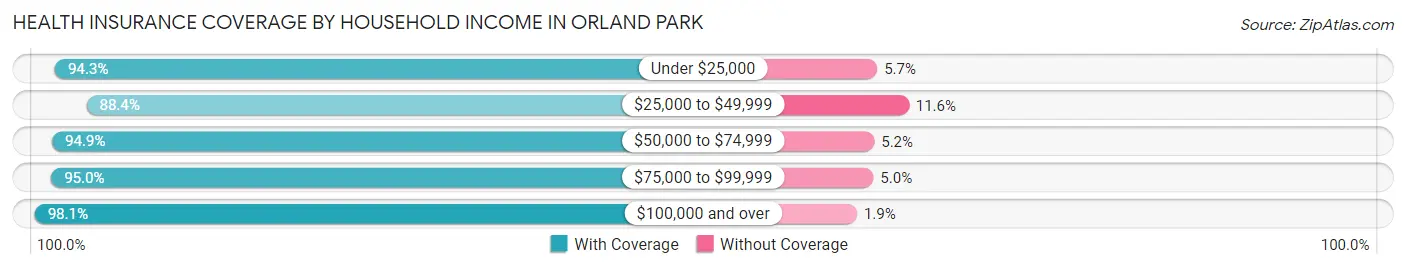
| Household Income | With Coverage | Without Coverage |
| Under $25,000 | 3,093 (94.3%) | 187 (5.7%) |
| $25,000 to $49,999 | 6,070 (88.4%) | 797 (11.6%) |
| $50,000 to $74,999 | 6,116 (94.9%) | 332 (5.1%) |
| $75,000 to $99,999 | 6,433 (95.0%) | 338 (5.0%) |
| $100,000 and over | 33,795 (98.1%) | 659 (1.9%) |
Public vs Private Health Insurance Coverage by Age in Orland Park
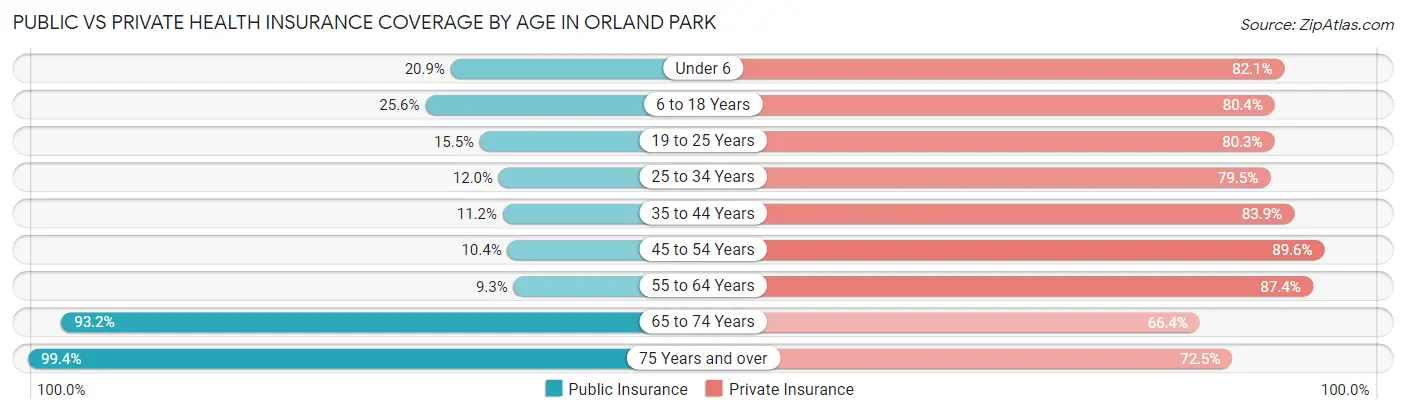
| Age Bracket | Public Insurance | Private Insurance |
| Under 6 | 720 (20.9%) | 2,829 (82.1%) |
| 6 to 18 Years | 2,338 (25.6%) | 7,336 (80.4%) |
| 19 to 25 Years | 552 (15.5%) | 2,862 (80.3%) |
| 25 to 34 Years | 639 (12.0%) | 4,245 (79.5%) |
| 35 to 44 Years | 711 (11.2%) | 5,314 (83.9%) |
| 45 to 54 Years | 769 (10.4%) | 6,641 (89.6%) |
| 55 to 64 Years | 842 (9.2%) | 7,953 (87.4%) |
| 65 to 74 Years | 7,294 (93.2%) | 5,201 (66.4%) |
| 75 Years and over | 5,654 (99.4%) | 4,124 (72.5%) |
| Total | 19,519 (33.7%) | 46,505 (80.4%) |
Disability Status by Sex by Age in Orland Park
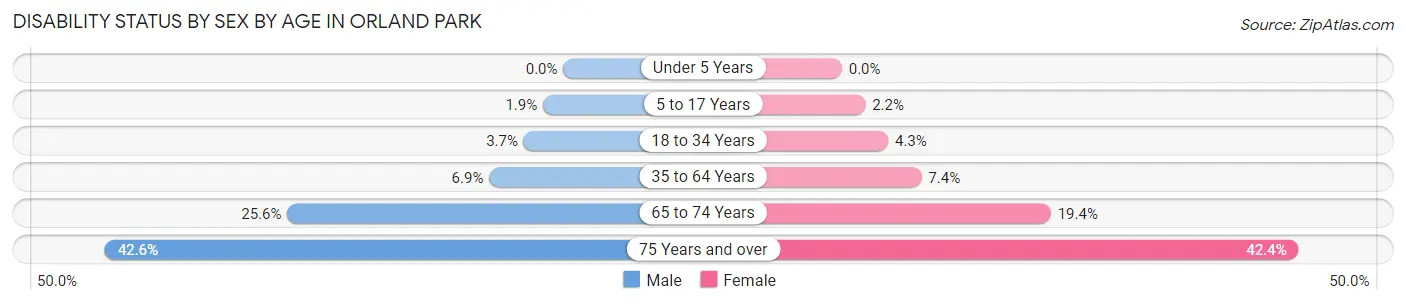
| Age Bracket | Male | Female |
| Under 5 Years | 0 (0.0%) | 0 (0.0%) |
| 5 to 17 Years | 101 (1.9%) | 82 (2.2%) |
| 18 to 34 Years | 187 (3.7%) | 187 (4.3%) |
| 35 to 64 Years | 802 (6.9%) | 827 (7.4%) |
| 65 to 74 Years | 861 (25.6%) | 866 (19.4%) |
| 75 Years and over | 1,113 (42.6%) | 1,304 (42.4%) |
Disability Class by Sex by Age in Orland Park
Disability Class: Hearing Difficulty
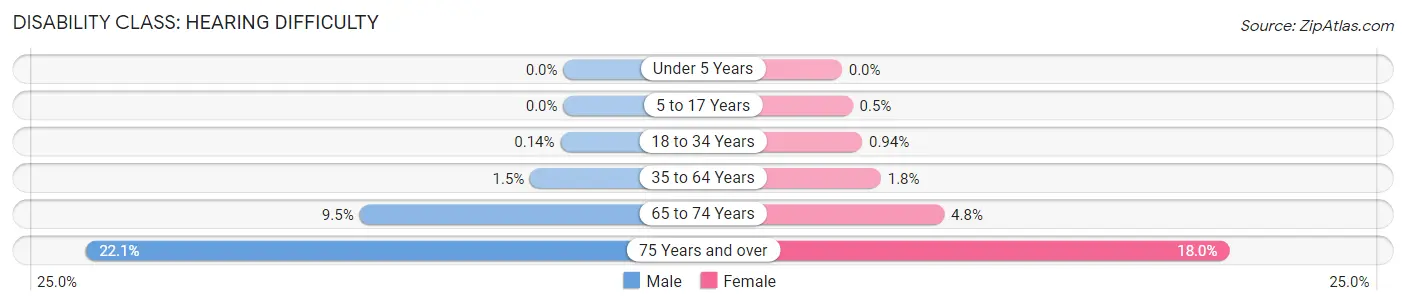
| Age Bracket | Male | Female |
| Under 5 Years | 0 (0.0%) | 0 (0.0%) |
| 5 to 17 Years | 0 (0.0%) | 19 (0.5%) |
| 18 to 34 Years | 7 (0.1%) | 41 (0.9%) |
| 35 to 64 Years | 180 (1.5%) | 203 (1.8%) |
| 65 to 74 Years | 318 (9.5%) | 212 (4.8%) |
| 75 Years and over | 579 (22.1%) | 553 (18.0%) |
Disability Class: Vision Difficulty
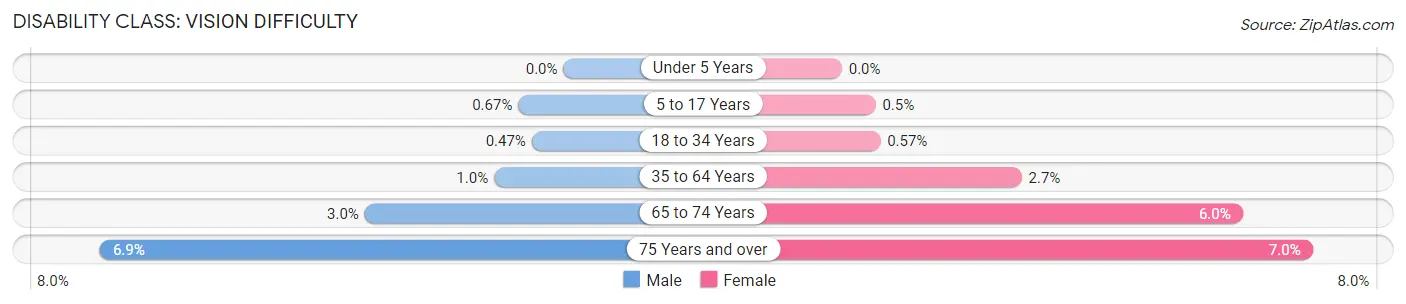
| Age Bracket | Male | Female |
| Under 5 Years | 0 (0.0%) | 0 (0.0%) |
| 5 to 17 Years | 36 (0.7%) | 19 (0.5%) |
| 18 to 34 Years | 24 (0.5%) | 25 (0.6%) |
| 35 to 64 Years | 120 (1.0%) | 299 (2.7%) |
| 65 to 74 Years | 99 (2.9%) | 266 (5.9%) |
| 75 Years and over | 180 (6.9%) | 215 (7.0%) |
Disability Class: Cognitive Difficulty
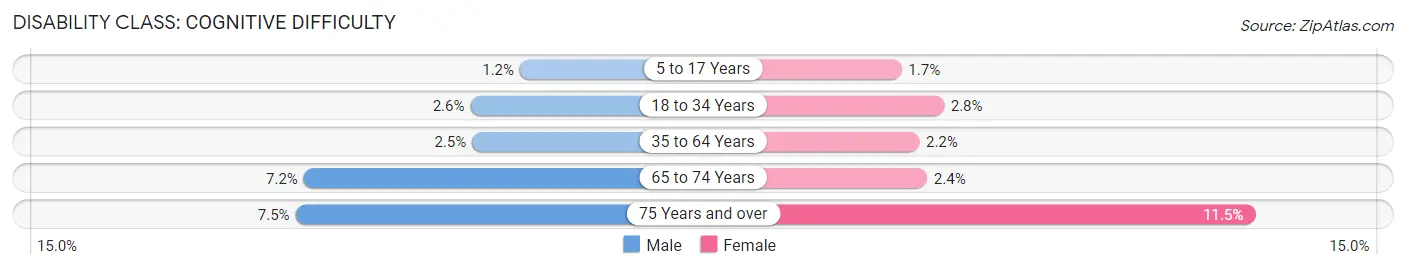
| Age Bracket | Male | Female |
| 5 to 17 Years | 65 (1.2%) | 63 (1.7%) |
| 18 to 34 Years | 132 (2.6%) | 124 (2.8%) |
| 35 to 64 Years | 296 (2.5%) | 240 (2.1%) |
| 65 to 74 Years | 243 (7.2%) | 106 (2.4%) |
| 75 Years and over | 195 (7.5%) | 354 (11.5%) |
Disability Class: Ambulatory Difficulty
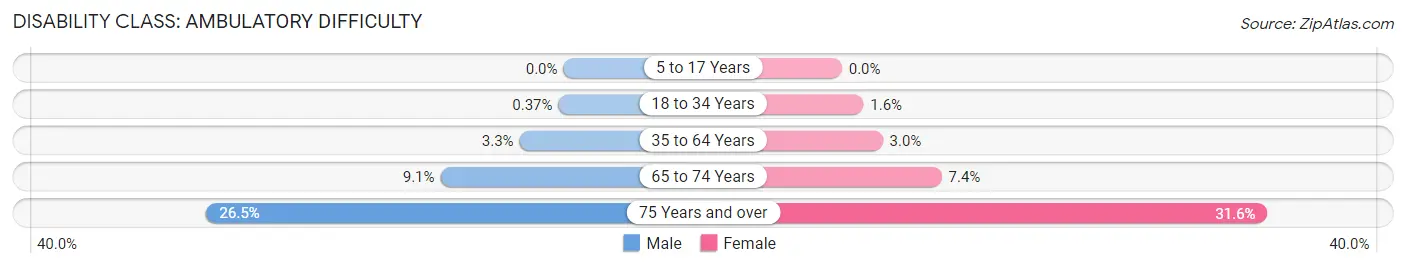
| Age Bracket | Male | Female |
| 5 to 17 Years | 0 (0.0%) | 0 (0.0%) |
| 18 to 34 Years | 19 (0.4%) | 70 (1.6%) |
| 35 to 64 Years | 380 (3.3%) | 339 (3.0%) |
| 65 to 74 Years | 307 (9.1%) | 331 (7.4%) |
| 75 Years and over | 693 (26.5%) | 972 (31.6%) |
Disability Class: Self-Care Difficulty
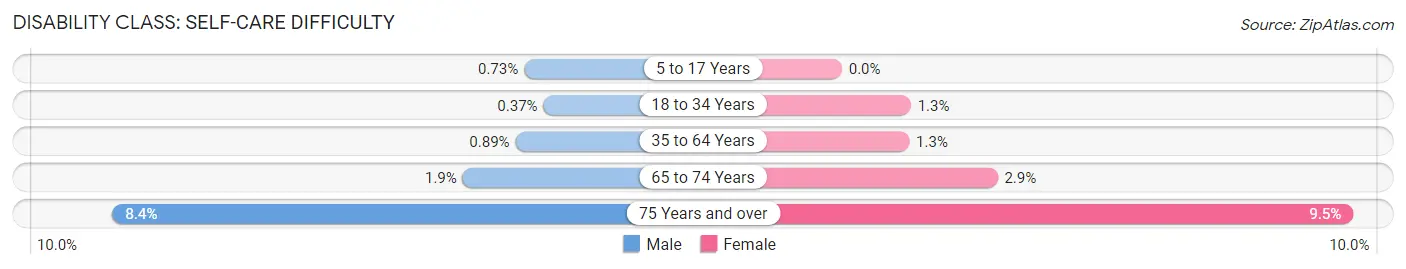
| Age Bracket | Male | Female |
| 5 to 17 Years | 39 (0.7%) | 0 (0.0%) |
| 18 to 34 Years | 19 (0.4%) | 56 (1.3%) |
| 35 to 64 Years | 104 (0.9%) | 140 (1.3%) |
| 65 to 74 Years | 63 (1.9%) | 129 (2.9%) |
| 75 Years and over | 219 (8.4%) | 292 (9.5%) |
Technology Access in Orland Park
Computing Device Access in Orland Park
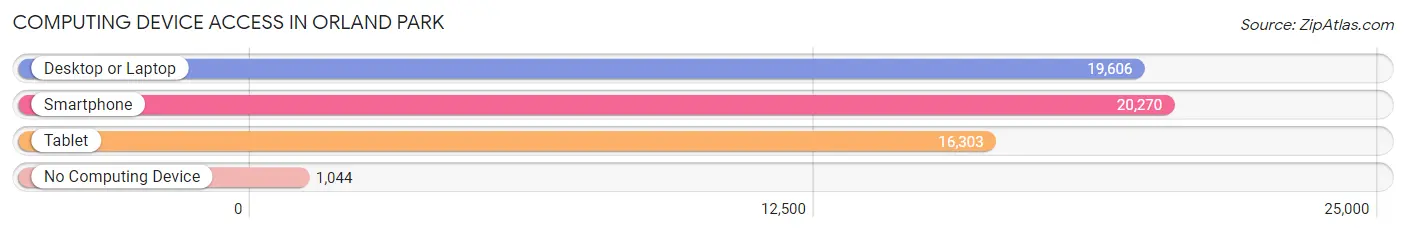
| Device Type | # Households | % Households |
| Desktop or Laptop | 19,606 | 85.3% |
| Smartphone | 20,270 | 88.2% |
| Tablet | 16,303 | 70.9% |
| No Computing Device | 1,044 | 4.5% |
| Total | 22,980 | 100.0% |
Internet Access in Orland Park
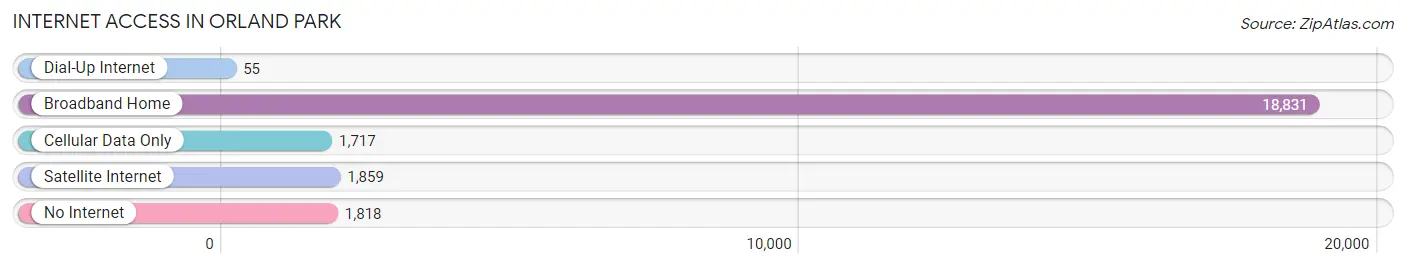
| Internet Type | # Households | % Households |
| Dial-Up Internet | 55 | 0.2% |
| Broadband Home | 18,831 | 82.0% |
| Cellular Data Only | 1,717 | 7.5% |
| Satellite Internet | 1,859 | 8.1% |
| No Internet | 1,818 | 7.9% |
| Total | 22,980 | 100.0% |
Orland Park Summary
Orland Park, Illinois is a village located in Cook and Will counties in the state of Illinois. It is a suburb of Chicago and is located approximately 25 miles southwest of the city. As of the 2010 census, the village had a population of 56,767, making it the fifth-largest village in Illinois.
Geography
Orland Park is located at 41°37'17" North, 87°51'51" West (41.6214, -87.8642). According to the United States Census Bureau, the village has a total area of 22.6 square miles (58.6 km2), of which 22.3 square miles (57.8 km2) is land and 0.3 square miles (0.8 km2) is water.
The village is bordered by the villages of Tinley Park to the north, Oak Forest to the east, Palos Park to the south, and Homer Glen to the west. It is also bordered by the townships of Orland, Palos, and Bremen.
Demographics
As of the 2010 census, there were 56,767 people, 20,845 households, and 15,717 families residing in the village. The population density was 2,541.2 people per square mile (981.2/km2). There were 21,717 housing units at an average density of 972.2 per square mile (375.7/km2). The racial makeup of the village was 87.2% White, 3.2% African American, 0.1% Native American, 5.7% Asian, 0.03% Pacific Islander, 1.7% from other races, and 2.1% from two or more races. Hispanic or Latino of any race were 6.9% of the population.
Economy
Orland Park is home to a variety of businesses, including retail stores, restaurants, and professional services. The village is also home to several large employers, including Advocate Healthcare, Orland Park Medical Center, and Orland Park Place Shopping Center.
The village is also home to a number of corporate headquarters, including the headquarters of the Orland Park Chamber of Commerce, the Orland Park Public Library, and the Orland Park Historical Society.
Education
Orland Park is served by several school districts, including Orland School District 135, Consolidated High School District 230, and Sandridge School District 146. The village is also home to several private schools, including St. Michael School, St. Francis of Assisi School, and St. George School.
The village is also home to several higher education institutions, including Moraine Valley Community College, Trinity Christian College, and the University of St. Francis.
Conclusion
Orland Park, Illinois is a village located in Cook and Will counties in the state of Illinois. It is a suburb of Chicago and is located approximately 25 miles southwest of the city. As of the 2010 census, the village had a population of 56,767, making it the fifth-largest village in Illinois. The village is home to a variety of businesses, including retail stores, restaurants, and professional services. It is also home to several large employers, corporate headquarters, and higher education institutions.
Common Questions
What is Per Capita Income in Orland Park?
Per Capita income in Orland Park is $49,989.
What is the Median Family Income in Orland Park?
Median Family Income in Orland Park is $118,190.
What is the Median Household income in Orland Park?
Median Household Income in Orland Park is $97,365.
What is Income or Wage Gap in Orland Park?
Income or Wage Gap in Orland Park is 31.0%.
Women in Orland Park earn 69.0 cents for every dollar earned by a man.
What is Family Income Deficit in Orland Park?
Family Income Deficit in Orland Park is $8,835.
Families that are below poverty line in Orland Park earn $8,835 less on average than the poverty threshold level.
What is Inequality or Gini Index in Orland Park?
Inequality or Gini Index in Orland Park is 0.44.
What is the Total Population of Orland Park?
Total Population of Orland Park is 58,345.
What is the Total Male Population of Orland Park?
Total Male Population of Orland Park is 29,713.
What is the Total Female Population of Orland Park?
Total Female Population of Orland Park is 28,632.
What is the Ratio of Males per 100 Females in Orland Park?
There are 103.78 Males per 100 Females in Orland Park.
What is the Ratio of Females per 100 Males in Orland Park?
There are 96.36 Females per 100 Males in Orland Park.
What is the Median Population Age in Orland Park?
Median Population Age in Orland Park is 46.6 Years.
What is the Average Family Size in Orland Park
Average Family Size in Orland Park is 3.1 People.
What is the Average Household Size in Orland Park
Average Household Size in Orland Park is 2.5 People.
How Large is the Labor Force in Orland Park?
There are 29,301 People in the Labor Forcein in Orland Park.
What is the Percentage of People in the Labor Force in Orland Park?
60.5% of People are in the Labor Force in Orland Park.
What is the Unemployment Rate in Orland Park?
Unemployment Rate in Orland Park is 4.5%.