Saybrook Manor, CT Map & Demographics
Saybrook Manor Map
Saybrook Manor Overview
$51,689
PER CAPITA INCOME
$94,875
AVG FAMILY INCOME
$110,526
AVG HOUSEHOLD INCOME
4.1%
WAGE / INCOME GAP [ % ]
95.9¢/ $1
WAGE / INCOME GAP [ $ ]
0.34
INEQUALITY / GINI INDEX
1,231
TOTAL POPULATION
496
MALE POPULATION
735
FEMALE POPULATION
67.48
MALES / 100 FEMALES
148.19
FEMALES / 100 MALES
52.5
MEDIAN AGE
2.9
AVG FAMILY SIZE
2.1
AVG HOUSEHOLD SIZE
781
LABOR FORCE [ PEOPLE ]
76.4%
PERCENT IN LABOR FORCE
4.2%
UNEMPLOYMENT RATE
Income in Saybrook Manor
Income Overview in Saybrook Manor
Per Capita Income in Saybrook Manor is $51,689, while median incomes of families and households are $94,875 and $110,526 respectively.
| Characteristic | Number | Measure |
| Per Capita Income | 1,231 | $51,689 |
| Median Family Income | 275 | $94,875 |
| Mean Family Income | 275 | $108,439 |
| Median Household Income | 578 | $110,526 |
| Mean Household Income | 578 | $111,243 |
| Income Deficit | 275 | $0 |
| Wage / Income Gap (%) | 1,231 | 4.10% |
| Wage / Income Gap ($) | 1,231 | 95.90¢ per $1 |
| Gini / Inequality Index | 1,231 | 0.34 |
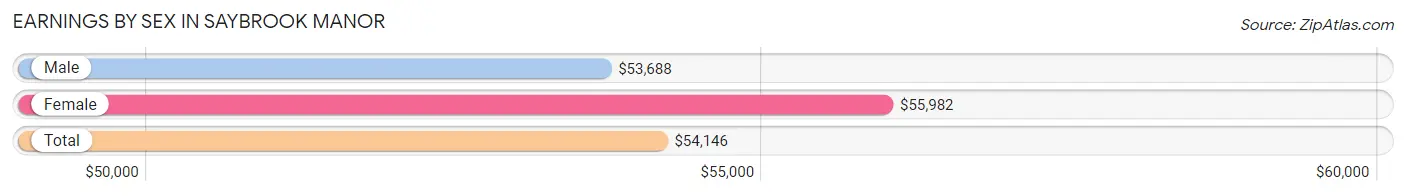
Earnings by Sex in Saybrook Manor
Average Earnings in Saybrook Manor are $54,146, $53,688 for men and $55,982 for women, a difference of 4.1%.
| Sex | Number | Average Earnings |
| Male | 403 (49.6%) | $53,688 |
| Female | 410 (50.4%) | $55,982 |
| Total | 813 (100.0%) | $54,146 |
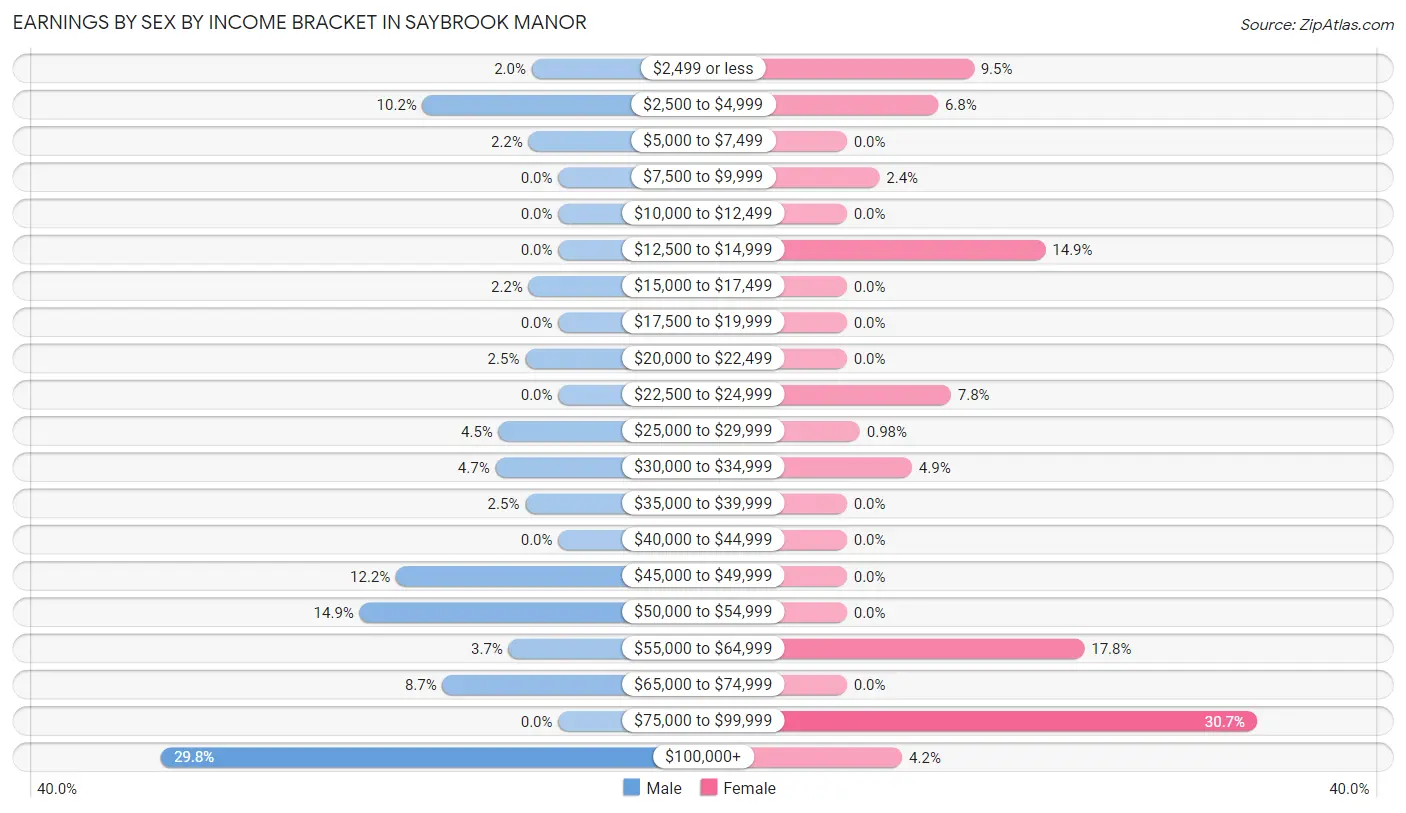
Earnings by Sex by Income Bracket in Saybrook Manor
The most common earnings brackets in Saybrook Manor are $100,000+ for men (120 | 29.8%) and $75,000 to $99,999 for women (126 | 30.7%).
| Income | Male | Female |
| $2,499 or less | 8 (2.0%) | 39 (9.5%) |
| $2,500 to $4,999 | 41 (10.2%) | 28 (6.8%) |
| $5,000 to $7,499 | 9 (2.2%) | 0 (0.0%) |
| $7,500 to $9,999 | 0 (0.0%) | 10 (2.4%) |
| $10,000 to $12,499 | 0 (0.0%) | 0 (0.0%) |
| $12,500 to $14,999 | 0 (0.0%) | 61 (14.9%) |
| $15,000 to $17,499 | 9 (2.2%) | 0 (0.0%) |
| $17,500 to $19,999 | 0 (0.0%) | 0 (0.0%) |
| $20,000 to $22,499 | 10 (2.5%) | 0 (0.0%) |
| $22,500 to $24,999 | 0 (0.0%) | 32 (7.8%) |
| $25,000 to $29,999 | 18 (4.5%) | 4 (1.0%) |
| $30,000 to $34,999 | 19 (4.7%) | 20 (4.9%) |
| $35,000 to $39,999 | 10 (2.5%) | 0 (0.0%) |
| $40,000 to $44,999 | 0 (0.0%) | 0 (0.0%) |
| $45,000 to $49,999 | 49 (12.2%) | 0 (0.0%) |
| $50,000 to $54,999 | 60 (14.9%) | 0 (0.0%) |
| $55,000 to $64,999 | 15 (3.7%) | 73 (17.8%) |
| $65,000 to $74,999 | 35 (8.7%) | 0 (0.0%) |
| $75,000 to $99,999 | 0 (0.0%) | 126 (30.7%) |
| $100,000+ | 120 (29.8%) | 17 (4.2%) |
| Total | 403 (100.0%) | 410 (100.0%) |
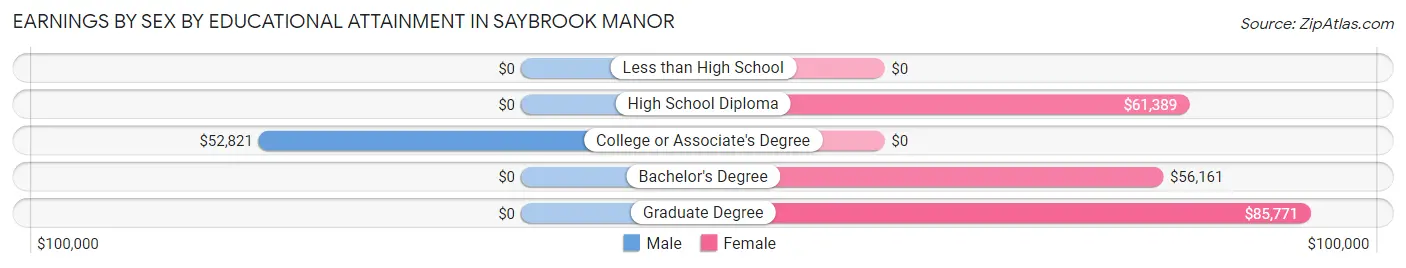
Earnings by Sex by Educational Attainment in Saybrook Manor
Average earnings in Saybrook Manor are $54,250 for men and $56,830 for women, a difference of 4.5%. Men with an educational attainment of college or associate's degree enjoy the highest average annual earnings of $52,821, while those with college or associate's degree education earn the least with $52,821. Women with an educational attainment of graduate degree earn the most with the average annual earnings of $85,771, while those with bachelor's degree education have the smallest earnings of $56,161.
| Educational Attainment | Male Income | Female Income |
| Less than High School | - | - |
| High School Diploma | - | - |
| College or Associate's Degree | $52,821 | $0 |
| Bachelor's Degree | - | - |
| Graduate Degree | - | - |
| Total | $54,250 | $56,830 |
Family Income in Saybrook Manor
Family Income Brackets in Saybrook Manor
According to the Saybrook Manor family income data, there are 88 families falling into the $50,000 to $74,999 income range, which is the most common income bracket and makes up 32.0% of all families.
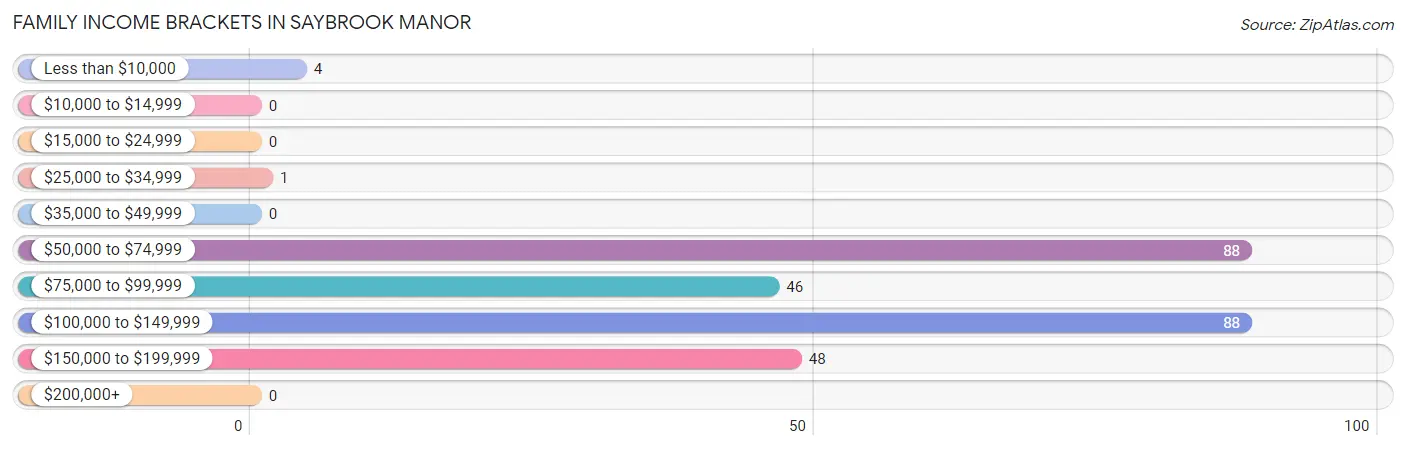
| Income Bracket | # Families | % Families |
| Less than $10,000 | 4 | 1.5% |
| $10,000 to $14,999 | 0 | 0.0% |
| $15,000 to $24,999 | 0 | 0.0% |
| $25,000 to $34,999 | 1 | 0.4% |
| $35,000 to $49,999 | 0 | 0.0% |
| $50,000 to $74,999 | 88 | 32.0% |
| $75,000 to $99,999 | 46 | 16.7% |
| $100,000 to $149,999 | 88 | 32.0% |
| $150,000 to $199,999 | 48 | 17.5% |
| $200,000+ | 0 | 0.0% |
Family Income by Famaliy Size in Saybrook Manor
2-person families (117 | 42.5%) account for the highest median family income in Saybrook Manor with $123,542 per family, while 2-person families (117 | 42.5%) have the highest median income of $61,771 per family member.
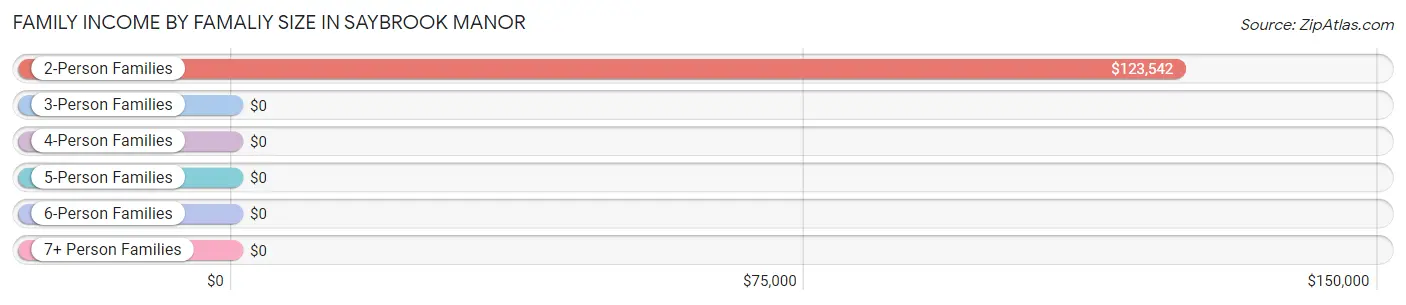
| Income Bracket | # Families | Median Income |
| 2-Person Families | 117 (42.5%) | $123,542 |
| 3-Person Families | 89 (32.4%) | $0 |
| 4-Person Families | 69 (25.1%) | $0 |
| 5-Person Families | 0 (0.0%) | $0 |
| 6-Person Families | 0 (0.0%) | $0 |
| 7+ Person Families | 0 (0.0%) | $0 |
| Total | 275 (100.0%) | $94,875 |
Family Income by Number of Earners in Saybrook Manor
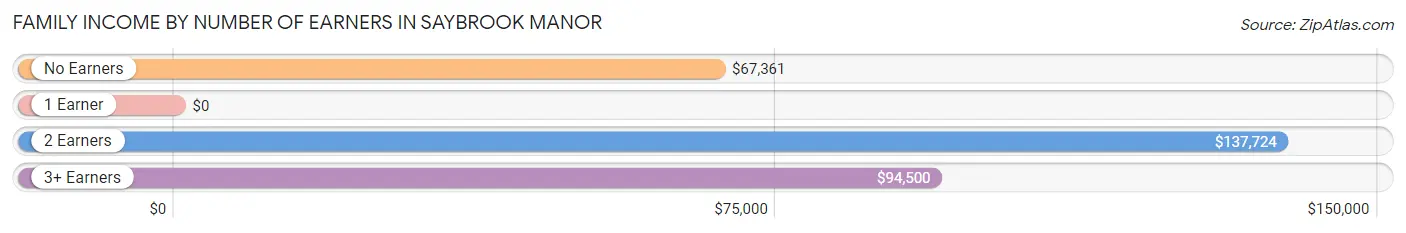
| Number of Earners | # Families | Median Income |
| No Earners | 45 (16.4%) | $67,361 |
| 1 Earner | 15 (5.4%) | $0 |
| 2 Earners | 167 (60.7%) | $137,724 |
| 3+ Earners | 48 (17.4%) | $94,500 |
| Total | 275 (100.0%) | $94,875 |
Household Income in Saybrook Manor
Household Income Brackets in Saybrook Manor
With 144 households falling in the category, the $100,000 to $149,999 income range is the most frequent in Saybrook Manor, accounting for 24.9% of all households.
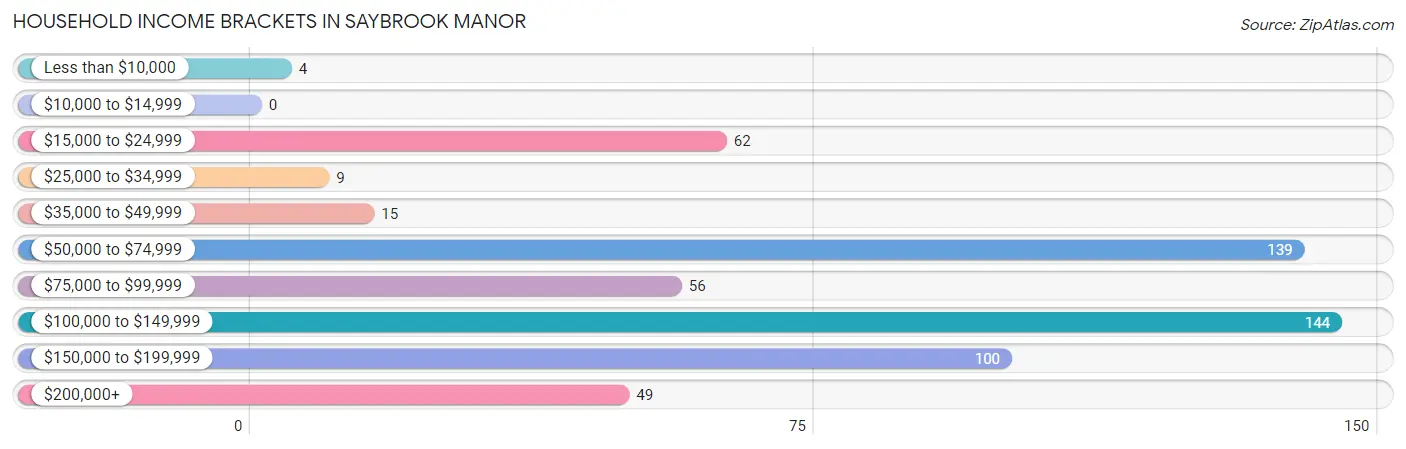
| Income Bracket | # Households | % Households |
| Less than $10,000 | 4 | 0.7% |
| $10,000 to $14,999 | 0 | 0.0% |
| $15,000 to $24,999 | 62 | 10.7% |
| $25,000 to $34,999 | 9 | 1.6% |
| $35,000 to $49,999 | 15 | 2.6% |
| $50,000 to $74,999 | 139 | 24.0% |
| $75,000 to $99,999 | 56 | 9.7% |
| $100,000 to $149,999 | 144 | 24.9% |
| $150,000 to $199,999 | 100 | 17.3% |
| $200,000+ | 49 | 8.5% |
Household Income by Householder Age in Saybrook Manor
The median household income in Saybrook Manor is $110,526, with the highest median household income of $133,795 found in the 45 to 64 years age bracket for the primary householder. A total of 261 households (45.2%) fall into this category.
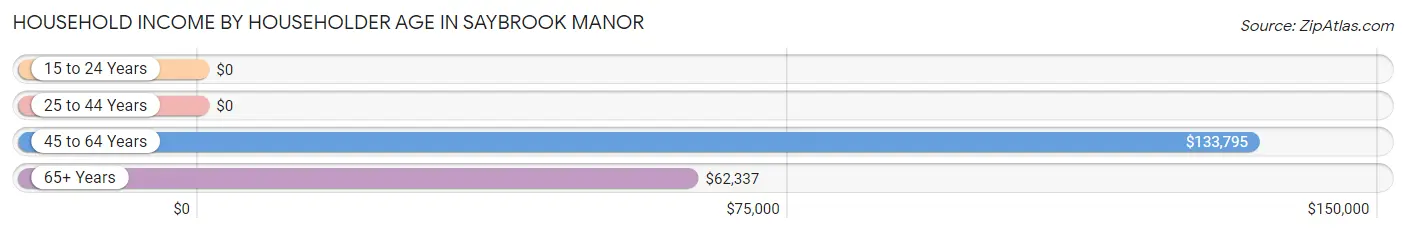
| Income Bracket | # Households | Median Income |
| 15 to 24 Years | 0 (0.0%) | $0 |
| 25 to 44 Years | 118 (20.4%) | $0 |
| 45 to 64 Years | 261 (45.2%) | $133,795 |
| 65+ Years | 199 (34.4%) | $62,337 |
| Total | 578 (100.0%) | $110,526 |
Poverty in Saybrook Manor
Income Below Poverty by Sex and Age in Saybrook Manor
With 0.8% poverty level for males and 0.1% for females among the residents of Saybrook Manor, 55 to 64 year old males and 65 to 74 year old females are the most vulnerable to poverty, with 4 males (2.5%) and 1 females (1.6%) in their respective age groups living below the poverty level.
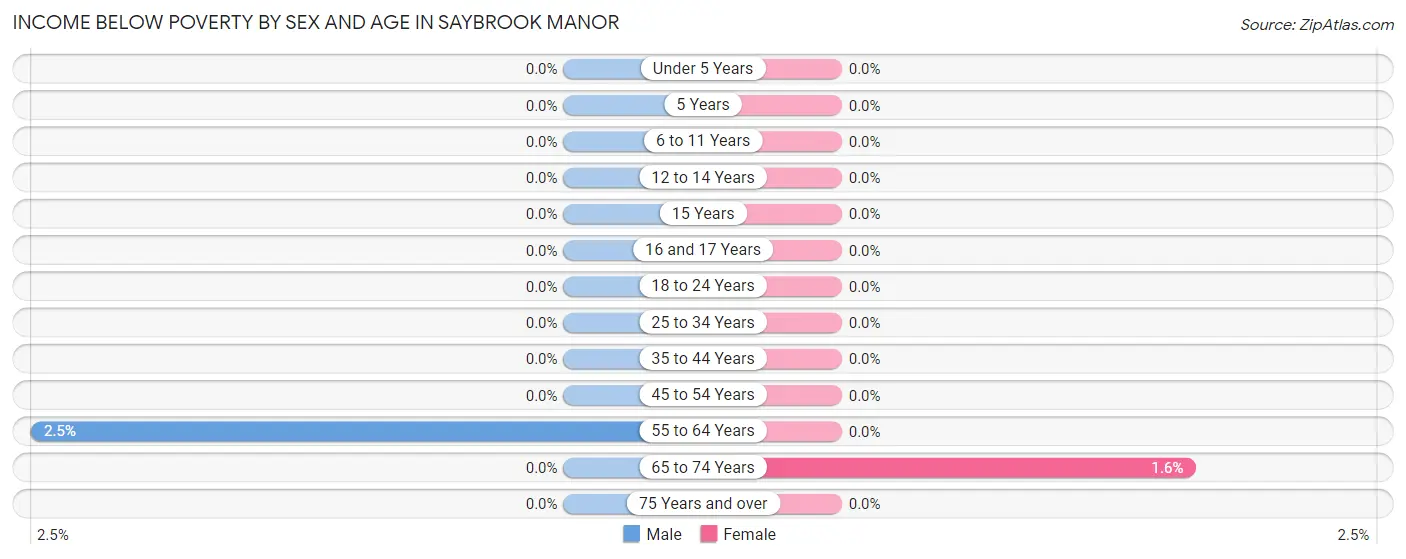
| Age Bracket | Male | Female |
| Under 5 Years | 0 (0.0%) | 0 (0.0%) |
| 5 Years | 0 (0.0%) | 0 (0.0%) |
| 6 to 11 Years | 0 (0.0%) | 0 (0.0%) |
| 12 to 14 Years | 0 (0.0%) | 0 (0.0%) |
| 15 Years | 0 (0.0%) | 0 (0.0%) |
| 16 and 17 Years | 0 (0.0%) | 0 (0.0%) |
| 18 to 24 Years | 0 (0.0%) | 0 (0.0%) |
| 25 to 34 Years | 0 (0.0%) | 0 (0.0%) |
| 35 to 44 Years | 0 (0.0%) | 0 (0.0%) |
| 45 to 54 Years | 0 (0.0%) | 0 (0.0%) |
| 55 to 64 Years | 4 (2.5%) | 0 (0.0%) |
| 65 to 74 Years | 0 (0.0%) | 1 (1.6%) |
| 75 Years and over | 0 (0.0%) | 0 (0.0%) |
| Total | 4 (0.8%) | 1 (0.1%) |
Income Above Poverty by Sex and Age in Saybrook Manor
According to the poverty statistics in Saybrook Manor, males aged 6 to 11 years and females aged 6 to 11 years are the age groups that are most secure financially, with 100.0% of males and 100.0% of females in these age groups living above the poverty line.
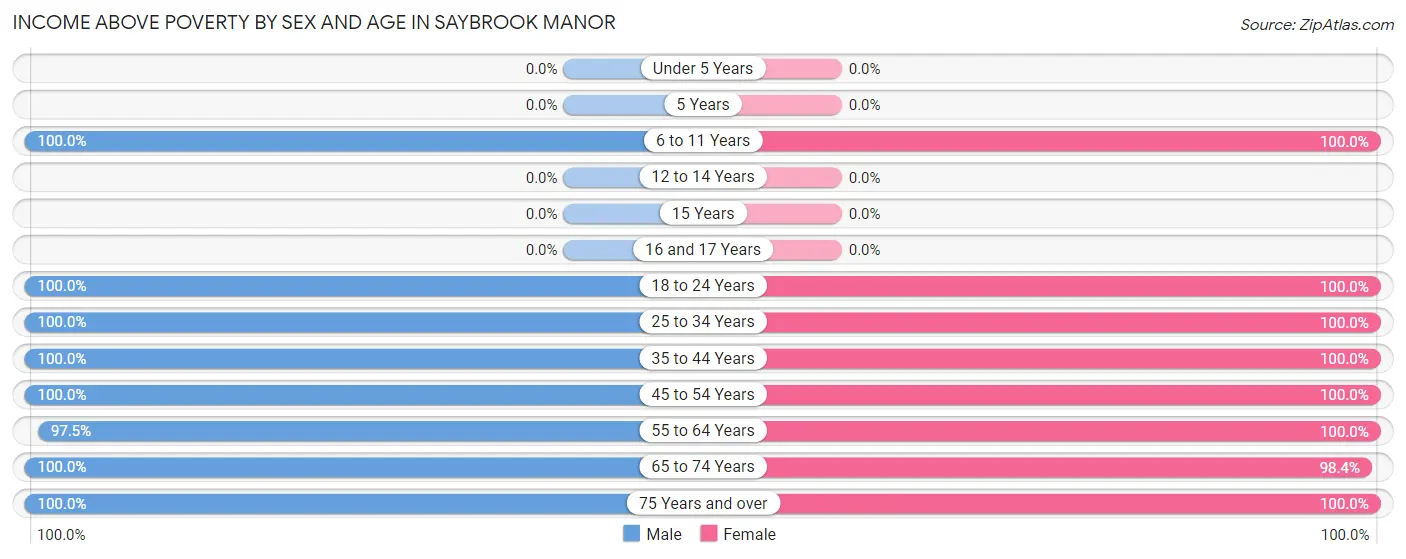
| Age Bracket | Male | Female |
| Under 5 Years | 0 (0.0%) | 0 (0.0%) |
| 5 Years | 0 (0.0%) | 0 (0.0%) |
| 6 to 11 Years | 21 (100.0%) | 188 (100.0%) |
| 12 to 14 Years | 0 (0.0%) | 0 (0.0%) |
| 15 Years | 0 (0.0%) | 0 (0.0%) |
| 16 and 17 Years | 0 (0.0%) | 0 (0.0%) |
| 18 to 24 Years | 27 (100.0%) | 19 (100.0%) |
| 25 to 34 Years | 17 (100.0%) | 8 (100.0%) |
| 35 to 44 Years | 98 (100.0%) | 108 (100.0%) |
| 45 to 54 Years | 69 (100.0%) | 86 (100.0%) |
| 55 to 64 Years | 158 (97.5%) | 173 (100.0%) |
| 65 to 74 Years | 65 (100.0%) | 60 (98.4%) |
| 75 Years and over | 37 (100.0%) | 92 (100.0%) |
| Total | 492 (99.2%) | 734 (99.9%) |
Income Below Poverty Among Married-Couple Families in Saybrook Manor
The poverty statistics for married-couple families in Saybrook Manor show that 1.6% or 4 of the total 245 families live below the poverty line. Families with no children have the highest poverty rate of 3.0%, comprising of 4 families. On the other hand, families with 1 or 2 children have the lowest poverty rate of 0.0%, which includes 0 families.
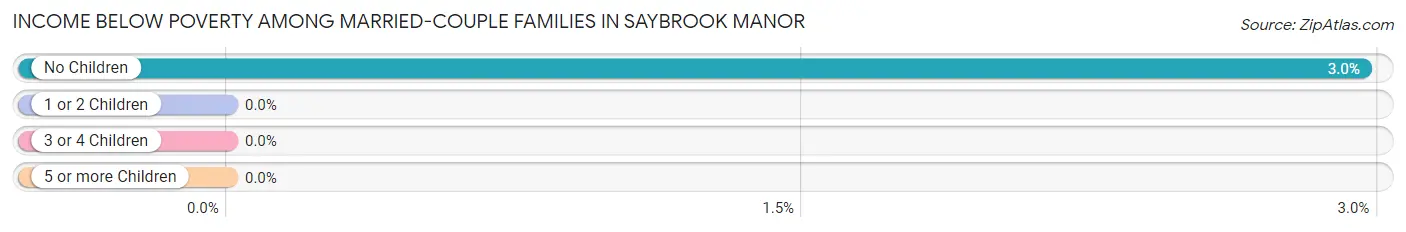
| Children | Above Poverty | Below Poverty |
| No Children | 131 (97.0%) | 4 (3.0%) |
| 1 or 2 Children | 110 (100.0%) | 0 (0.0%) |
| 3 or 4 Children | 0 (0.0%) | 0 (0.0%) |
| 5 or more Children | 0 (0.0%) | 0 (0.0%) |
| Total | 241 (98.4%) | 4 (1.6%) |
Income Below Poverty Among Single-Parent Households in Saybrook Manor
| Children | Single Father | Single Mother |
| No Children | 0 (0.0%) | 0 (0.0%) |
| 1 or 2 Children | 0 (0.0%) | 0 (0.0%) |
| 3 or 4 Children | 0 (0.0%) | 0 (0.0%) |
| 5 or more Children | 0 (0.0%) | 0 (0.0%) |
| Total | 0 (0.0%) | 0 (0.0%) |
Income Below Poverty Among Married-Couple vs Single-Parent Households in Saybrook Manor
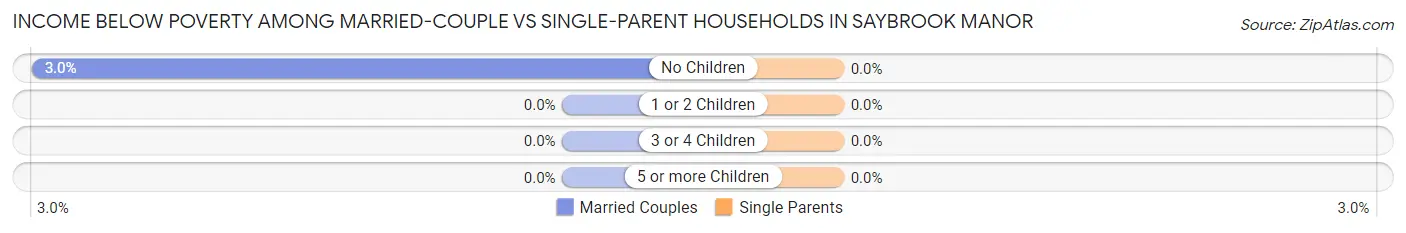
| Children | Married-Couple Families | Single-Parent Households |
| No Children | 4 (3.0%) | 0 (0.0%) |
| 1 or 2 Children | 0 (0.0%) | 0 (0.0%) |
| 3 or 4 Children | 0 (0.0%) | 0 (0.0%) |
| 5 or more Children | 0 (0.0%) | 0 (0.0%) |
| Total | 4 (1.6%) | 0 (0.0%) |
Race in Saybrook Manor
The most populous races in Saybrook Manor are White / Caucasian (1,107 | 89.9%), Hispanic or Latino (272 | 22.1%), and Native / Alaskan (106 | 8.6%).
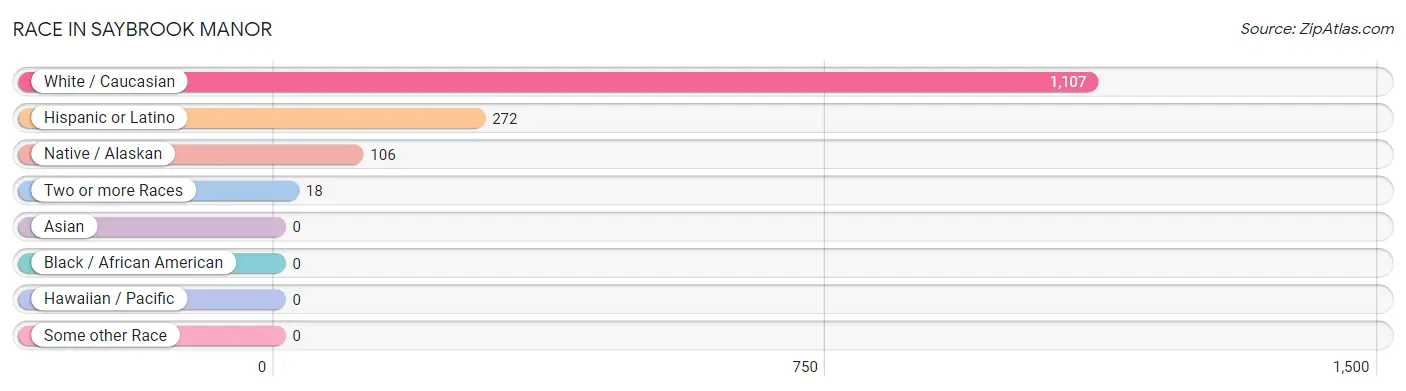
| Race | # Population | % Population |
| Asian | 0 | 0.0% |
| Black / African American | 0 | 0.0% |
| Hawaiian / Pacific | 0 | 0.0% |
| Hispanic or Latino | 272 | 22.1% |
| Native / Alaskan | 106 | 8.6% |
| White / Caucasian | 1,107 | 89.9% |
| Two or more Races | 18 | 1.5% |
| Some other Race | 0 | 0.0% |
| Total | 1,231 | 100.0% |
Ancestry in Saybrook Manor
The most populous ancestries reported in Saybrook Manor are Irish (430 | 34.9%), Italian (376 | 30.5%), Ecuadorian (259 | 21.0%), South American (259 | 21.0%), and German (153 | 12.4%), together accounting for 120.0% of all Saybrook Manor residents.
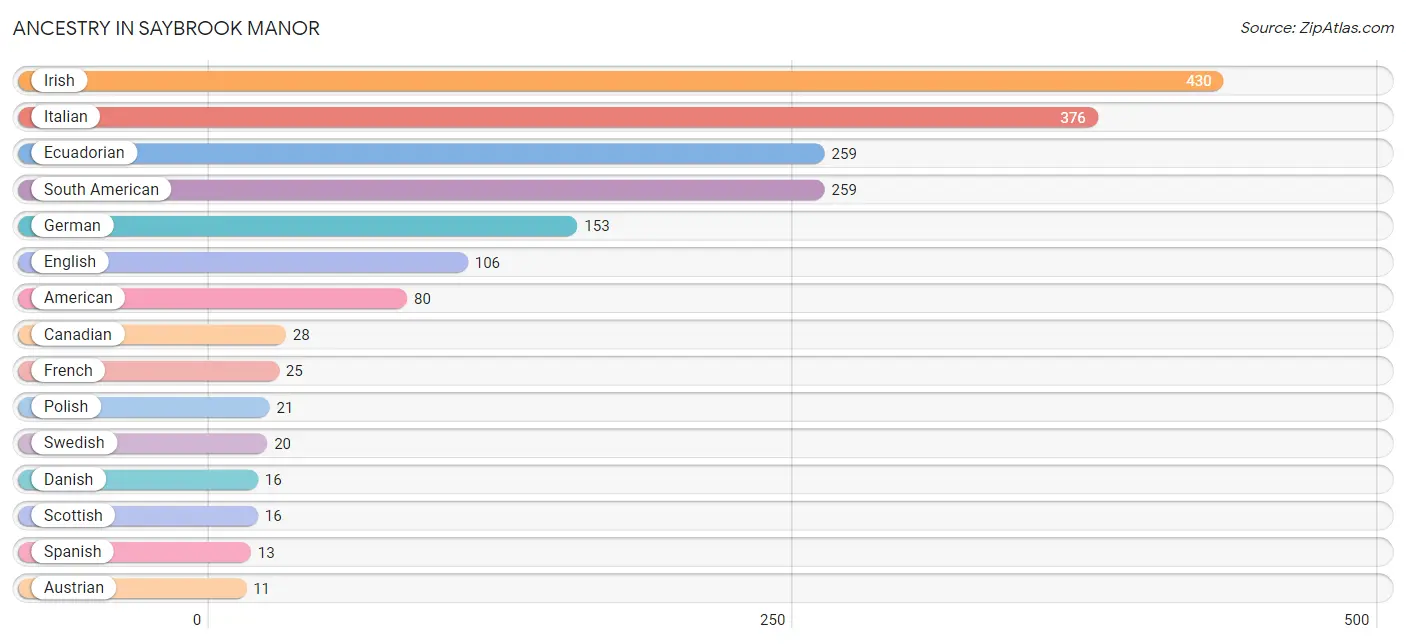
| Ancestry | # Population | % Population |
| American | 80 | 6.5% |
| Austrian | 11 | 0.9% |
| Canadian | 28 | 2.3% |
| Croatian | 8 | 0.6% |
| Danish | 16 | 1.3% |
| Ecuadorian | 259 | 21.0% |
| English | 106 | 8.6% |
| French | 25 | 2.0% |
| French Canadian | 9 | 0.7% |
| German | 153 | 12.4% |
| Greek | 10 | 0.8% |
| Irish | 430 | 34.9% |
| Italian | 376 | 30.5% |
| Lithuanian | 9 | 0.7% |
| Polish | 21 | 1.7% |
| Romanian | 5 | 0.4% |
| Russian | 9 | 0.7% |
| Scotch-Irish | 9 | 0.7% |
| Scottish | 16 | 1.3% |
| South American | 259 | 21.0% |
| Spanish | 13 | 1.1% |
| Swedish | 20 | 1.6% | View All 22 Rows |
Immigrants in Saybrook Manor
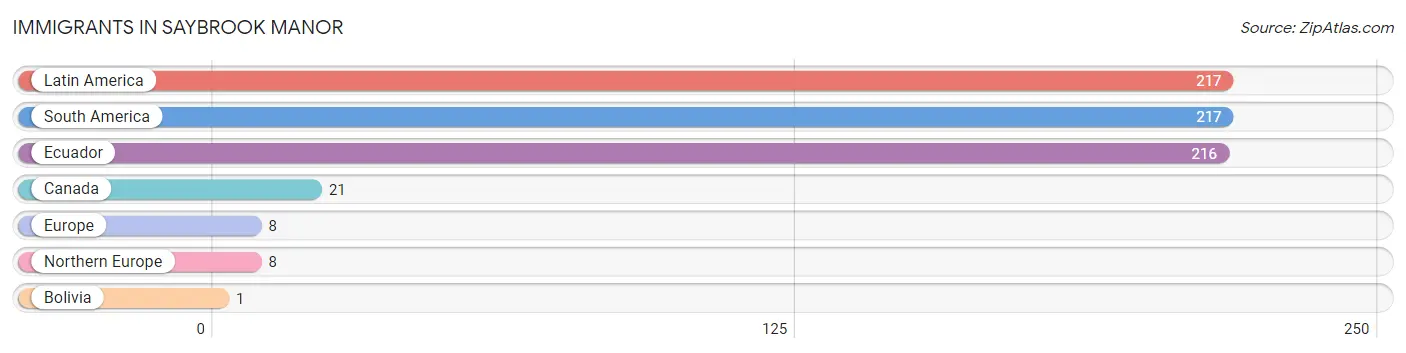
The most numerous immigrant groups reported in Saybrook Manor came from Latin America (217 | 17.6%), South America (217 | 17.6%), Ecuador (216 | 17.5%), Canada (21 | 1.7%), and Europe (8 | 0.6%), together accounting for 55.2% of all Saybrook Manor residents.
| Immigration Origin | # Population | % Population |
| Bolivia | 1 | 0.1% |
| Canada | 21 | 1.7% |
| Ecuador | 216 | 17.5% |
| Europe | 8 | 0.6% |
| Latin America | 217 | 17.6% |
| Northern Europe | 8 | 0.6% |
| South America | 217 | 17.6% | View All 7 Rows |
Sex and Age in Saybrook Manor
Sex and Age in Saybrook Manor
The most populous age groups in Saybrook Manor are 60 to 64 Years (101 | 20.4%) for men and 10 to 14 Years (135 | 18.4%) for women.
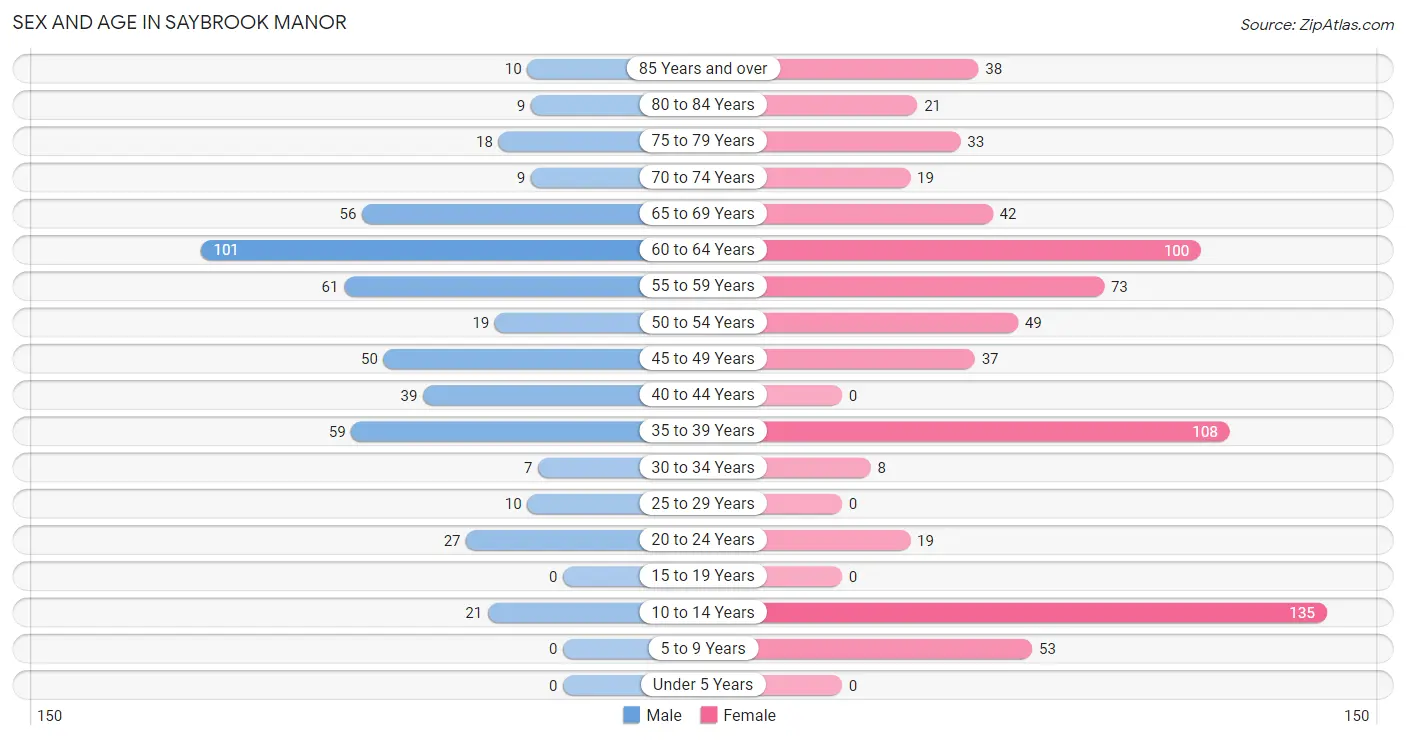
| Age Bracket | Male | Female |
| Under 5 Years | 0 (0.0%) | 0 (0.0%) |
| 5 to 9 Years | 0 (0.0%) | 53 (7.2%) |
| 10 to 14 Years | 21 (4.2%) | 135 (18.4%) |
| 15 to 19 Years | 0 (0.0%) | 0 (0.0%) |
| 20 to 24 Years | 27 (5.4%) | 19 (2.6%) |
| 25 to 29 Years | 10 (2.0%) | 0 (0.0%) |
| 30 to 34 Years | 7 (1.4%) | 8 (1.1%) |
| 35 to 39 Years | 59 (11.9%) | 108 (14.7%) |
| 40 to 44 Years | 39 (7.9%) | 0 (0.0%) |
| 45 to 49 Years | 50 (10.1%) | 37 (5.0%) |
| 50 to 54 Years | 19 (3.8%) | 49 (6.7%) |
| 55 to 59 Years | 61 (12.3%) | 73 (9.9%) |
| 60 to 64 Years | 101 (20.4%) | 100 (13.6%) |
| 65 to 69 Years | 56 (11.3%) | 42 (5.7%) |
| 70 to 74 Years | 9 (1.8%) | 19 (2.6%) |
| 75 to 79 Years | 18 (3.6%) | 33 (4.5%) |
| 80 to 84 Years | 9 (1.8%) | 21 (2.9%) |
| 85 Years and over | 10 (2.0%) | 38 (5.2%) |
| Total | 496 (100.0%) | 735 (100.0%) |
Families and Households in Saybrook Manor
Median Family Size in Saybrook Manor
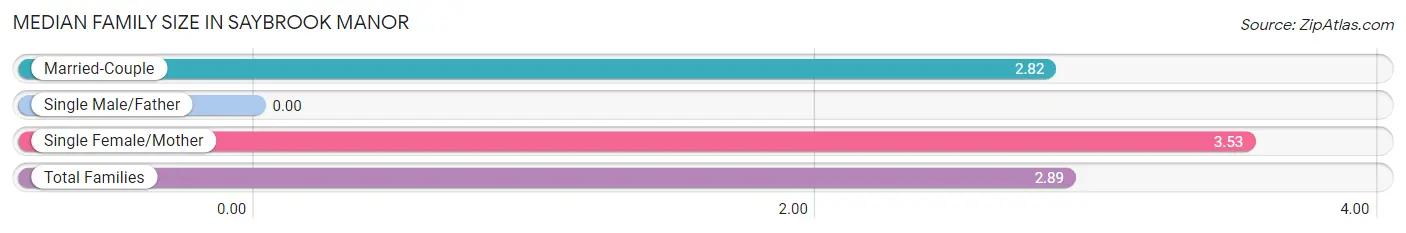
| Family Type | # Families | Family Size |
| Married-Couple | 245 (89.1%) | 2.82 |
| Single Male/Father | 0 (0.0%) | - |
| Single Female/Mother | 30 (10.9%) | 3.53 |
| Total Families | 275 (100.0%) | 2.89 |
Median Household Size in Saybrook Manor
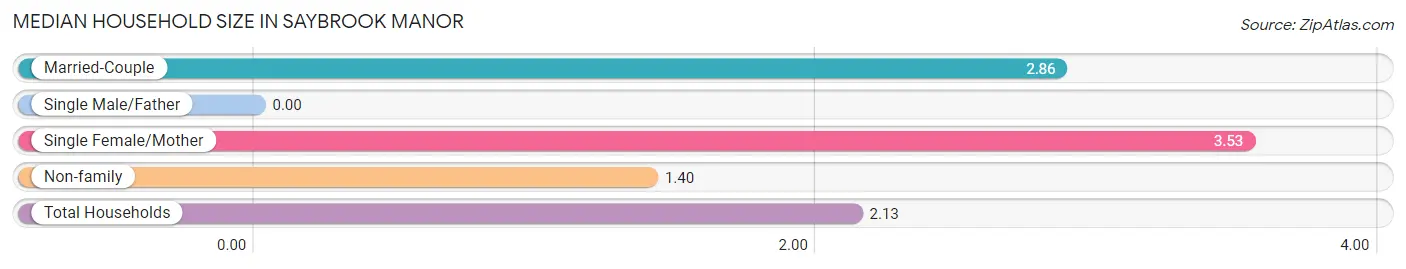
| Household Type | # Households | Household Size |
| Married-Couple | 245 (42.4%) | 2.86 |
| Single Male/Father | 0 (0.0%) | - |
| Single Female/Mother | 30 (5.2%) | 3.53 |
| Non-family | 303 (52.4%) | 1.40 |
| Total Households | 578 (100.0%) | 2.13 |
Household Size by Marriage Status in Saybrook Manor
Out of a total of 578 households in Saybrook Manor, 275 (47.6%) are family households, while 303 (52.4%) are nonfamily households. The most numerous type of family households are 2-person households, comprising 107, and the most common type of nonfamily households are 1-person households, comprising 173.
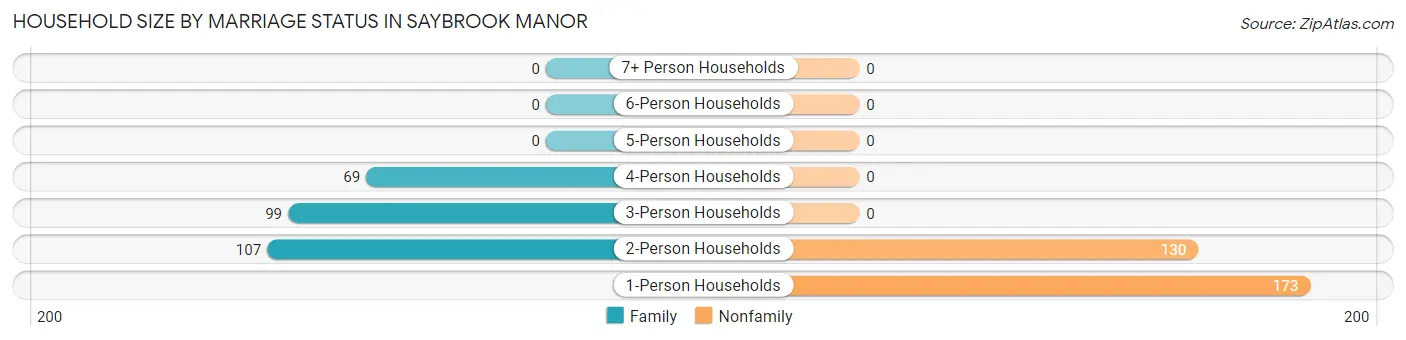
| Household Size | Family Households | Nonfamily Households |
| 1-Person Households | - | 173 (29.9%) |
| 2-Person Households | 107 (18.5%) | 130 (22.5%) |
| 3-Person Households | 99 (17.1%) | 0 (0.0%) |
| 4-Person Households | 69 (11.9%) | 0 (0.0%) |
| 5-Person Households | 0 (0.0%) | 0 (0.0%) |
| 6-Person Households | 0 (0.0%) | 0 (0.0%) |
| 7+ Person Households | 0 (0.0%) | 0 (0.0%) |
| Total | 275 (47.6%) | 303 (52.4%) |
Female Fertility in Saybrook Manor
Fertility by Age in Saybrook Manor
| Age Bracket | Women with Births | Births / 1,000 Women |
| 15 to 19 years | 0 (0.0%) | 0.0 |
| 20 to 34 years | 0 (0.0%) | 0.0 |
| 35 to 50 years | 0 (0.0%) | 0.0 |
| Total | 0 (0.0%) | 0.0 |
Fertility by Age by Marriage Status in Saybrook Manor
| Age Bracket | Married | Unmarried |
| 15 to 19 years | 0 (0.0%) | 0 (0.0%) |
| 20 to 34 years | 0 (0.0%) | 0 (0.0%) |
| 35 to 50 years | 0 (0.0%) | 0 (0.0%) |
| Total | 0 (0.0%) | 0 (0.0%) |
Fertility by Education in Saybrook Manor
| Educational Attainment | Women with Births | Births / 1,000 Women |
| Less than High School | 0 (0.0%) | 0.0 |
| High School Diploma | 0 (0.0%) | 0.0 |
| College or Associate's Degree | 0 (0.0%) | 0.0 |
| Bachelor's Degree | 0 (0.0%) | 0.0 |
| Graduate Degree | 0 (0.0%) | 0.0 |
| Total | 0 (0.0%) | 0.0 |
Fertility by Education by Marriage Status in Saybrook Manor
| Educational Attainment | Married | Unmarried |
| Less than High School | 0 (0.0%) | 0 (0.0%) |
| High School Diploma | 0 (0.0%) | 0 (0.0%) |
| College or Associate's Degree | 0 (0.0%) | 0 (0.0%) |
| Bachelor's Degree | 0 (0.0%) | 0 (0.0%) |
| Graduate Degree | 0 (0.0%) | 0 (0.0%) |
| Total | 0 (0.0%) | 0 (0.0%) |
Employment Characteristics in Saybrook Manor
Employment by Class of Employer in Saybrook Manor
Among the 748 employed individuals in Saybrook Manor, private company employees (502 | 67.1%), local government employees (101 | 13.5%), and self-employed (not incorporated) (51 | 6.8%) make up the most common classes of employment.
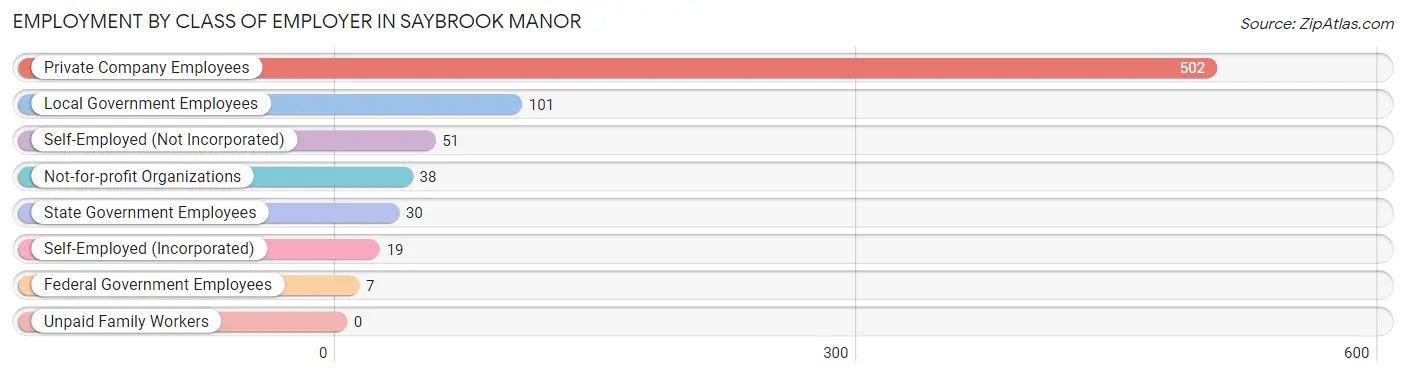
| Employer Class | # Employees | % Employees |
| Private Company Employees | 502 | 67.1% |
| Self-Employed (Incorporated) | 19 | 2.5% |
| Self-Employed (Not Incorporated) | 51 | 6.8% |
| Not-for-profit Organizations | 38 | 5.1% |
| Local Government Employees | 101 | 13.5% |
| State Government Employees | 30 | 4.0% |
| Federal Government Employees | 7 | 0.9% |
| Unpaid Family Workers | 0 | 0.0% |
| Total | 748 | 100.0% |
Employment Status by Age in Saybrook Manor
According to the labor force statistics for Saybrook Manor, out of the total population over 16 years of age (1,022), 76.4% or 781 individuals are in the labor force, with 4.2% or 33 of them unemployed. The age group with the highest labor force participation rate is 25 to 29 years, with 100.0% or 10 individuals in the labor force. Within the labor force, the 45 to 54 years age range has the highest percentage of unemployed individuals, with 11.6% or 18 of them being unemployed.
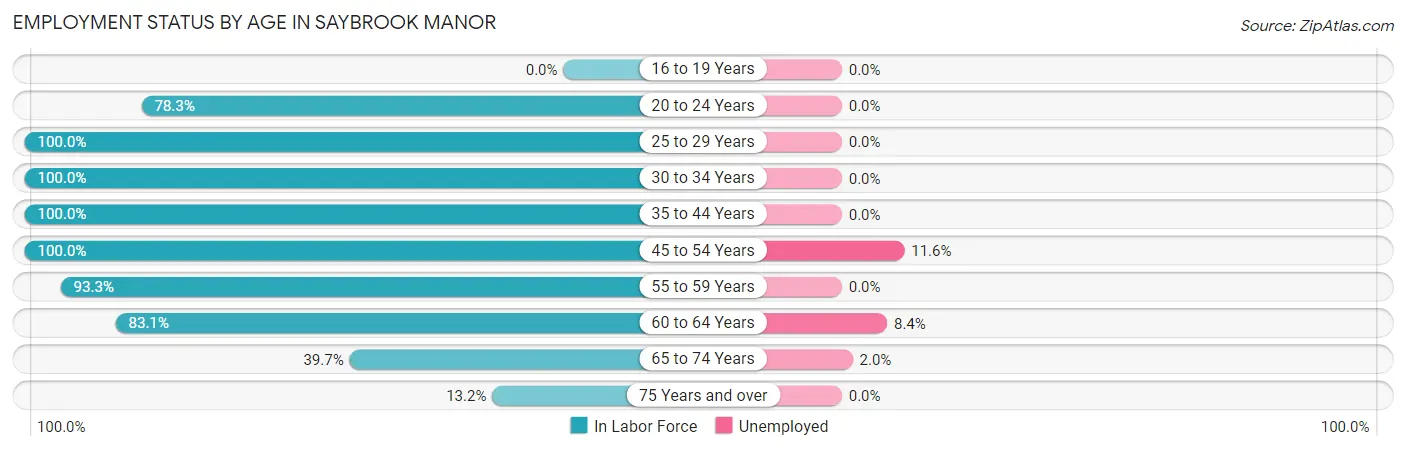
| Age Bracket | In Labor Force | Unemployed |
| 16 to 19 Years | 0 (0.0%) | 0 (0.0%) |
| 20 to 24 Years | 36 (78.3%) | 0 (0.0%) |
| 25 to 29 Years | 10 (100.0%) | 0 (0.0%) |
| 30 to 34 Years | 15 (100.0%) | 0 (0.0%) |
| 35 to 44 Years | 206 (100.0%) | 0 (0.0%) |
| 45 to 54 Years | 155 (100.0%) | 18 (11.6%) |
| 55 to 59 Years | 125 (93.3%) | 0 (0.0%) |
| 60 to 64 Years | 167 (83.1%) | 14 (8.4%) |
| 65 to 74 Years | 50 (39.7%) | 1 (2.0%) |
| 75 Years and over | 17 (13.2%) | 0 (0.0%) |
| Total | 781 (76.4%) | 33 (4.2%) |
Employment Status by Educational Attainment in Saybrook Manor
According to labor force statistics for Saybrook Manor, 94.0% of individuals (678) out of the total population between 25 and 64 years of age (721) are in the labor force, with 4.7% or 32 of them being unemployed. The group with the highest labor force participation rate are those with the educational attainment of high school diploma, with 100.0% or 205 individuals in the labor force. Within the labor force, individuals with college / associate degree education have the highest percentage of unemployment, with 23.0% or 32 of them being unemployed.
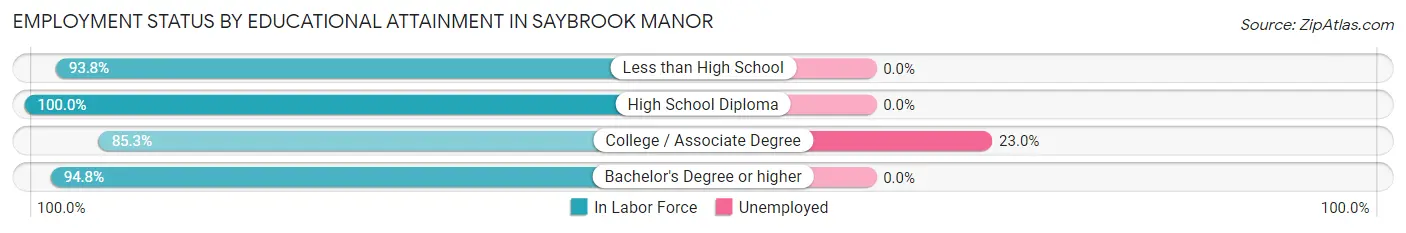
| Educational Attainment | In Labor Force | Unemployed |
| Less than High School | 61 (93.8%) | 0 (0.0%) |
| High School Diploma | 205 (100.0%) | 0 (0.0%) |
| College / Associate Degree | 139 (85.3%) | 37 (23.0%) |
| Bachelor's Degree or higher | 273 (94.8%) | 0 (0.0%) |
| Total | 678 (94.0%) | 34 (4.7%) |
Employment Occupations by Sex in Saybrook Manor
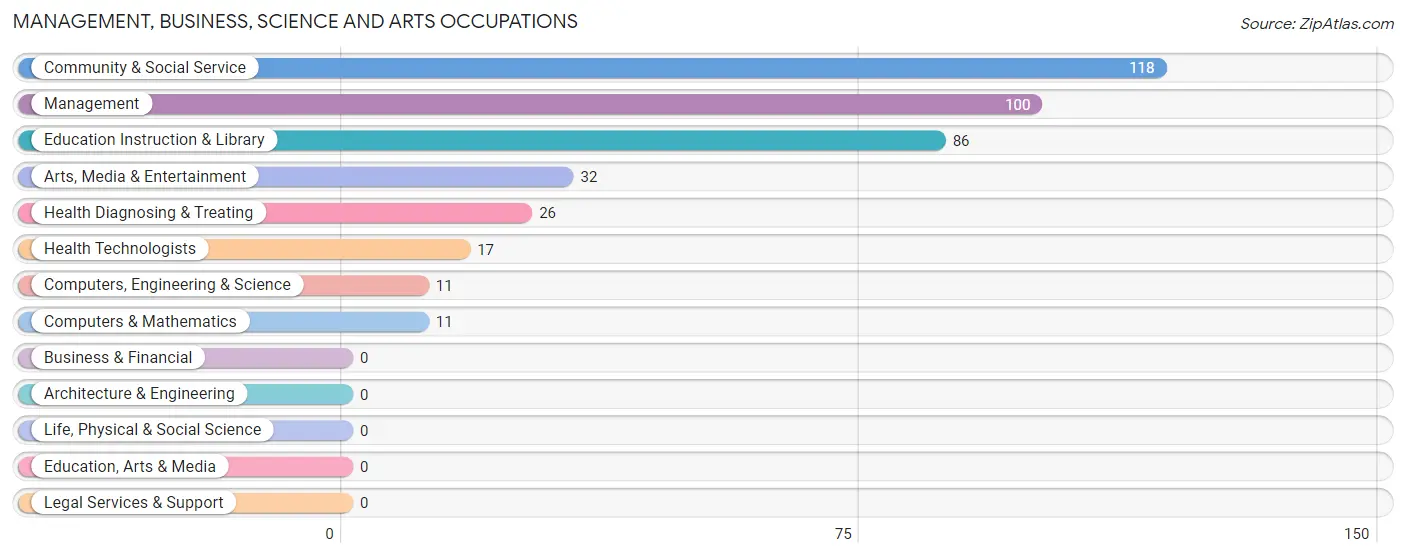
Management, Business, Science and Arts Occupations
The most common Management, Business, Science and Arts occupations in Saybrook Manor are Community & Social Service (118 | 15.8%), Management (100 | 13.4%), Education Instruction & Library (86 | 11.5%), Arts, Media & Entertainment (32 | 4.3%), and Health Diagnosing & Treating (26 | 3.5%).
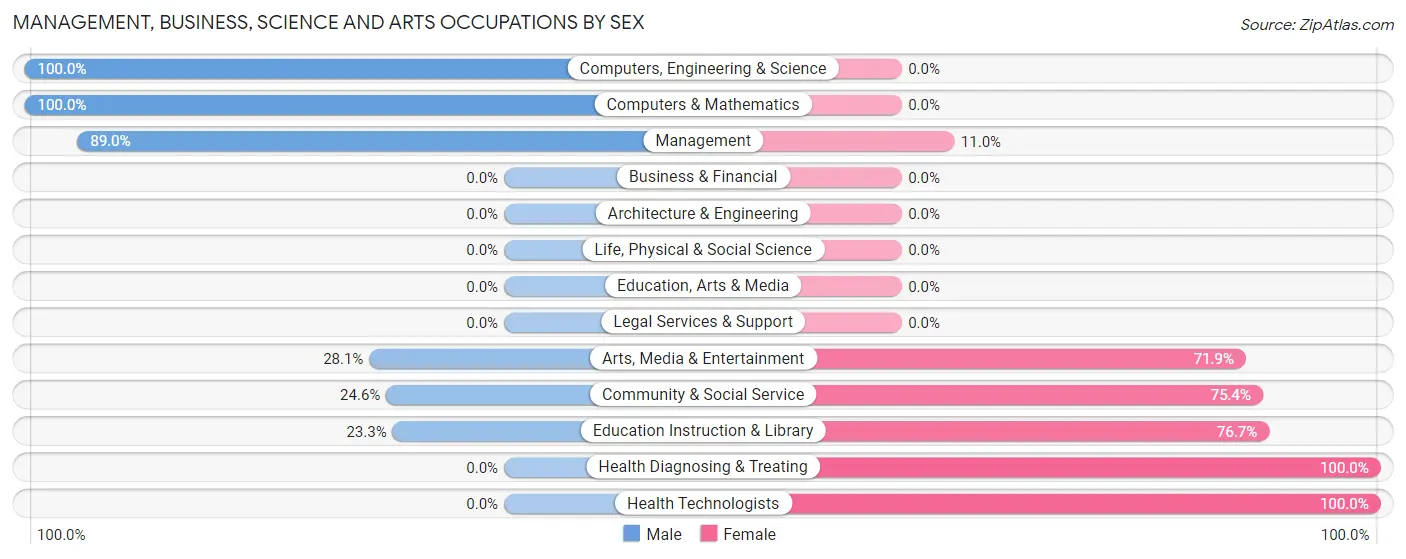
Management, Business, Science and Arts Occupations by Sex
Within the Management, Business, Science and Arts occupations in Saybrook Manor, the most male-oriented occupations are Computers, Engineering & Science (100.0%), Computers & Mathematics (100.0%), and Management (89.0%), while the most female-oriented occupations are Health Diagnosing & Treating (100.0%), Health Technologists (100.0%), and Education Instruction & Library (76.7%).
| Occupation | Male | Female |
| Management | 89 (89.0%) | 11 (11.0%) |
| Business & Financial | 0 (0.0%) | 0 (0.0%) |
| Computers, Engineering & Science | 11 (100.0%) | 0 (0.0%) |
| Computers & Mathematics | 11 (100.0%) | 0 (0.0%) |
| Architecture & Engineering | 0 (0.0%) | 0 (0.0%) |
| Life, Physical & Social Science | 0 (0.0%) | 0 (0.0%) |
| Community & Social Service | 29 (24.6%) | 89 (75.4%) |
| Education, Arts & Media | 0 (0.0%) | 0 (0.0%) |
| Legal Services & Support | 0 (0.0%) | 0 (0.0%) |
| Education Instruction & Library | 20 (23.3%) | 66 (76.7%) |
| Arts, Media & Entertainment | 9 (28.1%) | 23 (71.9%) |
| Health Diagnosing & Treating | 0 (0.0%) | 26 (100.0%) |
| Health Technologists | 0 (0.0%) | 17 (100.0%) |
| Total (Category) | 129 (50.6%) | 126 (49.4%) |
| Total (Overall) | 355 (47.5%) | 393 (52.5%) |
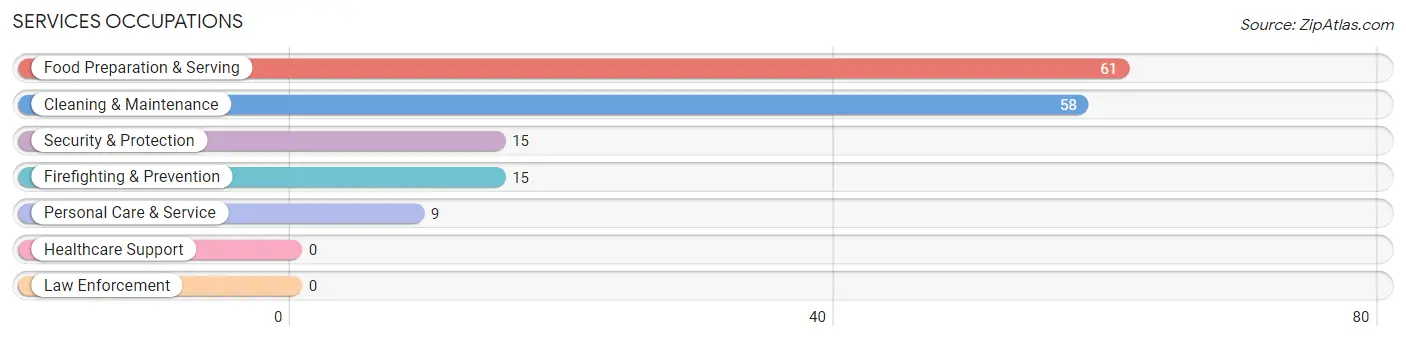
Services Occupations
The most common Services occupations in Saybrook Manor are Food Preparation & Serving (61 | 8.2%), Cleaning & Maintenance (58 | 7.7%), Security & Protection (15 | 2.0%), Firefighting & Prevention (15 | 2.0%), and Personal Care & Service (9 | 1.2%).
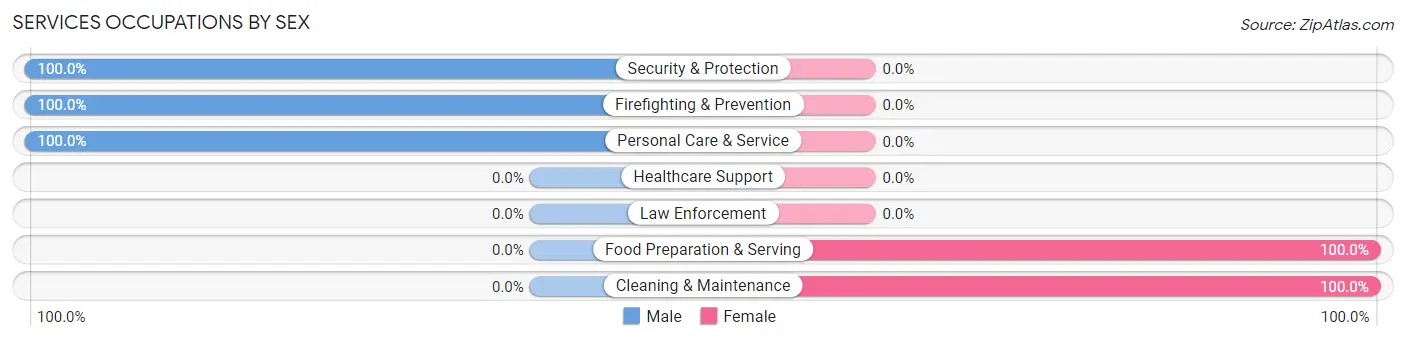
Services Occupations by Sex
Within the Services occupations in Saybrook Manor, the most male-oriented occupations are Security & Protection (100.0%), Firefighting & Prevention (100.0%), and Personal Care & Service (100.0%), while the most female-oriented occupations are Food Preparation & Serving (100.0%), and Cleaning & Maintenance (100.0%).
| Occupation | Male | Female |
| Healthcare Support | 0 (0.0%) | 0 (0.0%) |
| Security & Protection | 15 (100.0%) | 0 (0.0%) |
| Firefighting & Prevention | 15 (100.0%) | 0 (0.0%) |
| Law Enforcement | 0 (0.0%) | 0 (0.0%) |
| Food Preparation & Serving | 0 (0.0%) | 61 (100.0%) |
| Cleaning & Maintenance | 0 (0.0%) | 58 (100.0%) |
| Personal Care & Service | 9 (100.0%) | 0 (0.0%) |
| Total (Category) | 24 (16.8%) | 119 (83.2%) |
| Total (Overall) | 355 (47.5%) | 393 (52.5%) |
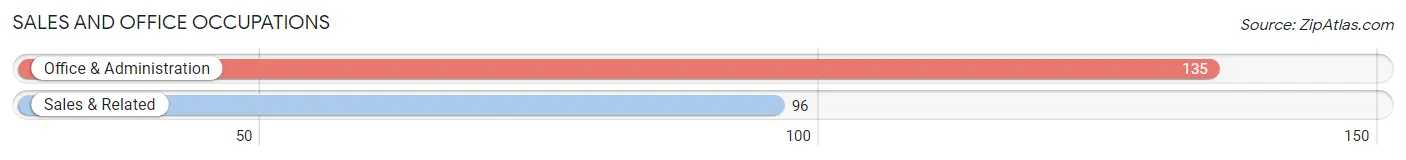
Sales and Office Occupations
The most common Sales and Office occupations in Saybrook Manor are Office & Administration (135 | 18.0%), and Sales & Related (96 | 12.8%).
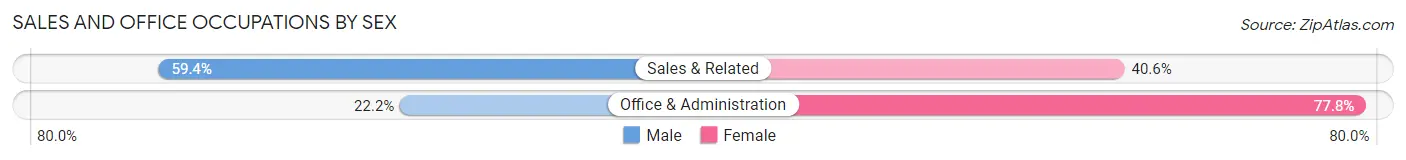
Sales and Office Occupations by Sex
| Occupation | Male | Female |
| Sales & Related | 57 (59.4%) | 39 (40.6%) |
| Office & Administration | 30 (22.2%) | 105 (77.8%) |
| Total (Category) | 87 (37.7%) | 144 (62.3%) |
| Total (Overall) | 355 (47.5%) | 393 (52.5%) |
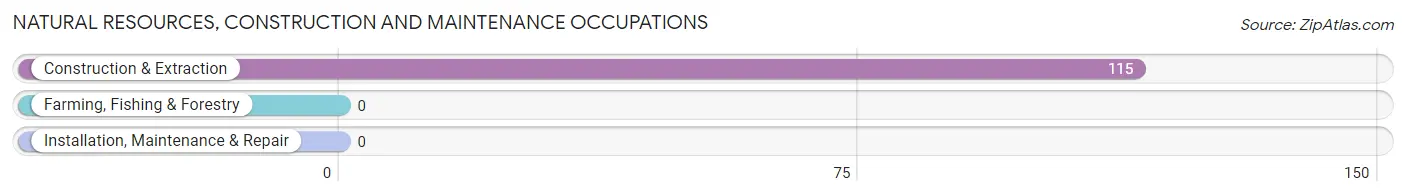
Natural Resources, Construction and Maintenance Occupations
The most common Natural Resources, Construction and Maintenance occupations in Saybrook Manor are , and Construction & Extraction (115 | 15.4%).
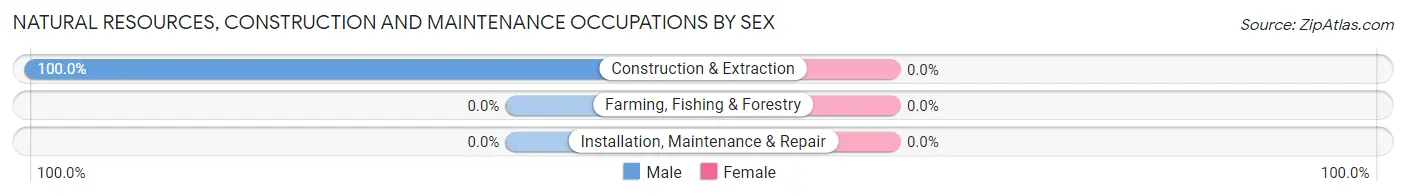
Natural Resources, Construction and Maintenance Occupations by Sex
| Occupation | Male | Female |
| Farming, Fishing & Forestry | 0 (0.0%) | 0 (0.0%) |
| Construction & Extraction | 115 (100.0%) | 0 (0.0%) |
| Installation, Maintenance & Repair | 0 (0.0%) | 0 (0.0%) |
| Total (Category) | 115 (100.0%) | 0 (0.0%) |
| Total (Overall) | 355 (47.5%) | 393 (52.5%) |
Production, Transportation and Moving Occupations
The most common Production, Transportation and Moving occupations in Saybrook Manor are , and Transportation (4 | 0.5%).
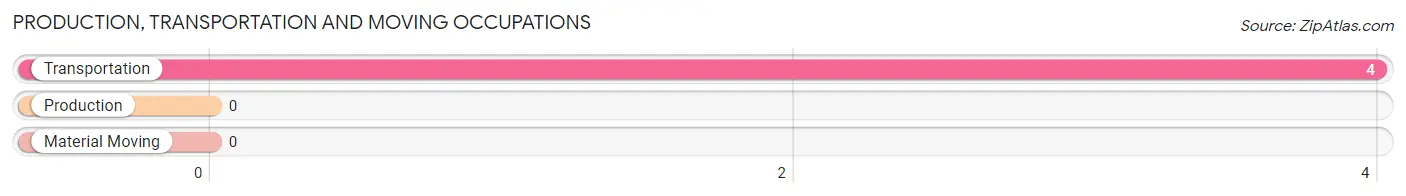
Production, Transportation and Moving Occupations by Sex
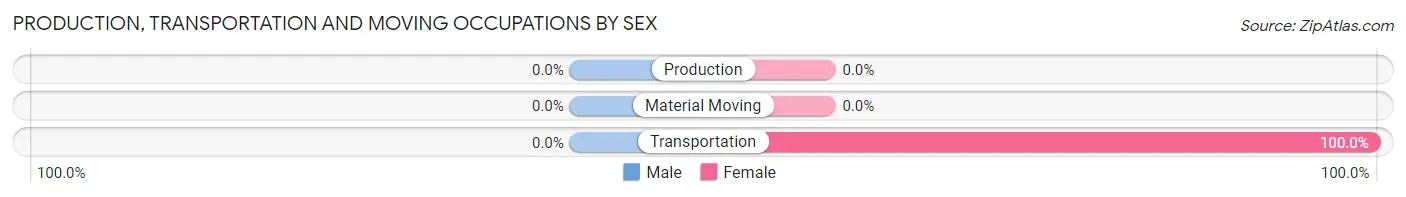
| Occupation | Male | Female |
| Production | 0 (0.0%) | 0 (0.0%) |
| Transportation | 0 (0.0%) | 4 (100.0%) |
| Material Moving | 0 (0.0%) | 0 (0.0%) |
| Total (Category) | 0 (0.0%) | 4 (100.0%) |
| Total (Overall) | 355 (47.5%) | 393 (52.5%) |
Employment Industries by Sex in Saybrook Manor
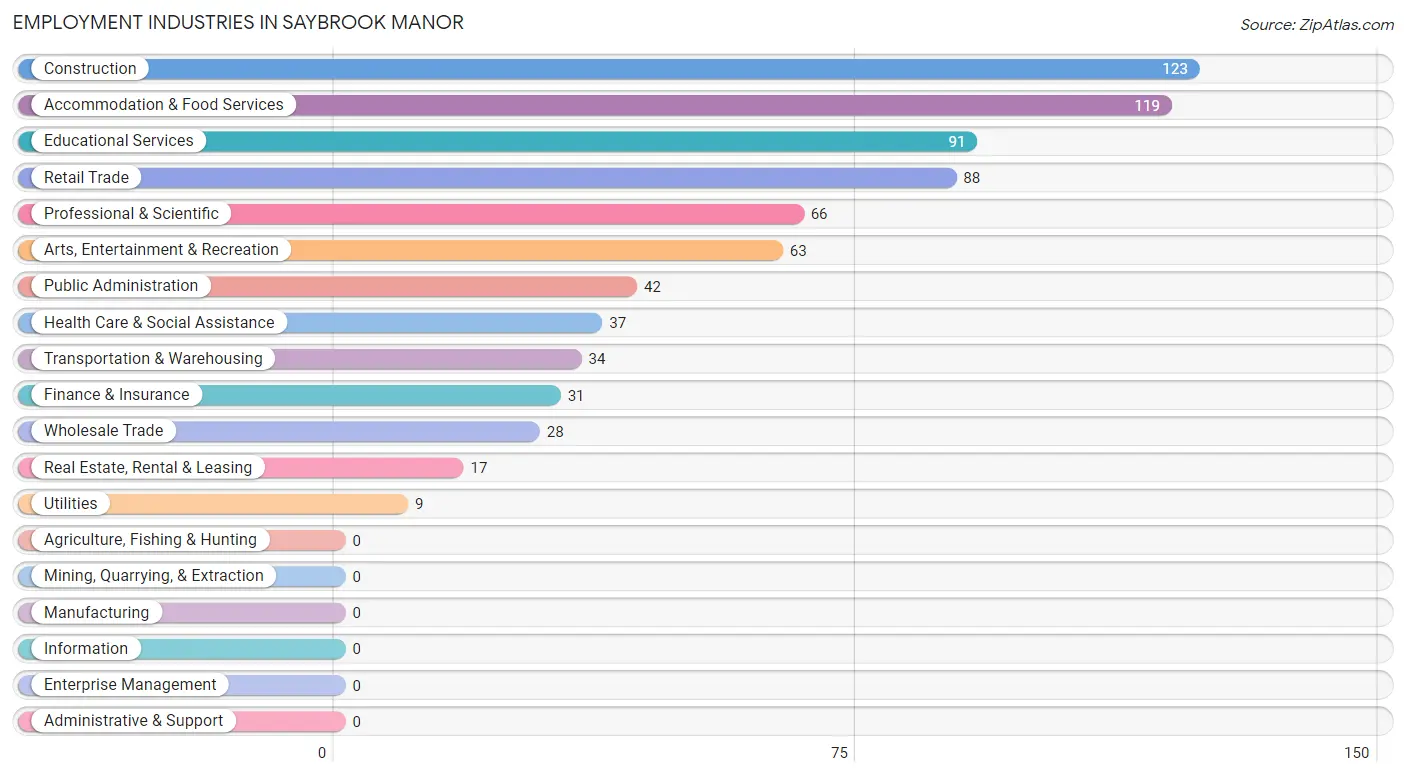
Employment Industries in Saybrook Manor
The major employment industries in Saybrook Manor include Construction (123 | 16.4%), Accommodation & Food Services (119 | 15.9%), Educational Services (91 | 12.2%), Retail Trade (88 | 11.8%), and Professional & Scientific (66 | 8.8%).
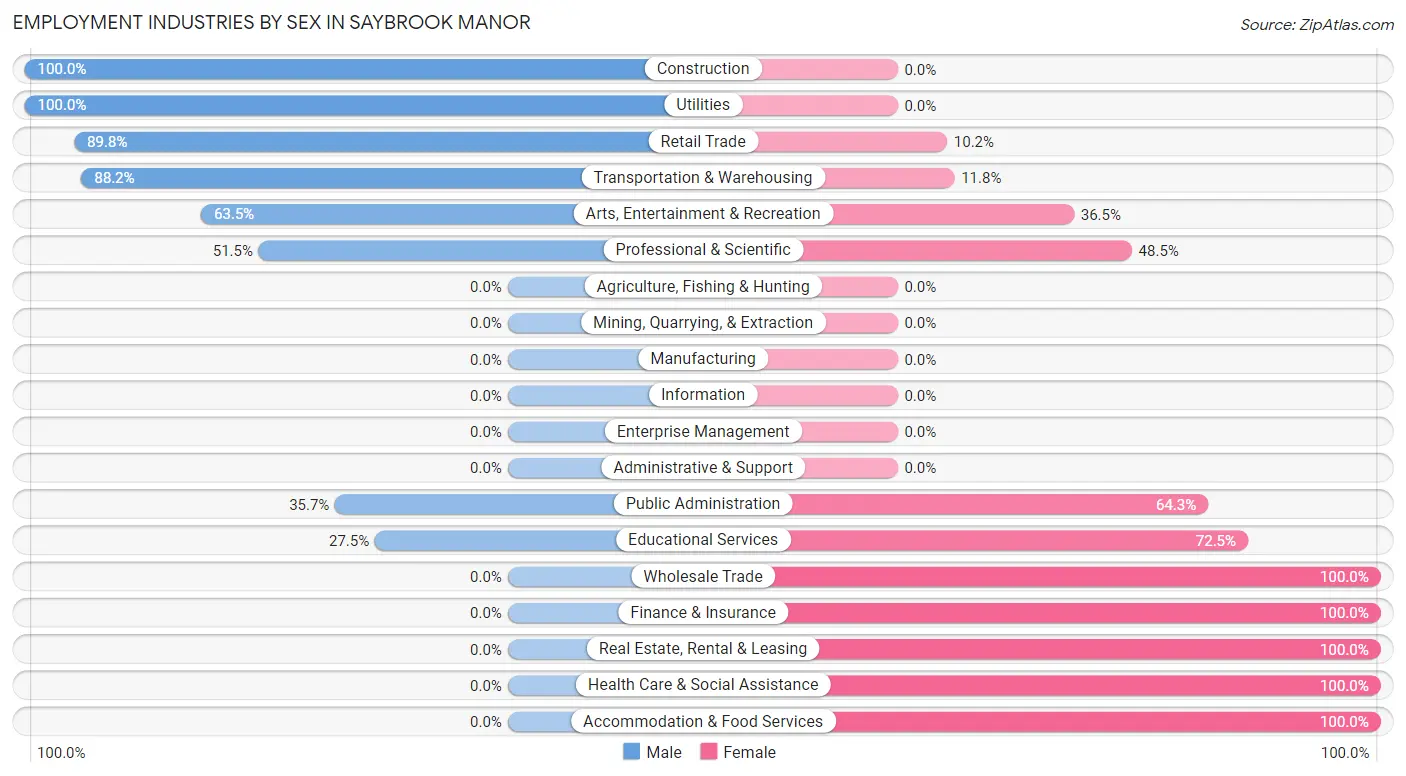
Employment Industries by Sex in Saybrook Manor
The Saybrook Manor industries that see more men than women are Construction (100.0%), Utilities (100.0%), and Retail Trade (89.8%), whereas the industries that tend to have a higher number of women are Wholesale Trade (100.0%), Finance & Insurance (100.0%), and Real Estate, Rental & Leasing (100.0%).
| Industry | Male | Female |
| Agriculture, Fishing & Hunting | 0 (0.0%) | 0 (0.0%) |
| Mining, Quarrying, & Extraction | 0 (0.0%) | 0 (0.0%) |
| Construction | 123 (100.0%) | 0 (0.0%) |
| Manufacturing | 0 (0.0%) | 0 (0.0%) |
| Wholesale Trade | 0 (0.0%) | 28 (100.0%) |
| Retail Trade | 79 (89.8%) | 9 (10.2%) |
| Transportation & Warehousing | 30 (88.2%) | 4 (11.8%) |
| Utilities | 9 (100.0%) | 0 (0.0%) |
| Information | 0 (0.0%) | 0 (0.0%) |
| Finance & Insurance | 0 (0.0%) | 31 (100.0%) |
| Real Estate, Rental & Leasing | 0 (0.0%) | 17 (100.0%) |
| Professional & Scientific | 34 (51.5%) | 32 (48.5%) |
| Enterprise Management | 0 (0.0%) | 0 (0.0%) |
| Administrative & Support | 0 (0.0%) | 0 (0.0%) |
| Educational Services | 25 (27.5%) | 66 (72.5%) |
| Health Care & Social Assistance | 0 (0.0%) | 37 (100.0%) |
| Arts, Entertainment & Recreation | 40 (63.5%) | 23 (36.5%) |
| Accommodation & Food Services | 0 (0.0%) | 119 (100.0%) |
| Public Administration | 15 (35.7%) | 27 (64.3%) |
| Total | 355 (47.5%) | 393 (52.5%) |
Education in Saybrook Manor
School Enrollment in Saybrook Manor
The most common levels of schooling among the 228 students in Saybrook Manor are middle school (156 | 68.4%), elementary school (53 | 23.3%), and college / undergraduate (10 | 4.4%).
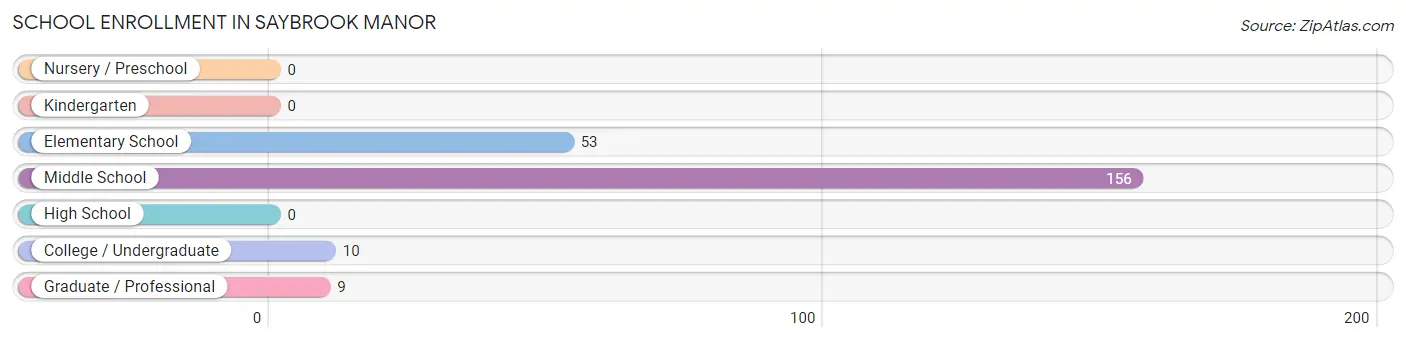
| School Level | # Students | % Students |
| Nursery / Preschool | 0 | 0.0% |
| Kindergarten | 0 | 0.0% |
| Elementary School | 53 | 23.3% |
| Middle School | 156 | 68.4% |
| High School | 0 | 0.0% |
| College / Undergraduate | 10 | 4.4% |
| Graduate / Professional | 9 | 4.0% |
| Total | 228 | 100.0% |
School Enrollment by Age by Funding Source in Saybrook Manor
Out of a total of 228 students who are enrolled in schools in Saybrook Manor, 9 (3.9%) attend a private institution, while the remaining 219 (96.1%) are enrolled in public schools. The age group of 20 to 24 year olds has the highest likelihood of being enrolled in private schools, with 9 (47.4% in the age bracket) enrolled. Conversely, the age group of 5 to 9 year old has the lowest likelihood of being enrolled in a private school, with 53 (100.0% in the age bracket) attending a public institution.
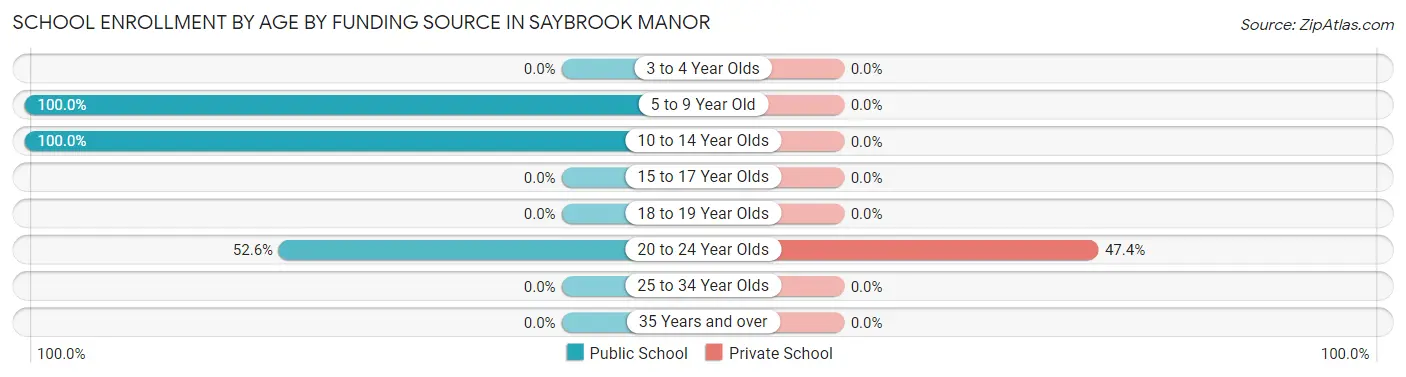
| Age Bracket | Public School | Private School |
| 3 to 4 Year Olds | 0 (0.0%) | 0 (0.0%) |
| 5 to 9 Year Old | 53 (100.0%) | 0 (0.0%) |
| 10 to 14 Year Olds | 156 (100.0%) | 0 (0.0%) |
| 15 to 17 Year Olds | 0 (0.0%) | 0 (0.0%) |
| 18 to 19 Year Olds | 0 (0.0%) | 0 (0.0%) |
| 20 to 24 Year Olds | 10 (52.6%) | 9 (47.4%) |
| 25 to 34 Year Olds | 0 (0.0%) | 0 (0.0%) |
| 35 Years and over | 0 (0.0%) | 0 (0.0%) |
| Total | 219 (96.1%) | 9 (3.9%) |
Educational Attainment by Field of Study in Saybrook Manor
Science & technology (84 | 18.6%), education (80 | 17.7%), liberal arts & history (55 | 12.2%), literature & languages (39 | 8.6%), and arts & humanities (32 | 7.1%) are the most common fields of study among 451 individuals in Saybrook Manor who have obtained a bachelor's degree or higher.
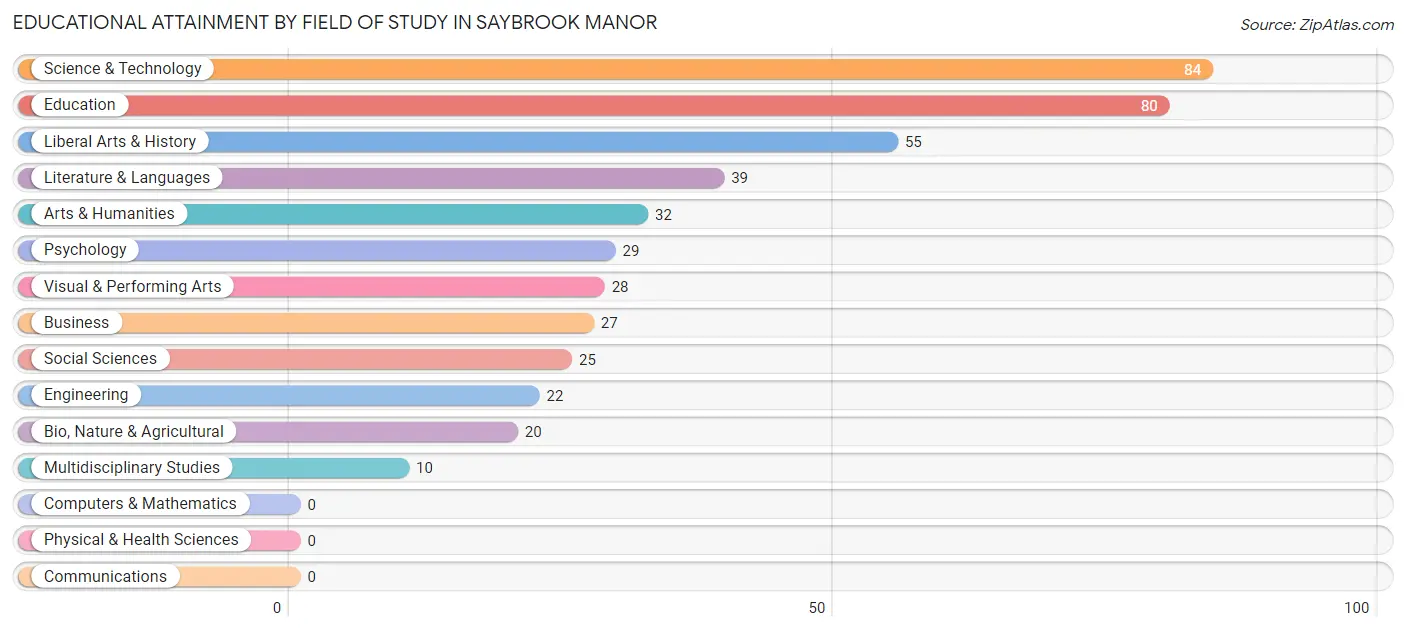
| Field of Study | # Graduates | % Graduates |
| Computers & Mathematics | 0 | 0.0% |
| Bio, Nature & Agricultural | 20 | 4.4% |
| Physical & Health Sciences | 0 | 0.0% |
| Psychology | 29 | 6.4% |
| Social Sciences | 25 | 5.5% |
| Engineering | 22 | 4.9% |
| Multidisciplinary Studies | 10 | 2.2% |
| Science & Technology | 84 | 18.6% |
| Business | 27 | 6.0% |
| Education | 80 | 17.7% |
| Literature & Languages | 39 | 8.6% |
| Liberal Arts & History | 55 | 12.2% |
| Visual & Performing Arts | 28 | 6.2% |
| Communications | 0 | 0.0% |
| Arts & Humanities | 32 | 7.1% |
| Total | 451 | 100.0% |
Transportation & Commute in Saybrook Manor
Vehicle Availability by Sex in Saybrook Manor
The most prevalent vehicle ownership categories in Saybrook Manor are males with 2 vehicles (177, accounting for 49.9%) and females with 2 vehicles (155, making up 45.0%).
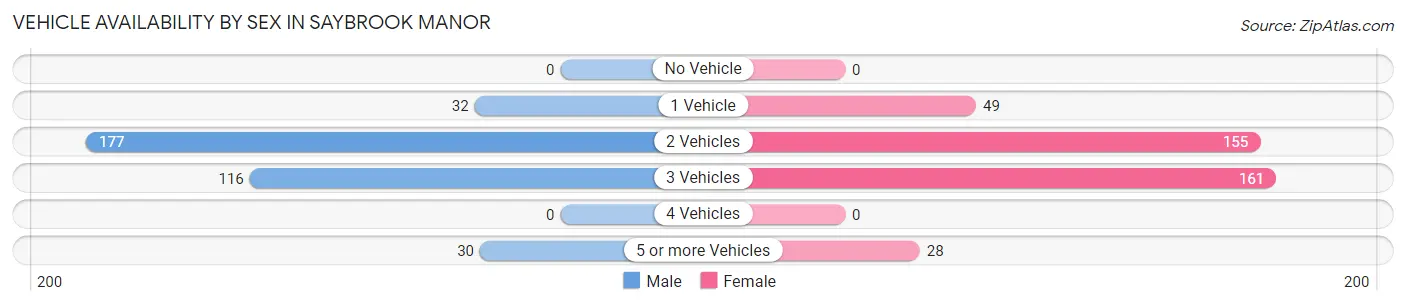
| Vehicles Available | Male | Female |
| No Vehicle | 0 (0.0%) | 0 (0.0%) |
| 1 Vehicle | 32 (9.0%) | 49 (12.5%) |
| 2 Vehicles | 177 (49.9%) | 155 (39.4%) |
| 3 Vehicles | 116 (32.7%) | 161 (41.0%) |
| 4 Vehicles | 0 (0.0%) | 0 (0.0%) |
| 5 or more Vehicles | 30 (8.5%) | 28 (7.1%) |
| Total | 355 (100.0%) | 393 (100.0%) |
Commute Time in Saybrook Manor
The most frequently occuring commute durations in Saybrook Manor are 5 to 9 minutes (126 commuters, 19.6%), 45 to 59 minutes (118 commuters, 18.4%), and 60 to 89 minutes (83 commuters, 12.9%).
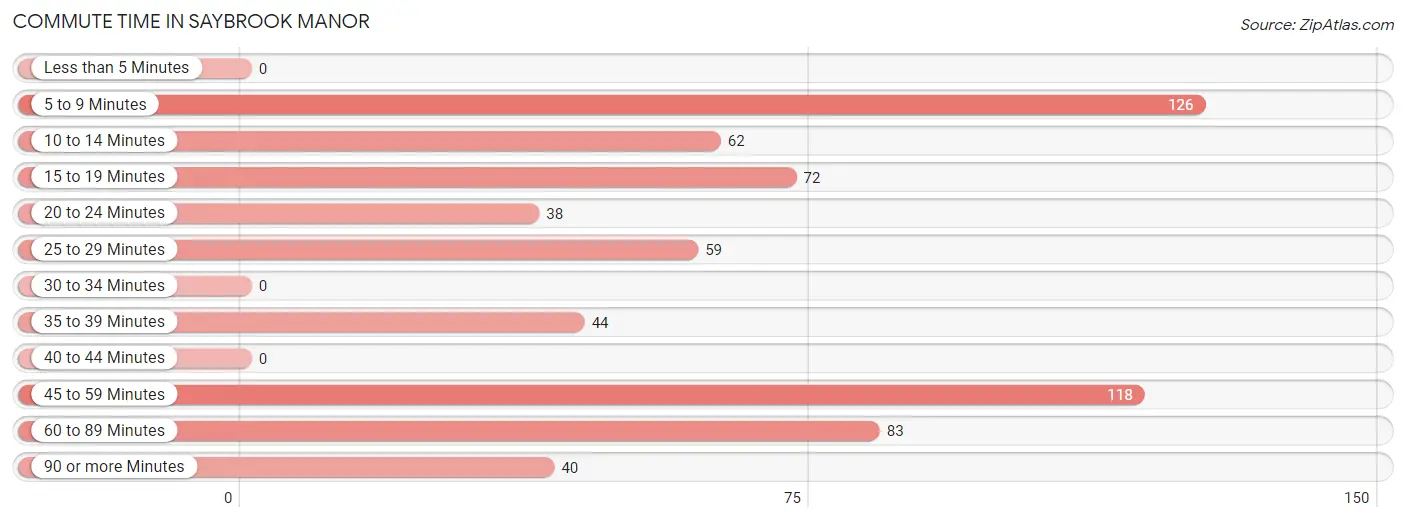
| Commute Time | # Commuters | % Commuters |
| Less than 5 Minutes | 0 | 0.0% |
| 5 to 9 Minutes | 126 | 19.6% |
| 10 to 14 Minutes | 62 | 9.7% |
| 15 to 19 Minutes | 72 | 11.2% |
| 20 to 24 Minutes | 38 | 5.9% |
| 25 to 29 Minutes | 59 | 9.2% |
| 30 to 34 Minutes | 0 | 0.0% |
| 35 to 39 Minutes | 44 | 6.9% |
| 40 to 44 Minutes | 0 | 0.0% |
| 45 to 59 Minutes | 118 | 18.4% |
| 60 to 89 Minutes | 83 | 12.9% |
| 90 or more Minutes | 40 | 6.2% |
Commute Time by Sex in Saybrook Manor
The most common commute times in Saybrook Manor are 60 to 89 minutes (83 commuters, 25.4%) for males and 5 to 9 minutes (87 commuters, 27.6%) for females.
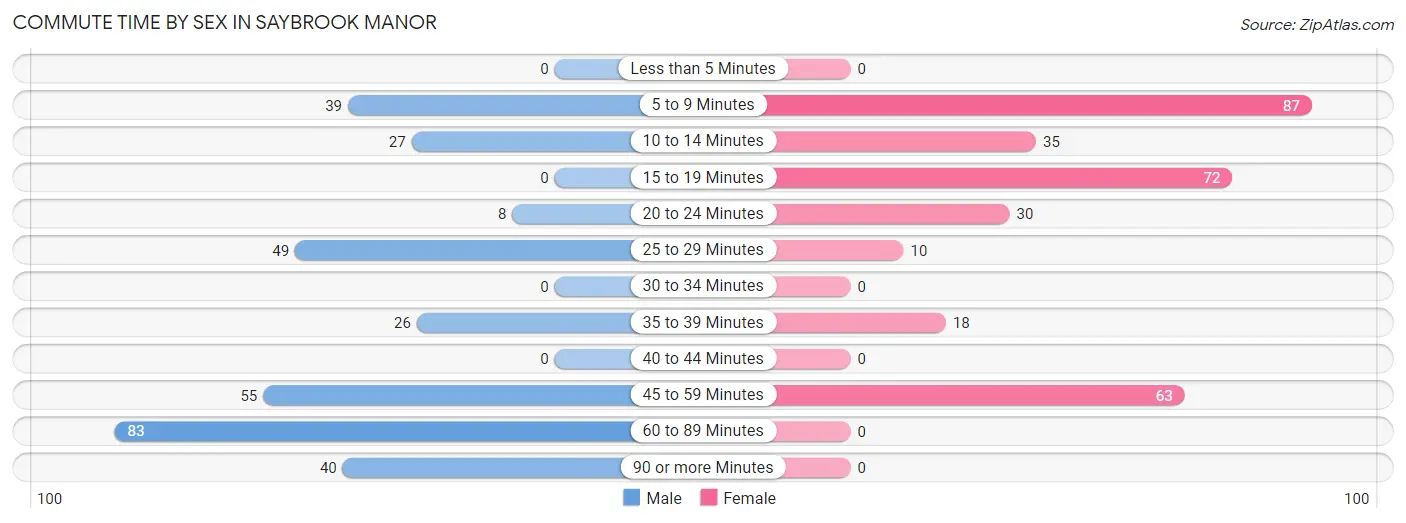
| Commute Time | Male | Female |
| Less than 5 Minutes | 0 (0.0%) | 0 (0.0%) |
| 5 to 9 Minutes | 39 (11.9%) | 87 (27.6%) |
| 10 to 14 Minutes | 27 (8.3%) | 35 (11.1%) |
| 15 to 19 Minutes | 0 (0.0%) | 72 (22.9%) |
| 20 to 24 Minutes | 8 (2.5%) | 30 (9.5%) |
| 25 to 29 Minutes | 49 (15.0%) | 10 (3.2%) |
| 30 to 34 Minutes | 0 (0.0%) | 0 (0.0%) |
| 35 to 39 Minutes | 26 (8.0%) | 18 (5.7%) |
| 40 to 44 Minutes | 0 (0.0%) | 0 (0.0%) |
| 45 to 59 Minutes | 55 (16.8%) | 63 (20.0%) |
| 60 to 89 Minutes | 83 (25.4%) | 0 (0.0%) |
| 90 or more Minutes | 40 (12.2%) | 0 (0.0%) |
Time of Departure to Work by Sex in Saybrook Manor
The most frequent times of departure to work in Saybrook Manor are 6:30 AM to 6:59 AM (110, 33.6%) for males and 7:00 AM to 7:29 AM (93, 29.5%) for females.
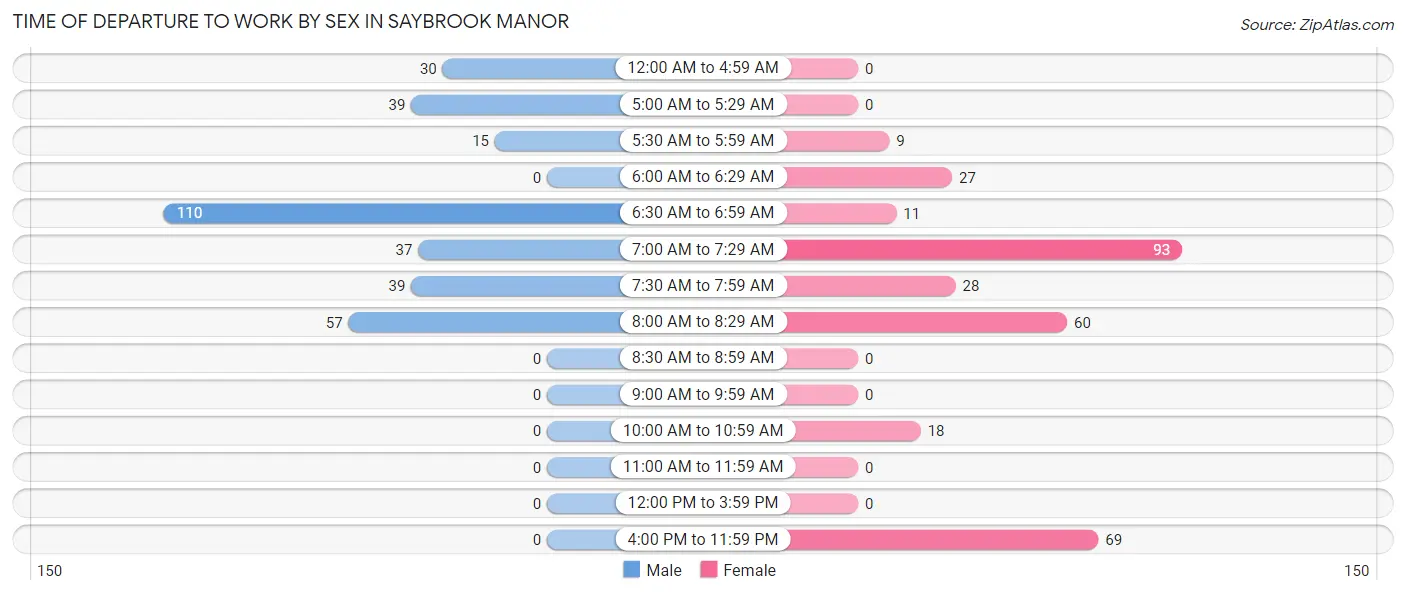
| Time of Departure | Male | Female |
| 12:00 AM to 4:59 AM | 30 (9.2%) | 0 (0.0%) |
| 5:00 AM to 5:29 AM | 39 (11.9%) | 0 (0.0%) |
| 5:30 AM to 5:59 AM | 15 (4.6%) | 9 (2.9%) |
| 6:00 AM to 6:29 AM | 0 (0.0%) | 27 (8.6%) |
| 6:30 AM to 6:59 AM | 110 (33.6%) | 11 (3.5%) |
| 7:00 AM to 7:29 AM | 37 (11.3%) | 93 (29.5%) |
| 7:30 AM to 7:59 AM | 39 (11.9%) | 28 (8.9%) |
| 8:00 AM to 8:29 AM | 57 (17.4%) | 60 (19.1%) |
| 8:30 AM to 8:59 AM | 0 (0.0%) | 0 (0.0%) |
| 9:00 AM to 9:59 AM | 0 (0.0%) | 0 (0.0%) |
| 10:00 AM to 10:59 AM | 0 (0.0%) | 18 (5.7%) |
| 11:00 AM to 11:59 AM | 0 (0.0%) | 0 (0.0%) |
| 12:00 PM to 3:59 PM | 0 (0.0%) | 0 (0.0%) |
| 4:00 PM to 11:59 PM | 0 (0.0%) | 69 (21.9%) |
| Total | 327 (100.0%) | 315 (100.0%) |
Housing Occupancy in Saybrook Manor
Occupancy by Ownership in Saybrook Manor
Of the total 578 dwellings in Saybrook Manor, owner-occupied units account for 452 (78.2%), while renter-occupied units make up 126 (21.8%).
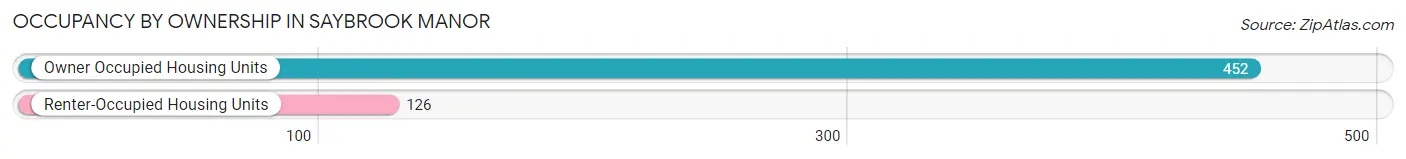
| Occupancy | # Housing Units | % Housing Units |
| Owner Occupied Housing Units | 452 | 78.2% |
| Renter-Occupied Housing Units | 126 | 21.8% |
| Total Occupied Housing Units | 578 | 100.0% |
Occupancy by Household Size in Saybrook Manor
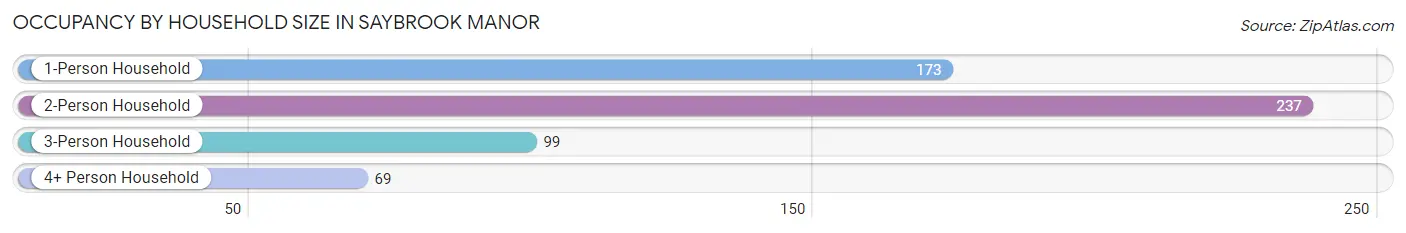
| Household Size | # Housing Units | % Housing Units |
| 1-Person Household | 173 | 29.9% |
| 2-Person Household | 237 | 41.0% |
| 3-Person Household | 99 | 17.1% |
| 4+ Person Household | 69 | 11.9% |
| Total Housing Units | 578 | 100.0% |
Occupancy by Ownership by Household Size in Saybrook Manor
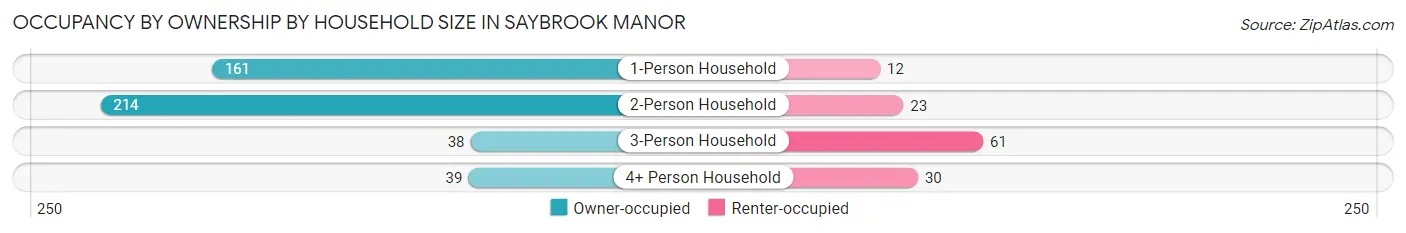
| Household Size | Owner-occupied | Renter-occupied |
| 1-Person Household | 161 (93.1%) | 12 (6.9%) |
| 2-Person Household | 214 (90.3%) | 23 (9.7%) |
| 3-Person Household | 38 (38.4%) | 61 (61.6%) |
| 4+ Person Household | 39 (56.5%) | 30 (43.5%) |
| Total Housing Units | 452 (78.2%) | 126 (21.8%) |
Occupancy by Educational Attainment in Saybrook Manor
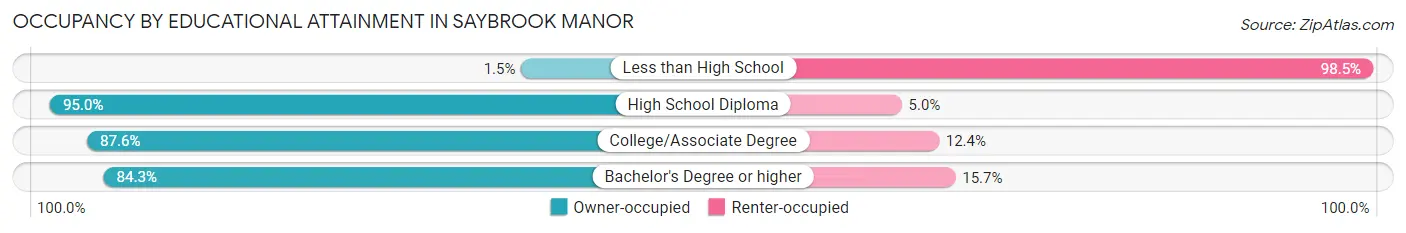
| Household Size | Owner-occupied | Renter-occupied |
| Less than High School | 1 (1.5%) | 65 (98.5%) |
| High School Diploma | 132 (95.0%) | 7 (5.0%) |
| College/Associate Degree | 120 (87.6%) | 17 (12.4%) |
| Bachelor's Degree or higher | 199 (84.3%) | 37 (15.7%) |
Occupancy by Age of Householder in Saybrook Manor
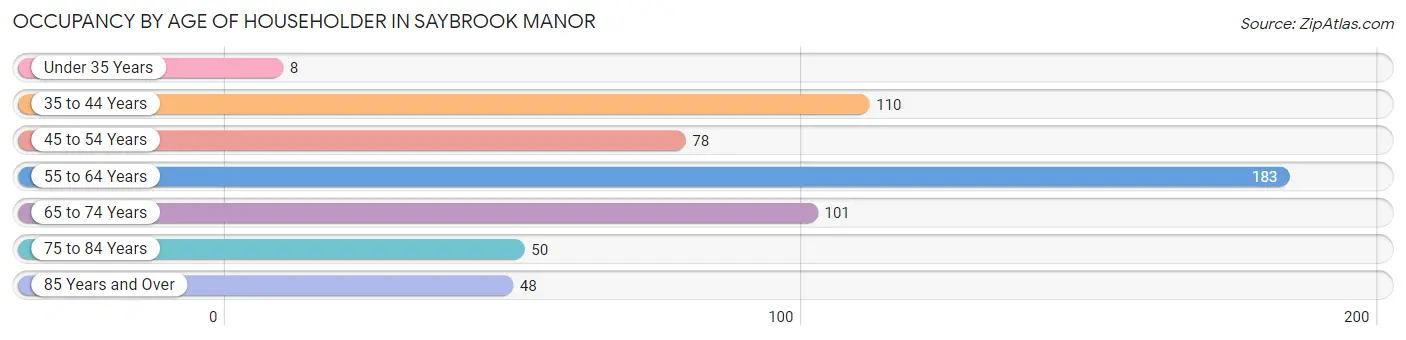
| Age Bracket | # Households | % Households |
| Under 35 Years | 8 | 1.4% |
| 35 to 44 Years | 110 | 19.0% |
| 45 to 54 Years | 78 | 13.5% |
| 55 to 64 Years | 183 | 31.7% |
| 65 to 74 Years | 101 | 17.5% |
| 75 to 84 Years | 50 | 8.6% |
| 85 Years and Over | 48 | 8.3% |
| Total | 578 | 100.0% |
Housing Finances in Saybrook Manor
Median Income by Occupancy in Saybrook Manor
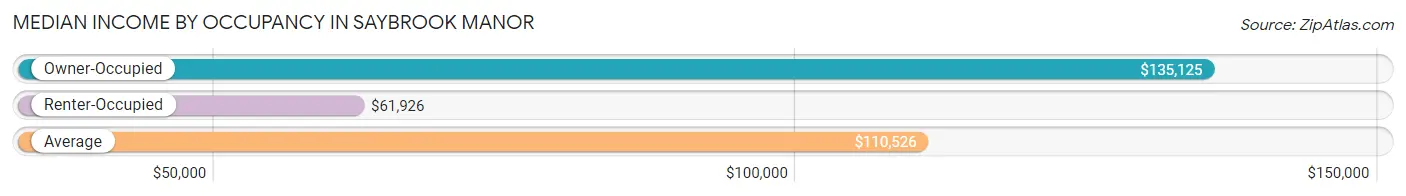
| Occupancy Type | # Households | Median Income |
| Owner-Occupied | 452 (78.2%) | $135,125 |
| Renter-Occupied | 126 (21.8%) | $61,926 |
| Average | 578 (100.0%) | $110,526 |
Occupancy by Householder Income Bracket in Saybrook Manor
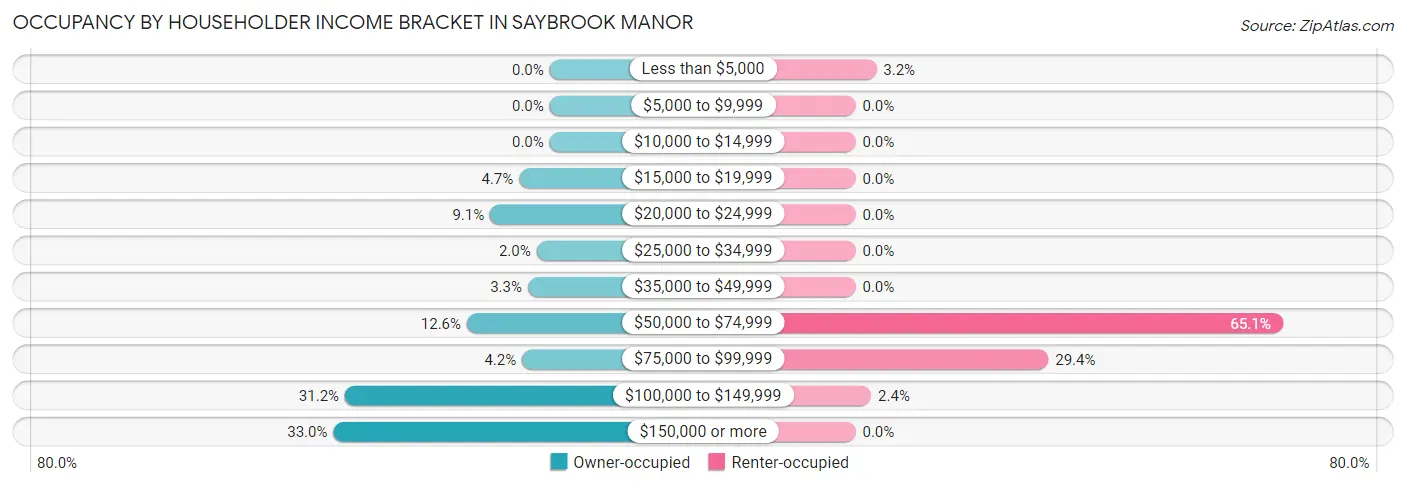
| Income Bracket | Owner-occupied | Renter-occupied |
| Less than $5,000 | 0 (0.0%) | 4 (3.2%) |
| $5,000 to $9,999 | 0 (0.0%) | 0 (0.0%) |
| $10,000 to $14,999 | 0 (0.0%) | 0 (0.0%) |
| $15,000 to $19,999 | 21 (4.6%) | 0 (0.0%) |
| $20,000 to $24,999 | 41 (9.1%) | 0 (0.0%) |
| $25,000 to $34,999 | 9 (2.0%) | 0 (0.0%) |
| $35,000 to $49,999 | 15 (3.3%) | 0 (0.0%) |
| $50,000 to $74,999 | 57 (12.6%) | 82 (65.1%) |
| $75,000 to $99,999 | 19 (4.2%) | 37 (29.4%) |
| $100,000 to $149,999 | 141 (31.2%) | 3 (2.4%) |
| $150,000 or more | 149 (33.0%) | 0 (0.0%) |
| Total | 452 (100.0%) | 126 (100.0%) |
Monthly Housing Cost Tiers in Saybrook Manor
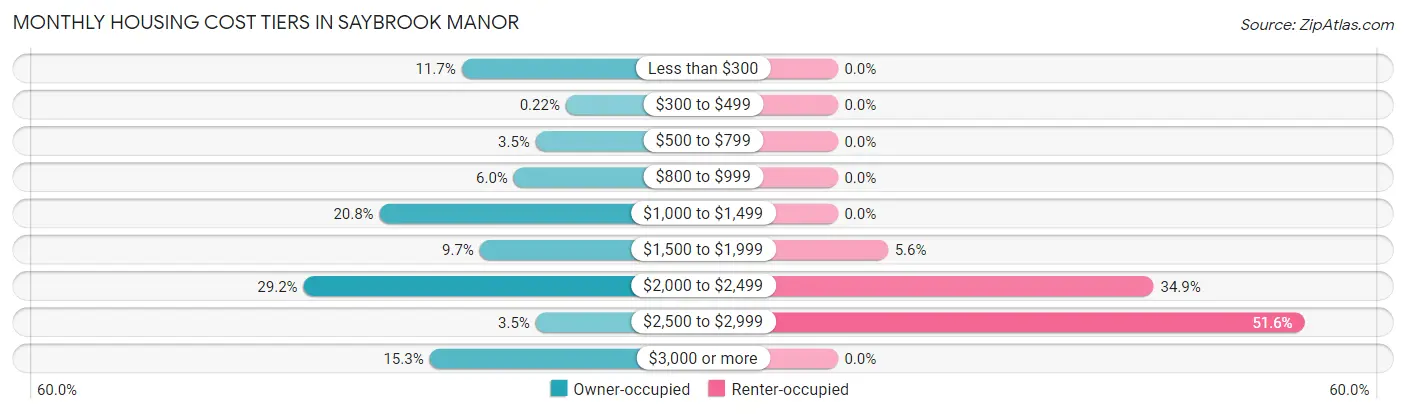
| Monthly Cost | Owner-occupied | Renter-occupied |
| Less than $300 | 53 (11.7%) | 0 (0.0%) |
| $300 to $499 | 1 (0.2%) | 0 (0.0%) |
| $500 to $799 | 16 (3.5%) | 0 (0.0%) |
| $800 to $999 | 27 (6.0%) | 0 (0.0%) |
| $1,000 to $1,499 | 94 (20.8%) | 0 (0.0%) |
| $1,500 to $1,999 | 44 (9.7%) | 7 (5.6%) |
| $2,000 to $2,499 | 132 (29.2%) | 44 (34.9%) |
| $2,500 to $2,999 | 16 (3.5%) | 65 (51.6%) |
| $3,000 or more | 69 (15.3%) | 0 (0.0%) |
| Total | 452 (100.0%) | 126 (100.0%) |
Physical Housing Characteristics in Saybrook Manor
Housing Structures in Saybrook Manor
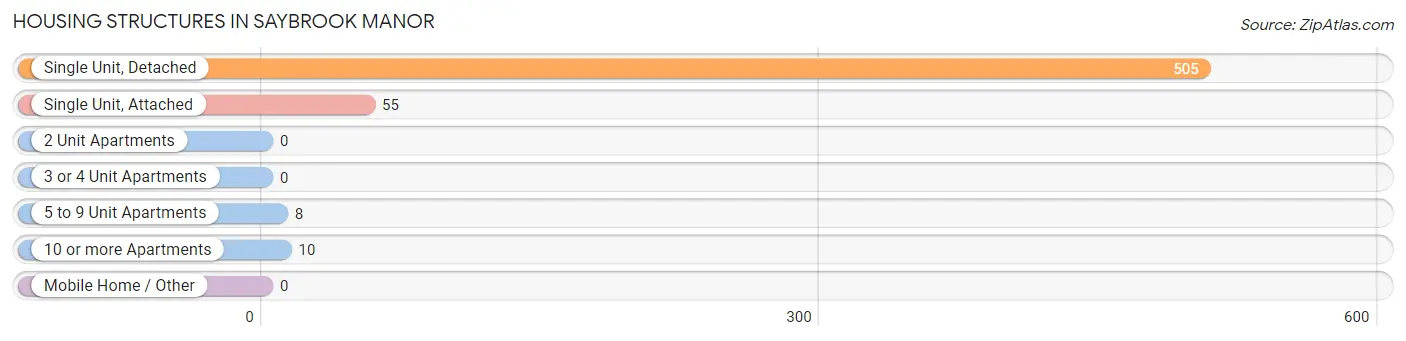
| Structure Type | # Housing Units | % Housing Units |
| Single Unit, Detached | 505 | 87.4% |
| Single Unit, Attached | 55 | 9.5% |
| 2 Unit Apartments | 0 | 0.0% |
| 3 or 4 Unit Apartments | 0 | 0.0% |
| 5 to 9 Unit Apartments | 8 | 1.4% |
| 10 or more Apartments | 10 | 1.7% |
| Mobile Home / Other | 0 | 0.0% |
| Total | 578 | 100.0% |
Housing Structures by Occupancy in Saybrook Manor
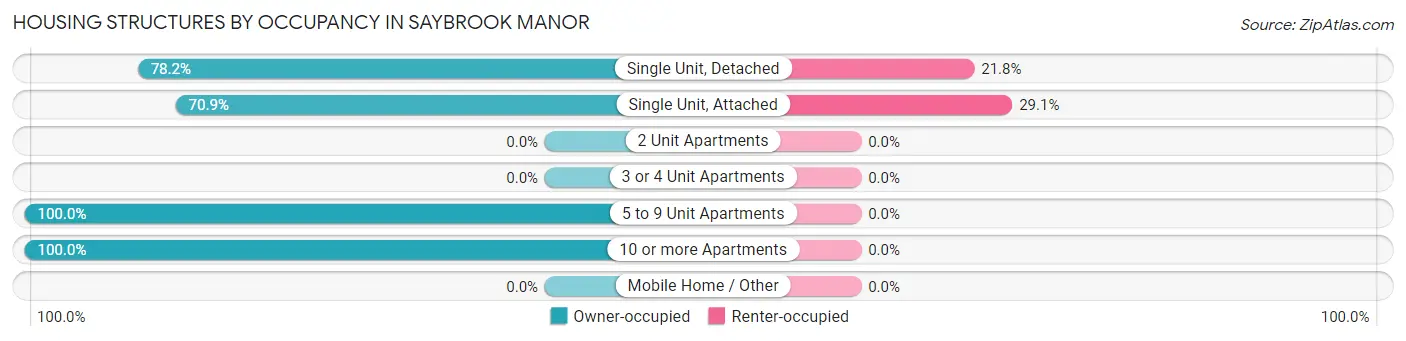
| Structure Type | Owner-occupied | Renter-occupied |
| Single Unit, Detached | 395 (78.2%) | 110 (21.8%) |
| Single Unit, Attached | 39 (70.9%) | 16 (29.1%) |
| 2 Unit Apartments | 0 (0.0%) | 0 (0.0%) |
| 3 or 4 Unit Apartments | 0 (0.0%) | 0 (0.0%) |
| 5 to 9 Unit Apartments | 8 (100.0%) | 0 (0.0%) |
| 10 or more Apartments | 10 (100.0%) | 0 (0.0%) |
| Mobile Home / Other | 0 (0.0%) | 0 (0.0%) |
| Total | 452 (78.2%) | 126 (21.8%) |
Housing Structures by Number of Rooms in Saybrook Manor
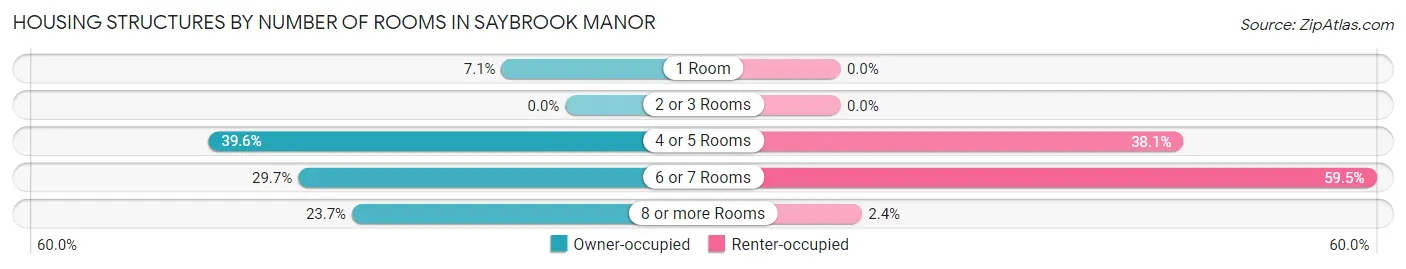
| Number of Rooms | Owner-occupied | Renter-occupied |
| 1 Room | 32 (7.1%) | 0 (0.0%) |
| 2 or 3 Rooms | 0 (0.0%) | 0 (0.0%) |
| 4 or 5 Rooms | 179 (39.6%) | 48 (38.1%) |
| 6 or 7 Rooms | 134 (29.6%) | 75 (59.5%) |
| 8 or more Rooms | 107 (23.7%) | 3 (2.4%) |
| Total | 452 (100.0%) | 126 (100.0%) |
Housing Structure by Heating Type in Saybrook Manor
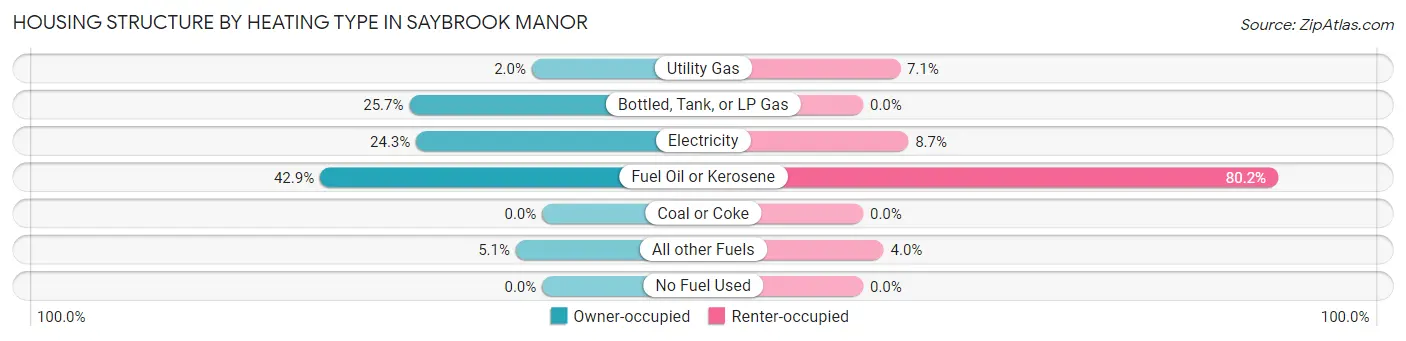
| Heating Type | Owner-occupied | Renter-occupied |
| Utility Gas | 9 (2.0%) | 9 (7.1%) |
| Bottled, Tank, or LP Gas | 116 (25.7%) | 0 (0.0%) |
| Electricity | 110 (24.3%) | 11 (8.7%) |
| Fuel Oil or Kerosene | 194 (42.9%) | 101 (80.2%) |
| Coal or Coke | 0 (0.0%) | 0 (0.0%) |
| All other Fuels | 23 (5.1%) | 5 (4.0%) |
| No Fuel Used | 0 (0.0%) | 0 (0.0%) |
| Total | 452 (100.0%) | 126 (100.0%) |
Household Vehicle Usage in Saybrook Manor
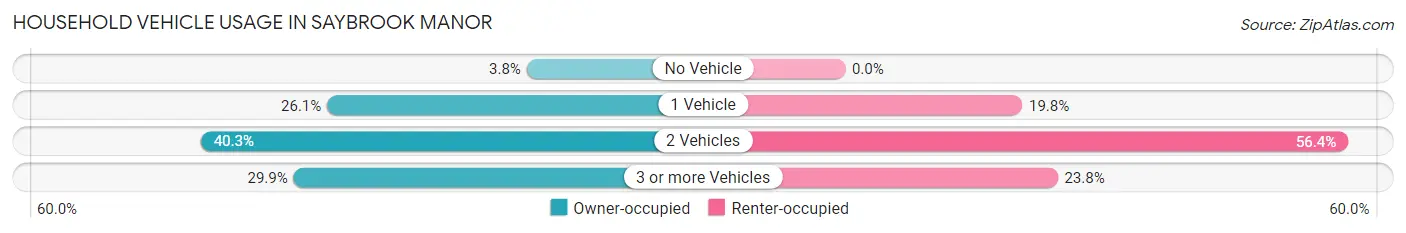
| Vehicles per Household | Owner-occupied | Renter-occupied |
| No Vehicle | 17 (3.8%) | 0 (0.0%) |
| 1 Vehicle | 118 (26.1%) | 25 (19.8%) |
| 2 Vehicles | 182 (40.3%) | 71 (56.4%) |
| 3 or more Vehicles | 135 (29.9%) | 30 (23.8%) |
| Total | 452 (100.0%) | 126 (100.0%) |
Real Estate & Mortgages in Saybrook Manor
Real Estate and Mortgage Overview in Saybrook Manor
| Characteristic | Without Mortgage | With Mortgage |
| Housing Units | 184 | 268 |
| Median Property Value | $459,300 | $435,900 |
| Median Household Income | - | - |
| Monthly Housing Costs | $938 | $69 |
| Real Estate Taxes | $4,595 | $0 |
Property Value by Mortgage Status in Saybrook Manor
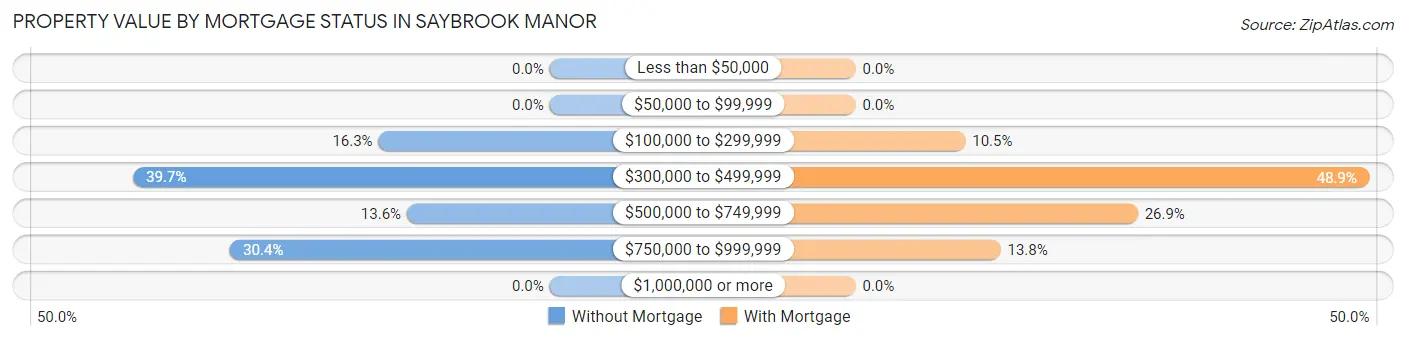
| Property Value | Without Mortgage | With Mortgage |
| Less than $50,000 | 0 (0.0%) | 0 (0.0%) |
| $50,000 to $99,999 | 0 (0.0%) | 0 (0.0%) |
| $100,000 to $299,999 | 30 (16.3%) | 28 (10.4%) |
| $300,000 to $499,999 | 73 (39.7%) | 131 (48.9%) |
| $500,000 to $749,999 | 25 (13.6%) | 72 (26.9%) |
| $750,000 to $999,999 | 56 (30.4%) | 37 (13.8%) |
| $1,000,000 or more | 0 (0.0%) | 0 (0.0%) |
| Total | 184 (100.0%) | 268 (100.0%) |
Household Income by Mortgage Status in Saybrook Manor
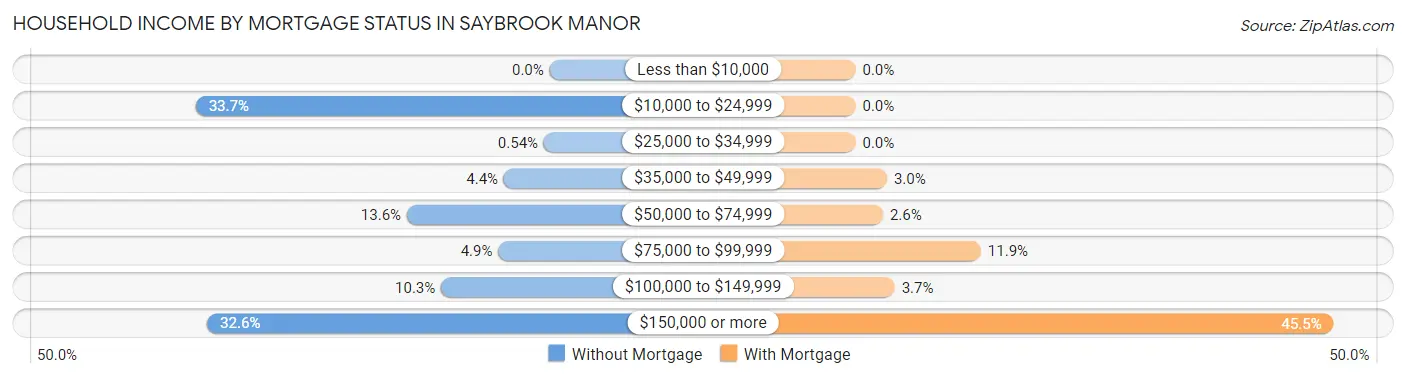
| Household Income | Without Mortgage | With Mortgage |
| Less than $10,000 | 0 (0.0%) | 0 (0.0%) |
| $10,000 to $24,999 | 62 (33.7%) | 0 (0.0%) |
| $25,000 to $34,999 | 1 (0.5%) | 0 (0.0%) |
| $35,000 to $49,999 | 8 (4.3%) | 8 (3.0%) |
| $50,000 to $74,999 | 25 (13.6%) | 7 (2.6%) |
| $75,000 to $99,999 | 9 (4.9%) | 32 (11.9%) |
| $100,000 to $149,999 | 19 (10.3%) | 10 (3.7%) |
| $150,000 or more | 60 (32.6%) | 122 (45.5%) |
| Total | 184 (100.0%) | 268 (100.0%) |
Property Value to Household Income Ratio in Saybrook Manor
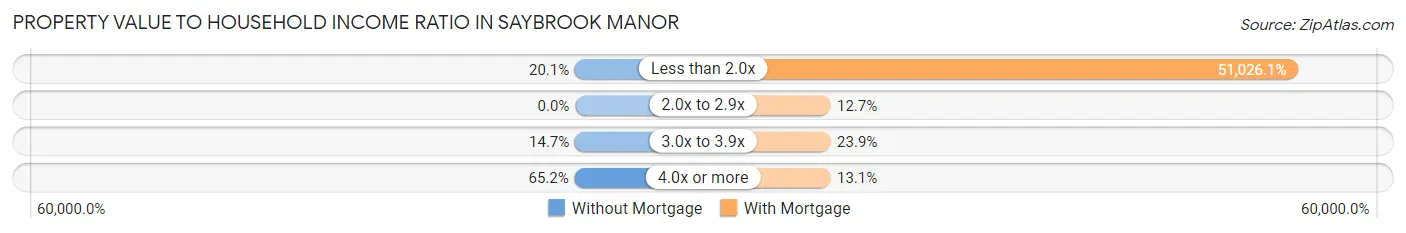
| Value-to-Income Ratio | Without Mortgage | With Mortgage |
| Less than 2.0x | 37 (20.1%) | 136,750 (51,026.1%) |
| 2.0x to 2.9x | 0 (0.0%) | 34 (12.7%) |
| 3.0x to 3.9x | 27 (14.7%) | 64 (23.9%) |
| 4.0x or more | 120 (65.2%) | 35 (13.1%) |
| Total | 184 (100.0%) | 268 (100.0%) |
Real Estate Taxes by Mortgage Status in Saybrook Manor
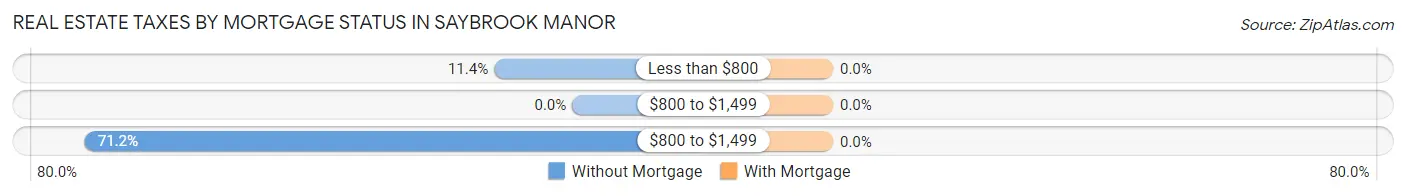
| Property Taxes | Without Mortgage | With Mortgage |
| Less than $800 | 21 (11.4%) | 0 (0.0%) |
| $800 to $1,499 | 0 (0.0%) | 0 (0.0%) |
| $800 to $1,499 | 131 (71.2%) | 0 (0.0%) |
| Total | 184 (100.0%) | 268 (100.0%) |
Health & Disability in Saybrook Manor
Health Insurance Coverage by Age in Saybrook Manor
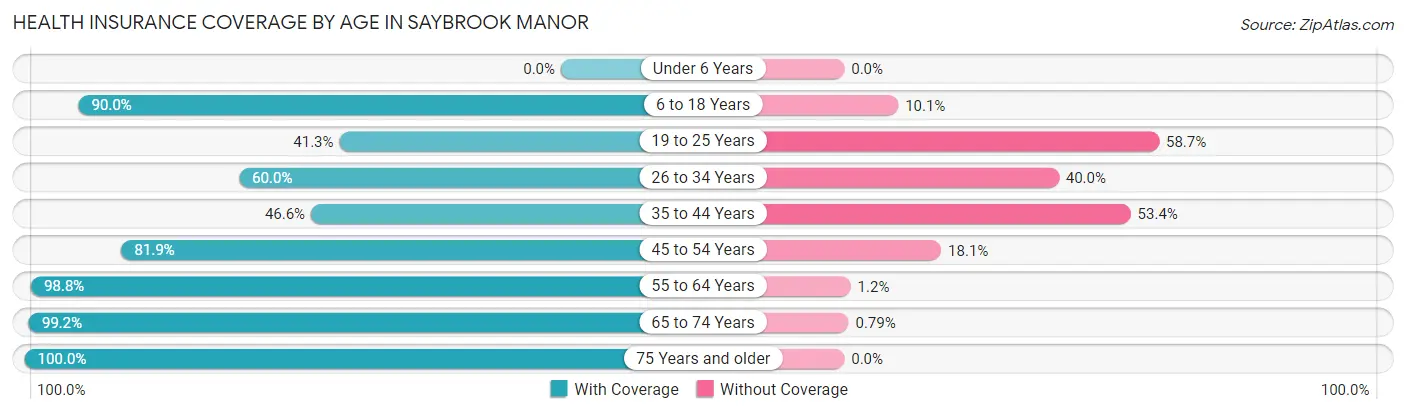
| Age Bracket | With Coverage | Without Coverage |
| Under 6 Years | 0 (0.0%) | 0 (0.0%) |
| 6 to 18 Years | 188 (89.9%) | 21 (10.1%) |
| 19 to 25 Years | 19 (41.3%) | 27 (58.7%) |
| 26 to 34 Years | 15 (60.0%) | 10 (40.0%) |
| 35 to 44 Years | 96 (46.6%) | 110 (53.4%) |
| 45 to 54 Years | 127 (81.9%) | 28 (18.1%) |
| 55 to 64 Years | 331 (98.8%) | 4 (1.2%) |
| 65 to 74 Years | 125 (99.2%) | 1 (0.8%) |
| 75 Years and older | 129 (100.0%) | 0 (0.0%) |
| Total | 1,030 (83.7%) | 201 (16.3%) |
Health Insurance Coverage by Citizenship Status in Saybrook Manor
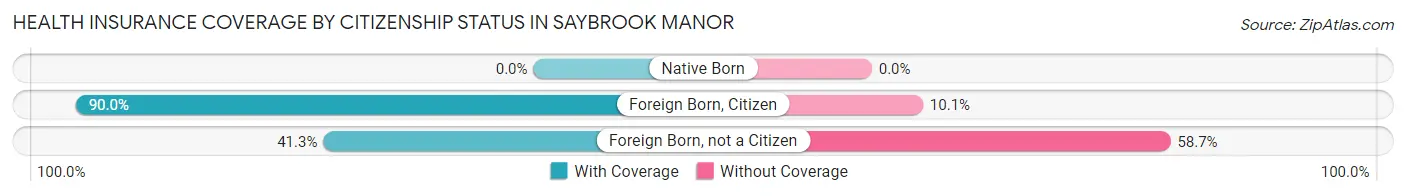
| Citizenship Status | With Coverage | Without Coverage |
| Native Born | 0 (0.0%) | 0 (0.0%) |
| Foreign Born, Citizen | 188 (89.9%) | 21 (10.1%) |
| Foreign Born, not a Citizen | 19 (41.3%) | 27 (58.7%) |
Health Insurance Coverage by Household Income in Saybrook Manor
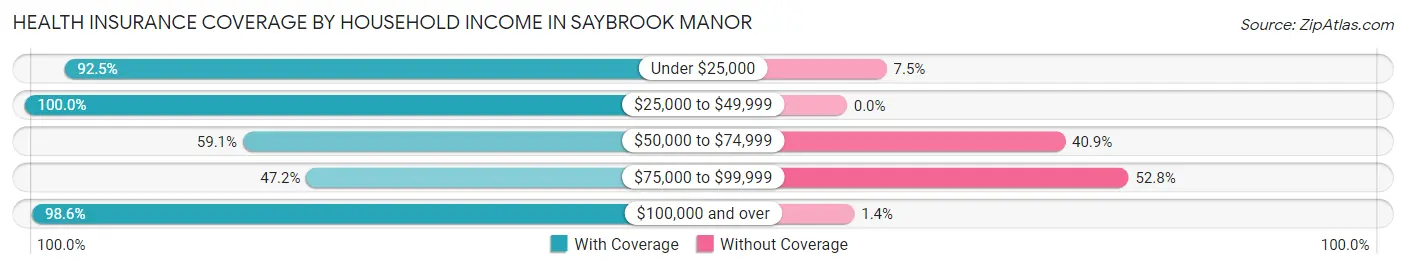
| Household Income | With Coverage | Without Coverage |
| Under $25,000 | 62 (92.5%) | 5 (7.5%) |
| $25,000 to $49,999 | 36 (100.0%) | 0 (0.0%) |
| $50,000 to $74,999 | 159 (59.1%) | 110 (40.9%) |
| $75,000 to $99,999 | 68 (47.2%) | 76 (52.8%) |
| $100,000 and over | 705 (98.6%) | 10 (1.4%) |
Public vs Private Health Insurance Coverage by Age in Saybrook Manor
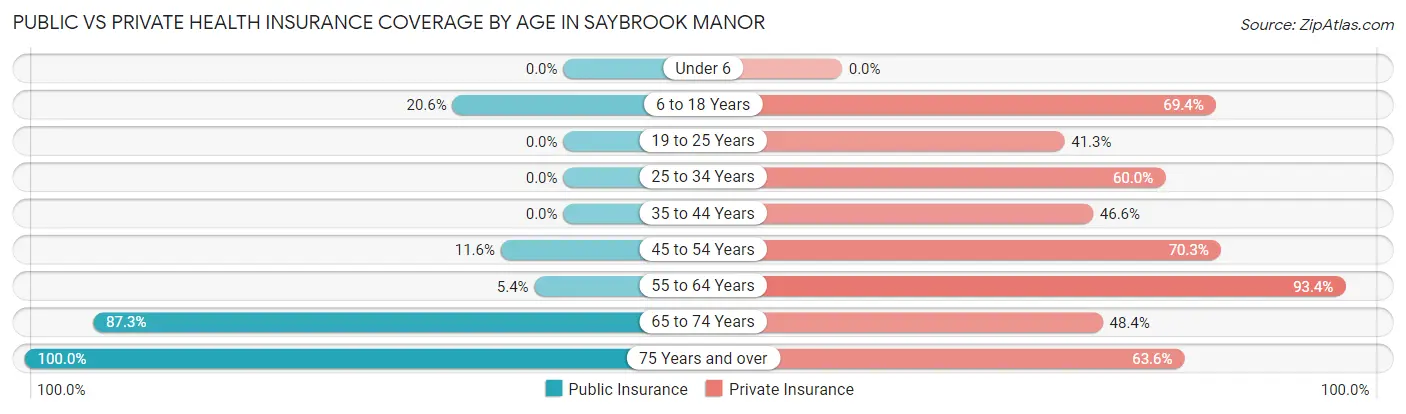
| Age Bracket | Public Insurance | Private Insurance |
| Under 6 | 0 (0.0%) | 0 (0.0%) |
| 6 to 18 Years | 43 (20.6%) | 145 (69.4%) |
| 19 to 25 Years | 0 (0.0%) | 19 (41.3%) |
| 25 to 34 Years | 0 (0.0%) | 15 (60.0%) |
| 35 to 44 Years | 0 (0.0%) | 96 (46.6%) |
| 45 to 54 Years | 18 (11.6%) | 109 (70.3%) |
| 55 to 64 Years | 18 (5.4%) | 313 (93.4%) |
| 65 to 74 Years | 110 (87.3%) | 61 (48.4%) |
| 75 Years and over | 129 (100.0%) | 82 (63.6%) |
| Total | 318 (25.8%) | 840 (68.2%) |
Disability Status by Sex by Age in Saybrook Manor
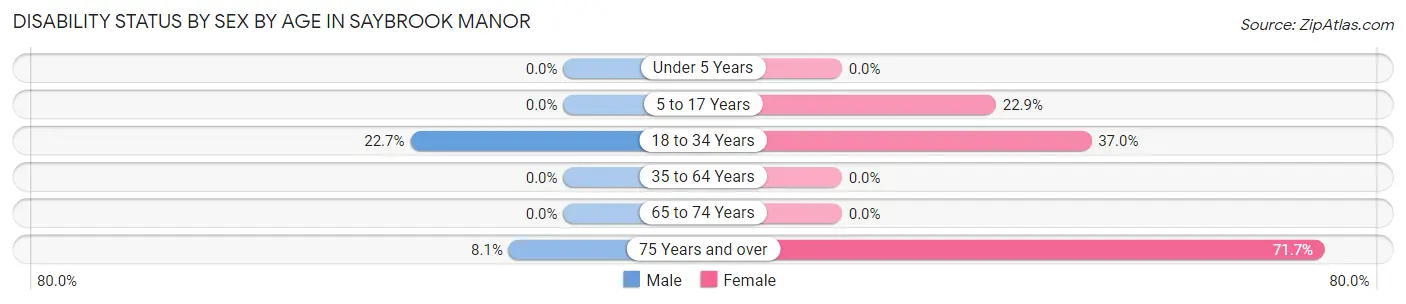
| Age Bracket | Male | Female |
| Under 5 Years | 0 (0.0%) | 0 (0.0%) |
| 5 to 17 Years | 0 (0.0%) | 43 (22.9%) |
| 18 to 34 Years | 10 (22.7%) | 10 (37.0%) |
| 35 to 64 Years | 0 (0.0%) | 0 (0.0%) |
| 65 to 74 Years | 0 (0.0%) | 0 (0.0%) |
| 75 Years and over | 3 (8.1%) | 66 (71.7%) |
Disability Class by Sex by Age in Saybrook Manor
Disability Class: Hearing Difficulty
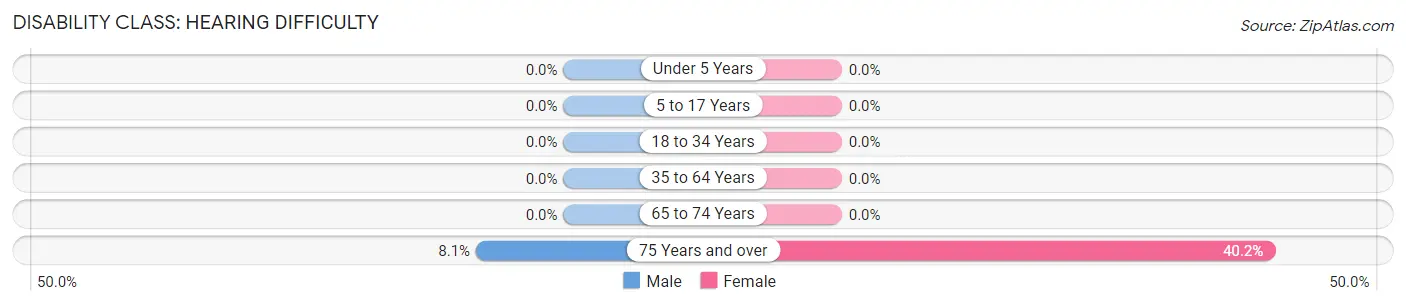
| Age Bracket | Male | Female |
| Under 5 Years | 0 (0.0%) | 0 (0.0%) |
| 5 to 17 Years | 0 (0.0%) | 0 (0.0%) |
| 18 to 34 Years | 0 (0.0%) | 0 (0.0%) |
| 35 to 64 Years | 0 (0.0%) | 0 (0.0%) |
| 65 to 74 Years | 0 (0.0%) | 0 (0.0%) |
| 75 Years and over | 3 (8.1%) | 37 (40.2%) |
Disability Class: Vision Difficulty
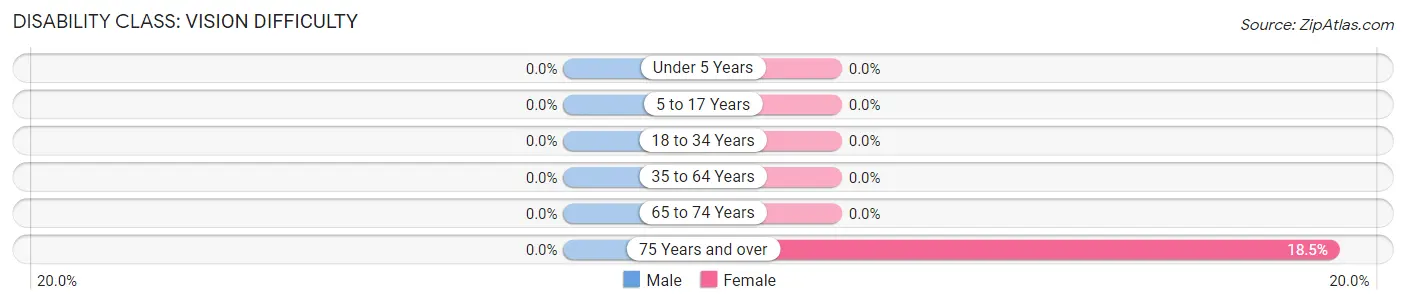
| Age Bracket | Male | Female |
| Under 5 Years | 0 (0.0%) | 0 (0.0%) |
| 5 to 17 Years | 0 (0.0%) | 0 (0.0%) |
| 18 to 34 Years | 0 (0.0%) | 0 (0.0%) |
| 35 to 64 Years | 0 (0.0%) | 0 (0.0%) |
| 65 to 74 Years | 0 (0.0%) | 0 (0.0%) |
| 75 Years and over | 0 (0.0%) | 17 (18.5%) |
Disability Class: Cognitive Difficulty
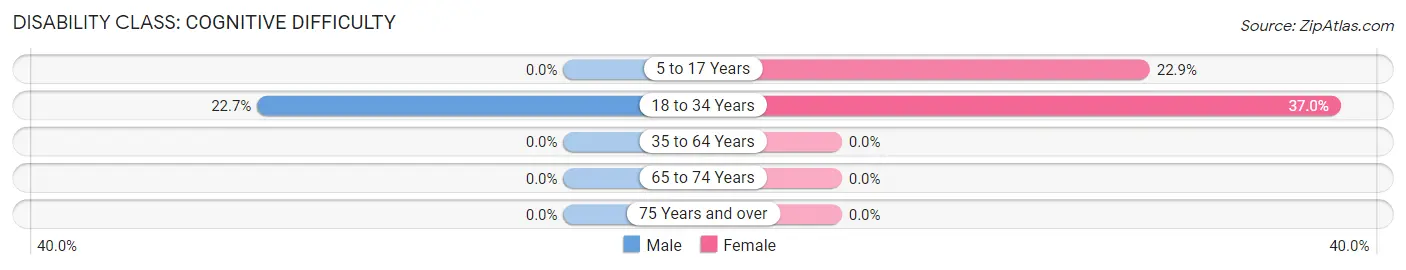
| Age Bracket | Male | Female |
| 5 to 17 Years | 0 (0.0%) | 43 (22.9%) |
| 18 to 34 Years | 10 (22.7%) | 10 (37.0%) |
| 35 to 64 Years | 0 (0.0%) | 0 (0.0%) |
| 65 to 74 Years | 0 (0.0%) | 0 (0.0%) |
| 75 Years and over | 0 (0.0%) | 0 (0.0%) |
Disability Class: Ambulatory Difficulty
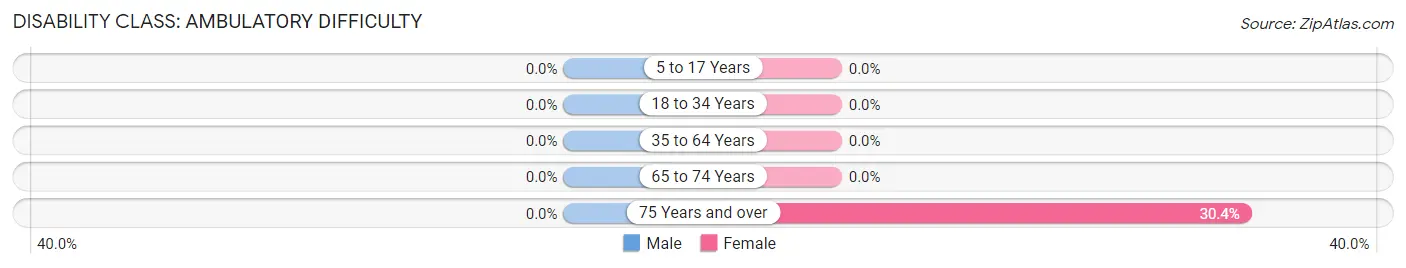
| Age Bracket | Male | Female |
| 5 to 17 Years | 0 (0.0%) | 0 (0.0%) |
| 18 to 34 Years | 0 (0.0%) | 0 (0.0%) |
| 35 to 64 Years | 0 (0.0%) | 0 (0.0%) |
| 65 to 74 Years | 0 (0.0%) | 0 (0.0%) |
| 75 Years and over | 0 (0.0%) | 28 (30.4%) |
Disability Class: Self-Care Difficulty
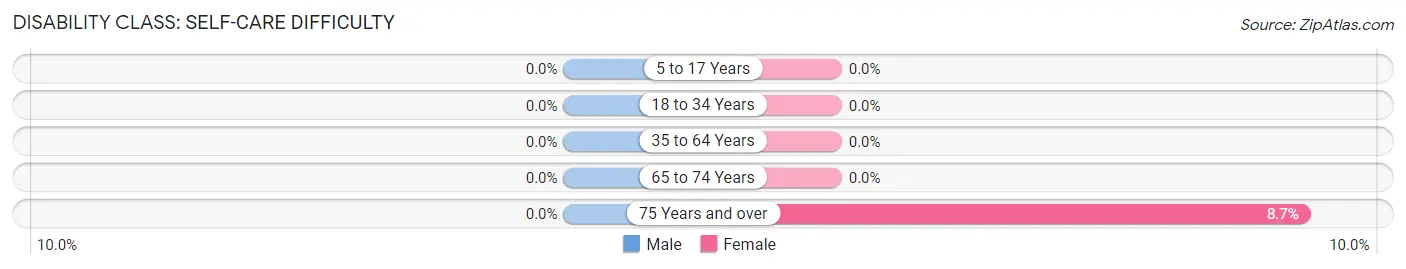
| Age Bracket | Male | Female |
| 5 to 17 Years | 0 (0.0%) | 0 (0.0%) |
| 18 to 34 Years | 0 (0.0%) | 0 (0.0%) |
| 35 to 64 Years | 0 (0.0%) | 0 (0.0%) |
| 65 to 74 Years | 0 (0.0%) | 0 (0.0%) |
| 75 Years and over | 0 (0.0%) | 8 (8.7%) |
Technology Access in Saybrook Manor
Computing Device Access in Saybrook Manor
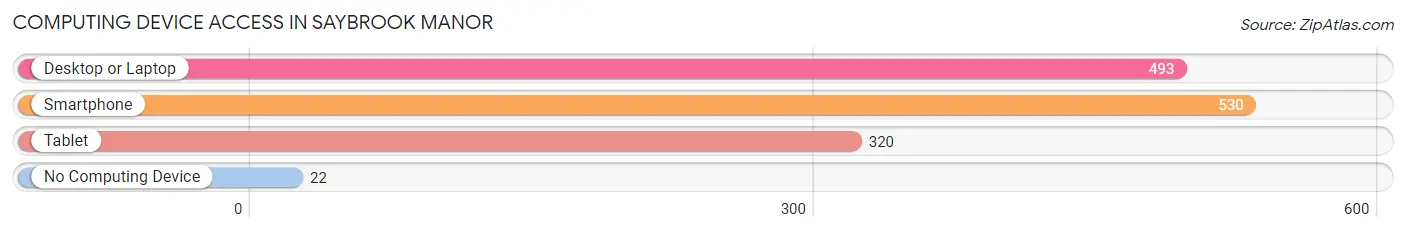
| Device Type | # Households | % Households |
| Desktop or Laptop | 493 | 85.3% |
| Smartphone | 530 | 91.7% |
| Tablet | 320 | 55.4% |
| No Computing Device | 22 | 3.8% |
| Total | 578 | 100.0% |
Internet Access in Saybrook Manor
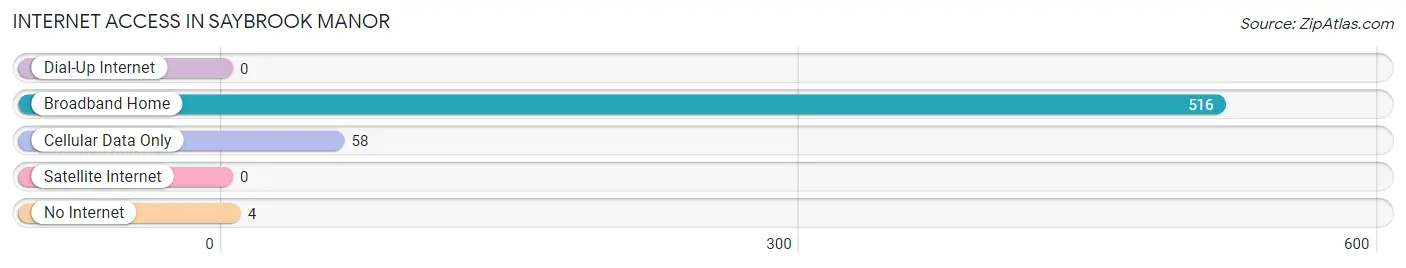
| Internet Type | # Households | % Households |
| Dial-Up Internet | 0 | 0.0% |
| Broadband Home | 516 | 89.3% |
| Cellular Data Only | 58 | 10.0% |
| Satellite Internet | 0 | 0.0% |
| No Internet | 4 | 0.7% |
| Total | 578 | 100.0% |
Saybrook Manor Summary
History
Saybrook Manor is a small town located in Middlesex County, Connecticut. It is situated on the Connecticut River, and is bordered by the towns of Old Saybrook, Essex, and Westbrook. The town was originally part of the Saybrook Colony, which was founded in 1635 by John Winthrop, Jr. and other Puritan settlers. The colony was named after Lord Saye and Sele, one of the original proprietors of the colony.
The town of Saybrook Manor was established in 1708, and was originally part of the Saybrook Colony. The town was incorporated in 1786, and was named after the original proprietors of the colony. The town was originally a farming community, and was known for its production of tobacco, corn, and other agricultural products.
In the 19th century, the town began to develop into a small industrial center. The town was home to several factories, including a paper mill, a cotton mill, and a sawmill. The town also had a number of stores and shops, as well as a post office.
In the 20th century, the town continued to grow and develop. The town was home to several businesses, including a grocery store, a hardware store, and a pharmacy. The town also had a number of churches, including the First Congregational Church, which was founded in 1708.
Geography
Saybrook Manor is located in Middlesex County, Connecticut. It is situated on the Connecticut River, and is bordered by the towns of Old Saybrook, Essex, and Westbrook. The town has a total area of 4.2 square miles, of which 4.1 square miles is land and 0.1 square miles is water.
The town is located in a hilly region, and is surrounded by forests and wetlands. The town is home to several parks, including the Saybrook Point State Park, which is located on the Connecticut River. The park offers a variety of recreational activities, including fishing, boating, and hiking.
Economy
The economy of Saybrook Manor is largely based on tourism and retail. The town is home to several restaurants, shops, and other businesses. The town is also home to a number of small businesses, including a grocery store, a hardware store, and a pharmacy.
The town is also home to several manufacturing companies, including a paper mill, a cotton mill, and a sawmill. The town is also home to a number of marinas, which offer boat rentals and other services.
Demographics
As of the 2010 census, the population of Saybrook Manor was 4,717. The population density was 1,133.3 people per square mile. The racial makeup of the town was 94.3% White, 1.3% African American, 0.3% Native American, 1.2% Asian, 0.1% Pacific Islander, 1.2% from other races, and 1.6% from two or more races. Hispanic or Latino of any race were 3.2% of the population.
The median income for a household in the town was $60,938, and the median income for a family was $71,250. The per capita income for the town was $30,945. About 4.3% of families and 5.7% of the population were below the poverty line, including 6.3% of those under age 18 and 4.2% of those age 65 or over.
Common Questions
What is Per Capita Income in Saybrook Manor?
Per Capita income in Saybrook Manor is $51,689.
What is the Median Family Income in Saybrook Manor?
Median Family Income in Saybrook Manor is $94,875.
What is the Median Household income in Saybrook Manor?
Median Household Income in Saybrook Manor is $110,526.
What is Income or Wage Gap in Saybrook Manor?
Income or Wage Gap in Saybrook Manor is 4.1%.
Women in Saybrook Manor earn 95.9 cents for every dollar earned by a man.
What is Inequality or Gini Index in Saybrook Manor?
Inequality or Gini Index in Saybrook Manor is 0.34.
What is the Total Population of Saybrook Manor?
Total Population of Saybrook Manor is 1,231.
What is the Total Male Population of Saybrook Manor?
Total Male Population of Saybrook Manor is 496.
What is the Total Female Population of Saybrook Manor?
Total Female Population of Saybrook Manor is 735.
What is the Ratio of Males per 100 Females in Saybrook Manor?
There are 67.48 Males per 100 Females in Saybrook Manor.
What is the Ratio of Females per 100 Males in Saybrook Manor?
There are 148.19 Females per 100 Males in Saybrook Manor.
What is the Median Population Age in Saybrook Manor?
Median Population Age in Saybrook Manor is 52.5 Years.
What is the Average Family Size in Saybrook Manor
Average Family Size in Saybrook Manor is 2.9 People.
What is the Average Household Size in Saybrook Manor
Average Household Size in Saybrook Manor is 2.1 People.
How Large is the Labor Force in Saybrook Manor?
There are 781 People in the Labor Forcein in Saybrook Manor.
What is the Percentage of People in the Labor Force in Saybrook Manor?
76.4% of People are in the Labor Force in Saybrook Manor.
What is the Unemployment Rate in Saybrook Manor?
Unemployment Rate in Saybrook Manor is 4.2%.