New Hartford Center, CT Map & Demographics
New Hartford Center Map
New Hartford Center Overview
$41,027
PER CAPITA INCOME
$95,099
AVG FAMILY INCOME
$71,456
AVG HOUSEHOLD INCOME
20.7%
WAGE / INCOME GAP [ % ]
79.3¢/ $1
WAGE / INCOME GAP [ $ ]
0.33
INEQUALITY / GINI INDEX
1,364
TOTAL POPULATION
561
MALE POPULATION
803
FEMALE POPULATION
69.86
MALES / 100 FEMALES
143.14
FEMALES / 100 MALES
36.1
MEDIAN AGE
2.8
AVG FAMILY SIZE
2.3
AVG HOUSEHOLD SIZE
613
LABOR FORCE [ PEOPLE ]
63.5%
PERCENT IN LABOR FORCE
5.1%
UNEMPLOYMENT RATE
Income in New Hartford Center
Income Overview in New Hartford Center
Per Capita Income in New Hartford Center is $41,027, while median incomes of families and households are $95,099 and $71,456 respectively.
| Characteristic | Number | Measure |
| Per Capita Income | 1,364 | $41,027 |
| Median Family Income | 413 | $95,099 |
| Mean Family Income | 413 | $112,633 |
| Median Household Income | 595 | $71,456 |
| Mean Household Income | 595 | $93,401 |
| Income Deficit | 413 | $0 |
| Wage / Income Gap (%) | 1,364 | 20.74% |
| Wage / Income Gap ($) | 1,364 | 79.26¢ per $1 |
| Gini / Inequality Index | 1,364 | 0.33 |
Earnings by Sex in New Hartford Center
Average Earnings in New Hartford Center are $63,438, $50,927 for men and $64,250 for women, a difference of 20.7%.
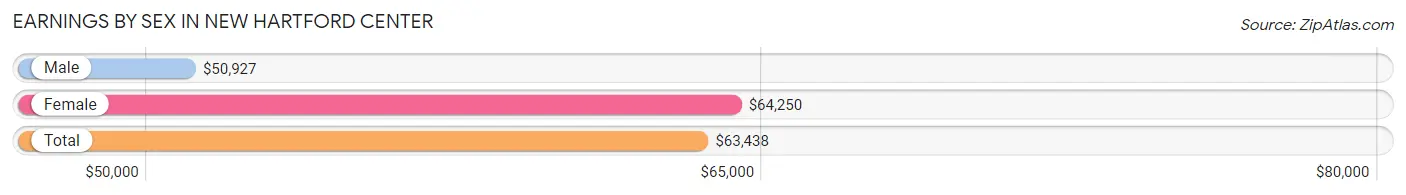
| Sex | Number | Average Earnings |
| Male | 291 (45.1%) | $50,927 |
| Female | 354 (54.9%) | $64,250 |
| Total | 645 (100.0%) | $63,438 |
Earnings by Sex by Income Bracket in New Hartford Center
The most common earnings brackets in New Hartford Center are $100,000+ for men (81 | 27.8%) and $75,000 to $99,999 for women (104 | 29.4%).
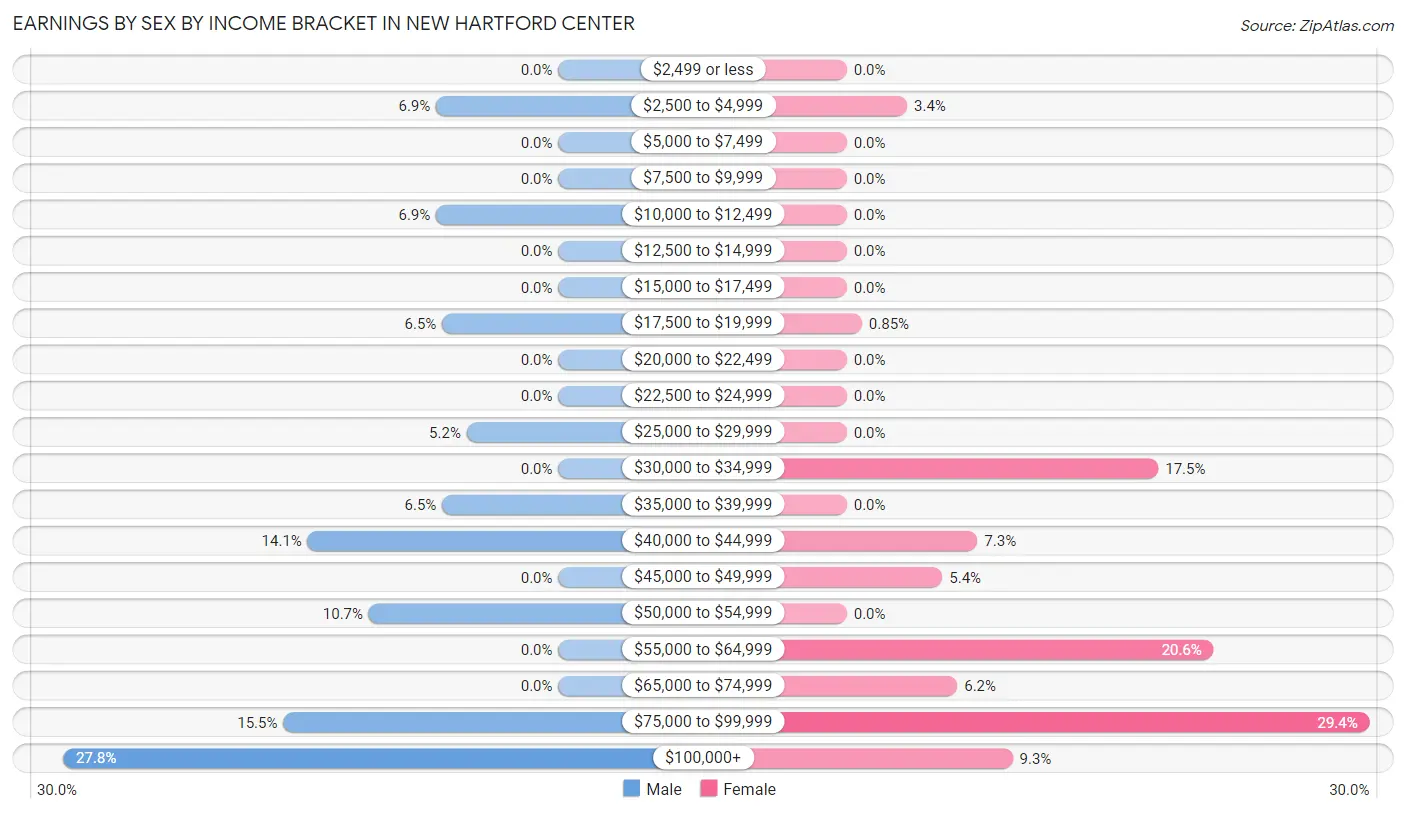
| Income | Male | Female |
| $2,499 or less | 0 (0.0%) | 0 (0.0%) |
| $2,500 to $4,999 | 20 (6.9%) | 12 (3.4%) |
| $5,000 to $7,499 | 0 (0.0%) | 0 (0.0%) |
| $7,500 to $9,999 | 0 (0.0%) | 0 (0.0%) |
| $10,000 to $12,499 | 20 (6.9%) | 0 (0.0%) |
| $12,500 to $14,999 | 0 (0.0%) | 0 (0.0%) |
| $15,000 to $17,499 | 0 (0.0%) | 0 (0.0%) |
| $17,500 to $19,999 | 19 (6.5%) | 3 (0.9%) |
| $20,000 to $22,499 | 0 (0.0%) | 0 (0.0%) |
| $22,500 to $24,999 | 0 (0.0%) | 0 (0.0%) |
| $25,000 to $29,999 | 15 (5.1%) | 0 (0.0%) |
| $30,000 to $34,999 | 0 (0.0%) | 62 (17.5%) |
| $35,000 to $39,999 | 19 (6.5%) | 0 (0.0%) |
| $40,000 to $44,999 | 41 (14.1%) | 26 (7.3%) |
| $45,000 to $49,999 | 0 (0.0%) | 19 (5.4%) |
| $50,000 to $54,999 | 31 (10.6%) | 0 (0.0%) |
| $55,000 to $64,999 | 0 (0.0%) | 73 (20.6%) |
| $65,000 to $74,999 | 0 (0.0%) | 22 (6.2%) |
| $75,000 to $99,999 | 45 (15.5%) | 104 (29.4%) |
| $100,000+ | 81 (27.8%) | 33 (9.3%) |
| Total | 291 (100.0%) | 354 (100.0%) |
Earnings by Sex by Educational Attainment in New Hartford Center
Average earnings in New Hartford Center are $50,927 for men and $64,250 for women, a difference of 20.7%. Men with an educational attainment of bachelor's degree enjoy the highest average annual earnings of $41,677, while those with bachelor's degree education earn the least with $41,677. Women with an educational attainment of graduate degree earn the most with the average annual earnings of $96,020, while those with college or associate's degree education have the smallest earnings of $43,510.
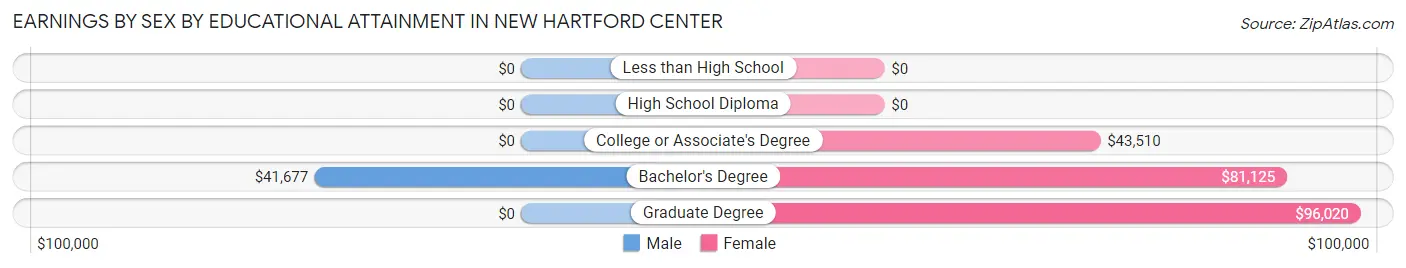
| Educational Attainment | Male Income | Female Income |
| Less than High School | - | - |
| High School Diploma | - | - |
| College or Associate's Degree | - | - |
| Bachelor's Degree | $41,677 | $81,125 |
| Graduate Degree | - | - |
| Total | $50,927 | $64,250 |
Family Income in New Hartford Center
Family Income Brackets in New Hartford Center
According to the New Hartford Center family income data, there are 159 families falling into the $50,000 to $74,999 income range, which is the most common income bracket and makes up 38.5% of all families.
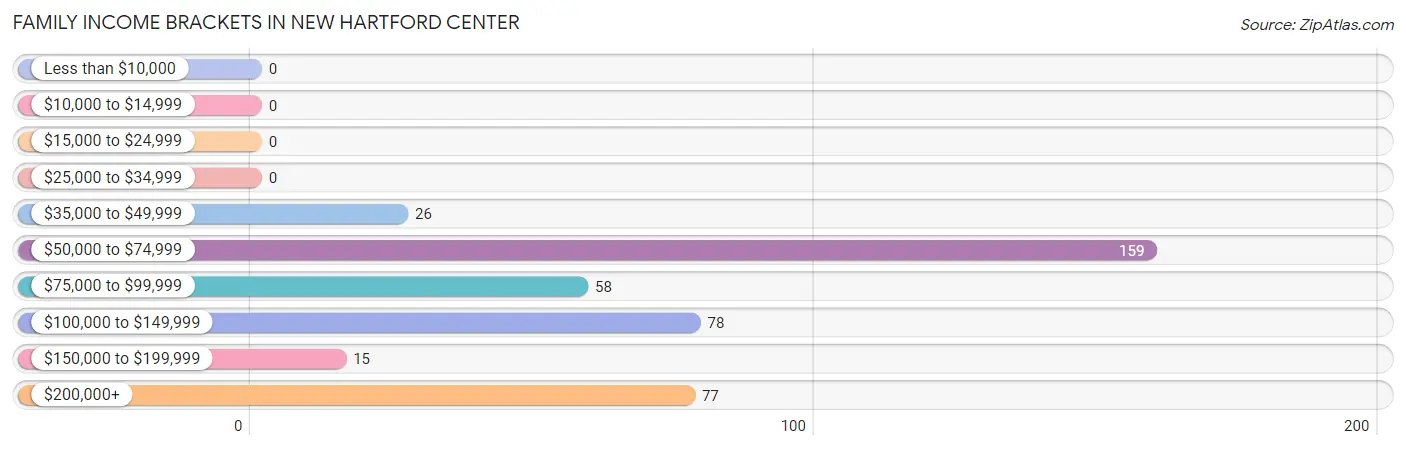
| Income Bracket | # Families | % Families |
| Less than $10,000 | 0 | 0.0% |
| $10,000 to $14,999 | 0 | 0.0% |
| $15,000 to $24,999 | 0 | 0.0% |
| $25,000 to $34,999 | 0 | 0.0% |
| $35,000 to $49,999 | 26 | 6.3% |
| $50,000 to $74,999 | 159 | 38.5% |
| $75,000 to $99,999 | 58 | 14.0% |
| $100,000 to $149,999 | 78 | 18.9% |
| $150,000 to $199,999 | 15 | 3.6% |
| $200,000+ | 77 | 18.6% |
Family Income by Famaliy Size in New Hartford Center
4-person families (110 | 26.6%) account for the highest median family income in New Hartford Center with $215,208 per family, while 4-person families (110 | 26.6%) have the highest median income of $53,802 per family member.
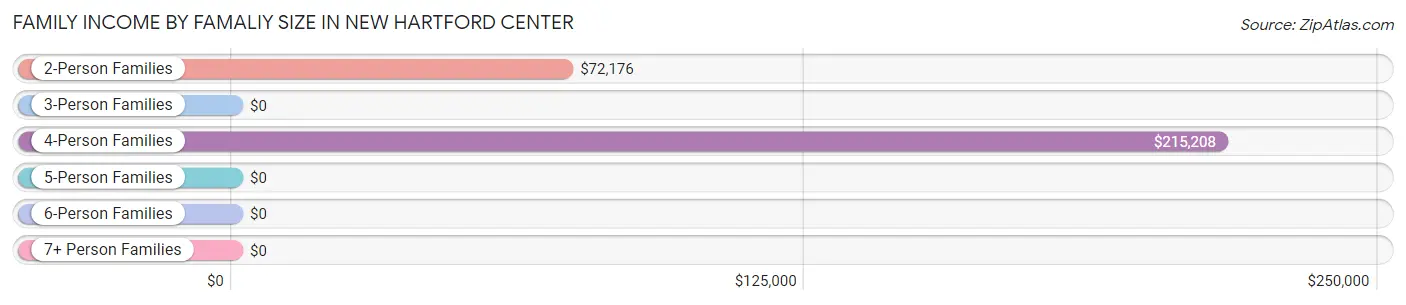
| Income Bracket | # Families | Median Income |
| 2-Person Families | 250 (60.5%) | $72,176 |
| 3-Person Families | 49 (11.9%) | $0 |
| 4-Person Families | 110 (26.6%) | $215,208 |
| 5-Person Families | 4 (1.0%) | $0 |
| 6-Person Families | 0 (0.0%) | $0 |
| 7+ Person Families | 0 (0.0%) | $0 |
| Total | 413 (100.0%) | $95,099 |
Family Income by Number of Earners in New Hartford Center
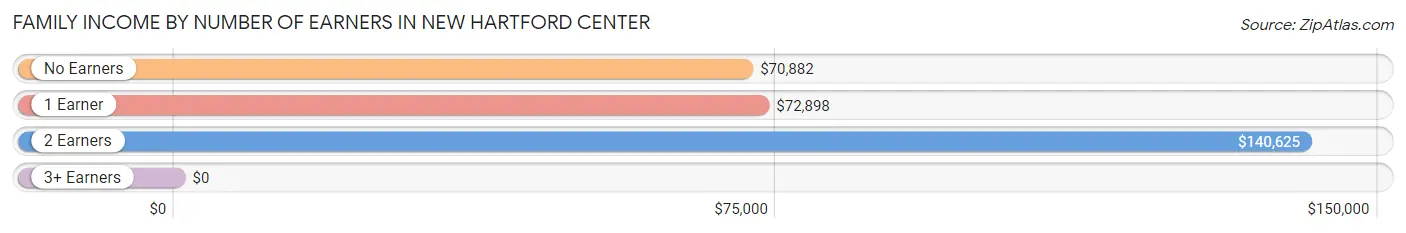
| Number of Earners | # Families | Median Income |
| No Earners | 110 (26.6%) | $70,882 |
| 1 Earner | 113 (27.4%) | $72,898 |
| 2 Earners | 190 (46.0%) | $140,625 |
| 3+ Earners | 0 (0.0%) | $0 |
| Total | 413 (100.0%) | $95,099 |
Household Income in New Hartford Center
Household Income Brackets in New Hartford Center
With 222 households falling in the category, the $50,000 to $74,999 income range is the most frequent in New Hartford Center, accounting for 37.3% of all households.
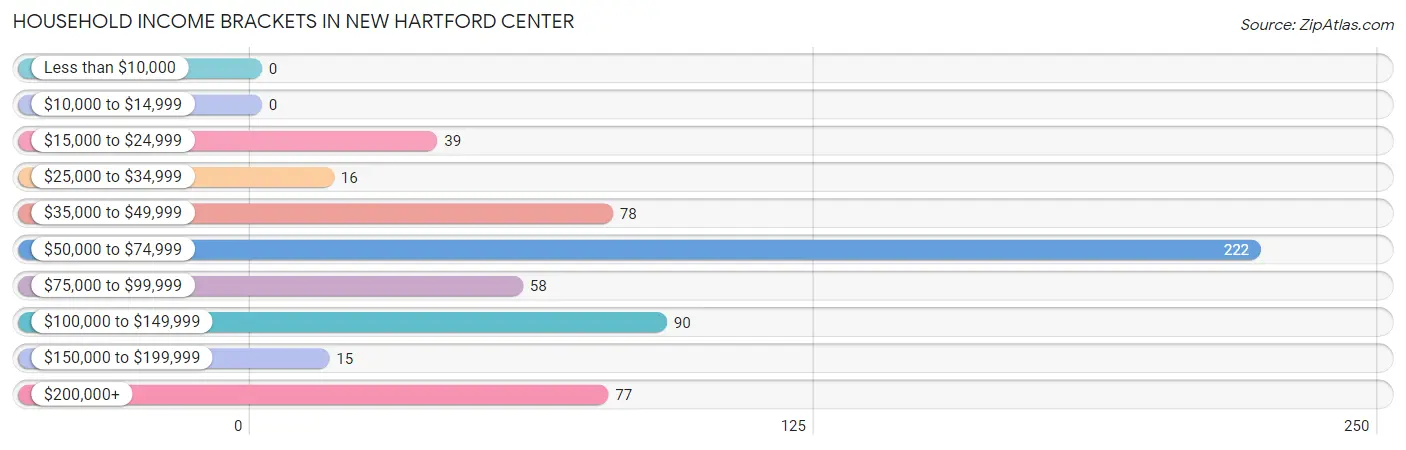
| Income Bracket | # Households | % Households |
| Less than $10,000 | 0 | 0.0% |
| $10,000 to $14,999 | 0 | 0.0% |
| $15,000 to $24,999 | 39 | 6.6% |
| $25,000 to $34,999 | 16 | 2.7% |
| $35,000 to $49,999 | 78 | 13.1% |
| $50,000 to $74,999 | 222 | 37.3% |
| $75,000 to $99,999 | 58 | 9.7% |
| $100,000 to $149,999 | 90 | 15.1% |
| $150,000 to $199,999 | 15 | 2.5% |
| $200,000+ | 77 | 12.9% |
Household Income by Householder Age in New Hartford Center
The median household income in New Hartford Center is $71,456, with the highest median household income of $94,750 found in the 25 to 44 years age bracket for the primary householder. A total of 224 households (37.7%) fall into this category.
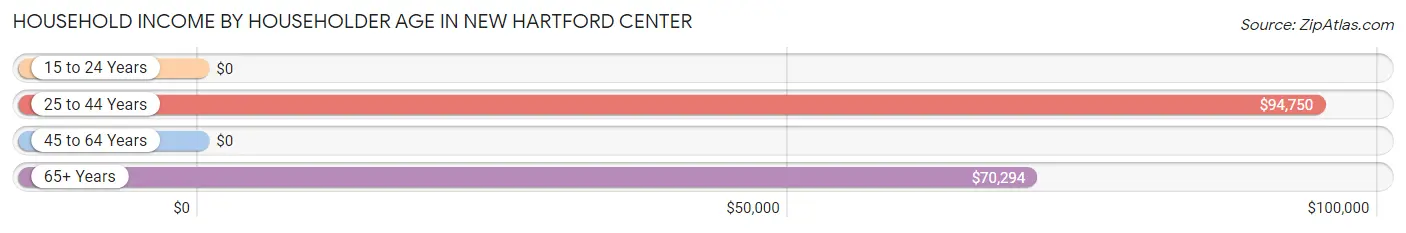
| Income Bracket | # Households | Median Income |
| 15 to 24 Years | 0 (0.0%) | $0 |
| 25 to 44 Years | 224 (37.7%) | $94,750 |
| 45 to 64 Years | 197 (33.1%) | $0 |
| 65+ Years | 174 (29.2%) | $70,294 |
| Total | 595 (100.0%) | $71,456 |
Poverty in New Hartford Center
Income Below Poverty by Sex and Age in New Hartford Center
| Age Bracket | Male | Female |
| Under 5 Years | 0 (0.0%) | 0 (0.0%) |
| 5 Years | 0 (0.0%) | 0 (0.0%) |
| 6 to 11 Years | 0 (0.0%) | 0 (0.0%) |
| 12 to 14 Years | 0 (0.0%) | 0 (0.0%) |
| 15 Years | 0 (0.0%) | 0 (0.0%) |
| 16 and 17 Years | 0 (0.0%) | 0 (0.0%) |
| 18 to 24 Years | 0 (0.0%) | 0 (0.0%) |
| 25 to 34 Years | 0 (0.0%) | 0 (0.0%) |
| 35 to 44 Years | 0 (0.0%) | 0 (0.0%) |
| 45 to 54 Years | 0 (0.0%) | 0 (0.0%) |
| 55 to 64 Years | 0 (0.0%) | 0 (0.0%) |
| 65 to 74 Years | 0 (0.0%) | 0 (0.0%) |
| 75 Years and over | 0 (0.0%) | 0 (0.0%) |
| Total | 0 (0.0%) | 0 (0.0%) |
Income Above Poverty by Sex and Age in New Hartford Center
According to the poverty statistics in New Hartford Center, males aged under 5 years and females aged under 5 years are the age groups that are most secure financially, with 100.0% of males and 100.0% of females in these age groups living above the poverty line.
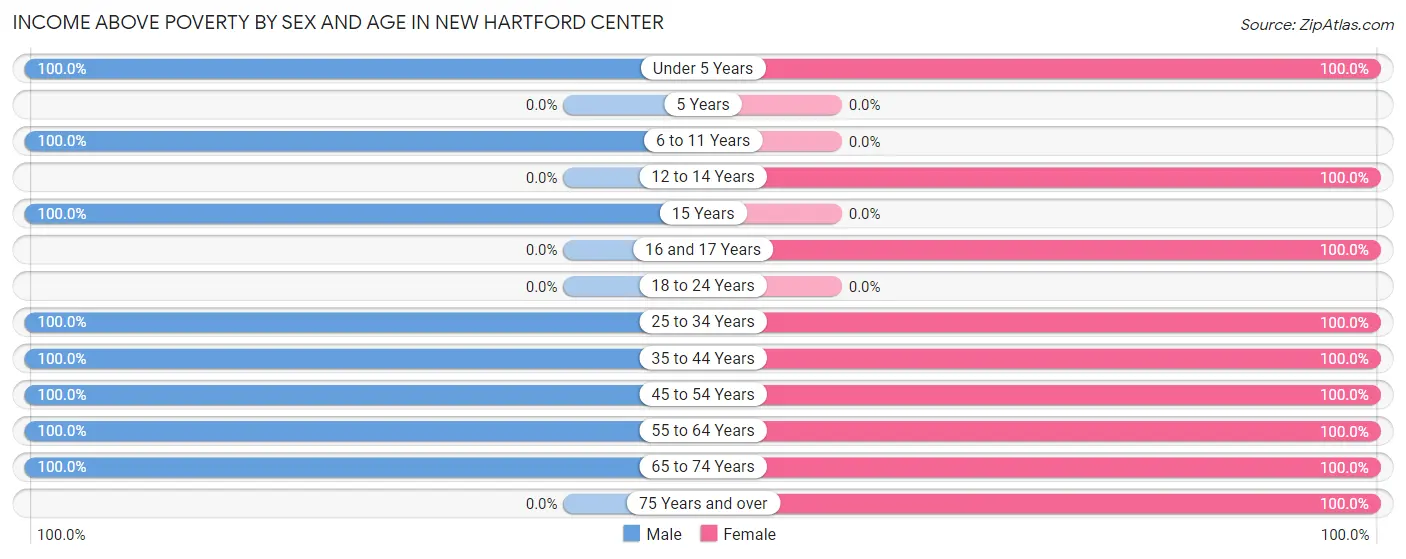
| Age Bracket | Male | Female |
| Under 5 Years | 98 (100.0%) | 104 (100.0%) |
| 5 Years | 0 (0.0%) | 0 (0.0%) |
| 6 to 11 Years | 4 (100.0%) | 0 (0.0%) |
| 12 to 14 Years | 0 (0.0%) | 153 (100.0%) |
| 15 Years | 40 (100.0%) | 0 (0.0%) |
| 16 and 17 Years | 0 (0.0%) | 25 (100.0%) |
| 18 to 24 Years | 0 (0.0%) | 0 (0.0%) |
| 25 to 34 Years | 124 (100.0%) | 112 (100.0%) |
| 35 to 44 Years | 58 (100.0%) | 93 (100.0%) |
| 45 to 54 Years | 19 (100.0%) | 3 (100.0%) |
| 55 to 64 Years | 93 (100.0%) | 161 (100.0%) |
| 65 to 74 Years | 125 (100.0%) | 55 (100.0%) |
| 75 Years and over | 0 (0.0%) | 97 (100.0%) |
| Total | 561 (100.0%) | 803 (100.0%) |
Income Below Poverty Among Married-Couple Families in New Hartford Center
| Children | Above Poverty | Below Poverty |
| No Children | 186 (100.0%) | 0 (0.0%) |
| 1 or 2 Children | 137 (100.0%) | 0 (0.0%) |
| 3 or 4 Children | 4 (100.0%) | 0 (0.0%) |
| 5 or more Children | 0 (0.0%) | 0 (0.0%) |
| Total | 327 (100.0%) | 0 (0.0%) |
Income Below Poverty Among Single-Parent Households in New Hartford Center
| Children | Single Father | Single Mother |
| No Children | 0 (0.0%) | 0 (0.0%) |
| 1 or 2 Children | 0 (0.0%) | 0 (0.0%) |
| 3 or 4 Children | 0 (0.0%) | 0 (0.0%) |
| 5 or more Children | 0 (0.0%) | 0 (0.0%) |
| Total | 0 (0.0%) | 0 (0.0%) |
Income Below Poverty Among Married-Couple vs Single-Parent Households in New Hartford Center
| Children | Married-Couple Families | Single-Parent Households |
| No Children | 0 (0.0%) | 0 (0.0%) |
| 1 or 2 Children | 0 (0.0%) | 0 (0.0%) |
| 3 or 4 Children | 0 (0.0%) | 0 (0.0%) |
| 5 or more Children | 0 (0.0%) | 0 (0.0%) |
| Total | 0 (0.0%) | 0 (0.0%) |
Race in New Hartford Center
The most populous races in New Hartford Center are White / Caucasian (1,288 | 94.4%), and Two or more Races (76 | 5.6%).
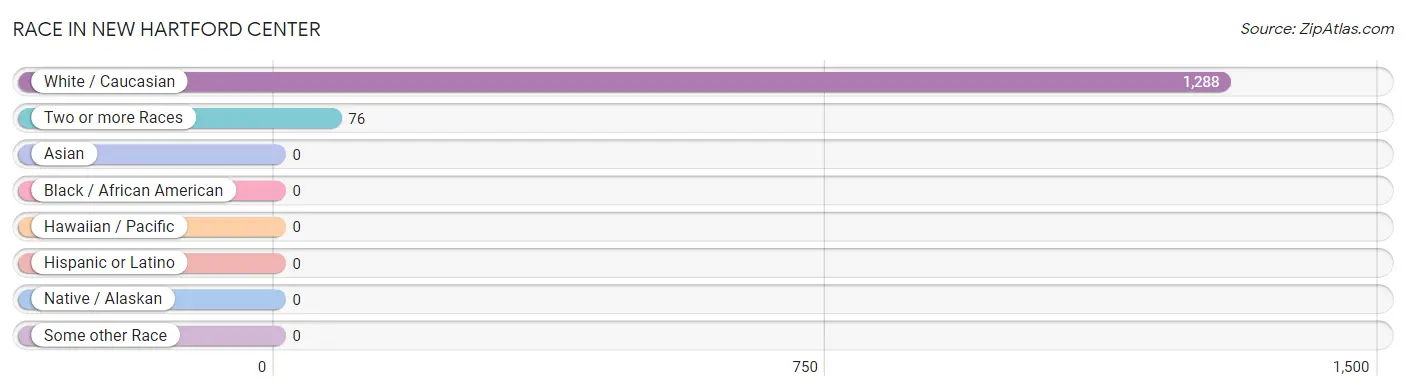
| Race | # Population | % Population |
| Asian | 0 | 0.0% |
| Black / African American | 0 | 0.0% |
| Hawaiian / Pacific | 0 | 0.0% |
| Hispanic or Latino | 0 | 0.0% |
| Native / Alaskan | 0 | 0.0% |
| White / Caucasian | 1,288 | 94.4% |
| Two or more Races | 76 | 5.6% |
| Some other Race | 0 | 0.0% |
| Total | 1,364 | 100.0% |
Ancestry in New Hartford Center
The most populous ancestries reported in New Hartford Center are Italian (345 | 25.3%), Irish (316 | 23.2%), German (271 | 19.9%), English (184 | 13.5%), and Swedish (101 | 7.4%), together accounting for 89.2% of all New Hartford Center residents.
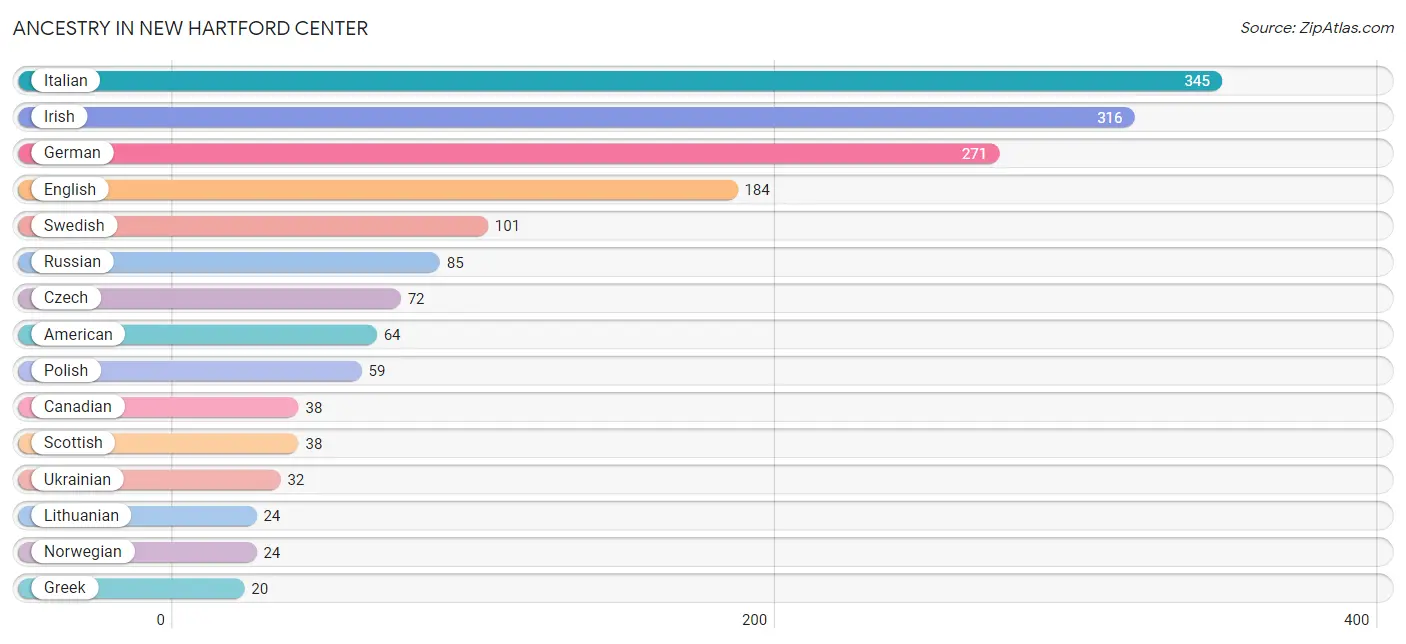
| Ancestry | # Population | % Population |
| American | 64 | 4.7% |
| Canadian | 38 | 2.8% |
| Czech | 72 | 5.3% |
| Danish | 19 | 1.4% |
| English | 184 | 13.5% |
| Finnish | 13 | 0.9% |
| French Canadian | 19 | 1.4% |
| German | 271 | 19.9% |
| Greek | 20 | 1.5% |
| Irish | 316 | 23.2% |
| Italian | 345 | 25.3% |
| Lithuanian | 24 | 1.8% |
| Norwegian | 24 | 1.8% |
| Polish | 59 | 4.3% |
| Romanian | 15 | 1.1% |
| Russian | 85 | 6.2% |
| Scottish | 38 | 2.8% |
| Swedish | 101 | 7.4% |
| Ukrainian | 32 | 2.4% | View All 19 Rows |
Immigrants in New Hartford Center
The most numerous immigrant groups reported in New Hartford Center came from Eastern Europe (19 | 1.4%), Europe (19 | 1.4%), and Poland (19 | 1.4%), together accounting for 4.2% of all New Hartford Center residents.
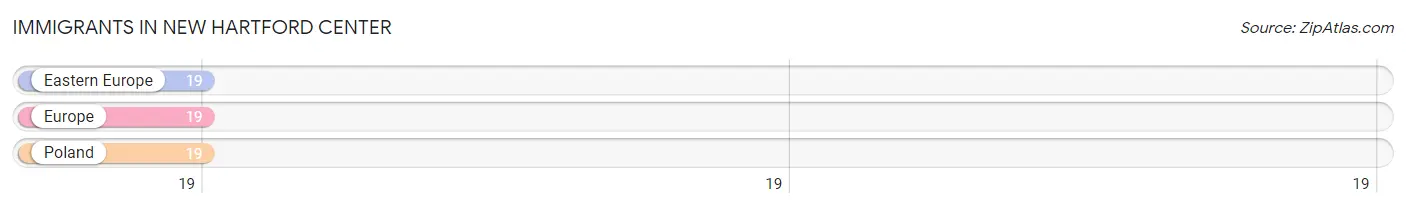
| Immigration Origin | # Population | % Population |
| Eastern Europe | 19 | 1.4% |
| Europe | 19 | 1.4% |
| Poland | 19 | 1.4% | View All 3 Rows |
Sex and Age in New Hartford Center
Sex and Age in New Hartford Center
The most populous age groups in New Hartford Center are Under 5 Years (98 | 17.5%) for men and 10 to 14 Years (153 | 19.1%) for women.
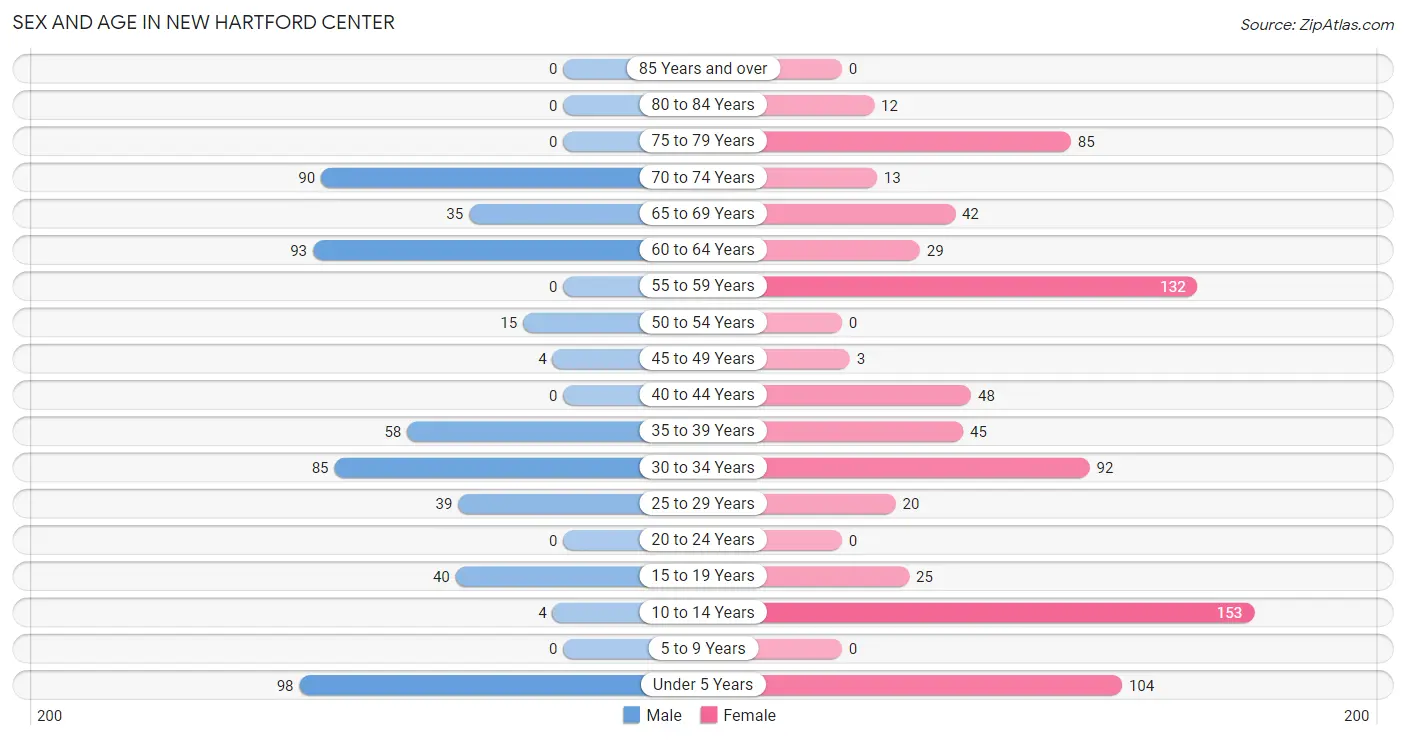
| Age Bracket | Male | Female |
| Under 5 Years | 98 (17.5%) | 104 (13.0%) |
| 5 to 9 Years | 0 (0.0%) | 0 (0.0%) |
| 10 to 14 Years | 4 (0.7%) | 153 (19.1%) |
| 15 to 19 Years | 40 (7.1%) | 25 (3.1%) |
| 20 to 24 Years | 0 (0.0%) | 0 (0.0%) |
| 25 to 29 Years | 39 (7.0%) | 20 (2.5%) |
| 30 to 34 Years | 85 (15.1%) | 92 (11.5%) |
| 35 to 39 Years | 58 (10.3%) | 45 (5.6%) |
| 40 to 44 Years | 0 (0.0%) | 48 (6.0%) |
| 45 to 49 Years | 4 (0.7%) | 3 (0.4%) |
| 50 to 54 Years | 15 (2.7%) | 0 (0.0%) |
| 55 to 59 Years | 0 (0.0%) | 132 (16.4%) |
| 60 to 64 Years | 93 (16.6%) | 29 (3.6%) |
| 65 to 69 Years | 35 (6.2%) | 42 (5.2%) |
| 70 to 74 Years | 90 (16.0%) | 13 (1.6%) |
| 75 to 79 Years | 0 (0.0%) | 85 (10.6%) |
| 80 to 84 Years | 0 (0.0%) | 12 (1.5%) |
| 85 Years and over | 0 (0.0%) | 0 (0.0%) |
| Total | 561 (100.0%) | 803 (100.0%) |
Families and Households in New Hartford Center
Median Family Size in New Hartford Center
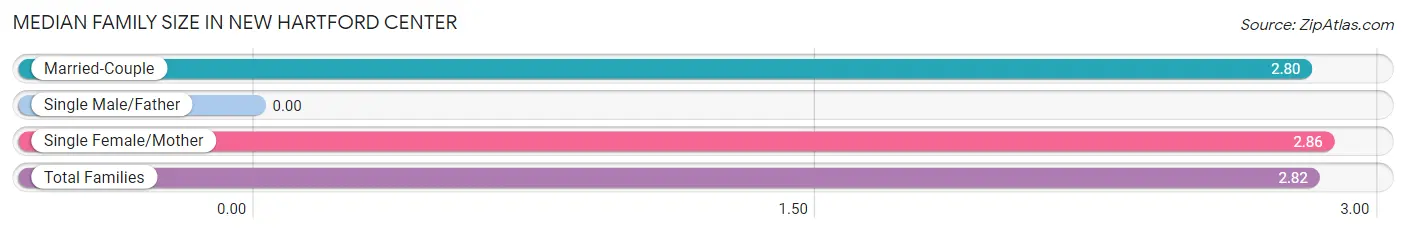
| Family Type | # Families | Family Size |
| Married-Couple | 327 (79.2%) | 2.80 |
| Single Male/Father | 0 (0.0%) | - |
| Single Female/Mother | 86 (20.8%) | 2.86 |
| Total Families | 413 (100.0%) | 2.82 |
Median Household Size in New Hartford Center
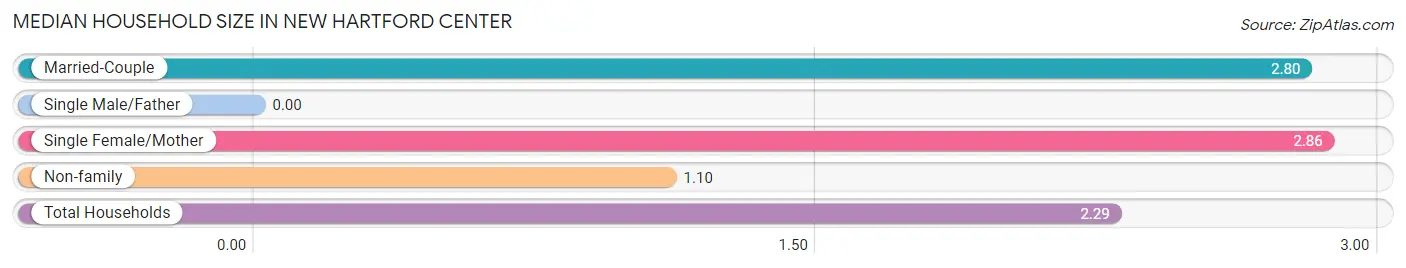
| Household Type | # Households | Household Size |
| Married-Couple | 327 (55.0%) | 2.80 |
| Single Male/Father | 0 (0.0%) | - |
| Single Female/Mother | 86 (14.4%) | 2.86 |
| Non-family | 182 (30.6%) | 1.10 |
| Total Households | 595 (100.0%) | 2.29 |
Household Size by Marriage Status in New Hartford Center
Out of a total of 595 households in New Hartford Center, 413 (69.4%) are family households, while 182 (30.6%) are nonfamily households. The most numerous type of family households are 2-person households, comprising 250, and the most common type of nonfamily households are 1-person households, comprising 163.
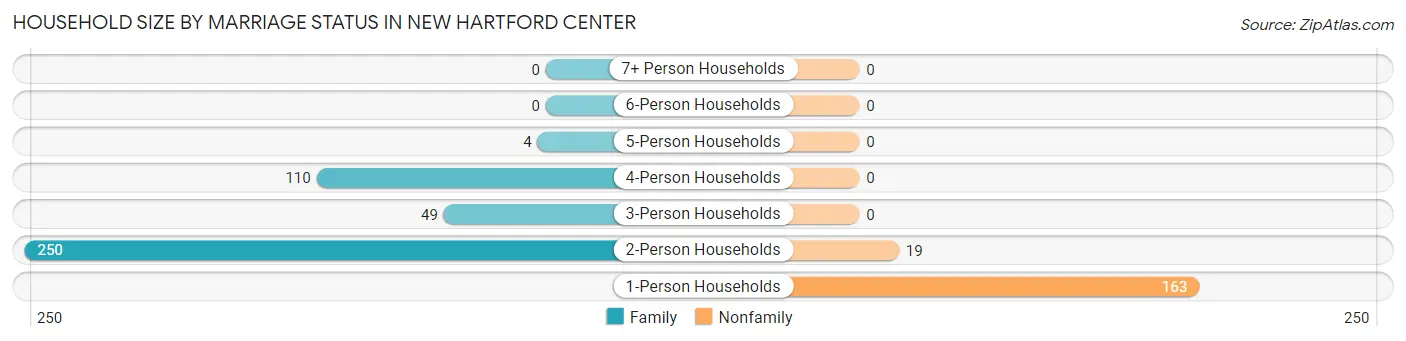
| Household Size | Family Households | Nonfamily Households |
| 1-Person Households | - | 163 (27.4%) |
| 2-Person Households | 250 (42.0%) | 19 (3.2%) |
| 3-Person Households | 49 (8.2%) | 0 (0.0%) |
| 4-Person Households | 110 (18.5%) | 0 (0.0%) |
| 5-Person Households | 4 (0.7%) | 0 (0.0%) |
| 6-Person Households | 0 (0.0%) | 0 (0.0%) |
| 7+ Person Households | 0 (0.0%) | 0 (0.0%) |
| Total | 413 (69.4%) | 182 (30.6%) |
Female Fertility in New Hartford Center
Fertility by Age in New Hartford Center
| Age Bracket | Women with Births | Births / 1,000 Women |
| 15 to 19 years | 0 (0.0%) | 0.0 |
| 20 to 34 years | 0 (0.0%) | 0.0 |
| 35 to 50 years | 0 (0.0%) | 0.0 |
| Total | 0 (0.0%) | 0.0 |
Fertility by Age by Marriage Status in New Hartford Center
| Age Bracket | Married | Unmarried |
| 15 to 19 years | 0 (0.0%) | 0 (0.0%) |
| 20 to 34 years | 0 (0.0%) | 0 (0.0%) |
| 35 to 50 years | 0 (0.0%) | 0 (0.0%) |
| Total | 0 (0.0%) | 0 (0.0%) |
Fertility by Education in New Hartford Center
| Educational Attainment | Women with Births | Births / 1,000 Women |
| Less than High School | 0 (0.0%) | 0.0 |
| High School Diploma | 0 (0.0%) | 0.0 |
| College or Associate's Degree | 0 (0.0%) | 0.0 |
| Bachelor's Degree | 0 (0.0%) | 0.0 |
| Graduate Degree | 0 (0.0%) | 0.0 |
| Total | 0 (0.0%) | 0.0 |
Fertility by Education by Marriage Status in New Hartford Center
| Educational Attainment | Married | Unmarried |
| Less than High School | 0 (0.0%) | 0 (0.0%) |
| High School Diploma | 0 (0.0%) | 0 (0.0%) |
| College or Associate's Degree | 0 (0.0%) | 0 (0.0%) |
| Bachelor's Degree | 0 (0.0%) | 0 (0.0%) |
| Graduate Degree | 0 (0.0%) | 0 (0.0%) |
| Total | 0 (0.0%) | 0 (0.0%) |
Employment Characteristics in New Hartford Center
Employment by Class of Employer in New Hartford Center
Among the 582 employed individuals in New Hartford Center, private company employees (390 | 67.0%), not-for-profit organizations (115 | 19.8%), and self-employed (not incorporated) (46 | 7.9%) make up the most common classes of employment.
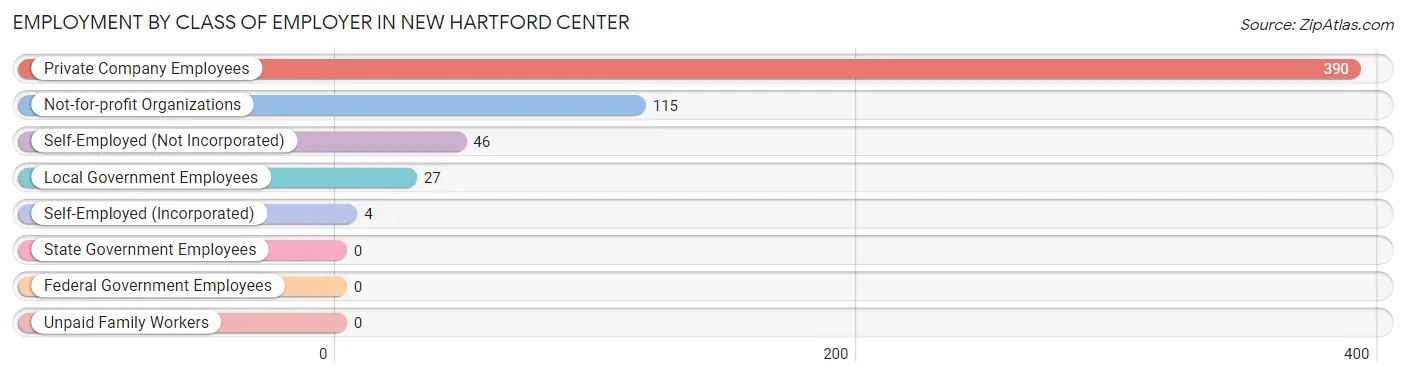
| Employer Class | # Employees | % Employees |
| Private Company Employees | 390 | 67.0% |
| Self-Employed (Incorporated) | 4 | 0.7% |
| Self-Employed (Not Incorporated) | 46 | 7.9% |
| Not-for-profit Organizations | 115 | 19.8% |
| Local Government Employees | 27 | 4.6% |
| State Government Employees | 0 | 0.0% |
| Federal Government Employees | 0 | 0.0% |
| Unpaid Family Workers | 0 | 0.0% |
| Total | 582 | 100.0% |
Employment Status by Age in New Hartford Center
According to the labor force statistics for New Hartford Center, out of the total population over 16 years of age (965), 63.5% or 613 individuals are in the labor force, with 5.1% or 31 of them unemployed. The age group with the highest labor force participation rate is 25 to 29 years, with 100.0% or 59 individuals in the labor force. Within the labor force, the 35 to 44 years age range has the highest percentage of unemployed individuals, with 25.0% or 31 of them being unemployed.
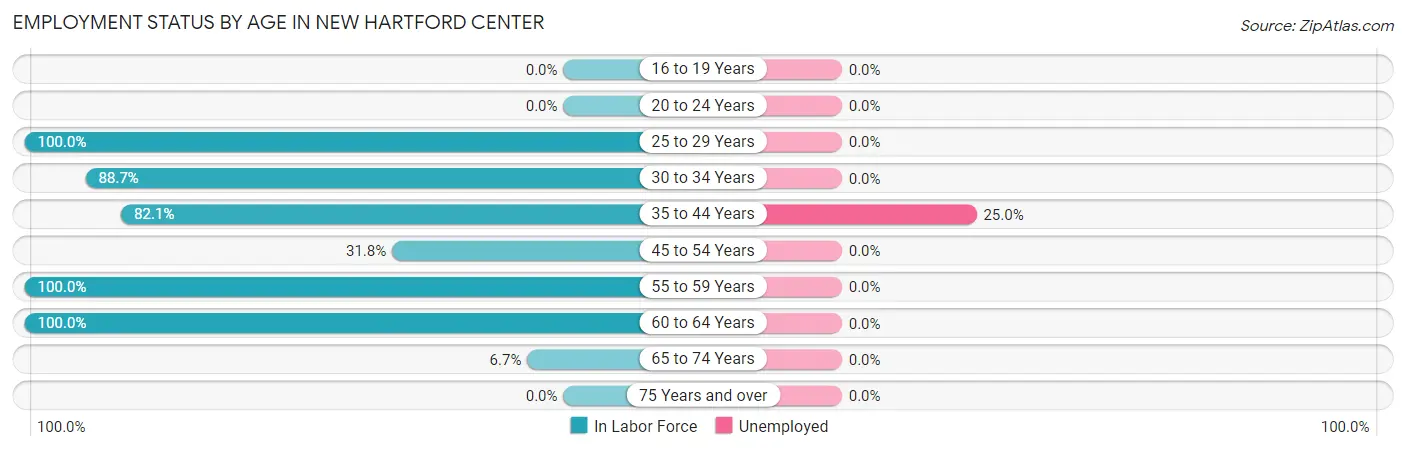
| Age Bracket | In Labor Force | Unemployed |
| 16 to 19 Years | 0 (0.0%) | 0 (0.0%) |
| 20 to 24 Years | 0 (0.0%) | 0 (0.0%) |
| 25 to 29 Years | 59 (100.0%) | 0 (0.0%) |
| 30 to 34 Years | 157 (88.7%) | 0 (0.0%) |
| 35 to 44 Years | 124 (82.1%) | 31 (25.0%) |
| 45 to 54 Years | 7 (31.8%) | 0 (0.0%) |
| 55 to 59 Years | 132 (100.0%) | 0 (0.0%) |
| 60 to 64 Years | 122 (100.0%) | 0 (0.0%) |
| 65 to 74 Years | 12 (6.7%) | 0 (0.0%) |
| 75 Years and over | 0 (0.0%) | 0 (0.0%) |
| Total | 613 (63.5%) | 31 (5.1%) |
Employment Status by Educational Attainment in New Hartford Center
According to labor force statistics for New Hartford Center, 90.6% of individuals (601) out of the total population between 25 and 64 years of age (663) are in the labor force, with 5.2% or 31 of them being unemployed. The group with the highest labor force participation rate are those with the educational attainment of high school diploma, with 100.0% or 98 individuals in the labor force. Within the labor force, individuals with college / associate degree education have the highest percentage of unemployment, with 16.1% or 31 of them being unemployed.
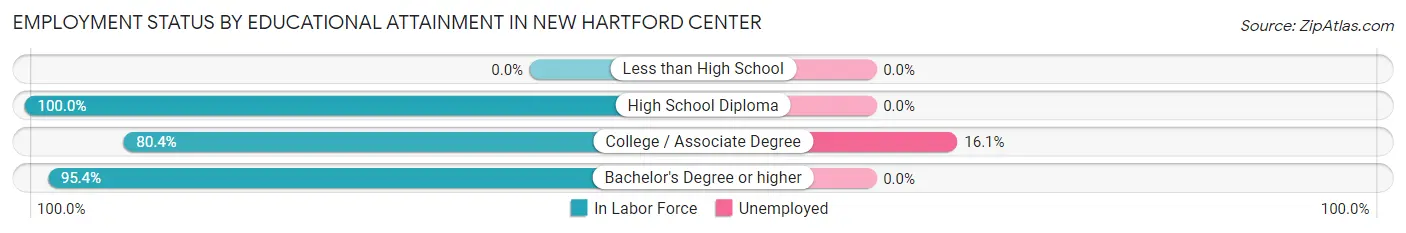
| Educational Attainment | In Labor Force | Unemployed |
| Less than High School | 0 (0.0%) | 0 (0.0%) |
| High School Diploma | 98 (100.0%) | 0 (0.0%) |
| College / Associate Degree | 193 (80.4%) | 39 (16.1%) |
| Bachelor's Degree or higher | 310 (95.4%) | 0 (0.0%) |
| Total | 601 (90.6%) | 34 (5.2%) |
Employment Occupations by Sex in New Hartford Center
Management, Business, Science and Arts Occupations
The most common Management, Business, Science and Arts occupations in New Hartford Center are Community & Social Service (156 | 26.8%), Management (75 | 12.9%), Education Instruction & Library (65 | 11.2%), Business & Financial (64 | 11.0%), and Arts, Media & Entertainment (58 | 10.0%).
Management, Business, Science and Arts Occupations by Sex
Within the Management, Business, Science and Arts occupations in New Hartford Center, the most male-oriented occupations are Education, Arts & Media (100.0%), Arts, Media & Entertainment (100.0%), and Community & Social Service (50.0%), while the most female-oriented occupations are Management (100.0%), Business & Financial (100.0%), and Computers, Engineering & Science (100.0%).
| Occupation | Male | Female |
| Management | 0 (0.0%) | 75 (100.0%) |
| Business & Financial | 0 (0.0%) | 64 (100.0%) |
| Computers, Engineering & Science | 0 (0.0%) | 20 (100.0%) |
| Computers & Mathematics | 0 (0.0%) | 0 (0.0%) |
| Architecture & Engineering | 0 (0.0%) | 20 (100.0%) |
| Life, Physical & Social Science | 0 (0.0%) | 0 (0.0%) |
| Community & Social Service | 78 (50.0%) | 78 (50.0%) |
| Education, Arts & Media | 20 (100.0%) | 0 (0.0%) |
| Legal Services & Support | 0 (0.0%) | 13 (100.0%) |
| Education Instruction & Library | 0 (0.0%) | 65 (100.0%) |
| Arts, Media & Entertainment | 58 (100.0%) | 0 (0.0%) |
| Health Diagnosing & Treating | 4 (15.4%) | 22 (84.6%) |
| Health Technologists | 4 (15.4%) | 22 (84.6%) |
| Total (Category) | 82 (24.0%) | 259 (75.9%) |
| Total (Overall) | 240 (41.2%) | 342 (58.8%) |
Services Occupations
The most common Services occupations in New Hartford Center are Healthcare Support (45 | 7.7%), Food Preparation & Serving (38 | 6.5%), Cleaning & Maintenance (28 | 4.8%), Security & Protection (15 | 2.6%), and Firefighting & Prevention (15 | 2.6%).
Services Occupations by Sex
Within the Services occupations in New Hartford Center, the most male-oriented occupations are Security & Protection (100.0%), Firefighting & Prevention (100.0%), and Cleaning & Maintenance (100.0%), while the most female-oriented occupations are Healthcare Support (100.0%), and Food Preparation & Serving (100.0%).
| Occupation | Male | Female |
| Healthcare Support | 0 (0.0%) | 45 (100.0%) |
| Security & Protection | 15 (100.0%) | 0 (0.0%) |
| Firefighting & Prevention | 15 (100.0%) | 0 (0.0%) |
| Law Enforcement | 0 (0.0%) | 0 (0.0%) |
| Food Preparation & Serving | 0 (0.0%) | 38 (100.0%) |
| Cleaning & Maintenance | 28 (100.0%) | 0 (0.0%) |
| Personal Care & Service | 0 (0.0%) | 0 (0.0%) |
| Total (Category) | 43 (34.1%) | 83 (65.9%) |
| Total (Overall) | 240 (41.2%) | 342 (58.8%) |
Sales and Office Occupations
The most common Sales and Office occupations in New Hartford Center are , and Sales & Related (12 | 2.1%).
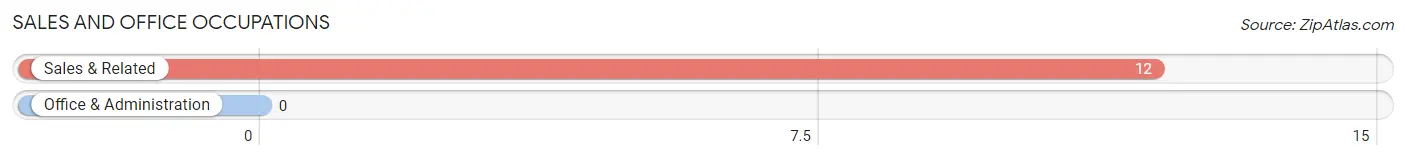
Sales and Office Occupations by Sex
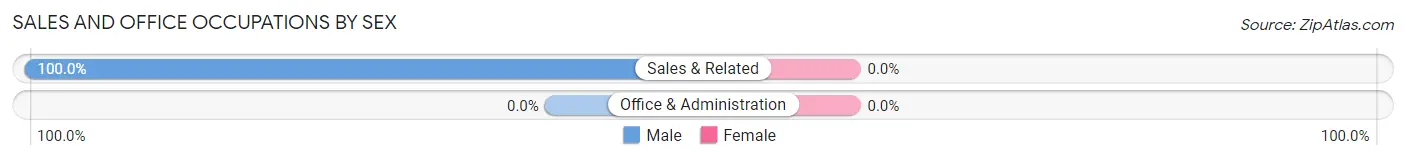
| Occupation | Male | Female |
| Sales & Related | 12 (100.0%) | 0 (0.0%) |
| Office & Administration | 0 (0.0%) | 0 (0.0%) |
| Total (Category) | 12 (100.0%) | 0 (0.0%) |
| Total (Overall) | 240 (41.2%) | 342 (58.8%) |
Natural Resources, Construction and Maintenance Occupations
The most common Natural Resources, Construction and Maintenance occupations in New Hartford Center are , and Construction & Extraction (38 | 6.5%).
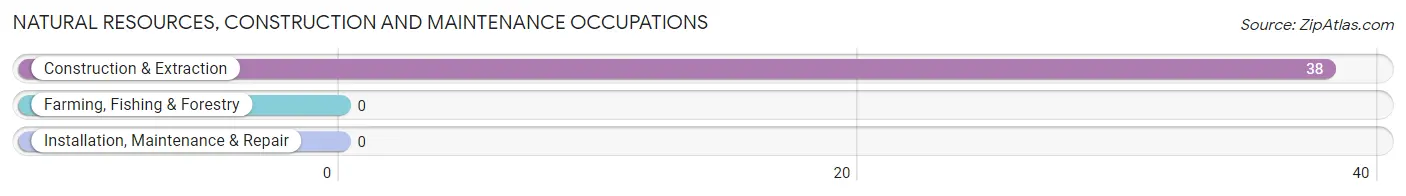
Natural Resources, Construction and Maintenance Occupations by Sex
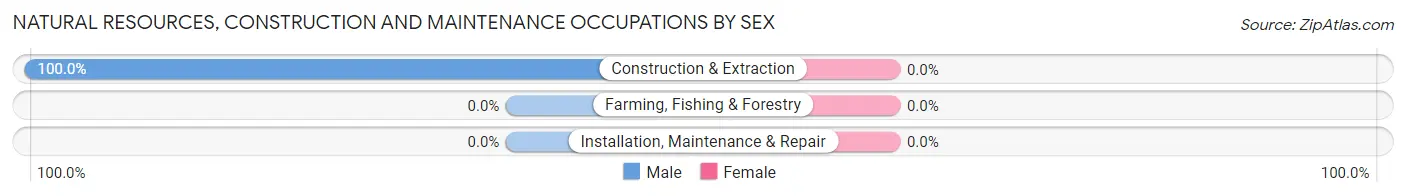
| Occupation | Male | Female |
| Farming, Fishing & Forestry | 0 (0.0%) | 0 (0.0%) |
| Construction & Extraction | 38 (100.0%) | 0 (0.0%) |
| Installation, Maintenance & Repair | 0 (0.0%) | 0 (0.0%) |
| Total (Category) | 38 (100.0%) | 0 (0.0%) |
| Total (Overall) | 240 (41.2%) | 342 (58.8%) |
Production, Transportation and Moving Occupations
The most common Production, Transportation and Moving occupations in New Hartford Center are , and Production (65 | 11.2%).
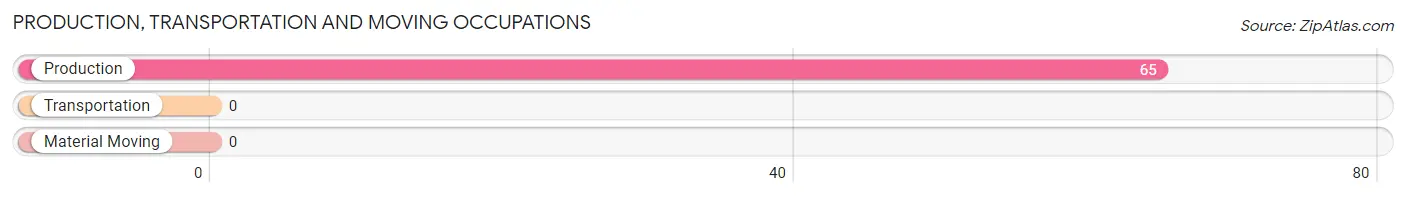
Production, Transportation and Moving Occupations by Sex
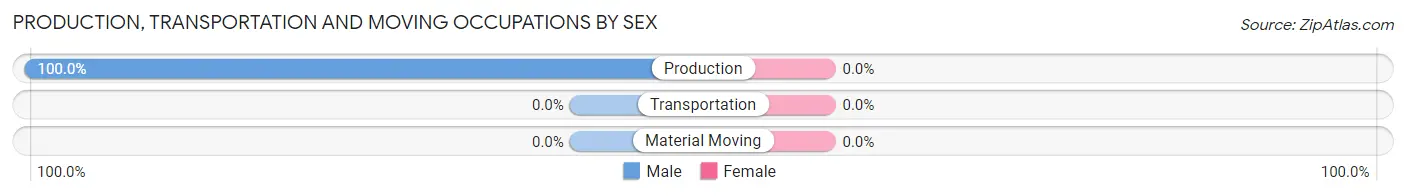
| Occupation | Male | Female |
| Production | 65 (100.0%) | 0 (0.0%) |
| Transportation | 0 (0.0%) | 0 (0.0%) |
| Material Moving | 0 (0.0%) | 0 (0.0%) |
| Total (Category) | 65 (100.0%) | 0 (0.0%) |
| Total (Overall) | 240 (41.2%) | 342 (58.8%) |
Employment Industries by Sex in New Hartford Center
Employment Industries in New Hartford Center
The major employment industries in New Hartford Center include Finance & Insurance (106 | 18.2%), Health Care & Social Assistance (86 | 14.8%), Educational Services (80 | 13.8%), Professional & Scientific (78 | 13.4%), and Manufacturing (65 | 11.2%).
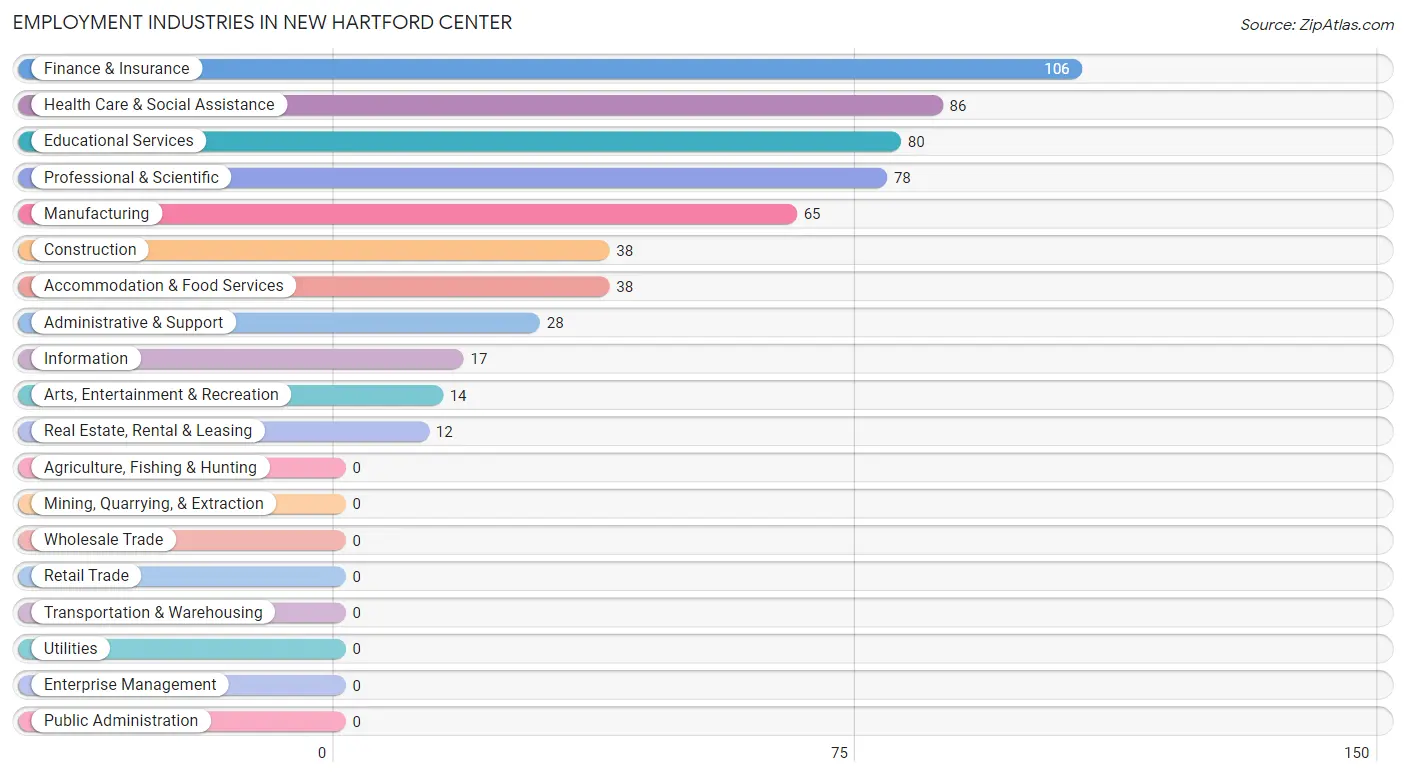
Employment Industries by Sex in New Hartford Center
The New Hartford Center industries that see more men than women are Construction (100.0%), Manufacturing (100.0%), and Information (100.0%), whereas the industries that tend to have a higher number of women are Finance & Insurance (100.0%), Accommodation & Food Services (100.0%), and Health Care & Social Assistance (95.4%).
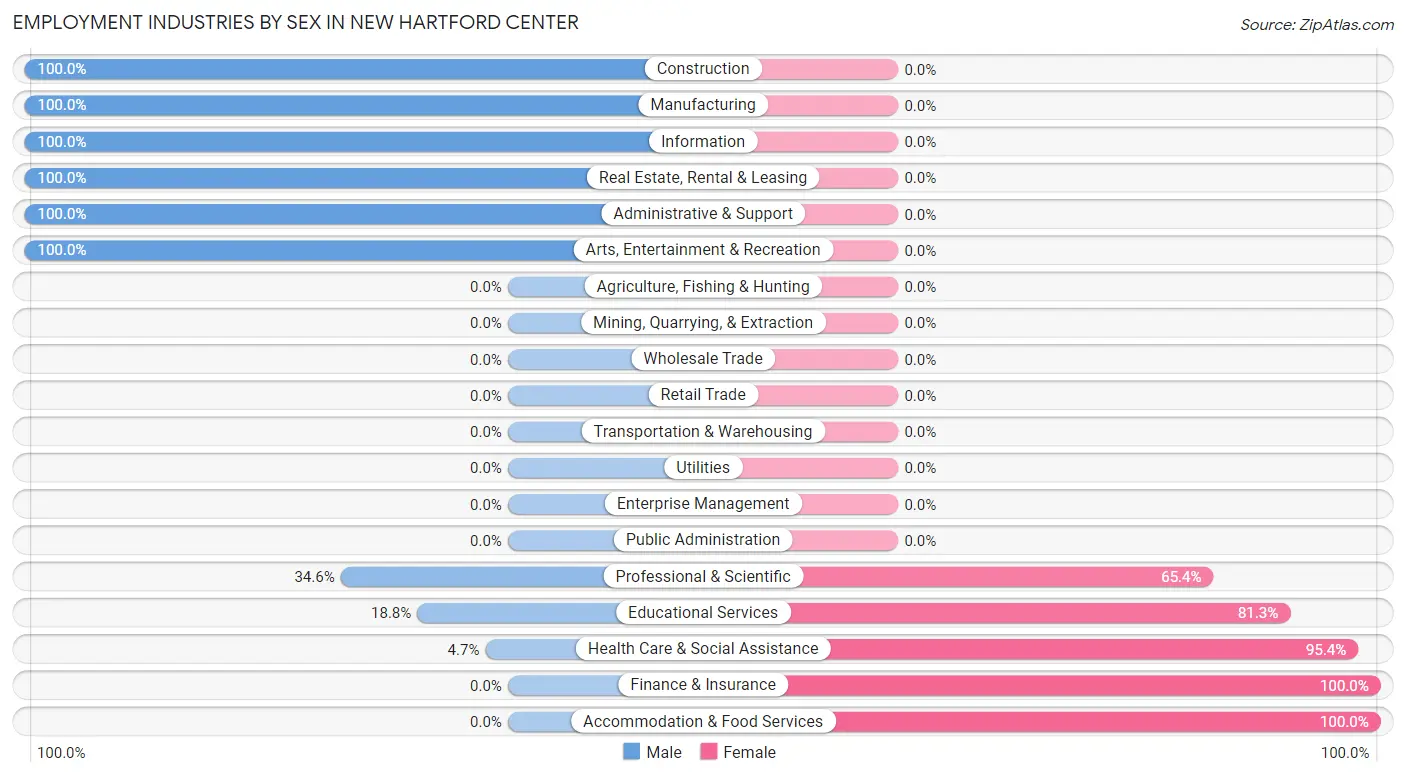
| Industry | Male | Female |
| Agriculture, Fishing & Hunting | 0 (0.0%) | 0 (0.0%) |
| Mining, Quarrying, & Extraction | 0 (0.0%) | 0 (0.0%) |
| Construction | 38 (100.0%) | 0 (0.0%) |
| Manufacturing | 65 (100.0%) | 0 (0.0%) |
| Wholesale Trade | 0 (0.0%) | 0 (0.0%) |
| Retail Trade | 0 (0.0%) | 0 (0.0%) |
| Transportation & Warehousing | 0 (0.0%) | 0 (0.0%) |
| Utilities | 0 (0.0%) | 0 (0.0%) |
| Information | 17 (100.0%) | 0 (0.0%) |
| Finance & Insurance | 0 (0.0%) | 106 (100.0%) |
| Real Estate, Rental & Leasing | 12 (100.0%) | 0 (0.0%) |
| Professional & Scientific | 27 (34.6%) | 51 (65.4%) |
| Enterprise Management | 0 (0.0%) | 0 (0.0%) |
| Administrative & Support | 28 (100.0%) | 0 (0.0%) |
| Educational Services | 15 (18.8%) | 65 (81.2%) |
| Health Care & Social Assistance | 4 (4.6%) | 82 (95.4%) |
| Arts, Entertainment & Recreation | 14 (100.0%) | 0 (0.0%) |
| Accommodation & Food Services | 0 (0.0%) | 38 (100.0%) |
| Public Administration | 0 (0.0%) | 0 (0.0%) |
| Total | 240 (41.2%) | 342 (58.8%) |
Education in New Hartford Center
School Enrollment in New Hartford Center
The most common levels of schooling among the 283 students in New Hartford Center are middle school (135 | 47.7%), high school (87 | 30.7%), and nursery / preschool (35 | 12.4%).
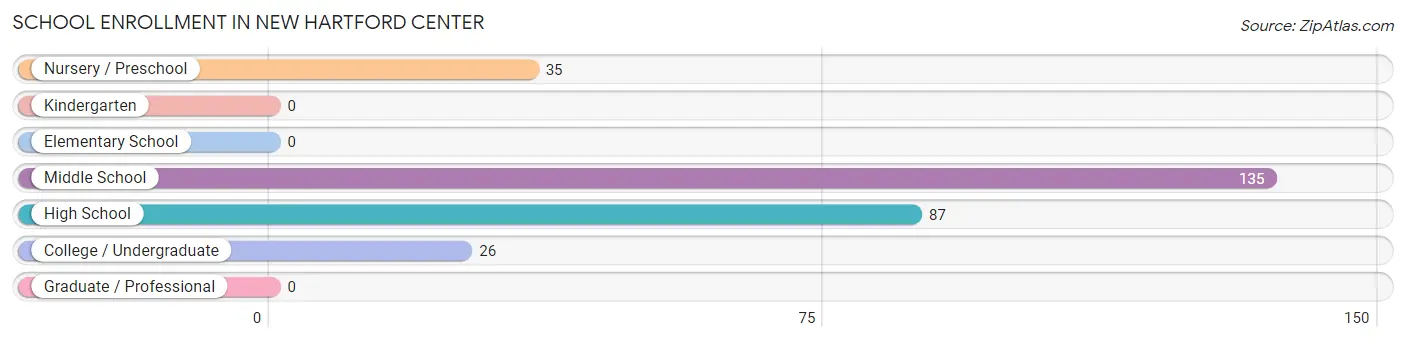
| School Level | # Students | % Students |
| Nursery / Preschool | 35 | 12.4% |
| Kindergarten | 0 | 0.0% |
| Elementary School | 0 | 0.0% |
| Middle School | 135 | 47.7% |
| High School | 87 | 30.7% |
| College / Undergraduate | 26 | 9.2% |
| Graduate / Professional | 0 | 0.0% |
| Total | 283 | 100.0% |
School Enrollment by Age by Funding Source in New Hartford Center
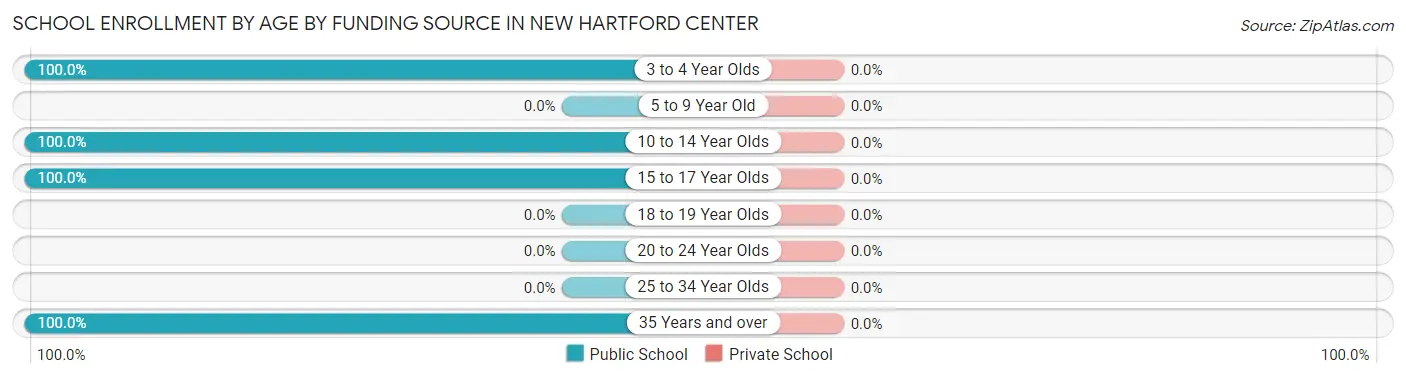
| Age Bracket | Public School | Private School |
| 3 to 4 Year Olds | 35 (100.0%) | 0 (0.0%) |
| 5 to 9 Year Old | 0 (0.0%) | 0 (0.0%) |
| 10 to 14 Year Olds | 157 (100.0%) | 0 (0.0%) |
| 15 to 17 Year Olds | 65 (100.0%) | 0 (0.0%) |
| 18 to 19 Year Olds | 0 (0.0%) | 0 (0.0%) |
| 20 to 24 Year Olds | 0 (0.0%) | 0 (0.0%) |
| 25 to 34 Year Olds | 0 (0.0%) | 0 (0.0%) |
| 35 Years and over | 26 (100.0%) | 0 (0.0%) |
| Total | 283 (100.0%) | 0 (0.0%) |
Educational Attainment by Field of Study in New Hartford Center
Education (108 | 25.9%), business (95 | 22.8%), bio, nature & agricultural (79 | 18.9%), engineering (35 | 8.4%), and science & technology (35 | 8.4%) are the most common fields of study among 417 individuals in New Hartford Center who have obtained a bachelor's degree or higher.
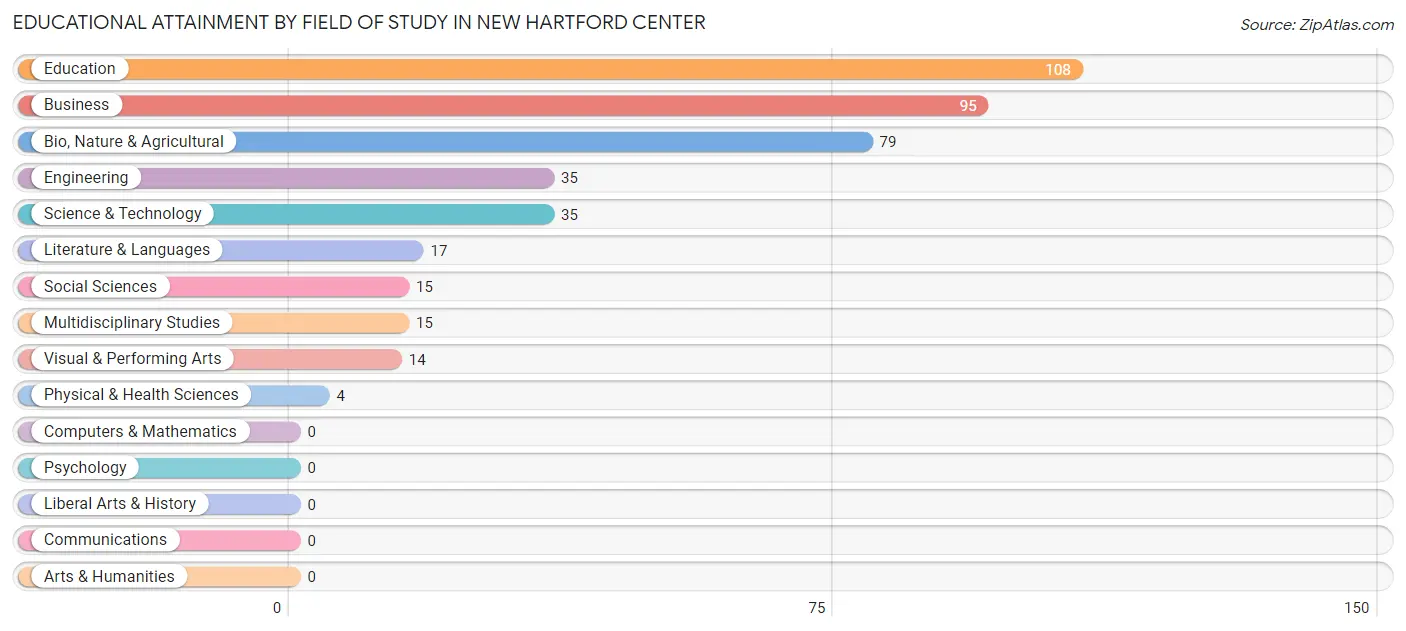
| Field of Study | # Graduates | % Graduates |
| Computers & Mathematics | 0 | 0.0% |
| Bio, Nature & Agricultural | 79 | 18.9% |
| Physical & Health Sciences | 4 | 1.0% |
| Psychology | 0 | 0.0% |
| Social Sciences | 15 | 3.6% |
| Engineering | 35 | 8.4% |
| Multidisciplinary Studies | 15 | 3.6% |
| Science & Technology | 35 | 8.4% |
| Business | 95 | 22.8% |
| Education | 108 | 25.9% |
| Literature & Languages | 17 | 4.1% |
| Liberal Arts & History | 0 | 0.0% |
| Visual & Performing Arts | 14 | 3.4% |
| Communications | 0 | 0.0% |
| Arts & Humanities | 0 | 0.0% |
| Total | 417 | 100.0% |
Transportation & Commute in New Hartford Center
Vehicle Availability by Sex in New Hartford Center
The most prevalent vehicle ownership categories in New Hartford Center are males with 2 vehicles (132, accounting for 55.0%) and females with 2 vehicles (167, making up 38.6%).
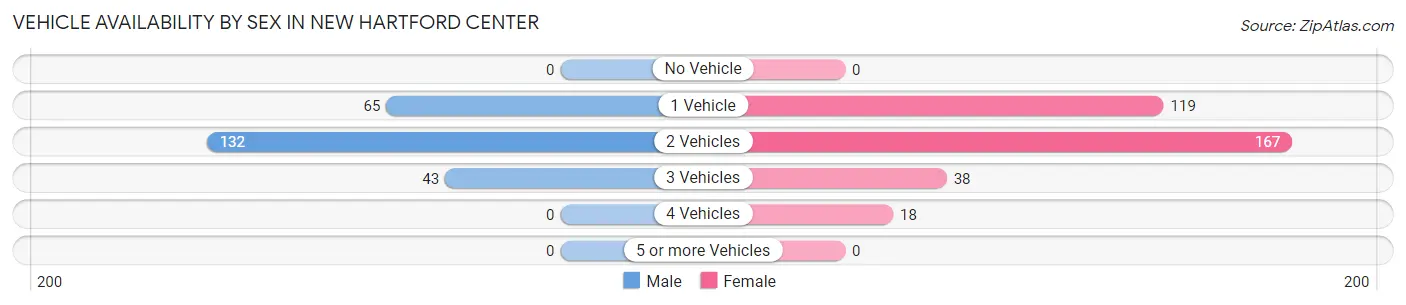
| Vehicles Available | Male | Female |
| No Vehicle | 0 (0.0%) | 0 (0.0%) |
| 1 Vehicle | 65 (27.1%) | 119 (34.8%) |
| 2 Vehicles | 132 (55.0%) | 167 (48.8%) |
| 3 Vehicles | 43 (17.9%) | 38 (11.1%) |
| 4 Vehicles | 0 (0.0%) | 18 (5.3%) |
| 5 or more Vehicles | 0 (0.0%) | 0 (0.0%) |
| Total | 240 (100.0%) | 342 (100.0%) |
Commute Time in New Hartford Center
The most frequently occuring commute durations in New Hartford Center are 35 to 39 minutes (91 commuters, 18.1%), 45 to 59 minutes (91 commuters, 18.1%), and 15 to 19 minutes (76 commuters, 15.1%).
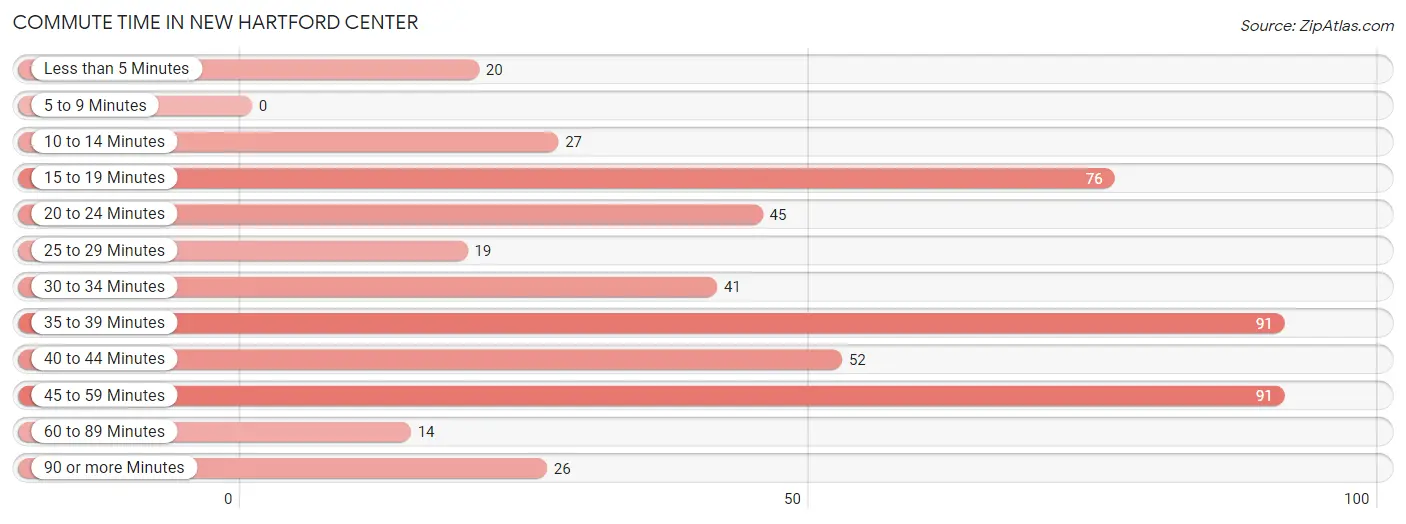
| Commute Time | # Commuters | % Commuters |
| Less than 5 Minutes | 20 | 4.0% |
| 5 to 9 Minutes | 0 | 0.0% |
| 10 to 14 Minutes | 27 | 5.4% |
| 15 to 19 Minutes | 76 | 15.1% |
| 20 to 24 Minutes | 45 | 9.0% |
| 25 to 29 Minutes | 19 | 3.8% |
| 30 to 34 Minutes | 41 | 8.2% |
| 35 to 39 Minutes | 91 | 18.1% |
| 40 to 44 Minutes | 52 | 10.4% |
| 45 to 59 Minutes | 91 | 18.1% |
| 60 to 89 Minutes | 14 | 2.8% |
| 90 or more Minutes | 26 | 5.2% |
Commute Time by Sex in New Hartford Center
The most common commute times in New Hartford Center are 35 to 39 minutes (91 commuters, 37.9%) for males and 15 to 19 minutes (76 commuters, 29.0%) for females.
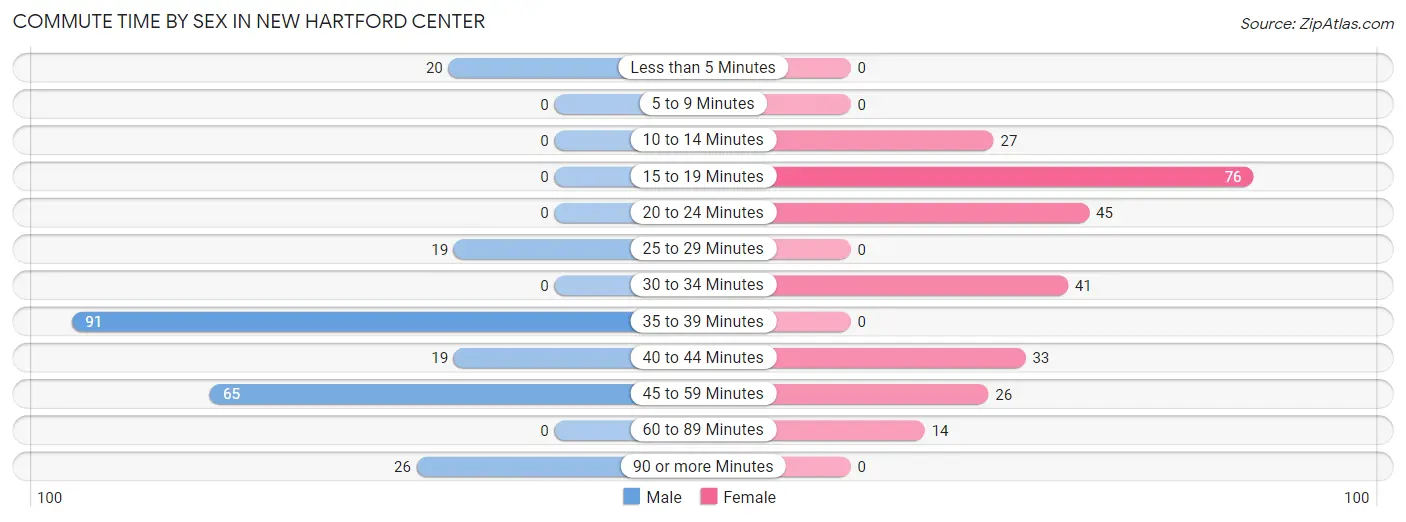
| Commute Time | Male | Female |
| Less than 5 Minutes | 20 (8.3%) | 0 (0.0%) |
| 5 to 9 Minutes | 0 (0.0%) | 0 (0.0%) |
| 10 to 14 Minutes | 0 (0.0%) | 27 (10.3%) |
| 15 to 19 Minutes | 0 (0.0%) | 76 (29.0%) |
| 20 to 24 Minutes | 0 (0.0%) | 45 (17.2%) |
| 25 to 29 Minutes | 19 (7.9%) | 0 (0.0%) |
| 30 to 34 Minutes | 0 (0.0%) | 41 (15.7%) |
| 35 to 39 Minutes | 91 (37.9%) | 0 (0.0%) |
| 40 to 44 Minutes | 19 (7.9%) | 33 (12.6%) |
| 45 to 59 Minutes | 65 (27.1%) | 26 (9.9%) |
| 60 to 89 Minutes | 0 (0.0%) | 14 (5.3%) |
| 90 or more Minutes | 26 (10.8%) | 0 (0.0%) |
Time of Departure to Work by Sex in New Hartford Center
The most frequent times of departure to work in New Hartford Center are 6:00 AM to 6:29 AM (84, 35.0%) for males and 6:30 AM to 6:59 AM (98, 37.4%) for females.
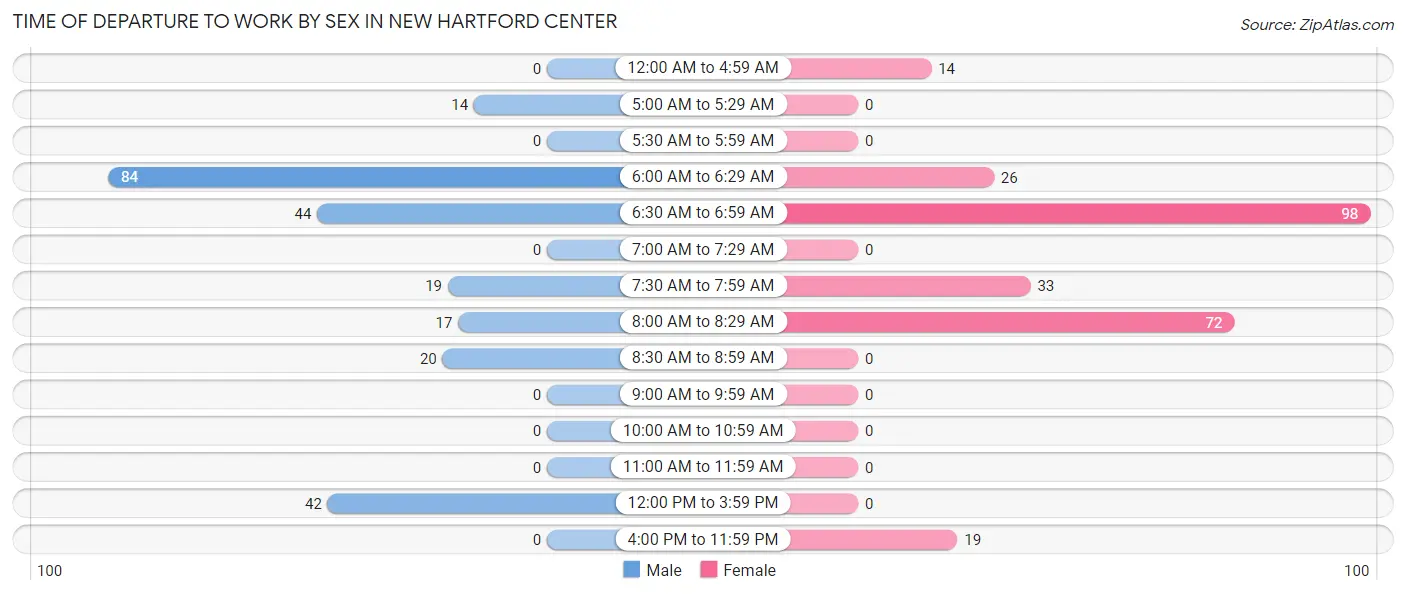
| Time of Departure | Male | Female |
| 12:00 AM to 4:59 AM | 0 (0.0%) | 14 (5.3%) |
| 5:00 AM to 5:29 AM | 14 (5.8%) | 0 (0.0%) |
| 5:30 AM to 5:59 AM | 0 (0.0%) | 0 (0.0%) |
| 6:00 AM to 6:29 AM | 84 (35.0%) | 26 (9.9%) |
| 6:30 AM to 6:59 AM | 44 (18.3%) | 98 (37.4%) |
| 7:00 AM to 7:29 AM | 0 (0.0%) | 0 (0.0%) |
| 7:30 AM to 7:59 AM | 19 (7.9%) | 33 (12.6%) |
| 8:00 AM to 8:29 AM | 17 (7.1%) | 72 (27.5%) |
| 8:30 AM to 8:59 AM | 20 (8.3%) | 0 (0.0%) |
| 9:00 AM to 9:59 AM | 0 (0.0%) | 0 (0.0%) |
| 10:00 AM to 10:59 AM | 0 (0.0%) | 0 (0.0%) |
| 11:00 AM to 11:59 AM | 0 (0.0%) | 0 (0.0%) |
| 12:00 PM to 3:59 PM | 42 (17.5%) | 0 (0.0%) |
| 4:00 PM to 11:59 PM | 0 (0.0%) | 19 (7.2%) |
| Total | 240 (100.0%) | 262 (100.0%) |
Housing Occupancy in New Hartford Center
Occupancy by Ownership in New Hartford Center
Of the total 595 dwellings in New Hartford Center, owner-occupied units account for 396 (66.5%), while renter-occupied units make up 199 (33.5%).
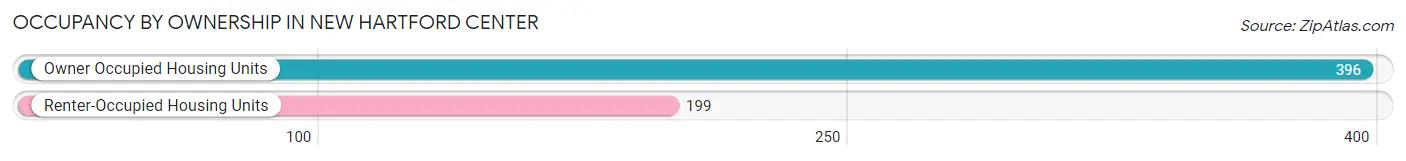
| Occupancy | # Housing Units | % Housing Units |
| Owner Occupied Housing Units | 396 | 66.5% |
| Renter-Occupied Housing Units | 199 | 33.5% |
| Total Occupied Housing Units | 595 | 100.0% |
Occupancy by Household Size in New Hartford Center
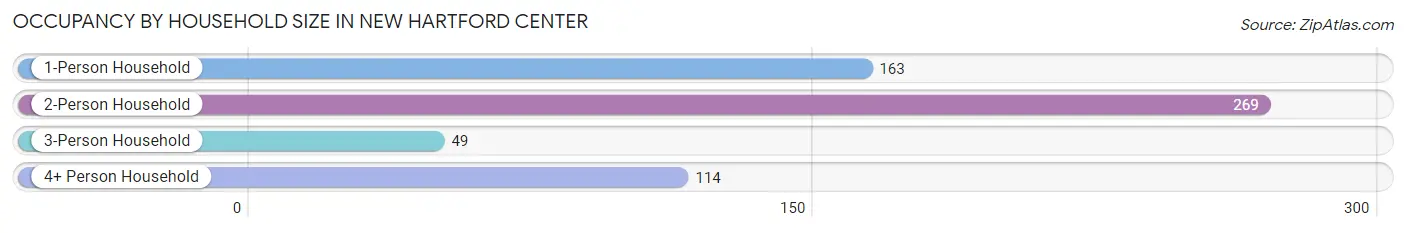
| Household Size | # Housing Units | % Housing Units |
| 1-Person Household | 163 | 27.4% |
| 2-Person Household | 269 | 45.2% |
| 3-Person Household | 49 | 8.2% |
| 4+ Person Household | 114 | 19.2% |
| Total Housing Units | 595 | 100.0% |
Occupancy by Ownership by Household Size in New Hartford Center
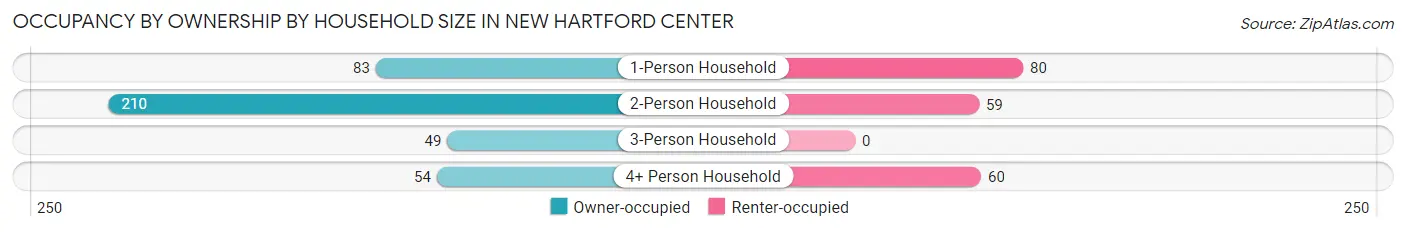
| Household Size | Owner-occupied | Renter-occupied |
| 1-Person Household | 83 (50.9%) | 80 (49.1%) |
| 2-Person Household | 210 (78.1%) | 59 (21.9%) |
| 3-Person Household | 49 (100.0%) | 0 (0.0%) |
| 4+ Person Household | 54 (47.4%) | 60 (52.6%) |
| Total Housing Units | 396 (66.5%) | 199 (33.5%) |
Occupancy by Educational Attainment in New Hartford Center
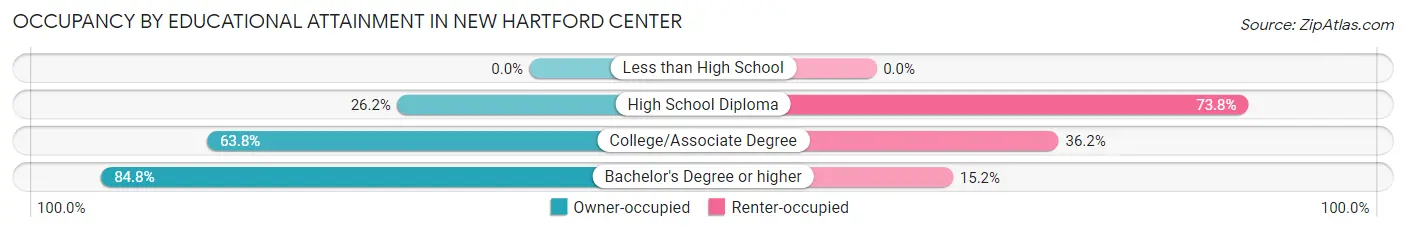
| Household Size | Owner-occupied | Renter-occupied |
| Less than High School | 0 (0.0%) | 0 (0.0%) |
| High School Diploma | 32 (26.2%) | 90 (73.8%) |
| College/Associate Degree | 113 (63.8%) | 64 (36.2%) |
| Bachelor's Degree or higher | 251 (84.8%) | 45 (15.2%) |
Occupancy by Age of Householder in New Hartford Center
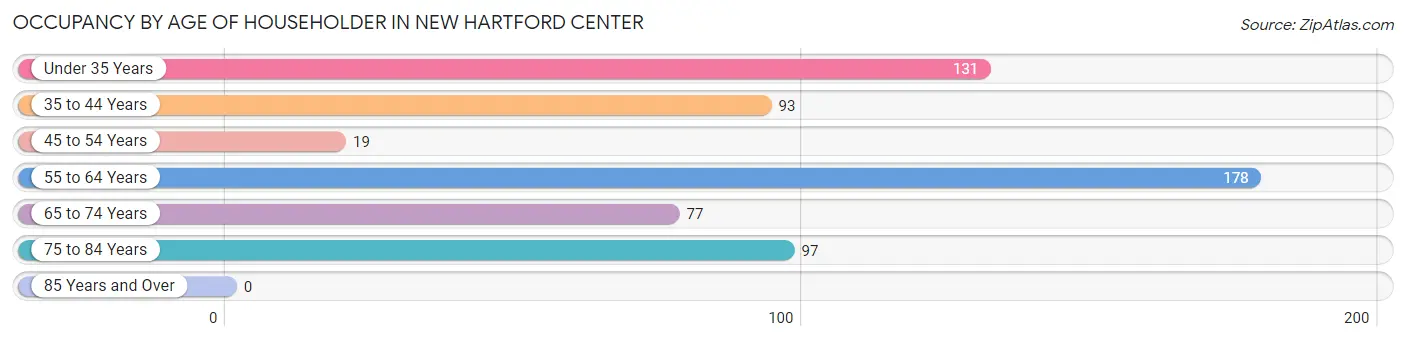
| Age Bracket | # Households | % Households |
| Under 35 Years | 131 | 22.0% |
| 35 to 44 Years | 93 | 15.6% |
| 45 to 54 Years | 19 | 3.2% |
| 55 to 64 Years | 178 | 29.9% |
| 65 to 74 Years | 77 | 12.9% |
| 75 to 84 Years | 97 | 16.3% |
| 85 Years and Over | 0 | 0.0% |
| Total | 595 | 100.0% |
Housing Finances in New Hartford Center
Median Income by Occupancy in New Hartford Center
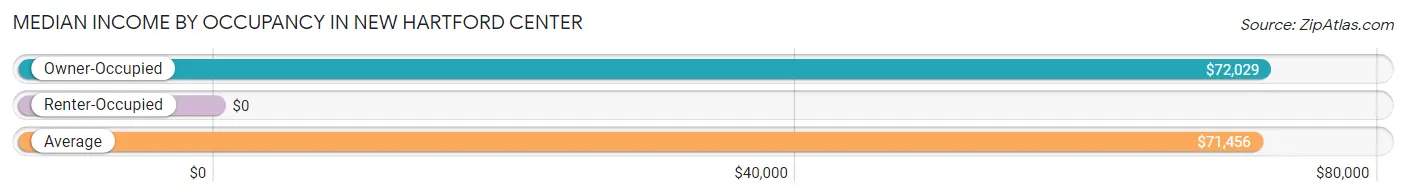
| Occupancy Type | # Households | Median Income |
| Owner-Occupied | 396 (66.5%) | $72,029 |
| Renter-Occupied | 199 (33.5%) | $0 |
| Average | 595 (100.0%) | $71,456 |
Occupancy by Householder Income Bracket in New Hartford Center
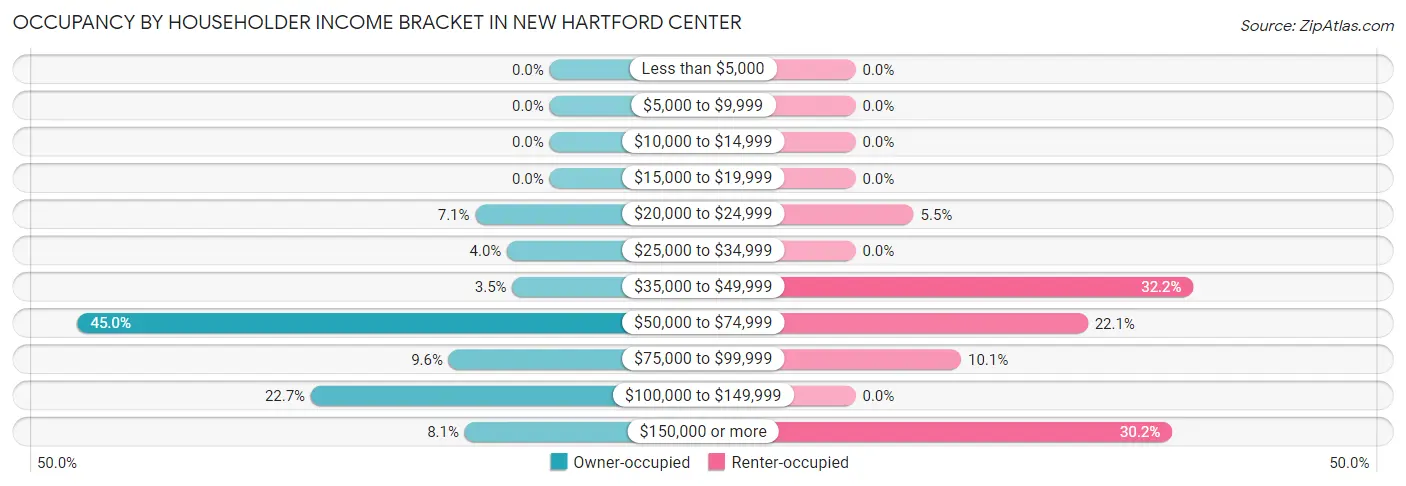
| Income Bracket | Owner-occupied | Renter-occupied |
| Less than $5,000 | 0 (0.0%) | 0 (0.0%) |
| $5,000 to $9,999 | 0 (0.0%) | 0 (0.0%) |
| $10,000 to $14,999 | 0 (0.0%) | 0 (0.0%) |
| $15,000 to $19,999 | 0 (0.0%) | 0 (0.0%) |
| $20,000 to $24,999 | 28 (7.1%) | 11 (5.5%) |
| $25,000 to $34,999 | 16 (4.0%) | 0 (0.0%) |
| $35,000 to $49,999 | 14 (3.5%) | 64 (32.2%) |
| $50,000 to $74,999 | 178 (45.0%) | 44 (22.1%) |
| $75,000 to $99,999 | 38 (9.6%) | 20 (10.1%) |
| $100,000 to $149,999 | 90 (22.7%) | 0 (0.0%) |
| $150,000 or more | 32 (8.1%) | 60 (30.1%) |
| Total | 396 (100.0%) | 199 (100.0%) |
Monthly Housing Cost Tiers in New Hartford Center
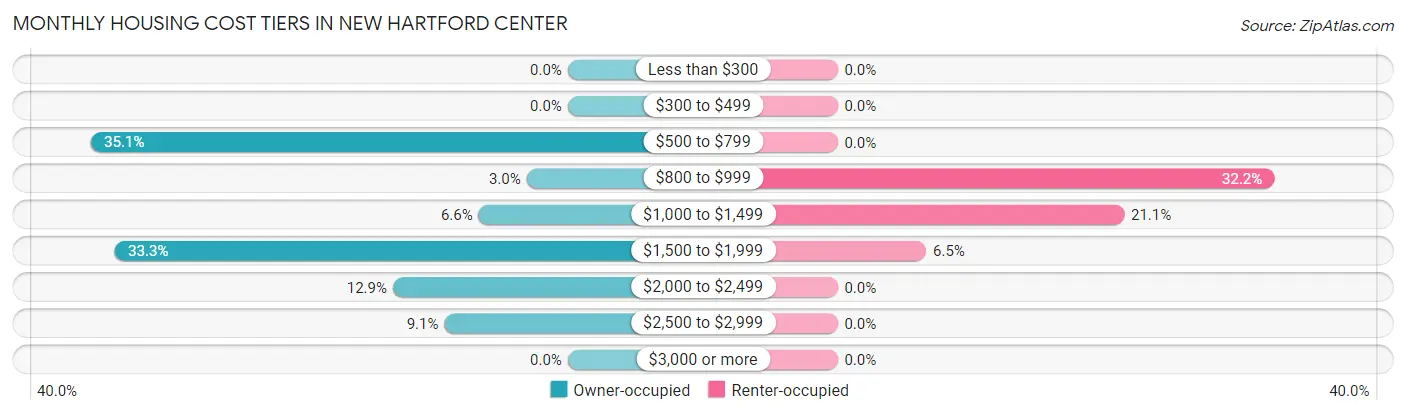
| Monthly Cost | Owner-occupied | Renter-occupied |
| Less than $300 | 0 (0.0%) | 0 (0.0%) |
| $300 to $499 | 0 (0.0%) | 0 (0.0%) |
| $500 to $799 | 139 (35.1%) | 0 (0.0%) |
| $800 to $999 | 12 (3.0%) | 64 (32.2%) |
| $1,000 to $1,499 | 26 (6.6%) | 42 (21.1%) |
| $1,500 to $1,999 | 132 (33.3%) | 13 (6.5%) |
| $2,000 to $2,499 | 51 (12.9%) | 0 (0.0%) |
| $2,500 to $2,999 | 36 (9.1%) | 0 (0.0%) |
| $3,000 or more | 0 (0.0%) | 0 (0.0%) |
| Total | 396 (100.0%) | 199 (100.0%) |
Physical Housing Characteristics in New Hartford Center
Housing Structures in New Hartford Center
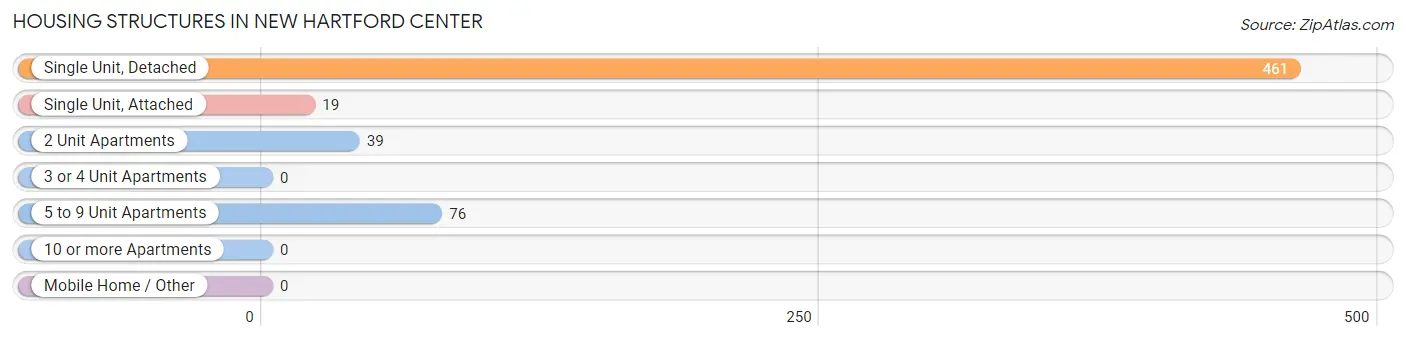
| Structure Type | # Housing Units | % Housing Units |
| Single Unit, Detached | 461 | 77.5% |
| Single Unit, Attached | 19 | 3.2% |
| 2 Unit Apartments | 39 | 6.6% |
| 3 or 4 Unit Apartments | 0 | 0.0% |
| 5 to 9 Unit Apartments | 76 | 12.8% |
| 10 or more Apartments | 0 | 0.0% |
| Mobile Home / Other | 0 | 0.0% |
| Total | 595 | 100.0% |
Housing Structures by Occupancy in New Hartford Center
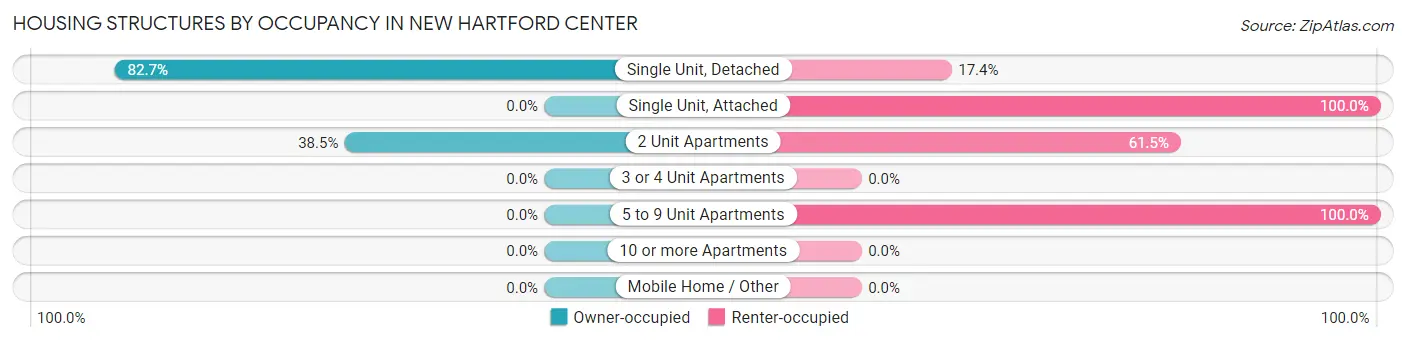
| Structure Type | Owner-occupied | Renter-occupied |
| Single Unit, Detached | 381 (82.7%) | 80 (17.3%) |
| Single Unit, Attached | 0 (0.0%) | 19 (100.0%) |
| 2 Unit Apartments | 15 (38.5%) | 24 (61.5%) |
| 3 or 4 Unit Apartments | 0 (0.0%) | 0 (0.0%) |
| 5 to 9 Unit Apartments | 0 (0.0%) | 76 (100.0%) |
| 10 or more Apartments | 0 (0.0%) | 0 (0.0%) |
| Mobile Home / Other | 0 (0.0%) | 0 (0.0%) |
| Total | 396 (66.5%) | 199 (33.5%) |
Housing Structures by Number of Rooms in New Hartford Center
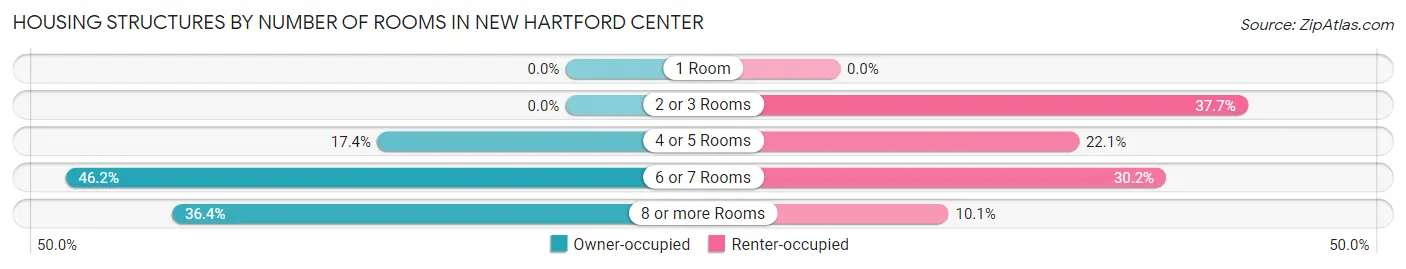
| Number of Rooms | Owner-occupied | Renter-occupied |
| 1 Room | 0 (0.0%) | 0 (0.0%) |
| 2 or 3 Rooms | 0 (0.0%) | 75 (37.7%) |
| 4 or 5 Rooms | 69 (17.4%) | 44 (22.1%) |
| 6 or 7 Rooms | 183 (46.2%) | 60 (30.1%) |
| 8 or more Rooms | 144 (36.4%) | 20 (10.1%) |
| Total | 396 (100.0%) | 199 (100.0%) |
Housing Structure by Heating Type in New Hartford Center
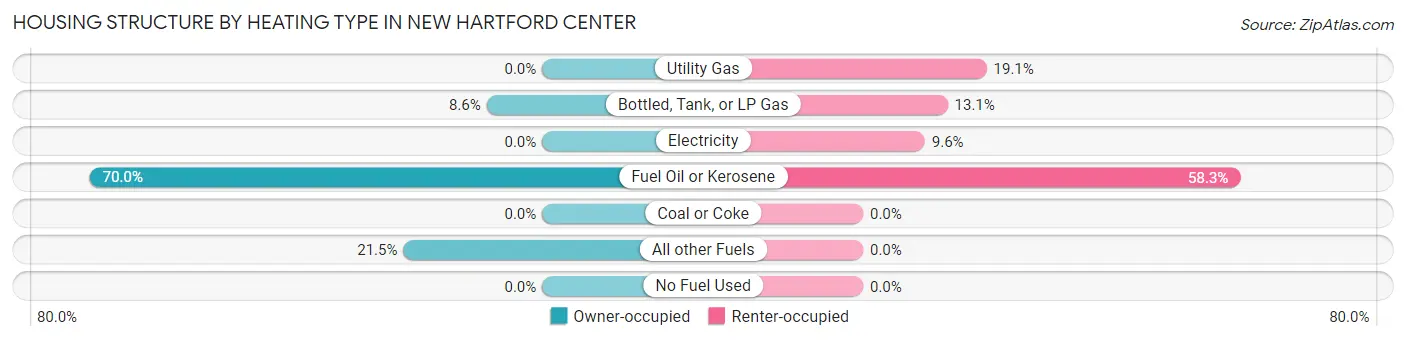
| Heating Type | Owner-occupied | Renter-occupied |
| Utility Gas | 0 (0.0%) | 38 (19.1%) |
| Bottled, Tank, or LP Gas | 34 (8.6%) | 26 (13.1%) |
| Electricity | 0 (0.0%) | 19 (9.6%) |
| Fuel Oil or Kerosene | 277 (70.0%) | 116 (58.3%) |
| Coal or Coke | 0 (0.0%) | 0 (0.0%) |
| All other Fuels | 85 (21.5%) | 0 (0.0%) |
| No Fuel Used | 0 (0.0%) | 0 (0.0%) |
| Total | 396 (100.0%) | 199 (100.0%) |
Household Vehicle Usage in New Hartford Center
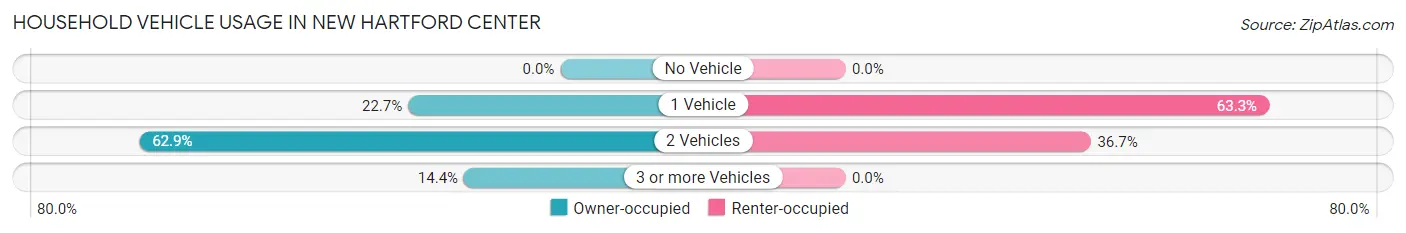
| Vehicles per Household | Owner-occupied | Renter-occupied |
| No Vehicle | 0 (0.0%) | 0 (0.0%) |
| 1 Vehicle | 90 (22.7%) | 126 (63.3%) |
| 2 Vehicles | 249 (62.9%) | 73 (36.7%) |
| 3 or more Vehicles | 57 (14.4%) | 0 (0.0%) |
| Total | 396 (100.0%) | 199 (100.0%) |
Real Estate & Mortgages in New Hartford Center
Real Estate and Mortgage Overview in New Hartford Center
| Characteristic | Without Mortgage | With Mortgage |
| Housing Units | 137 | 259 |
| Median Property Value | $163,800 | $228,100 |
| Median Household Income | $70,838 | $32 |
| Monthly Housing Costs | $661 | $0 |
| Real Estate Taxes | $3,552 | $0 |
Property Value by Mortgage Status in New Hartford Center
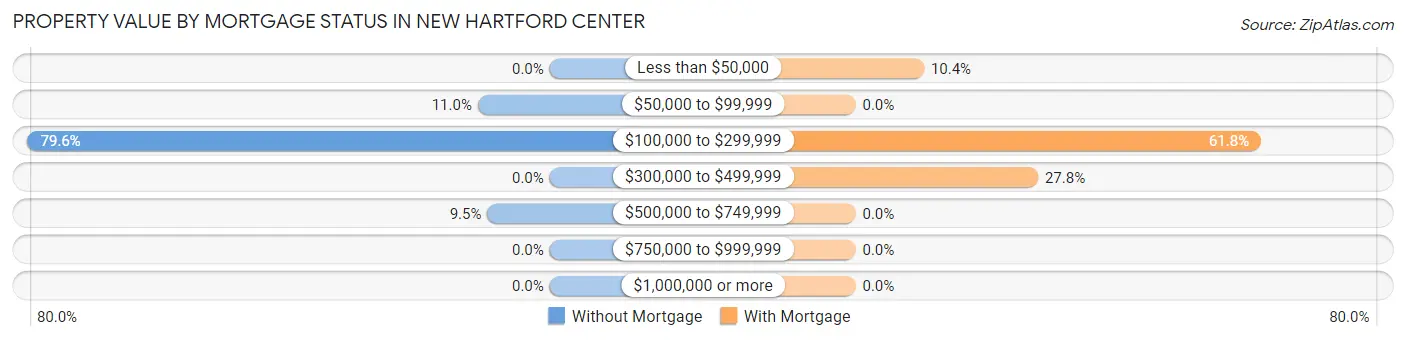
| Property Value | Without Mortgage | With Mortgage |
| Less than $50,000 | 0 (0.0%) | 27 (10.4%) |
| $50,000 to $99,999 | 15 (11.0%) | 0 (0.0%) |
| $100,000 to $299,999 | 109 (79.6%) | 160 (61.8%) |
| $300,000 to $499,999 | 0 (0.0%) | 72 (27.8%) |
| $500,000 to $749,999 | 13 (9.5%) | 0 (0.0%) |
| $750,000 to $999,999 | 0 (0.0%) | 0 (0.0%) |
| $1,000,000 or more | 0 (0.0%) | 0 (0.0%) |
| Total | 137 (100.0%) | 259 (100.0%) |
Household Income by Mortgage Status in New Hartford Center
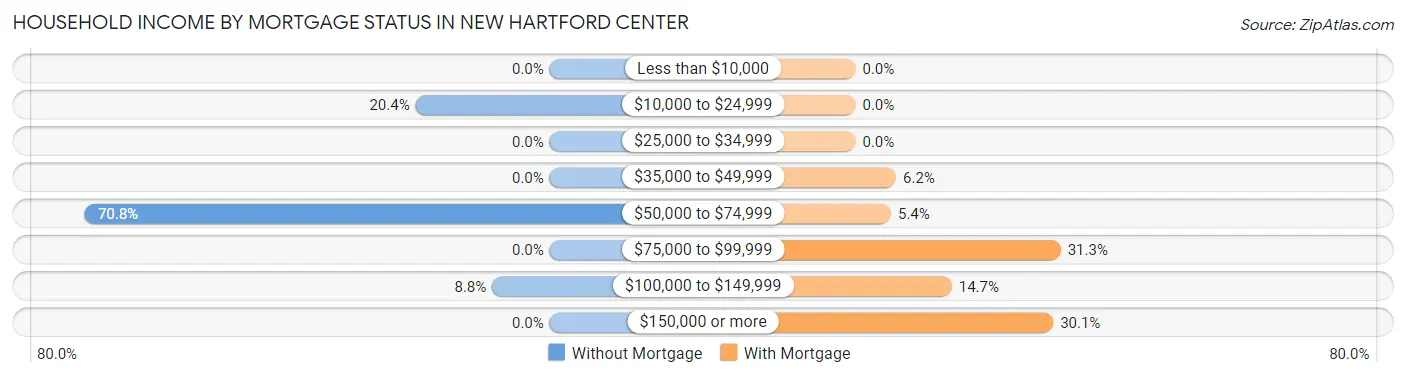
| Household Income | Without Mortgage | With Mortgage |
| Less than $10,000 | 0 (0.0%) | 0 (0.0%) |
| $10,000 to $24,999 | 28 (20.4%) | 0 (0.0%) |
| $25,000 to $34,999 | 0 (0.0%) | 0 (0.0%) |
| $35,000 to $49,999 | 0 (0.0%) | 16 (6.2%) |
| $50,000 to $74,999 | 97 (70.8%) | 14 (5.4%) |
| $75,000 to $99,999 | 0 (0.0%) | 81 (31.3%) |
| $100,000 to $149,999 | 12 (8.8%) | 38 (14.7%) |
| $150,000 or more | 0 (0.0%) | 78 (30.1%) |
| Total | 137 (100.0%) | 259 (100.0%) |
Property Value to Household Income Ratio in New Hartford Center
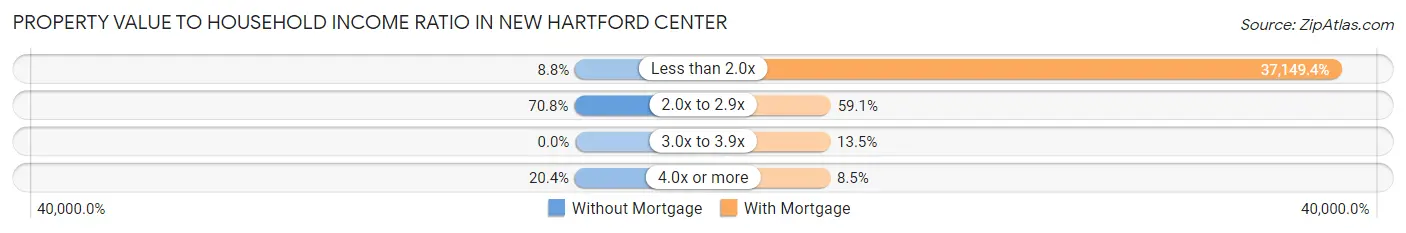
| Value-to-Income Ratio | Without Mortgage | With Mortgage |
| Less than 2.0x | 12 (8.8%) | 96,217 (37,149.4%) |
| 2.0x to 2.9x | 97 (70.8%) | 153 (59.1%) |
| 3.0x to 3.9x | 0 (0.0%) | 35 (13.5%) |
| 4.0x or more | 28 (20.4%) | 22 (8.5%) |
| Total | 137 (100.0%) | 259 (100.0%) |
Real Estate Taxes by Mortgage Status in New Hartford Center
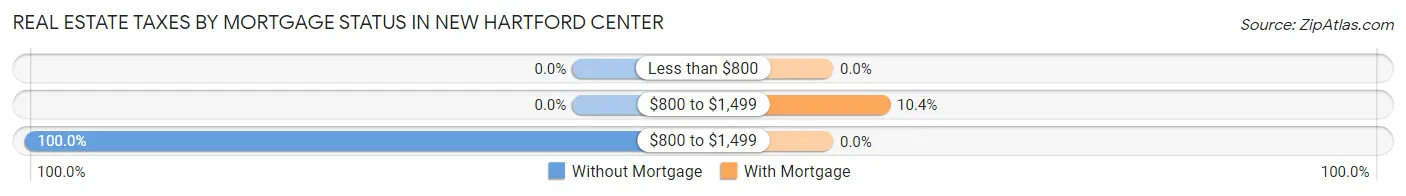
| Property Taxes | Without Mortgage | With Mortgage |
| Less than $800 | 0 (0.0%) | 0 (0.0%) |
| $800 to $1,499 | 0 (0.0%) | 27 (10.4%) |
| $800 to $1,499 | 137 (100.0%) | 0 (0.0%) |
| Total | 137 (100.0%) | 259 (100.0%) |
Health & Disability in New Hartford Center
Health Insurance Coverage by Age in New Hartford Center
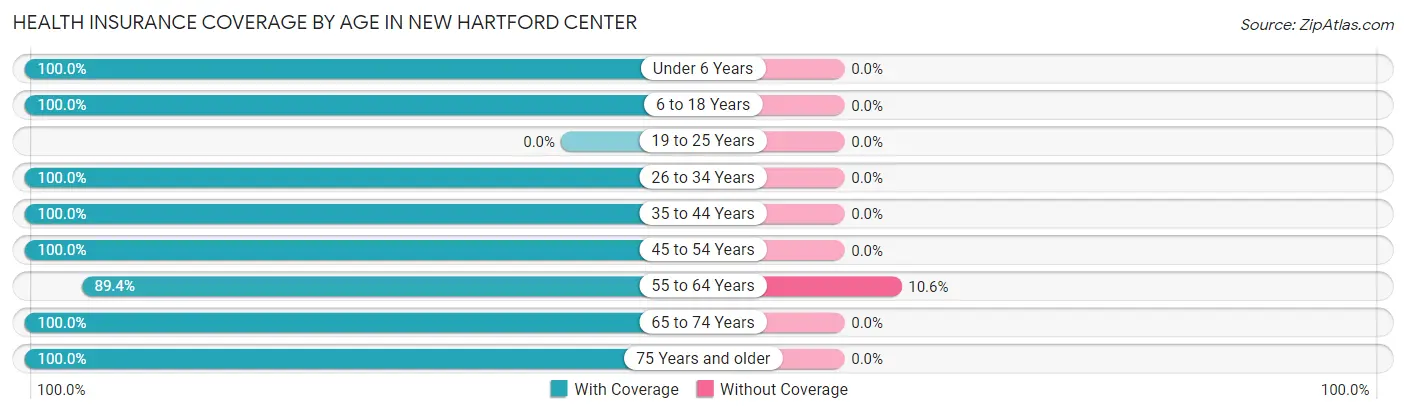
| Age Bracket | With Coverage | Without Coverage |
| Under 6 Years | 202 (100.0%) | 0 (0.0%) |
| 6 to 18 Years | 222 (100.0%) | 0 (0.0%) |
| 19 to 25 Years | 0 (0.0%) | 0 (0.0%) |
| 26 to 34 Years | 236 (100.0%) | 0 (0.0%) |
| 35 to 44 Years | 151 (100.0%) | 0 (0.0%) |
| 45 to 54 Years | 22 (100.0%) | 0 (0.0%) |
| 55 to 64 Years | 227 (89.4%) | 27 (10.6%) |
| 65 to 74 Years | 180 (100.0%) | 0 (0.0%) |
| 75 Years and older | 97 (100.0%) | 0 (0.0%) |
| Total | 1,337 (98.0%) | 27 (2.0%) |
Health Insurance Coverage by Citizenship Status in New Hartford Center
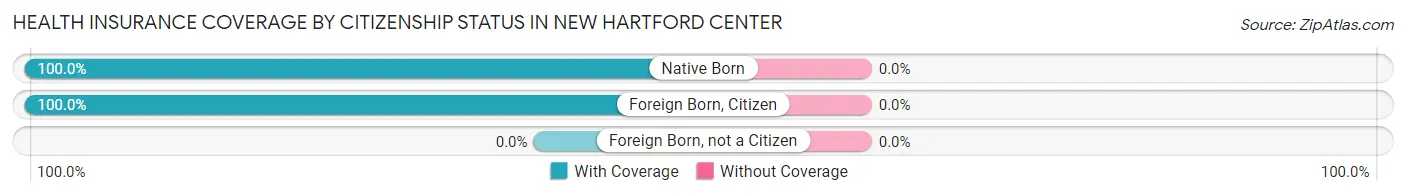
| Citizenship Status | With Coverage | Without Coverage |
| Native Born | 202 (100.0%) | 0 (0.0%) |
| Foreign Born, Citizen | 222 (100.0%) | 0 (0.0%) |
| Foreign Born, not a Citizen | 0 (0.0%) | 0 (0.0%) |
Health Insurance Coverage by Household Income in New Hartford Center
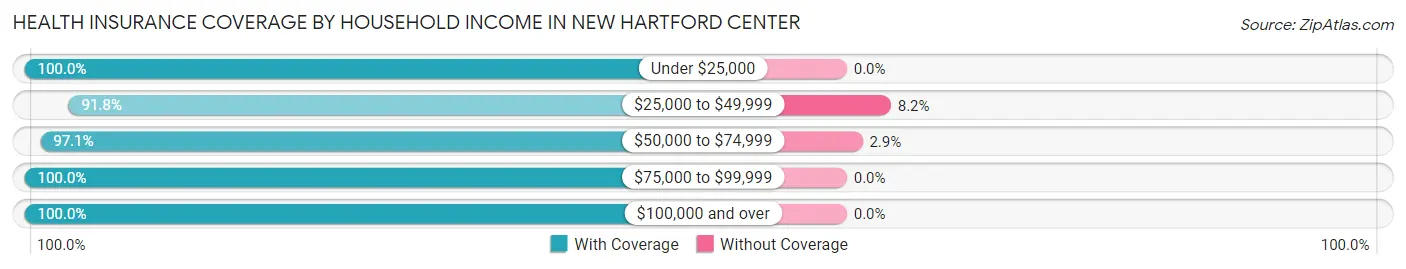
| Household Income | With Coverage | Without Coverage |
| Under $25,000 | 39 (100.0%) | 0 (0.0%) |
| $25,000 to $49,999 | 156 (91.8%) | 14 (8.2%) |
| $50,000 to $74,999 | 429 (97.1%) | 13 (2.9%) |
| $75,000 to $99,999 | 118 (100.0%) | 0 (0.0%) |
| $100,000 and over | 595 (100.0%) | 0 (0.0%) |
Public vs Private Health Insurance Coverage by Age in New Hartford Center
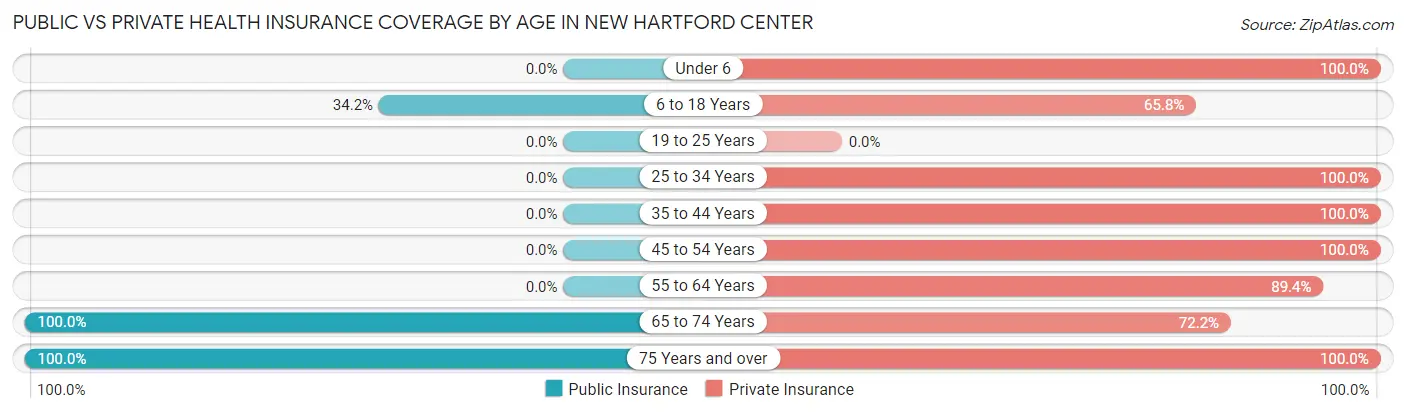
| Age Bracket | Public Insurance | Private Insurance |
| Under 6 | 0 (0.0%) | 202 (100.0%) |
| 6 to 18 Years | 76 (34.2%) | 146 (65.8%) |
| 19 to 25 Years | 0 (0.0%) | 0 (0.0%) |
| 25 to 34 Years | 0 (0.0%) | 236 (100.0%) |
| 35 to 44 Years | 0 (0.0%) | 151 (100.0%) |
| 45 to 54 Years | 0 (0.0%) | 22 (100.0%) |
| 55 to 64 Years | 0 (0.0%) | 227 (89.4%) |
| 65 to 74 Years | 180 (100.0%) | 130 (72.2%) |
| 75 Years and over | 97 (100.0%) | 97 (100.0%) |
| Total | 353 (25.9%) | 1,211 (88.8%) |
Disability Status by Sex by Age in New Hartford Center
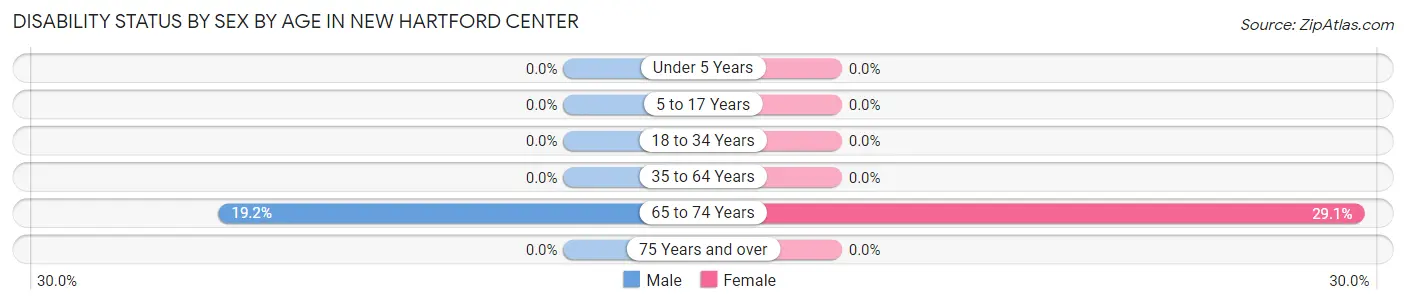
| Age Bracket | Male | Female |
| Under 5 Years | 0 (0.0%) | 0 (0.0%) |
| 5 to 17 Years | 0 (0.0%) | 0 (0.0%) |
| 18 to 34 Years | 0 (0.0%) | 0 (0.0%) |
| 35 to 64 Years | 0 (0.0%) | 0 (0.0%) |
| 65 to 74 Years | 24 (19.2%) | 16 (29.1%) |
| 75 Years and over | 0 (0.0%) | 0 (0.0%) |
Disability Class by Sex by Age in New Hartford Center
Disability Class: Hearing Difficulty
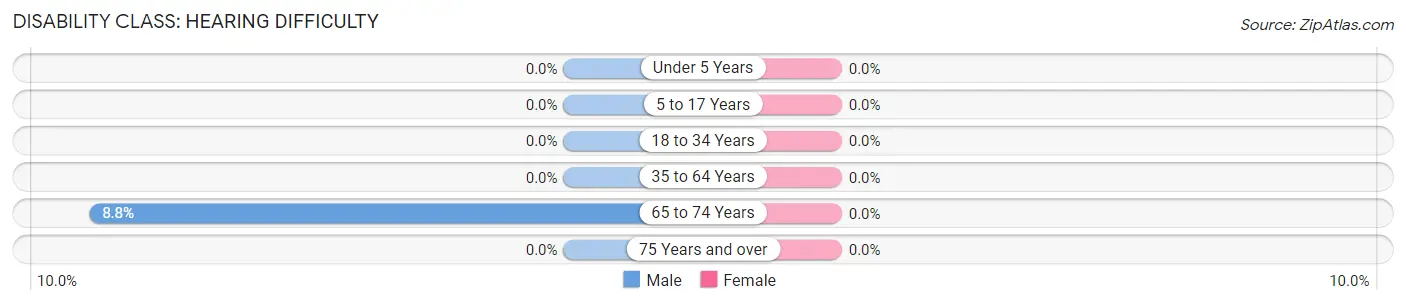
| Age Bracket | Male | Female |
| Under 5 Years | 0 (0.0%) | 0 (0.0%) |
| 5 to 17 Years | 0 (0.0%) | 0 (0.0%) |
| 18 to 34 Years | 0 (0.0%) | 0 (0.0%) |
| 35 to 64 Years | 0 (0.0%) | 0 (0.0%) |
| 65 to 74 Years | 11 (8.8%) | 0 (0.0%) |
| 75 Years and over | 0 (0.0%) | 0 (0.0%) |
Disability Class: Vision Difficulty
| Age Bracket | Male | Female |
| Under 5 Years | 0 (0.0%) | 0 (0.0%) |
| 5 to 17 Years | 0 (0.0%) | 0 (0.0%) |
| 18 to 34 Years | 0 (0.0%) | 0 (0.0%) |
| 35 to 64 Years | 0 (0.0%) | 0 (0.0%) |
| 65 to 74 Years | 0 (0.0%) | 0 (0.0%) |
| 75 Years and over | 0 (0.0%) | 0 (0.0%) |
Disability Class: Cognitive Difficulty
| Age Bracket | Male | Female |
| 5 to 17 Years | 0 (0.0%) | 0 (0.0%) |
| 18 to 34 Years | 0 (0.0%) | 0 (0.0%) |
| 35 to 64 Years | 0 (0.0%) | 0 (0.0%) |
| 65 to 74 Years | 0 (0.0%) | 0 (0.0%) |
| 75 Years and over | 0 (0.0%) | 0 (0.0%) |
Disability Class: Ambulatory Difficulty
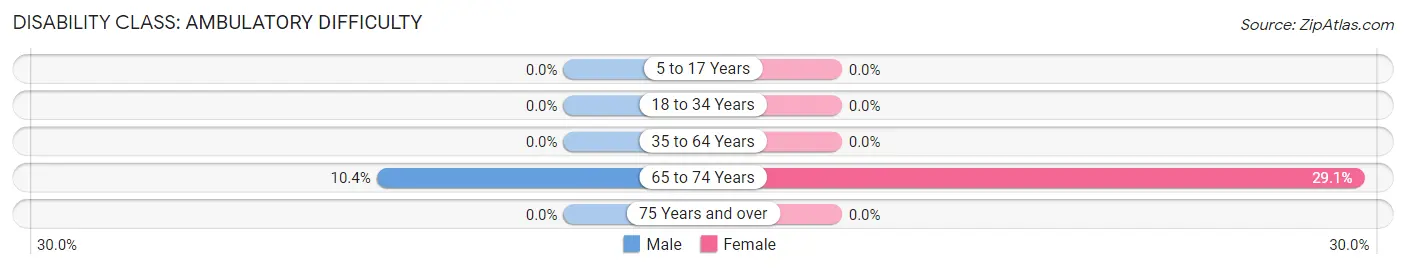
| Age Bracket | Male | Female |
| 5 to 17 Years | 0 (0.0%) | 0 (0.0%) |
| 18 to 34 Years | 0 (0.0%) | 0 (0.0%) |
| 35 to 64 Years | 0 (0.0%) | 0 (0.0%) |
| 65 to 74 Years | 13 (10.4%) | 16 (29.1%) |
| 75 Years and over | 0 (0.0%) | 0 (0.0%) |
Disability Class: Self-Care Difficulty
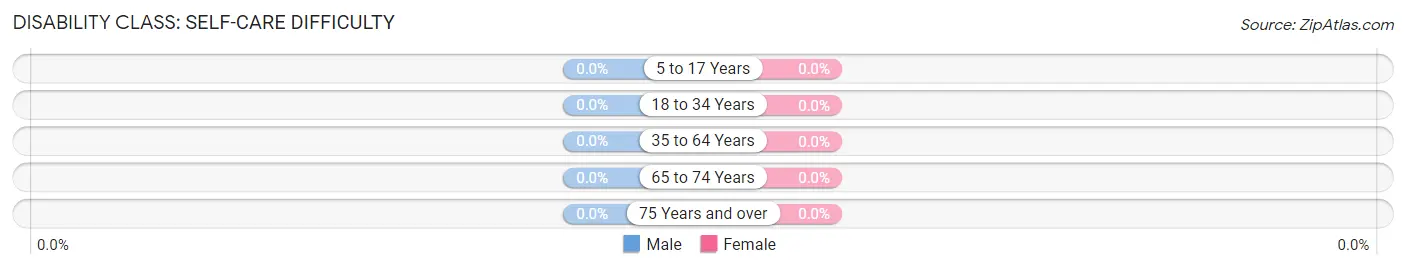
| Age Bracket | Male | Female |
| 5 to 17 Years | 0 (0.0%) | 0 (0.0%) |
| 18 to 34 Years | 0 (0.0%) | 0 (0.0%) |
| 35 to 64 Years | 0 (0.0%) | 0 (0.0%) |
| 65 to 74 Years | 0 (0.0%) | 0 (0.0%) |
| 75 Years and over | 0 (0.0%) | 0 (0.0%) |
Technology Access in New Hartford Center
Computing Device Access in New Hartford Center
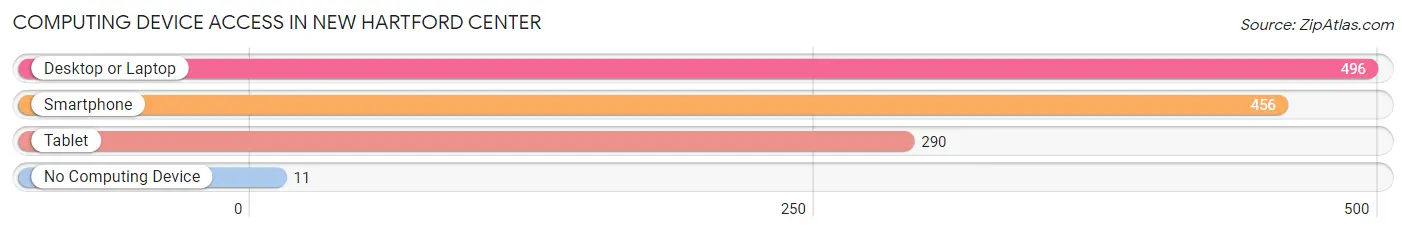
| Device Type | # Households | % Households |
| Desktop or Laptop | 496 | 83.4% |
| Smartphone | 456 | 76.6% |
| Tablet | 290 | 48.7% |
| No Computing Device | 11 | 1.8% |
| Total | 595 | 100.0% |
Internet Access in New Hartford Center
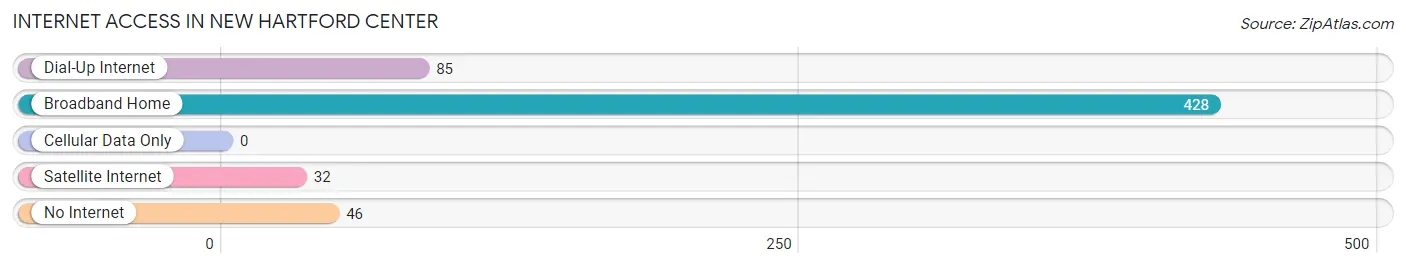
| Internet Type | # Households | % Households |
| Dial-Up Internet | 85 | 14.3% |
| Broadband Home | 428 | 71.9% |
| Cellular Data Only | 0 | 0.0% |
| Satellite Internet | 32 | 5.4% |
| No Internet | 46 | 7.7% |
| Total | 595 | 100.0% |
New Hartford Center Summary
New Hartford Center is a small village located in the town of New Hartford, Connecticut. It is situated in the northwest corner of the state, in Litchfield County. The village is located on the banks of the Farmington River, and is home to a population of approximately 1,500 people.
History
The area that is now New Hartford Center was first settled in 1737 by a group of settlers from Hartford, Connecticut. The settlers were led by Captain John Bissell, who was granted a charter from the General Assembly of Connecticut to establish a new town. The town was named New Hartford, and the village of New Hartford Center was established in 1741.
The village was an important center of commerce and industry in the early 19th century. It was home to several mills, including a grist mill, a saw mill, and a paper mill. The village also had a blacksmith shop, a tannery, and a general store.
In the late 19th century, the village began to decline in importance as the industrial revolution took hold. The mills and other businesses closed, and the population began to decline. By the early 20th century, the village was largely abandoned.
In the late 20th century, the village began to experience a resurgence. The population began to grow again, and new businesses began to open. Today, the village is a popular tourist destination, and is home to a variety of shops, restaurants, and other businesses.
Geography
New Hartford Center is located in the northwest corner of Connecticut, in Litchfield County. It is situated on the banks of the Farmington River, and is bordered by the towns of Barkhamsted, Colebrook, and Norfolk. The village is located approximately 25 miles northwest of Hartford, and approximately 75 miles northeast of New York City.
The village is located in a rural area, and is surrounded by forests and rolling hills. The terrain is mostly flat, with some hills and valleys. The climate is humid continental, with cold winters and warm summers.
Economy
The economy of New Hartford Center is largely based on tourism. The village is a popular destination for visitors from all over the region, and is home to a variety of shops, restaurants, and other businesses. The village also has a number of historic sites, including the New Hartford Center Historic District, which is listed on the National Register of Historic Places.
In addition to tourism, the village is also home to a number of small businesses, including a general store, a hardware store, and a variety of other shops. The village also has a number of professional services, including a doctor’s office, a dentist’s office, and a law office.
Demographics
As of the 2010 census, the population of New Hartford Center was 1,521. The racial makeup of the village was 97.2% White, 0.7% African American, 0.3% Native American, 0.4% Asian, 0.1% Pacific Islander, 0.3% from other races, and 1.0% from two or more races. Hispanic or Latino of any race were 1.7% of the population.
The median household income in the village was $60,938, and the median family income was $68,750. The per capita income was $30,945. About 4.2% of families and 5.3% of the population were below the poverty line, including 6.2% of those under age 18 and 4.2% of those age 65 or over.
Conclusion
New Hartford Center is a small village located in the northwest corner of Connecticut. It is situated on the banks of the Farmington River, and is home to a population of approximately 1,500 people. The village is a popular tourist destination, and is home to a variety of shops, restaurants, and other businesses. The economy of the village is largely based on tourism, and the population is mostly White. The median household income in the village is $60,938, and the per capita income is $30,945.
Common Questions
What is Per Capita Income in New Hartford Center?
Per Capita income in New Hartford Center is $41,027.
What is the Median Family Income in New Hartford Center?
Median Family Income in New Hartford Center is $95,099.
What is the Median Household income in New Hartford Center?
Median Household Income in New Hartford Center is $71,456.
What is Income or Wage Gap in New Hartford Center?
Income or Wage Gap in New Hartford Center is 20.7%.
Women in New Hartford Center earn 79.3 cents for every dollar earned by a man.
What is Inequality or Gini Index in New Hartford Center?
Inequality or Gini Index in New Hartford Center is 0.33.
What is the Total Population of New Hartford Center?
Total Population of New Hartford Center is 1,364.
What is the Total Male Population of New Hartford Center?
Total Male Population of New Hartford Center is 561.
What is the Total Female Population of New Hartford Center?
Total Female Population of New Hartford Center is 803.
What is the Ratio of Males per 100 Females in New Hartford Center?
There are 69.86 Males per 100 Females in New Hartford Center.
What is the Ratio of Females per 100 Males in New Hartford Center?
There are 143.14 Females per 100 Males in New Hartford Center.
What is the Median Population Age in New Hartford Center?
Median Population Age in New Hartford Center is 36.1 Years.
What is the Average Family Size in New Hartford Center
Average Family Size in New Hartford Center is 2.8 People.
What is the Average Household Size in New Hartford Center
Average Household Size in New Hartford Center is 2.3 People.
How Large is the Labor Force in New Hartford Center?
There are 613 People in the Labor Forcein in New Hartford Center.
What is the Percentage of People in the Labor Force in New Hartford Center?
63.5% of People are in the Labor Force in New Hartford Center.
What is the Unemployment Rate in New Hartford Center?
Unemployment Rate in New Hartford Center is 5.1%.