Byram, CT Map & Demographics
Byram Map
Byram Overview
$58,202
PER CAPITA INCOME
$91,458
AVG FAMILY INCOME
$92,500
AVG HOUSEHOLD INCOME
43.0%
WAGE / INCOME GAP [ % ]
57.0¢/ $1
WAGE / INCOME GAP [ $ ]
0.55
INEQUALITY / GINI INDEX
5,285
TOTAL POPULATION
2,461
MALE POPULATION
2,824
FEMALE POPULATION
87.15
MALES / 100 FEMALES
114.75
FEMALES / 100 MALES
35.5
MEDIAN AGE
3.2
AVG FAMILY SIZE
2.9
AVG HOUSEHOLD SIZE
3,024
LABOR FORCE [ PEOPLE ]
72.2%
PERCENT IN LABOR FORCE
13.1%
UNEMPLOYMENT RATE
Income in Byram
Income Overview in Byram
Per Capita Income in Byram is $58,202, while median incomes of families and households are $91,458 and $92,500 respectively.
| Characteristic | Number | Measure |
| Per Capita Income | 5,285 | $58,202 |
| Median Family Income | 1,352 | $91,458 |
| Mean Family Income | 1,352 | $152,478 |
| Median Household Income | 1,808 | $92,500 |
| Mean Household Income | 1,808 | $168,868 |
| Income Deficit | 1,352 | $0 |
| Wage / Income Gap (%) | 5,285 | 43.02% |
| Wage / Income Gap ($) | 5,285 | 56.98¢ per $1 |
| Gini / Inequality Index | 5,285 | 0.55 |
Earnings by Sex in Byram
Average Earnings in Byram are $36,632, $46,797 for men and $26,667 for women, a difference of 43.0%.
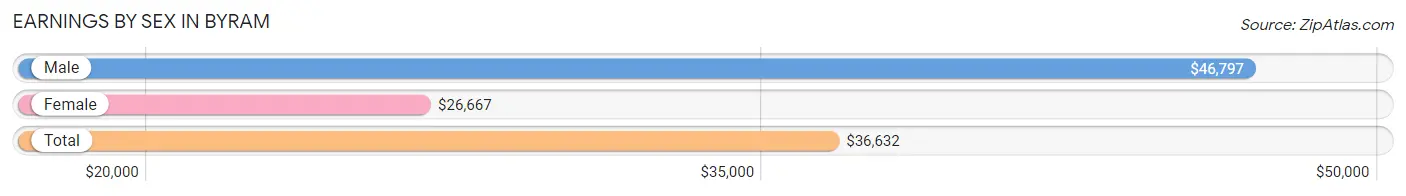
| Sex | Number | Average Earnings |
| Male | 1,587 (48.7%) | $46,797 |
| Female | 1,670 (51.3%) | $26,667 |
| Total | 3,257 (100.0%) | $36,632 |
Earnings by Sex by Income Bracket in Byram
The most common earnings brackets in Byram are $100,000+ for men (366 | 23.1%) and $22,500 to $24,999 for women (213 | 12.8%).
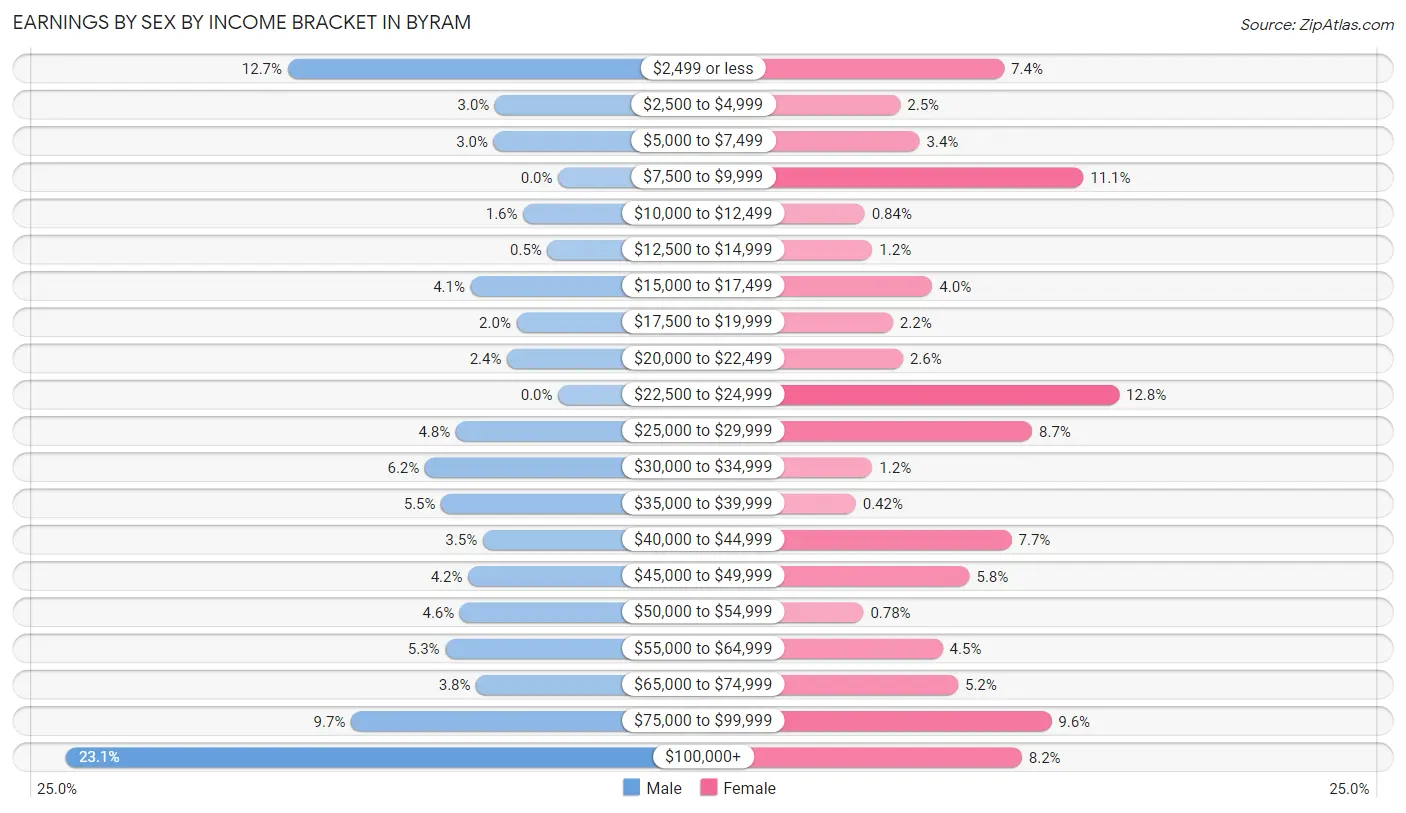
| Income | Male | Female |
| $2,499 or less | 201 (12.7%) | 123 (7.4%) |
| $2,500 to $4,999 | 47 (3.0%) | 42 (2.5%) |
| $5,000 to $7,499 | 48 (3.0%) | 57 (3.4%) |
| $7,500 to $9,999 | 0 (0.0%) | 185 (11.1%) |
| $10,000 to $12,499 | 26 (1.6%) | 14 (0.8%) |
| $12,500 to $14,999 | 8 (0.5%) | 20 (1.2%) |
| $15,000 to $17,499 | 65 (4.1%) | 67 (4.0%) |
| $17,500 to $19,999 | 31 (1.9%) | 36 (2.2%) |
| $20,000 to $22,499 | 38 (2.4%) | 44 (2.6%) |
| $22,500 to $24,999 | 0 (0.0%) | 213 (12.8%) |
| $25,000 to $29,999 | 76 (4.8%) | 145 (8.7%) |
| $30,000 to $34,999 | 99 (6.2%) | 20 (1.2%) |
| $35,000 to $39,999 | 87 (5.5%) | 7 (0.4%) |
| $40,000 to $44,999 | 56 (3.5%) | 129 (7.7%) |
| $45,000 to $49,999 | 67 (4.2%) | 96 (5.8%) |
| $50,000 to $54,999 | 73 (4.6%) | 13 (0.8%) |
| $55,000 to $64,999 | 84 (5.3%) | 75 (4.5%) |
| $65,000 to $74,999 | 61 (3.8%) | 87 (5.2%) |
| $75,000 to $99,999 | 154 (9.7%) | 160 (9.6%) |
| $100,000+ | 366 (23.1%) | 137 (8.2%) |
| Total | 1,587 (100.0%) | 1,670 (100.0%) |
Earnings by Sex by Educational Attainment in Byram
Average earnings in Byram are $59,393 for men and $32,438 for women, a difference of 45.4%. Men with an educational attainment of bachelor's degree enjoy the highest average annual earnings of $91,500, while those with high school diploma education earn the least with $39,844. Women with an educational attainment of graduate degree earn the most with the average annual earnings of $91,528, while those with less than high school education have the smallest earnings of $23,442.
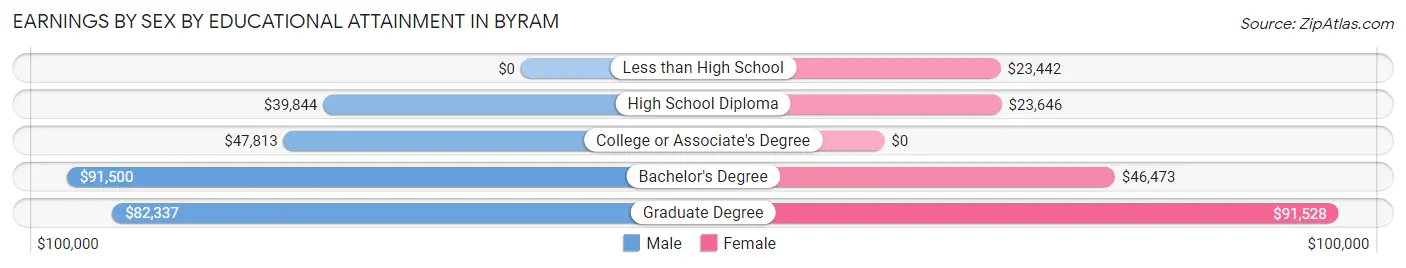
| Educational Attainment | Male Income | Female Income |
| Less than High School | - | - |
| High School Diploma | $39,844 | $23,646 |
| College or Associate's Degree | $47,813 | $0 |
| Bachelor's Degree | $91,500 | $46,473 |
| Graduate Degree | $82,337 | $91,528 |
| Total | $59,393 | $32,438 |
Family Income in Byram
Family Income Brackets in Byram
According to the Byram family income data, there are 253 families falling into the $25,000 to $34,999 income range, which is the most common income bracket and makes up 18.7% of all families.
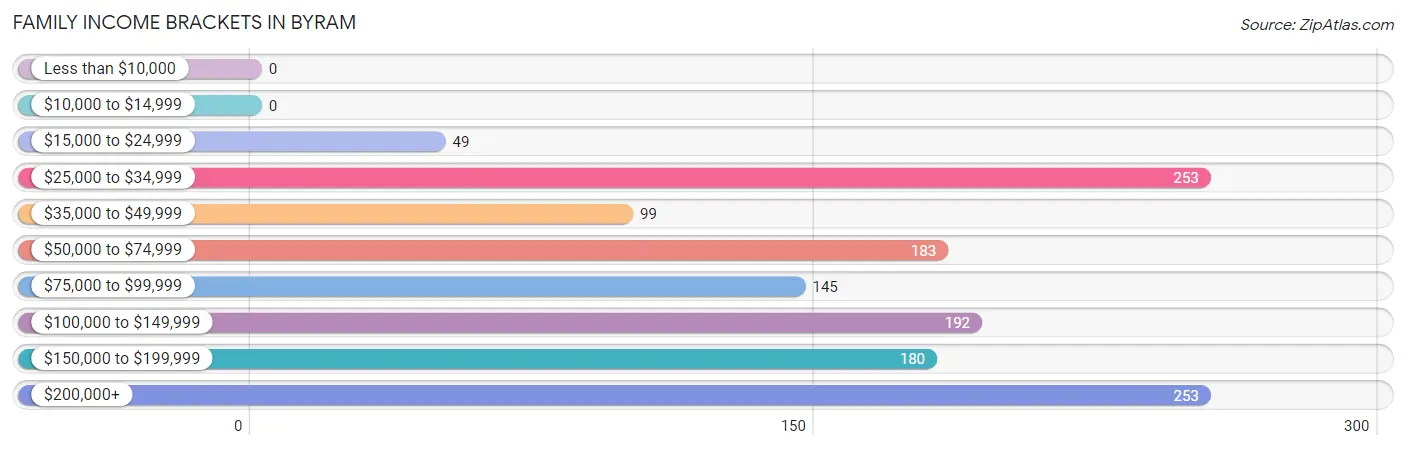
| Income Bracket | # Families | % Families |
| Less than $10,000 | 0 | 0.0% |
| $10,000 to $14,999 | 0 | 0.0% |
| $15,000 to $24,999 | 49 | 3.6% |
| $25,000 to $34,999 | 253 | 18.7% |
| $35,000 to $49,999 | 99 | 7.3% |
| $50,000 to $74,999 | 183 | 13.5% |
| $75,000 to $99,999 | 145 | 10.7% |
| $100,000 to $149,999 | 192 | 14.2% |
| $150,000 to $199,999 | 180 | 13.3% |
| $200,000+ | 253 | 18.7% |
Family Income by Famaliy Size in Byram
5-person families (166 | 12.3%) account for the highest median family income in Byram with $102,786 per family, while 2-person families (476 | 35.2%) have the highest median income of $47,894 per family member.
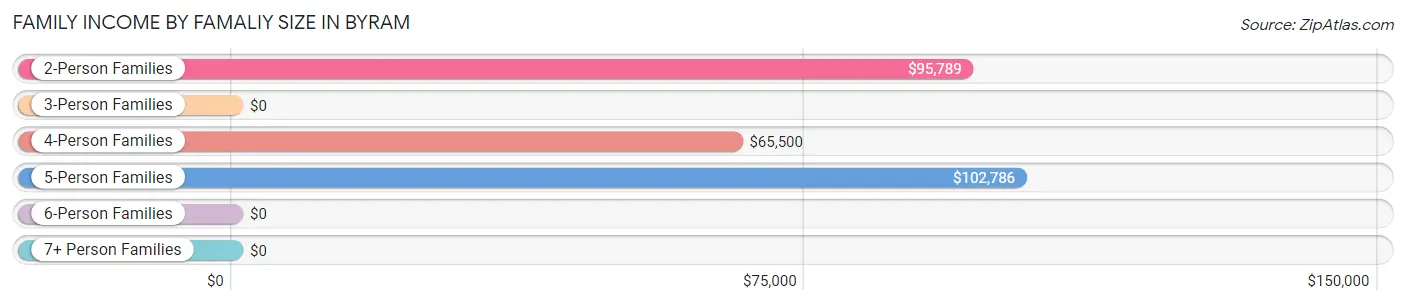
| Income Bracket | # Families | Median Income |
| 2-Person Families | 476 (35.2%) | $95,789 |
| 3-Person Families | 436 (32.3%) | $0 |
| 4-Person Families | 232 (17.2%) | $65,500 |
| 5-Person Families | 166 (12.3%) | $102,786 |
| 6-Person Families | 34 (2.5%) | $0 |
| 7+ Person Families | 8 (0.6%) | $0 |
| Total | 1,352 (100.0%) | $91,458 |
Family Income by Number of Earners in Byram
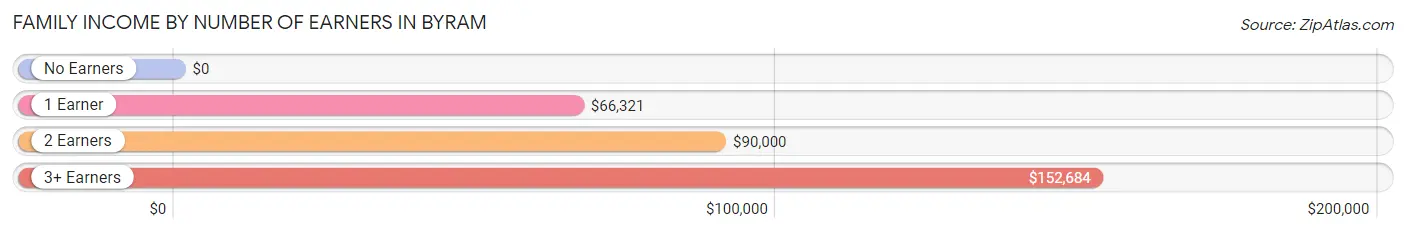
| Number of Earners | # Families | Median Income |
| No Earners | 74 (5.5%) | $0 |
| 1 Earner | 365 (27.0%) | $66,321 |
| 2 Earners | 696 (51.5%) | $90,000 |
| 3+ Earners | 217 (16.1%) | $152,684 |
| Total | 1,352 (100.0%) | $91,458 |
Household Income in Byram
Household Income Brackets in Byram
With 345 households falling in the category, the $200,000+ income range is the most frequent in Byram, accounting for 19.1% of all households.
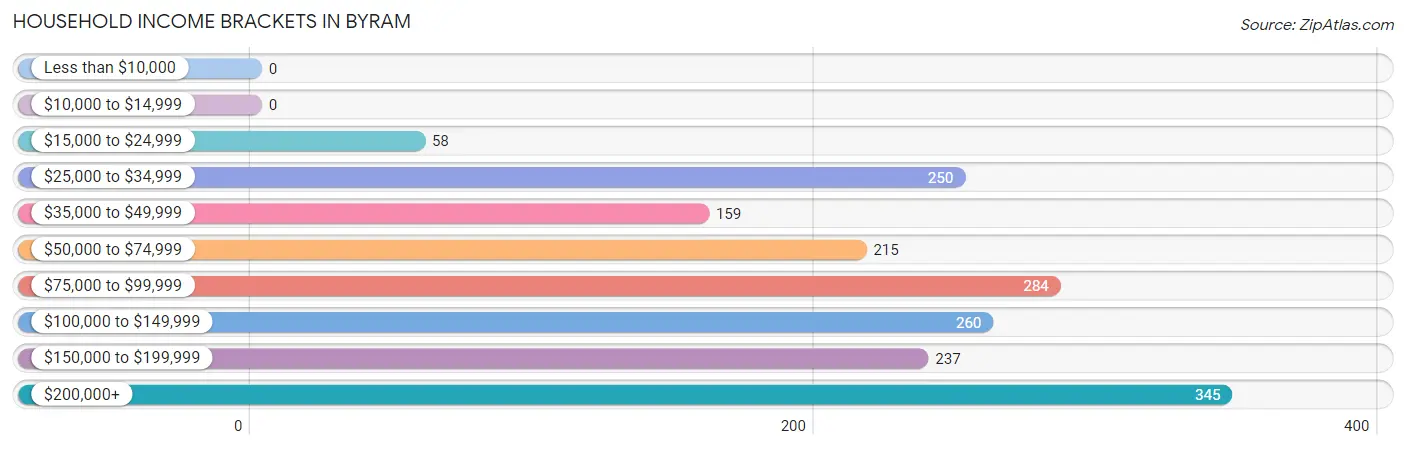
| Income Bracket | # Households | % Households |
| Less than $10,000 | 0 | 0.0% |
| $10,000 to $14,999 | 0 | 0.0% |
| $15,000 to $24,999 | 58 | 3.2% |
| $25,000 to $34,999 | 250 | 13.8% |
| $35,000 to $49,999 | 159 | 8.8% |
| $50,000 to $74,999 | 215 | 11.9% |
| $75,000 to $99,999 | 284 | 15.7% |
| $100,000 to $149,999 | 260 | 14.4% |
| $150,000 to $199,999 | 237 | 13.1% |
| $200,000+ | 345 | 19.1% |
Household Income by Householder Age in Byram
The median household income in Byram is $92,500, with the highest median household income of $132,500 found in the 65+ years age bracket for the primary householder. A total of 246 households (13.6%) fall into this category. Meanwhile, the 45 to 64 years age bracket for the primary householder has the lowest median household income of $75,950, with 965 households (53.4%) in this group.
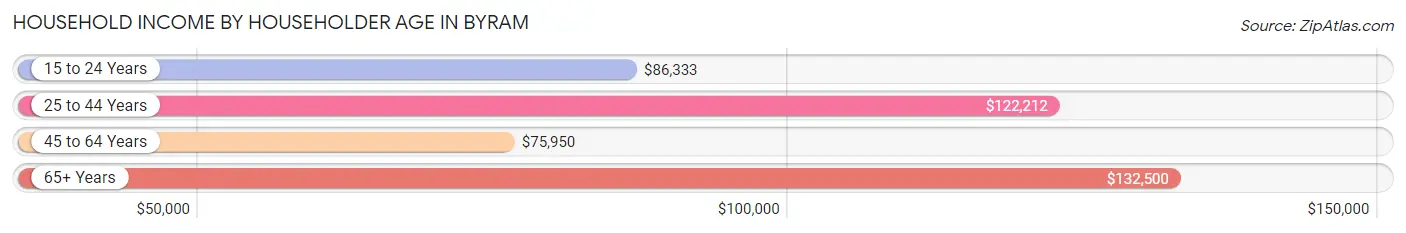
| Income Bracket | # Households | Median Income |
| 15 to 24 Years | 72 (4.0%) | $86,333 |
| 25 to 44 Years | 525 (29.0%) | $122,212 |
| 45 to 64 Years | 965 (53.4%) | $75,950 |
| 65+ Years | 246 (13.6%) | $132,500 |
| Total | 1,808 (100.0%) | $92,500 |
Poverty in Byram
Income Below Poverty by Sex and Age in Byram
With 5.0% poverty level for males and 4.5% for females among the residents of Byram, 16 and 17 year old males and 75 year old and over females are the most vulnerable to poverty, with 61 males (36.5%) and 21 females (19.6%) in their respective age groups living below the poverty level.
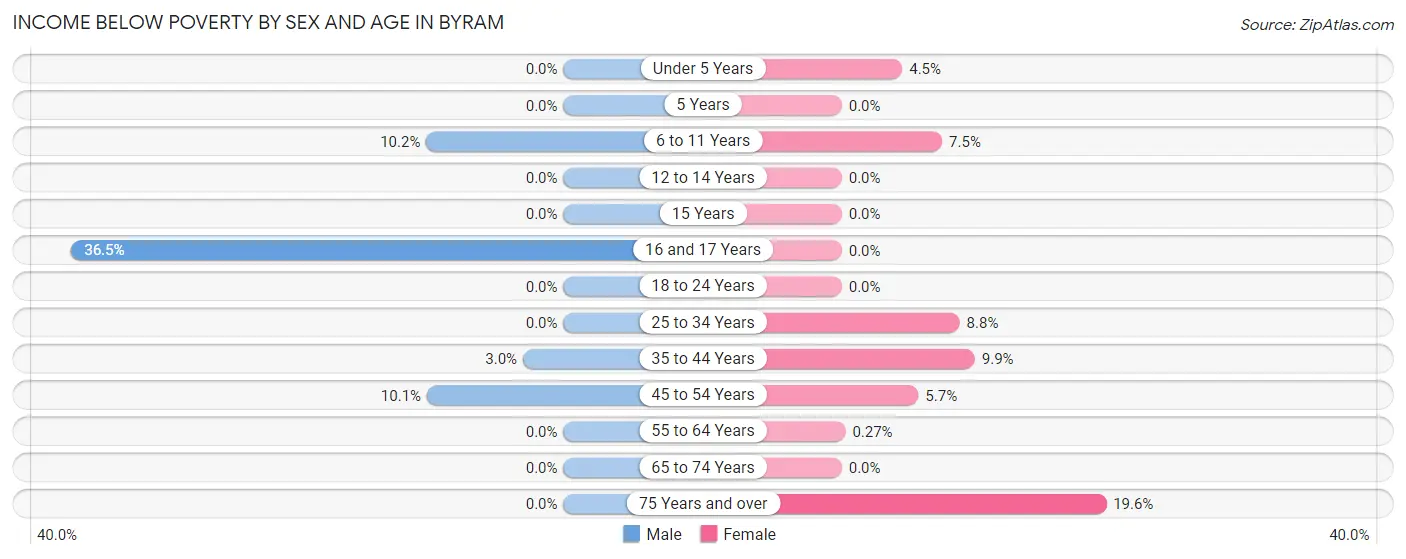
| Age Bracket | Male | Female |
| Under 5 Years | 0 (0.0%) | 7 (4.5%) |
| 5 Years | 0 (0.0%) | 0 (0.0%) |
| 6 to 11 Years | 23 (10.2%) | 7 (7.4%) |
| 12 to 14 Years | 0 (0.0%) | 0 (0.0%) |
| 15 Years | 0 (0.0%) | 0 (0.0%) |
| 16 and 17 Years | 61 (36.5%) | 0 (0.0%) |
| 18 to 24 Years | 0 (0.0%) | 0 (0.0%) |
| 25 to 34 Years | 0 (0.0%) | 26 (8.7%) |
| 35 to 44 Years | 8 (3.0%) | 34 (9.9%) |
| 45 to 54 Years | 32 (10.1%) | 32 (5.7%) |
| 55 to 64 Years | 0 (0.0%) | 1 (0.3%) |
| 65 to 74 Years | 0 (0.0%) | 0 (0.0%) |
| 75 Years and over | 0 (0.0%) | 21 (19.6%) |
| Total | 124 (5.0%) | 128 (4.5%) |
Income Above Poverty by Sex and Age in Byram
According to the poverty statistics in Byram, males aged under 5 years and females aged 12 to 14 years are the age groups that are most secure financially, with 100.0% of males and 100.0% of females in these age groups living above the poverty line.
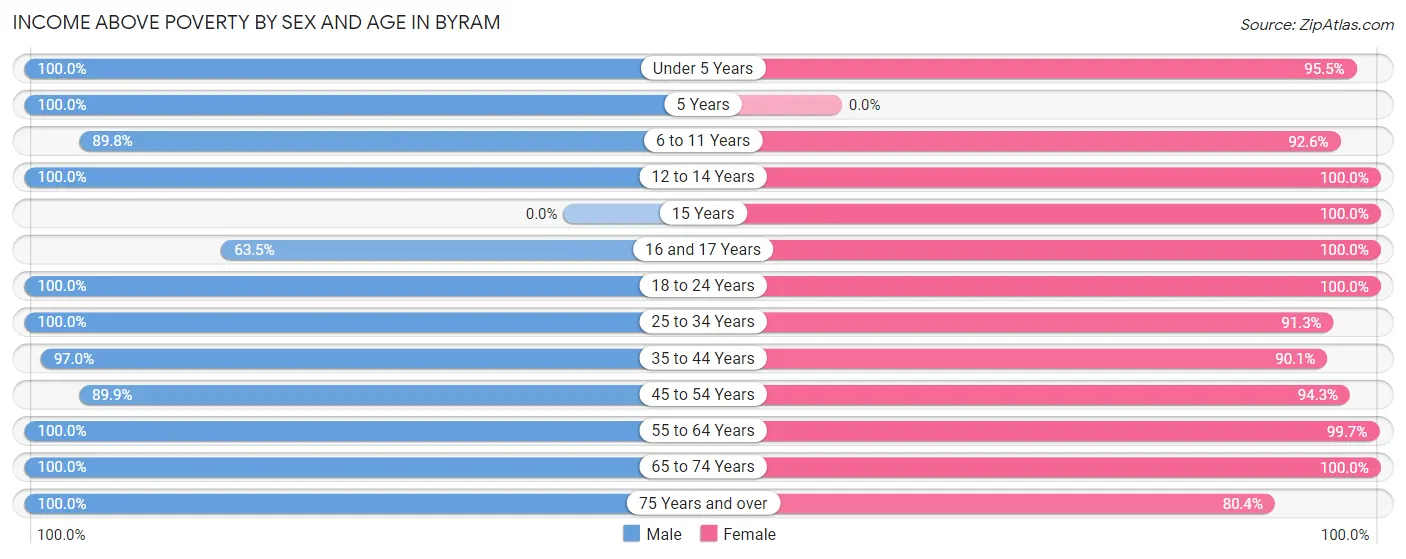
| Age Bracket | Male | Female |
| Under 5 Years | 130 (100.0%) | 149 (95.5%) |
| 5 Years | 55 (100.0%) | 0 (0.0%) |
| 6 to 11 Years | 203 (89.8%) | 87 (92.5%) |
| 12 to 14 Years | 49 (100.0%) | 345 (100.0%) |
| 15 Years | 0 (0.0%) | 41 (100.0%) |
| 16 and 17 Years | 106 (63.5%) | 55 (100.0%) |
| 18 to 24 Years | 357 (100.0%) | 323 (100.0%) |
| 25 to 34 Years | 296 (100.0%) | 271 (91.2%) |
| 35 to 44 Years | 259 (97.0%) | 310 (90.1%) |
| 45 to 54 Years | 284 (89.9%) | 530 (94.3%) |
| 55 to 64 Years | 339 (100.0%) | 367 (99.7%) |
| 65 to 74 Years | 171 (100.0%) | 132 (100.0%) |
| 75 Years and over | 88 (100.0%) | 86 (80.4%) |
| Total | 2,337 (95.0%) | 2,696 (95.5%) |
Income Below Poverty Among Married-Couple Families in Byram
The poverty statistics for married-couple families in Byram show that 0.7% or 6 of the total 847 families live below the poverty line. Families with 3 or 4 children have the highest poverty rate of 9.7%, comprising of 6 families. On the other hand, families with no children have the lowest poverty rate of 0.0%, which includes 0 families.
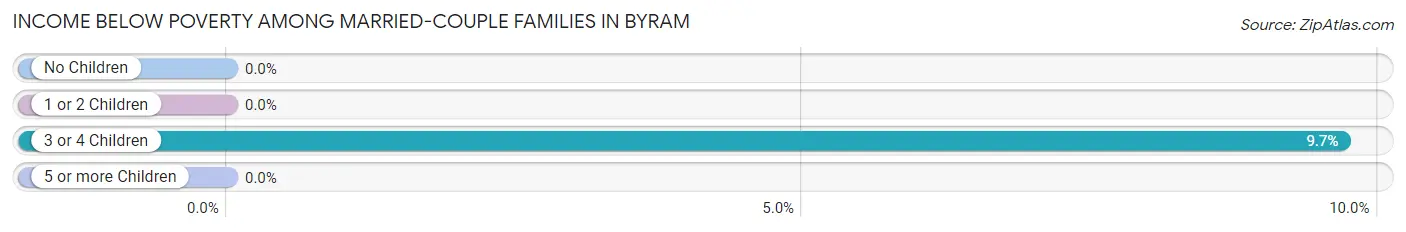
| Children | Above Poverty | Below Poverty |
| No Children | 473 (100.0%) | 0 (0.0%) |
| 1 or 2 Children | 312 (100.0%) | 0 (0.0%) |
| 3 or 4 Children | 56 (90.3%) | 6 (9.7%) |
| 5 or more Children | 0 (0.0%) | 0 (0.0%) |
| Total | 841 (99.3%) | 6 (0.7%) |
Income Below Poverty Among Single-Parent Households in Byram
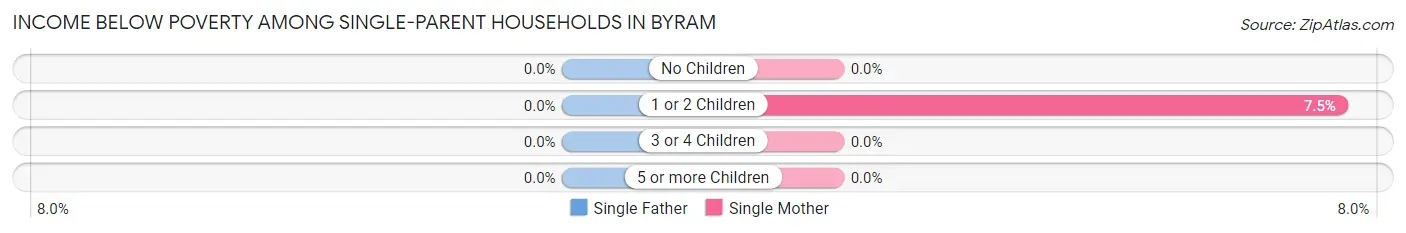
| Children | Single Father | Single Mother |
| No Children | 0 (0.0%) | 0 (0.0%) |
| 1 or 2 Children | 0 (0.0%) | 19 (7.5%) |
| 3 or 4 Children | 0 (0.0%) | 0 (0.0%) |
| 5 or more Children | 0 (0.0%) | 0 (0.0%) |
| Total | 0 (0.0%) | 19 (5.0%) |
Income Below Poverty Among Married-Couple vs Single-Parent Households in Byram
The poverty data for Byram shows that 6 of the married-couple family households (0.7%) and 19 of the single-parent households (3.8%) are living below the poverty level. Within the married-couple family households, those with 3 or 4 children have the highest poverty rate, with 6 households (9.7%) falling below the poverty line. Among the single-parent households, those with 1 or 2 children have the highest poverty rate, with 19 household (5.2%) living below poverty.
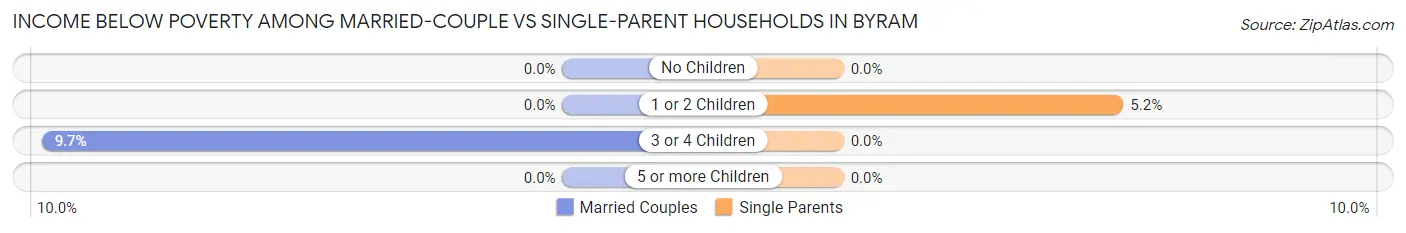
| Children | Married-Couple Families | Single-Parent Households |
| No Children | 0 (0.0%) | 0 (0.0%) |
| 1 or 2 Children | 0 (0.0%) | 19 (5.2%) |
| 3 or 4 Children | 6 (9.7%) | 0 (0.0%) |
| 5 or more Children | 0 (0.0%) | 0 (0.0%) |
| Total | 6 (0.7%) | 19 (3.8%) |
Race in Byram
The most populous races in Byram are White / Caucasian (3,521 | 66.6%), Hispanic or Latino (2,139 | 40.5%), and Some other Race (760 | 14.4%).
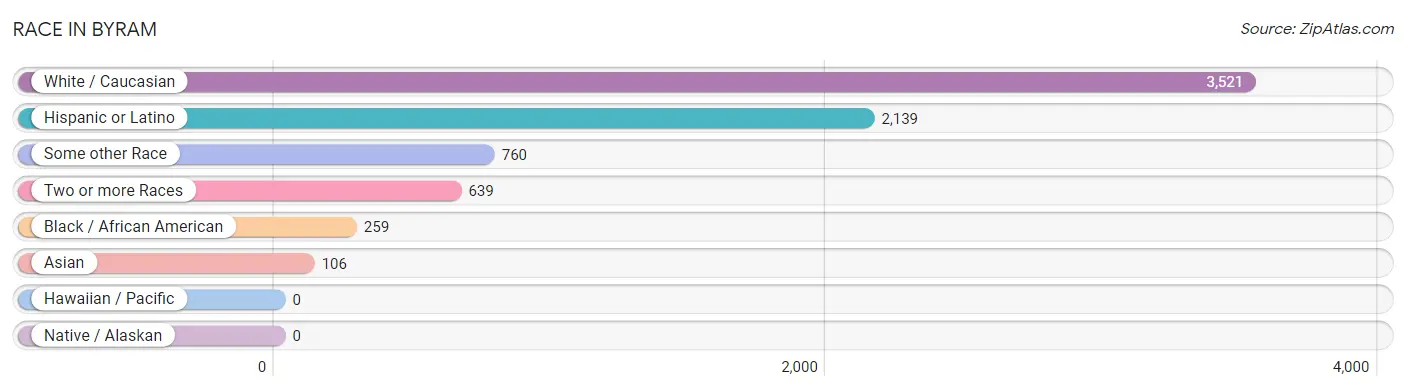
| Race | # Population | % Population |
| Asian | 106 | 2.0% |
| Black / African American | 259 | 4.9% |
| Hawaiian / Pacific | 0 | 0.0% |
| Hispanic or Latino | 2,139 | 40.5% |
| Native / Alaskan | 0 | 0.0% |
| White / Caucasian | 3,521 | 66.6% |
| Two or more Races | 639 | 12.1% |
| Some other Race | 760 | 14.4% |
| Total | 5,285 | 100.0% |
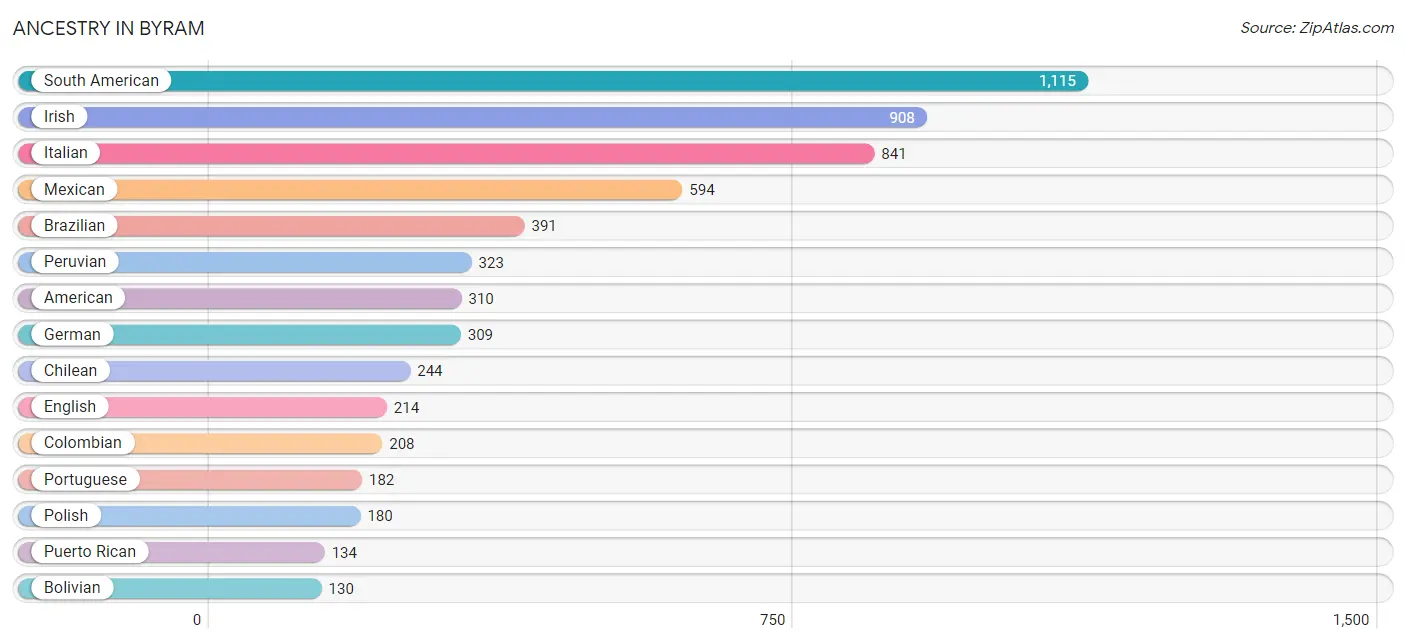
Ancestry in Byram
The most populous ancestries reported in Byram are South American (1,115 | 21.1%), Irish (908 | 17.2%), Italian (841 | 15.9%), Mexican (594 | 11.2%), and Brazilian (391 | 7.4%), together accounting for 72.8% of all Byram residents.
| Ancestry | # Population | % Population |
| American | 310 | 5.9% |
| Arab | 38 | 0.7% |
| Argentinean | 15 | 0.3% |
| Australian | 8 | 0.2% |
| Bhutanese | 52 | 1.0% |
| Bolivian | 130 | 2.5% |
| Brazilian | 391 | 7.4% |
| Central American | 34 | 0.6% |
| Central American Indian | 37 | 0.7% |
| Chilean | 244 | 4.6% |
| Colombian | 208 | 3.9% |
| Cuban | 1 | 0.0% |
| Czech | 8 | 0.2% |
| Danish | 12 | 0.2% |
| Dominican | 66 | 1.3% |
| Dutch | 22 | 0.4% |
| Eastern European | 50 | 0.9% |
| Ecuadorian | 123 | 2.3% |
| English | 214 | 4.1% |
| European | 20 | 0.4% |
| Filipino | 19 | 0.4% |
| French | 38 | 0.7% |
| French Canadian | 32 | 0.6% |
| German | 309 | 5.9% |
| Greek | 41 | 0.8% |
| Guatemalan | 34 | 0.6% |
| Indian (Asian) | 8 | 0.2% |
| Irish | 908 | 17.2% |
| Italian | 841 | 15.9% |
| Jamaican | 40 | 0.8% |
| Korean | 22 | 0.4% |
| Lebanese | 37 | 0.7% |
| Lithuanian | 12 | 0.2% |
| Mexican | 594 | 11.2% |
| Moroccan | 1 | 0.0% |
| Norwegian | 37 | 0.7% |
| Paraguayan | 56 | 1.1% |
| Peruvian | 323 | 6.1% |
| Polish | 180 | 3.4% |
| Portuguese | 182 | 3.4% |
| Puerto Rican | 134 | 2.5% |
| Russian | 62 | 1.2% |
| Scotch-Irish | 58 | 1.1% |
| Scottish | 75 | 1.4% |
| Serbian | 19 | 0.4% |
| Slovak | 51 | 1.0% |
| South American | 1,115 | 21.1% |
| Spaniard | 25 | 0.5% |
| Swedish | 38 | 0.7% |
| Swiss | 25 | 0.5% |
| Ukrainian | 37 | 0.7% |
| Uruguayan | 16 | 0.3% |
| Welsh | 40 | 0.8% | View All 53 Rows |
Immigrants in Byram
The most numerous immigrant groups reported in Byram came from Latin America (1,580 | 29.9%), South America (1,085 | 20.5%), Central America (366 | 6.9%), Peru (356 | 6.7%), and Mexico (332 | 6.3%), together accounting for 70.4% of all Byram residents.
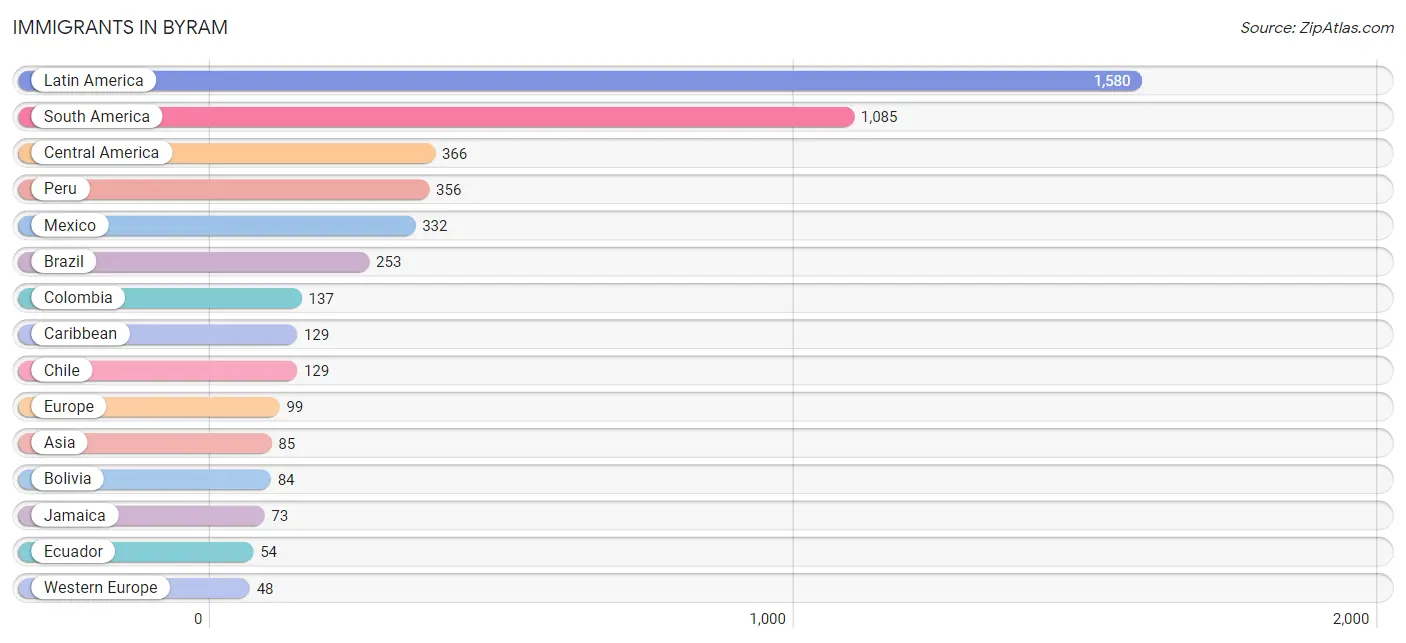
| Immigration Origin | # Population | % Population |
| Africa | 21 | 0.4% |
| Asia | 85 | 1.6% |
| Australia | 8 | 0.2% |
| Bolivia | 84 | 1.6% |
| Brazil | 253 | 4.8% |
| Canada | 38 | 0.7% |
| Caribbean | 129 | 2.4% |
| Central America | 366 | 6.9% |
| Chile | 129 | 2.4% |
| China | 19 | 0.4% |
| Colombia | 137 | 2.6% |
| Cuba | 1 | 0.0% |
| Dominican Republic | 27 | 0.5% |
| Eastern Asia | 19 | 0.4% |
| Eastern Europe | 38 | 0.7% |
| Ecuador | 54 | 1.0% |
| Europe | 99 | 1.9% |
| France | 33 | 0.6% |
| Germany | 15 | 0.3% |
| Guatemala | 34 | 0.6% |
| Jamaica | 73 | 1.4% |
| Latin America | 1,580 | 29.9% |
| Lebanon | 19 | 0.4% |
| Mexico | 332 | 6.3% |
| Northern Europe | 13 | 0.3% |
| Oceania | 8 | 0.2% |
| Pakistan | 13 | 0.3% |
| Peru | 356 | 6.7% |
| Philippines | 22 | 0.4% |
| Poland | 14 | 0.3% |
| South America | 1,085 | 20.5% |
| South Central Asia | 13 | 0.3% |
| South Eastern Asia | 22 | 0.4% |
| Taiwan | 19 | 0.4% |
| Ukraine | 24 | 0.4% |
| Uruguay | 16 | 0.3% |
| West Indies | 28 | 0.5% |
| Western Asia | 31 | 0.6% |
| Western Europe | 48 | 0.9% | View All 39 Rows |
Sex and Age in Byram
Sex and Age in Byram
The most populous age groups in Byram are 15 to 19 Years (353 | 14.3%) for men and 10 to 14 Years (389 | 13.8%) for women.
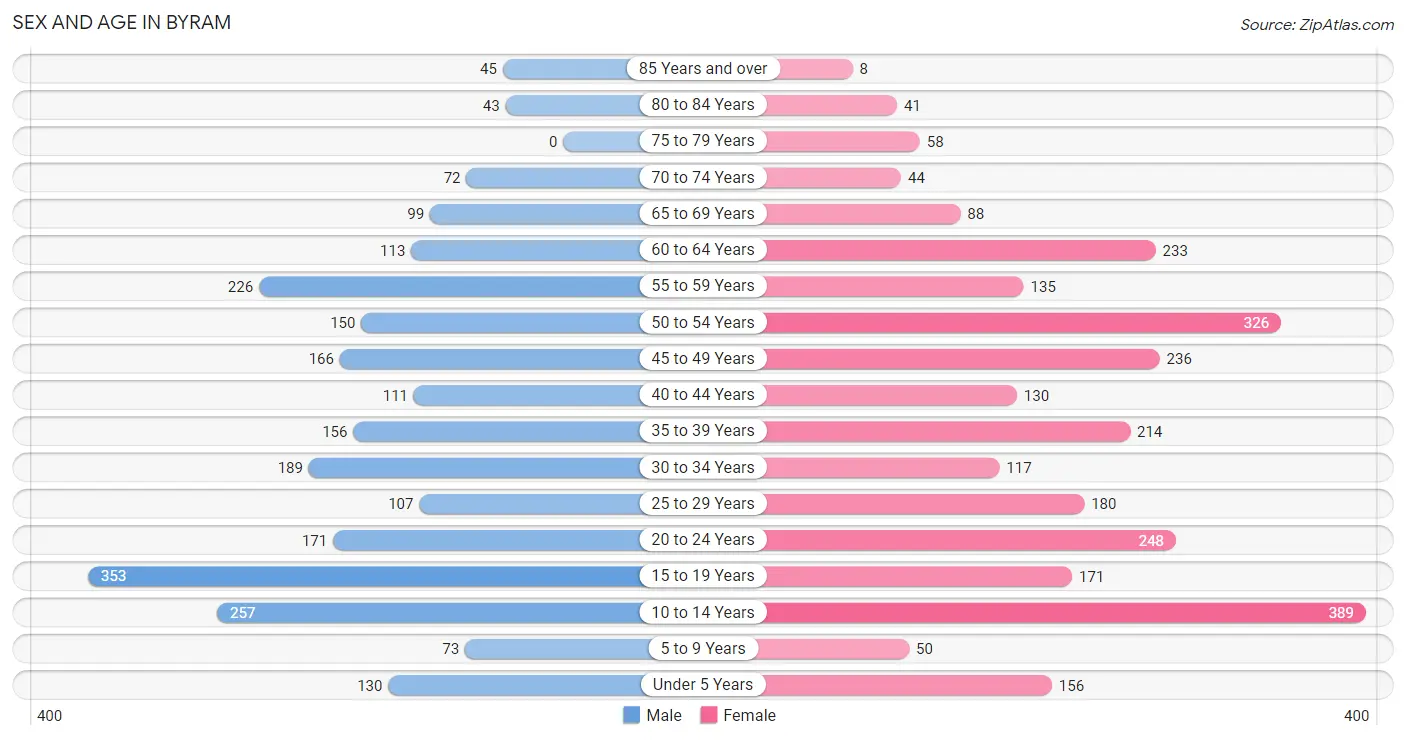
| Age Bracket | Male | Female |
| Under 5 Years | 130 (5.3%) | 156 (5.5%) |
| 5 to 9 Years | 73 (3.0%) | 50 (1.8%) |
| 10 to 14 Years | 257 (10.4%) | 389 (13.8%) |
| 15 to 19 Years | 353 (14.3%) | 171 (6.1%) |
| 20 to 24 Years | 171 (7.0%) | 248 (8.8%) |
| 25 to 29 Years | 107 (4.3%) | 180 (6.4%) |
| 30 to 34 Years | 189 (7.7%) | 117 (4.1%) |
| 35 to 39 Years | 156 (6.3%) | 214 (7.6%) |
| 40 to 44 Years | 111 (4.5%) | 130 (4.6%) |
| 45 to 49 Years | 166 (6.8%) | 236 (8.4%) |
| 50 to 54 Years | 150 (6.1%) | 326 (11.5%) |
| 55 to 59 Years | 226 (9.2%) | 135 (4.8%) |
| 60 to 64 Years | 113 (4.6%) | 233 (8.3%) |
| 65 to 69 Years | 99 (4.0%) | 88 (3.1%) |
| 70 to 74 Years | 72 (2.9%) | 44 (1.6%) |
| 75 to 79 Years | 0 (0.0%) | 58 (2.1%) |
| 80 to 84 Years | 43 (1.8%) | 41 (1.5%) |
| 85 Years and over | 45 (1.8%) | 8 (0.3%) |
| Total | 2,461 (100.0%) | 2,824 (100.0%) |
Families and Households in Byram
Median Family Size in Byram
The median family size in Byram is 3.24 persons per family, with married-couple families (847 | 62.6%) accounting for the largest median family size of 3.36 persons per family. On the other hand, single male/father families (127 | 9.4%) represent the smallest median family size with 3.03 persons per family.
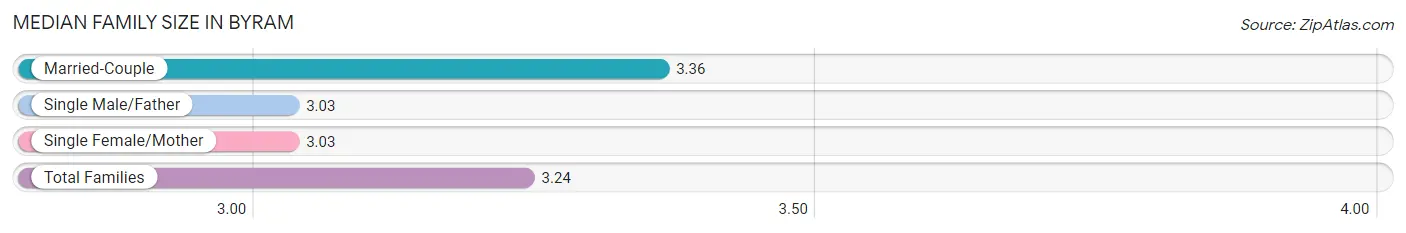
| Family Type | # Families | Family Size |
| Married-Couple | 847 (62.6%) | 3.36 |
| Single Male/Father | 127 (9.4%) | 3.03 |
| Single Female/Mother | 378 (28.0%) | 3.03 |
| Total Families | 1,352 (100.0%) | 3.24 |
Median Household Size in Byram
The median household size in Byram is 2.92 persons per household, with single male/father households (127 | 7.0%) accounting for the largest median household size of 4 persons per household. non-family households (456 | 25.2%) represent the smallest median household size with 1.37 persons per household.
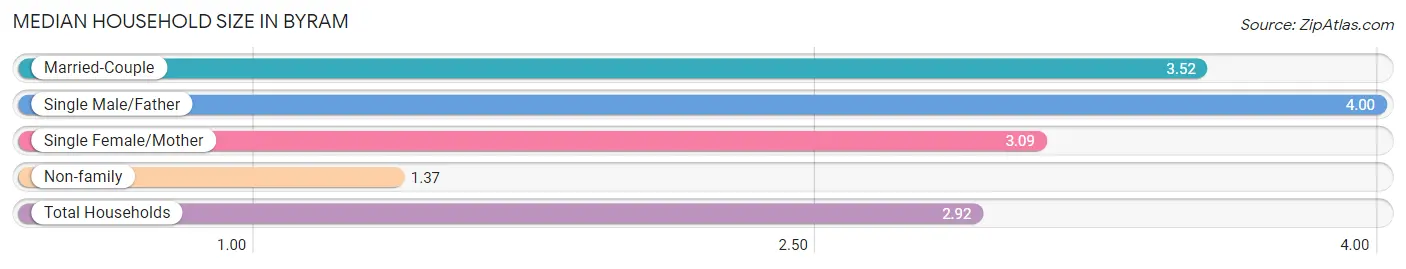
| Household Type | # Households | Household Size |
| Married-Couple | 847 (46.9%) | 3.52 |
| Single Male/Father | 127 (7.0%) | 4.00 |
| Single Female/Mother | 378 (20.9%) | 3.09 |
| Non-family | 456 (25.2%) | 1.37 |
| Total Households | 1,808 (100.0%) | 2.92 |
Household Size by Marriage Status in Byram
Out of a total of 1,808 households in Byram, 1,352 (74.8%) are family households, while 456 (25.2%) are nonfamily households. The most numerous type of family households are 2-person households, comprising 407, and the most common type of nonfamily households are 1-person households, comprising 328.
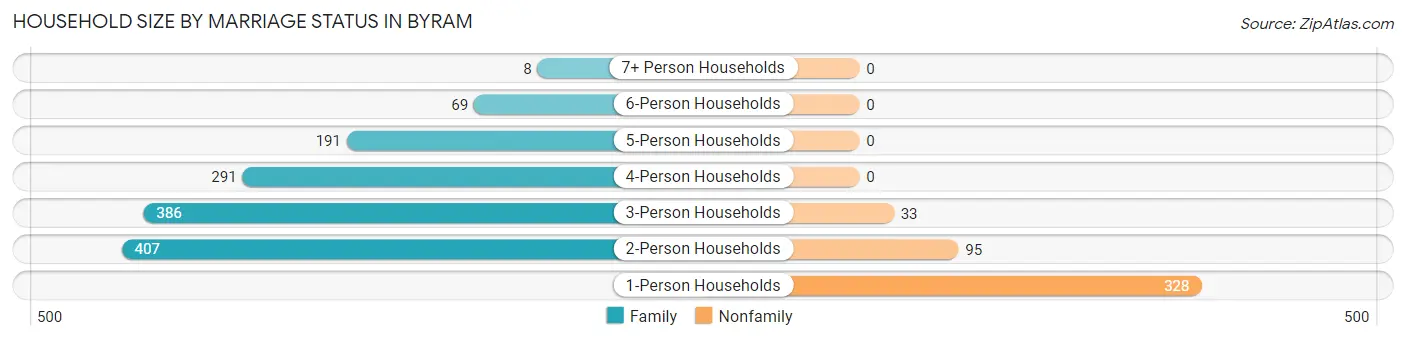
| Household Size | Family Households | Nonfamily Households |
| 1-Person Households | - | 328 (18.1%) |
| 2-Person Households | 407 (22.5%) | 95 (5.2%) |
| 3-Person Households | 386 (21.3%) | 33 (1.8%) |
| 4-Person Households | 291 (16.1%) | 0 (0.0%) |
| 5-Person Households | 191 (10.6%) | 0 (0.0%) |
| 6-Person Households | 69 (3.8%) | 0 (0.0%) |
| 7+ Person Households | 8 (0.4%) | 0 (0.0%) |
| Total | 1,352 (74.8%) | 456 (25.2%) |
Female Fertility in Byram
Fertility by Age in Byram
Average fertility rate in Byram is 129.0 births per 1,000 women. Women in the age bracket of 20 to 34 years have the highest fertility rate with 169.0 births per 1,000 women. Women in the age bracket of 20 to 34 years acount for 53.2% of all women with births.
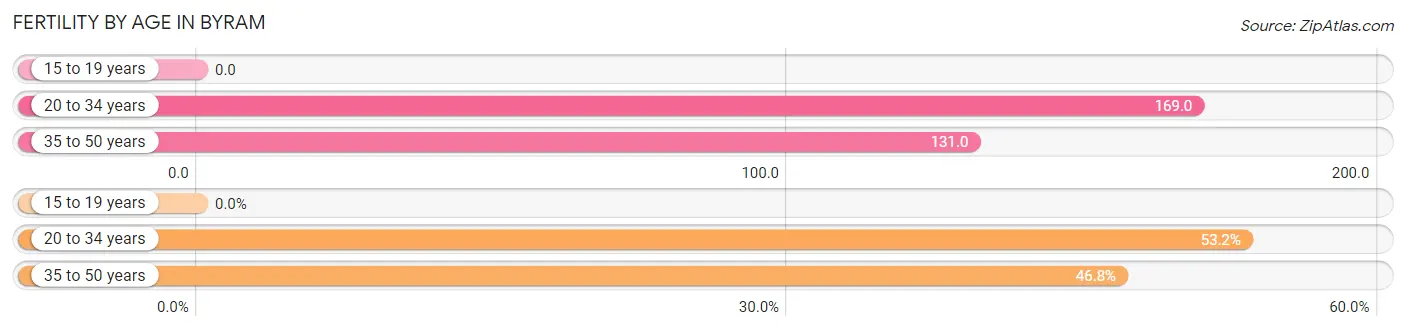
| Age Bracket | Women with Births | Births / 1,000 Women |
| 15 to 19 years | 0 (0.0%) | 0.0 |
| 20 to 34 years | 92 (53.2%) | 169.0 |
| 35 to 50 years | 81 (46.8%) | 131.0 |
| Total | 173 (100.0%) | 129.0 |
Fertility by Age by Marriage Status in Byram
65.3% of women with births (173) in Byram are married. The highest percentage of unmarried women with births falls into 20 to 34 years age bracket with 34.8% of them unmarried at the time of birth, while the lowest percentage of unmarried women with births belong to 35 to 50 years age bracket with 34.6% of them unmarried.
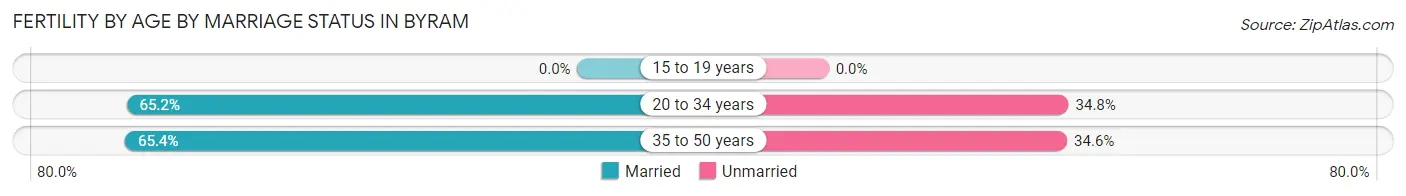
| Age Bracket | Married | Unmarried |
| 15 to 19 years | 0 (0.0%) | 0 (0.0%) |
| 20 to 34 years | 60 (65.2%) | 32 (34.8%) |
| 35 to 50 years | 53 (65.4%) | 28 (34.6%) |
| Total | 113 (65.3%) | 60 (34.7%) |
Fertility by Education in Byram
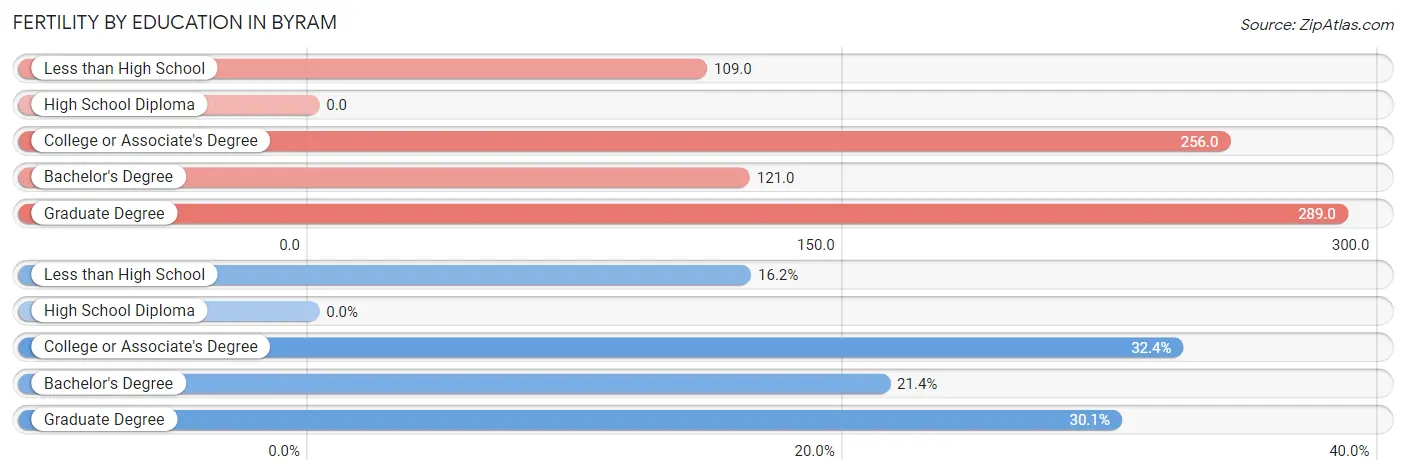
| Educational Attainment | Women with Births | Births / 1,000 Women |
| Less than High School | 28 (16.2%) | 109.0 |
| High School Diploma | 0 (0.0%) | 0.0 |
| College or Associate's Degree | 56 (32.4%) | 256.0 |
| Bachelor's Degree | 37 (21.4%) | 121.0 |
| Graduate Degree | 52 (30.1%) | 289.0 |
| Total | 173 (100.0%) | 129.0 |
Fertility by Education by Marriage Status in Byram
34.7% of women with births in Byram are unmarried. Women with the educational attainment of bachelor's degree are most likely to be married with 100.0% of them married at childbirth, while women with the educational attainment of less than high school are least likely to be married with 100.0% of them unmarried at childbirth.
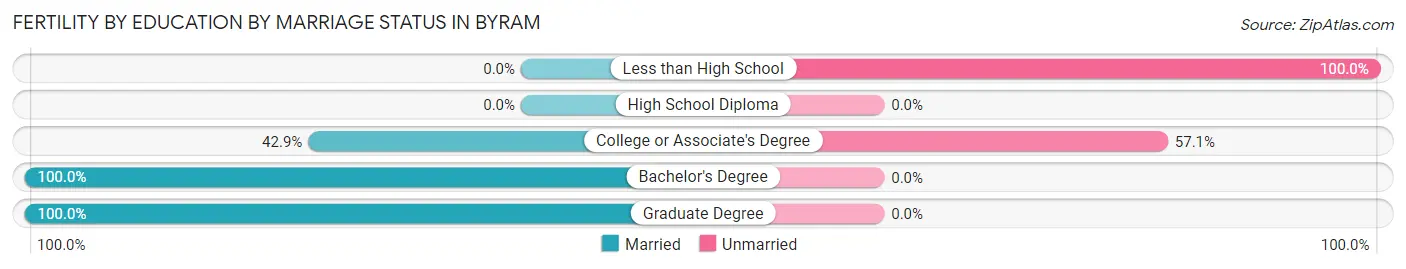
| Educational Attainment | Married | Unmarried |
| Less than High School | 0 (0.0%) | 28 (100.0%) |
| High School Diploma | 0 (0.0%) | 0 (0.0%) |
| College or Associate's Degree | 24 (42.9%) | 32 (57.1%) |
| Bachelor's Degree | 37 (100.0%) | 0 (0.0%) |
| Graduate Degree | 52 (100.0%) | 0 (0.0%) |
| Total | 113 (65.3%) | 60 (34.7%) |
Employment Characteristics in Byram
Employment by Class of Employer in Byram
Among the 2,605 employed individuals in Byram, private company employees (1,641 | 63.0%), self-employed (not incorporated) (375 | 14.4%), and local government employees (261 | 10.0%) make up the most common classes of employment.
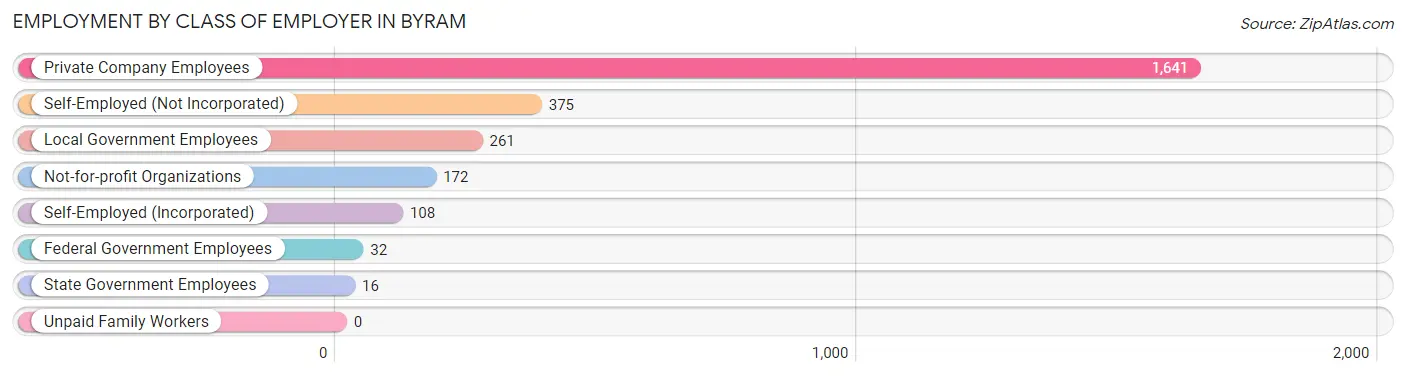
| Employer Class | # Employees | % Employees |
| Private Company Employees | 1,641 | 63.0% |
| Self-Employed (Incorporated) | 108 | 4.2% |
| Self-Employed (Not Incorporated) | 375 | 14.4% |
| Not-for-profit Organizations | 172 | 6.6% |
| Local Government Employees | 261 | 10.0% |
| State Government Employees | 16 | 0.6% |
| Federal Government Employees | 32 | 1.2% |
| Unpaid Family Workers | 0 | 0.0% |
| Total | 2,605 | 100.0% |
Employment Status by Age in Byram
According to the labor force statistics for Byram, out of the total population over 16 years of age (4,189), 72.2% or 3,024 individuals are in the labor force, with 13.1% or 396 of them unemployed. The age group with the highest labor force participation rate is 25 to 29 years, with 100.0% or 287 individuals in the labor force. Within the labor force, the 20 to 24 years age range has the highest percentage of unemployed individuals, with 27.5% or 88 of them being unemployed.
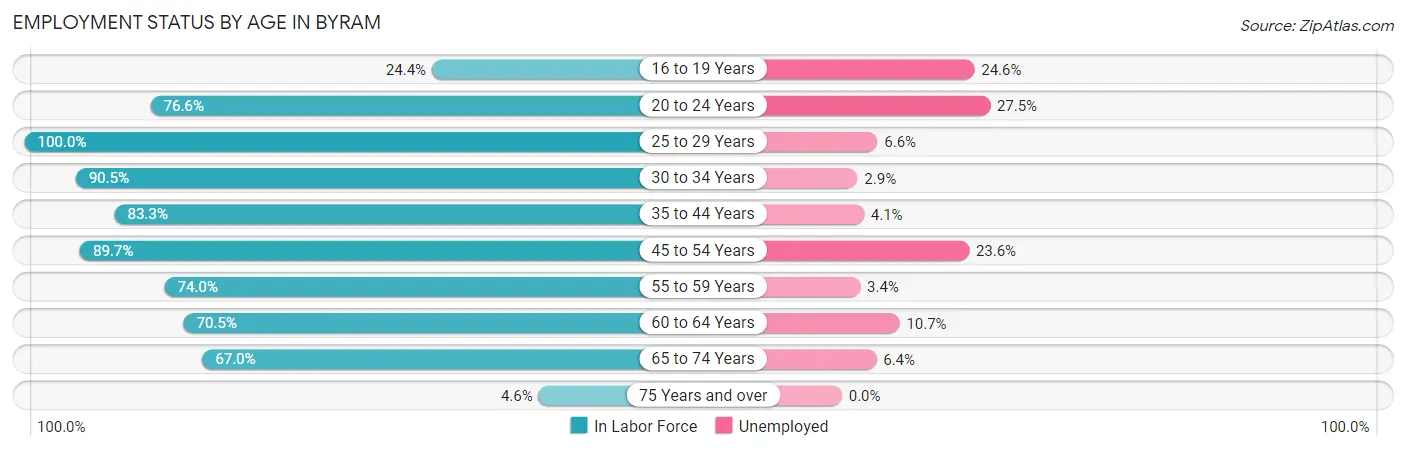
| Age Bracket | In Labor Force | Unemployed |
| 16 to 19 Years | 118 (24.4%) | 29 (24.6%) |
| 20 to 24 Years | 321 (76.6%) | 88 (27.5%) |
| 25 to 29 Years | 287 (100.0%) | 19 (6.6%) |
| 30 to 34 Years | 277 (90.5%) | 8 (2.9%) |
| 35 to 44 Years | 509 (83.3%) | 21 (4.1%) |
| 45 to 54 Years | 788 (89.7%) | 186 (23.6%) |
| 55 to 59 Years | 267 (74.0%) | 9 (3.4%) |
| 60 to 64 Years | 244 (70.5%) | 26 (10.7%) |
| 65 to 74 Years | 203 (67.0%) | 13 (6.4%) |
| 75 Years and over | 9 (4.6%) | 0 (0.0%) |
| Total | 3,024 (72.2%) | 396 (13.1%) |
Employment Status by Educational Attainment in Byram
According to labor force statistics for Byram, 85.0% of individuals (2,371) out of the total population between 25 and 64 years of age (2,789) are in the labor force, with 11.3% or 268 of them being unemployed. The group with the highest labor force participation rate are those with the educational attainment of high school diploma, with 96.0% or 605 individuals in the labor force. Within the labor force, individuals with college / associate degree education have the highest percentage of unemployment, with 29.1% or 154 of them being unemployed.
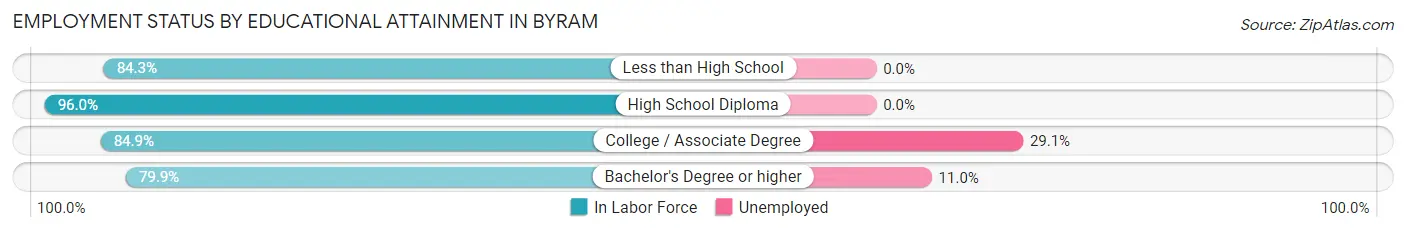
| Educational Attainment | In Labor Force | Unemployed |
| Less than High School | 193 (84.3%) | 0 (0.0%) |
| High School Diploma | 605 (96.0%) | 0 (0.0%) |
| College / Associate Degree | 530 (84.9%) | 182 (29.1%) |
| Bachelor's Degree or higher | 1,043 (79.9%) | 144 (11.0%) |
| Total | 2,371 (85.0%) | 315 (11.3%) |
Employment Occupations by Sex in Byram
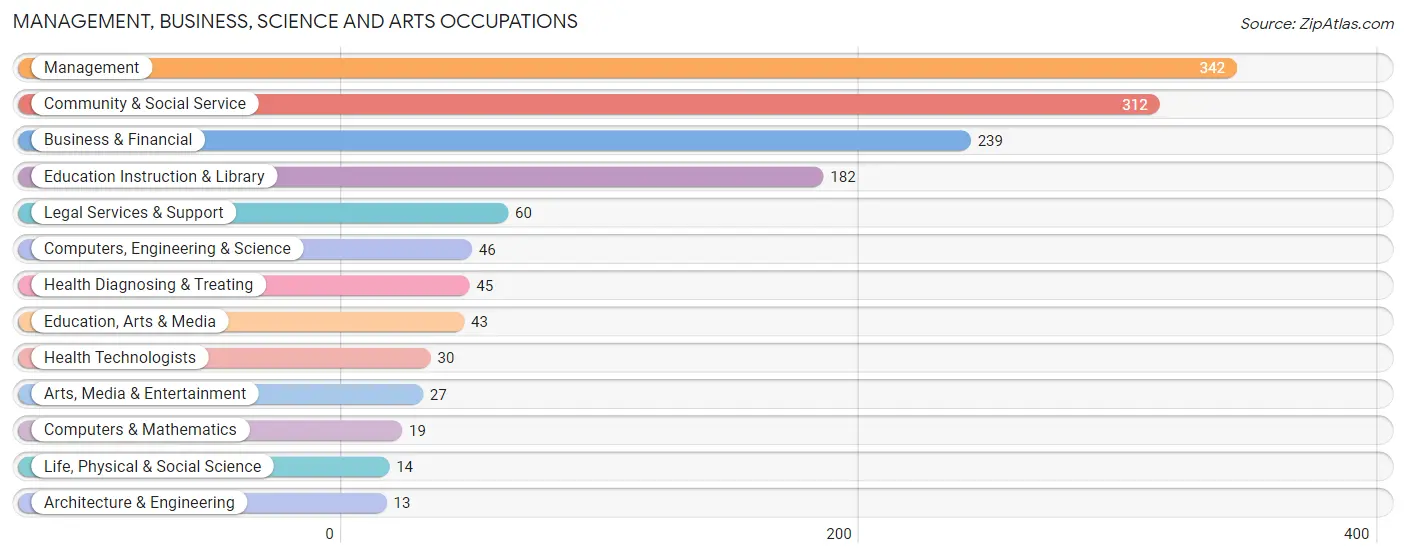
Management, Business, Science and Arts Occupations
The most common Management, Business, Science and Arts occupations in Byram are Management (342 | 13.1%), Community & Social Service (312 | 11.9%), Business & Financial (239 | 9.1%), Education Instruction & Library (182 | 7.0%), and Legal Services & Support (60 | 2.3%).
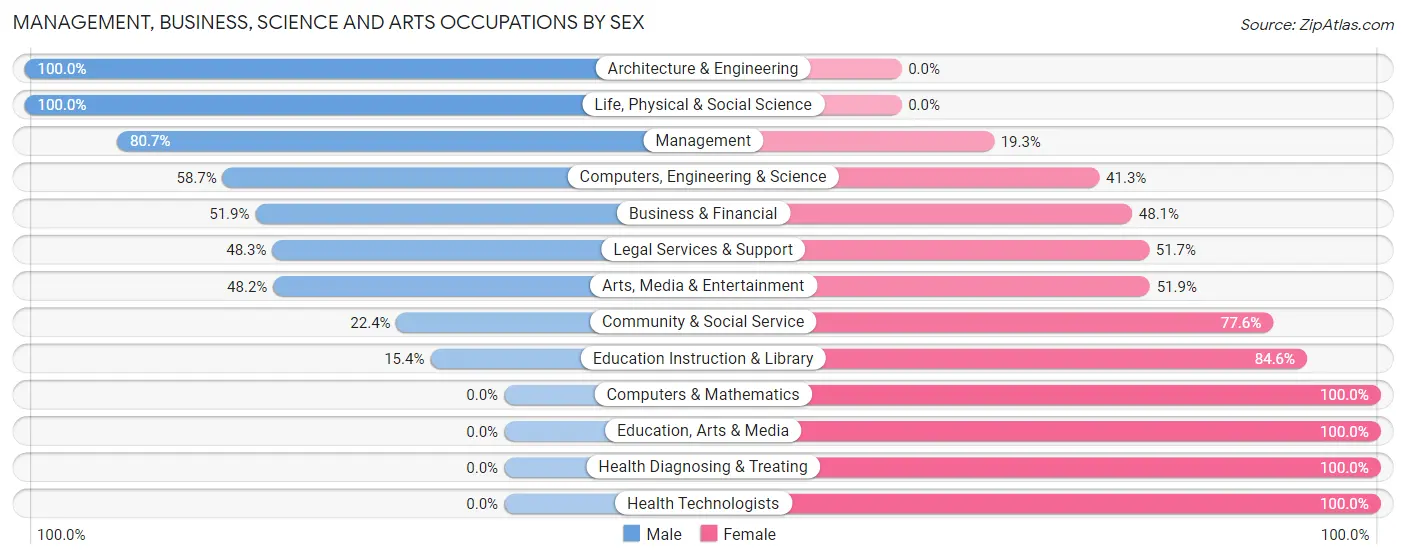
Management, Business, Science and Arts Occupations by Sex
Within the Management, Business, Science and Arts occupations in Byram, the most male-oriented occupations are Architecture & Engineering (100.0%), Life, Physical & Social Science (100.0%), and Management (80.7%), while the most female-oriented occupations are Computers & Mathematics (100.0%), Education, Arts & Media (100.0%), and Health Diagnosing & Treating (100.0%).
| Occupation | Male | Female |
| Management | 276 (80.7%) | 66 (19.3%) |
| Business & Financial | 124 (51.9%) | 115 (48.1%) |
| Computers, Engineering & Science | 27 (58.7%) | 19 (41.3%) |
| Computers & Mathematics | 0 (0.0%) | 19 (100.0%) |
| Architecture & Engineering | 13 (100.0%) | 0 (0.0%) |
| Life, Physical & Social Science | 14 (100.0%) | 0 (0.0%) |
| Community & Social Service | 70 (22.4%) | 242 (77.6%) |
| Education, Arts & Media | 0 (0.0%) | 43 (100.0%) |
| Legal Services & Support | 29 (48.3%) | 31 (51.7%) |
| Education Instruction & Library | 28 (15.4%) | 154 (84.6%) |
| Arts, Media & Entertainment | 13 (48.1%) | 14 (51.8%) |
| Health Diagnosing & Treating | 0 (0.0%) | 45 (100.0%) |
| Health Technologists | 0 (0.0%) | 30 (100.0%) |
| Total (Category) | 497 (50.5%) | 487 (49.5%) |
| Total (Overall) | 1,259 (48.2%) | 1,354 (51.8%) |
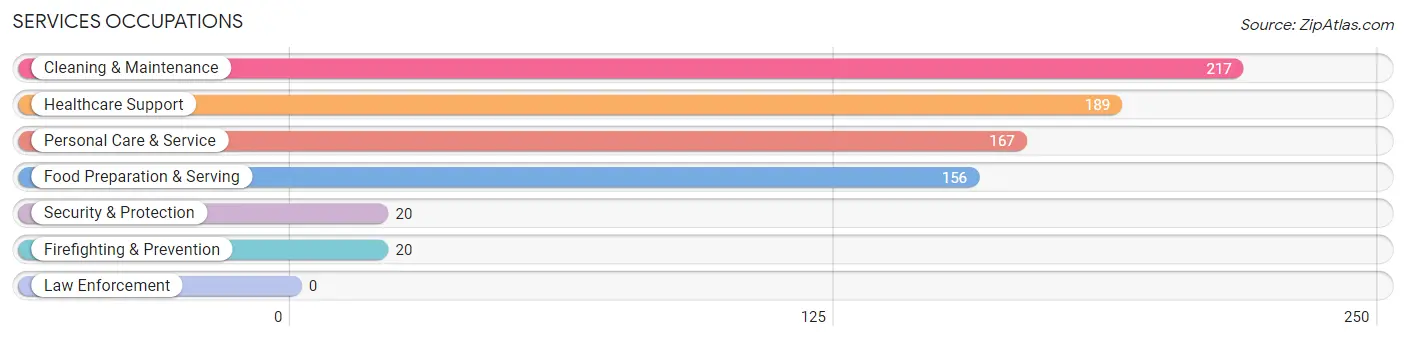
Services Occupations
The most common Services occupations in Byram are Cleaning & Maintenance (217 | 8.3%), Healthcare Support (189 | 7.2%), Personal Care & Service (167 | 6.4%), Food Preparation & Serving (156 | 6.0%), and Security & Protection (20 | 0.8%).
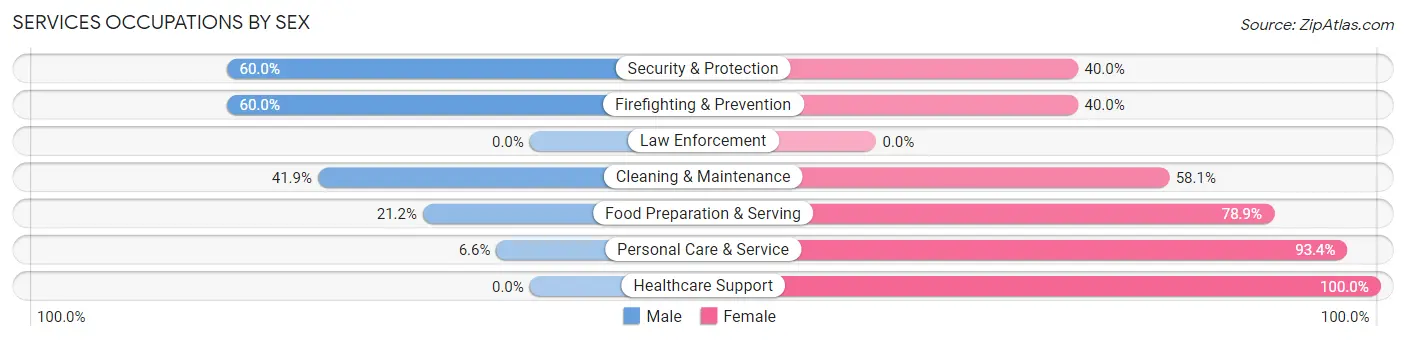
Services Occupations by Sex
Within the Services occupations in Byram, the most male-oriented occupations are Security & Protection (60.0%), Firefighting & Prevention (60.0%), and Cleaning & Maintenance (41.9%), while the most female-oriented occupations are Healthcare Support (100.0%), Personal Care & Service (93.4%), and Food Preparation & Serving (78.8%).
| Occupation | Male | Female |
| Healthcare Support | 0 (0.0%) | 189 (100.0%) |
| Security & Protection | 12 (60.0%) | 8 (40.0%) |
| Firefighting & Prevention | 12 (60.0%) | 8 (40.0%) |
| Law Enforcement | 0 (0.0%) | 0 (0.0%) |
| Food Preparation & Serving | 33 (21.1%) | 123 (78.8%) |
| Cleaning & Maintenance | 91 (41.9%) | 126 (58.1%) |
| Personal Care & Service | 11 (6.6%) | 156 (93.4%) |
| Total (Category) | 147 (19.6%) | 602 (80.4%) |
| Total (Overall) | 1,259 (48.2%) | 1,354 (51.8%) |
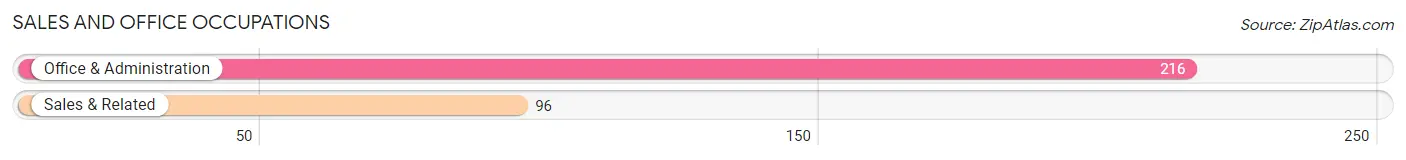
Sales and Office Occupations
The most common Sales and Office occupations in Byram are Office & Administration (216 | 8.3%), and Sales & Related (96 | 3.7%).
Sales and Office Occupations by Sex
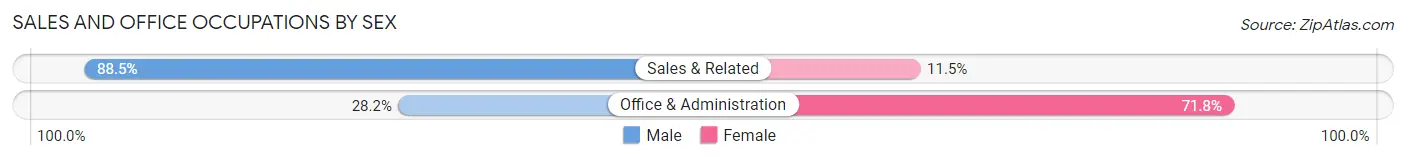
| Occupation | Male | Female |
| Sales & Related | 85 (88.5%) | 11 (11.5%) |
| Office & Administration | 61 (28.2%) | 155 (71.8%) |
| Total (Category) | 146 (46.8%) | 166 (53.2%) |
| Total (Overall) | 1,259 (48.2%) | 1,354 (51.8%) |
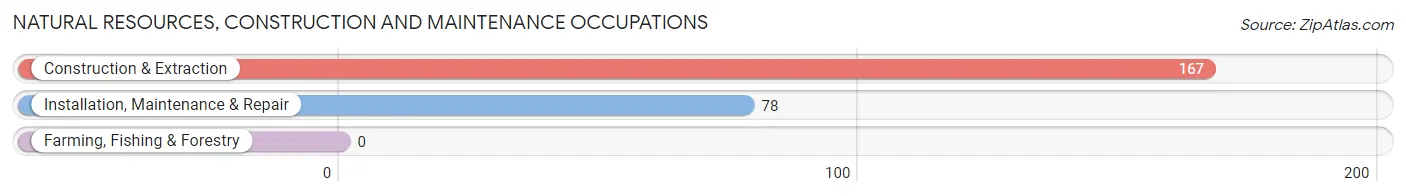
Natural Resources, Construction and Maintenance Occupations
The most common Natural Resources, Construction and Maintenance occupations in Byram are Construction & Extraction (167 | 6.4%), and Installation, Maintenance & Repair (78 | 3.0%).
Natural Resources, Construction and Maintenance Occupations by Sex
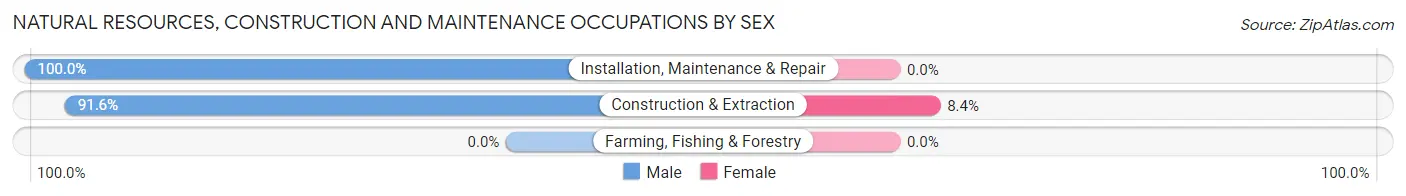
| Occupation | Male | Female |
| Farming, Fishing & Forestry | 0 (0.0%) | 0 (0.0%) |
| Construction & Extraction | 153 (91.6%) | 14 (8.4%) |
| Installation, Maintenance & Repair | 78 (100.0%) | 0 (0.0%) |
| Total (Category) | 231 (94.3%) | 14 (5.7%) |
| Total (Overall) | 1,259 (48.2%) | 1,354 (51.8%) |
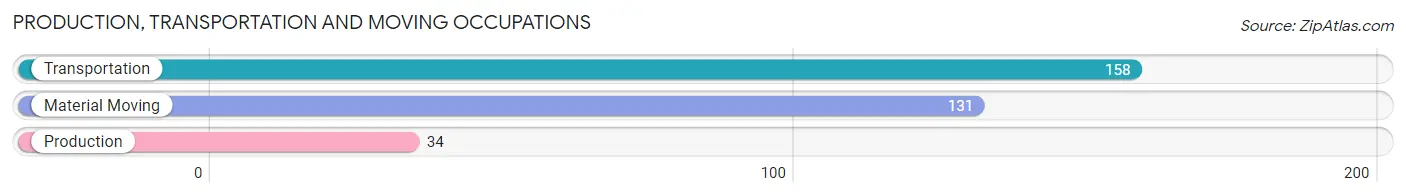
Production, Transportation and Moving Occupations
The most common Production, Transportation and Moving occupations in Byram are Transportation (158 | 6.0%), Material Moving (131 | 5.0%), and Production (34 | 1.3%).
Production, Transportation and Moving Occupations by Sex
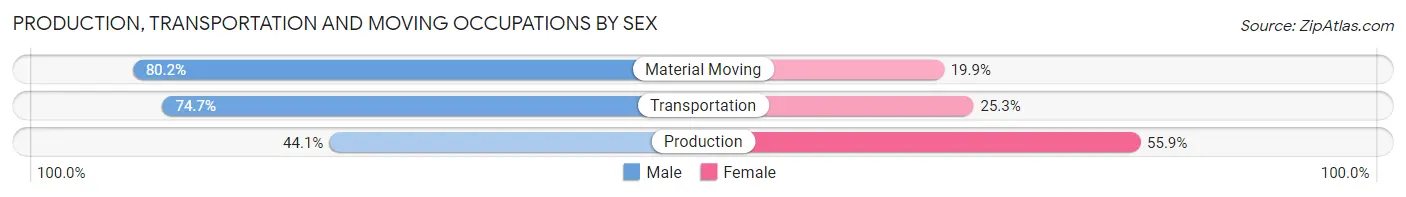
| Occupation | Male | Female |
| Production | 15 (44.1%) | 19 (55.9%) |
| Transportation | 118 (74.7%) | 40 (25.3%) |
| Material Moving | 105 (80.1%) | 26 (19.9%) |
| Total (Category) | 238 (73.7%) | 85 (26.3%) |
| Total (Overall) | 1,259 (48.2%) | 1,354 (51.8%) |
Employment Industries by Sex in Byram
Employment Industries in Byram
The major employment industries in Byram include Health Care & Social Assistance (279 | 10.7%), Administrative & Support (258 | 9.9%), Educational Services (246 | 9.4%), Construction (242 | 9.3%), and Finance & Insurance (224 | 8.6%).
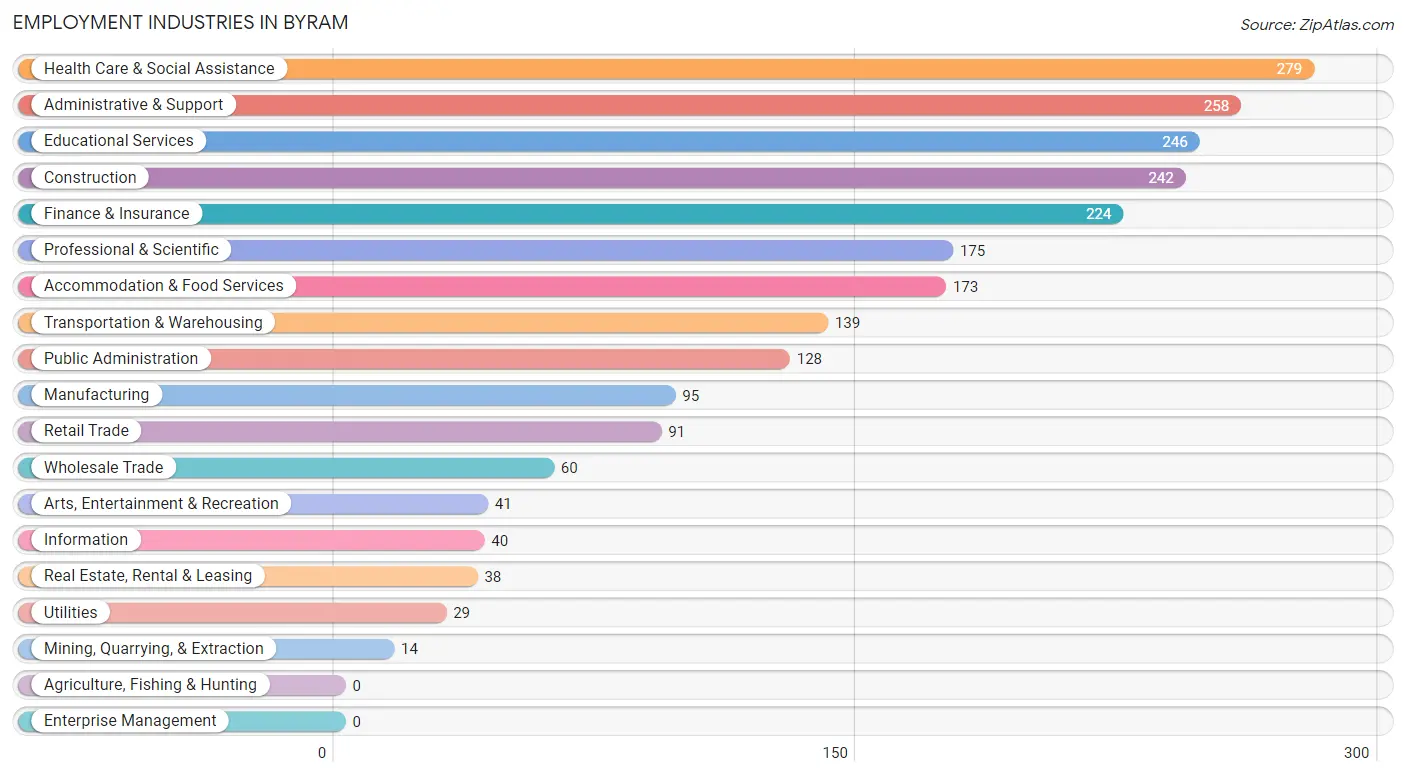
Employment Industries by Sex in Byram
The Byram industries that see more men than women are Mining, Quarrying, & Extraction (100.0%), Wholesale Trade (100.0%), and Utilities (100.0%), whereas the industries that tend to have a higher number of women are Educational Services (84.2%), Health Care & Social Assistance (83.5%), and Manufacturing (72.6%).
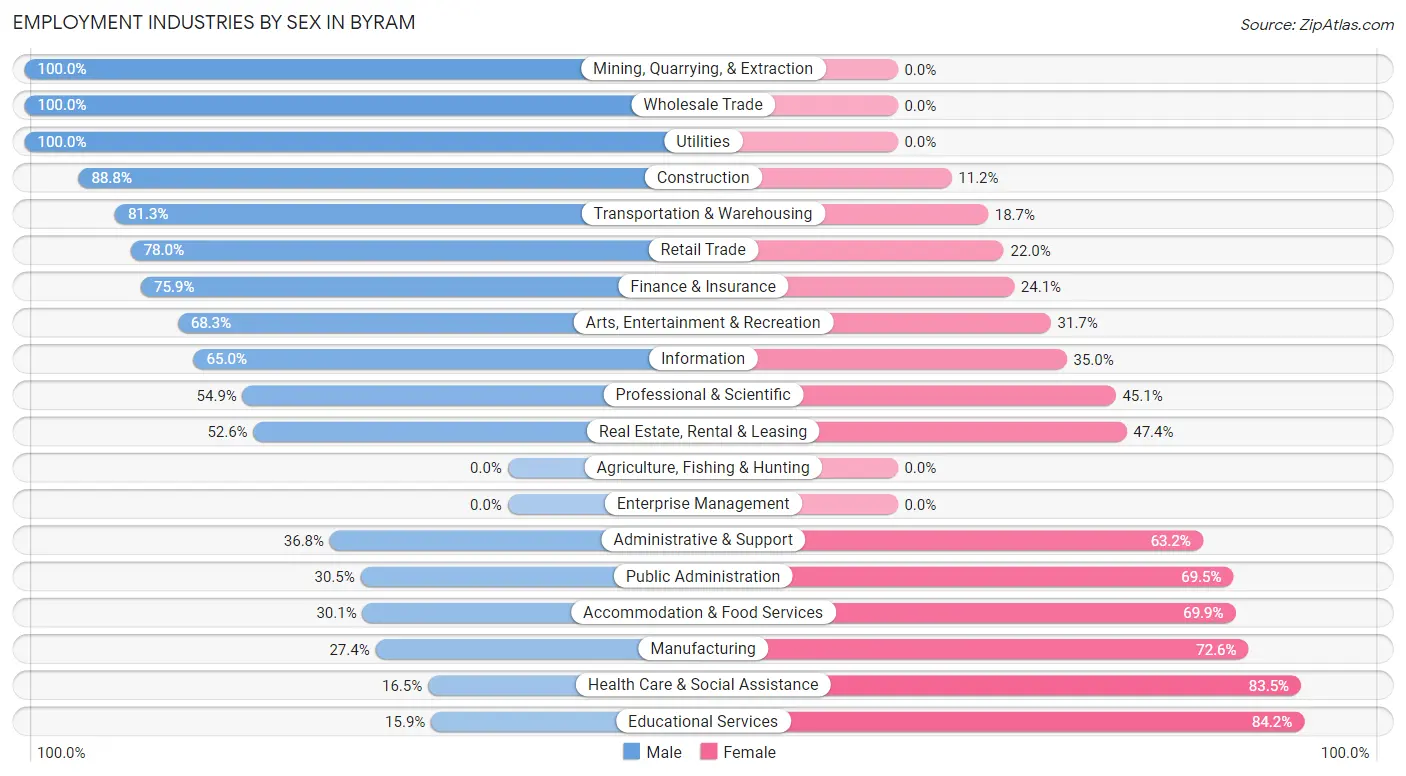
| Industry | Male | Female |
| Agriculture, Fishing & Hunting | 0 (0.0%) | 0 (0.0%) |
| Mining, Quarrying, & Extraction | 14 (100.0%) | 0 (0.0%) |
| Construction | 215 (88.8%) | 27 (11.2%) |
| Manufacturing | 26 (27.4%) | 69 (72.6%) |
| Wholesale Trade | 60 (100.0%) | 0 (0.0%) |
| Retail Trade | 71 (78.0%) | 20 (22.0%) |
| Transportation & Warehousing | 113 (81.3%) | 26 (18.7%) |
| Utilities | 29 (100.0%) | 0 (0.0%) |
| Information | 26 (65.0%) | 14 (35.0%) |
| Finance & Insurance | 170 (75.9%) | 54 (24.1%) |
| Real Estate, Rental & Leasing | 20 (52.6%) | 18 (47.4%) |
| Professional & Scientific | 96 (54.9%) | 79 (45.1%) |
| Enterprise Management | 0 (0.0%) | 0 (0.0%) |
| Administrative & Support | 95 (36.8%) | 163 (63.2%) |
| Educational Services | 39 (15.9%) | 207 (84.2%) |
| Health Care & Social Assistance | 46 (16.5%) | 233 (83.5%) |
| Arts, Entertainment & Recreation | 28 (68.3%) | 13 (31.7%) |
| Accommodation & Food Services | 52 (30.1%) | 121 (69.9%) |
| Public Administration | 39 (30.5%) | 89 (69.5%) |
| Total | 1,259 (48.2%) | 1,354 (51.8%) |
Education in Byram
School Enrollment in Byram
The most common levels of schooling among the 1,519 students in Byram are high school (556 | 36.6%), middle school (470 | 30.9%), and college / undergraduate (198 | 13.0%).
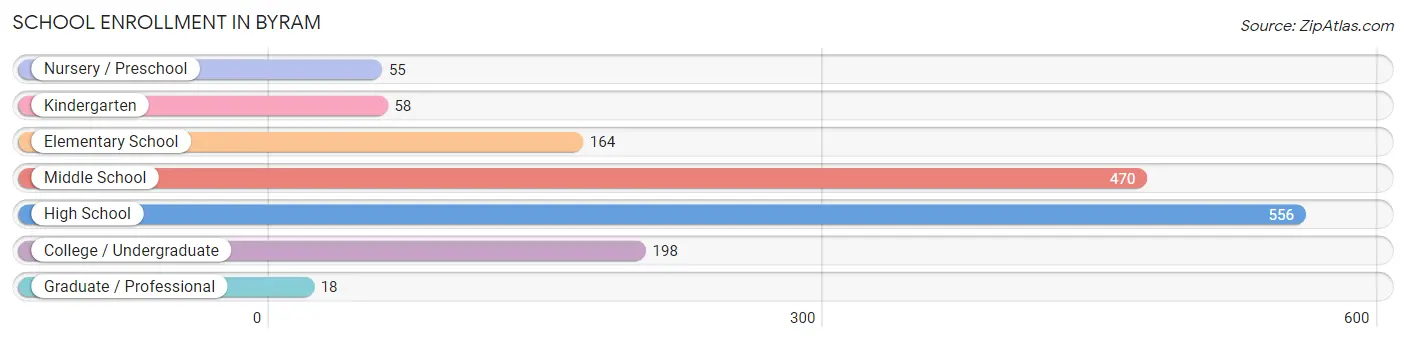
| School Level | # Students | % Students |
| Nursery / Preschool | 55 | 3.6% |
| Kindergarten | 58 | 3.8% |
| Elementary School | 164 | 10.8% |
| Middle School | 470 | 30.9% |
| High School | 556 | 36.6% |
| College / Undergraduate | 198 | 13.0% |
| Graduate / Professional | 18 | 1.2% |
| Total | 1,519 | 100.0% |
School Enrollment by Age by Funding Source in Byram
Out of a total of 1,519 students who are enrolled in schools in Byram, 137 (9.0%) attend a private institution, while the remaining 1,382 (91.0%) are enrolled in public schools. The age group of 15 to 17 year olds has the highest likelihood of being enrolled in private schools, with 63 (23.9% in the age bracket) enrolled. Conversely, the age group of 3 to 4 year olds has the lowest likelihood of being enrolled in a private school, with 37 (100.0% in the age bracket) attending a public institution.
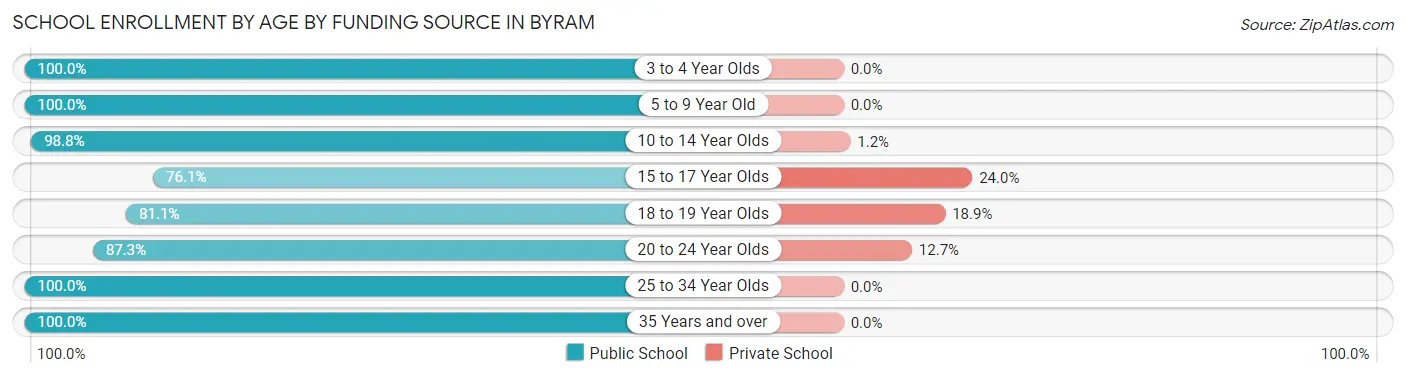
| Age Bracket | Public School | Private School |
| 3 to 4 Year Olds | 37 (100.0%) | 0 (0.0%) |
| 5 to 9 Year Old | 123 (100.0%) | 0 (0.0%) |
| 10 to 14 Year Olds | 638 (98.8%) | 8 (1.2%) |
| 15 to 17 Year Olds | 200 (76.0%) | 63 (23.9%) |
| 18 to 19 Year Olds | 180 (81.1%) | 42 (18.9%) |
| 20 to 24 Year Olds | 158 (87.3%) | 23 (12.7%) |
| 25 to 34 Year Olds | 9 (100.0%) | 0 (0.0%) |
| 35 Years and over | 38 (100.0%) | 0 (0.0%) |
| Total | 1,382 (91.0%) | 137 (9.0%) |
Educational Attainment by Field of Study in Byram
Business (450 | 26.9%), social sciences (341 | 20.4%), literature & languages (149 | 8.9%), psychology (138 | 8.3%), and engineering (104 | 6.2%) are the most common fields of study among 1,672 individuals in Byram who have obtained a bachelor's degree or higher.
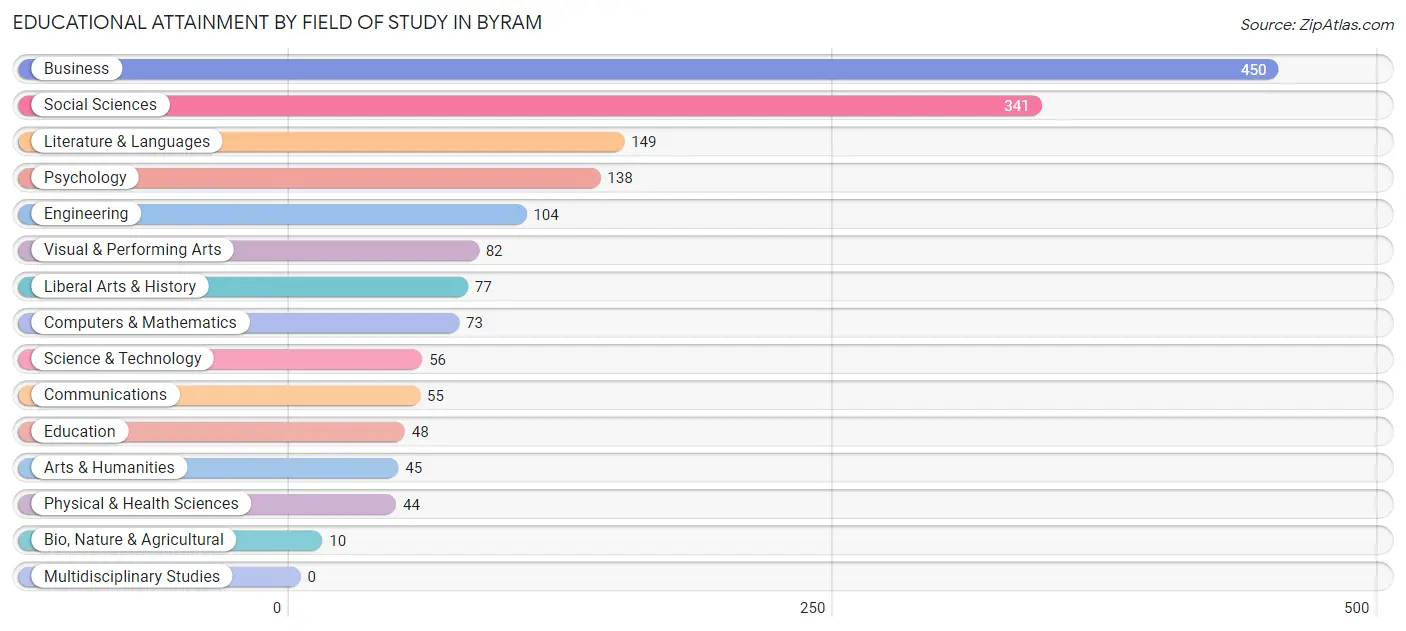
| Field of Study | # Graduates | % Graduates |
| Computers & Mathematics | 73 | 4.4% |
| Bio, Nature & Agricultural | 10 | 0.6% |
| Physical & Health Sciences | 44 | 2.6% |
| Psychology | 138 | 8.3% |
| Social Sciences | 341 | 20.4% |
| Engineering | 104 | 6.2% |
| Multidisciplinary Studies | 0 | 0.0% |
| Science & Technology | 56 | 3.4% |
| Business | 450 | 26.9% |
| Education | 48 | 2.9% |
| Literature & Languages | 149 | 8.9% |
| Liberal Arts & History | 77 | 4.6% |
| Visual & Performing Arts | 82 | 4.9% |
| Communications | 55 | 3.3% |
| Arts & Humanities | 45 | 2.7% |
| Total | 1,672 | 100.0% |
Transportation & Commute in Byram
Vehicle Availability by Sex in Byram
The most prevalent vehicle ownership categories in Byram are males with 2 vehicles (659, accounting for 51.7%) and females with 2 vehicles (616, making up 49.6%).
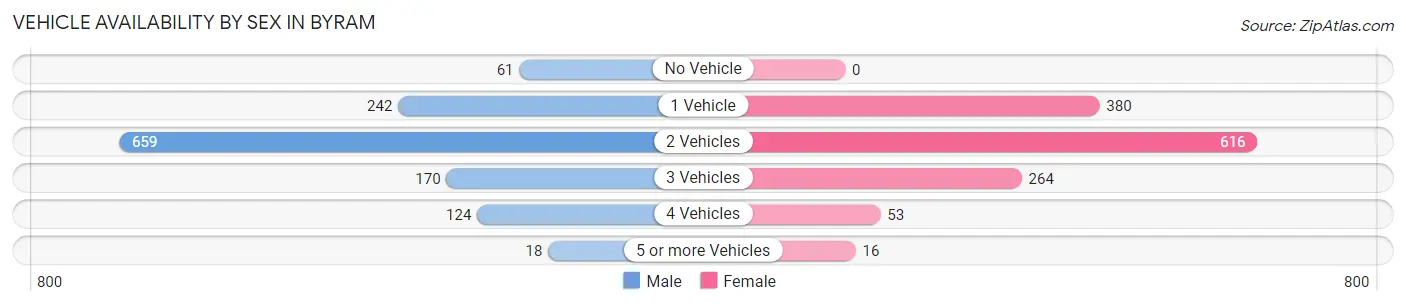
| Vehicles Available | Male | Female |
| No Vehicle | 61 (4.8%) | 0 (0.0%) |
| 1 Vehicle | 242 (19.0%) | 380 (28.6%) |
| 2 Vehicles | 659 (51.7%) | 616 (46.4%) |
| 3 Vehicles | 170 (13.3%) | 264 (19.9%) |
| 4 Vehicles | 124 (9.7%) | 53 (4.0%) |
| 5 or more Vehicles | 18 (1.4%) | 16 (1.2%) |
| Total | 1,274 (100.0%) | 1,329 (100.0%) |
Commute Time in Byram
The most frequently occuring commute durations in Byram are 20 to 24 minutes (469 commuters, 20.3%), 10 to 14 minutes (383 commuters, 16.6%), and 5 to 9 minutes (371 commuters, 16.1%).
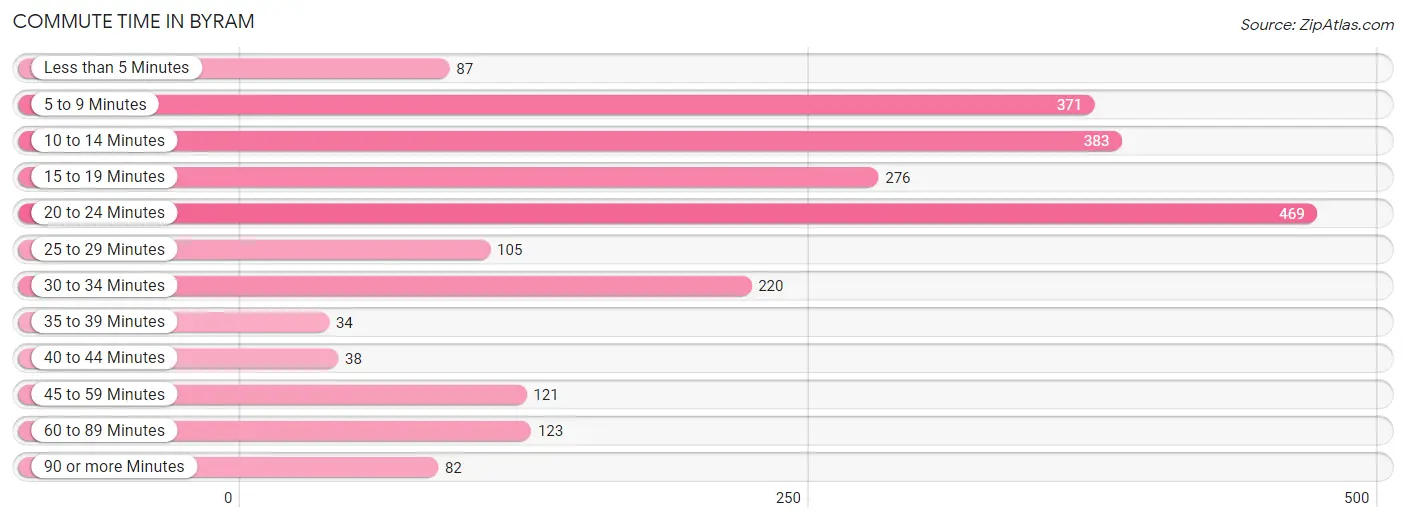
| Commute Time | # Commuters | % Commuters |
| Less than 5 Minutes | 87 | 3.8% |
| 5 to 9 Minutes | 371 | 16.1% |
| 10 to 14 Minutes | 383 | 16.6% |
| 15 to 19 Minutes | 276 | 11.9% |
| 20 to 24 Minutes | 469 | 20.3% |
| 25 to 29 Minutes | 105 | 4.5% |
| 30 to 34 Minutes | 220 | 9.5% |
| 35 to 39 Minutes | 34 | 1.5% |
| 40 to 44 Minutes | 38 | 1.7% |
| 45 to 59 Minutes | 121 | 5.2% |
| 60 to 89 Minutes | 123 | 5.3% |
| 90 or more Minutes | 82 | 3.5% |
Commute Time by Sex in Byram
The most common commute times in Byram are 20 to 24 minutes (276 commuters, 24.0%) for males and 10 to 14 minutes (268 commuters, 23.1%) for females.
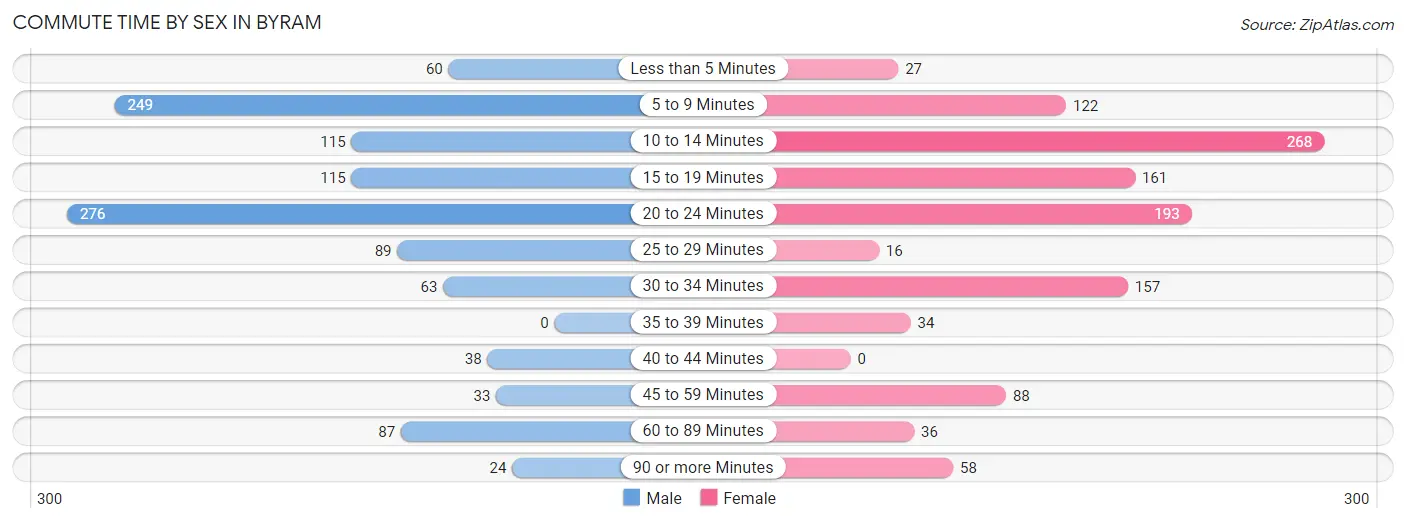
| Commute Time | Male | Female |
| Less than 5 Minutes | 60 (5.2%) | 27 (2.3%) |
| 5 to 9 Minutes | 249 (21.7%) | 122 (10.5%) |
| 10 to 14 Minutes | 115 (10.0%) | 268 (23.1%) |
| 15 to 19 Minutes | 115 (10.0%) | 161 (13.9%) |
| 20 to 24 Minutes | 276 (24.0%) | 193 (16.6%) |
| 25 to 29 Minutes | 89 (7.7%) | 16 (1.4%) |
| 30 to 34 Minutes | 63 (5.5%) | 157 (13.5%) |
| 35 to 39 Minutes | 0 (0.0%) | 34 (2.9%) |
| 40 to 44 Minutes | 38 (3.3%) | 0 (0.0%) |
| 45 to 59 Minutes | 33 (2.9%) | 88 (7.6%) |
| 60 to 89 Minutes | 87 (7.6%) | 36 (3.1%) |
| 90 or more Minutes | 24 (2.1%) | 58 (5.0%) |
Time of Departure to Work by Sex in Byram
The most frequent times of departure to work in Byram are 7:00 AM to 7:29 AM (208, 18.1%) for males and 8:30 AM to 8:59 AM (265, 22.8%) for females.
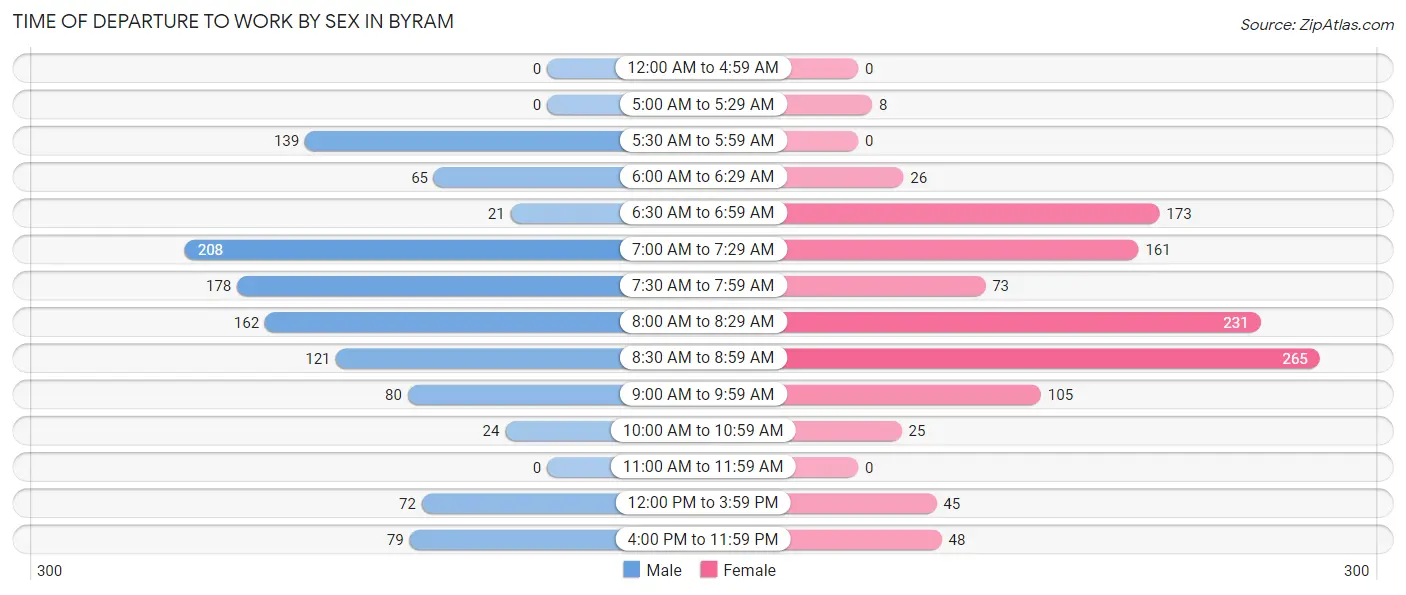
| Time of Departure | Male | Female |
| 12:00 AM to 4:59 AM | 0 (0.0%) | 0 (0.0%) |
| 5:00 AM to 5:29 AM | 0 (0.0%) | 8 (0.7%) |
| 5:30 AM to 5:59 AM | 139 (12.1%) | 0 (0.0%) |
| 6:00 AM to 6:29 AM | 65 (5.7%) | 26 (2.2%) |
| 6:30 AM to 6:59 AM | 21 (1.8%) | 173 (14.9%) |
| 7:00 AM to 7:29 AM | 208 (18.1%) | 161 (13.9%) |
| 7:30 AM to 7:59 AM | 178 (15.5%) | 73 (6.3%) |
| 8:00 AM to 8:29 AM | 162 (14.1%) | 231 (19.9%) |
| 8:30 AM to 8:59 AM | 121 (10.5%) | 265 (22.8%) |
| 9:00 AM to 9:59 AM | 80 (7.0%) | 105 (9.0%) |
| 10:00 AM to 10:59 AM | 24 (2.1%) | 25 (2.2%) |
| 11:00 AM to 11:59 AM | 0 (0.0%) | 0 (0.0%) |
| 12:00 PM to 3:59 PM | 72 (6.3%) | 45 (3.9%) |
| 4:00 PM to 11:59 PM | 79 (6.9%) | 48 (4.1%) |
| Total | 1,149 (100.0%) | 1,160 (100.0%) |
Housing Occupancy in Byram
Occupancy by Ownership in Byram
Of the total 1,808 dwellings in Byram, owner-occupied units account for 665 (36.8%), while renter-occupied units make up 1,143 (63.2%).
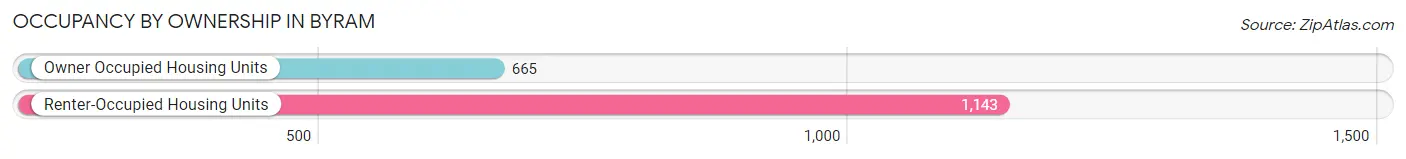
| Occupancy | # Housing Units | % Housing Units |
| Owner Occupied Housing Units | 665 | 36.8% |
| Renter-Occupied Housing Units | 1,143 | 63.2% |
| Total Occupied Housing Units | 1,808 | 100.0% |
Occupancy by Household Size in Byram
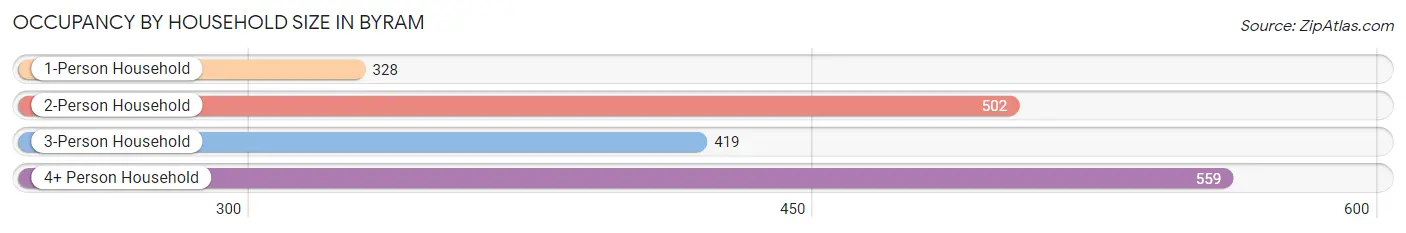
| Household Size | # Housing Units | % Housing Units |
| 1-Person Household | 328 | 18.1% |
| 2-Person Household | 502 | 27.8% |
| 3-Person Household | 419 | 23.2% |
| 4+ Person Household | 559 | 30.9% |
| Total Housing Units | 1,808 | 100.0% |
Occupancy by Ownership by Household Size in Byram
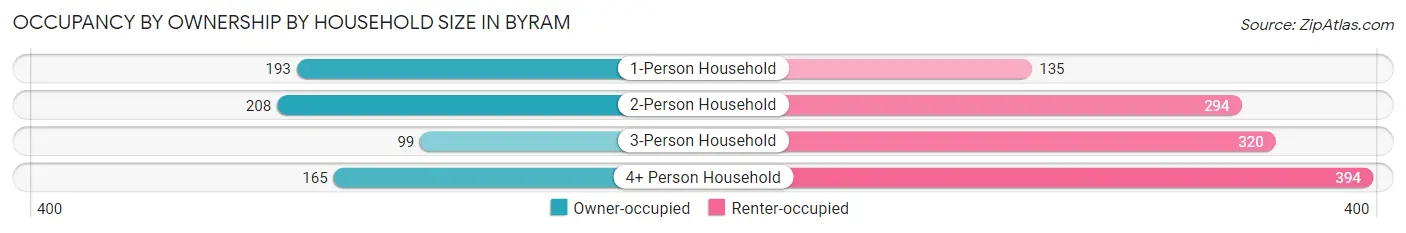
| Household Size | Owner-occupied | Renter-occupied |
| 1-Person Household | 193 (58.8%) | 135 (41.2%) |
| 2-Person Household | 208 (41.4%) | 294 (58.6%) |
| 3-Person Household | 99 (23.6%) | 320 (76.4%) |
| 4+ Person Household | 165 (29.5%) | 394 (70.5%) |
| Total Housing Units | 665 (36.8%) | 1,143 (63.2%) |
Occupancy by Educational Attainment in Byram
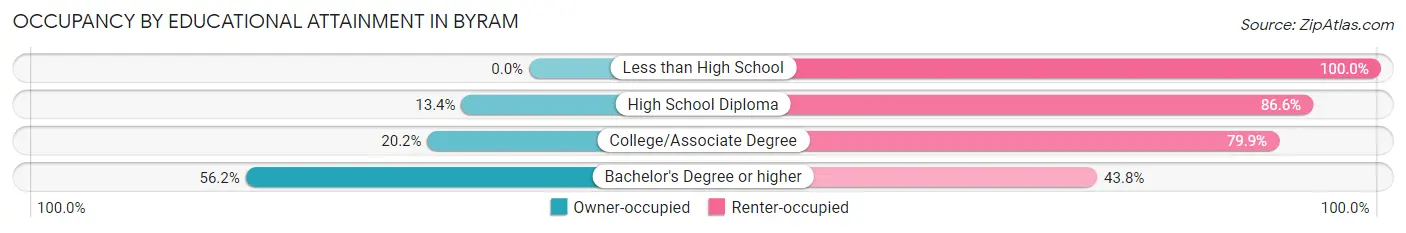
| Household Size | Owner-occupied | Renter-occupied |
| Less than High School | 0 (0.0%) | 117 (100.0%) |
| High School Diploma | 44 (13.4%) | 284 (86.6%) |
| College/Associate Degree | 81 (20.2%) | 321 (79.8%) |
| Bachelor's Degree or higher | 540 (56.2%) | 421 (43.8%) |
Occupancy by Age of Householder in Byram
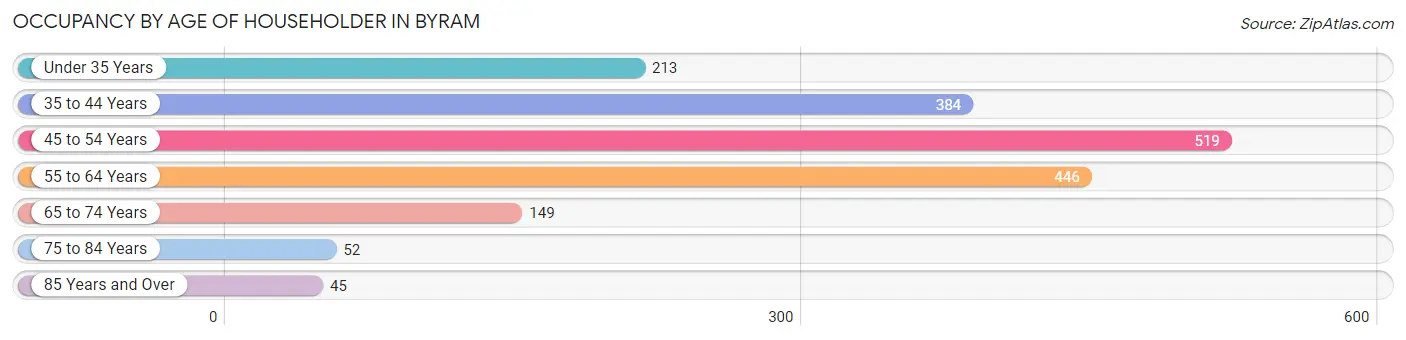
| Age Bracket | # Households | % Households |
| Under 35 Years | 213 | 11.8% |
| 35 to 44 Years | 384 | 21.2% |
| 45 to 54 Years | 519 | 28.7% |
| 55 to 64 Years | 446 | 24.7% |
| 65 to 74 Years | 149 | 8.2% |
| 75 to 84 Years | 52 | 2.9% |
| 85 Years and Over | 45 | 2.5% |
| Total | 1,808 | 100.0% |
Housing Finances in Byram
Median Income by Occupancy in Byram
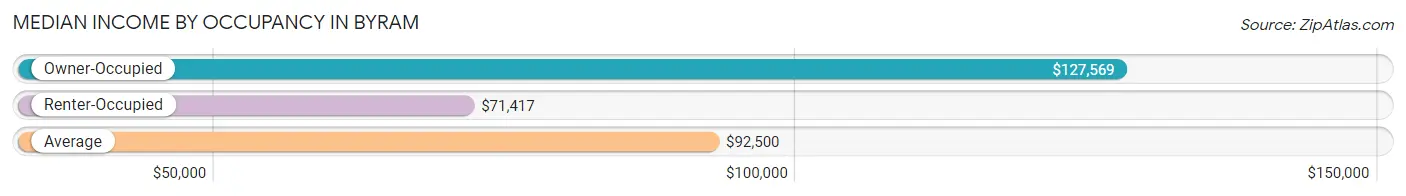
| Occupancy Type | # Households | Median Income |
| Owner-Occupied | 665 (36.8%) | $127,569 |
| Renter-Occupied | 1,143 (63.2%) | $71,417 |
| Average | 1,808 (100.0%) | $92,500 |
Occupancy by Householder Income Bracket in Byram
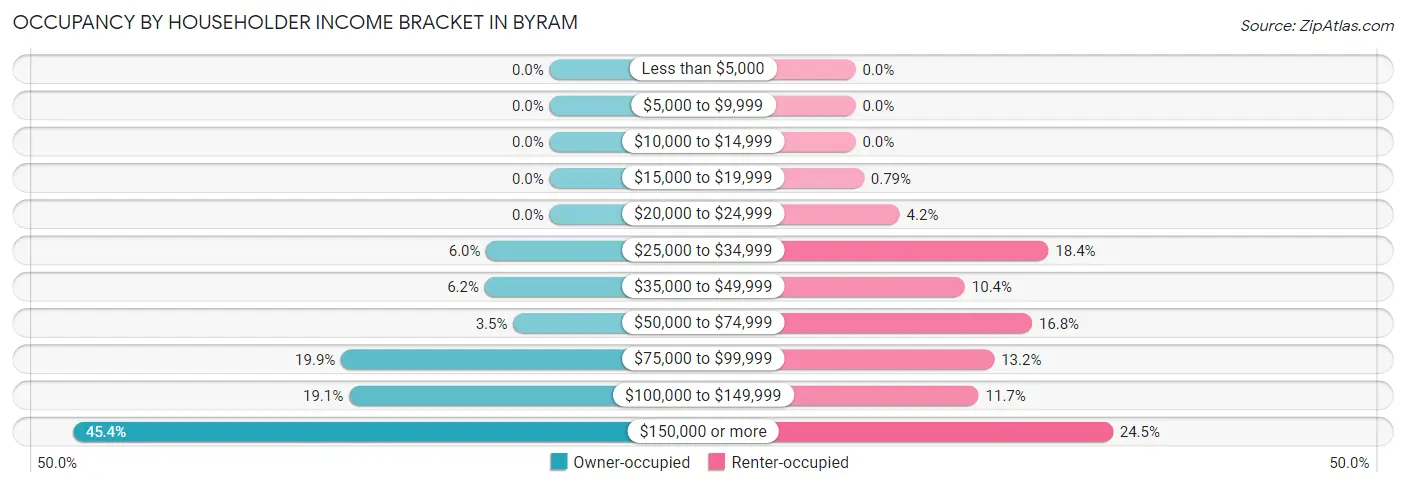
| Income Bracket | Owner-occupied | Renter-occupied |
| Less than $5,000 | 0 (0.0%) | 0 (0.0%) |
| $5,000 to $9,999 | 0 (0.0%) | 0 (0.0%) |
| $10,000 to $14,999 | 0 (0.0%) | 0 (0.0%) |
| $15,000 to $19,999 | 0 (0.0%) | 9 (0.8%) |
| $20,000 to $24,999 | 0 (0.0%) | 48 (4.2%) |
| $25,000 to $34,999 | 40 (6.0%) | 210 (18.4%) |
| $35,000 to $49,999 | 41 (6.2%) | 119 (10.4%) |
| $50,000 to $74,999 | 23 (3.5%) | 192 (16.8%) |
| $75,000 to $99,999 | 132 (19.9%) | 151 (13.2%) |
| $100,000 to $149,999 | 127 (19.1%) | 134 (11.7%) |
| $150,000 or more | 302 (45.4%) | 280 (24.5%) |
| Total | 665 (100.0%) | 1,143 (100.0%) |
Monthly Housing Cost Tiers in Byram
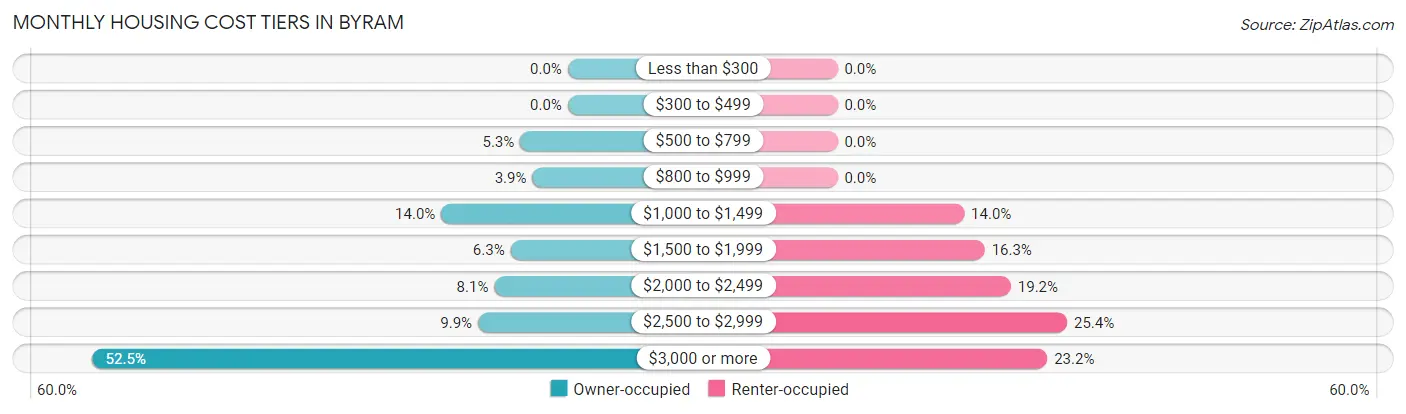
| Monthly Cost | Owner-occupied | Renter-occupied |
| Less than $300 | 0 (0.0%) | 0 (0.0%) |
| $300 to $499 | 0 (0.0%) | 0 (0.0%) |
| $500 to $799 | 35 (5.3%) | 0 (0.0%) |
| $800 to $999 | 26 (3.9%) | 0 (0.0%) |
| $1,000 to $1,499 | 93 (14.0%) | 160 (14.0%) |
| $1,500 to $1,999 | 42 (6.3%) | 186 (16.3%) |
| $2,000 to $2,499 | 54 (8.1%) | 219 (19.2%) |
| $2,500 to $2,999 | 66 (9.9%) | 290 (25.4%) |
| $3,000 or more | 349 (52.5%) | 265 (23.2%) |
| Total | 665 (100.0%) | 1,143 (100.0%) |
Physical Housing Characteristics in Byram
Housing Structures in Byram
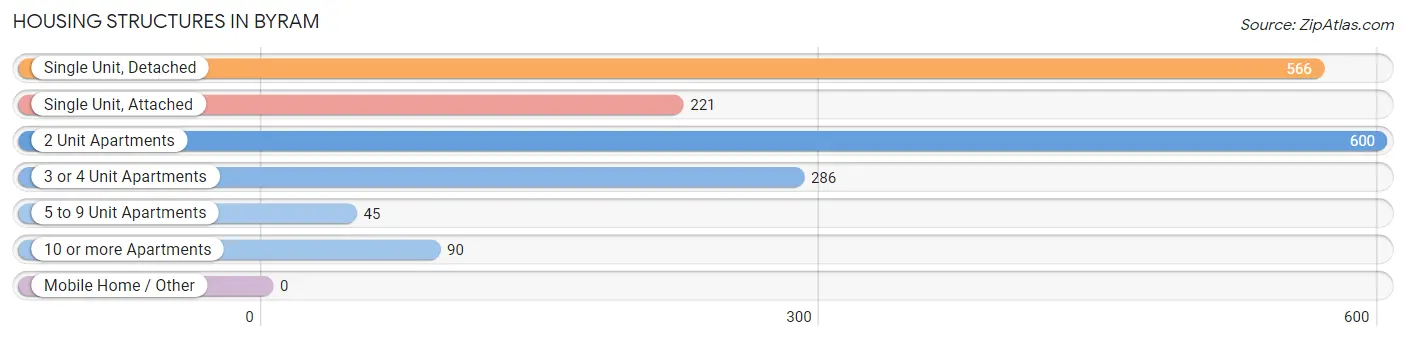
| Structure Type | # Housing Units | % Housing Units |
| Single Unit, Detached | 566 | 31.3% |
| Single Unit, Attached | 221 | 12.2% |
| 2 Unit Apartments | 600 | 33.2% |
| 3 or 4 Unit Apartments | 286 | 15.8% |
| 5 to 9 Unit Apartments | 45 | 2.5% |
| 10 or more Apartments | 90 | 5.0% |
| Mobile Home / Other | 0 | 0.0% |
| Total | 1,808 | 100.0% |
Housing Structures by Occupancy in Byram
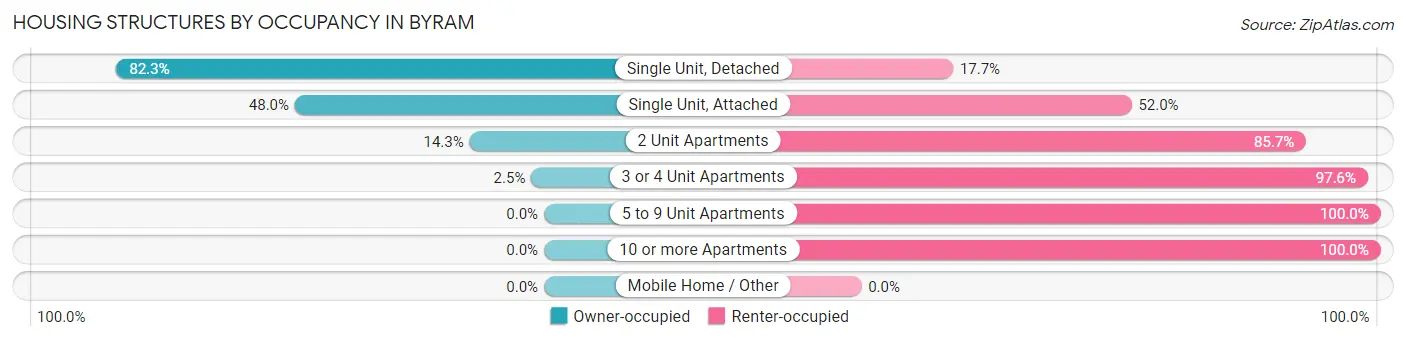
| Structure Type | Owner-occupied | Renter-occupied |
| Single Unit, Detached | 466 (82.3%) | 100 (17.7%) |
| Single Unit, Attached | 106 (48.0%) | 115 (52.0%) |
| 2 Unit Apartments | 86 (14.3%) | 514 (85.7%) |
| 3 or 4 Unit Apartments | 7 (2.5%) | 279 (97.6%) |
| 5 to 9 Unit Apartments | 0 (0.0%) | 45 (100.0%) |
| 10 or more Apartments | 0 (0.0%) | 90 (100.0%) |
| Mobile Home / Other | 0 (0.0%) | 0 (0.0%) |
| Total | 665 (36.8%) | 1,143 (63.2%) |
Housing Structures by Number of Rooms in Byram
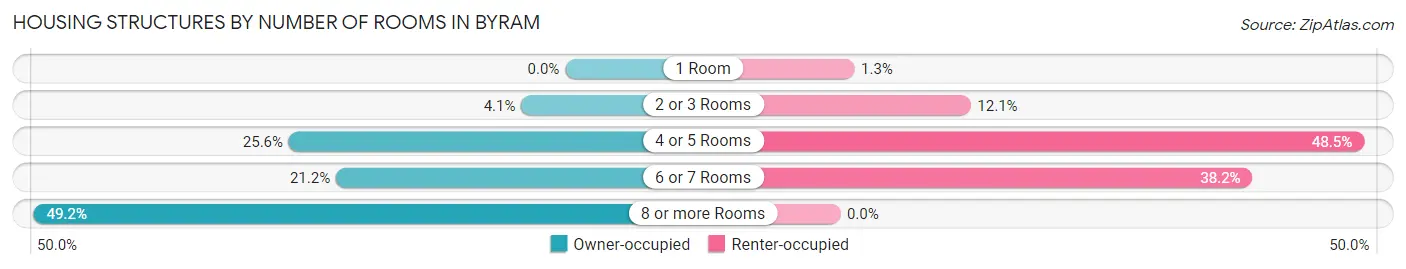
| Number of Rooms | Owner-occupied | Renter-occupied |
| 1 Room | 0 (0.0%) | 15 (1.3%) |
| 2 or 3 Rooms | 27 (4.1%) | 138 (12.1%) |
| 4 or 5 Rooms | 170 (25.6%) | 554 (48.5%) |
| 6 or 7 Rooms | 141 (21.2%) | 436 (38.2%) |
| 8 or more Rooms | 327 (49.2%) | 0 (0.0%) |
| Total | 665 (100.0%) | 1,143 (100.0%) |
Housing Structure by Heating Type in Byram
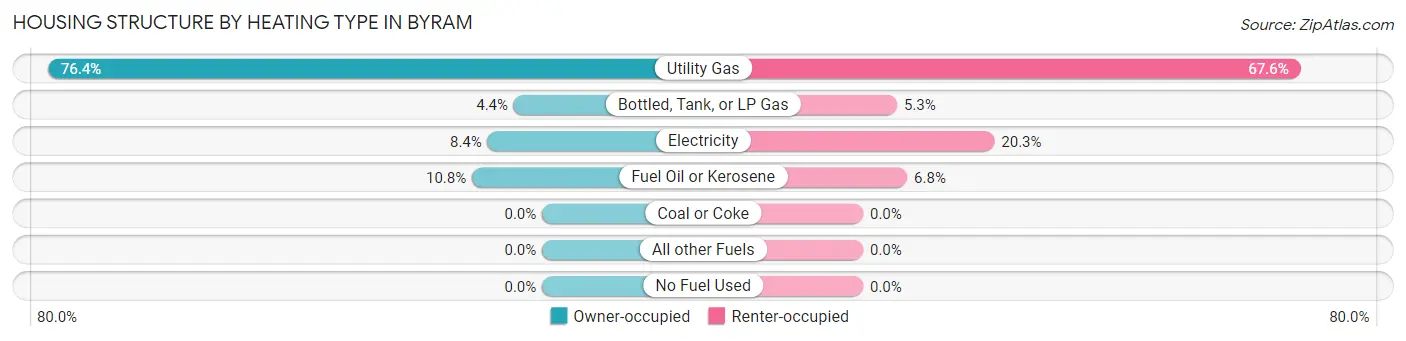
| Heating Type | Owner-occupied | Renter-occupied |
| Utility Gas | 508 (76.4%) | 773 (67.6%) |
| Bottled, Tank, or LP Gas | 29 (4.4%) | 60 (5.2%) |
| Electricity | 56 (8.4%) | 232 (20.3%) |
| Fuel Oil or Kerosene | 72 (10.8%) | 78 (6.8%) |
| Coal or Coke | 0 (0.0%) | 0 (0.0%) |
| All other Fuels | 0 (0.0%) | 0 (0.0%) |
| No Fuel Used | 0 (0.0%) | 0 (0.0%) |
| Total | 665 (100.0%) | 1,143 (100.0%) |
Household Vehicle Usage in Byram
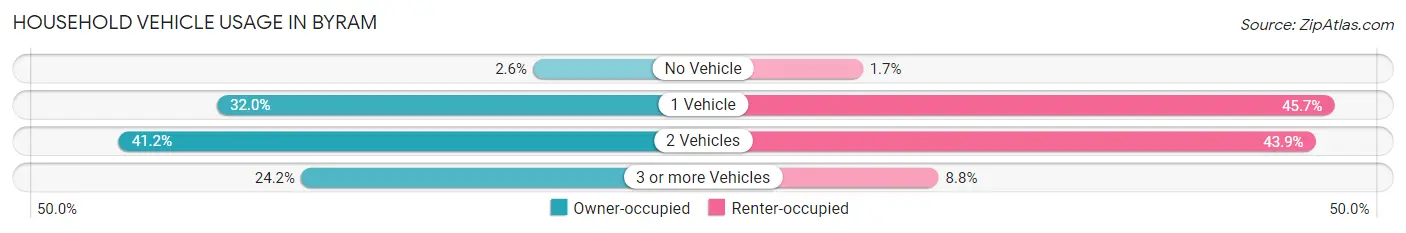
| Vehicles per Household | Owner-occupied | Renter-occupied |
| No Vehicle | 17 (2.6%) | 19 (1.7%) |
| 1 Vehicle | 213 (32.0%) | 522 (45.7%) |
| 2 Vehicles | 274 (41.2%) | 502 (43.9%) |
| 3 or more Vehicles | 161 (24.2%) | 100 (8.7%) |
| Total | 665 (100.0%) | 1,143 (100.0%) |
Real Estate & Mortgages in Byram
Real Estate and Mortgage Overview in Byram
| Characteristic | Without Mortgage | With Mortgage |
| Housing Units | 215 | 450 |
| Median Property Value | $950,700 | $820,800 |
| Median Household Income | $155,625 | $193 |
| Monthly Housing Costs | $1,262 | $338 |
| Real Estate Taxes | $7,435 | $0 |
Property Value by Mortgage Status in Byram
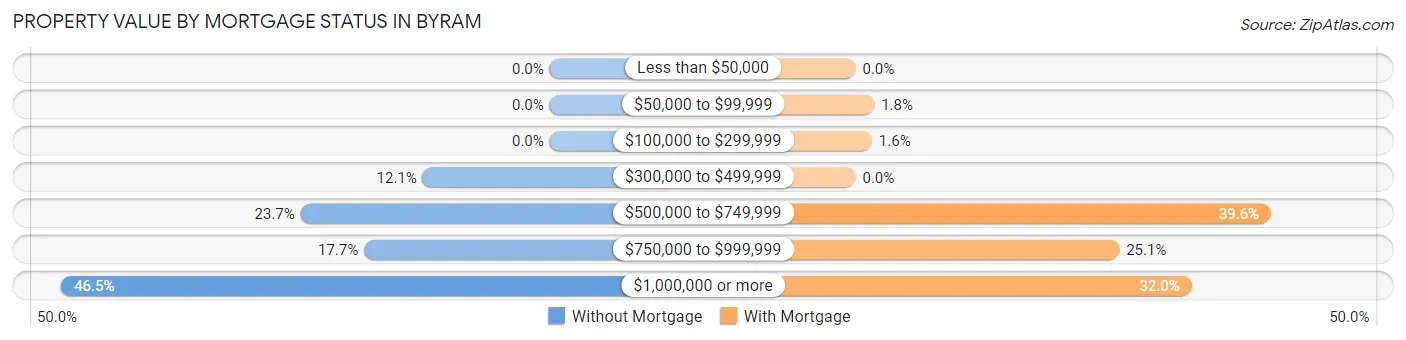
| Property Value | Without Mortgage | With Mortgage |
| Less than $50,000 | 0 (0.0%) | 0 (0.0%) |
| $50,000 to $99,999 | 0 (0.0%) | 8 (1.8%) |
| $100,000 to $299,999 | 0 (0.0%) | 7 (1.6%) |
| $300,000 to $499,999 | 26 (12.1%) | 0 (0.0%) |
| $500,000 to $749,999 | 51 (23.7%) | 178 (39.6%) |
| $750,000 to $999,999 | 38 (17.7%) | 113 (25.1%) |
| $1,000,000 or more | 100 (46.5%) | 144 (32.0%) |
| Total | 215 (100.0%) | 450 (100.0%) |
Household Income by Mortgage Status in Byram
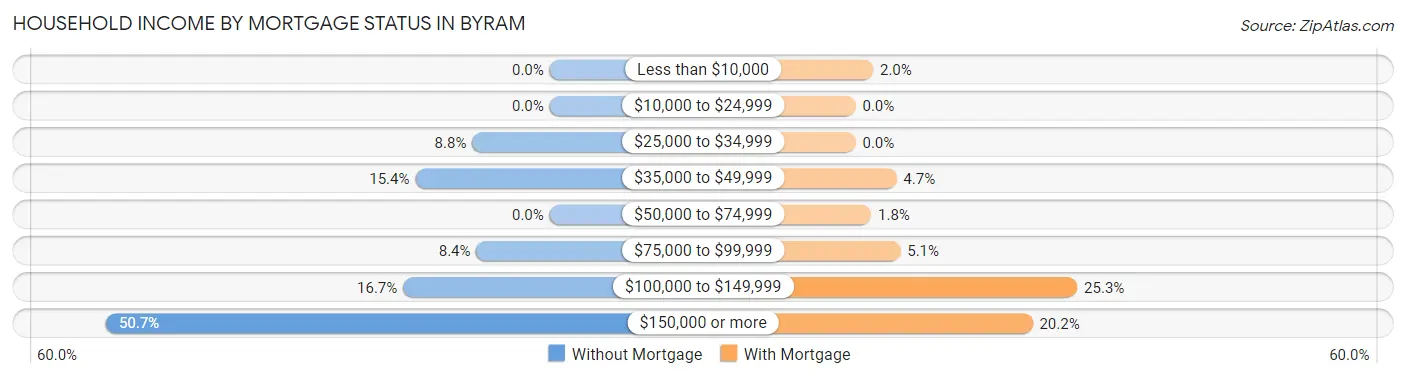
| Household Income | Without Mortgage | With Mortgage |
| Less than $10,000 | 0 (0.0%) | 9 (2.0%) |
| $10,000 to $24,999 | 0 (0.0%) | 0 (0.0%) |
| $25,000 to $34,999 | 19 (8.8%) | 0 (0.0%) |
| $35,000 to $49,999 | 33 (15.3%) | 21 (4.7%) |
| $50,000 to $74,999 | 0 (0.0%) | 8 (1.8%) |
| $75,000 to $99,999 | 18 (8.4%) | 23 (5.1%) |
| $100,000 to $149,999 | 36 (16.7%) | 114 (25.3%) |
| $150,000 or more | 109 (50.7%) | 91 (20.2%) |
| Total | 215 (100.0%) | 450 (100.0%) |
Property Value to Household Income Ratio in Byram
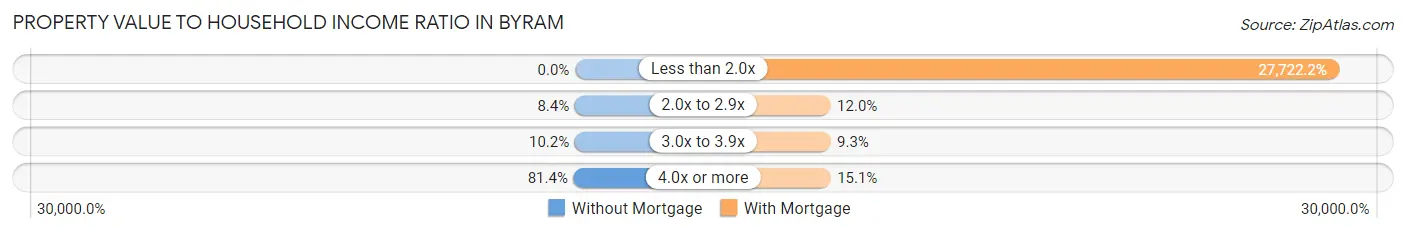
| Value-to-Income Ratio | Without Mortgage | With Mortgage |
| Less than 2.0x | 0 (0.0%) | 124,750 (27,722.2%) |
| 2.0x to 2.9x | 18 (8.4%) | 54 (12.0%) |
| 3.0x to 3.9x | 22 (10.2%) | 42 (9.3%) |
| 4.0x or more | 175 (81.4%) | 68 (15.1%) |
| Total | 215 (100.0%) | 450 (100.0%) |
Real Estate Taxes by Mortgage Status in Byram
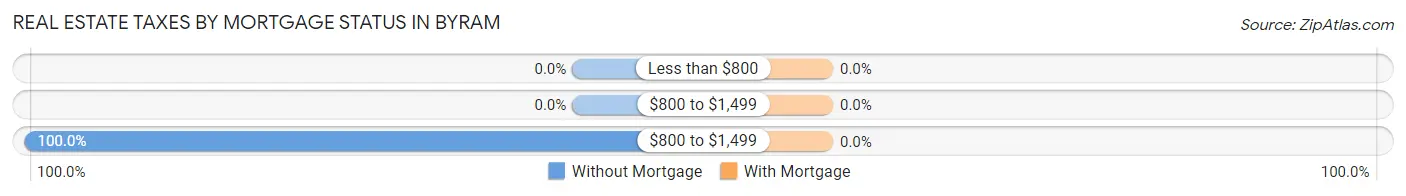
| Property Taxes | Without Mortgage | With Mortgage |
| Less than $800 | 0 (0.0%) | 0 (0.0%) |
| $800 to $1,499 | 0 (0.0%) | 0 (0.0%) |
| $800 to $1,499 | 215 (100.0%) | 0 (0.0%) |
| Total | 215 (100.0%) | 450 (100.0%) |
Health & Disability in Byram
Health Insurance Coverage by Age in Byram
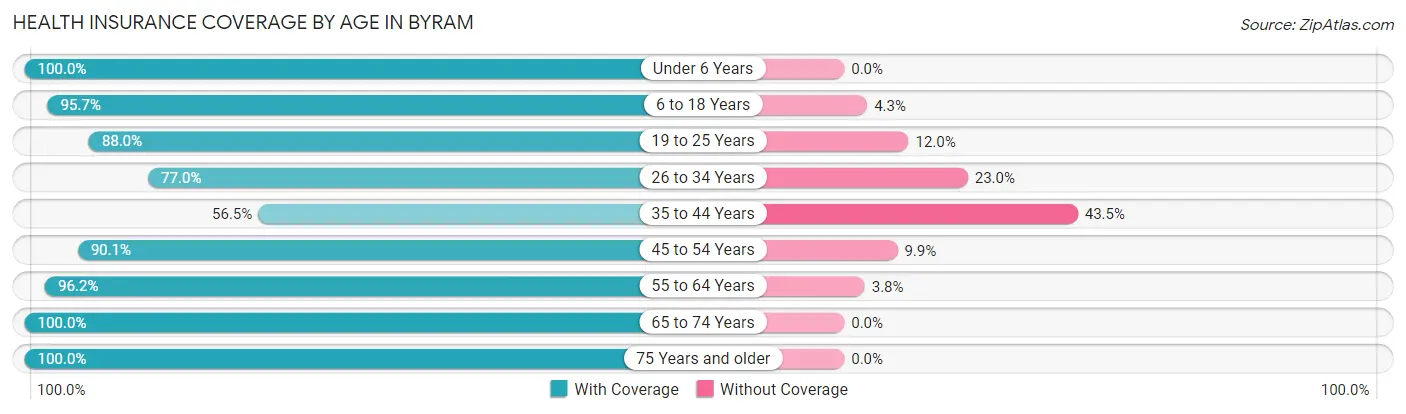
| Age Bracket | With Coverage | Without Coverage |
| Under 6 Years | 341 (100.0%) | 0 (0.0%) |
| 6 to 18 Years | 1,142 (95.7%) | 51 (4.3%) |
| 19 to 25 Years | 470 (88.0%) | 64 (12.0%) |
| 26 to 34 Years | 391 (77.0%) | 117 (23.0%) |
| 35 to 44 Years | 345 (56.5%) | 266 (43.5%) |
| 45 to 54 Years | 791 (90.1%) | 87 (9.9%) |
| 55 to 64 Years | 680 (96.2%) | 27 (3.8%) |
| 65 to 74 Years | 303 (100.0%) | 0 (0.0%) |
| 75 Years and older | 195 (100.0%) | 0 (0.0%) |
| Total | 4,658 (88.4%) | 612 (11.6%) |
Health Insurance Coverage by Citizenship Status in Byram
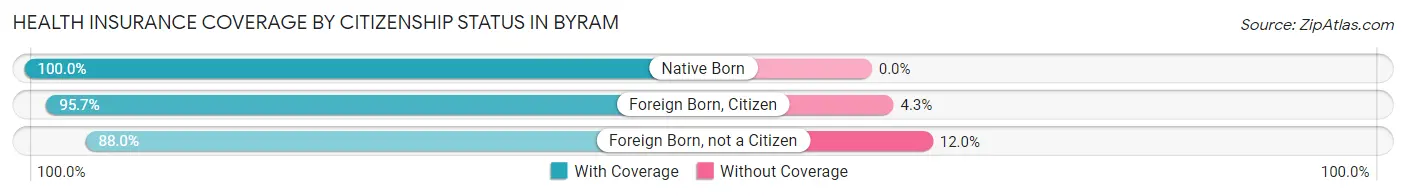
| Citizenship Status | With Coverage | Without Coverage |
| Native Born | 341 (100.0%) | 0 (0.0%) |
| Foreign Born, Citizen | 1,142 (95.7%) | 51 (4.3%) |
| Foreign Born, not a Citizen | 470 (88.0%) | 64 (12.0%) |
Health Insurance Coverage by Household Income in Byram
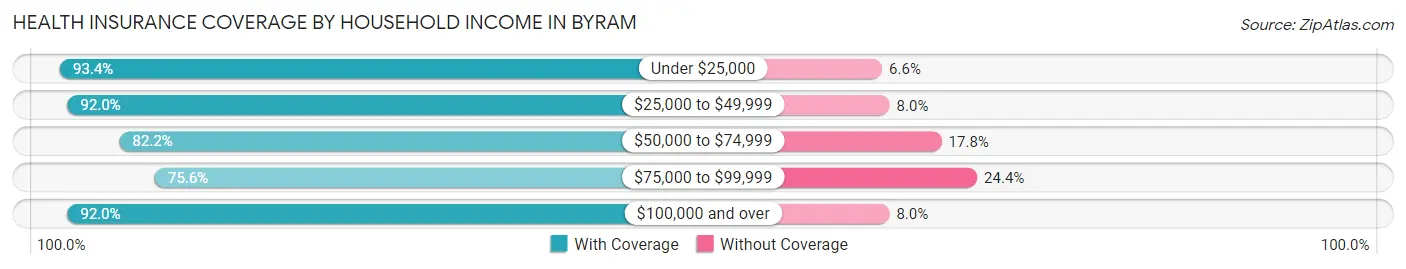
| Household Income | With Coverage | Without Coverage |
| Under $25,000 | 127 (93.4%) | 9 (6.6%) |
| $25,000 to $49,999 | 1,053 (92.0%) | 92 (8.0%) |
| $50,000 to $74,999 | 546 (82.2%) | 118 (17.8%) |
| $75,000 to $99,999 | 585 (75.6%) | 189 (24.4%) |
| $100,000 and over | 2,345 (92.0%) | 204 (8.0%) |
Public vs Private Health Insurance Coverage by Age in Byram
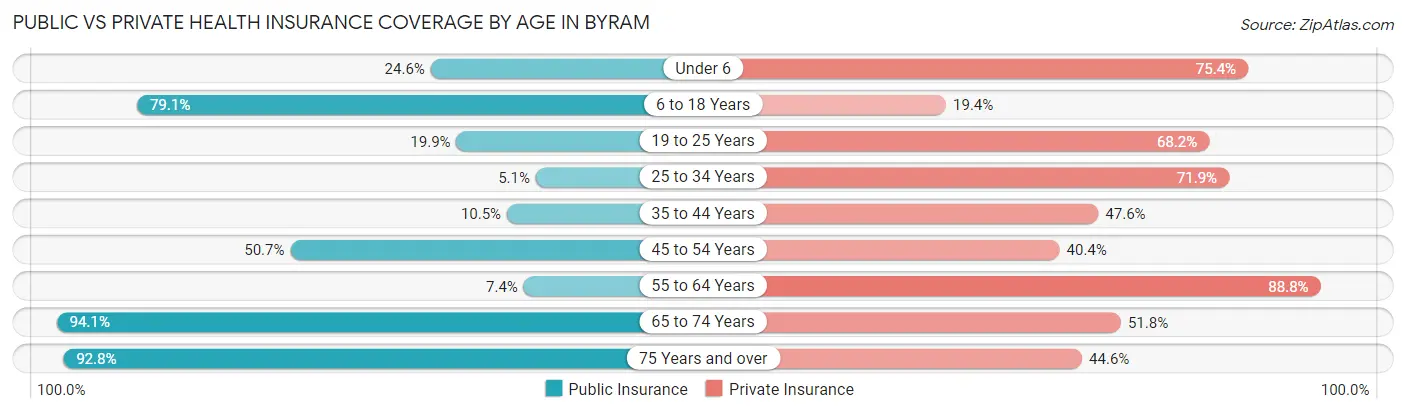
| Age Bracket | Public Insurance | Private Insurance |
| Under 6 | 84 (24.6%) | 257 (75.4%) |
| 6 to 18 Years | 944 (79.1%) | 231 (19.4%) |
| 19 to 25 Years | 106 (19.9%) | 364 (68.2%) |
| 25 to 34 Years | 26 (5.1%) | 365 (71.9%) |
| 35 to 44 Years | 64 (10.5%) | 291 (47.6%) |
| 45 to 54 Years | 445 (50.7%) | 355 (40.4%) |
| 55 to 64 Years | 52 (7.4%) | 628 (88.8%) |
| 65 to 74 Years | 285 (94.1%) | 157 (51.8%) |
| 75 Years and over | 181 (92.8%) | 87 (44.6%) |
| Total | 2,187 (41.5%) | 2,735 (51.9%) |
Disability Status by Sex by Age in Byram
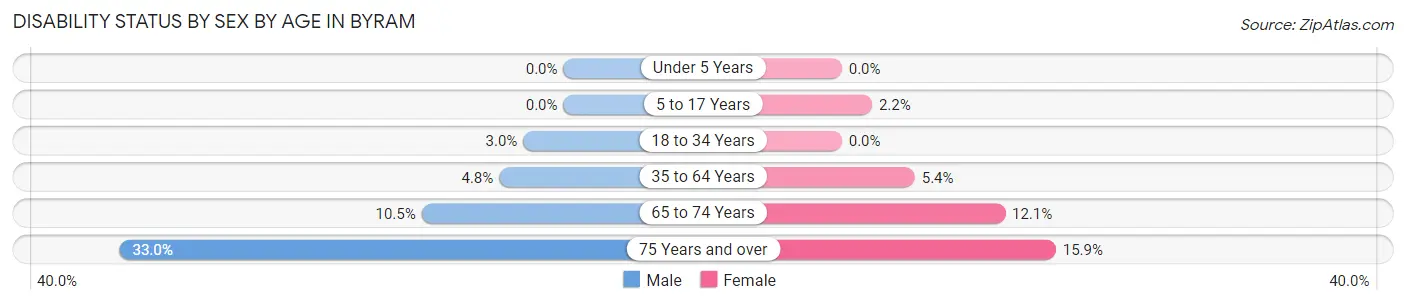
| Age Bracket | Male | Female |
| Under 5 Years | 0 (0.0%) | 0 (0.0%) |
| 5 to 17 Years | 0 (0.0%) | 12 (2.2%) |
| 18 to 34 Years | 19 (3.0%) | 0 (0.0%) |
| 35 to 64 Years | 44 (4.8%) | 69 (5.4%) |
| 65 to 74 Years | 18 (10.5%) | 16 (12.1%) |
| 75 Years and over | 29 (33.0%) | 17 (15.9%) |
Disability Class by Sex by Age in Byram
Disability Class: Hearing Difficulty
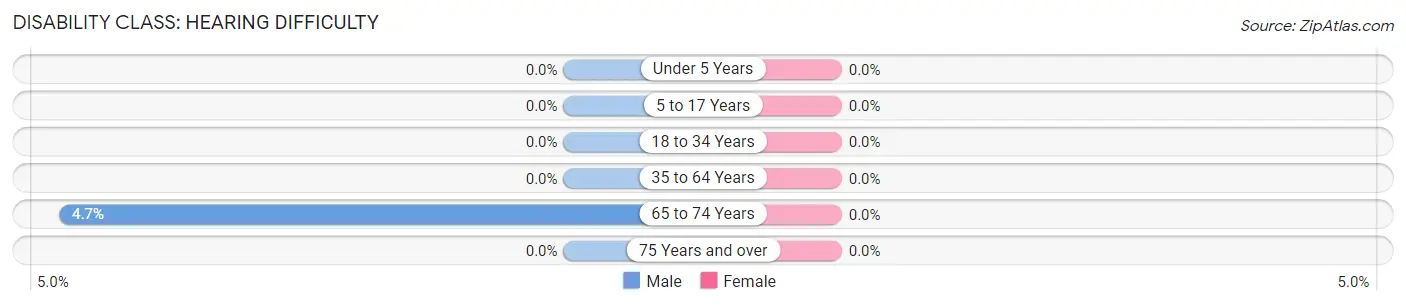
| Age Bracket | Male | Female |
| Under 5 Years | 0 (0.0%) | 0 (0.0%) |
| 5 to 17 Years | 0 (0.0%) | 0 (0.0%) |
| 18 to 34 Years | 0 (0.0%) | 0 (0.0%) |
| 35 to 64 Years | 0 (0.0%) | 0 (0.0%) |
| 65 to 74 Years | 8 (4.7%) | 0 (0.0%) |
| 75 Years and over | 0 (0.0%) | 0 (0.0%) |
Disability Class: Vision Difficulty
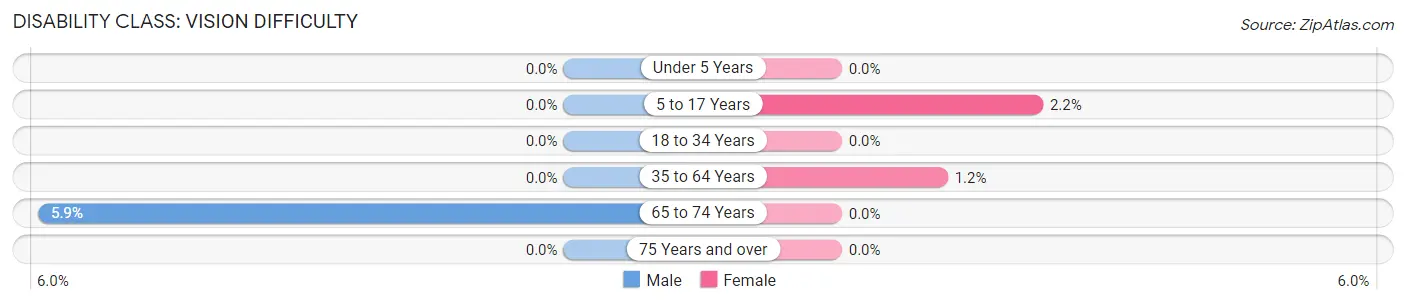
| Age Bracket | Male | Female |
| Under 5 Years | 0 (0.0%) | 0 (0.0%) |
| 5 to 17 Years | 0 (0.0%) | 12 (2.2%) |
| 18 to 34 Years | 0 (0.0%) | 0 (0.0%) |
| 35 to 64 Years | 0 (0.0%) | 15 (1.2%) |
| 65 to 74 Years | 10 (5.9%) | 0 (0.0%) |
| 75 Years and over | 0 (0.0%) | 0 (0.0%) |
Disability Class: Cognitive Difficulty
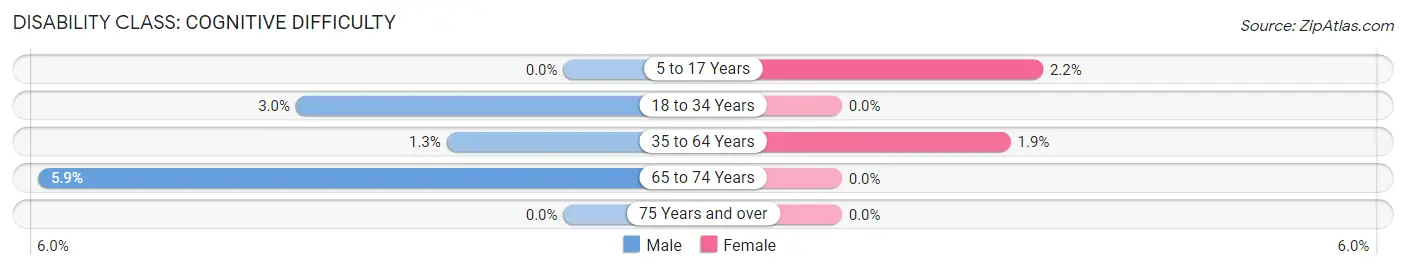
| Age Bracket | Male | Female |
| 5 to 17 Years | 0 (0.0%) | 12 (2.2%) |
| 18 to 34 Years | 19 (3.0%) | 0 (0.0%) |
| 35 to 64 Years | 12 (1.3%) | 24 (1.9%) |
| 65 to 74 Years | 10 (5.9%) | 0 (0.0%) |
| 75 Years and over | 0 (0.0%) | 0 (0.0%) |
Disability Class: Ambulatory Difficulty
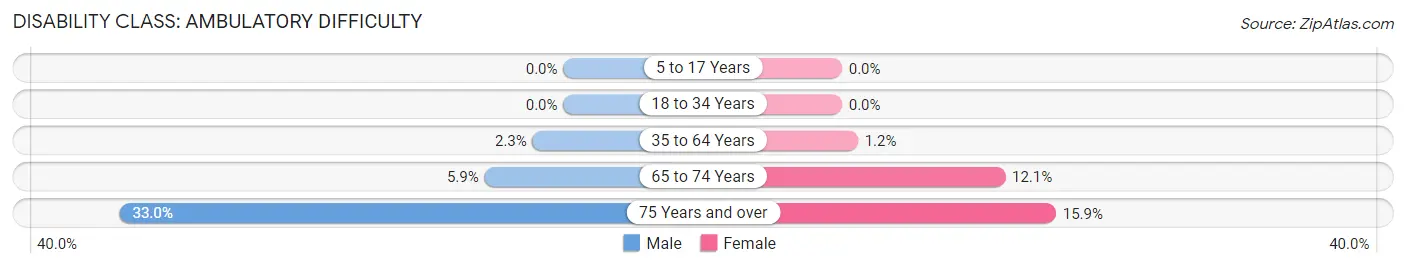
| Age Bracket | Male | Female |
| 5 to 17 Years | 0 (0.0%) | 0 (0.0%) |
| 18 to 34 Years | 0 (0.0%) | 0 (0.0%) |
| 35 to 64 Years | 21 (2.3%) | 15 (1.2%) |
| 65 to 74 Years | 10 (5.9%) | 16 (12.1%) |
| 75 Years and over | 29 (33.0%) | 17 (15.9%) |
Disability Class: Self-Care Difficulty
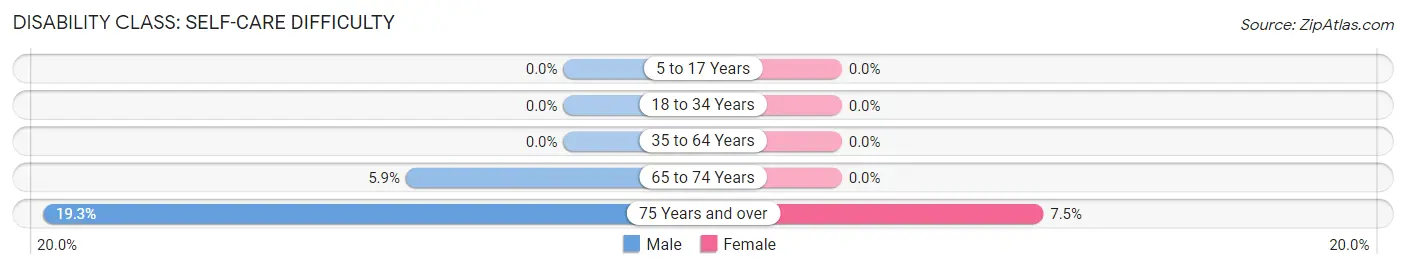
| Age Bracket | Male | Female |
| 5 to 17 Years | 0 (0.0%) | 0 (0.0%) |
| 18 to 34 Years | 0 (0.0%) | 0 (0.0%) |
| 35 to 64 Years | 0 (0.0%) | 0 (0.0%) |
| 65 to 74 Years | 10 (5.9%) | 0 (0.0%) |
| 75 Years and over | 17 (19.3%) | 8 (7.5%) |
Technology Access in Byram
Computing Device Access in Byram
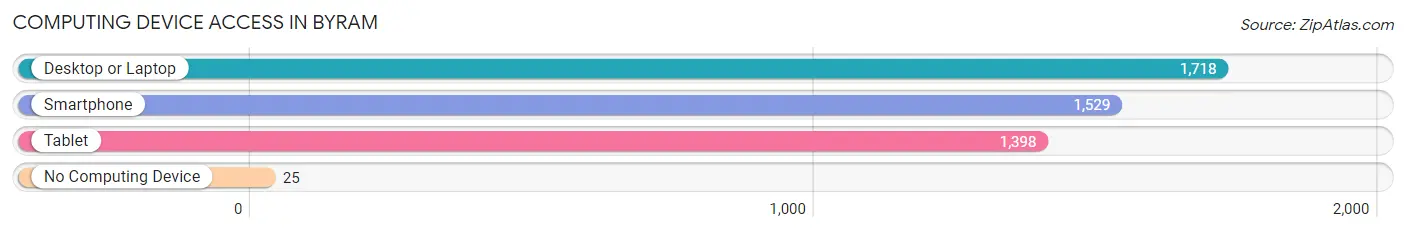
| Device Type | # Households | % Households |
| Desktop or Laptop | 1,718 | 95.0% |
| Smartphone | 1,529 | 84.6% |
| Tablet | 1,398 | 77.3% |
| No Computing Device | 25 | 1.4% |
| Total | 1,808 | 100.0% |
Internet Access in Byram
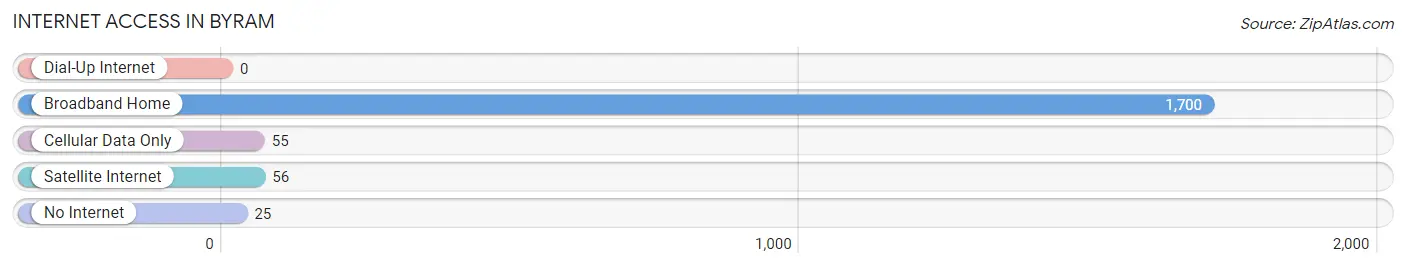
| Internet Type | # Households | % Households |
| Dial-Up Internet | 0 | 0.0% |
| Broadband Home | 1,700 | 94.0% |
| Cellular Data Only | 55 | 3.0% |
| Satellite Internet | 56 | 3.1% |
| No Internet | 25 | 1.4% |
| Total | 1,808 | 100.0% |
Byram Summary
Byram is a town located in Fairfield County, Connecticut. It is situated on the Long Island Sound, and is bordered by Greenwich to the north, Stamford to the east, and Port Chester, New York to the south. The town has a population of approximately 8,000 people, and is part of the greater Bridgeport-Stamford-Norwalk metropolitan area.
Geography
Byram is located in southwestern Connecticut, and is bordered by Greenwich to the north, Stamford to the east, and Port Chester, New York to the south. The town is situated on the Long Island Sound, and is part of the greater Bridgeport-Stamford-Norwalk metropolitan area. The town covers an area of approximately 4.5 square miles, and is home to several parks and recreational areas, including Byram Park, Byram Shore Park, and Byram Beach.
History
Byram was first settled in 1640 by English settlers, and was originally part of the town of Greenwich. In 1820, the town was officially incorporated as the Town of Byram. The town was named after the Byram River, which runs through the town.
In the 19th century, Byram was a popular summer resort destination for wealthy New Yorkers. The town was home to several large estates, and was known for its beautiful beaches and waterfront views.
Economy
Byram’s economy is largely based on the service industry, with many residents employed in retail, hospitality, and healthcare. The town is also home to several small businesses, including restaurants, shops, and professional services.
Demographics
As of the 2010 census, Byram had a population of 8,098 people. The racial makeup of the town was 79.2% White, 8.2% African American, 0.3% Native American, 5.2% Asian, and 4.3% from other races. Hispanic or Latino of any race were 11.2% of the population.
The median household income in Byram was $76,945, and the median family income was $90,917. The per capita income for the town was $37,945. About 4.3% of families and 5.7% of the population were below the poverty line.
Byram is a diverse community, with a variety of cultures and backgrounds represented. The town is home to a large Hispanic population, as well as a growing Asian population. The town is also home to a large Jewish community, with several synagogues located in the area.
Common Questions
What is Per Capita Income in Byram?
Per Capita income in Byram is $58,202.
What is the Median Family Income in Byram?
Median Family Income in Byram is $91,458.
What is the Median Household income in Byram?
Median Household Income in Byram is $92,500.
What is Income or Wage Gap in Byram?
Income or Wage Gap in Byram is 43.0%.
Women in Byram earn 57.0 cents for every dollar earned by a man.
What is Inequality or Gini Index in Byram?
Inequality or Gini Index in Byram is 0.55.
What is the Total Population of Byram?
Total Population of Byram is 5,285.
What is the Total Male Population of Byram?
Total Male Population of Byram is 2,461.
What is the Total Female Population of Byram?
Total Female Population of Byram is 2,824.
What is the Ratio of Males per 100 Females in Byram?
There are 87.15 Males per 100 Females in Byram.
What is the Ratio of Females per 100 Males in Byram?
There are 114.75 Females per 100 Males in Byram.
What is the Median Population Age in Byram?
Median Population Age in Byram is 35.5 Years.
What is the Average Family Size in Byram
Average Family Size in Byram is 3.2 People.
What is the Average Household Size in Byram
Average Household Size in Byram is 2.9 People.
How Large is the Labor Force in Byram?
There are 3,024 People in the Labor Forcein in Byram.
What is the Percentage of People in the Labor Force in Byram?
72.2% of People are in the Labor Force in Byram.
What is the Unemployment Rate in Byram?
Unemployment Rate in Byram is 13.1%.