Rockville, CT Map & Demographics
Rockville Map
Rockville Overview
$26,387
PER CAPITA INCOME
$66,088
AVG FAMILY INCOME
$49,823
AVG HOUSEHOLD INCOME
33.3%
WAGE / INCOME GAP [ % ]
66.7¢/ $1
WAGE / INCOME GAP [ $ ]
0.43
INEQUALITY / GINI INDEX
6,951
TOTAL POPULATION
3,354
MALE POPULATION
3,597
FEMALE POPULATION
93.24
MALES / 100 FEMALES
107.25
FEMALES / 100 MALES
32.5
MEDIAN AGE
3.0
AVG FAMILY SIZE
2.4
AVG HOUSEHOLD SIZE
3,481
LABOR FORCE [ PEOPLE ]
63.0%
PERCENT IN LABOR FORCE
11.3%
UNEMPLOYMENT RATE
Income in Rockville
Income Overview in Rockville
Per Capita Income in Rockville is $26,387, while median incomes of families and households are $66,088 and $49,823 respectively.
| Characteristic | Number | Measure |
| Per Capita Income | 6,951 | $26,387 |
| Median Family Income | 1,587 | $66,088 |
| Mean Family Income | 1,587 | $68,959 |
| Median Household Income | 2,828 | $49,823 |
| Mean Household Income | 2,828 | $62,068 |
| Income Deficit | 1,587 | $0 |
| Wage / Income Gap (%) | 6,951 | 33.31% |
| Wage / Income Gap ($) | 6,951 | 66.69¢ per $1 |
| Gini / Inequality Index | 6,951 | 0.43 |
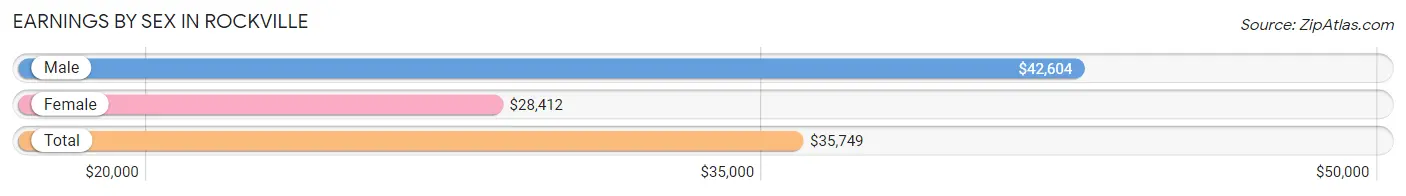
Earnings by Sex in Rockville
Average Earnings in Rockville are $35,749, $42,604 for men and $28,412 for women, a difference of 33.3%.
| Sex | Number | Average Earnings |
| Male | 1,752 (50.9%) | $42,604 |
| Female | 1,689 (49.1%) | $28,412 |
| Total | 3,441 (100.0%) | $35,749 |
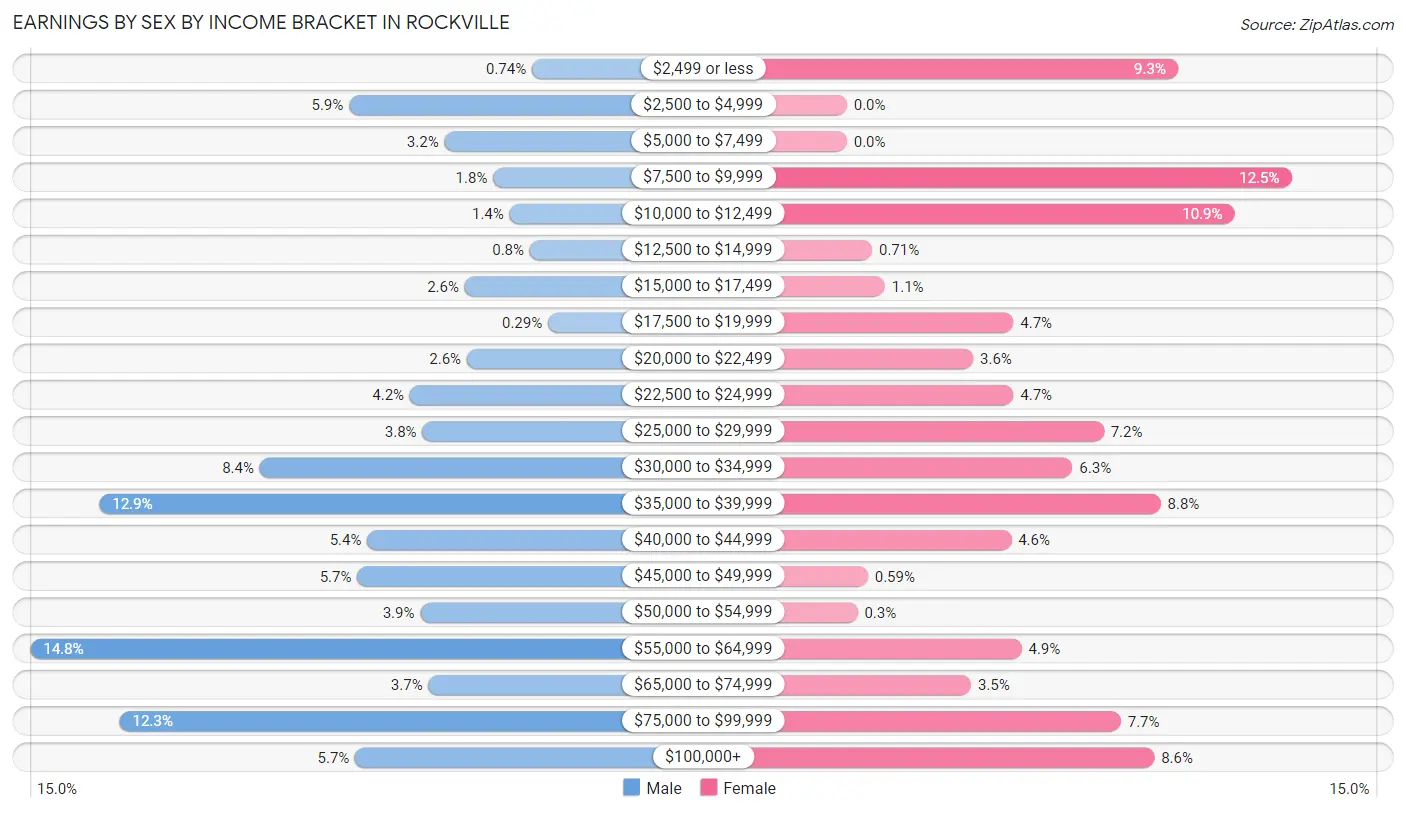
Earnings by Sex by Income Bracket in Rockville
The most common earnings brackets in Rockville are $55,000 to $64,999 for men (260 | 14.8%) and $7,500 to $9,999 for women (211 | 12.5%).
| Income | Male | Female |
| $2,499 or less | 13 (0.7%) | 157 (9.3%) |
| $2,500 to $4,999 | 103 (5.9%) | 0 (0.0%) |
| $5,000 to $7,499 | 56 (3.2%) | 0 (0.0%) |
| $7,500 to $9,999 | 32 (1.8%) | 211 (12.5%) |
| $10,000 to $12,499 | 24 (1.4%) | 184 (10.9%) |
| $12,500 to $14,999 | 14 (0.8%) | 12 (0.7%) |
| $15,000 to $17,499 | 46 (2.6%) | 18 (1.1%) |
| $17,500 to $19,999 | 5 (0.3%) | 79 (4.7%) |
| $20,000 to $22,499 | 45 (2.6%) | 60 (3.5%) |
| $22,500 to $24,999 | 73 (4.2%) | 79 (4.7%) |
| $25,000 to $29,999 | 67 (3.8%) | 122 (7.2%) |
| $30,000 to $34,999 | 147 (8.4%) | 107 (6.3%) |
| $35,000 to $39,999 | 226 (12.9%) | 149 (8.8%) |
| $40,000 to $44,999 | 94 (5.4%) | 78 (4.6%) |
| $45,000 to $49,999 | 99 (5.7%) | 10 (0.6%) |
| $50,000 to $54,999 | 68 (3.9%) | 5 (0.3%) |
| $55,000 to $64,999 | 260 (14.8%) | 83 (4.9%) |
| $65,000 to $74,999 | 64 (3.6%) | 59 (3.5%) |
| $75,000 to $99,999 | 216 (12.3%) | 130 (7.7%) |
| $100,000+ | 100 (5.7%) | 146 (8.6%) |
| Total | 1,752 (100.0%) | 1,689 (100.0%) |
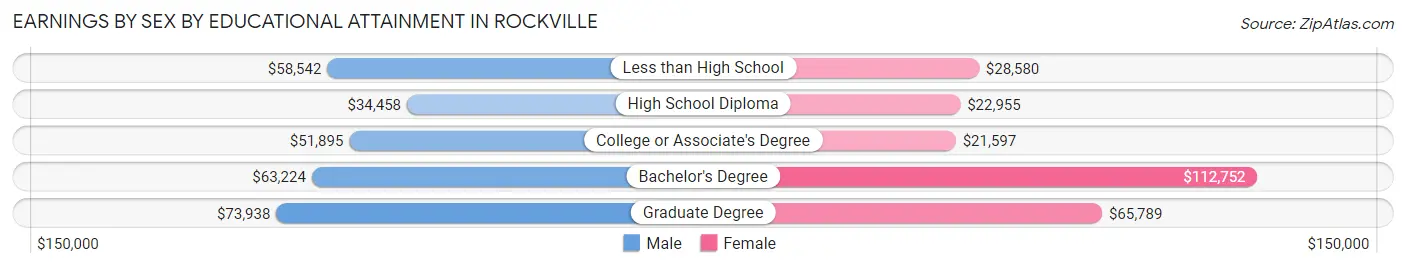
Earnings by Sex by Educational Attainment in Rockville
Average earnings in Rockville are $47,056 for men and $32,006 for women, a difference of 32.0%. Men with an educational attainment of graduate degree enjoy the highest average annual earnings of $73,938, while those with high school diploma education earn the least with $34,458. Women with an educational attainment of bachelor's degree earn the most with the average annual earnings of $112,752, while those with college or associate's degree education have the smallest earnings of $21,597.
| Educational Attainment | Male Income | Female Income |
| Less than High School | $58,542 | $28,580 |
| High School Diploma | $34,458 | $22,955 |
| College or Associate's Degree | $51,895 | $21,597 |
| Bachelor's Degree | $63,224 | $112,752 |
| Graduate Degree | $73,938 | $65,789 |
| Total | $47,056 | $32,006 |
Family Income in Rockville
Family Income Brackets in Rockville
According to the Rockville family income data, there are 430 families falling into the $100,000 to $149,999 income range, which is the most common income bracket and makes up 27.1% of all families.
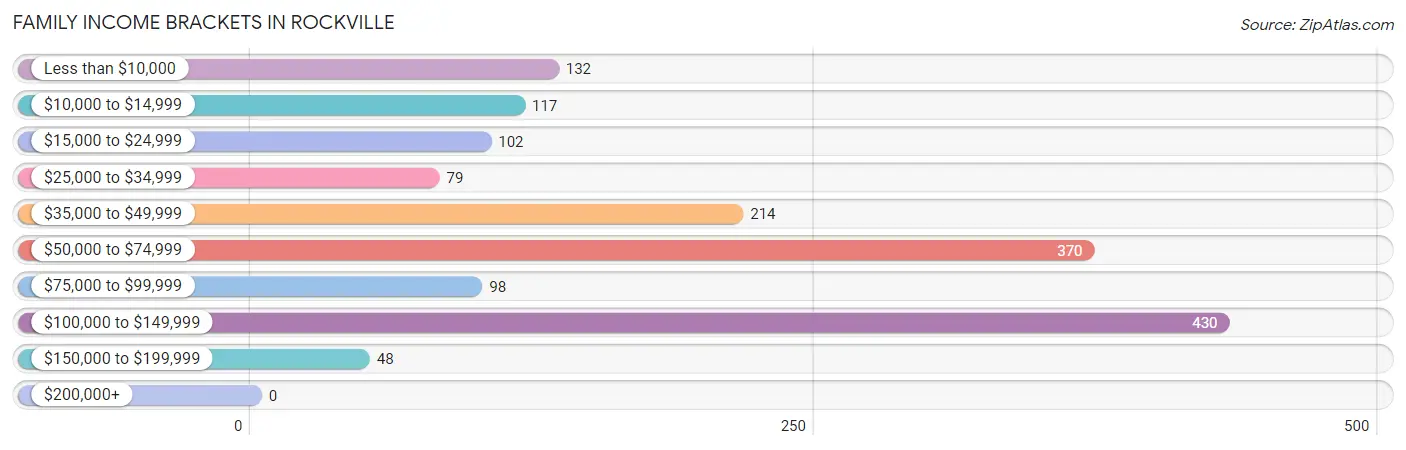
| Income Bracket | # Families | % Families |
| Less than $10,000 | 132 | 8.3% |
| $10,000 to $14,999 | 117 | 7.4% |
| $15,000 to $24,999 | 102 | 6.4% |
| $25,000 to $34,999 | 79 | 5.0% |
| $35,000 to $49,999 | 214 | 13.5% |
| $50,000 to $74,999 | 370 | 23.3% |
| $75,000 to $99,999 | 98 | 6.2% |
| $100,000 to $149,999 | 430 | 27.1% |
| $150,000 to $199,999 | 48 | 3.0% |
| $200,000+ | 0 | 0.0% |
Family Income by Famaliy Size in Rockville
5-person families (142 | 8.9%) account for the highest median family income in Rockville with $79,524 per family, while 2-person families (765 | 48.2%) have the highest median income of $33,507 per family member.
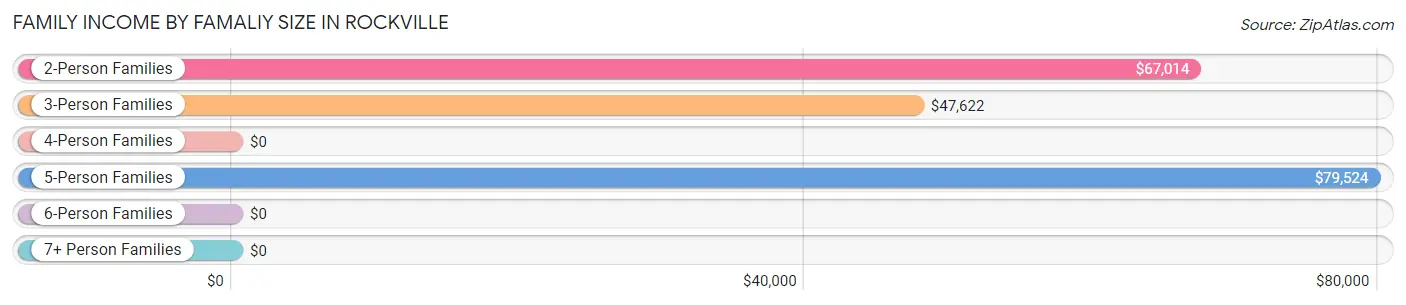
| Income Bracket | # Families | Median Income |
| 2-Person Families | 765 (48.2%) | $67,014 |
| 3-Person Families | 362 (22.8%) | $47,622 |
| 4-Person Families | 269 (17.0%) | $0 |
| 5-Person Families | 142 (8.9%) | $79,524 |
| 6-Person Families | 40 (2.5%) | $0 |
| 7+ Person Families | 9 (0.6%) | $0 |
| Total | 1,587 (100.0%) | $66,088 |
Family Income by Number of Earners in Rockville
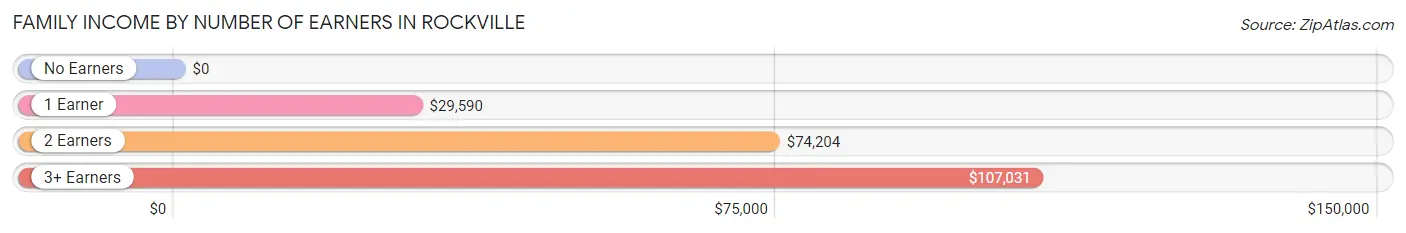
| Number of Earners | # Families | Median Income |
| No Earners | 243 (15.3%) | $0 |
| 1 Earner | 555 (35.0%) | $29,590 |
| 2 Earners | 630 (39.7%) | $74,204 |
| 3+ Earners | 159 (10.0%) | $107,031 |
| Total | 1,587 (100.0%) | $66,088 |
Household Income in Rockville
Household Income Brackets in Rockville
With 580 households falling in the category, the $100,000 to $149,999 income range is the most frequent in Rockville, accounting for 20.5% of all households. In contrast, only 28 households (1.0%) fall into the $200,000+ income bracket, making it the least populous group.
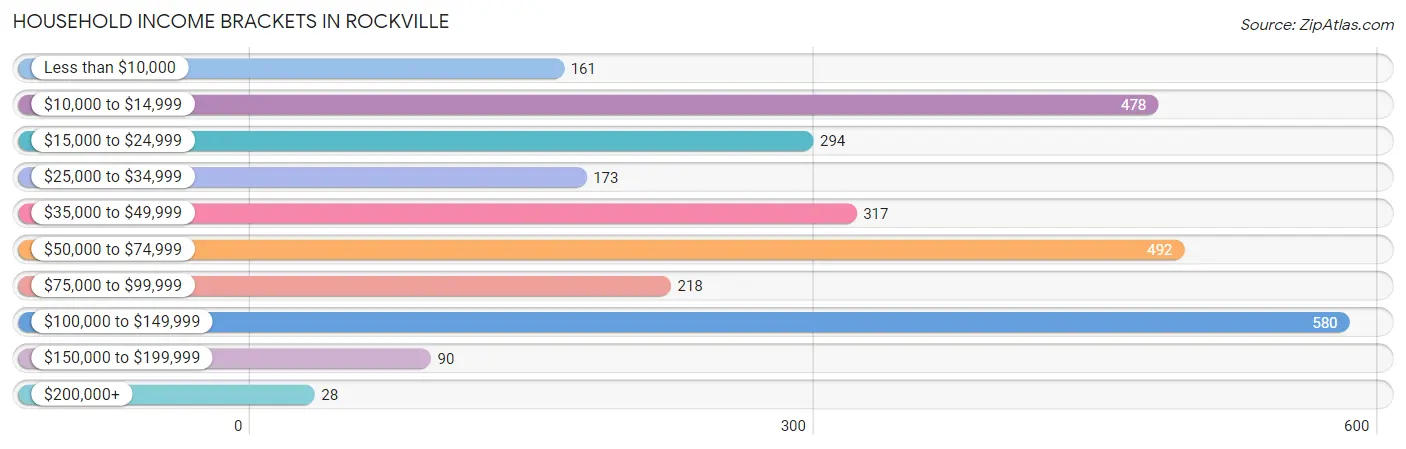
| Income Bracket | # Households | % Households |
| Less than $10,000 | 161 | 5.7% |
| $10,000 to $14,999 | 478 | 16.9% |
| $15,000 to $24,999 | 294 | 10.4% |
| $25,000 to $34,999 | 173 | 6.1% |
| $35,000 to $49,999 | 317 | 11.2% |
| $50,000 to $74,999 | 492 | 17.4% |
| $75,000 to $99,999 | 218 | 7.7% |
| $100,000 to $149,999 | 580 | 20.5% |
| $150,000 to $199,999 | 90 | 3.2% |
| $200,000+ | 28 | 1.0% |
Household Income by Householder Age in Rockville
The median household income in Rockville is $49,823, with the highest median household income of $66,042 found in the 45 to 64 years age bracket for the primary householder. A total of 1,021 households (36.1%) fall into this category. Meanwhile, the 15 to 24 years age bracket for the primary householder has the lowest median household income of $0, with 308 households (10.9%) in this group.
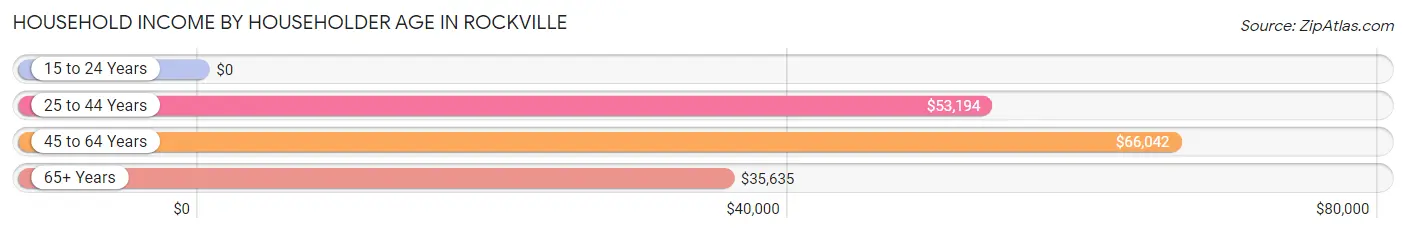
| Income Bracket | # Households | Median Income |
| 15 to 24 Years | 308 (10.9%) | $0 |
| 25 to 44 Years | 945 (33.4%) | $53,194 |
| 45 to 64 Years | 1,021 (36.1%) | $66,042 |
| 65+ Years | 554 (19.6%) | $35,635 |
| Total | 2,828 (100.0%) | $49,823 |
Poverty in Rockville
Income Below Poverty by Sex and Age in Rockville
With 21.6% poverty level for males and 28.6% for females among the residents of Rockville, 6 to 11 year old males and 5 year old females are the most vulnerable to poverty, with 88 males (44.7%) and 33 females (42.3%) in their respective age groups living below the poverty level.
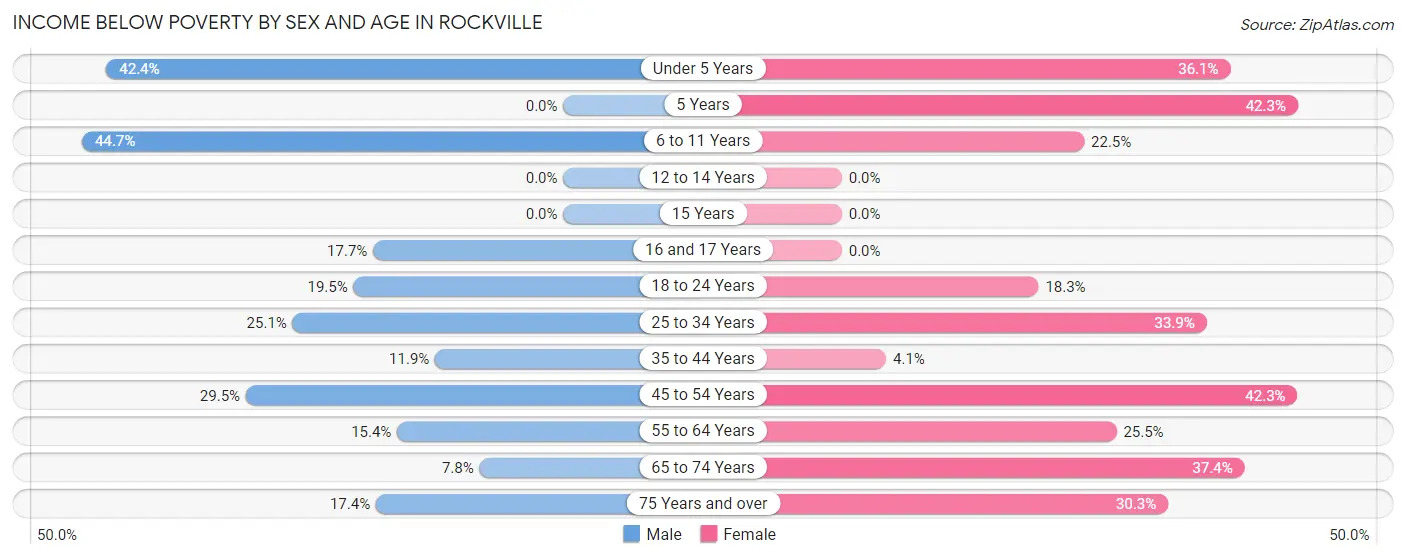
| Age Bracket | Male | Female |
| Under 5 Years | 137 (42.4%) | 93 (36.0%) |
| 5 Years | 0 (0.0%) | 33 (42.3%) |
| 6 to 11 Years | 88 (44.7%) | 47 (22.5%) |
| 12 to 14 Years | 0 (0.0%) | 0 (0.0%) |
| 15 Years | 0 (0.0%) | 0 (0.0%) |
| 16 and 17 Years | 3 (17.6%) | 0 (0.0%) |
| 18 to 24 Years | 89 (19.5%) | 77 (18.2%) |
| 25 to 34 Years | 152 (25.1%) | 280 (33.9%) |
| 35 to 44 Years | 42 (11.9%) | 9 (4.1%) |
| 45 to 54 Years | 104 (29.5%) | 219 (42.3%) |
| 55 to 64 Years | 66 (15.4%) | 104 (25.5%) |
| 65 to 74 Years | 14 (7.8%) | 117 (37.4%) |
| 75 Years and over | 28 (17.4%) | 43 (30.3%) |
| Total | 723 (21.6%) | 1,022 (28.6%) |
Income Above Poverty by Sex and Age in Rockville
According to the poverty statistics in Rockville, males aged 5 years and females aged 12 to 14 years are the age groups that are most secure financially, with 100.0% of males and 100.0% of females in these age groups living above the poverty line.
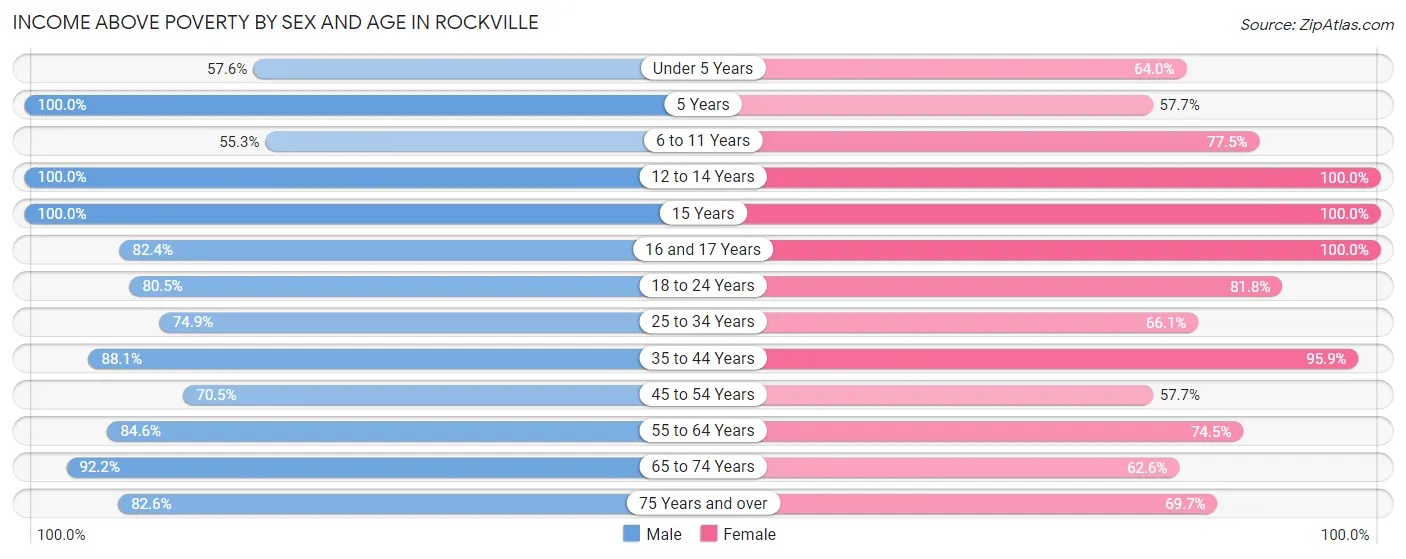
| Age Bracket | Male | Female |
| Under 5 Years | 186 (57.6%) | 165 (63.9%) |
| 5 Years | 20 (100.0%) | 45 (57.7%) |
| 6 to 11 Years | 109 (55.3%) | 162 (77.5%) |
| 12 to 14 Years | 229 (100.0%) | 43 (100.0%) |
| 15 Years | 20 (100.0%) | 36 (100.0%) |
| 16 and 17 Years | 14 (82.4%) | 105 (100.0%) |
| 18 to 24 Years | 368 (80.5%) | 345 (81.8%) |
| 25 to 34 Years | 453 (74.9%) | 547 (66.1%) |
| 35 to 44 Years | 311 (88.1%) | 210 (95.9%) |
| 45 to 54 Years | 249 (70.5%) | 299 (57.7%) |
| 55 to 64 Years | 362 (84.6%) | 304 (74.5%) |
| 65 to 74 Years | 166 (92.2%) | 196 (62.6%) |
| 75 Years and over | 133 (82.6%) | 99 (69.7%) |
| Total | 2,620 (78.4%) | 2,556 (71.4%) |
Income Below Poverty Among Married-Couple Families in Rockville
The poverty statistics for married-couple families in Rockville show that 4.8% or 34 of the total 712 families live below the poverty line. Families with 1 or 2 children have the highest poverty rate of 9.6%, comprising of 34 families. On the other hand, families with no children have the lowest poverty rate of 0.0%, which includes 0 families.
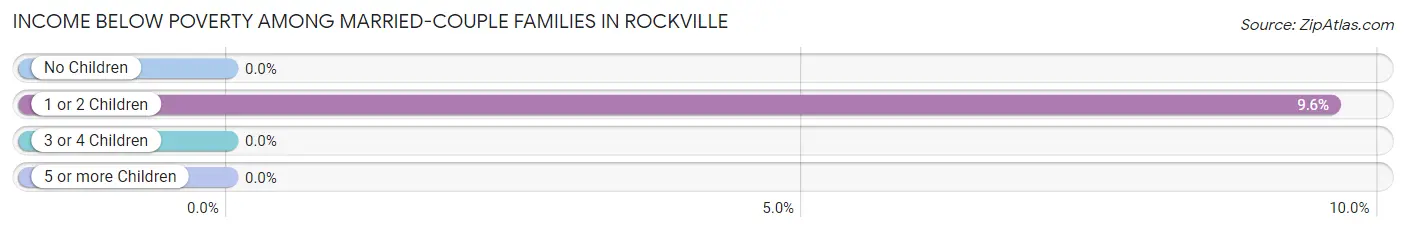
| Children | Above Poverty | Below Poverty |
| No Children | 326 (100.0%) | 0 (0.0%) |
| 1 or 2 Children | 320 (90.4%) | 34 (9.6%) |
| 3 or 4 Children | 23 (100.0%) | 0 (0.0%) |
| 5 or more Children | 9 (100.0%) | 0 (0.0%) |
| Total | 678 (95.2%) | 34 (4.8%) |
Income Below Poverty Among Single-Parent Households in Rockville
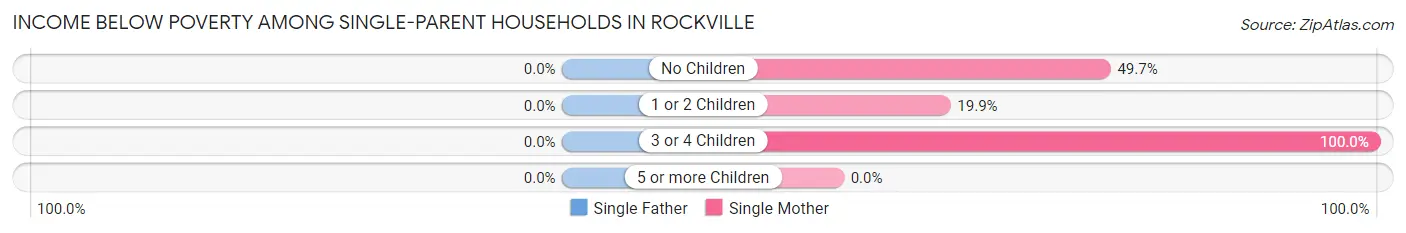
| Children | Single Father | Single Mother |
| No Children | 0 (0.0%) | 83 (49.7%) |
| 1 or 2 Children | 0 (0.0%) | 102 (19.9%) |
| 3 or 4 Children | 0 (0.0%) | 45 (100.0%) |
| 5 or more Children | 0 (0.0%) | 0 (0.0%) |
| Total | 0 (0.0%) | 230 (31.7%) |
Income Below Poverty Among Married-Couple vs Single-Parent Households in Rockville
The poverty data for Rockville shows that 34 of the married-couple family households (4.8%) and 230 of the single-parent households (26.3%) are living below the poverty level. Within the married-couple family households, those with 1 or 2 children have the highest poverty rate, with 34 households (9.6%) falling below the poverty line. Among the single-parent households, those with 3 or 4 children have the highest poverty rate, with 45 household (100.0%) living below poverty.
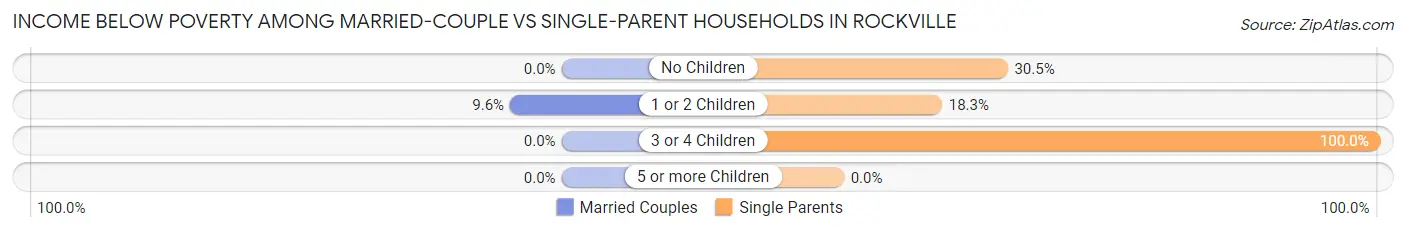
| Children | Married-Couple Families | Single-Parent Households |
| No Children | 0 (0.0%) | 83 (30.5%) |
| 1 or 2 Children | 34 (9.6%) | 102 (18.3%) |
| 3 or 4 Children | 0 (0.0%) | 45 (100.0%) |
| 5 or more Children | 0 (0.0%) | 0 (0.0%) |
| Total | 34 (4.8%) | 230 (26.3%) |
Race in Rockville
The most populous races in Rockville are White / Caucasian (5,203 | 74.9%), Hispanic or Latino (1,379 | 19.8%), and Black / African American (679 | 9.8%).
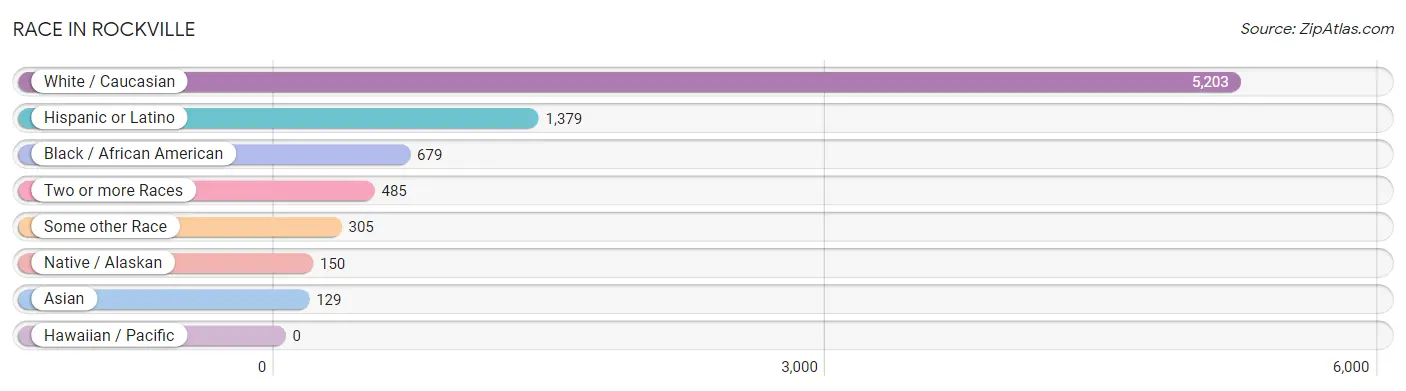
| Race | # Population | % Population |
| Asian | 129 | 1.9% |
| Black / African American | 679 | 9.8% |
| Hawaiian / Pacific | 0 | 0.0% |
| Hispanic or Latino | 1,379 | 19.8% |
| Native / Alaskan | 150 | 2.2% |
| White / Caucasian | 5,203 | 74.9% |
| Two or more Races | 485 | 7.0% |
| Some other Race | 305 | 4.4% |
| Total | 6,951 | 100.0% |
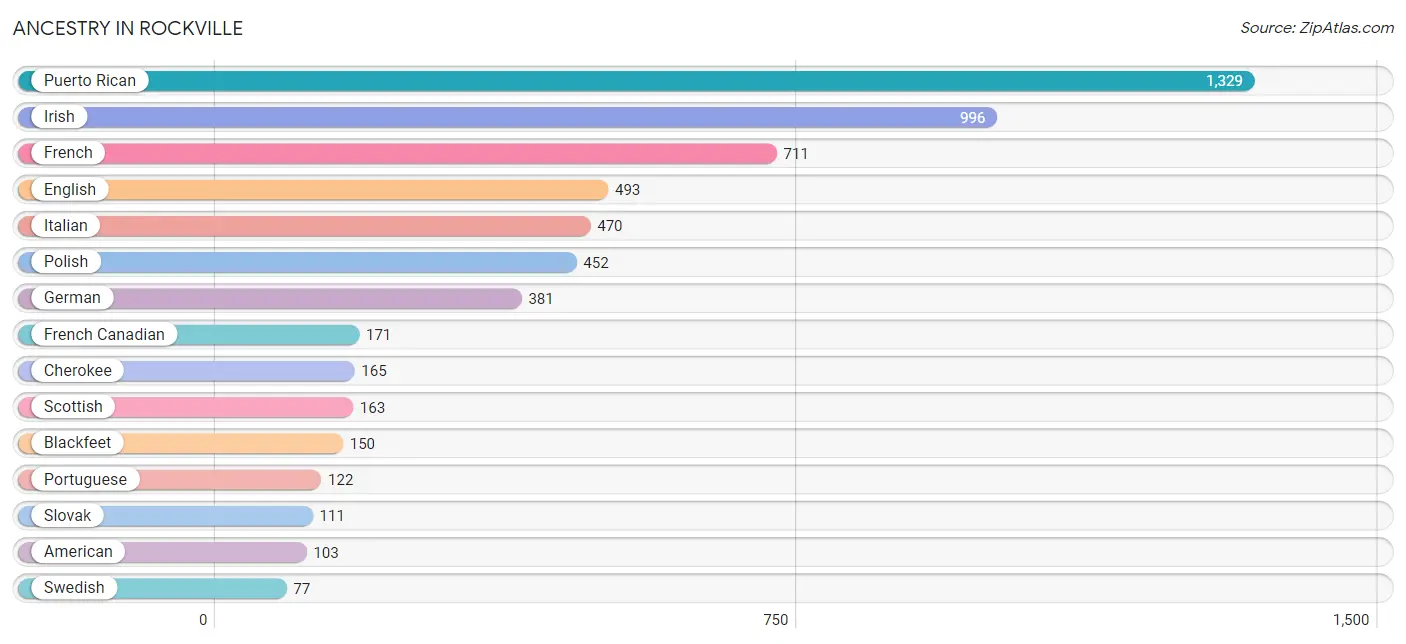
Ancestry in Rockville
The most populous ancestries reported in Rockville are Puerto Rican (1,329 | 19.1%), Irish (996 | 14.3%), French (711 | 10.2%), English (493 | 7.1%), and Italian (470 | 6.8%), together accounting for 57.5% of all Rockville residents.
| Ancestry | # Population | % Population |
| African | 57 | 0.8% |
| Albanian | 2 | 0.0% |
| American | 103 | 1.5% |
| Arab | 30 | 0.4% |
| Armenian | 61 | 0.9% |
| Austrian | 21 | 0.3% |
| Blackfeet | 150 | 2.2% |
| British | 7 | 0.1% |
| British West Indian | 62 | 0.9% |
| Canadian | 53 | 0.8% |
| Cherokee | 165 | 2.4% |
| Dutch | 55 | 0.8% |
| Eastern European | 28 | 0.4% |
| English | 493 | 7.1% |
| European | 12 | 0.2% |
| Finnish | 30 | 0.4% |
| French | 711 | 10.2% |
| French Canadian | 171 | 2.5% |
| German | 381 | 5.5% |
| Greek | 2 | 0.0% |
| Hungarian | 70 | 1.0% |
| Irish | 996 | 14.3% |
| Italian | 470 | 6.8% |
| Jamaican | 60 | 0.9% |
| Korean | 20 | 0.3% |
| Lebanese | 30 | 0.4% |
| Mexican | 18 | 0.3% |
| Peruvian | 14 | 0.2% |
| Polish | 452 | 6.5% |
| Portuguese | 122 | 1.8% |
| Puerto Rican | 1,329 | 19.1% |
| Russian | 31 | 0.4% |
| Scotch-Irish | 27 | 0.4% |
| Scottish | 163 | 2.3% |
| Slovak | 111 | 1.6% |
| South American | 14 | 0.2% |
| Spaniard | 18 | 0.3% |
| Subsaharan African | 57 | 0.8% |
| Swedish | 77 | 1.1% |
| Thai | 17 | 0.2% |
| Ukrainian | 9 | 0.1% | View All 41 Rows |
Immigrants in Rockville
The most numerous immigrant groups reported in Rockville came from Asia (60 | 0.9%), Africa (57 | 0.8%), Ghana (57 | 0.8%), Western Africa (57 | 0.8%), and Pakistan (51 | 0.7%), together accounting for 4.1% of all Rockville residents.
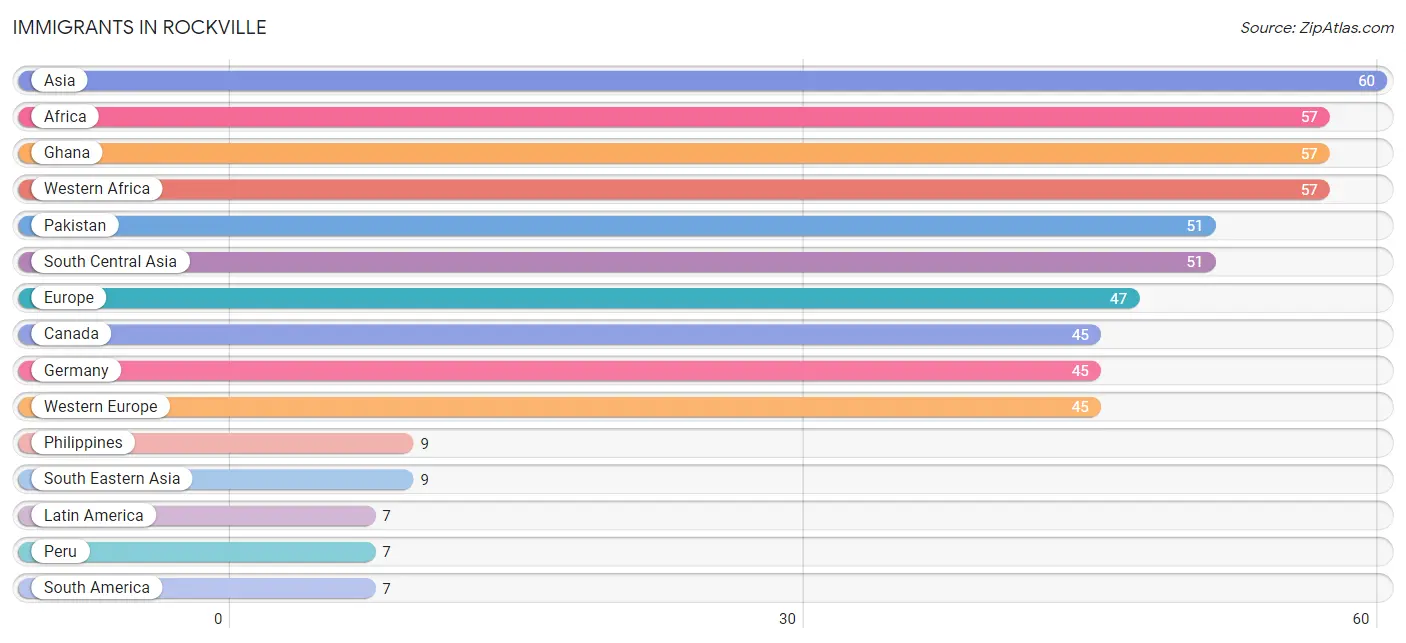
| Immigration Origin | # Population | % Population |
| Africa | 57 | 0.8% |
| Asia | 60 | 0.9% |
| Canada | 45 | 0.6% |
| Eastern Europe | 2 | 0.0% |
| Europe | 47 | 0.7% |
| Germany | 45 | 0.6% |
| Ghana | 57 | 0.8% |
| Latin America | 7 | 0.1% |
| Pakistan | 51 | 0.7% |
| Peru | 7 | 0.1% |
| Philippines | 9 | 0.1% |
| Poland | 2 | 0.0% |
| South America | 7 | 0.1% |
| South Central Asia | 51 | 0.7% |
| South Eastern Asia | 9 | 0.1% |
| Western Africa | 57 | 0.8% |
| Western Europe | 45 | 0.6% | View All 17 Rows |
Sex and Age in Rockville
Sex and Age in Rockville
The most populous age groups in Rockville are 30 to 34 Years (443 | 13.2%) for men and 30 to 34 Years (527 | 14.6%) for women.
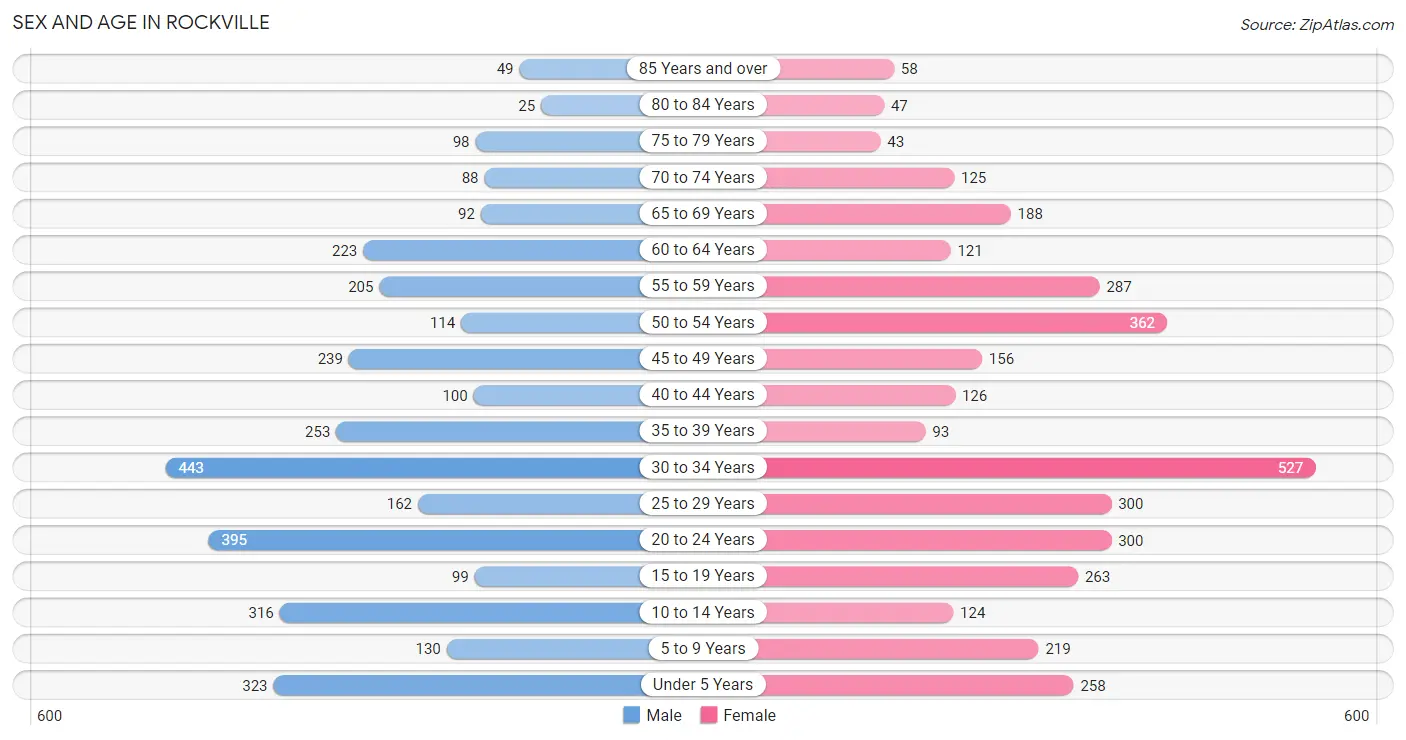
| Age Bracket | Male | Female |
| Under 5 Years | 323 (9.6%) | 258 (7.2%) |
| 5 to 9 Years | 130 (3.9%) | 219 (6.1%) |
| 10 to 14 Years | 316 (9.4%) | 124 (3.5%) |
| 15 to 19 Years | 99 (2.9%) | 263 (7.3%) |
| 20 to 24 Years | 395 (11.8%) | 300 (8.3%) |
| 25 to 29 Years | 162 (4.8%) | 300 (8.3%) |
| 30 to 34 Years | 443 (13.2%) | 527 (14.6%) |
| 35 to 39 Years | 253 (7.5%) | 93 (2.6%) |
| 40 to 44 Years | 100 (3.0%) | 126 (3.5%) |
| 45 to 49 Years | 239 (7.1%) | 156 (4.3%) |
| 50 to 54 Years | 114 (3.4%) | 362 (10.1%) |
| 55 to 59 Years | 205 (6.1%) | 287 (8.0%) |
| 60 to 64 Years | 223 (6.7%) | 121 (3.4%) |
| 65 to 69 Years | 92 (2.7%) | 188 (5.2%) |
| 70 to 74 Years | 88 (2.6%) | 125 (3.5%) |
| 75 to 79 Years | 98 (2.9%) | 43 (1.2%) |
| 80 to 84 Years | 25 (0.7%) | 47 (1.3%) |
| 85 Years and over | 49 (1.5%) | 58 (1.6%) |
| Total | 3,354 (100.0%) | 3,597 (100.0%) |
Families and Households in Rockville
Median Family Size in Rockville
The median family size in Rockville is 2.96 persons per family, with married-couple families (712 | 44.9%) accounting for the largest median family size of 3.07 persons per family. On the other hand, single male/father families (150 | 9.5%) represent the smallest median family size with 2.04 persons per family.
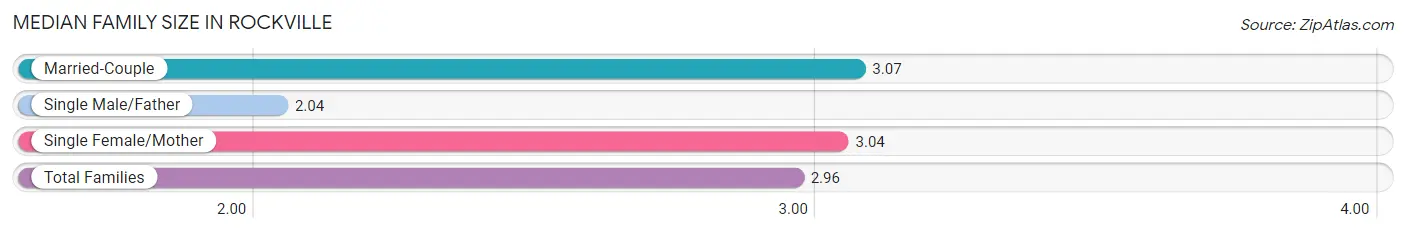
| Family Type | # Families | Family Size |
| Married-Couple | 712 (44.9%) | 3.07 |
| Single Male/Father | 150 (9.5%) | 2.04 |
| Single Female/Mother | 725 (45.7%) | 3.04 |
| Total Families | 1,587 (100.0%) | 2.96 |
Median Household Size in Rockville
The median household size in Rockville is 2.43 persons per household, with single female/mother households (725 | 25.6%) accounting for the largest median household size of 3.58 persons per household. non-family households (1,241 | 43.9%) represent the smallest median household size with 1.42 persons per household.
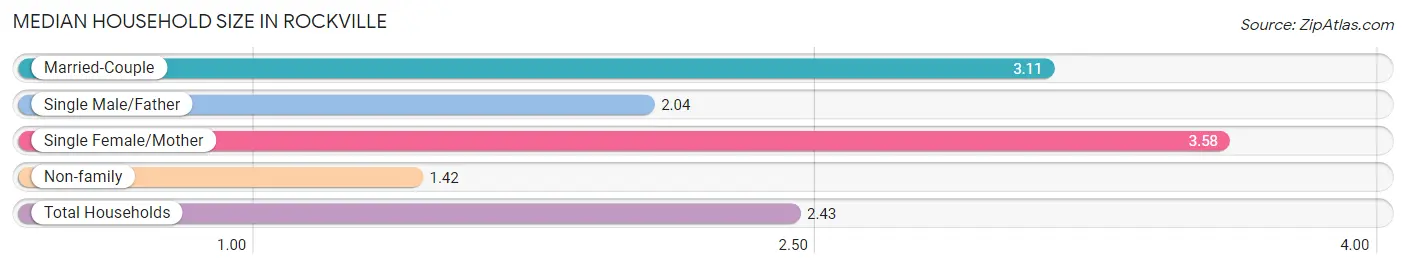
| Household Type | # Households | Household Size |
| Married-Couple | 712 (25.2%) | 3.11 |
| Single Male/Father | 150 (5.3%) | 2.04 |
| Single Female/Mother | 725 (25.6%) | 3.58 |
| Non-family | 1,241 (43.9%) | 1.42 |
| Total Households | 2,828 (100.0%) | 2.43 |
Household Size by Marriage Status in Rockville
Out of a total of 2,828 households in Rockville, 1,587 (56.1%) are family households, while 1,241 (43.9%) are nonfamily households. The most numerous type of family households are 2-person households, comprising 711, and the most common type of nonfamily households are 1-person households, comprising 956.
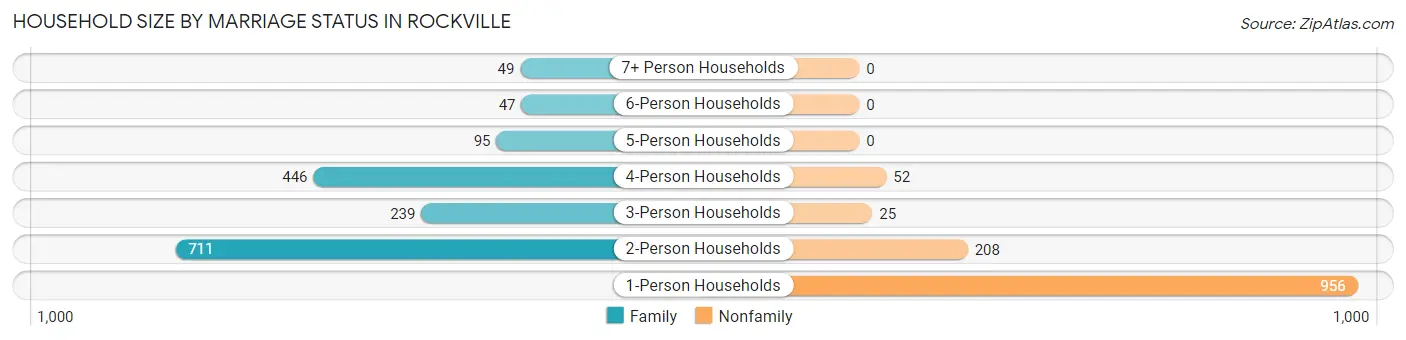
| Household Size | Family Households | Nonfamily Households |
| 1-Person Households | - | 956 (33.8%) |
| 2-Person Households | 711 (25.1%) | 208 (7.4%) |
| 3-Person Households | 239 (8.5%) | 25 (0.9%) |
| 4-Person Households | 446 (15.8%) | 52 (1.8%) |
| 5-Person Households | 95 (3.4%) | 0 (0.0%) |
| 6-Person Households | 47 (1.7%) | 0 (0.0%) |
| 7+ Person Households | 49 (1.7%) | 0 (0.0%) |
| Total | 1,587 (56.1%) | 1,241 (43.9%) |
Female Fertility in Rockville
Fertility by Age in Rockville
Average fertility rate in Rockville is 115.0 births per 1,000 women. Women in the age bracket of 20 to 34 years have the highest fertility rate with 181.0 births per 1,000 women. Women in the age bracket of 20 to 34 years acount for 100.0% of all women with births.
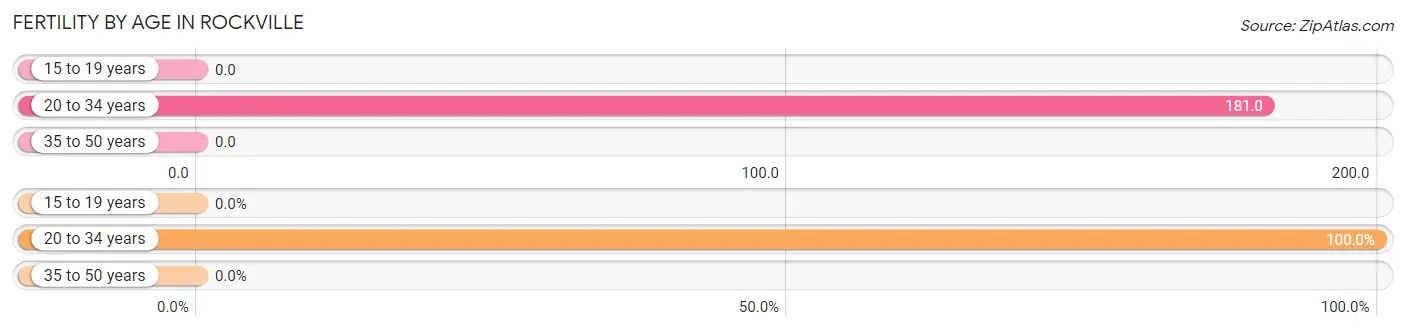
| Age Bracket | Women with Births | Births / 1,000 Women |
| 15 to 19 years | 0 (0.0%) | 0.0 |
| 20 to 34 years | 204 (100.0%) | 181.0 |
| 35 to 50 years | 0 (0.0%) | 0.0 |
| Total | 204 (100.0%) | 115.0 |
Fertility by Age by Marriage Status in Rockville
44.6% of women with births (204) in Rockville are married. The highest percentage of unmarried women with births falls into 20 to 34 years age bracket with 55.4% of them unmarried at the time of birth, while the lowest percentage of unmarried women with births belong to 20 to 34 years age bracket with 55.4% of them unmarried.
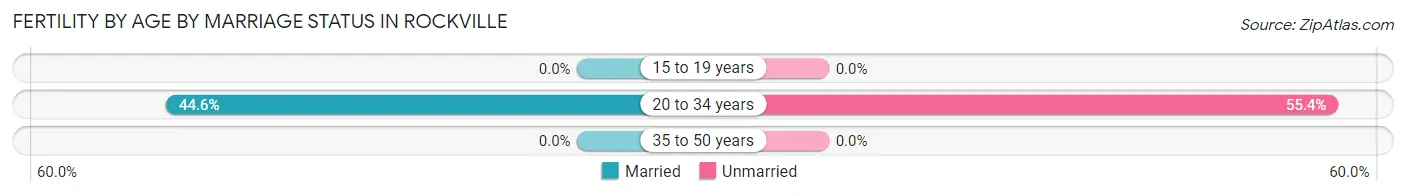
| Age Bracket | Married | Unmarried |
| 15 to 19 years | 0 (0.0%) | 0 (0.0%) |
| 20 to 34 years | 91 (44.6%) | 113 (55.4%) |
| 35 to 50 years | 0 (0.0%) | 0 (0.0%) |
| Total | 91 (44.6%) | 113 (55.4%) |
Fertility by Education in Rockville
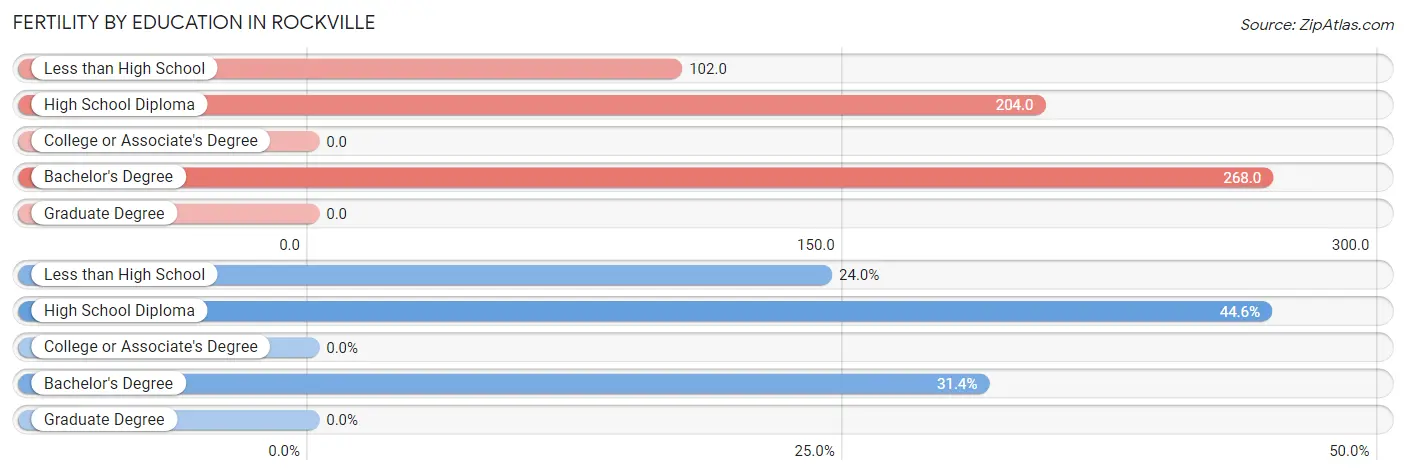
| Educational Attainment | Women with Births | Births / 1,000 Women |
| Less than High School | 49 (24.0%) | 102.0 |
| High School Diploma | 91 (44.6%) | 204.0 |
| College or Associate's Degree | 0 (0.0%) | 0.0 |
| Bachelor's Degree | 64 (31.4%) | 268.0 |
| Graduate Degree | 0 (0.0%) | 0.0 |
| Total | 204 (100.0%) | 115.0 |
Fertility by Education by Marriage Status in Rockville
55.4% of women with births in Rockville are unmarried. Women with the educational attainment of high school diploma are most likely to be married with 100.0% of them married at childbirth, while women with the educational attainment of less than high school are least likely to be married with 100.0% of them unmarried at childbirth.
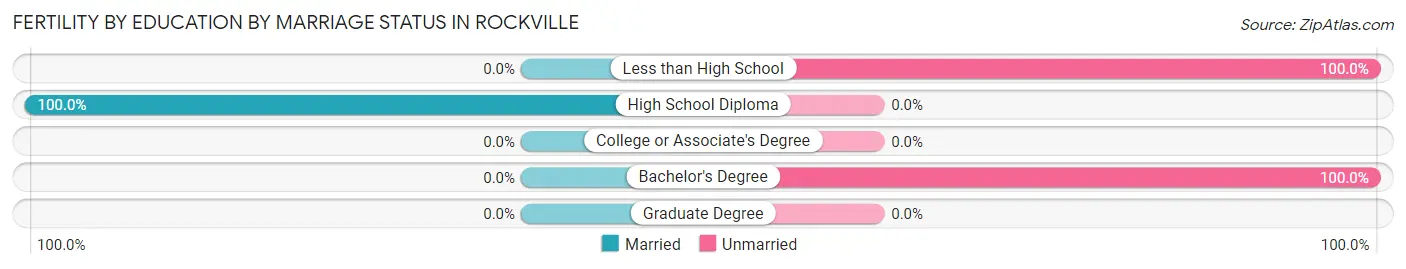
| Educational Attainment | Married | Unmarried |
| Less than High School | 0 (0.0%) | 49 (100.0%) |
| High School Diploma | 91 (100.0%) | 0 (0.0%) |
| College or Associate's Degree | 0 (0.0%) | 0 (0.0%) |
| Bachelor's Degree | 0 (0.0%) | 64 (100.0%) |
| Graduate Degree | 0 (0.0%) | 0 (0.0%) |
| Total | 91 (44.6%) | 113 (55.4%) |
Employment Characteristics in Rockville
Employment by Class of Employer in Rockville
Among the 2,959 employed individuals in Rockville, private company employees (2,257 | 76.3%), not-for-profit organizations (252 | 8.5%), and local government employees (197 | 6.7%) make up the most common classes of employment.
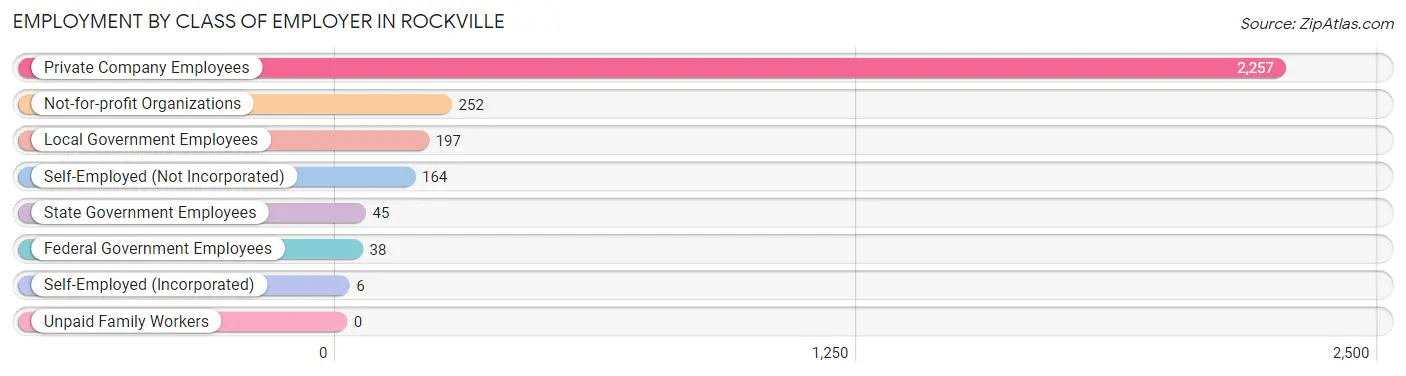
| Employer Class | # Employees | % Employees |
| Private Company Employees | 2,257 | 76.3% |
| Self-Employed (Incorporated) | 6 | 0.2% |
| Self-Employed (Not Incorporated) | 164 | 5.5% |
| Not-for-profit Organizations | 252 | 8.5% |
| Local Government Employees | 197 | 6.7% |
| State Government Employees | 45 | 1.5% |
| Federal Government Employees | 38 | 1.3% |
| Unpaid Family Workers | 0 | 0.0% |
| Total | 2,959 | 100.0% |
Employment Status by Age in Rockville
According to the labor force statistics for Rockville, out of the total population over 16 years of age (5,525), 63.0% or 3,481 individuals are in the labor force, with 11.3% or 393 of them unemployed. The age group with the highest labor force participation rate is 25 to 29 years, with 92.6% or 428 individuals in the labor force. Within the labor force, the 20 to 24 years age range has the highest percentage of unemployed individuals, with 31.9% or 164 of them being unemployed.
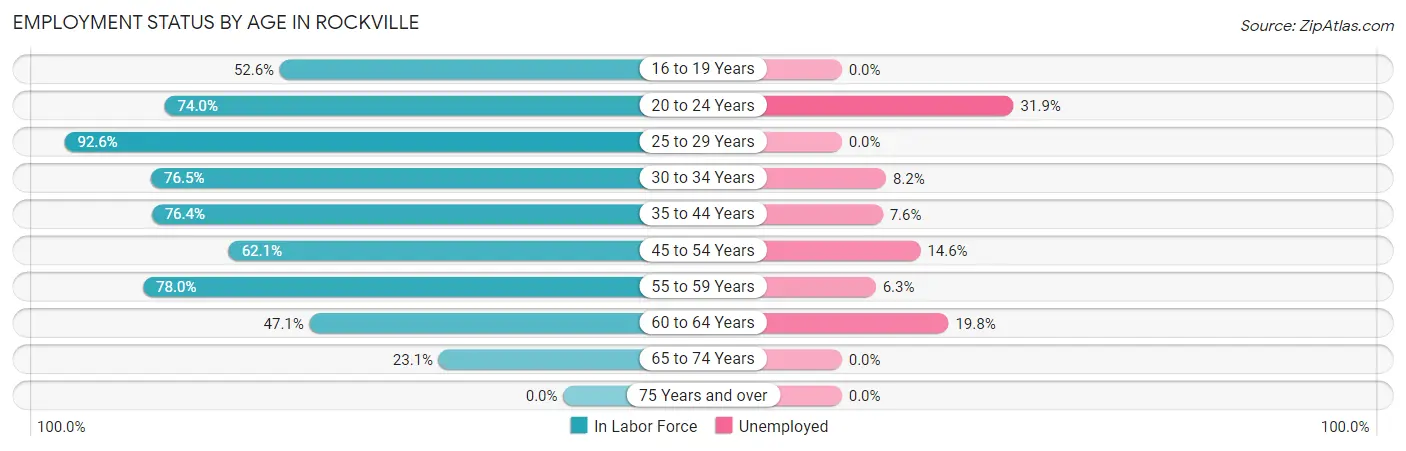
| Age Bracket | In Labor Force | Unemployed |
| 16 to 19 Years | 161 (52.6%) | 0 (0.0%) |
| 20 to 24 Years | 514 (74.0%) | 164 (31.9%) |
| 25 to 29 Years | 428 (92.6%) | 0 (0.0%) |
| 30 to 34 Years | 742 (76.5%) | 61 (8.2%) |
| 35 to 44 Years | 437 (76.4%) | 33 (7.6%) |
| 45 to 54 Years | 541 (62.1%) | 79 (14.6%) |
| 55 to 59 Years | 384 (78.0%) | 24 (6.3%) |
| 60 to 64 Years | 162 (47.1%) | 32 (19.8%) |
| 65 to 74 Years | 114 (23.1%) | 0 (0.0%) |
| 75 Years and over | 0 (0.0%) | 0 (0.0%) |
| Total | 3,481 (63.0%) | 393 (11.3%) |
Employment Status by Educational Attainment in Rockville
According to labor force statistics for Rockville, 72.6% of individuals (2,694) out of the total population between 25 and 64 years of age (3,711) are in the labor force, with 8.5% or 229 of them being unemployed. The group with the highest labor force participation rate are those with the educational attainment of bachelor's degree or higher, with 89.5% or 536 individuals in the labor force. Within the labor force, individuals with less than high school education have the highest percentage of unemployment, with 23.8% or 105 of them being unemployed.
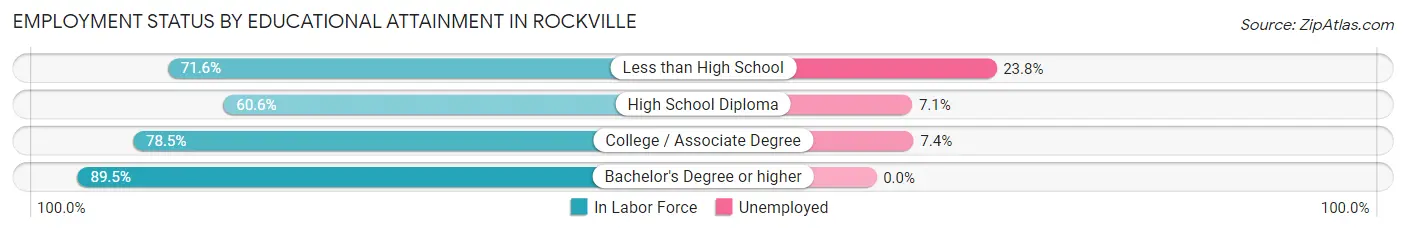
| Educational Attainment | In Labor Force | Unemployed |
| Less than High School | 442 (71.6%) | 147 (23.8%) |
| High School Diploma | 820 (60.6%) | 96 (7.1%) |
| College / Associate Degree | 896 (78.5%) | 85 (7.4%) |
| Bachelor's Degree or higher | 536 (89.5%) | 0 (0.0%) |
| Total | 2,694 (72.6%) | 315 (8.5%) |
Employment Occupations by Sex in Rockville
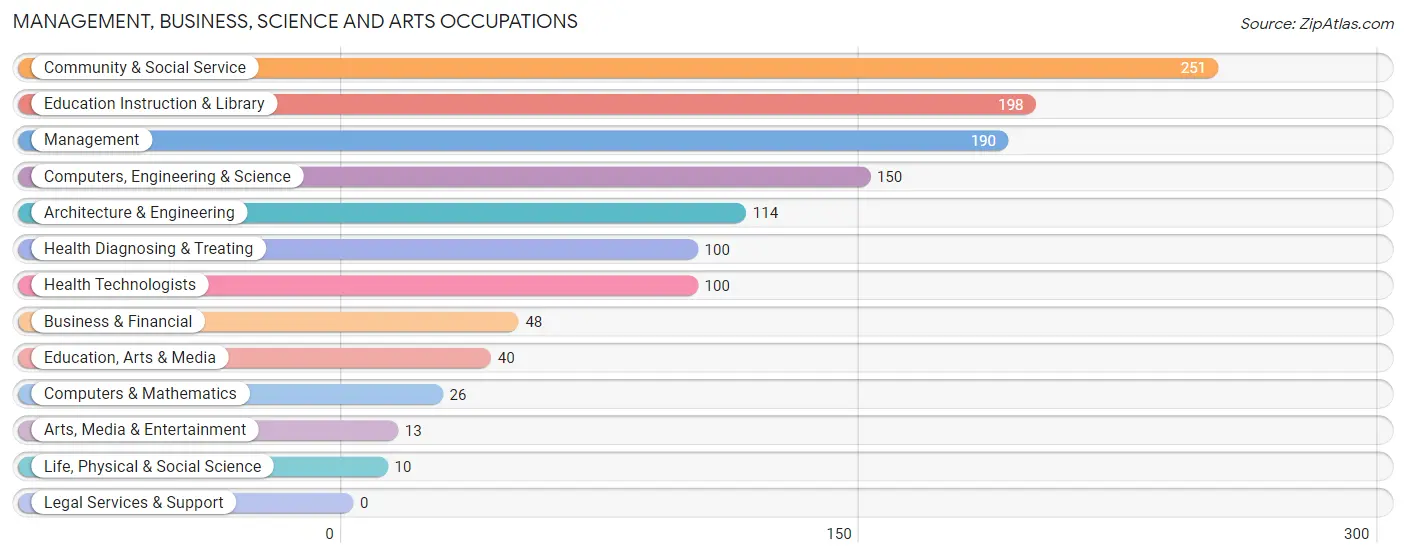
Management, Business, Science and Arts Occupations
The most common Management, Business, Science and Arts occupations in Rockville are Community & Social Service (251 | 8.1%), Education Instruction & Library (198 | 6.4%), Management (190 | 6.1%), Computers, Engineering & Science (150 | 4.9%), and Architecture & Engineering (114 | 3.7%).
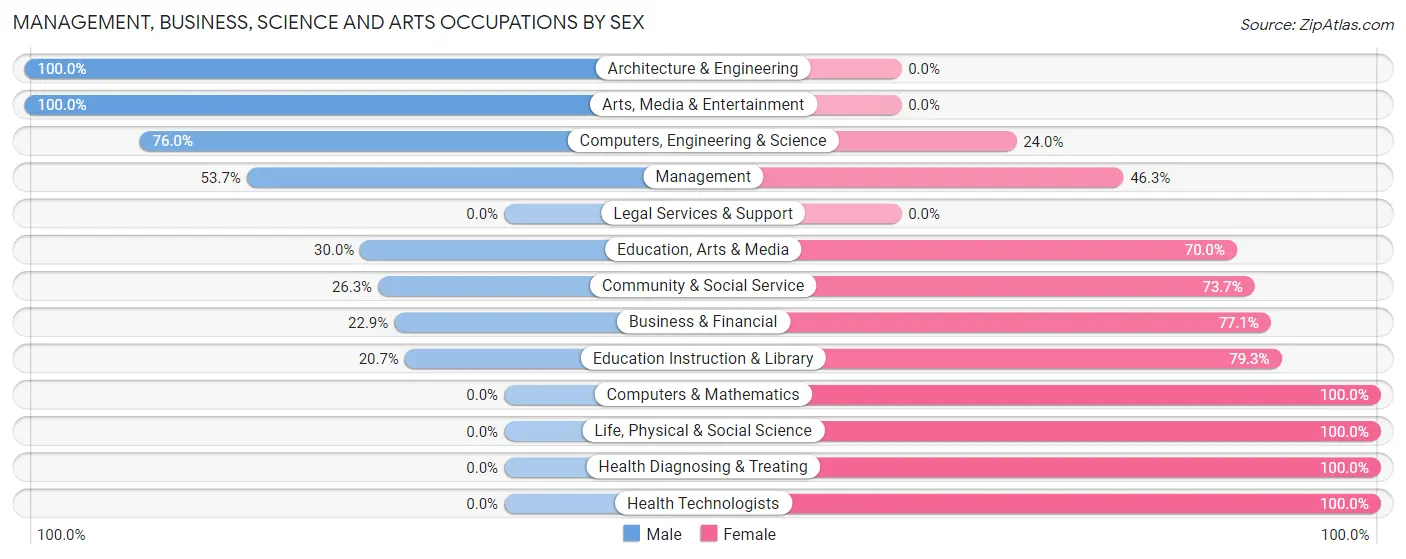
Management, Business, Science and Arts Occupations by Sex
Within the Management, Business, Science and Arts occupations in Rockville, the most male-oriented occupations are Architecture & Engineering (100.0%), Arts, Media & Entertainment (100.0%), and Computers, Engineering & Science (76.0%), while the most female-oriented occupations are Computers & Mathematics (100.0%), Life, Physical & Social Science (100.0%), and Health Diagnosing & Treating (100.0%).
| Occupation | Male | Female |
| Management | 102 (53.7%) | 88 (46.3%) |
| Business & Financial | 11 (22.9%) | 37 (77.1%) |
| Computers, Engineering & Science | 114 (76.0%) | 36 (24.0%) |
| Computers & Mathematics | 0 (0.0%) | 26 (100.0%) |
| Architecture & Engineering | 114 (100.0%) | 0 (0.0%) |
| Life, Physical & Social Science | 0 (0.0%) | 10 (100.0%) |
| Community & Social Service | 66 (26.3%) | 185 (73.7%) |
| Education, Arts & Media | 12 (30.0%) | 28 (70.0%) |
| Legal Services & Support | 0 (0.0%) | 0 (0.0%) |
| Education Instruction & Library | 41 (20.7%) | 157 (79.3%) |
| Arts, Media & Entertainment | 13 (100.0%) | 0 (0.0%) |
| Health Diagnosing & Treating | 0 (0.0%) | 100 (100.0%) |
| Health Technologists | 0 (0.0%) | 100 (100.0%) |
| Total (Category) | 293 (39.7%) | 446 (60.4%) |
| Total (Overall) | 1,628 (52.7%) | 1,462 (47.3%) |
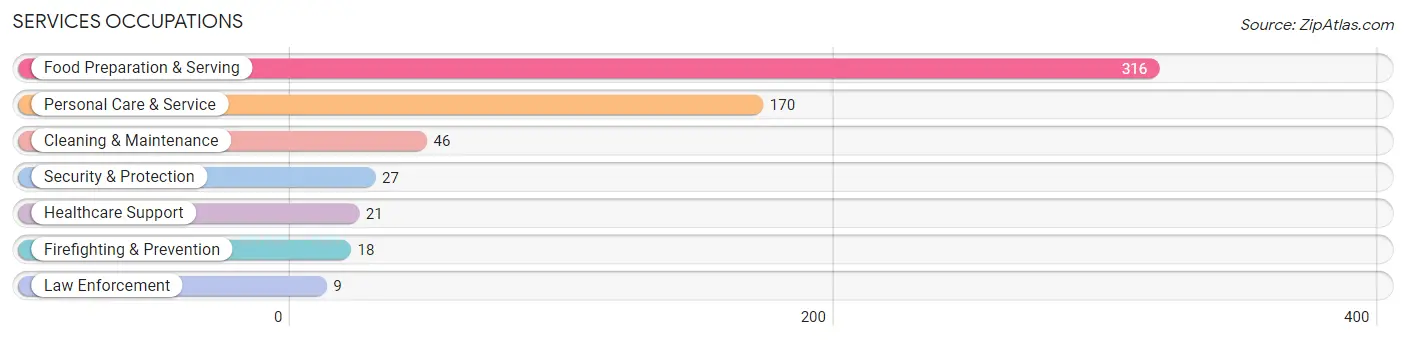
Services Occupations
The most common Services occupations in Rockville are Food Preparation & Serving (316 | 10.2%), Personal Care & Service (170 | 5.5%), Cleaning & Maintenance (46 | 1.5%), Security & Protection (27 | 0.9%), and Healthcare Support (21 | 0.7%).
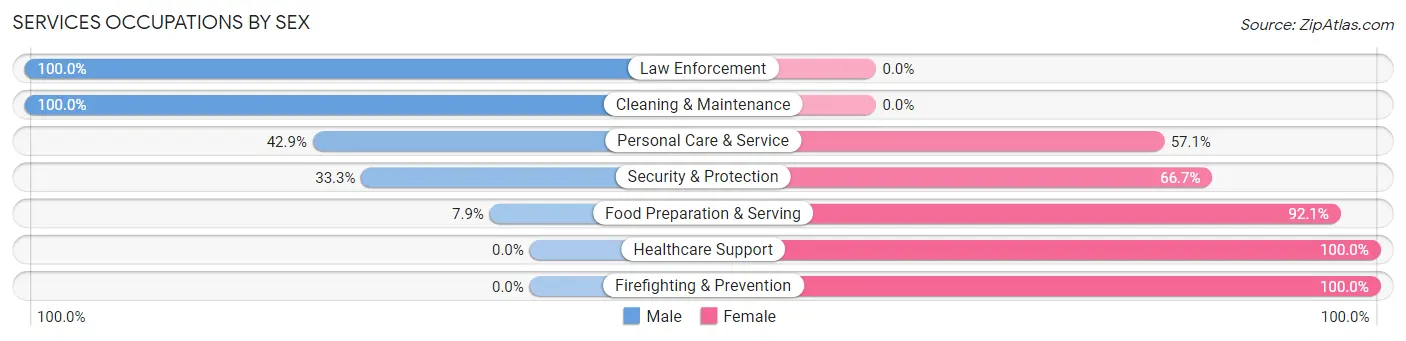
Services Occupations by Sex
Within the Services occupations in Rockville, the most male-oriented occupations are Law Enforcement (100.0%), Cleaning & Maintenance (100.0%), and Personal Care & Service (42.9%), while the most female-oriented occupations are Healthcare Support (100.0%), Firefighting & Prevention (100.0%), and Food Preparation & Serving (92.1%).
| Occupation | Male | Female |
| Healthcare Support | 0 (0.0%) | 21 (100.0%) |
| Security & Protection | 9 (33.3%) | 18 (66.7%) |
| Firefighting & Prevention | 0 (0.0%) | 18 (100.0%) |
| Law Enforcement | 9 (100.0%) | 0 (0.0%) |
| Food Preparation & Serving | 25 (7.9%) | 291 (92.1%) |
| Cleaning & Maintenance | 46 (100.0%) | 0 (0.0%) |
| Personal Care & Service | 73 (42.9%) | 97 (57.1%) |
| Total (Category) | 153 (26.4%) | 427 (73.6%) |
| Total (Overall) | 1,628 (52.7%) | 1,462 (47.3%) |
Sales and Office Occupations
The most common Sales and Office occupations in Rockville are Office & Administration (351 | 11.4%), and Sales & Related (282 | 9.1%).

Sales and Office Occupations by Sex
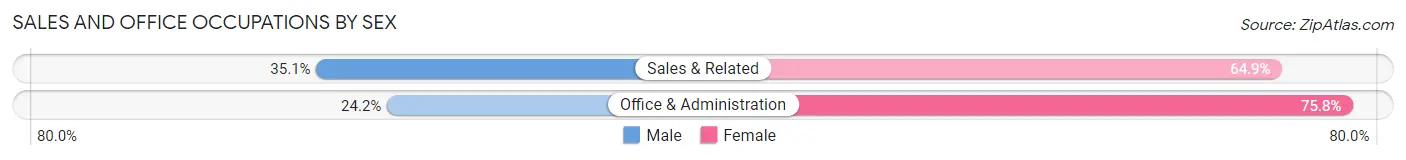
| Occupation | Male | Female |
| Sales & Related | 99 (35.1%) | 183 (64.9%) |
| Office & Administration | 85 (24.2%) | 266 (75.8%) |
| Total (Category) | 184 (29.1%) | 449 (70.9%) |
| Total (Overall) | 1,628 (52.7%) | 1,462 (47.3%) |
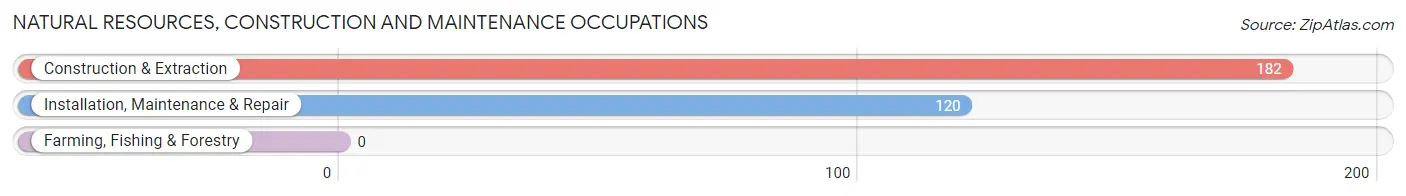
Natural Resources, Construction and Maintenance Occupations
The most common Natural Resources, Construction and Maintenance occupations in Rockville are Construction & Extraction (182 | 5.9%), and Installation, Maintenance & Repair (120 | 3.9%).
Natural Resources, Construction and Maintenance Occupations by Sex
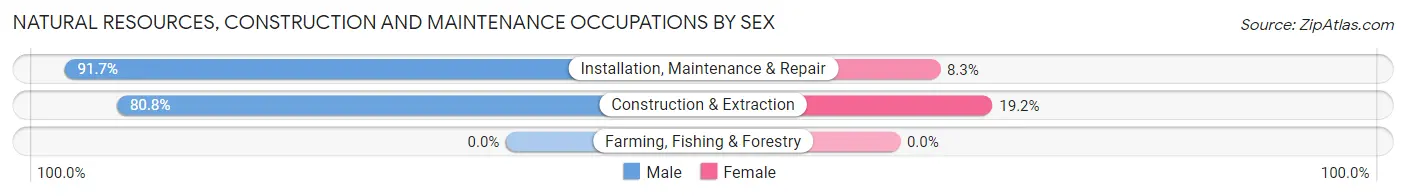
| Occupation | Male | Female |
| Farming, Fishing & Forestry | 0 (0.0%) | 0 (0.0%) |
| Construction & Extraction | 147 (80.8%) | 35 (19.2%) |
| Installation, Maintenance & Repair | 110 (91.7%) | 10 (8.3%) |
| Total (Category) | 257 (85.1%) | 45 (14.9%) |
| Total (Overall) | 1,628 (52.7%) | 1,462 (47.3%) |
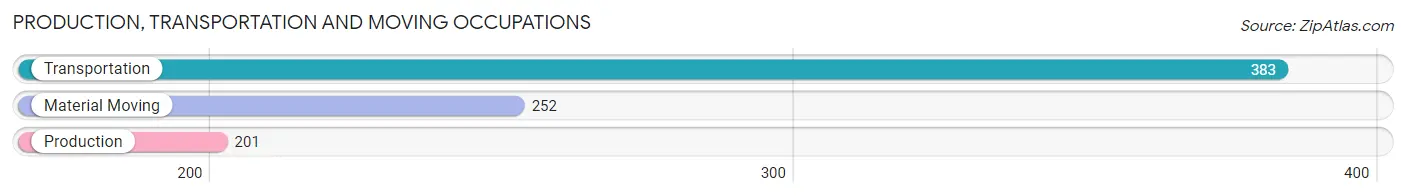
Production, Transportation and Moving Occupations
The most common Production, Transportation and Moving occupations in Rockville are Transportation (383 | 12.4%), Material Moving (252 | 8.2%), and Production (201 | 6.5%).
Production, Transportation and Moving Occupations by Sex
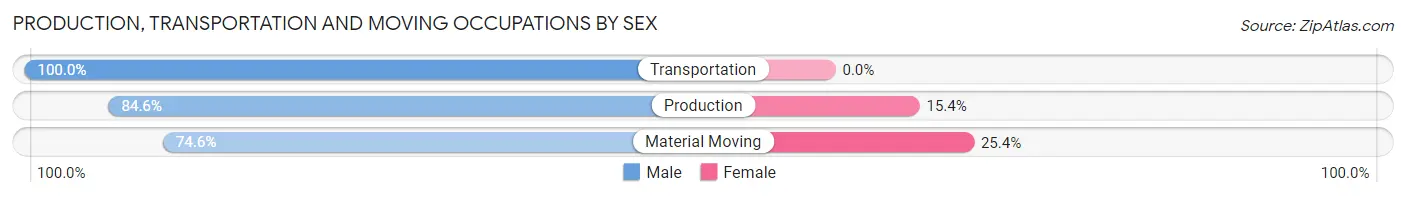
| Occupation | Male | Female |
| Production | 170 (84.6%) | 31 (15.4%) |
| Transportation | 383 (100.0%) | 0 (0.0%) |
| Material Moving | 188 (74.6%) | 64 (25.4%) |
| Total (Category) | 741 (88.6%) | 95 (11.4%) |
| Total (Overall) | 1,628 (52.7%) | 1,462 (47.3%) |
Employment Industries by Sex in Rockville
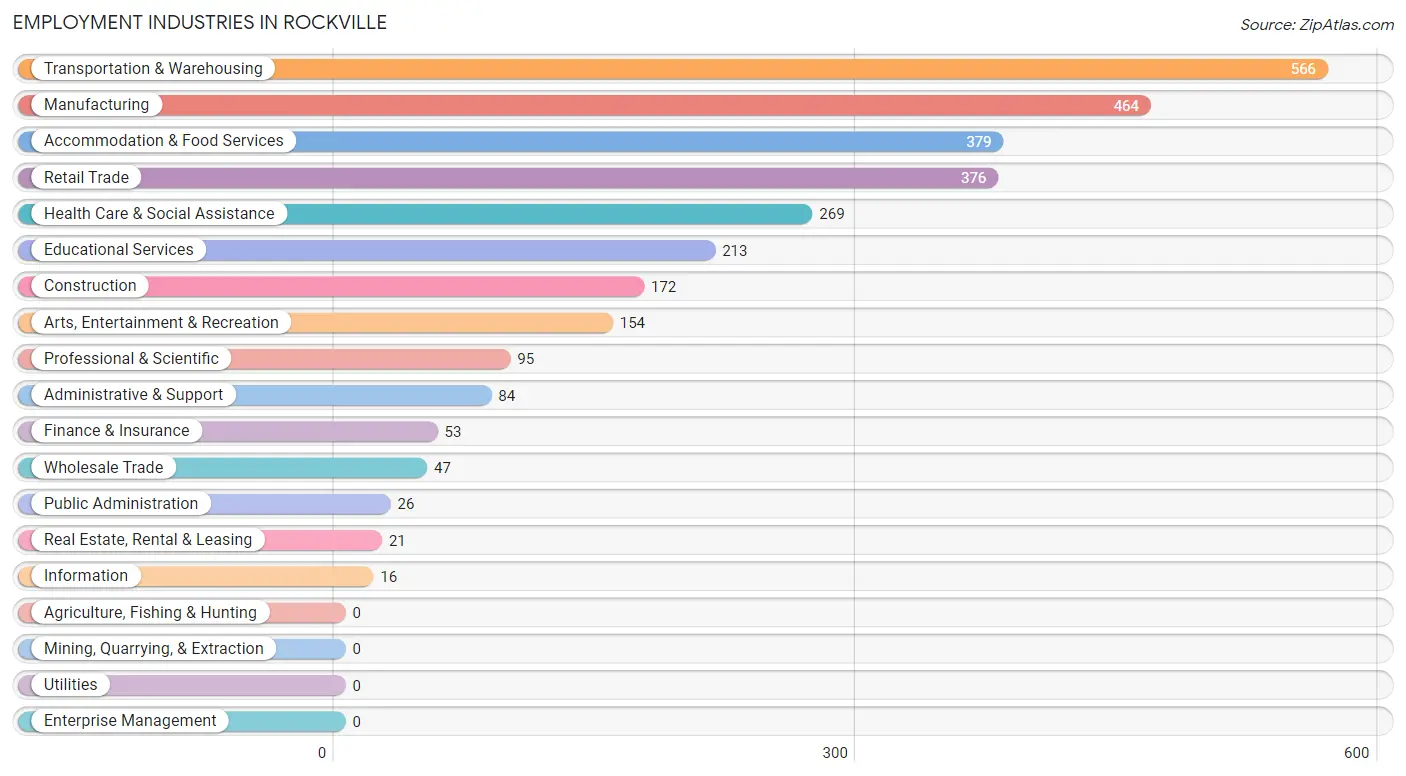
Employment Industries in Rockville
The major employment industries in Rockville include Transportation & Warehousing (566 | 18.3%), Manufacturing (464 | 15.0%), Accommodation & Food Services (379 | 12.3%), Retail Trade (376 | 12.2%), and Health Care & Social Assistance (269 | 8.7%).
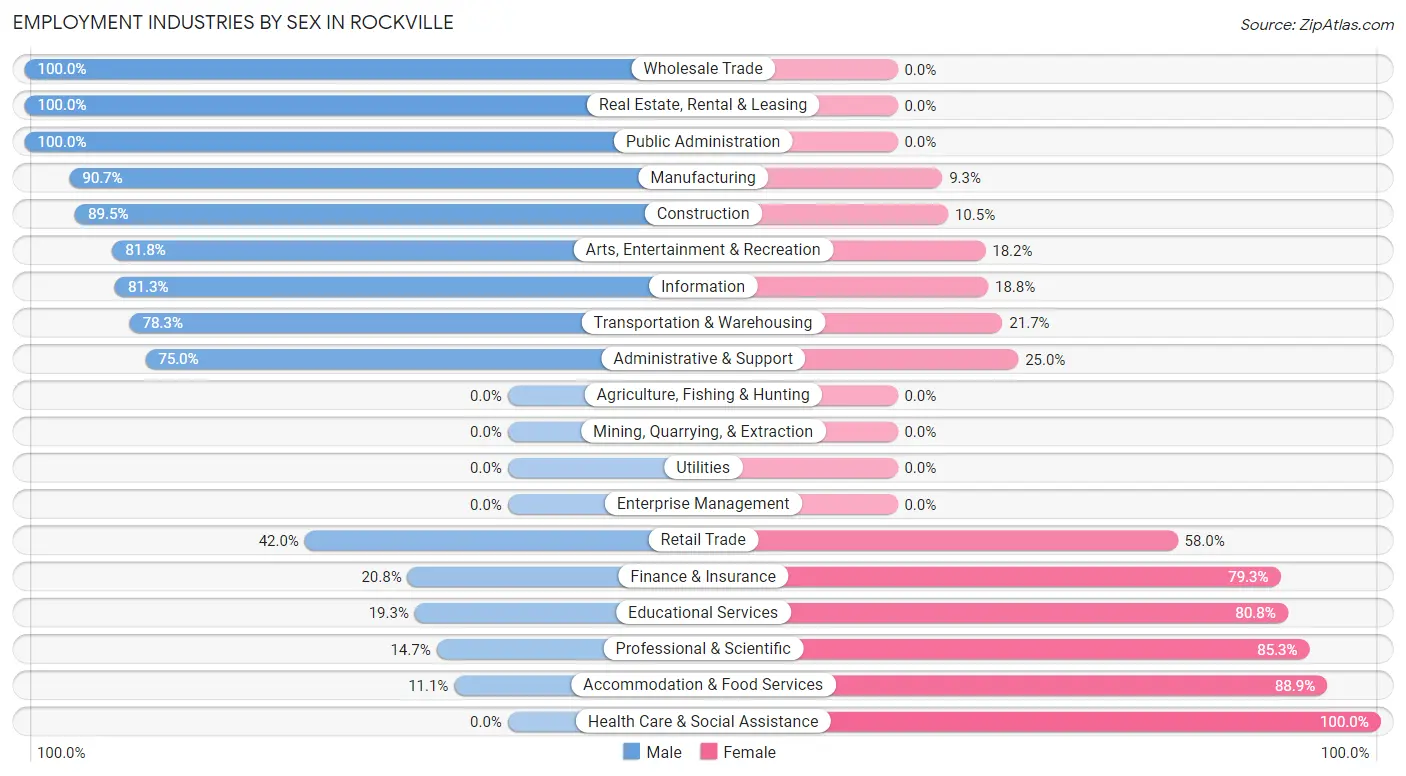
Employment Industries by Sex in Rockville
The Rockville industries that see more men than women are Wholesale Trade (100.0%), Real Estate, Rental & Leasing (100.0%), and Public Administration (100.0%), whereas the industries that tend to have a higher number of women are Health Care & Social Assistance (100.0%), Accommodation & Food Services (88.9%), and Professional & Scientific (85.3%).
| Industry | Male | Female |
| Agriculture, Fishing & Hunting | 0 (0.0%) | 0 (0.0%) |
| Mining, Quarrying, & Extraction | 0 (0.0%) | 0 (0.0%) |
| Construction | 154 (89.5%) | 18 (10.5%) |
| Manufacturing | 421 (90.7%) | 43 (9.3%) |
| Wholesale Trade | 47 (100.0%) | 0 (0.0%) |
| Retail Trade | 158 (42.0%) | 218 (58.0%) |
| Transportation & Warehousing | 443 (78.3%) | 123 (21.7%) |
| Utilities | 0 (0.0%) | 0 (0.0%) |
| Information | 13 (81.2%) | 3 (18.8%) |
| Finance & Insurance | 11 (20.7%) | 42 (79.2%) |
| Real Estate, Rental & Leasing | 21 (100.0%) | 0 (0.0%) |
| Professional & Scientific | 14 (14.7%) | 81 (85.3%) |
| Enterprise Management | 0 (0.0%) | 0 (0.0%) |
| Administrative & Support | 63 (75.0%) | 21 (25.0%) |
| Educational Services | 41 (19.3%) | 172 (80.7%) |
| Health Care & Social Assistance | 0 (0.0%) | 269 (100.0%) |
| Arts, Entertainment & Recreation | 126 (81.8%) | 28 (18.2%) |
| Accommodation & Food Services | 42 (11.1%) | 337 (88.9%) |
| Public Administration | 26 (100.0%) | 0 (0.0%) |
| Total | 1,628 (52.7%) | 1,462 (47.3%) |
Education in Rockville
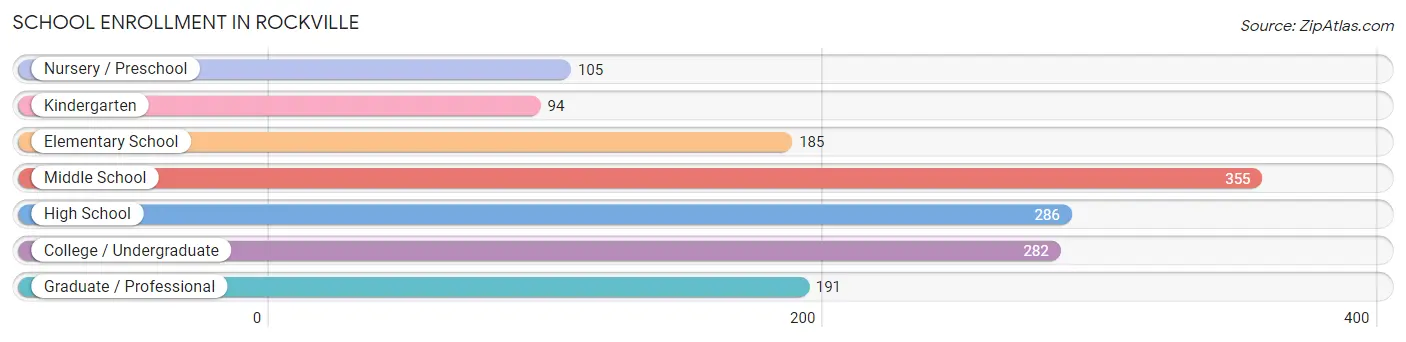
School Enrollment in Rockville
The most common levels of schooling among the 1,498 students in Rockville are middle school (355 | 23.7%), high school (286 | 19.1%), and college / undergraduate (282 | 18.8%).
| School Level | # Students | % Students |
| Nursery / Preschool | 105 | 7.0% |
| Kindergarten | 94 | 6.3% |
| Elementary School | 185 | 12.3% |
| Middle School | 355 | 23.7% |
| High School | 286 | 19.1% |
| College / Undergraduate | 282 | 18.8% |
| Graduate / Professional | 191 | 12.8% |
| Total | 1,498 | 100.0% |
School Enrollment by Age by Funding Source in Rockville
Out of a total of 1,498 students who are enrolled in schools in Rockville, 160 (10.7%) attend a private institution, while the remaining 1,338 (89.3%) are enrolled in public schools. The age group of 3 to 4 year olds has the highest likelihood of being enrolled in private schools, with 68 (80.0% in the age bracket) enrolled. Conversely, the age group of 5 to 9 year old has the lowest likelihood of being enrolled in a private school, with 279 (100.0% in the age bracket) attending a public institution.
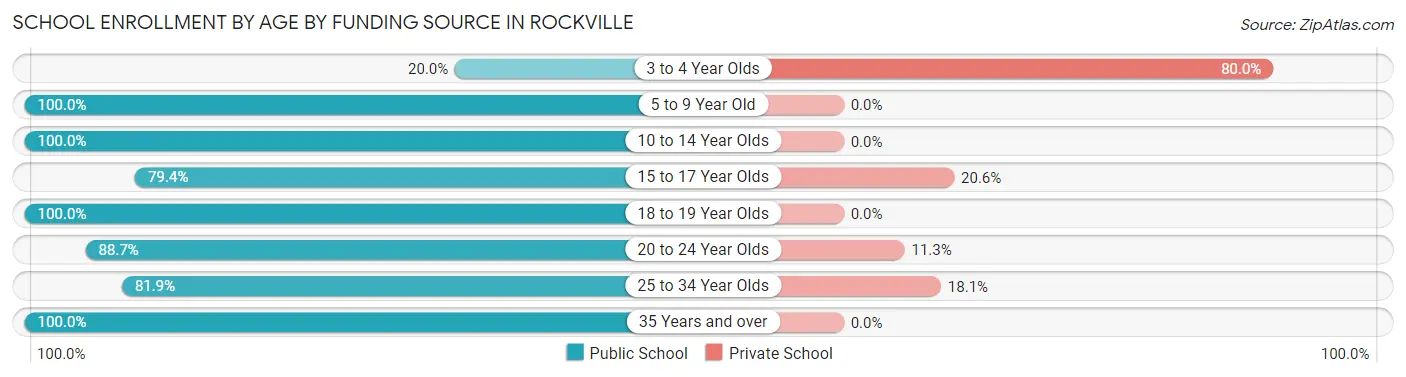
| Age Bracket | Public School | Private School |
| 3 to 4 Year Olds | 17 (20.0%) | 68 (80.0%) |
| 5 to 9 Year Old | 279 (100.0%) | 0 (0.0%) |
| 10 to 14 Year Olds | 440 (100.0%) | 0 (0.0%) |
| 15 to 17 Year Olds | 139 (79.4%) | 36 (20.6%) |
| 18 to 19 Year Olds | 74 (100.0%) | 0 (0.0%) |
| 20 to 24 Year Olds | 86 (88.7%) | 11 (11.3%) |
| 25 to 34 Year Olds | 208 (81.9%) | 46 (18.1%) |
| 35 Years and over | 94 (100.0%) | 0 (0.0%) |
| Total | 1,338 (89.3%) | 160 (10.7%) |
Educational Attainment by Field of Study in Rockville
Social sciences (171 | 19.4%), science & technology (111 | 12.6%), education (99 | 11.2%), business (97 | 11.0%), and communications (93 | 10.5%) are the most common fields of study among 882 individuals in Rockville who have obtained a bachelor's degree or higher.
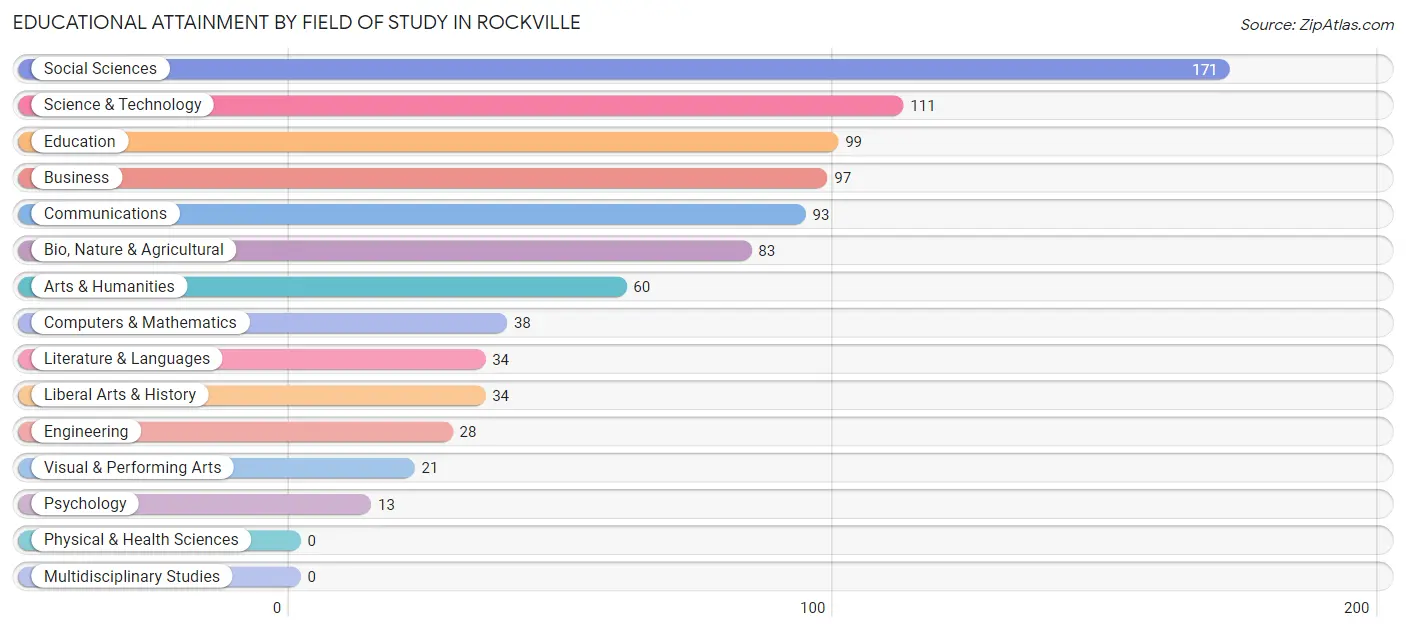
| Field of Study | # Graduates | % Graduates |
| Computers & Mathematics | 38 | 4.3% |
| Bio, Nature & Agricultural | 83 | 9.4% |
| Physical & Health Sciences | 0 | 0.0% |
| Psychology | 13 | 1.5% |
| Social Sciences | 171 | 19.4% |
| Engineering | 28 | 3.2% |
| Multidisciplinary Studies | 0 | 0.0% |
| Science & Technology | 111 | 12.6% |
| Business | 97 | 11.0% |
| Education | 99 | 11.2% |
| Literature & Languages | 34 | 3.8% |
| Liberal Arts & History | 34 | 3.8% |
| Visual & Performing Arts | 21 | 2.4% |
| Communications | 93 | 10.5% |
| Arts & Humanities | 60 | 6.8% |
| Total | 882 | 100.0% |
Transportation & Commute in Rockville
Vehicle Availability by Sex in Rockville
The most prevalent vehicle ownership categories in Rockville are males with 2 vehicles (661, accounting for 41.7%) and females with 2 vehicles (477, making up 48.3%).
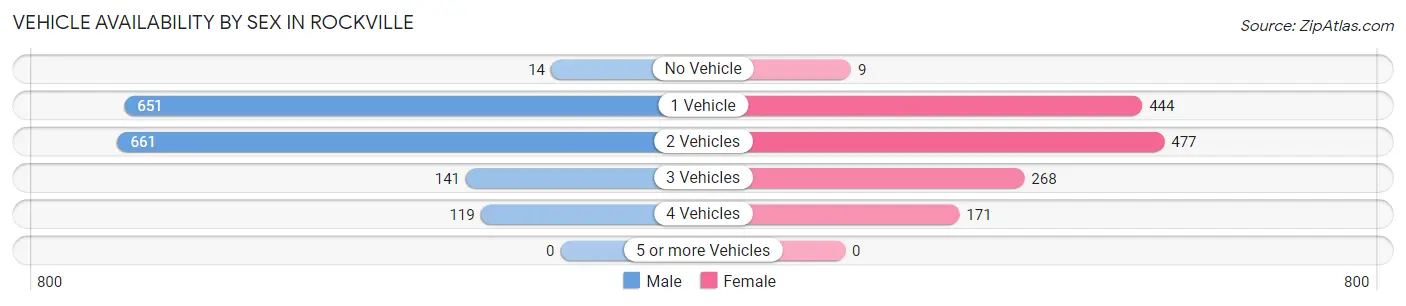
| Vehicles Available | Male | Female |
| No Vehicle | 14 (0.9%) | 9 (0.7%) |
| 1 Vehicle | 651 (41.0%) | 444 (32.4%) |
| 2 Vehicles | 661 (41.7%) | 477 (34.8%) |
| 3 Vehicles | 141 (8.9%) | 268 (19.6%) |
| 4 Vehicles | 119 (7.5%) | 171 (12.5%) |
| 5 or more Vehicles | 0 (0.0%) | 0 (0.0%) |
| Total | 1,586 (100.0%) | 1,369 (100.0%) |
Commute Time in Rockville
The most frequently occuring commute durations in Rockville are 20 to 24 minutes (538 commuters, 19.3%), 15 to 19 minutes (488 commuters, 17.5%), and 30 to 34 minutes (439 commuters, 15.8%).
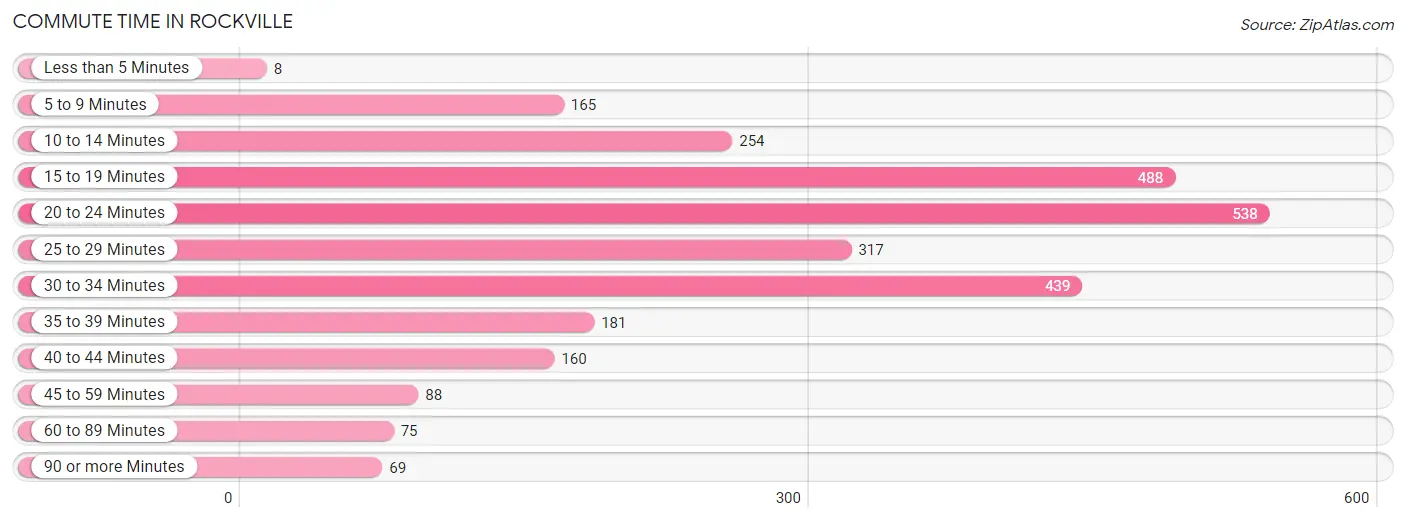
| Commute Time | # Commuters | % Commuters |
| Less than 5 Minutes | 8 | 0.3% |
| 5 to 9 Minutes | 165 | 5.9% |
| 10 to 14 Minutes | 254 | 9.1% |
| 15 to 19 Minutes | 488 | 17.5% |
| 20 to 24 Minutes | 538 | 19.3% |
| 25 to 29 Minutes | 317 | 11.4% |
| 30 to 34 Minutes | 439 | 15.8% |
| 35 to 39 Minutes | 181 | 6.5% |
| 40 to 44 Minutes | 160 | 5.8% |
| 45 to 59 Minutes | 88 | 3.2% |
| 60 to 89 Minutes | 75 | 2.7% |
| 90 or more Minutes | 69 | 2.5% |
Commute Time by Sex in Rockville
The most common commute times in Rockville are 15 to 19 minutes (326 commuters, 21.8%) for males and 20 to 24 minutes (216 commuters, 16.8%) for females.
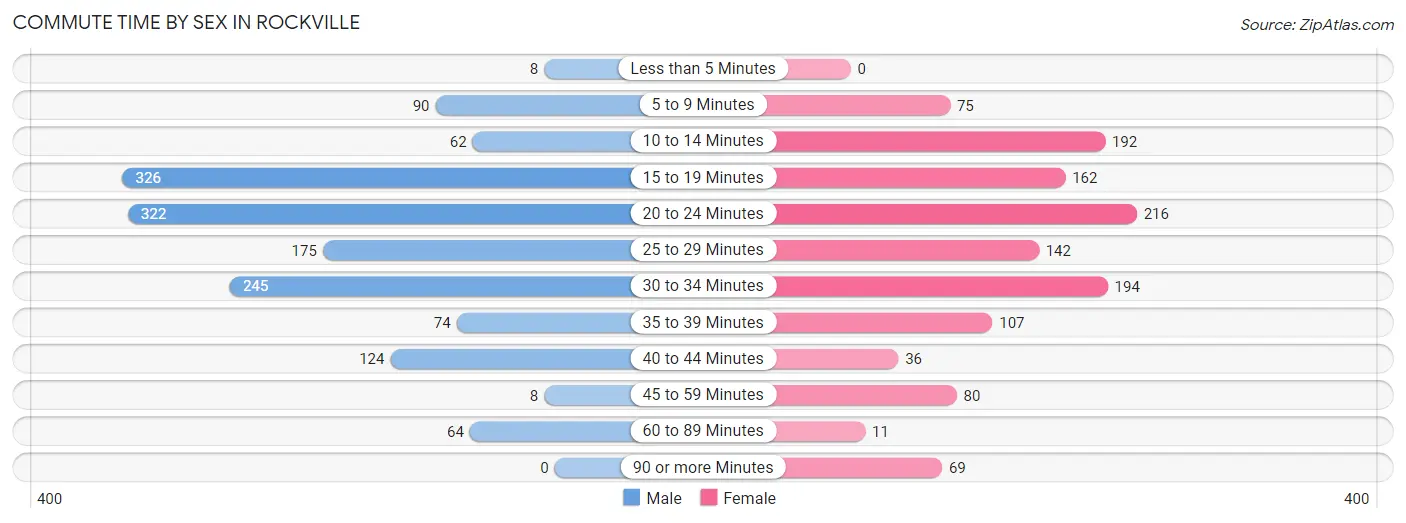
| Commute Time | Male | Female |
| Less than 5 Minutes | 8 (0.5%) | 0 (0.0%) |
| 5 to 9 Minutes | 90 (6.0%) | 75 (5.8%) |
| 10 to 14 Minutes | 62 (4.1%) | 192 (14.9%) |
| 15 to 19 Minutes | 326 (21.8%) | 162 (12.6%) |
| 20 to 24 Minutes | 322 (21.5%) | 216 (16.8%) |
| 25 to 29 Minutes | 175 (11.7%) | 142 (11.1%) |
| 30 to 34 Minutes | 245 (16.4%) | 194 (15.1%) |
| 35 to 39 Minutes | 74 (4.9%) | 107 (8.3%) |
| 40 to 44 Minutes | 124 (8.3%) | 36 (2.8%) |
| 45 to 59 Minutes | 8 (0.5%) | 80 (6.2%) |
| 60 to 89 Minutes | 64 (4.3%) | 11 (0.9%) |
| 90 or more Minutes | 0 (0.0%) | 69 (5.4%) |
Time of Departure to Work by Sex in Rockville
The most frequent times of departure to work in Rockville are 5:30 AM to 5:59 AM (311, 20.8%) for males and 7:30 AM to 7:59 AM (220, 17.1%) for females.
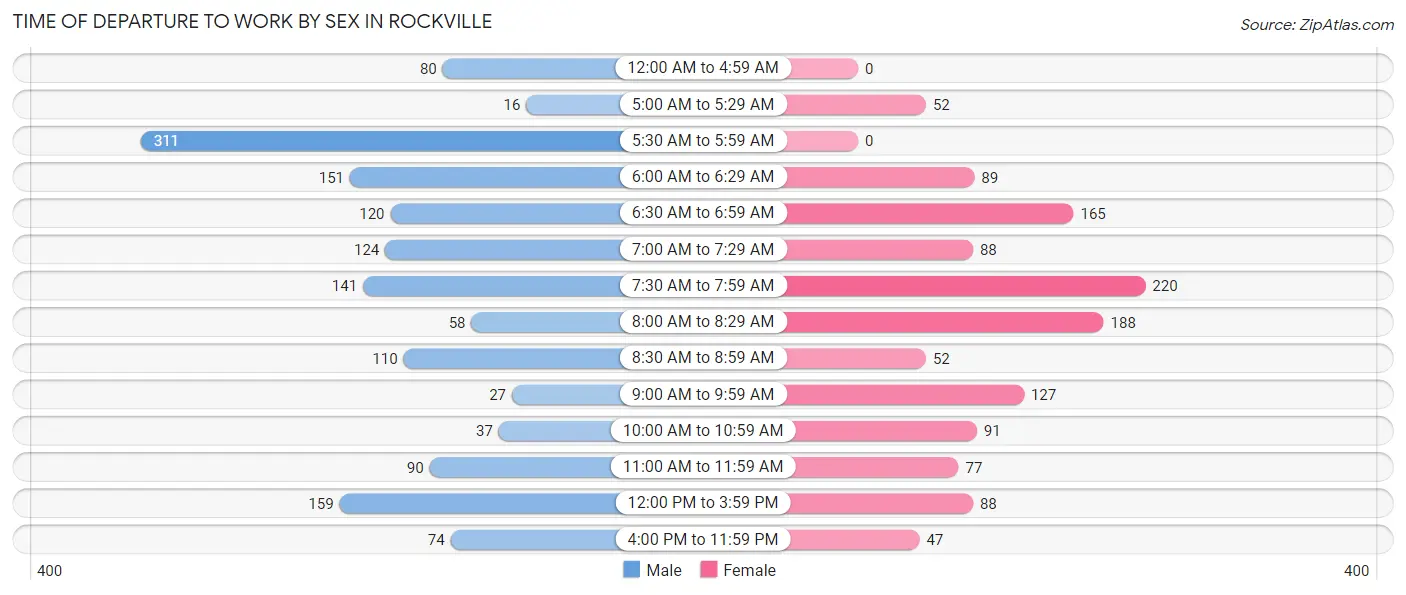
| Time of Departure | Male | Female |
| 12:00 AM to 4:59 AM | 80 (5.3%) | 0 (0.0%) |
| 5:00 AM to 5:29 AM | 16 (1.1%) | 52 (4.1%) |
| 5:30 AM to 5:59 AM | 311 (20.8%) | 0 (0.0%) |
| 6:00 AM to 6:29 AM | 151 (10.1%) | 89 (6.9%) |
| 6:30 AM to 6:59 AM | 120 (8.0%) | 165 (12.9%) |
| 7:00 AM to 7:29 AM | 124 (8.3%) | 88 (6.9%) |
| 7:30 AM to 7:59 AM | 141 (9.4%) | 220 (17.1%) |
| 8:00 AM to 8:29 AM | 58 (3.9%) | 188 (14.6%) |
| 8:30 AM to 8:59 AM | 110 (7.3%) | 52 (4.1%) |
| 9:00 AM to 9:59 AM | 27 (1.8%) | 127 (9.9%) |
| 10:00 AM to 10:59 AM | 37 (2.5%) | 91 (7.1%) |
| 11:00 AM to 11:59 AM | 90 (6.0%) | 77 (6.0%) |
| 12:00 PM to 3:59 PM | 159 (10.6%) | 88 (6.9%) |
| 4:00 PM to 11:59 PM | 74 (4.9%) | 47 (3.7%) |
| Total | 1,498 (100.0%) | 1,284 (100.0%) |
Housing Occupancy in Rockville
Occupancy by Ownership in Rockville
Of the total 2,828 dwellings in Rockville, owner-occupied units account for 761 (26.9%), while renter-occupied units make up 2,067 (73.1%).
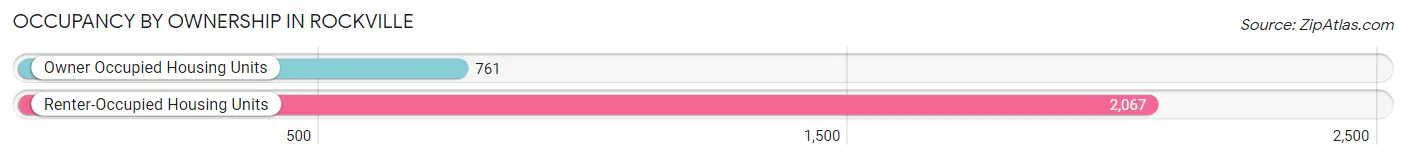
| Occupancy | # Housing Units | % Housing Units |
| Owner Occupied Housing Units | 761 | 26.9% |
| Renter-Occupied Housing Units | 2,067 | 73.1% |
| Total Occupied Housing Units | 2,828 | 100.0% |
Occupancy by Household Size in Rockville
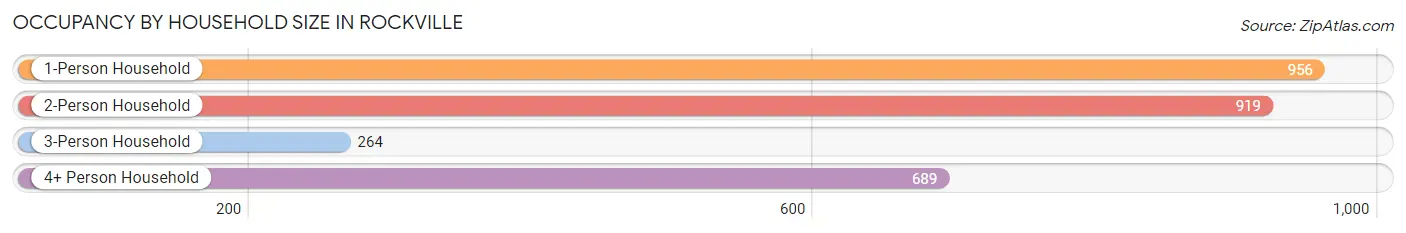
| Household Size | # Housing Units | % Housing Units |
| 1-Person Household | 956 | 33.8% |
| 2-Person Household | 919 | 32.5% |
| 3-Person Household | 264 | 9.3% |
| 4+ Person Household | 689 | 24.4% |
| Total Housing Units | 2,828 | 100.0% |
Occupancy by Ownership by Household Size in Rockville
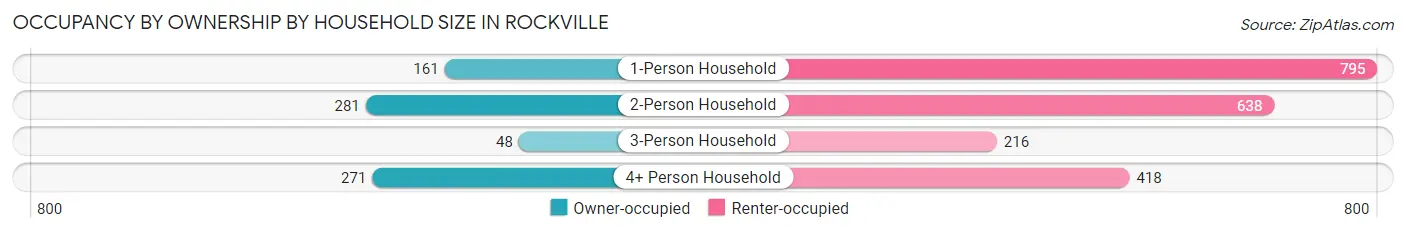
| Household Size | Owner-occupied | Renter-occupied |
| 1-Person Household | 161 (16.8%) | 795 (83.2%) |
| 2-Person Household | 281 (30.6%) | 638 (69.4%) |
| 3-Person Household | 48 (18.2%) | 216 (81.8%) |
| 4+ Person Household | 271 (39.3%) | 418 (60.7%) |
| Total Housing Units | 761 (26.9%) | 2,067 (73.1%) |
Occupancy by Educational Attainment in Rockville
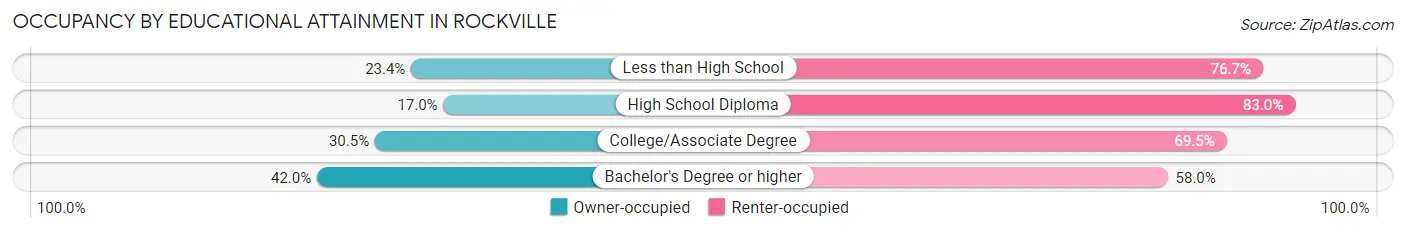
| Household Size | Owner-occupied | Renter-occupied |
| Less than High School | 110 (23.4%) | 361 (76.6%) |
| High School Diploma | 164 (17.0%) | 803 (83.0%) |
| College/Associate Degree | 258 (30.5%) | 587 (69.5%) |
| Bachelor's Degree or higher | 229 (42.0%) | 316 (58.0%) |
Occupancy by Age of Householder in Rockville
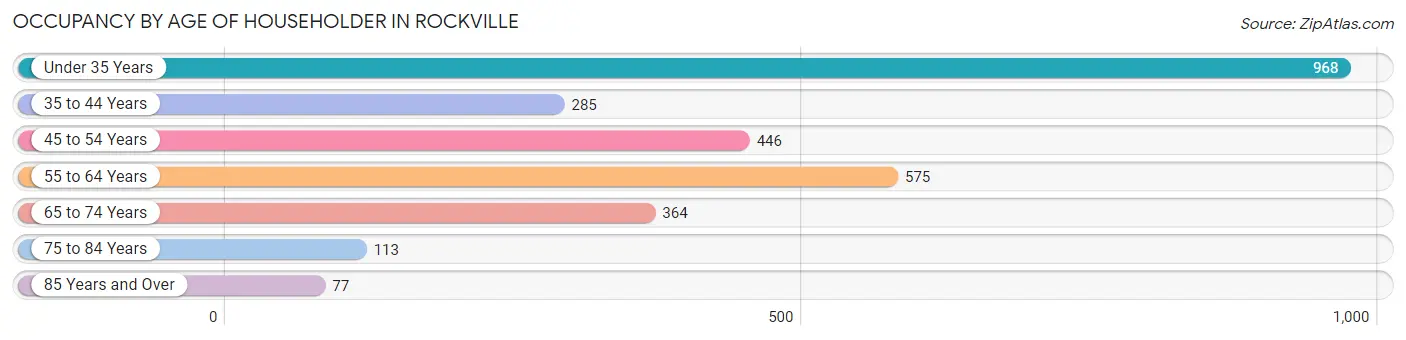
| Age Bracket | # Households | % Households |
| Under 35 Years | 968 | 34.2% |
| 35 to 44 Years | 285 | 10.1% |
| 45 to 54 Years | 446 | 15.8% |
| 55 to 64 Years | 575 | 20.3% |
| 65 to 74 Years | 364 | 12.9% |
| 75 to 84 Years | 113 | 4.0% |
| 85 Years and Over | 77 | 2.7% |
| Total | 2,828 | 100.0% |
Housing Finances in Rockville
Median Income by Occupancy in Rockville
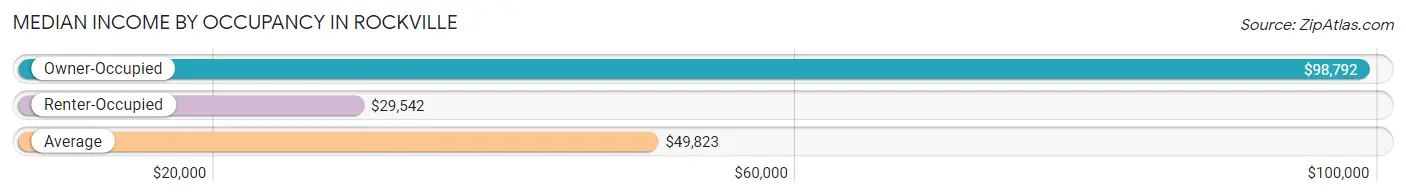
| Occupancy Type | # Households | Median Income |
| Owner-Occupied | 761 (26.9%) | $98,792 |
| Renter-Occupied | 2,067 (73.1%) | $29,542 |
| Average | 2,828 (100.0%) | $49,823 |
Occupancy by Householder Income Bracket in Rockville
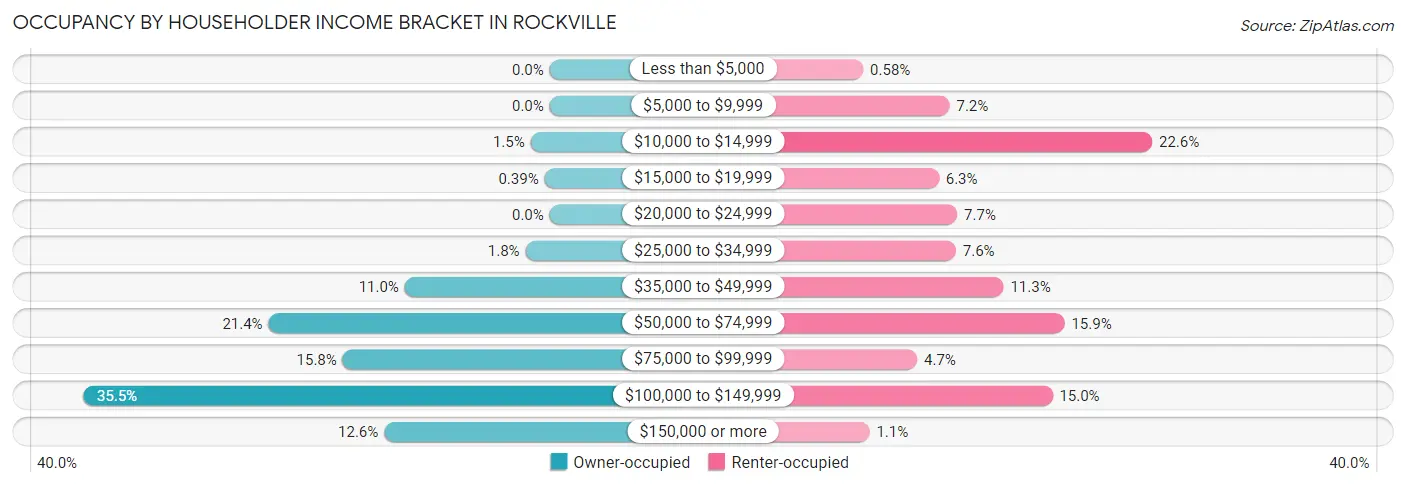
| Income Bracket | Owner-occupied | Renter-occupied |
| Less than $5,000 | 0 (0.0%) | 12 (0.6%) |
| $5,000 to $9,999 | 0 (0.0%) | 148 (7.2%) |
| $10,000 to $14,999 | 11 (1.5%) | 467 (22.6%) |
| $15,000 to $19,999 | 3 (0.4%) | 131 (6.3%) |
| $20,000 to $24,999 | 0 (0.0%) | 160 (7.7%) |
| $25,000 to $34,999 | 14 (1.8%) | 158 (7.6%) |
| $35,000 to $49,999 | 84 (11.0%) | 233 (11.3%) |
| $50,000 to $74,999 | 163 (21.4%) | 329 (15.9%) |
| $75,000 to $99,999 | 120 (15.8%) | 97 (4.7%) |
| $100,000 to $149,999 | 270 (35.5%) | 310 (15.0%) |
| $150,000 or more | 96 (12.6%) | 22 (1.1%) |
| Total | 761 (100.0%) | 2,067 (100.0%) |
Monthly Housing Cost Tiers in Rockville
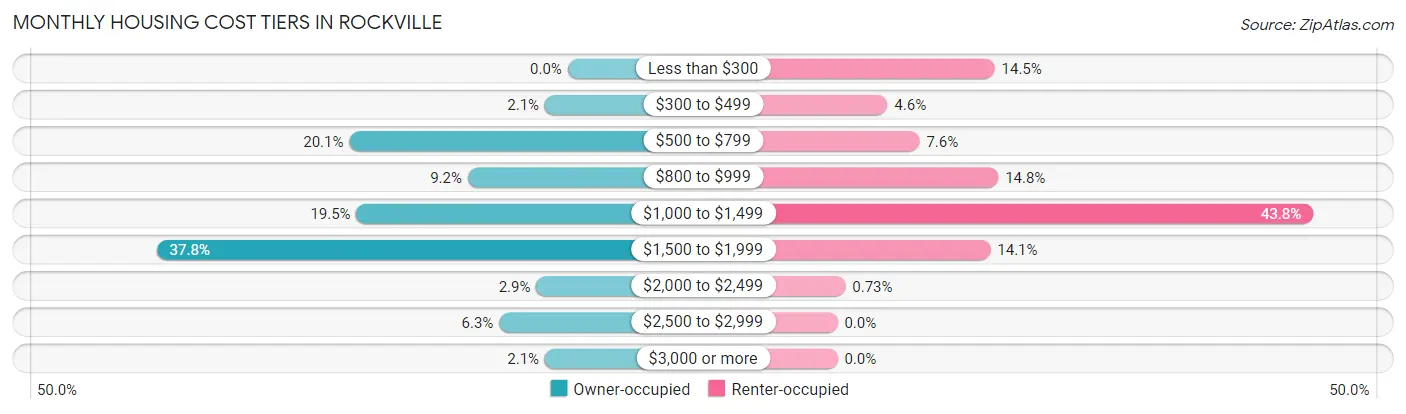
| Monthly Cost | Owner-occupied | Renter-occupied |
| Less than $300 | 0 (0.0%) | 299 (14.5%) |
| $300 to $499 | 16 (2.1%) | 95 (4.6%) |
| $500 to $799 | 153 (20.1%) | 156 (7.5%) |
| $800 to $999 | 70 (9.2%) | 306 (14.8%) |
| $1,000 to $1,499 | 148 (19.5%) | 905 (43.8%) |
| $1,500 to $1,999 | 288 (37.8%) | 291 (14.1%) |
| $2,000 to $2,499 | 22 (2.9%) | 15 (0.7%) |
| $2,500 to $2,999 | 48 (6.3%) | 0 (0.0%) |
| $3,000 or more | 16 (2.1%) | 0 (0.0%) |
| Total | 761 (100.0%) | 2,067 (100.0%) |
Physical Housing Characteristics in Rockville
Housing Structures in Rockville
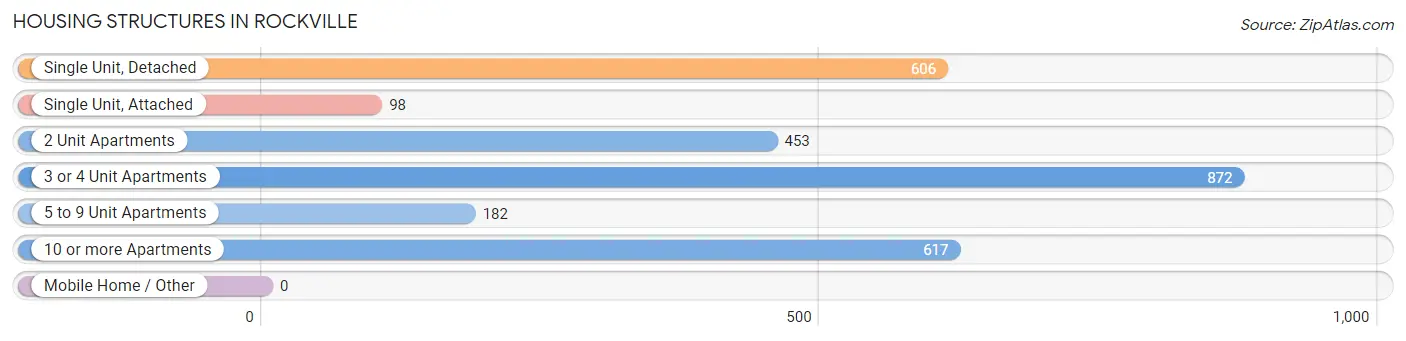
| Structure Type | # Housing Units | % Housing Units |
| Single Unit, Detached | 606 | 21.4% |
| Single Unit, Attached | 98 | 3.5% |
| 2 Unit Apartments | 453 | 16.0% |
| 3 or 4 Unit Apartments | 872 | 30.8% |
| 5 to 9 Unit Apartments | 182 | 6.4% |
| 10 or more Apartments | 617 | 21.8% |
| Mobile Home / Other | 0 | 0.0% |
| Total | 2,828 | 100.0% |
Housing Structures by Occupancy in Rockville
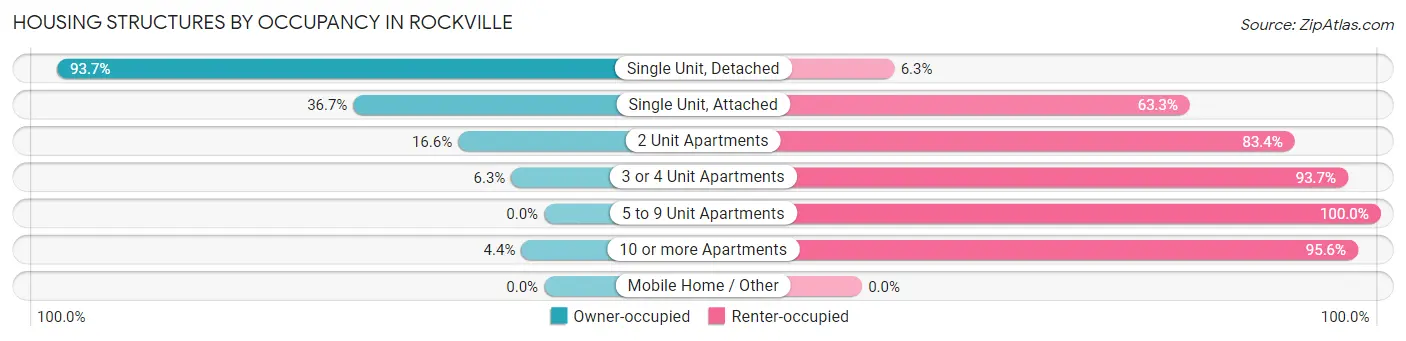
| Structure Type | Owner-occupied | Renter-occupied |
| Single Unit, Detached | 568 (93.7%) | 38 (6.3%) |
| Single Unit, Attached | 36 (36.7%) | 62 (63.3%) |
| 2 Unit Apartments | 75 (16.6%) | 378 (83.4%) |
| 3 or 4 Unit Apartments | 55 (6.3%) | 817 (93.7%) |
| 5 to 9 Unit Apartments | 0 (0.0%) | 182 (100.0%) |
| 10 or more Apartments | 27 (4.4%) | 590 (95.6%) |
| Mobile Home / Other | 0 (0.0%) | 0 (0.0%) |
| Total | 761 (26.9%) | 2,067 (73.1%) |
Housing Structures by Number of Rooms in Rockville
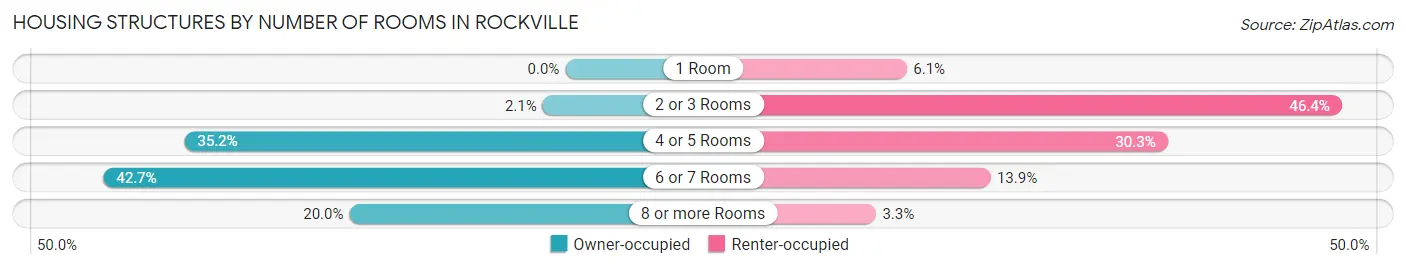
| Number of Rooms | Owner-occupied | Renter-occupied |
| 1 Room | 0 (0.0%) | 127 (6.1%) |
| 2 or 3 Rooms | 16 (2.1%) | 959 (46.4%) |
| 4 or 5 Rooms | 268 (35.2%) | 626 (30.3%) |
| 6 or 7 Rooms | 325 (42.7%) | 287 (13.9%) |
| 8 or more Rooms | 152 (20.0%) | 68 (3.3%) |
| Total | 761 (100.0%) | 2,067 (100.0%) |
Housing Structure by Heating Type in Rockville
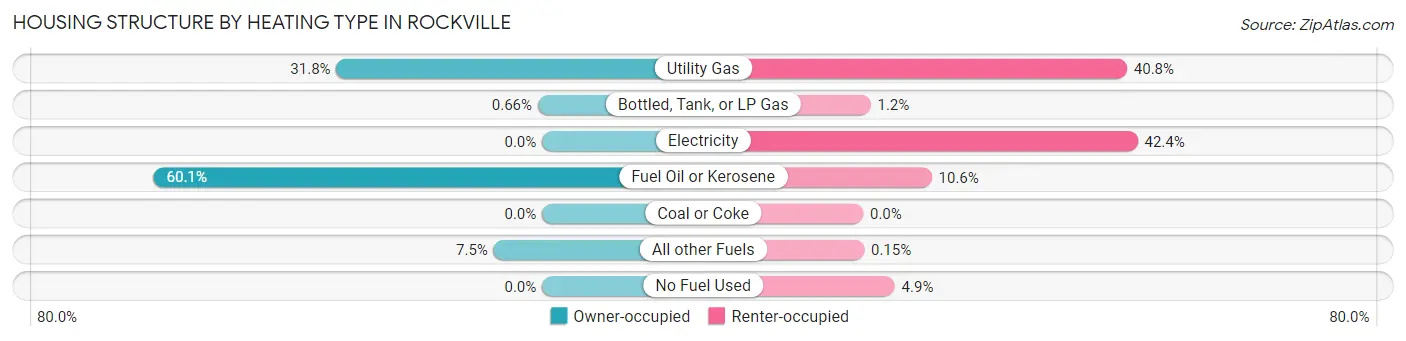
| Heating Type | Owner-occupied | Renter-occupied |
| Utility Gas | 242 (31.8%) | 843 (40.8%) |
| Bottled, Tank, or LP Gas | 5 (0.7%) | 24 (1.2%) |
| Electricity | 0 (0.0%) | 877 (42.4%) |
| Fuel Oil or Kerosene | 457 (60.1%) | 219 (10.6%) |
| Coal or Coke | 0 (0.0%) | 0 (0.0%) |
| All other Fuels | 57 (7.5%) | 3 (0.2%) |
| No Fuel Used | 0 (0.0%) | 101 (4.9%) |
| Total | 761 (100.0%) | 2,067 (100.0%) |
Household Vehicle Usage in Rockville
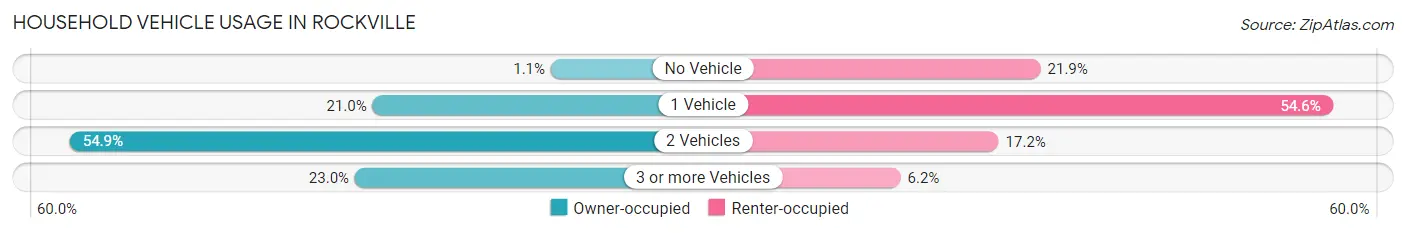
| Vehicles per Household | Owner-occupied | Renter-occupied |
| No Vehicle | 8 (1.1%) | 453 (21.9%) |
| 1 Vehicle | 160 (21.0%) | 1,129 (54.6%) |
| 2 Vehicles | 418 (54.9%) | 356 (17.2%) |
| 3 or more Vehicles | 175 (23.0%) | 129 (6.2%) |
| Total | 761 (100.0%) | 2,067 (100.0%) |
Real Estate & Mortgages in Rockville
Real Estate and Mortgage Overview in Rockville
| Characteristic | Without Mortgage | With Mortgage |
| Housing Units | 293 | 468 |
| Median Property Value | $194,300 | $177,500 |
| Median Household Income | $74,602 | $81 |
| Monthly Housing Costs | $777 | $5 |
| Real Estate Taxes | $4,009 | $40 |
Property Value by Mortgage Status in Rockville
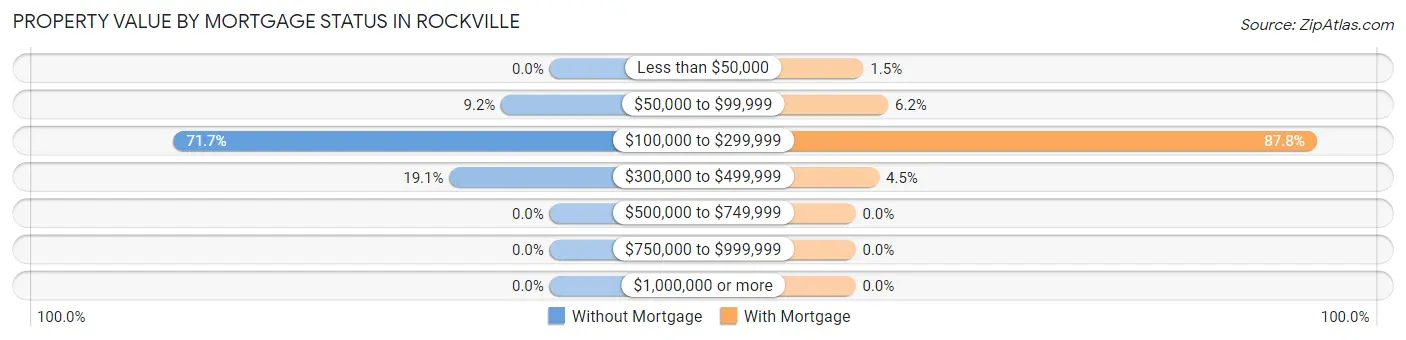
| Property Value | Without Mortgage | With Mortgage |
| Less than $50,000 | 0 (0.0%) | 7 (1.5%) |
| $50,000 to $99,999 | 27 (9.2%) | 29 (6.2%) |
| $100,000 to $299,999 | 210 (71.7%) | 411 (87.8%) |
| $300,000 to $499,999 | 56 (19.1%) | 21 (4.5%) |
| $500,000 to $749,999 | 0 (0.0%) | 0 (0.0%) |
| $750,000 to $999,999 | 0 (0.0%) | 0 (0.0%) |
| $1,000,000 or more | 0 (0.0%) | 0 (0.0%) |
| Total | 293 (100.0%) | 468 (100.0%) |
Household Income by Mortgage Status in Rockville
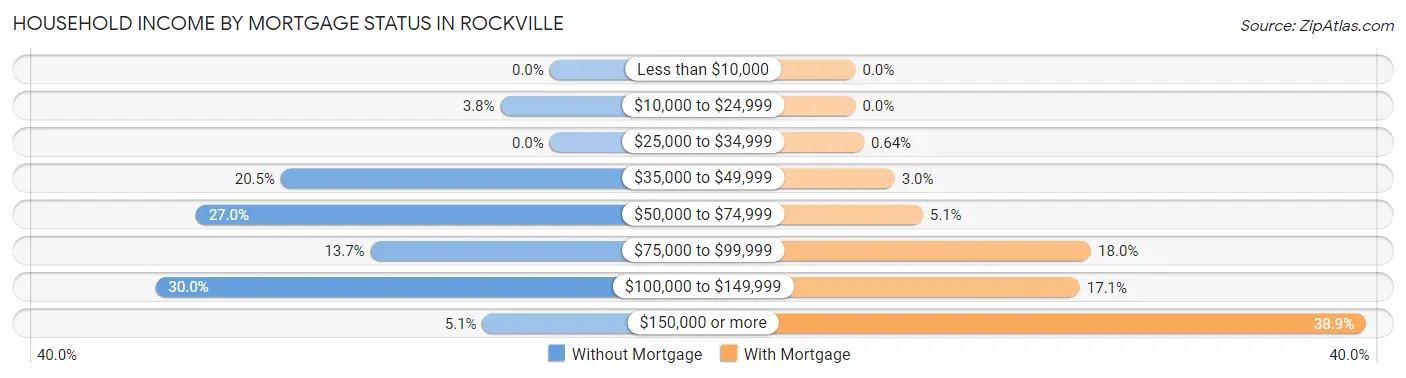
| Household Income | Without Mortgage | With Mortgage |
| Less than $10,000 | 0 (0.0%) | 0 (0.0%) |
| $10,000 to $24,999 | 11 (3.7%) | 0 (0.0%) |
| $25,000 to $34,999 | 0 (0.0%) | 3 (0.6%) |
| $35,000 to $49,999 | 60 (20.5%) | 14 (3.0%) |
| $50,000 to $74,999 | 79 (27.0%) | 24 (5.1%) |
| $75,000 to $99,999 | 40 (13.7%) | 84 (17.9%) |
| $100,000 to $149,999 | 88 (30.0%) | 80 (17.1%) |
| $150,000 or more | 15 (5.1%) | 182 (38.9%) |
| Total | 293 (100.0%) | 468 (100.0%) |
Property Value to Household Income Ratio in Rockville
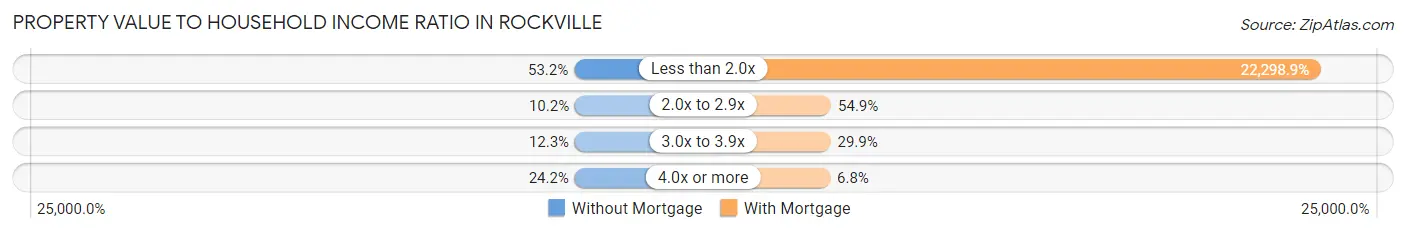
| Value-to-Income Ratio | Without Mortgage | With Mortgage |
| Less than 2.0x | 156 (53.2%) | 104,359 (22,298.9%) |
| 2.0x to 2.9x | 30 (10.2%) | 257 (54.9%) |
| 3.0x to 3.9x | 36 (12.3%) | 140 (29.9%) |
| 4.0x or more | 71 (24.2%) | 32 (6.8%) |
| Total | 293 (100.0%) | 468 (100.0%) |
Real Estate Taxes by Mortgage Status in Rockville

| Property Taxes | Without Mortgage | With Mortgage |
| Less than $800 | 0 (0.0%) | 0 (0.0%) |
| $800 to $1,499 | 32 (10.9%) | 7 (1.5%) |
| $800 to $1,499 | 261 (89.1%) | 0 (0.0%) |
| Total | 293 (100.0%) | 468 (100.0%) |
Health & Disability in Rockville
Health Insurance Coverage by Age in Rockville
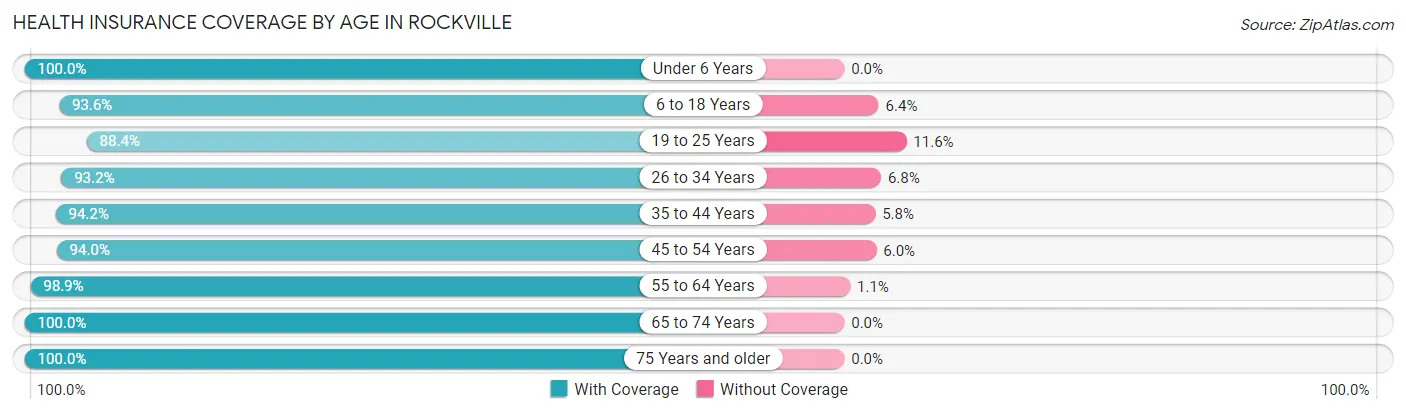
| Age Bracket | With Coverage | Without Coverage |
| Under 6 Years | 679 (100.0%) | 0 (0.0%) |
| 6 to 18 Years | 949 (93.6%) | 65 (6.4%) |
| 19 to 25 Years | 649 (88.4%) | 85 (11.6%) |
| 26 to 34 Years | 1,334 (93.2%) | 98 (6.8%) |
| 35 to 44 Years | 539 (94.2%) | 33 (5.8%) |
| 45 to 54 Years | 819 (94.0%) | 52 (6.0%) |
| 55 to 64 Years | 827 (98.9%) | 9 (1.1%) |
| 65 to 74 Years | 493 (100.0%) | 0 (0.0%) |
| 75 Years and older | 303 (100.0%) | 0 (0.0%) |
| Total | 6,592 (95.1%) | 342 (4.9%) |
Health Insurance Coverage by Citizenship Status in Rockville
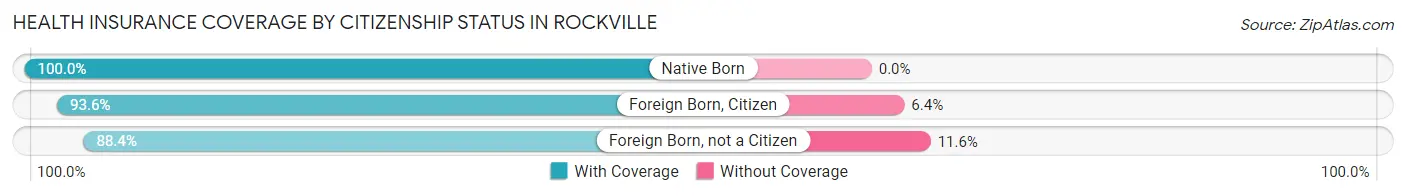
| Citizenship Status | With Coverage | Without Coverage |
| Native Born | 679 (100.0%) | 0 (0.0%) |
| Foreign Born, Citizen | 949 (93.6%) | 65 (6.4%) |
| Foreign Born, not a Citizen | 649 (88.4%) | 85 (11.6%) |
Health Insurance Coverage by Household Income in Rockville
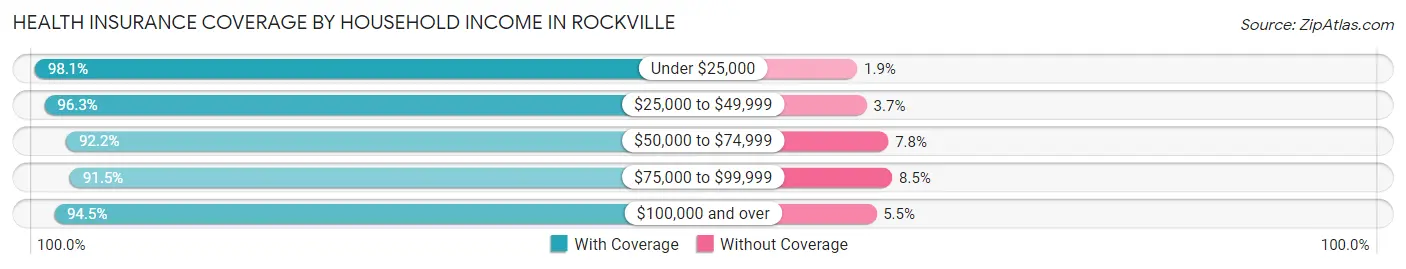
| Household Income | With Coverage | Without Coverage |
| Under $25,000 | 1,783 (98.1%) | 35 (1.9%) |
| $25,000 to $49,999 | 984 (96.3%) | 38 (3.7%) |
| $50,000 to $74,999 | 1,070 (92.2%) | 90 (7.8%) |
| $75,000 to $99,999 | 614 (91.5%) | 57 (8.5%) |
| $100,000 and over | 2,092 (94.5%) | 122 (5.5%) |
Public vs Private Health Insurance Coverage by Age in Rockville
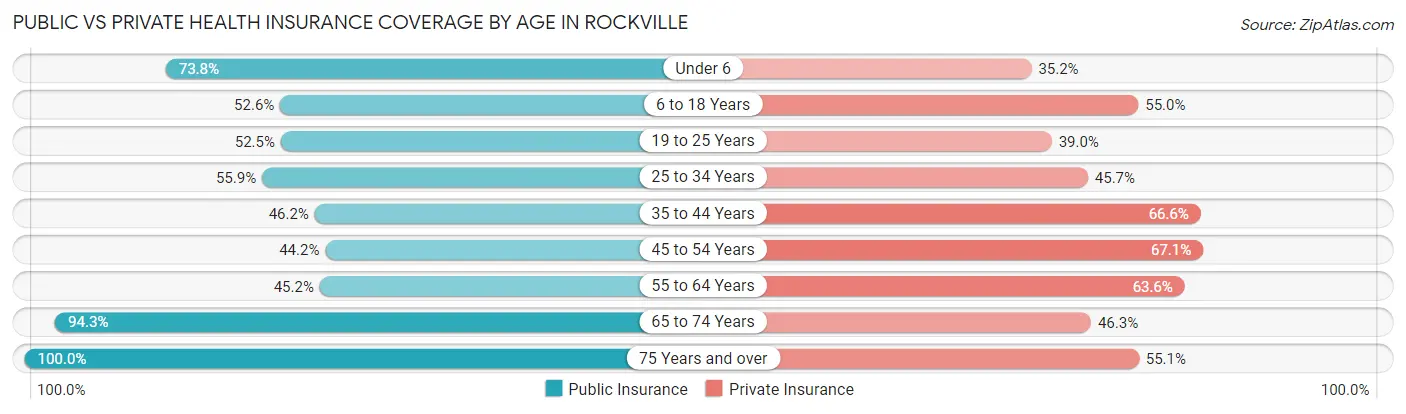
| Age Bracket | Public Insurance | Private Insurance |
| Under 6 | 501 (73.8%) | 239 (35.2%) |
| 6 to 18 Years | 533 (52.6%) | 558 (55.0%) |
| 19 to 25 Years | 385 (52.4%) | 286 (39.0%) |
| 25 to 34 Years | 801 (55.9%) | 654 (45.7%) |
| 35 to 44 Years | 264 (46.2%) | 381 (66.6%) |
| 45 to 54 Years | 385 (44.2%) | 584 (67.0%) |
| 55 to 64 Years | 378 (45.2%) | 532 (63.6%) |
| 65 to 74 Years | 465 (94.3%) | 228 (46.3%) |
| 75 Years and over | 303 (100.0%) | 167 (55.1%) |
| Total | 4,015 (57.9%) | 3,629 (52.3%) |
Disability Status by Sex by Age in Rockville
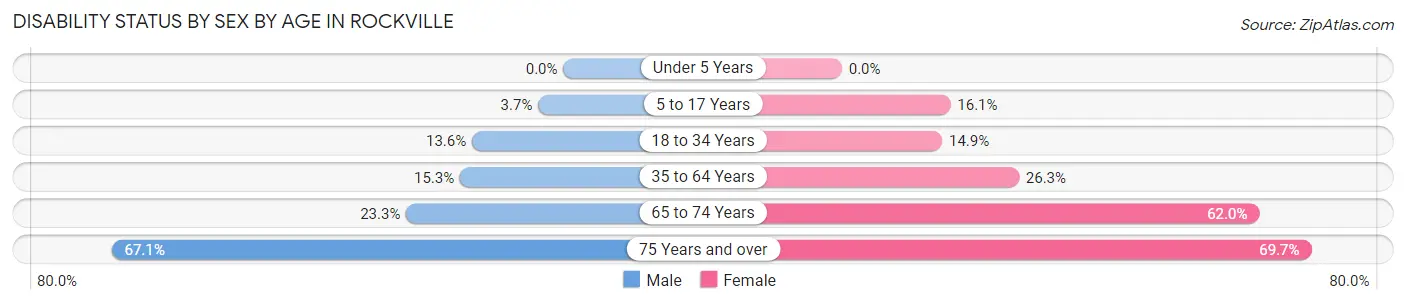
| Age Bracket | Male | Female |
| Under 5 Years | 0 (0.0%) | 0 (0.0%) |
| 5 to 17 Years | 18 (3.7%) | 78 (16.1%) |
| 18 to 34 Years | 144 (13.6%) | 186 (14.9%) |
| 35 to 64 Years | 174 (15.3%) | 301 (26.3%) |
| 65 to 74 Years | 42 (23.3%) | 194 (62.0%) |
| 75 Years and over | 108 (67.1%) | 99 (69.7%) |
Disability Class by Sex by Age in Rockville
Disability Class: Hearing Difficulty
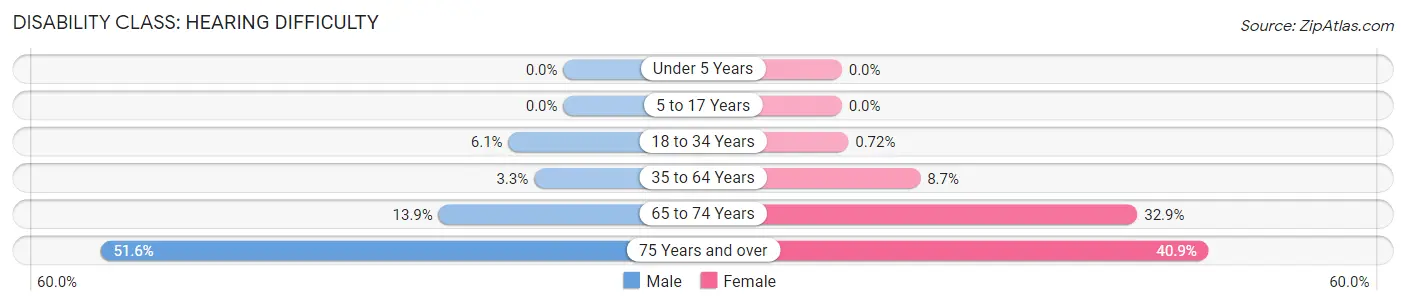
| Age Bracket | Male | Female |
| Under 5 Years | 0 (0.0%) | 0 (0.0%) |
| 5 to 17 Years | 0 (0.0%) | 0 (0.0%) |
| 18 to 34 Years | 65 (6.1%) | 9 (0.7%) |
| 35 to 64 Years | 37 (3.3%) | 100 (8.7%) |
| 65 to 74 Years | 25 (13.9%) | 103 (32.9%) |
| 75 Years and over | 83 (51.5%) | 58 (40.8%) |
Disability Class: Vision Difficulty
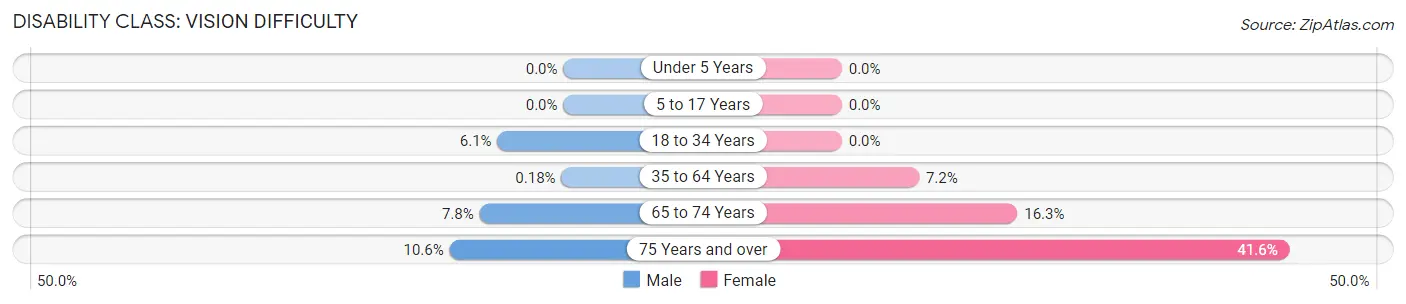
| Age Bracket | Male | Female |
| Under 5 Years | 0 (0.0%) | 0 (0.0%) |
| 5 to 17 Years | 0 (0.0%) | 0 (0.0%) |
| 18 to 34 Years | 65 (6.1%) | 0 (0.0%) |
| 35 to 64 Years | 2 (0.2%) | 82 (7.2%) |
| 65 to 74 Years | 14 (7.8%) | 51 (16.3%) |
| 75 Years and over | 17 (10.6%) | 59 (41.5%) |
Disability Class: Cognitive Difficulty
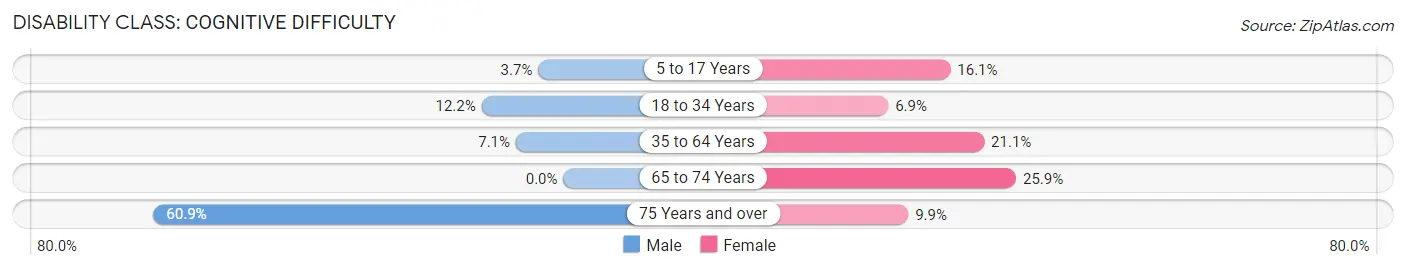
| Age Bracket | Male | Female |
| 5 to 17 Years | 18 (3.7%) | 78 (16.1%) |
| 18 to 34 Years | 129 (12.1%) | 86 (6.9%) |
| 35 to 64 Years | 80 (7.0%) | 242 (21.1%) |
| 65 to 74 Years | 0 (0.0%) | 81 (25.9%) |
| 75 Years and over | 98 (60.9%) | 14 (9.9%) |
Disability Class: Ambulatory Difficulty
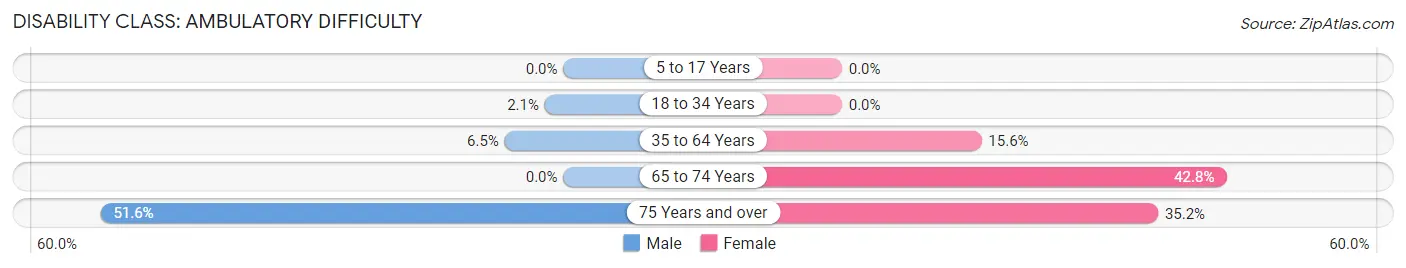
| Age Bracket | Male | Female |
| 5 to 17 Years | 0 (0.0%) | 0 (0.0%) |
| 18 to 34 Years | 22 (2.1%) | 0 (0.0%) |
| 35 to 64 Years | 74 (6.5%) | 178 (15.5%) |
| 65 to 74 Years | 0 (0.0%) | 134 (42.8%) |
| 75 Years and over | 83 (51.5%) | 50 (35.2%) |
Disability Class: Self-Care Difficulty
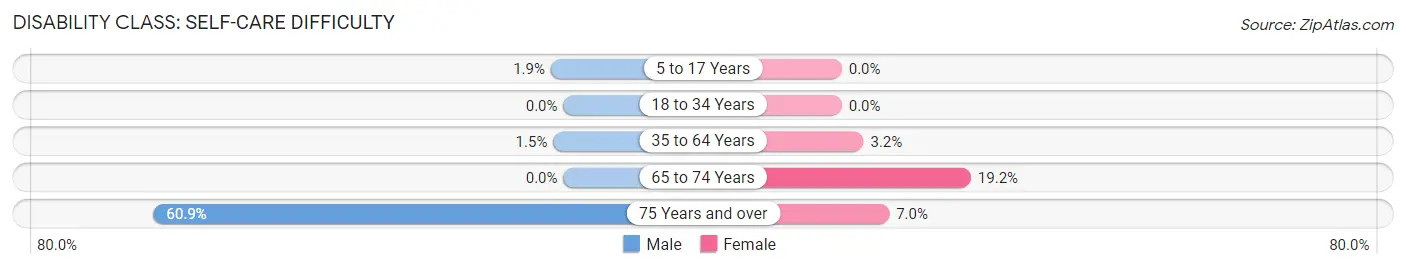
| Age Bracket | Male | Female |
| 5 to 17 Years | 9 (1.9%) | 0 (0.0%) |
| 18 to 34 Years | 0 (0.0%) | 0 (0.0%) |
| 35 to 64 Years | 17 (1.5%) | 37 (3.2%) |
| 65 to 74 Years | 0 (0.0%) | 60 (19.2%) |
| 75 Years and over | 98 (60.9%) | 10 (7.0%) |
Technology Access in Rockville
Computing Device Access in Rockville
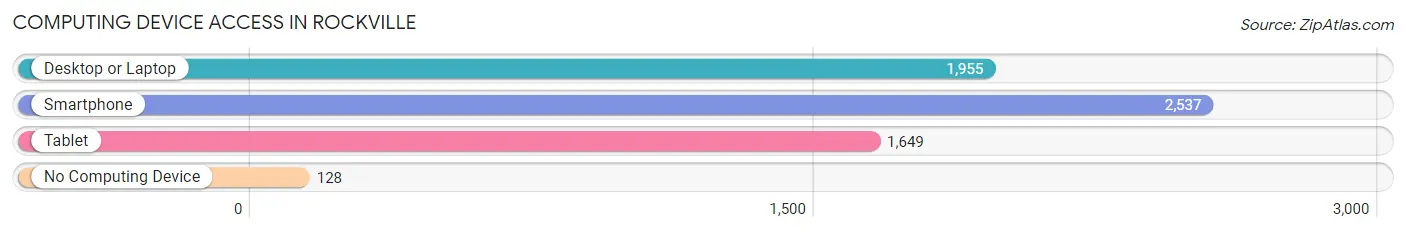
| Device Type | # Households | % Households |
| Desktop or Laptop | 1,955 | 69.1% |
| Smartphone | 2,537 | 89.7% |
| Tablet | 1,649 | 58.3% |
| No Computing Device | 128 | 4.5% |
| Total | 2,828 | 100.0% |
Internet Access in Rockville
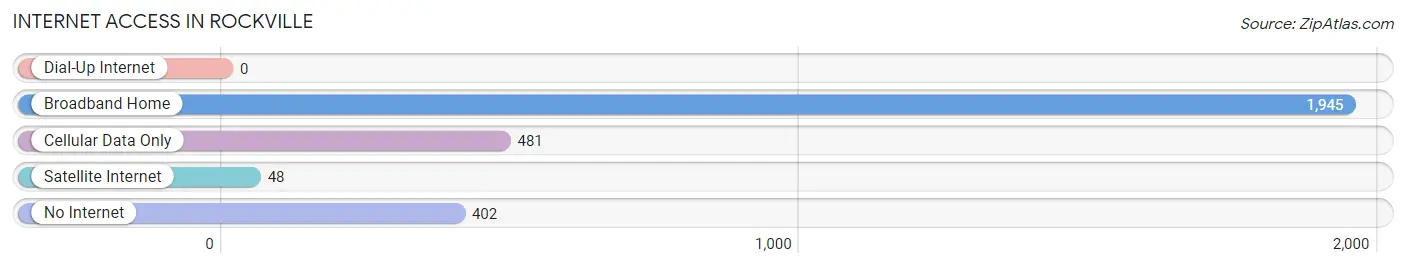
| Internet Type | # Households | % Households |
| Dial-Up Internet | 0 | 0.0% |
| Broadband Home | 1,945 | 68.8% |
| Cellular Data Only | 481 | 17.0% |
| Satellite Internet | 48 | 1.7% |
| No Internet | 402 | 14.2% |
| Total | 2,828 | 100.0% |
Rockville Summary
Rockville is a town located in Tolland County, Connecticut, United States. The population was 7,474 at the 2010 census. It is primarily a residential suburb of Hartford, Connecticut, and is part of the Hartford-West Hartford-East Hartford metropolitan statistical area.
History
Rockville was originally part of the town of Vernon, which was incorporated in October 1808. In October 1867, the town of Rockville was incorporated from the western part of Vernon. The town was named after the rocky ledges that line the banks of the Tankerhoosen River, which runs through the center of town.
Geography
Rockville is located in the eastern part of Tolland County, Connecticut. It is bordered by the towns of Bolton to the north, Vernon to the east, Ellington to the south, and Manchester to the west. The town covers an area of 8.7 square miles and is located in the Connecticut River Valley.
The Tankerhoosen River runs through the center of town and is a tributary of the Connecticut River. The town is home to several parks, including Rockville Park, which features a playground, picnic area, and walking trails.
Economy
Rockville is primarily a residential suburb of Hartford, Connecticut. The town is home to several small businesses, including restaurants, retail stores, and professional services. The town is also home to several manufacturing companies, including Pratt & Whitney, a major aerospace manufacturer.
Demographics
As of the 2010 census, there were 7,474 people, 2,945 households, and 1,945 families residing in the town. The population density was 854.3 people per square mile. The racial makeup of the town was 92.2% White, 2.7% African American, 0.3% Native American, 2.2% Asian, 0.1% Pacific Islander, 1.2% from other races, and 1.4% from two or more races. Hispanic or Latino of any race were 4.2% of the population.
The median income for a household in the town was $68,945, and the median income for a family was $81,945. The per capita income for the town was $31,945. About 3.2% of families and 4.7% of the population were below the poverty line, including 5.3% of those under age 18 and 4.2% of those age 65 or over.
Common Questions
What is Per Capita Income in Rockville?
Per Capita income in Rockville is $26,387.
What is the Median Family Income in Rockville?
Median Family Income in Rockville is $66,088.
What is the Median Household income in Rockville?
Median Household Income in Rockville is $49,823.
What is Income or Wage Gap in Rockville?
Income or Wage Gap in Rockville is 33.3%.
Women in Rockville earn 66.7 cents for every dollar earned by a man.
What is Inequality or Gini Index in Rockville?
Inequality or Gini Index in Rockville is 0.43.
What is the Total Population of Rockville?
Total Population of Rockville is 6,951.
What is the Total Male Population of Rockville?
Total Male Population of Rockville is 3,354.
What is the Total Female Population of Rockville?
Total Female Population of Rockville is 3,597.
What is the Ratio of Males per 100 Females in Rockville?
There are 93.24 Males per 100 Females in Rockville.
What is the Ratio of Females per 100 Males in Rockville?
There are 107.25 Females per 100 Males in Rockville.
What is the Median Population Age in Rockville?
Median Population Age in Rockville is 32.5 Years.
What is the Average Family Size in Rockville
Average Family Size in Rockville is 3.0 People.
What is the Average Household Size in Rockville
Average Household Size in Rockville is 2.4 People.
How Large is the Labor Force in Rockville?
There are 3,481 People in the Labor Forcein in Rockville.
What is the Percentage of People in the Labor Force in Rockville?
63.0% of People are in the Labor Force in Rockville.
What is the Unemployment Rate in Rockville?
Unemployment Rate in Rockville is 11.3%.