Westbrook Center, CT Map & Demographics
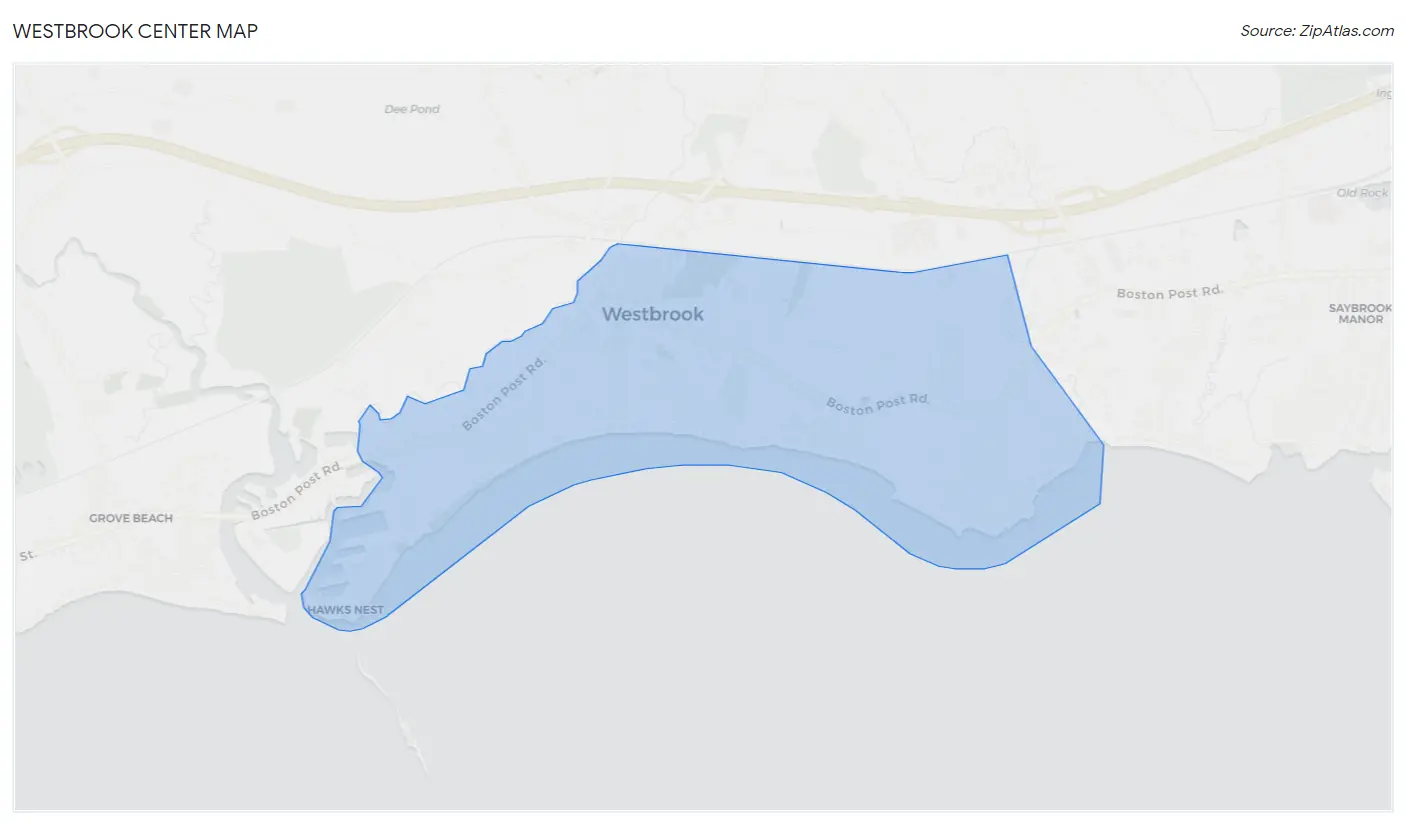
Westbrook Center Map
Westbrook Center Overview
$56,164
PER CAPITA INCOME
$136,184
AVG FAMILY INCOME
$69,544
AVG HOUSEHOLD INCOME
32.6%
WAGE / INCOME GAP [ % ]
67.4¢/ $1
WAGE / INCOME GAP [ $ ]
0.51
INEQUALITY / GINI INDEX
2,317
TOTAL POPULATION
1,270
MALE POPULATION
1,047
FEMALE POPULATION
121.30
MALES / 100 FEMALES
82.44
FEMALES / 100 MALES
51.2
MEDIAN AGE
2.5
AVG FAMILY SIZE
1.9
AVG HOUSEHOLD SIZE
1,352
LABOR FORCE [ PEOPLE ]
63.2%
PERCENT IN LABOR FORCE
3.6%
UNEMPLOYMENT RATE
Income in Westbrook Center
Income Overview in Westbrook Center
Per Capita Income in Westbrook Center is $56,164, while median incomes of families and households are $136,184 and $69,544 respectively.
| Characteristic | Number | Measure |
| Per Capita Income | 2,317 | $56,164 |
| Median Family Income | 618 | $136,184 |
| Mean Family Income | 618 | $161,175 |
| Median Household Income | 1,189 | $69,544 |
| Mean Household Income | 1,189 | $107,485 |
| Income Deficit | 618 | $0 |
| Wage / Income Gap (%) | 2,317 | 32.56% |
| Wage / Income Gap ($) | 2,317 | 67.44¢ per $1 |
| Gini / Inequality Index | 2,317 | 0.51 |
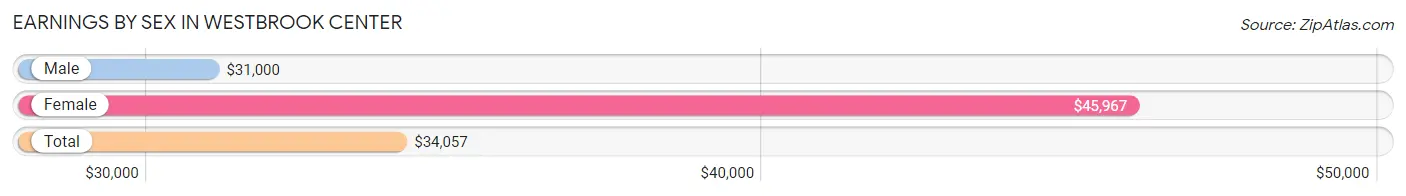
Earnings by Sex in Westbrook Center
Average Earnings in Westbrook Center are $34,057, $31,000 for men and $45,967 for women, a difference of 32.6%.
| Sex | Number | Average Earnings |
| Male | 792 (56.8%) | $31,000 |
| Female | 603 (43.2%) | $45,967 |
| Total | 1,395 (100.0%) | $34,057 |
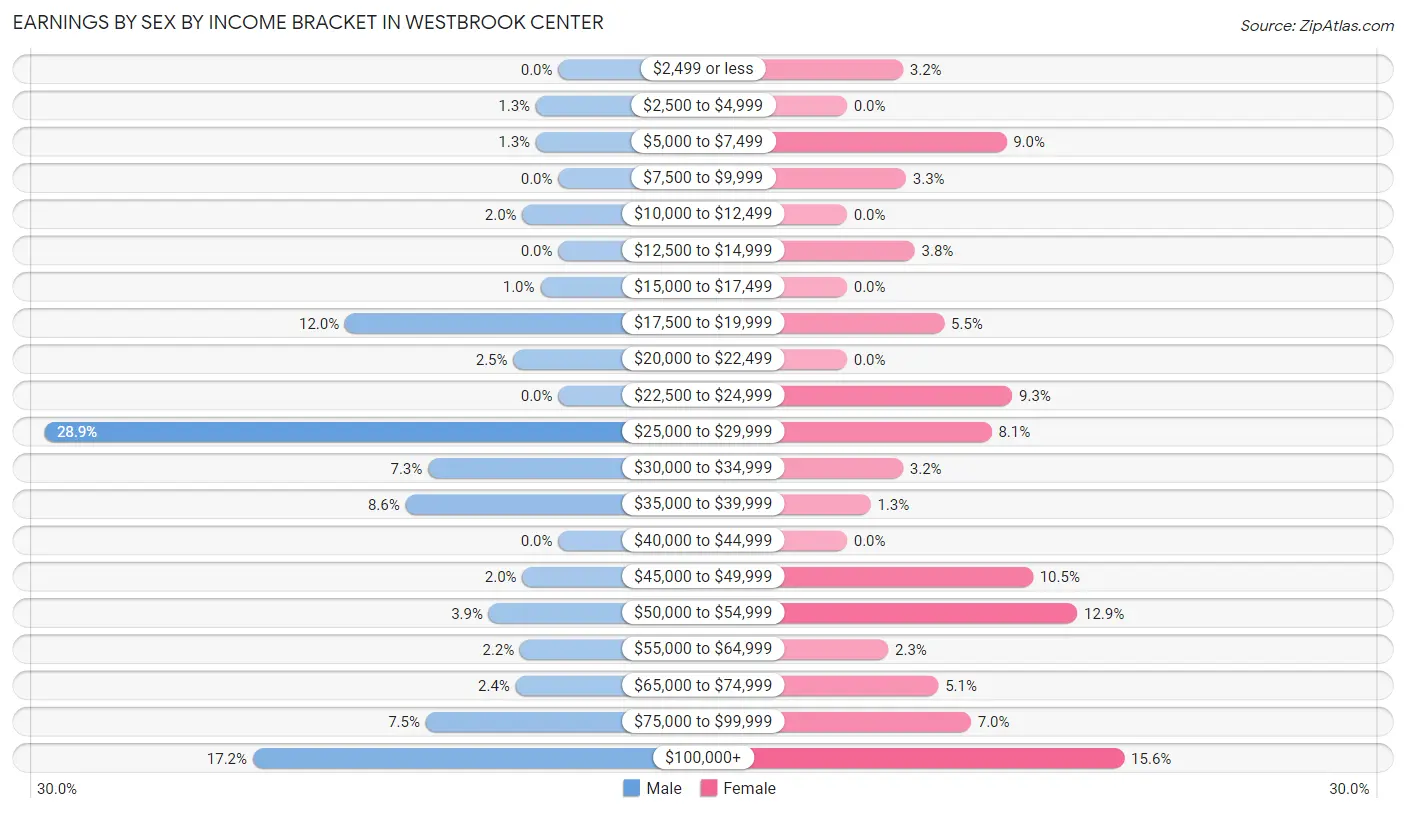
Earnings by Sex by Income Bracket in Westbrook Center
The most common earnings brackets in Westbrook Center are $25,000 to $29,999 for men (229 | 28.9%) and $100,000+ for women (94 | 15.6%).
| Income | Male | Female |
| $2,499 or less | 0 (0.0%) | 19 (3.2%) |
| $2,500 to $4,999 | 10 (1.3%) | 0 (0.0%) |
| $5,000 to $7,499 | 10 (1.3%) | 54 (9.0%) |
| $7,500 to $9,999 | 0 (0.0%) | 20 (3.3%) |
| $10,000 to $12,499 | 16 (2.0%) | 0 (0.0%) |
| $12,500 to $14,999 | 0 (0.0%) | 23 (3.8%) |
| $15,000 to $17,499 | 8 (1.0%) | 0 (0.0%) |
| $17,500 to $19,999 | 95 (12.0%) | 33 (5.5%) |
| $20,000 to $22,499 | 20 (2.5%) | 0 (0.0%) |
| $22,500 to $24,999 | 0 (0.0%) | 56 (9.3%) |
| $25,000 to $29,999 | 229 (28.9%) | 49 (8.1%) |
| $30,000 to $34,999 | 58 (7.3%) | 19 (3.2%) |
| $35,000 to $39,999 | 68 (8.6%) | 8 (1.3%) |
| $40,000 to $44,999 | 0 (0.0%) | 0 (0.0%) |
| $45,000 to $49,999 | 16 (2.0%) | 63 (10.4%) |
| $50,000 to $54,999 | 31 (3.9%) | 78 (12.9%) |
| $55,000 to $64,999 | 17 (2.1%) | 14 (2.3%) |
| $65,000 to $74,999 | 19 (2.4%) | 31 (5.1%) |
| $75,000 to $99,999 | 59 (7.4%) | 42 (7.0%) |
| $100,000+ | 136 (17.2%) | 94 (15.6%) |
| Total | 792 (100.0%) | 603 (100.0%) |
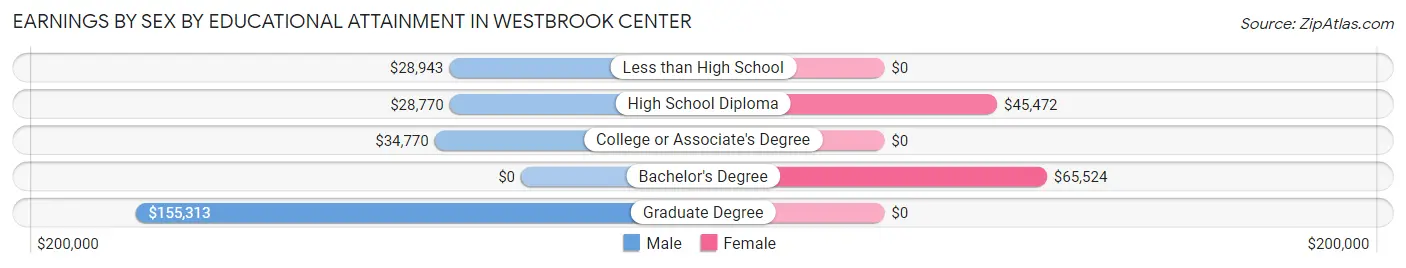
Earnings by Sex by Educational Attainment in Westbrook Center
Average earnings in Westbrook Center are $33,224 for men and $46,769 for women, a difference of 29.0%. Men with an educational attainment of graduate degree enjoy the highest average annual earnings of $155,313, while those with high school diploma education earn the least with $28,770. Women with an educational attainment of bachelor's degree earn the most with the average annual earnings of $65,524, while those with high school diploma education have the smallest earnings of $45,472.
| Educational Attainment | Male Income | Female Income |
| Less than High School | $28,943 | $0 |
| High School Diploma | $28,770 | $45,472 |
| College or Associate's Degree | $34,770 | $0 |
| Bachelor's Degree | - | - |
| Graduate Degree | $155,313 | $0 |
| Total | $33,224 | $46,769 |
Family Income in Westbrook Center
Family Income Brackets in Westbrook Center
According to the Westbrook Center family income data, there are 136 families falling into the $50,000 to $74,999 income range, which is the most common income bracket and makes up 22.0% of all families.
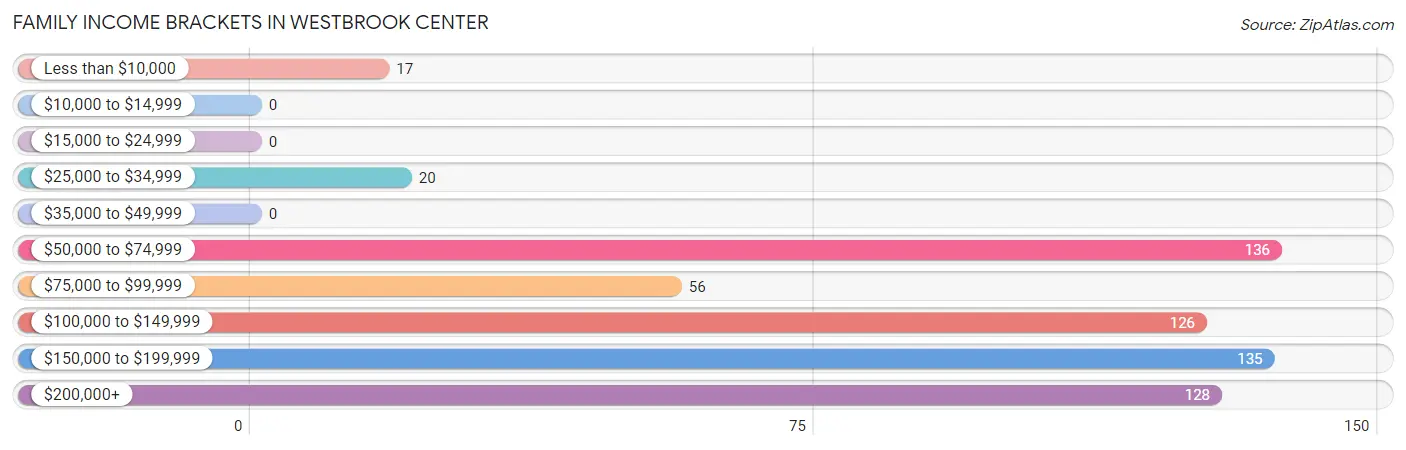
| Income Bracket | # Families | % Families |
| Less than $10,000 | 17 | 2.8% |
| $10,000 to $14,999 | 0 | 0.0% |
| $15,000 to $24,999 | 0 | 0.0% |
| $25,000 to $34,999 | 20 | 3.2% |
| $35,000 to $49,999 | 0 | 0.0% |
| $50,000 to $74,999 | 136 | 22.0% |
| $75,000 to $99,999 | 56 | 9.1% |
| $100,000 to $149,999 | 126 | 20.4% |
| $150,000 to $199,999 | 135 | 21.8% |
| $200,000+ | 128 | 20.7% |
Family Income by Famaliy Size in Westbrook Center
2-person families (422 | 68.3%) account for the highest median family income in Westbrook Center with $150,417 per family, while 2-person families (422 | 68.3%) have the highest median income of $75,208 per family member.
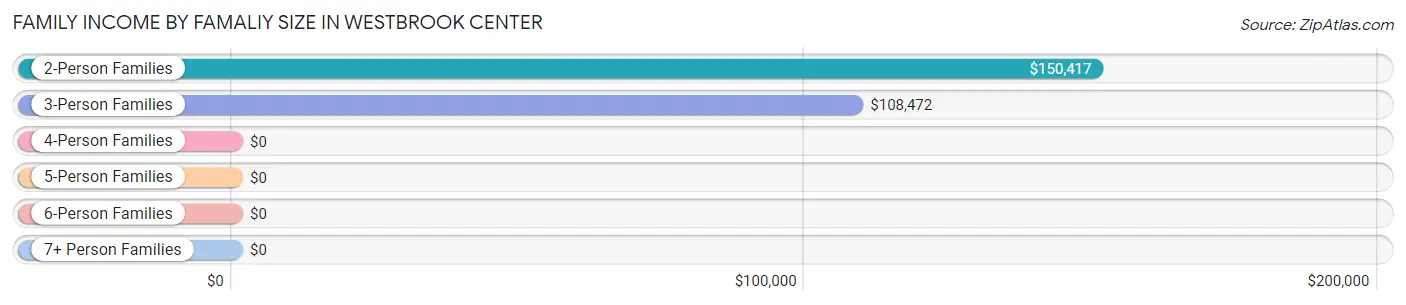
| Income Bracket | # Families | Median Income |
| 2-Person Families | 422 (68.3%) | $150,417 |
| 3-Person Families | 131 (21.2%) | $108,472 |
| 4-Person Families | 63 (10.2%) | $0 |
| 5-Person Families | 2 (0.3%) | $0 |
| 6-Person Families | 0 (0.0%) | $0 |
| 7+ Person Families | 0 (0.0%) | $0 |
| Total | 618 (100.0%) | $136,184 |
Family Income by Number of Earners in Westbrook Center
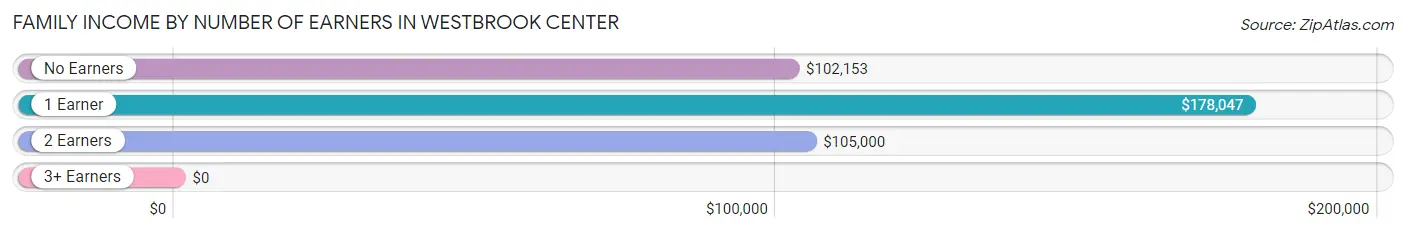
| Number of Earners | # Families | Median Income |
| No Earners | 125 (20.2%) | $102,153 |
| 1 Earner | 125 (20.2%) | $178,047 |
| 2 Earners | 352 (57.0%) | $105,000 |
| 3+ Earners | 16 (2.6%) | $0 |
| Total | 618 (100.0%) | $136,184 |
Household Income in Westbrook Center
Household Income Brackets in Westbrook Center
With 218 households falling in the category, the $100,000 to $149,999 income range is the most frequent in Westbrook Center, accounting for 18.3% of all households. In contrast, only 26 households (2.2%) fall into the $10,000 to $14,999 income bracket, making it the least populous group.
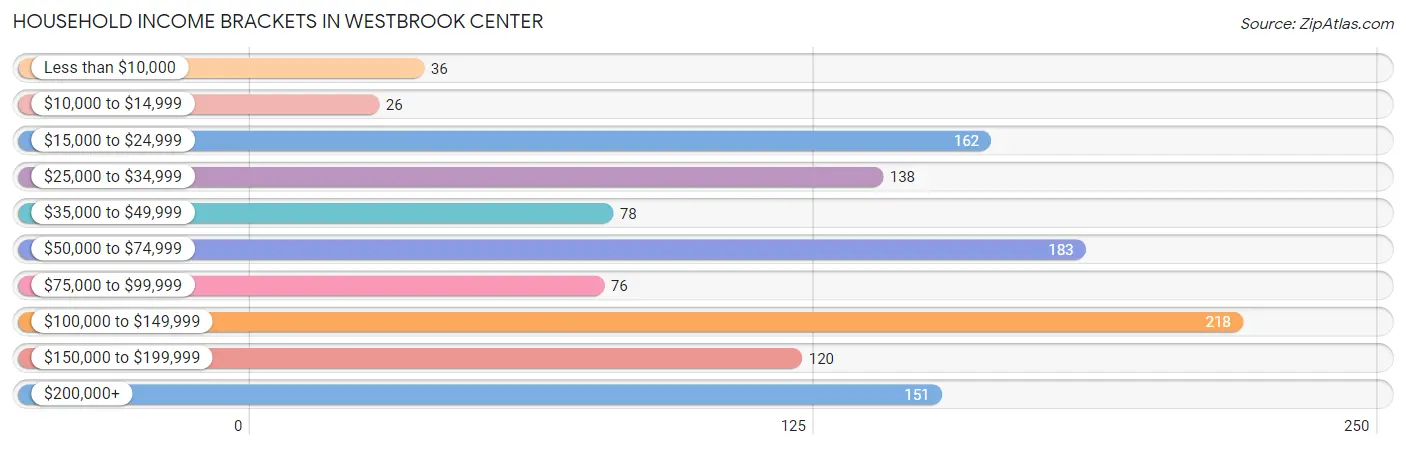
| Income Bracket | # Households | % Households |
| Less than $10,000 | 36 | 3.0% |
| $10,000 to $14,999 | 26 | 2.2% |
| $15,000 to $24,999 | 162 | 13.6% |
| $25,000 to $34,999 | 138 | 11.6% |
| $35,000 to $49,999 | 78 | 6.6% |
| $50,000 to $74,999 | 183 | 15.4% |
| $75,000 to $99,999 | 76 | 6.4% |
| $100,000 to $149,999 | 218 | 18.3% |
| $150,000 to $199,999 | 120 | 10.1% |
| $200,000+ | 151 | 12.7% |
Household Income by Householder Age in Westbrook Center
The median household income in Westbrook Center is $69,544, with the highest median household income of $101,779 found in the 65+ years age bracket for the primary householder. A total of 434 households (36.5%) fall into this category. Meanwhile, the 15 to 24 years age bracket for the primary householder has the lowest median household income of $0, with 36 households (3.0%) in this group.
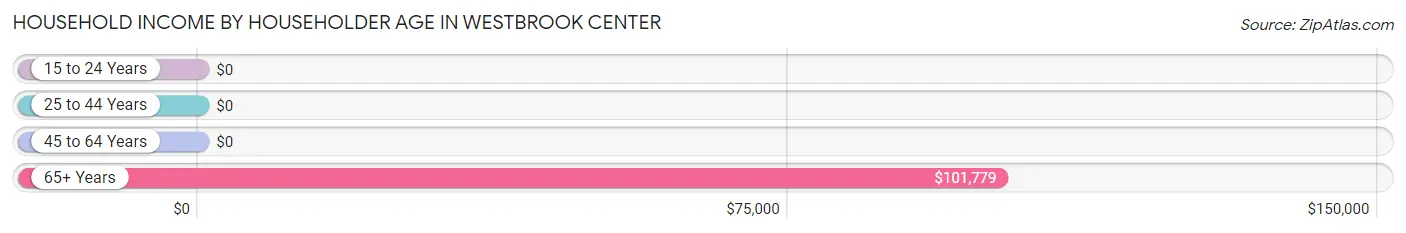
| Income Bracket | # Households | Median Income |
| 15 to 24 Years | 36 (3.0%) | $0 |
| 25 to 44 Years | 448 (37.7%) | $0 |
| 45 to 64 Years | 271 (22.8%) | $0 |
| 65+ Years | 434 (36.5%) | $101,779 |
| Total | 1,189 (100.0%) | $69,544 |
Poverty in Westbrook Center
Income Below Poverty by Sex and Age in Westbrook Center
With 8.4% poverty level for males and 1.7% for females among the residents of Westbrook Center, 35 to 44 year old males and 75 year old and over females are the most vulnerable to poverty, with 61 males (23.8%) and 17 females (13.5%) in their respective age groups living below the poverty level.
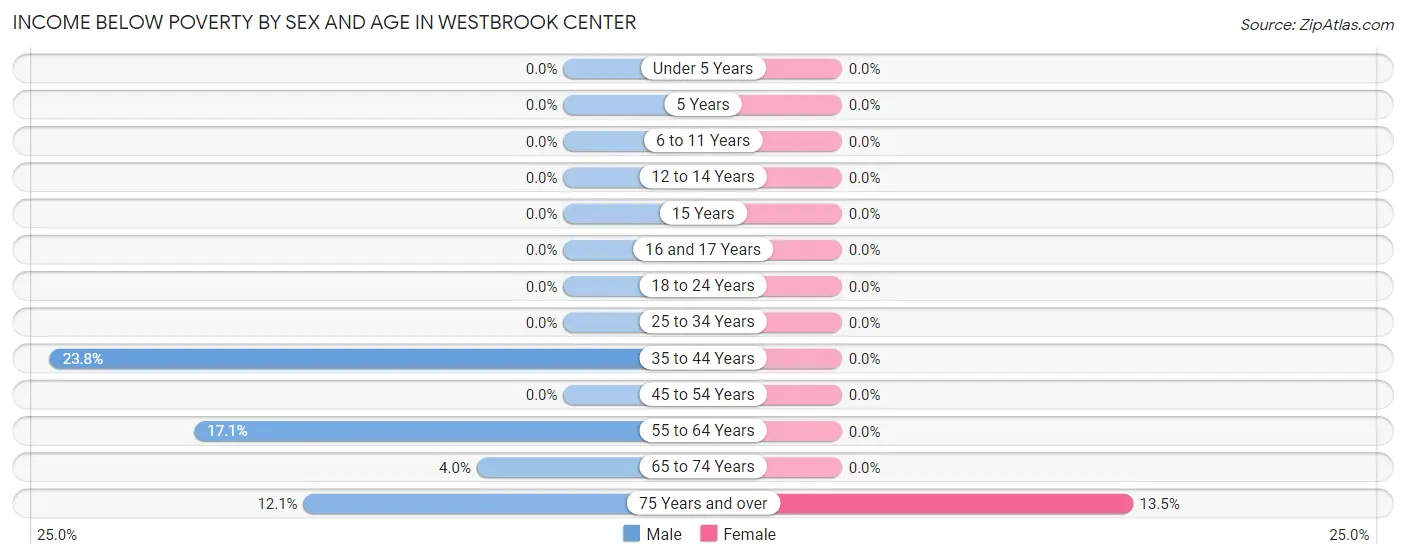
| Age Bracket | Male | Female |
| Under 5 Years | 0 (0.0%) | 0 (0.0%) |
| 5 Years | 0 (0.0%) | 0 (0.0%) |
| 6 to 11 Years | 0 (0.0%) | 0 (0.0%) |
| 12 to 14 Years | 0 (0.0%) | 0 (0.0%) |
| 15 Years | 0 (0.0%) | 0 (0.0%) |
| 16 and 17 Years | 0 (0.0%) | 0 (0.0%) |
| 18 to 24 Years | 0 (0.0%) | 0 (0.0%) |
| 25 to 34 Years | 0 (0.0%) | 0 (0.0%) |
| 35 to 44 Years | 61 (23.8%) | 0 (0.0%) |
| 45 to 54 Years | 0 (0.0%) | 0 (0.0%) |
| 55 to 64 Years | 19 (17.1%) | 0 (0.0%) |
| 65 to 74 Years | 9 (4.0%) | 0 (0.0%) |
| 75 Years and over | 17 (12.1%) | 17 (13.5%) |
| Total | 106 (8.4%) | 17 (1.7%) |
Income Above Poverty by Sex and Age in Westbrook Center
According to the poverty statistics in Westbrook Center, males aged under 5 years and females aged 6 to 11 years are the age groups that are most secure financially, with 100.0% of males and 100.0% of females in these age groups living above the poverty line.
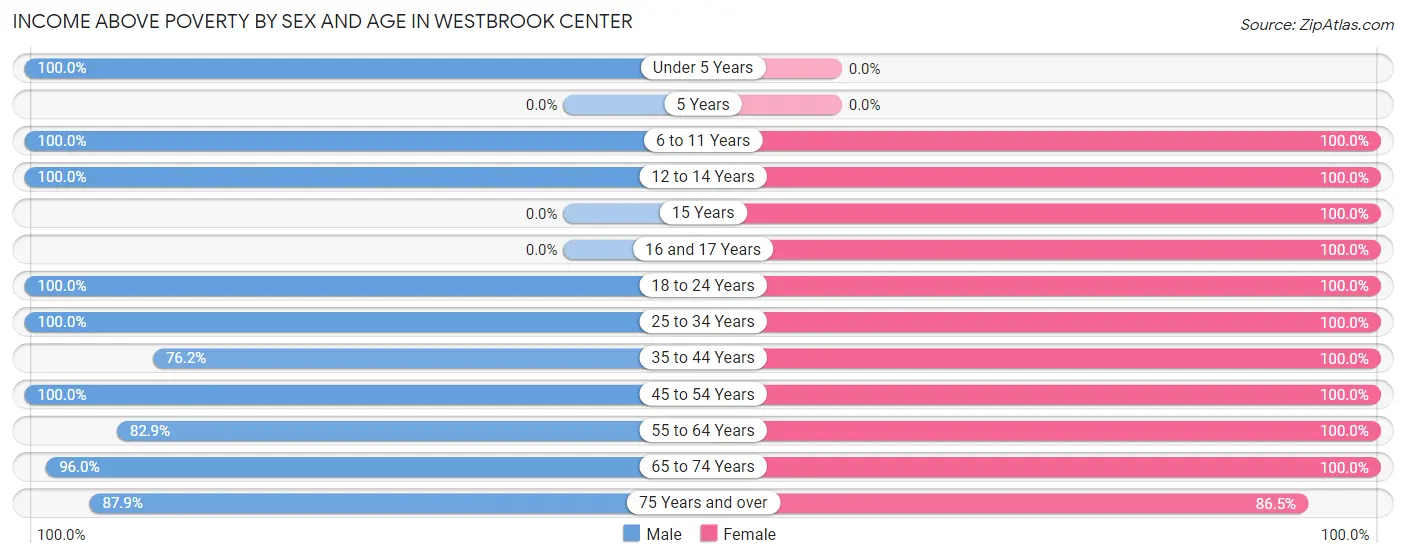
| Age Bracket | Male | Female |
| Under 5 Years | 33 (100.0%) | 0 (0.0%) |
| 5 Years | 0 (0.0%) | 0 (0.0%) |
| 6 to 11 Years | 40 (100.0%) | 36 (100.0%) |
| 12 to 14 Years | 5 (100.0%) | 54 (100.0%) |
| 15 Years | 0 (0.0%) | 10 (100.0%) |
| 16 and 17 Years | 0 (0.0%) | 2 (100.0%) |
| 18 to 24 Years | 46 (100.0%) | 44 (100.0%) |
| 25 to 34 Years | 340 (100.0%) | 158 (100.0%) |
| 35 to 44 Years | 195 (76.2%) | 33 (100.0%) |
| 45 to 54 Years | 68 (100.0%) | 125 (100.0%) |
| 55 to 64 Years | 92 (82.9%) | 153 (100.0%) |
| 65 to 74 Years | 215 (96.0%) | 291 (100.0%) |
| 75 Years and over | 124 (87.9%) | 109 (86.5%) |
| Total | 1,158 (91.6%) | 1,015 (98.4%) |
Income Below Poverty Among Married-Couple Families in Westbrook Center
The poverty statistics for married-couple families in Westbrook Center show that 3.9% or 17 of the total 433 families live below the poverty line. Families with no children have the highest poverty rate of 4.9%, comprising of 17 families. On the other hand, families with 1 or 2 children have the lowest poverty rate of 0.0%, which includes 0 families.
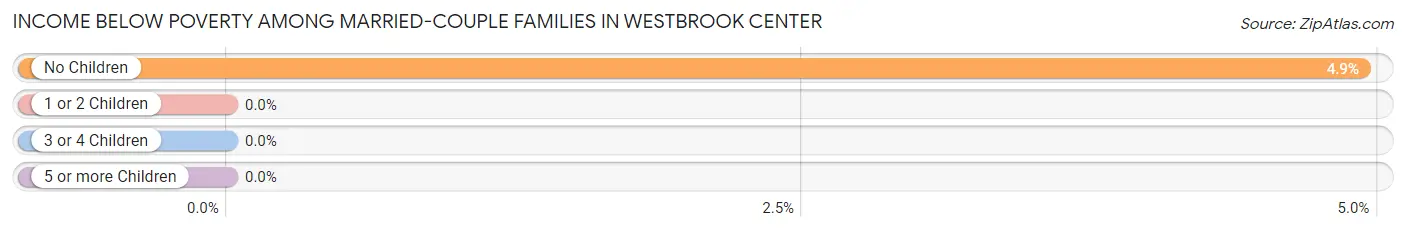
| Children | Above Poverty | Below Poverty |
| No Children | 328 (95.1%) | 17 (4.9%) |
| 1 or 2 Children | 86 (100.0%) | 0 (0.0%) |
| 3 or 4 Children | 2 (100.0%) | 0 (0.0%) |
| 5 or more Children | 0 (0.0%) | 0 (0.0%) |
| Total | 416 (96.1%) | 17 (3.9%) |
Income Below Poverty Among Single-Parent Households in Westbrook Center
| Children | Single Father | Single Mother |
| No Children | 0 (0.0%) | 0 (0.0%) |
| 1 or 2 Children | 0 (0.0%) | 0 (0.0%) |
| 3 or 4 Children | 0 (0.0%) | 0 (0.0%) |
| 5 or more Children | 0 (0.0%) | 0 (0.0%) |
| Total | 0 (0.0%) | 0 (0.0%) |
Income Below Poverty Among Married-Couple vs Single-Parent Households in Westbrook Center
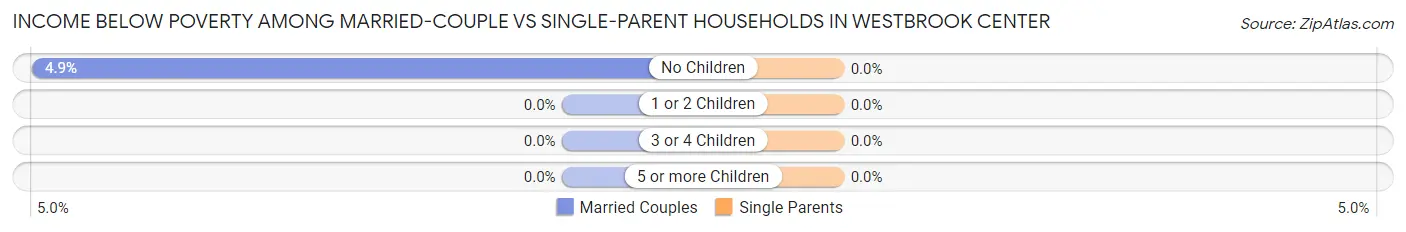
| Children | Married-Couple Families | Single-Parent Households |
| No Children | 17 (4.9%) | 0 (0.0%) |
| 1 or 2 Children | 0 (0.0%) | 0 (0.0%) |
| 3 or 4 Children | 0 (0.0%) | 0 (0.0%) |
| 5 or more Children | 0 (0.0%) | 0 (0.0%) |
| Total | 17 (3.9%) | 0 (0.0%) |
Race in Westbrook Center
The most populous races in Westbrook Center are White / Caucasian (1,676 | 72.3%), Two or more Races (462 | 19.9%), and Hispanic or Latino (312 | 13.5%).
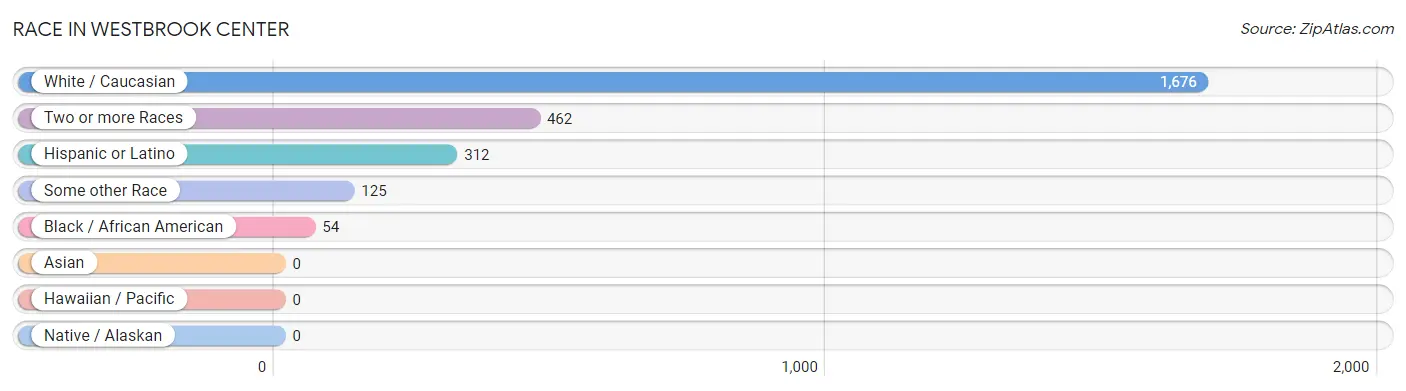
| Race | # Population | % Population |
| Asian | 0 | 0.0% |
| Black / African American | 54 | 2.3% |
| Hawaiian / Pacific | 0 | 0.0% |
| Hispanic or Latino | 312 | 13.5% |
| Native / Alaskan | 0 | 0.0% |
| White / Caucasian | 1,676 | 72.3% |
| Two or more Races | 462 | 19.9% |
| Some other Race | 125 | 5.4% |
| Total | 2,317 | 100.0% |
Ancestry in Westbrook Center
The most populous ancestries reported in Westbrook Center are Irish (390 | 16.8%), Italian (368 | 15.9%), Central American (242 | 10.4%), Brazilian (211 | 9.1%), and English (200 | 8.6%), together accounting for 60.9% of all Westbrook Center residents.
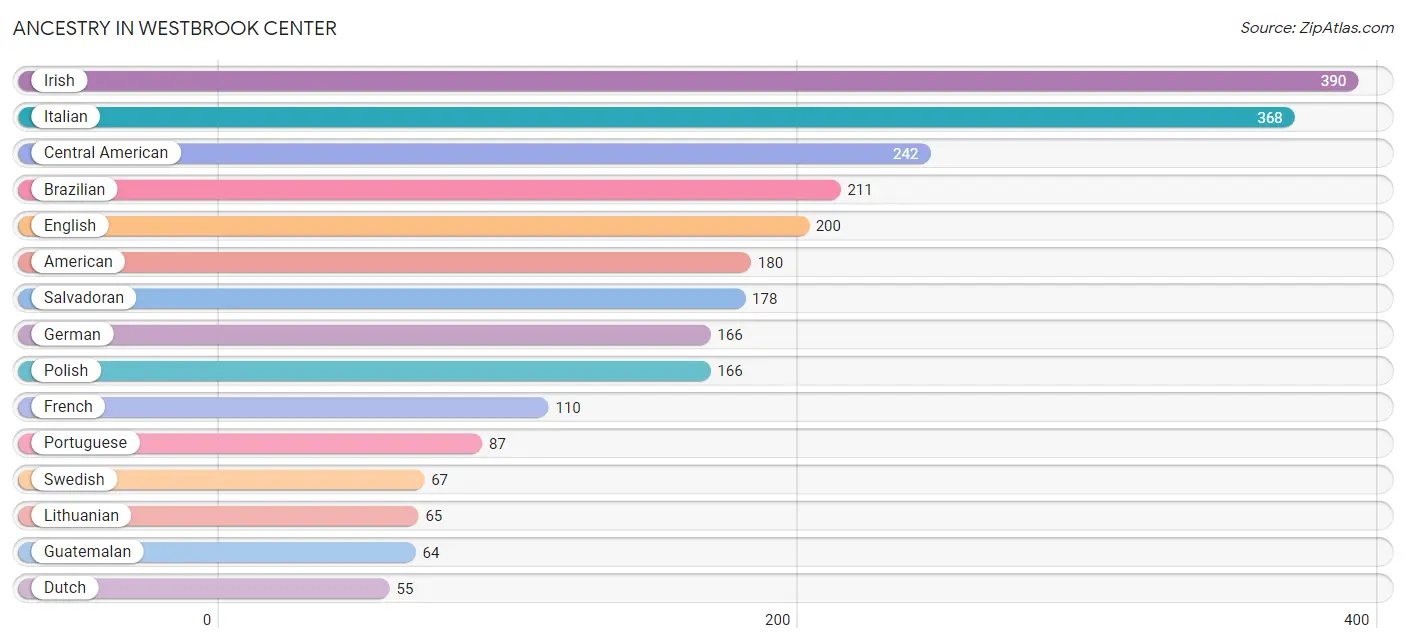
| Ancestry | # Population | % Population |
| American | 180 | 7.8% |
| Austrian | 12 | 0.5% |
| Blackfeet | 50 | 2.2% |
| Brazilian | 211 | 9.1% |
| Central American | 242 | 10.4% |
| Croatian | 11 | 0.5% |
| Danish | 24 | 1.0% |
| Dutch | 55 | 2.4% |
| Eastern European | 38 | 1.6% |
| English | 200 | 8.6% |
| European | 36 | 1.5% |
| French | 110 | 4.8% |
| French Canadian | 55 | 2.4% |
| German | 166 | 7.2% |
| Guatemalan | 64 | 2.8% |
| Irish | 390 | 16.8% |
| Italian | 368 | 15.9% |
| Lithuanian | 65 | 2.8% |
| Mexican | 37 | 1.6% |
| Polish | 166 | 7.2% |
| Portuguese | 87 | 3.7% |
| Romanian | 16 | 0.7% |
| Russian | 36 | 1.5% |
| Salvadoran | 178 | 7.7% |
| Scottish | 43 | 1.9% |
| South American | 7 | 0.3% |
| Swedish | 67 | 2.9% |
| Uruguayan | 7 | 0.3% | View All 28 Rows |
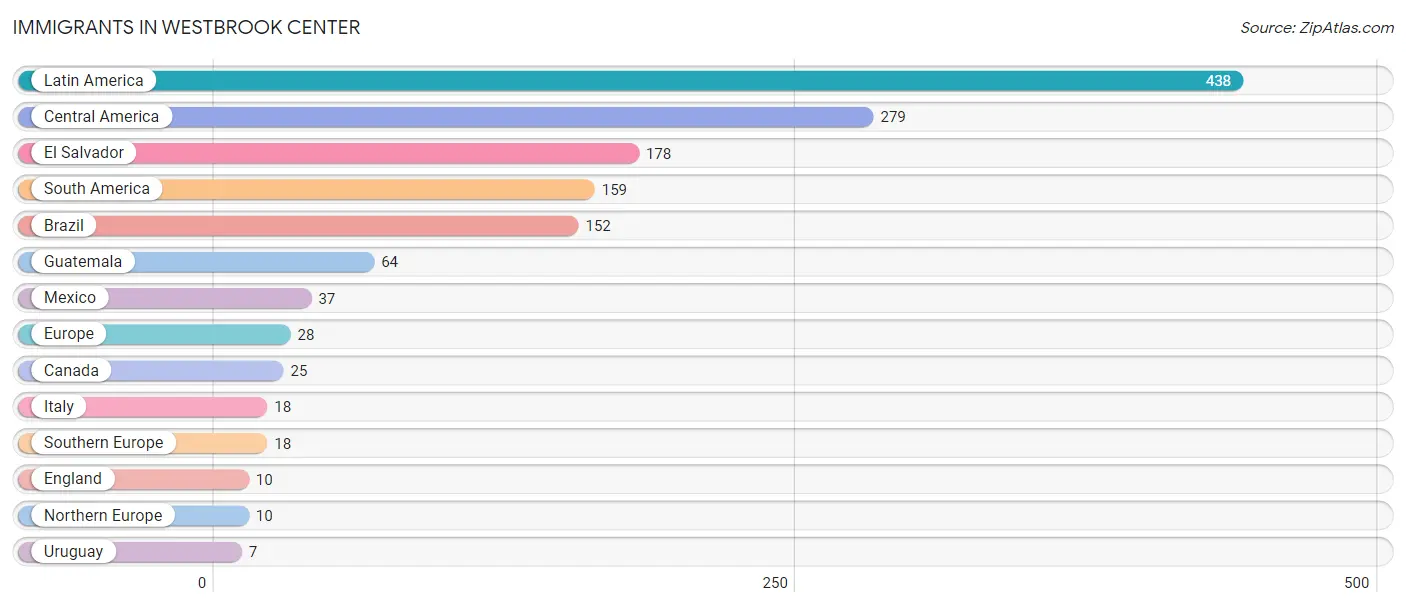
Immigrants in Westbrook Center
The most numerous immigrant groups reported in Westbrook Center came from Latin America (438 | 18.9%), Central America (279 | 12.0%), El Salvador (178 | 7.7%), South America (159 | 6.9%), and Brazil (152 | 6.6%), together accounting for 52.0% of all Westbrook Center residents.
| Immigration Origin | # Population | % Population |
| Brazil | 152 | 6.6% |
| Canada | 25 | 1.1% |
| Central America | 279 | 12.0% |
| El Salvador | 178 | 7.7% |
| England | 10 | 0.4% |
| Europe | 28 | 1.2% |
| Guatemala | 64 | 2.8% |
| Italy | 18 | 0.8% |
| Latin America | 438 | 18.9% |
| Mexico | 37 | 1.6% |
| Northern Europe | 10 | 0.4% |
| South America | 159 | 6.9% |
| Southern Europe | 18 | 0.8% |
| Uruguay | 7 | 0.3% | View All 14 Rows |
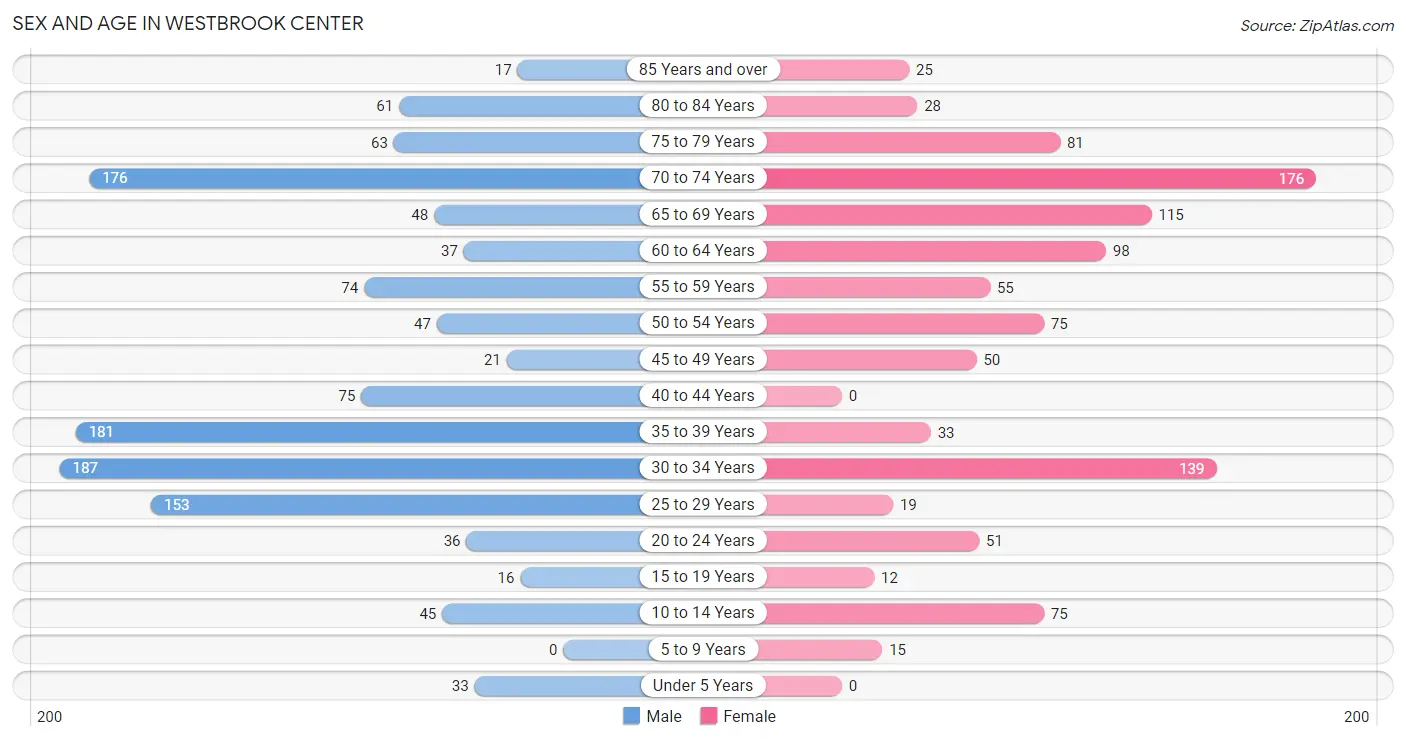
Sex and Age in Westbrook Center
Sex and Age in Westbrook Center
The most populous age groups in Westbrook Center are 30 to 34 Years (187 | 14.7%) for men and 70 to 74 Years (176 | 16.8%) for women.
| Age Bracket | Male | Female |
| Under 5 Years | 33 (2.6%) | 0 (0.0%) |
| 5 to 9 Years | 0 (0.0%) | 15 (1.4%) |
| 10 to 14 Years | 45 (3.5%) | 75 (7.2%) |
| 15 to 19 Years | 16 (1.3%) | 12 (1.1%) |
| 20 to 24 Years | 36 (2.8%) | 51 (4.9%) |
| 25 to 29 Years | 153 (12.0%) | 19 (1.8%) |
| 30 to 34 Years | 187 (14.7%) | 139 (13.3%) |
| 35 to 39 Years | 181 (14.2%) | 33 (3.2%) |
| 40 to 44 Years | 75 (5.9%) | 0 (0.0%) |
| 45 to 49 Years | 21 (1.7%) | 50 (4.8%) |
| 50 to 54 Years | 47 (3.7%) | 75 (7.2%) |
| 55 to 59 Years | 74 (5.8%) | 55 (5.2%) |
| 60 to 64 Years | 37 (2.9%) | 98 (9.4%) |
| 65 to 69 Years | 48 (3.8%) | 115 (11.0%) |
| 70 to 74 Years | 176 (13.9%) | 176 (16.8%) |
| 75 to 79 Years | 63 (5.0%) | 81 (7.7%) |
| 80 to 84 Years | 61 (4.8%) | 28 (2.7%) |
| 85 Years and over | 17 (1.3%) | 25 (2.4%) |
| Total | 1,270 (100.0%) | 1,047 (100.0%) |
Families and Households in Westbrook Center
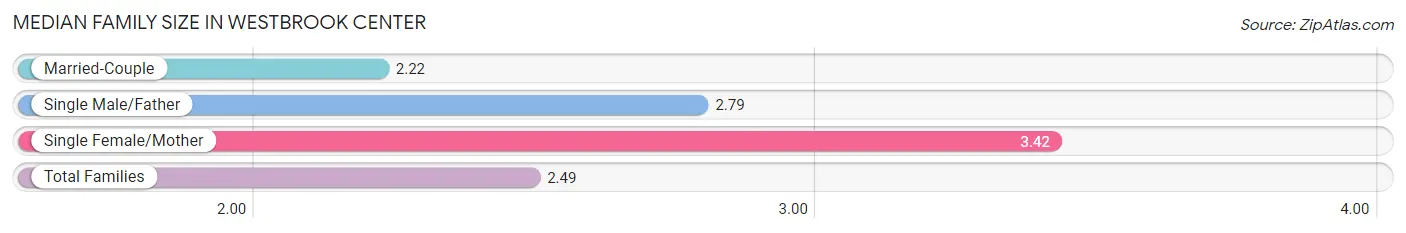
Median Family Size in Westbrook Center
The median family size in Westbrook Center is 2.49 persons per family, with single female/mother families (96 | 15.5%) accounting for the largest median family size of 3.42 persons per family. On the other hand, married-couple families (433 | 70.1%) represent the smallest median family size with 2.22 persons per family.
| Family Type | # Families | Family Size |
| Married-Couple | 433 (70.1%) | 2.22 |
| Single Male/Father | 89 (14.4%) | 2.79 |
| Single Female/Mother | 96 (15.5%) | 3.42 |
| Total Families | 618 (100.0%) | 2.49 |
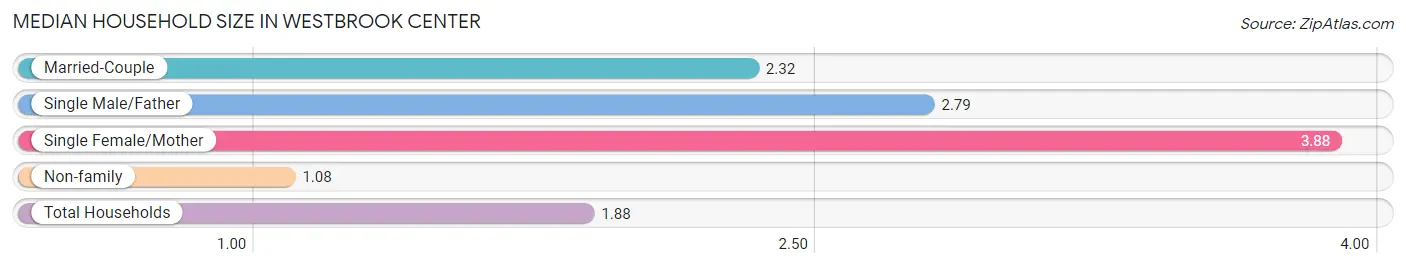
Median Household Size in Westbrook Center
The median household size in Westbrook Center is 1.88 persons per household, with single female/mother households (96 | 8.1%) accounting for the largest median household size of 3.88 persons per household. non-family households (571 | 48.0%) represent the smallest median household size with 1.08 persons per household.
| Household Type | # Households | Household Size |
| Married-Couple | 433 (36.4%) | 2.32 |
| Single Male/Father | 89 (7.5%) | 2.79 |
| Single Female/Mother | 96 (8.1%) | 3.88 |
| Non-family | 571 (48.0%) | 1.08 |
| Total Households | 1,189 (100.0%) | 1.88 |
Household Size by Marriage Status in Westbrook Center
Out of a total of 1,189 households in Westbrook Center, 618 (52.0%) are family households, while 571 (48.0%) are nonfamily households. The most numerous type of family households are 2-person households, comprising 390, and the most common type of nonfamily households are 1-person households, comprising 528.
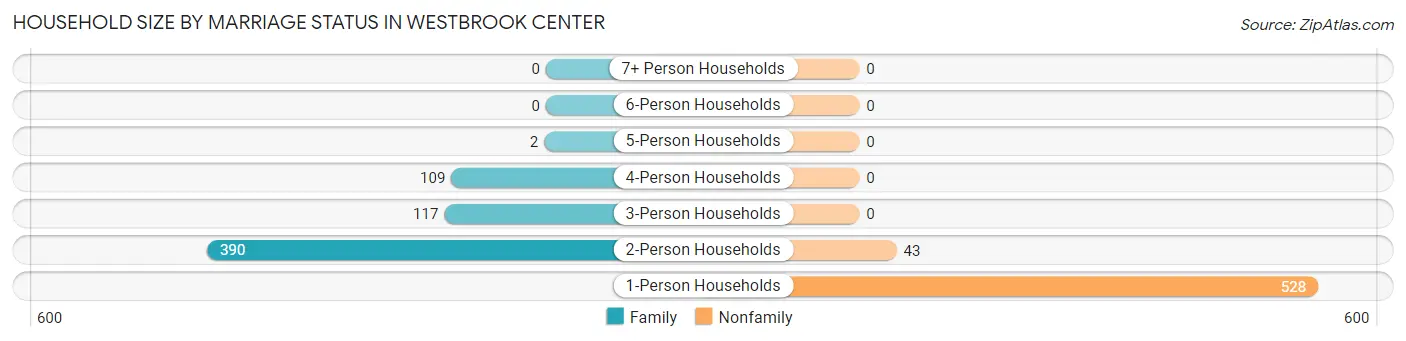
| Household Size | Family Households | Nonfamily Households |
| 1-Person Households | - | 528 (44.4%) |
| 2-Person Households | 390 (32.8%) | 43 (3.6%) |
| 3-Person Households | 117 (9.8%) | 0 (0.0%) |
| 4-Person Households | 109 (9.2%) | 0 (0.0%) |
| 5-Person Households | 2 (0.2%) | 0 (0.0%) |
| 6-Person Households | 0 (0.0%) | 0 (0.0%) |
| 7+ Person Households | 0 (0.0%) | 0 (0.0%) |
| Total | 618 (52.0%) | 571 (48.0%) |
Female Fertility in Westbrook Center
Fertility by Age in Westbrook Center
Average fertility rate in Westbrook Center is 63.0 births per 1,000 women. Women in the age bracket of 20 to 34 years have the highest fertility rate with 91.0 births per 1,000 women. Women in the age bracket of 20 to 34 years acount for 100.0% of all women with births.
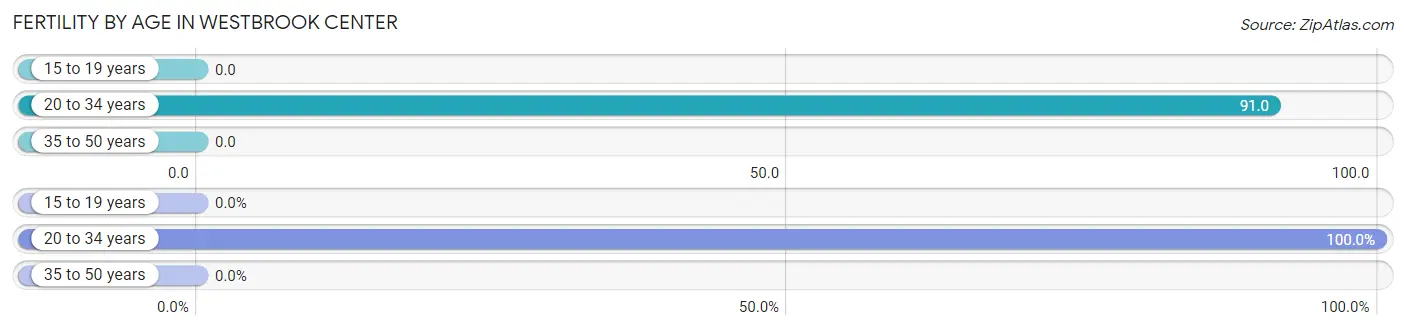
| Age Bracket | Women with Births | Births / 1,000 Women |
| 15 to 19 years | 0 (0.0%) | 0.0 |
| 20 to 34 years | 19 (100.0%) | 91.0 |
| 35 to 50 years | 0 (0.0%) | 0.0 |
| Total | 19 (100.0%) | 63.0 |
Fertility by Age by Marriage Status in Westbrook Center
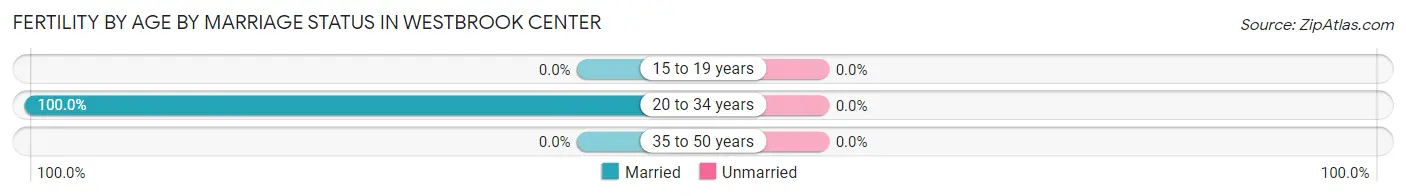
| Age Bracket | Married | Unmarried |
| 15 to 19 years | 0 (0.0%) | 0 (0.0%) |
| 20 to 34 years | 19 (100.0%) | 0 (0.0%) |
| 35 to 50 years | 0 (0.0%) | 0 (0.0%) |
| Total | 19 (100.0%) | 0 (0.0%) |
Fertility by Education in Westbrook Center
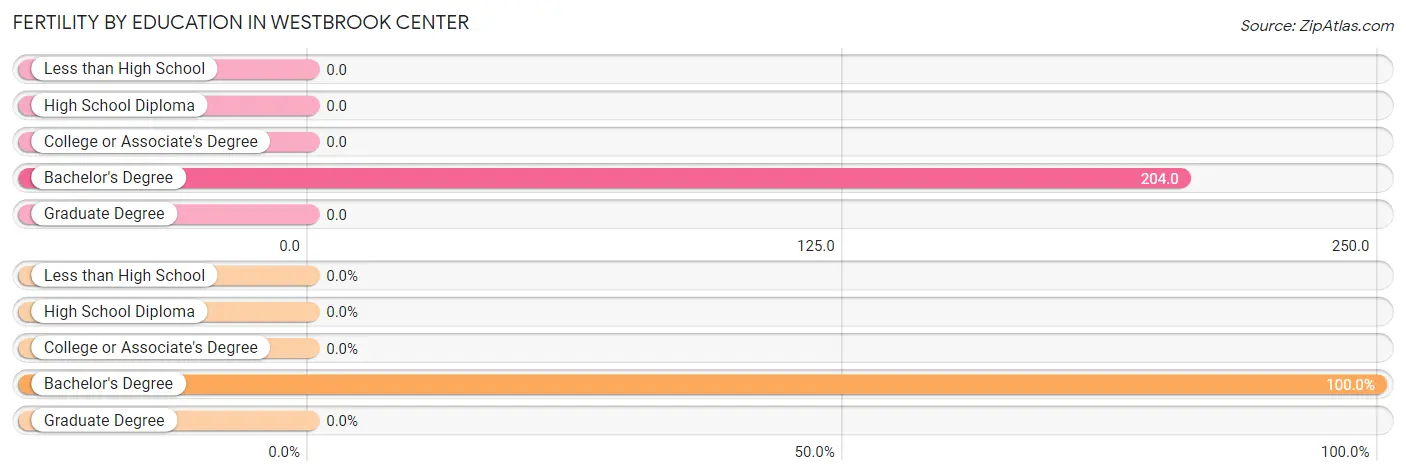
| Educational Attainment | Women with Births | Births / 1,000 Women |
| Less than High School | 0 (0.0%) | 0.0 |
| High School Diploma | 0 (0.0%) | 0.0 |
| College or Associate's Degree | 0 (0.0%) | 0.0 |
| Bachelor's Degree | 19 (100.0%) | 204.0 |
| Graduate Degree | 0 (0.0%) | 0.0 |
| Total | 19 (100.0%) | 63.0 |
Fertility by Education by Marriage Status in Westbrook Center
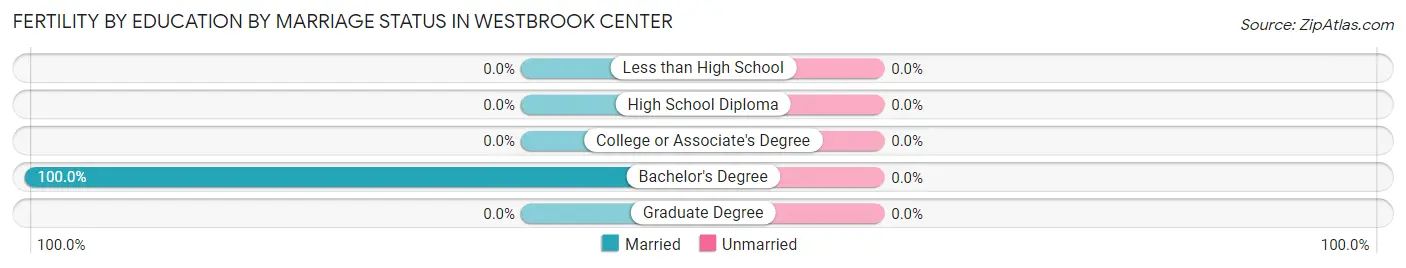
| Educational Attainment | Married | Unmarried |
| Less than High School | 0 (0.0%) | 0 (0.0%) |
| High School Diploma | 0 (0.0%) | 0 (0.0%) |
| College or Associate's Degree | 0 (0.0%) | 0 (0.0%) |
| Bachelor's Degree | 19 (100.0%) | 0 (0.0%) |
| Graduate Degree | 0 (0.0%) | 0 (0.0%) |
| Total | 19 (100.0%) | 0 (0.0%) |
Employment Characteristics in Westbrook Center
Employment by Class of Employer in Westbrook Center
Among the 1,270 employed individuals in Westbrook Center, private company employees (858 | 67.6%), not-for-profit organizations (130 | 10.2%), and self-employed (incorporated) (108 | 8.5%) make up the most common classes of employment.
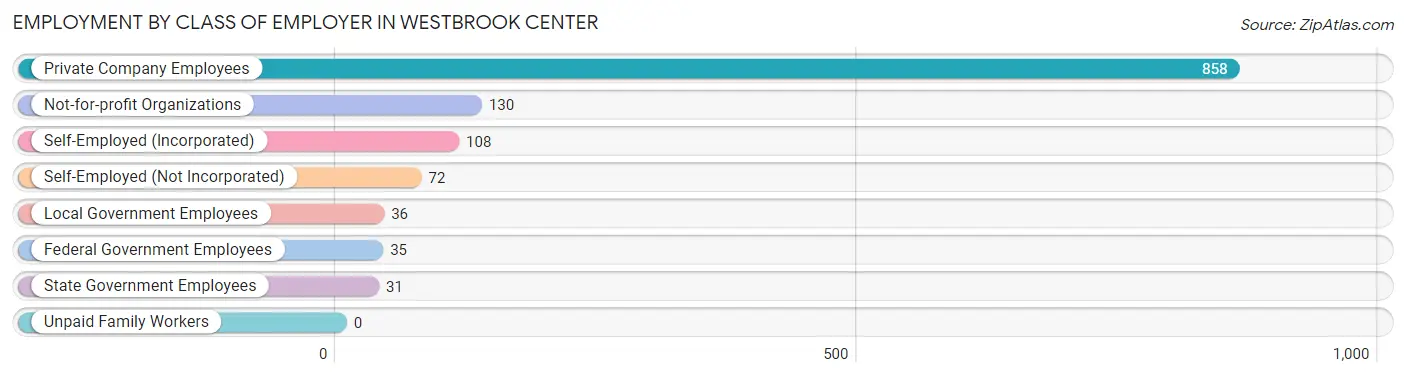
| Employer Class | # Employees | % Employees |
| Private Company Employees | 858 | 67.6% |
| Self-Employed (Incorporated) | 108 | 8.5% |
| Self-Employed (Not Incorporated) | 72 | 5.7% |
| Not-for-profit Organizations | 130 | 10.2% |
| Local Government Employees | 36 | 2.8% |
| State Government Employees | 31 | 2.4% |
| Federal Government Employees | 35 | 2.8% |
| Unpaid Family Workers | 0 | 0.0% |
| Total | 1,270 | 100.0% |
Employment Status by Age in Westbrook Center
According to the labor force statistics for Westbrook Center, out of the total population over 16 years of age (2,139), 63.2% or 1,352 individuals are in the labor force, with 3.6% or 49 of them unemployed. The age group with the highest labor force participation rate is 25 to 29 years, with 100.0% or 172 individuals in the labor force. Within the labor force, the 16 to 19 years age range has the highest percentage of unemployed individuals, with 100.0% or 10 of them being unemployed.
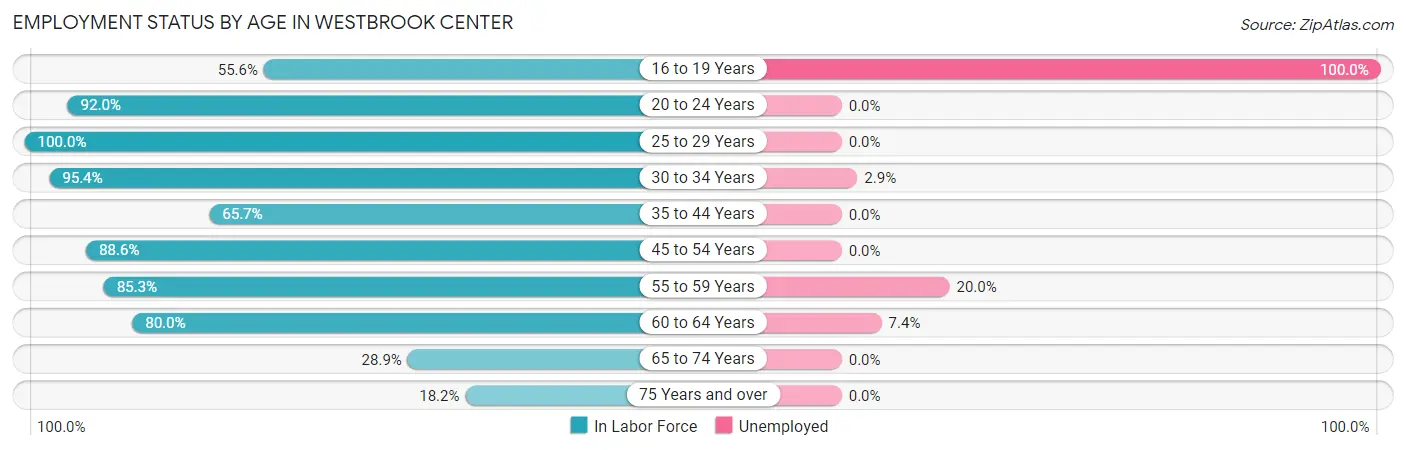
| Age Bracket | In Labor Force | Unemployed |
| 16 to 19 Years | 10 (55.6%) | 10 (100.0%) |
| 20 to 24 Years | 80 (92.0%) | 0 (0.0%) |
| 25 to 29 Years | 172 (100.0%) | 0 (0.0%) |
| 30 to 34 Years | 311 (95.4%) | 9 (2.9%) |
| 35 to 44 Years | 190 (65.7%) | 0 (0.0%) |
| 45 to 54 Years | 171 (88.6%) | 0 (0.0%) |
| 55 to 59 Years | 110 (85.3%) | 22 (20.0%) |
| 60 to 64 Years | 108 (80.0%) | 8 (7.4%) |
| 65 to 74 Years | 149 (28.9%) | 0 (0.0%) |
| 75 Years and over | 50 (18.2%) | 0 (0.0%) |
| Total | 1,352 (63.2%) | 49 (3.6%) |
Employment Status by Educational Attainment in Westbrook Center
According to labor force statistics for Westbrook Center, 85.4% of individuals (1,062) out of the total population between 25 and 64 years of age (1,244) are in the labor force, with 3.7% or 39 of them being unemployed. The group with the highest labor force participation rate are those with the educational attainment of college / associate degree, with 90.6% or 279 individuals in the labor force. Within the labor force, individuals with college / associate degree education have the highest percentage of unemployment, with 10.8% or 30 of them being unemployed.
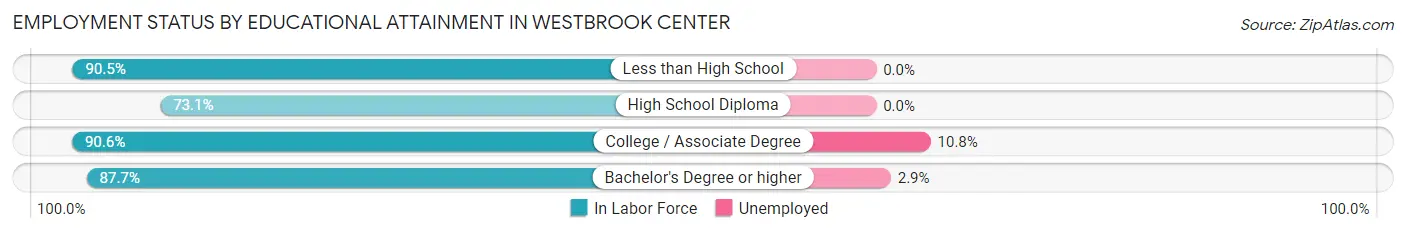
| Educational Attainment | In Labor Force | Unemployed |
| Less than High School | 247 (90.5%) | 0 (0.0%) |
| High School Diploma | 228 (73.1%) | 0 (0.0%) |
| College / Associate Degree | 279 (90.6%) | 33 (10.8%) |
| Bachelor's Degree or higher | 308 (87.7%) | 10 (2.9%) |
| Total | 1,062 (85.4%) | 46 (3.7%) |
Employment Occupations by Sex in Westbrook Center
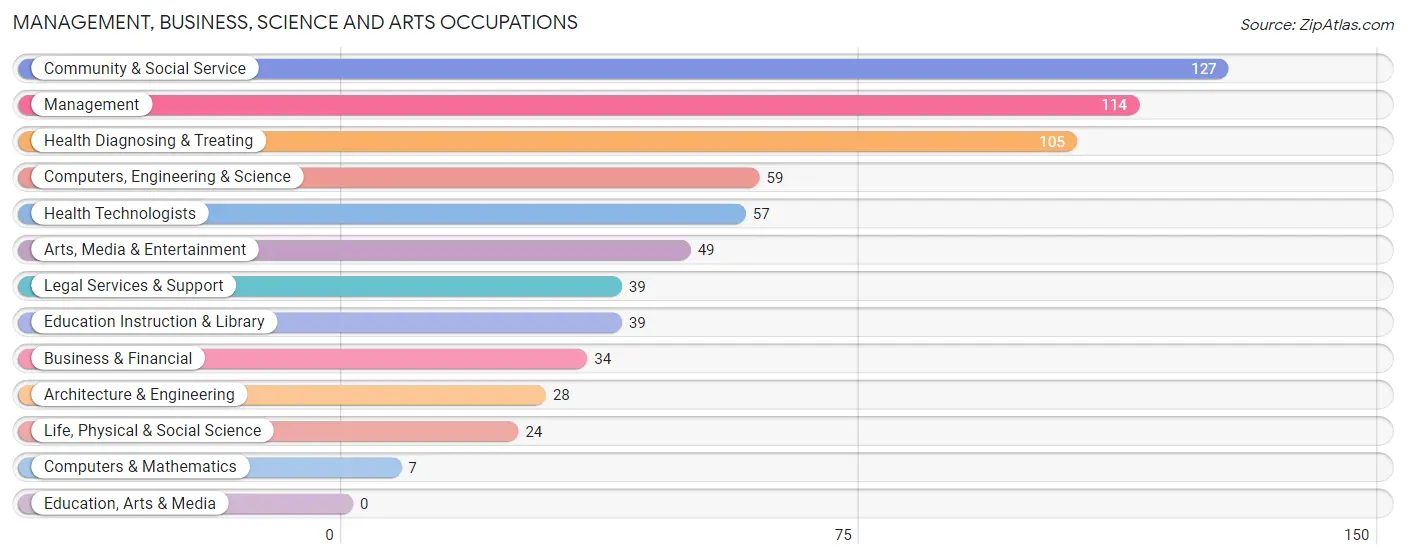
Management, Business, Science and Arts Occupations
The most common Management, Business, Science and Arts occupations in Westbrook Center are Community & Social Service (127 | 9.8%), Management (114 | 8.8%), Health Diagnosing & Treating (105 | 8.1%), Computers, Engineering & Science (59 | 4.5%), and Health Technologists (57 | 4.4%).
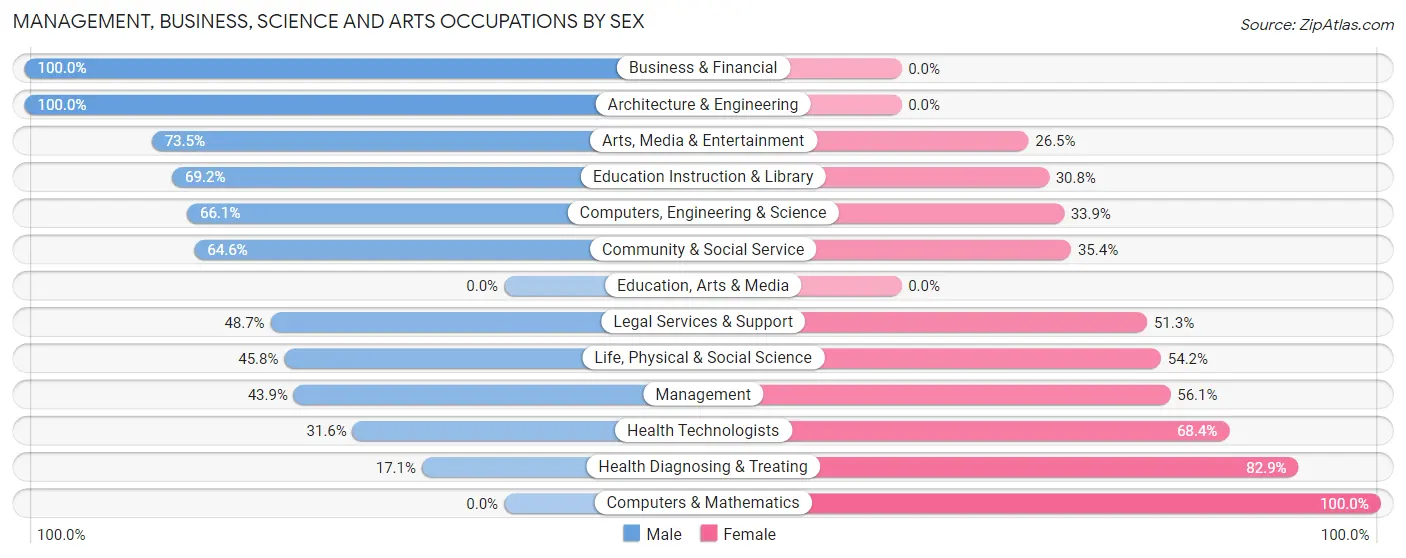
Management, Business, Science and Arts Occupations by Sex
Within the Management, Business, Science and Arts occupations in Westbrook Center, the most male-oriented occupations are Business & Financial (100.0%), Architecture & Engineering (100.0%), and Arts, Media & Entertainment (73.5%), while the most female-oriented occupations are Computers & Mathematics (100.0%), Health Diagnosing & Treating (82.9%), and Health Technologists (68.4%).
| Occupation | Male | Female |
| Management | 50 (43.9%) | 64 (56.1%) |
| Business & Financial | 34 (100.0%) | 0 (0.0%) |
| Computers, Engineering & Science | 39 (66.1%) | 20 (33.9%) |
| Computers & Mathematics | 0 (0.0%) | 7 (100.0%) |
| Architecture & Engineering | 28 (100.0%) | 0 (0.0%) |
| Life, Physical & Social Science | 11 (45.8%) | 13 (54.2%) |
| Community & Social Service | 82 (64.6%) | 45 (35.4%) |
| Education, Arts & Media | 0 (0.0%) | 0 (0.0%) |
| Legal Services & Support | 19 (48.7%) | 20 (51.3%) |
| Education Instruction & Library | 27 (69.2%) | 12 (30.8%) |
| Arts, Media & Entertainment | 36 (73.5%) | 13 (26.5%) |
| Health Diagnosing & Treating | 18 (17.1%) | 87 (82.9%) |
| Health Technologists | 18 (31.6%) | 39 (68.4%) |
| Total (Category) | 223 (50.8%) | 216 (49.2%) |
| Total (Overall) | 742 (57.0%) | 560 (43.0%) |
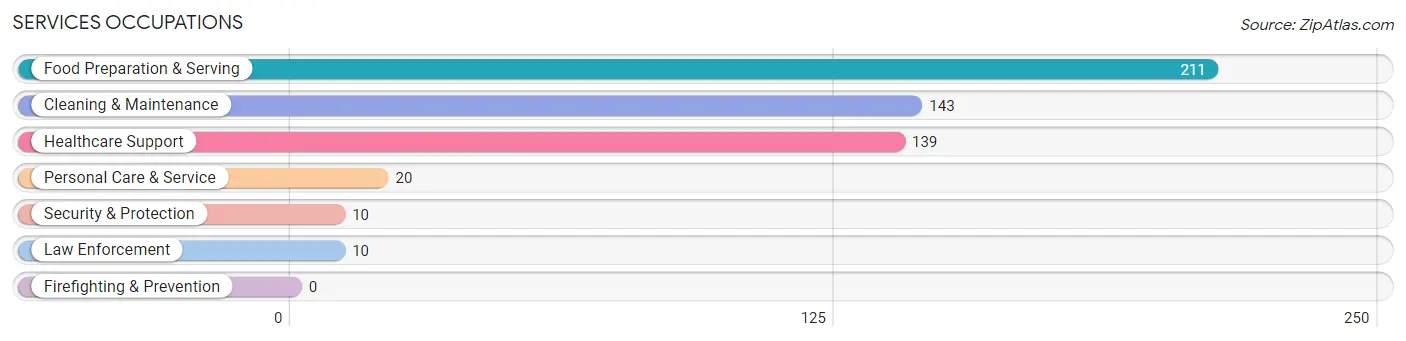
Services Occupations
The most common Services occupations in Westbrook Center are Food Preparation & Serving (211 | 16.2%), Cleaning & Maintenance (143 | 11.0%), Healthcare Support (139 | 10.7%), Personal Care & Service (20 | 1.5%), and Security & Protection (10 | 0.8%).
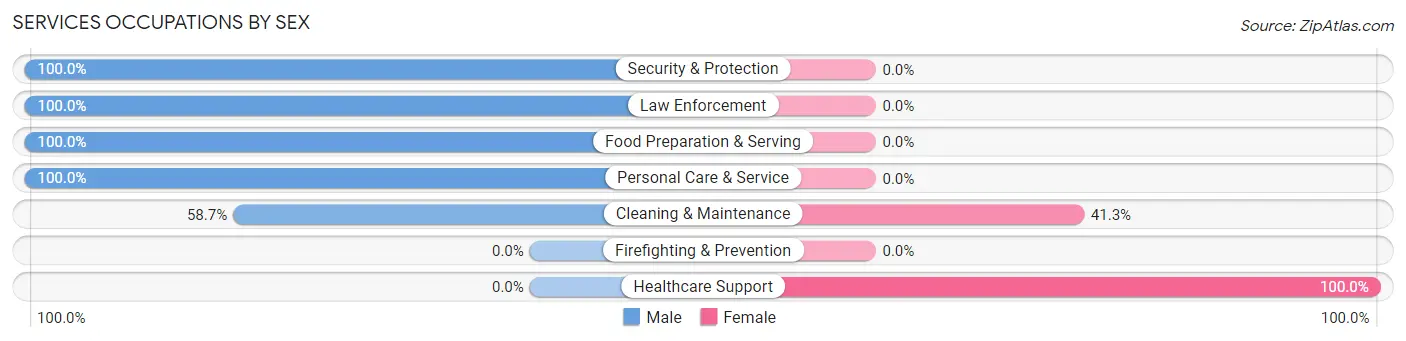
Services Occupations by Sex
Within the Services occupations in Westbrook Center, the most male-oriented occupations are Security & Protection (100.0%), Law Enforcement (100.0%), and Food Preparation & Serving (100.0%), while the most female-oriented occupations are Healthcare Support (100.0%), and Cleaning & Maintenance (41.3%).
| Occupation | Male | Female |
| Healthcare Support | 0 (0.0%) | 139 (100.0%) |
| Security & Protection | 10 (100.0%) | 0 (0.0%) |
| Firefighting & Prevention | 0 (0.0%) | 0 (0.0%) |
| Law Enforcement | 10 (100.0%) | 0 (0.0%) |
| Food Preparation & Serving | 211 (100.0%) | 0 (0.0%) |
| Cleaning & Maintenance | 84 (58.7%) | 59 (41.3%) |
| Personal Care & Service | 20 (100.0%) | 0 (0.0%) |
| Total (Category) | 325 (62.1%) | 198 (37.9%) |
| Total (Overall) | 742 (57.0%) | 560 (43.0%) |
Sales and Office Occupations
The most common Sales and Office occupations in Westbrook Center are Sales & Related (104 | 8.0%), and Office & Administration (90 | 6.9%).
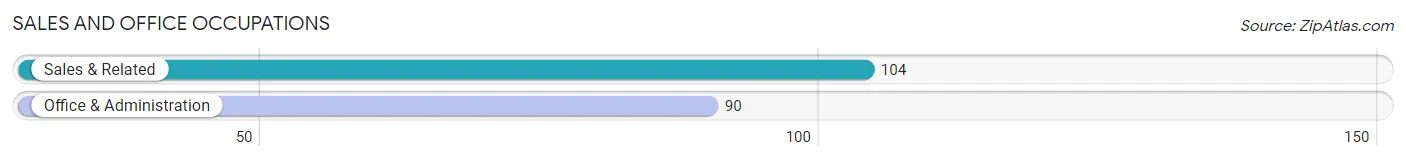
Sales and Office Occupations by Sex
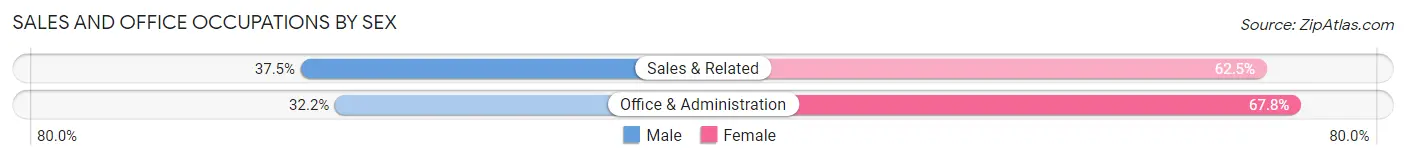
| Occupation | Male | Female |
| Sales & Related | 39 (37.5%) | 65 (62.5%) |
| Office & Administration | 29 (32.2%) | 61 (67.8%) |
| Total (Category) | 68 (35.0%) | 126 (64.9%) |
| Total (Overall) | 742 (57.0%) | 560 (43.0%) |
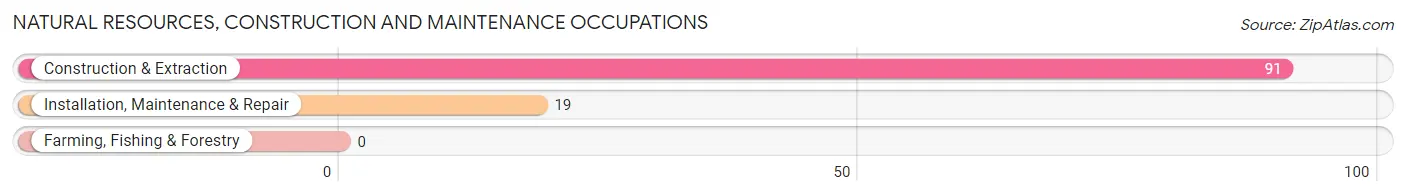
Natural Resources, Construction and Maintenance Occupations
The most common Natural Resources, Construction and Maintenance occupations in Westbrook Center are Construction & Extraction (91 | 7.0%), and Installation, Maintenance & Repair (19 | 1.5%).
Natural Resources, Construction and Maintenance Occupations by Sex
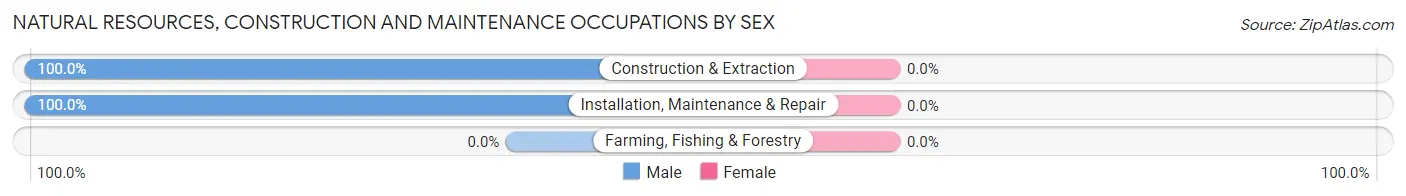
| Occupation | Male | Female |
| Farming, Fishing & Forestry | 0 (0.0%) | 0 (0.0%) |
| Construction & Extraction | 91 (100.0%) | 0 (0.0%) |
| Installation, Maintenance & Repair | 19 (100.0%) | 0 (0.0%) |
| Total (Category) | 110 (100.0%) | 0 (0.0%) |
| Total (Overall) | 742 (57.0%) | 560 (43.0%) |
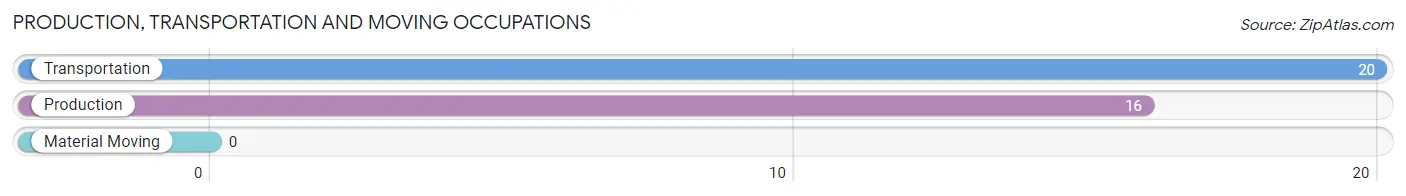
Production, Transportation and Moving Occupations
The most common Production, Transportation and Moving occupations in Westbrook Center are Transportation (20 | 1.5%), and Production (16 | 1.2%).
Production, Transportation and Moving Occupations by Sex
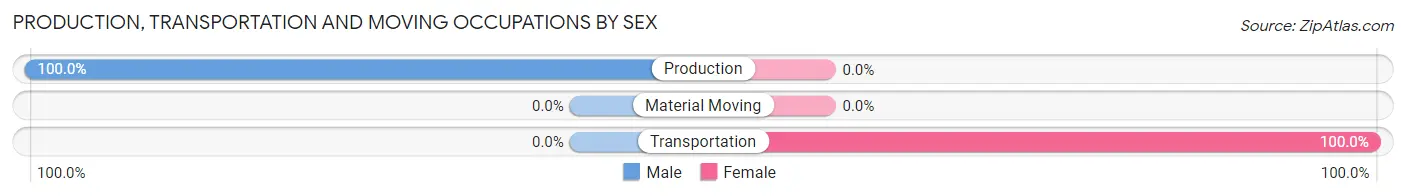
| Occupation | Male | Female |
| Production | 16 (100.0%) | 0 (0.0%) |
| Transportation | 0 (0.0%) | 20 (100.0%) |
| Material Moving | 0 (0.0%) | 0 (0.0%) |
| Total (Category) | 16 (44.4%) | 20 (55.6%) |
| Total (Overall) | 742 (57.0%) | 560 (43.0%) |
Employment Industries by Sex in Westbrook Center
Employment Industries in Westbrook Center
The major employment industries in Westbrook Center include Health Care & Social Assistance (286 | 22.0%), Accommodation & Food Services (237 | 18.2%), Construction (129 | 9.9%), Administrative & Support (122 | 9.4%), and Professional & Scientific (116 | 8.9%).

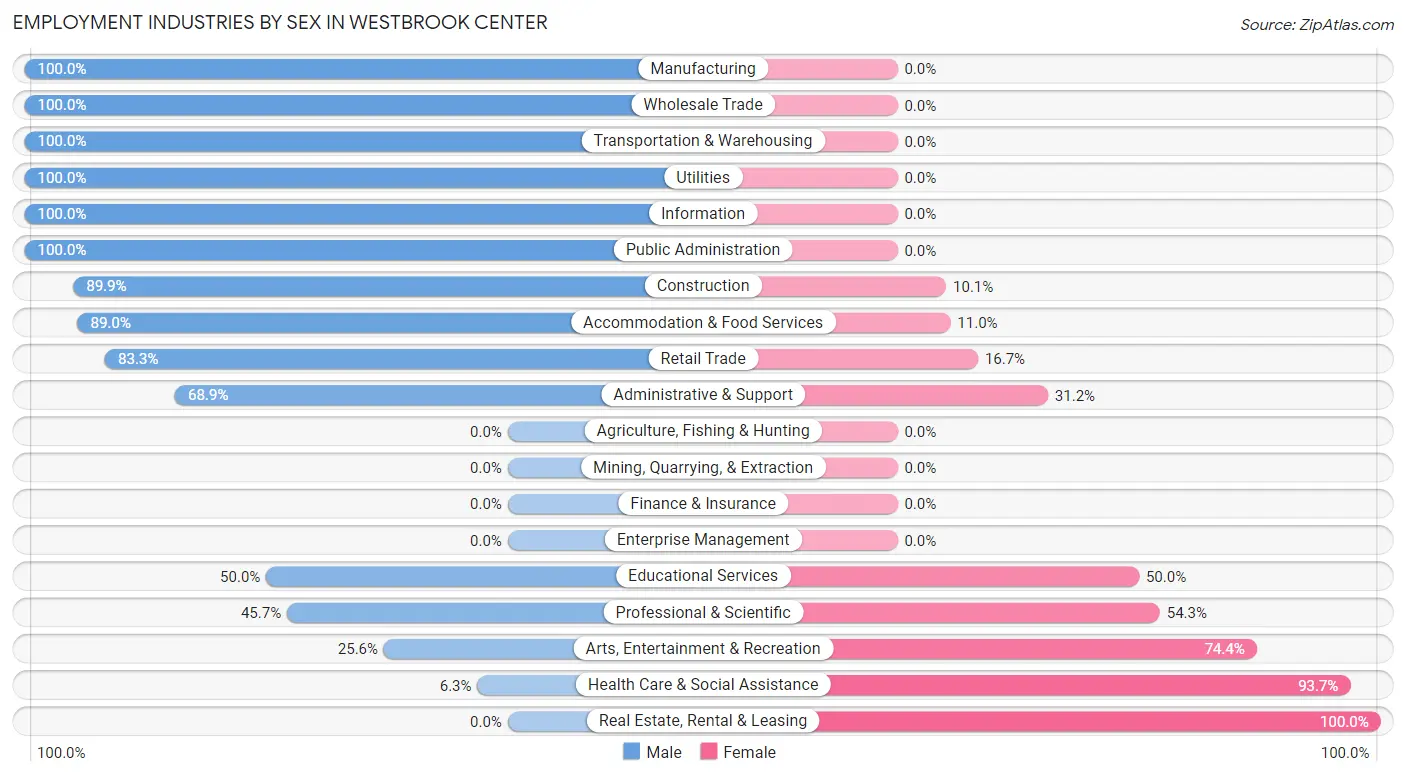
Employment Industries by Sex in Westbrook Center
The Westbrook Center industries that see more men than women are Manufacturing (100.0%), Wholesale Trade (100.0%), and Transportation & Warehousing (100.0%), whereas the industries that tend to have a higher number of women are Real Estate, Rental & Leasing (100.0%), Health Care & Social Assistance (93.7%), and Arts, Entertainment & Recreation (74.4%).
| Industry | Male | Female |
| Agriculture, Fishing & Hunting | 0 (0.0%) | 0 (0.0%) |
| Mining, Quarrying, & Extraction | 0 (0.0%) | 0 (0.0%) |
| Construction | 116 (89.9%) | 13 (10.1%) |
| Manufacturing | 23 (100.0%) | 0 (0.0%) |
| Wholesale Trade | 19 (100.0%) | 0 (0.0%) |
| Retail Trade | 35 (83.3%) | 7 (16.7%) |
| Transportation & Warehousing | 43 (100.0%) | 0 (0.0%) |
| Utilities | 16 (100.0%) | 0 (0.0%) |
| Information | 36 (100.0%) | 0 (0.0%) |
| Finance & Insurance | 0 (0.0%) | 0 (0.0%) |
| Real Estate, Rental & Leasing | 0 (0.0%) | 19 (100.0%) |
| Professional & Scientific | 53 (45.7%) | 63 (54.3%) |
| Enterprise Management | 0 (0.0%) | 0 (0.0%) |
| Administrative & Support | 84 (68.9%) | 38 (31.1%) |
| Educational Services | 47 (50.0%) | 47 (50.0%) |
| Health Care & Social Assistance | 18 (6.3%) | 268 (93.7%) |
| Arts, Entertainment & Recreation | 20 (25.6%) | 58 (74.4%) |
| Accommodation & Food Services | 211 (89.0%) | 26 (11.0%) |
| Public Administration | 21 (100.0%) | 0 (0.0%) |
| Total | 742 (57.0%) | 560 (43.0%) |
Education in Westbrook Center
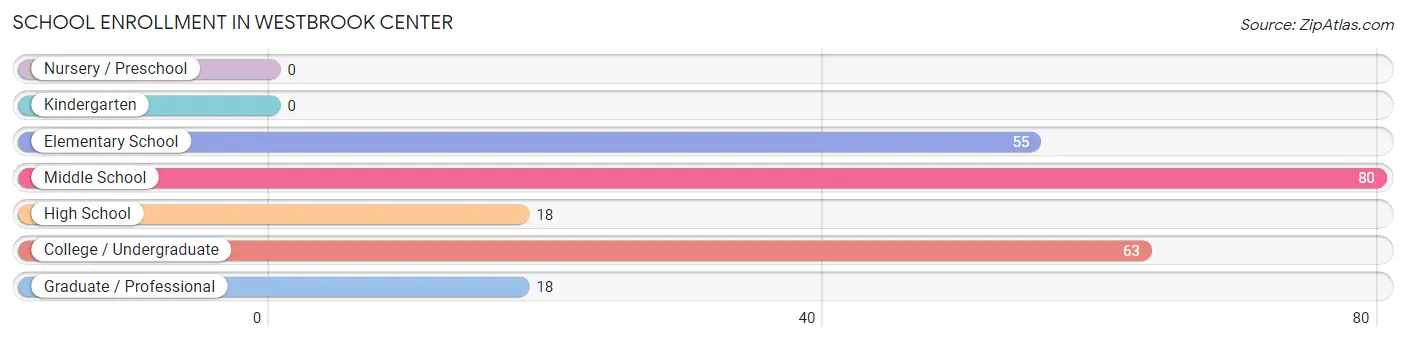
School Enrollment in Westbrook Center
The most common levels of schooling among the 234 students in Westbrook Center are middle school (80 | 34.2%), college / undergraduate (63 | 26.9%), and elementary school (55 | 23.5%).
| School Level | # Students | % Students |
| Nursery / Preschool | 0 | 0.0% |
| Kindergarten | 0 | 0.0% |
| Elementary School | 55 | 23.5% |
| Middle School | 80 | 34.2% |
| High School | 18 | 7.7% |
| College / Undergraduate | 63 | 26.9% |
| Graduate / Professional | 18 | 7.7% |
| Total | 234 | 100.0% |
School Enrollment by Age by Funding Source in Westbrook Center
Out of a total of 234 students who are enrolled in schools in Westbrook Center, 41 (17.5%) attend a private institution, while the remaining 193 (82.5%) are enrolled in public schools. The age group of 18 to 19 year olds has the highest likelihood of being enrolled in private schools, with 16 (100.0% in the age bracket) enrolled. Conversely, the age group of 5 to 9 year old has the lowest likelihood of being enrolled in a private school, with 15 (100.0% in the age bracket) attending a public institution.
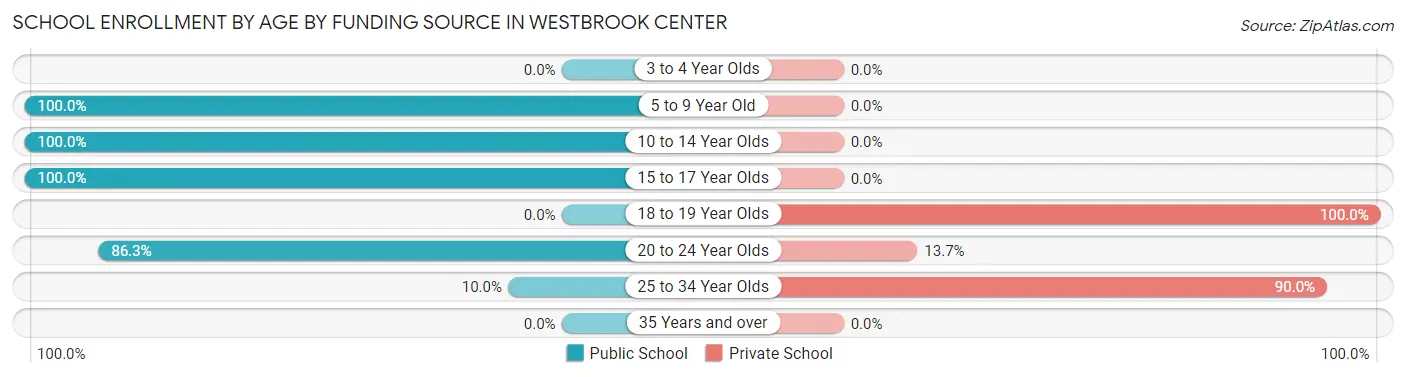
| Age Bracket | Public School | Private School |
| 3 to 4 Year Olds | 0 (0.0%) | 0 (0.0%) |
| 5 to 9 Year Old | 15 (100.0%) | 0 (0.0%) |
| 10 to 14 Year Olds | 120 (100.0%) | 0 (0.0%) |
| 15 to 17 Year Olds | 12 (100.0%) | 0 (0.0%) |
| 18 to 19 Year Olds | 0 (0.0%) | 16 (100.0%) |
| 20 to 24 Year Olds | 44 (86.3%) | 7 (13.7%) |
| 25 to 34 Year Olds | 2 (10.0%) | 18 (90.0%) |
| 35 Years and over | 0 (0.0%) | 0 (0.0%) |
| Total | 193 (82.5%) | 41 (17.5%) |
Educational Attainment by Field of Study in Westbrook Center
Business (188 | 25.3%), science & technology (116 | 15.6%), education (113 | 15.2%), social sciences (62 | 8.3%), and literature & languages (45 | 6.1%) are the most common fields of study among 743 individuals in Westbrook Center who have obtained a bachelor's degree or higher.
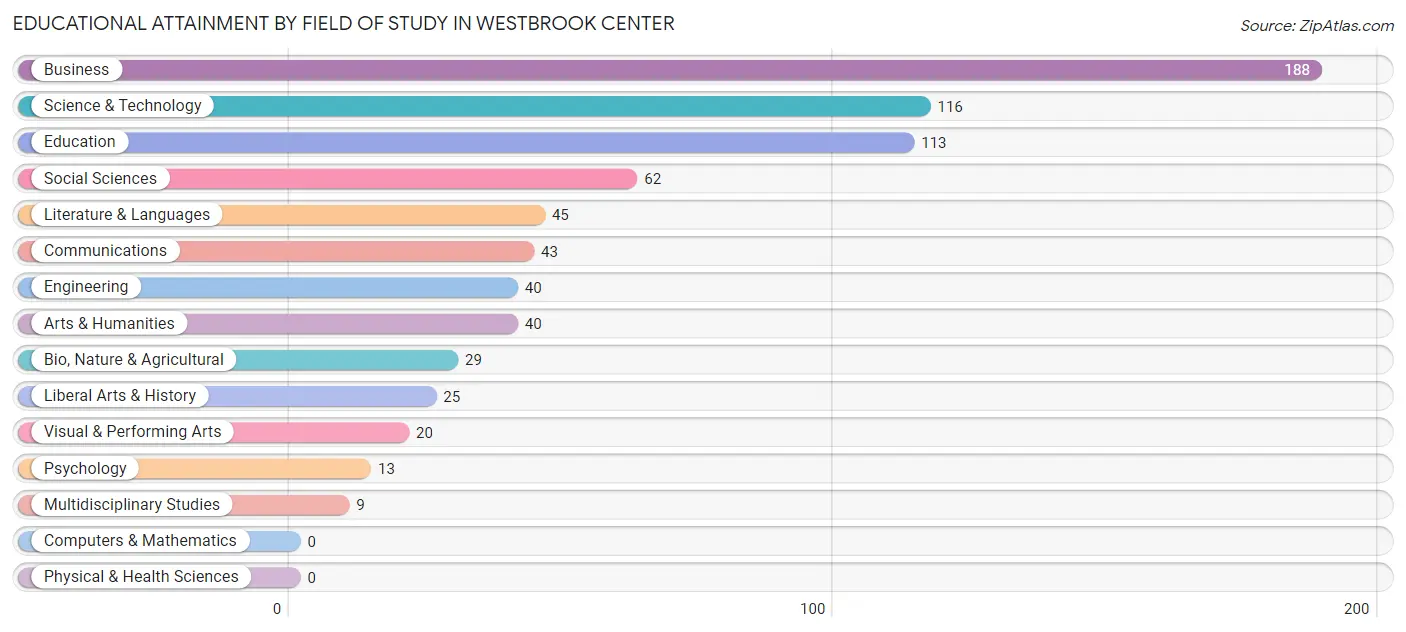
| Field of Study | # Graduates | % Graduates |
| Computers & Mathematics | 0 | 0.0% |
| Bio, Nature & Agricultural | 29 | 3.9% |
| Physical & Health Sciences | 0 | 0.0% |
| Psychology | 13 | 1.8% |
| Social Sciences | 62 | 8.3% |
| Engineering | 40 | 5.4% |
| Multidisciplinary Studies | 9 | 1.2% |
| Science & Technology | 116 | 15.6% |
| Business | 188 | 25.3% |
| Education | 113 | 15.2% |
| Literature & Languages | 45 | 6.1% |
| Liberal Arts & History | 25 | 3.4% |
| Visual & Performing Arts | 20 | 2.7% |
| Communications | 43 | 5.8% |
| Arts & Humanities | 40 | 5.4% |
| Total | 743 | 100.0% |
Transportation & Commute in Westbrook Center
Vehicle Availability by Sex in Westbrook Center
The most prevalent vehicle ownership categories in Westbrook Center are males with 2 vehicles (361, accounting for 50.9%) and females with 2 vehicles (201, making up 68.4%).
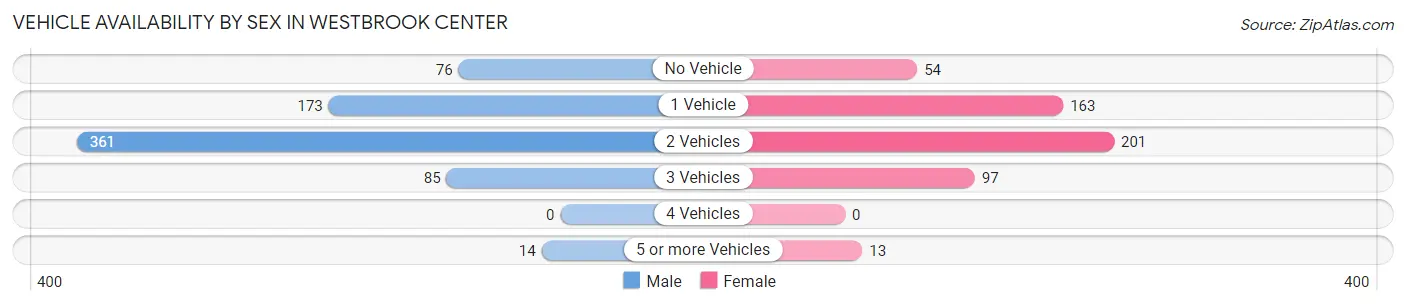
| Vehicles Available | Male | Female |
| No Vehicle | 76 (10.7%) | 54 (10.2%) |
| 1 Vehicle | 173 (24.4%) | 163 (30.9%) |
| 2 Vehicles | 361 (50.9%) | 201 (38.1%) |
| 3 Vehicles | 85 (12.0%) | 97 (18.4%) |
| 4 Vehicles | 0 (0.0%) | 0 (0.0%) |
| 5 or more Vehicles | 14 (2.0%) | 13 (2.5%) |
| Total | 709 (100.0%) | 528 (100.0%) |
Commute Time in Westbrook Center
The most frequently occuring commute durations in Westbrook Center are 10 to 14 minutes (282 commuters, 24.6%), 45 to 59 minutes (190 commuters, 16.6%), and 5 to 9 minutes (179 commuters, 15.6%).
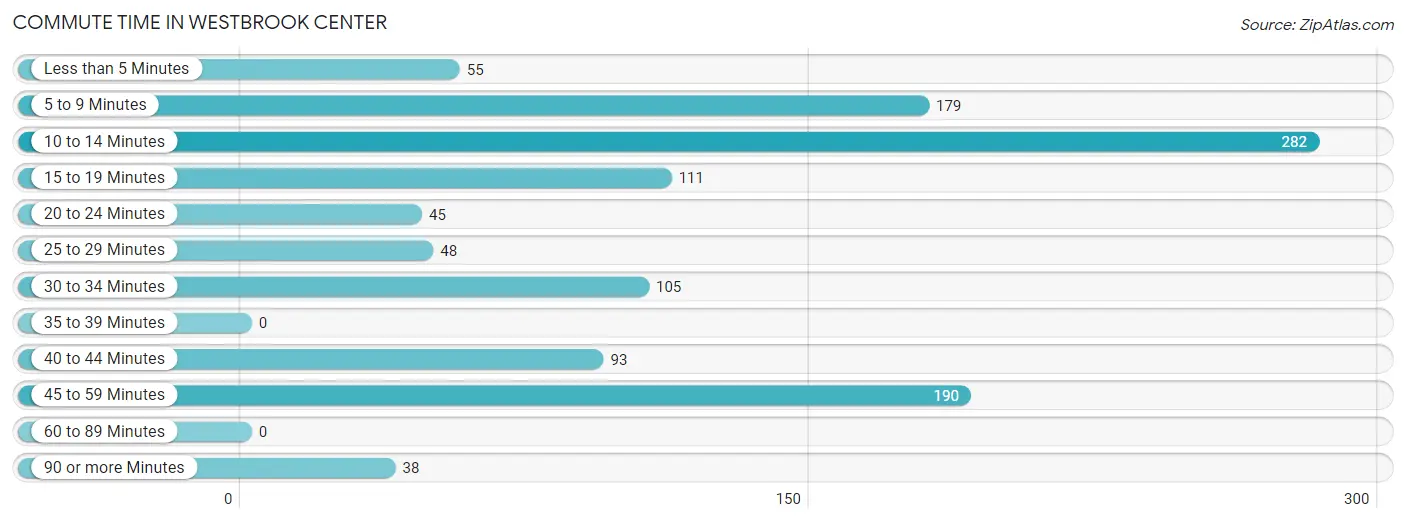
| Commute Time | # Commuters | % Commuters |
| Less than 5 Minutes | 55 | 4.8% |
| 5 to 9 Minutes | 179 | 15.6% |
| 10 to 14 Minutes | 282 | 24.6% |
| 15 to 19 Minutes | 111 | 9.7% |
| 20 to 24 Minutes | 45 | 3.9% |
| 25 to 29 Minutes | 48 | 4.2% |
| 30 to 34 Minutes | 105 | 9.2% |
| 35 to 39 Minutes | 0 | 0.0% |
| 40 to 44 Minutes | 93 | 8.1% |
| 45 to 59 Minutes | 190 | 16.6% |
| 60 to 89 Minutes | 0 | 0.0% |
| 90 or more Minutes | 38 | 3.3% |
Commute Time by Sex in Westbrook Center
The most common commute times in Westbrook Center are 10 to 14 minutes (231 commuters, 32.4%) for males and 45 to 59 minutes (117 commuters, 27.1%) for females.
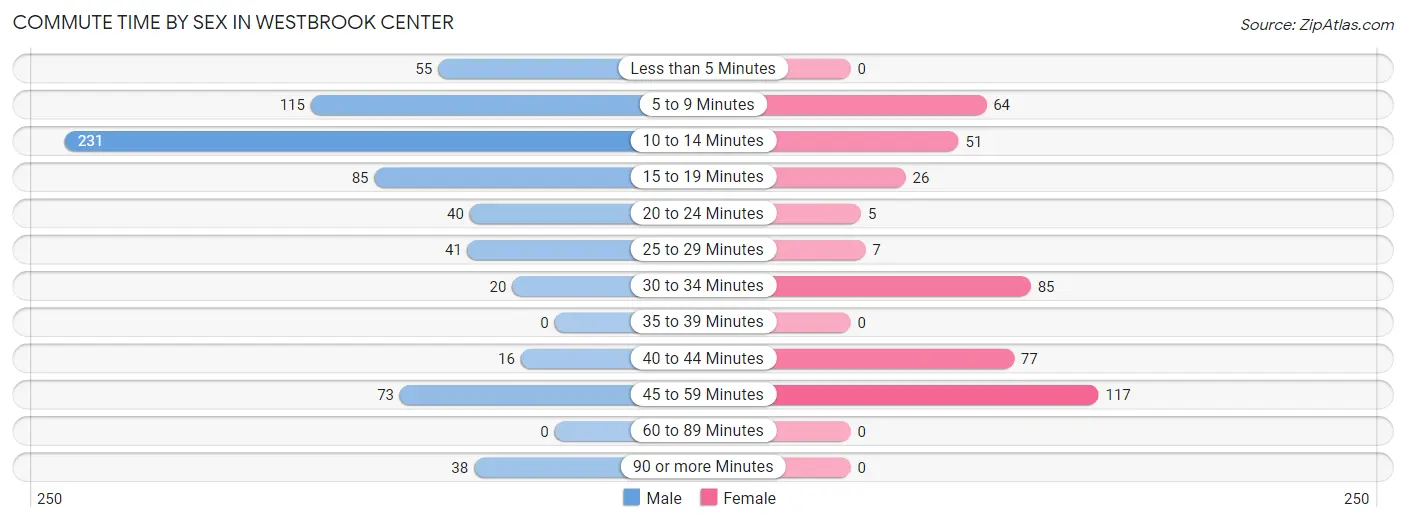
| Commute Time | Male | Female |
| Less than 5 Minutes | 55 (7.7%) | 0 (0.0%) |
| 5 to 9 Minutes | 115 (16.1%) | 64 (14.8%) |
| 10 to 14 Minutes | 231 (32.4%) | 51 (11.8%) |
| 15 to 19 Minutes | 85 (11.9%) | 26 (6.0%) |
| 20 to 24 Minutes | 40 (5.6%) | 5 (1.2%) |
| 25 to 29 Minutes | 41 (5.7%) | 7 (1.6%) |
| 30 to 34 Minutes | 20 (2.8%) | 85 (19.7%) |
| 35 to 39 Minutes | 0 (0.0%) | 0 (0.0%) |
| 40 to 44 Minutes | 16 (2.2%) | 77 (17.8%) |
| 45 to 59 Minutes | 73 (10.2%) | 117 (27.1%) |
| 60 to 89 Minutes | 0 (0.0%) | 0 (0.0%) |
| 90 or more Minutes | 38 (5.3%) | 0 (0.0%) |
Time of Departure to Work by Sex in Westbrook Center
The most frequent times of departure to work in Westbrook Center are 12:00 PM to 3:59 PM (143, 20.0%) for males and 6:00 AM to 6:29 AM (75, 17.4%) for females.
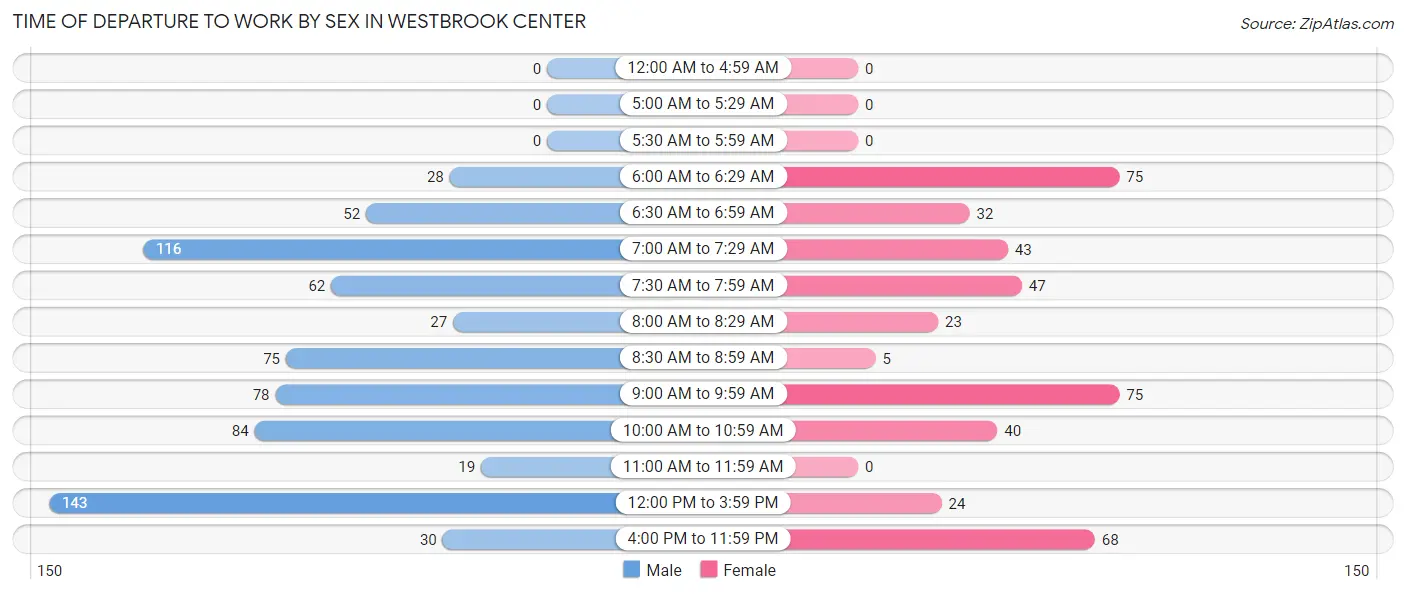
| Time of Departure | Male | Female |
| 12:00 AM to 4:59 AM | 0 (0.0%) | 0 (0.0%) |
| 5:00 AM to 5:29 AM | 0 (0.0%) | 0 (0.0%) |
| 5:30 AM to 5:59 AM | 0 (0.0%) | 0 (0.0%) |
| 6:00 AM to 6:29 AM | 28 (3.9%) | 75 (17.4%) |
| 6:30 AM to 6:59 AM | 52 (7.3%) | 32 (7.4%) |
| 7:00 AM to 7:29 AM | 116 (16.3%) | 43 (10.0%) |
| 7:30 AM to 7:59 AM | 62 (8.7%) | 47 (10.9%) |
| 8:00 AM to 8:29 AM | 27 (3.8%) | 23 (5.3%) |
| 8:30 AM to 8:59 AM | 75 (10.5%) | 5 (1.2%) |
| 9:00 AM to 9:59 AM | 78 (10.9%) | 75 (17.4%) |
| 10:00 AM to 10:59 AM | 84 (11.8%) | 40 (9.3%) |
| 11:00 AM to 11:59 AM | 19 (2.7%) | 0 (0.0%) |
| 12:00 PM to 3:59 PM | 143 (20.0%) | 24 (5.6%) |
| 4:00 PM to 11:59 PM | 30 (4.2%) | 68 (15.7%) |
| Total | 714 (100.0%) | 432 (100.0%) |
Housing Occupancy in Westbrook Center
Occupancy by Ownership in Westbrook Center
Of the total 1,189 dwellings in Westbrook Center, owner-occupied units account for 633 (53.2%), while renter-occupied units make up 556 (46.8%).
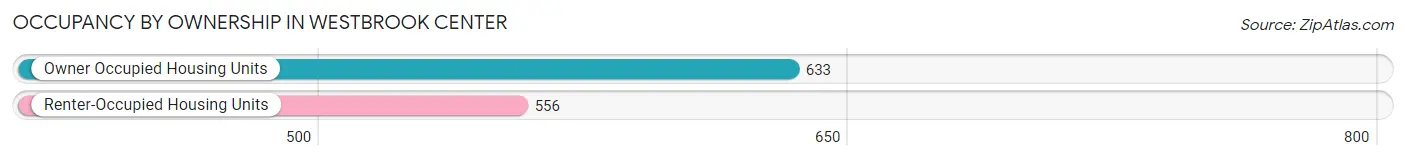
| Occupancy | # Housing Units | % Housing Units |
| Owner Occupied Housing Units | 633 | 53.2% |
| Renter-Occupied Housing Units | 556 | 46.8% |
| Total Occupied Housing Units | 1,189 | 100.0% |
Occupancy by Household Size in Westbrook Center
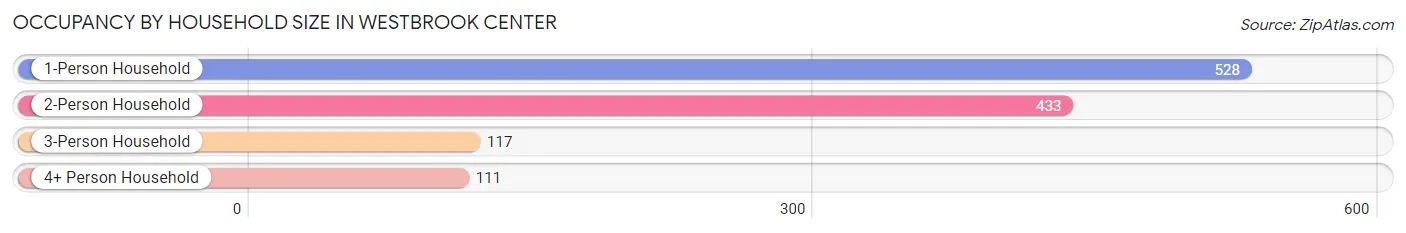
| Household Size | # Housing Units | % Housing Units |
| 1-Person Household | 528 | 44.4% |
| 2-Person Household | 433 | 36.4% |
| 3-Person Household | 117 | 9.8% |
| 4+ Person Household | 111 | 9.3% |
| Total Housing Units | 1,189 | 100.0% |
Occupancy by Ownership by Household Size in Westbrook Center
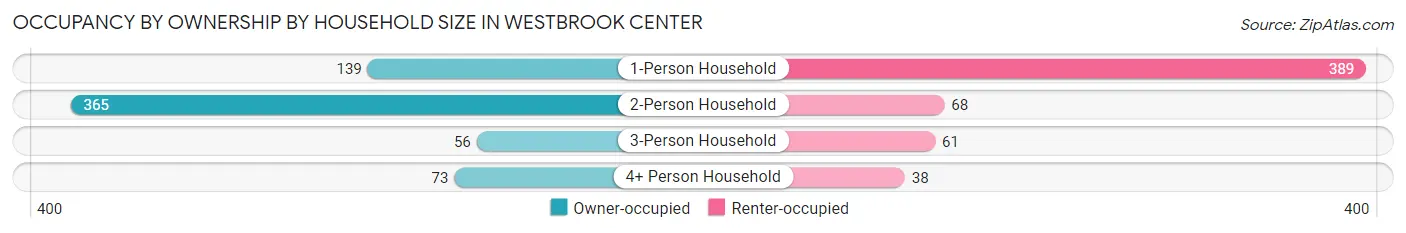
| Household Size | Owner-occupied | Renter-occupied |
| 1-Person Household | 139 (26.3%) | 389 (73.7%) |
| 2-Person Household | 365 (84.3%) | 68 (15.7%) |
| 3-Person Household | 56 (47.9%) | 61 (52.1%) |
| 4+ Person Household | 73 (65.8%) | 38 (34.2%) |
| Total Housing Units | 633 (53.2%) | 556 (46.8%) |
Occupancy by Educational Attainment in Westbrook Center
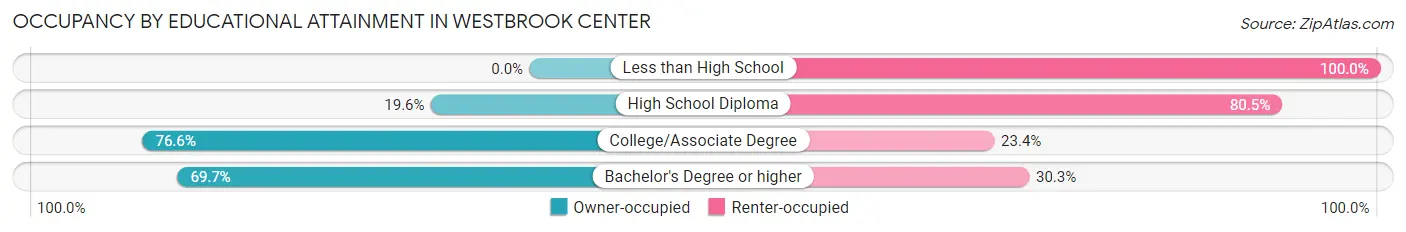
| Household Size | Owner-occupied | Renter-occupied |
| Less than High School | 0 (0.0%) | 161 (100.0%) |
| High School Diploma | 43 (19.6%) | 177 (80.4%) |
| College/Associate Degree | 298 (76.6%) | 91 (23.4%) |
| Bachelor's Degree or higher | 292 (69.7%) | 127 (30.3%) |
Occupancy by Age of Householder in Westbrook Center
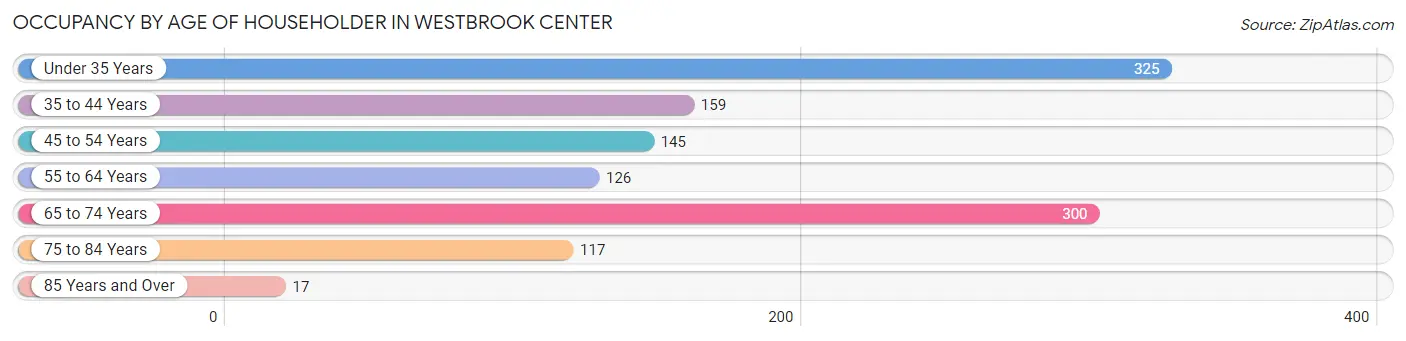
| Age Bracket | # Households | % Households |
| Under 35 Years | 325 | 27.3% |
| 35 to 44 Years | 159 | 13.4% |
| 45 to 54 Years | 145 | 12.2% |
| 55 to 64 Years | 126 | 10.6% |
| 65 to 74 Years | 300 | 25.2% |
| 75 to 84 Years | 117 | 9.8% |
| 85 Years and Over | 17 | 1.4% |
| Total | 1,189 | 100.0% |
Housing Finances in Westbrook Center
Median Income by Occupancy in Westbrook Center
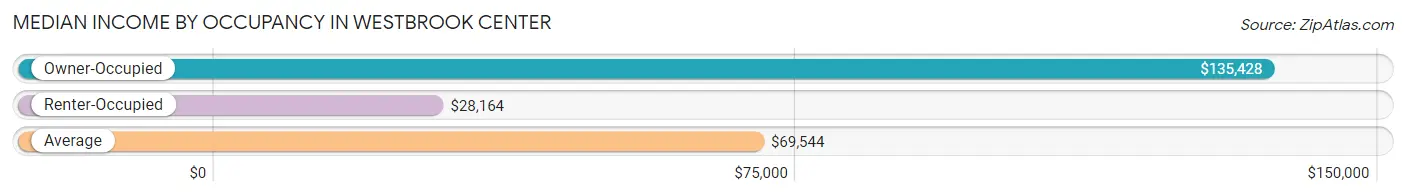
| Occupancy Type | # Households | Median Income |
| Owner-Occupied | 633 (53.2%) | $135,428 |
| Renter-Occupied | 556 (46.8%) | $28,164 |
| Average | 1,189 (100.0%) | $69,544 |
Occupancy by Householder Income Bracket in Westbrook Center
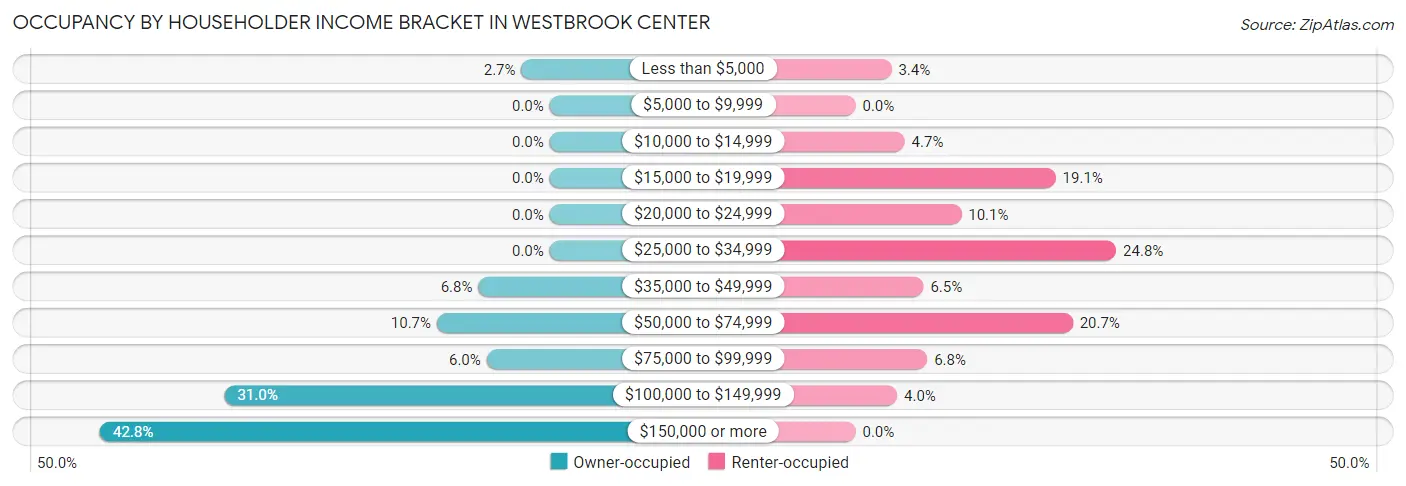
| Income Bracket | Owner-occupied | Renter-occupied |
| Less than $5,000 | 17 (2.7%) | 19 (3.4%) |
| $5,000 to $9,999 | 0 (0.0%) | 0 (0.0%) |
| $10,000 to $14,999 | 0 (0.0%) | 26 (4.7%) |
| $15,000 to $19,999 | 0 (0.0%) | 106 (19.1%) |
| $20,000 to $24,999 | 0 (0.0%) | 56 (10.1%) |
| $25,000 to $34,999 | 0 (0.0%) | 138 (24.8%) |
| $35,000 to $49,999 | 43 (6.8%) | 36 (6.5%) |
| $50,000 to $74,999 | 68 (10.7%) | 115 (20.7%) |
| $75,000 to $99,999 | 38 (6.0%) | 38 (6.8%) |
| $100,000 to $149,999 | 196 (31.0%) | 22 (4.0%) |
| $150,000 or more | 271 (42.8%) | 0 (0.0%) |
| Total | 633 (100.0%) | 556 (100.0%) |
Monthly Housing Cost Tiers in Westbrook Center
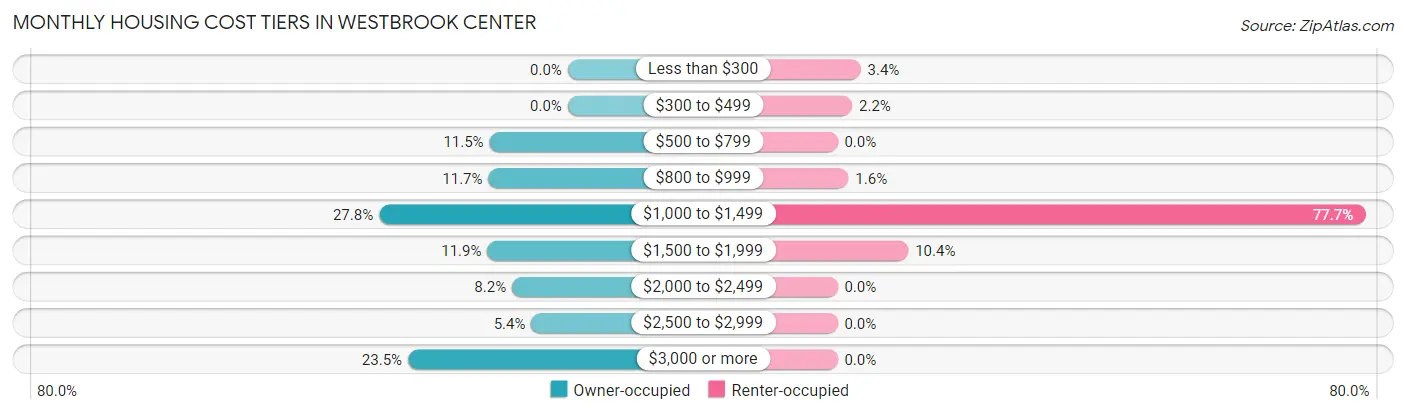
| Monthly Cost | Owner-occupied | Renter-occupied |
| Less than $300 | 0 (0.0%) | 19 (3.4%) |
| $300 to $499 | 0 (0.0%) | 12 (2.2%) |
| $500 to $799 | 73 (11.5%) | 0 (0.0%) |
| $800 to $999 | 74 (11.7%) | 9 (1.6%) |
| $1,000 to $1,499 | 176 (27.8%) | 432 (77.7%) |
| $1,500 to $1,999 | 75 (11.8%) | 58 (10.4%) |
| $2,000 to $2,499 | 52 (8.2%) | 0 (0.0%) |
| $2,500 to $2,999 | 34 (5.4%) | 0 (0.0%) |
| $3,000 or more | 149 (23.5%) | 0 (0.0%) |
| Total | 633 (100.0%) | 556 (100.0%) |
Physical Housing Characteristics in Westbrook Center
Housing Structures in Westbrook Center
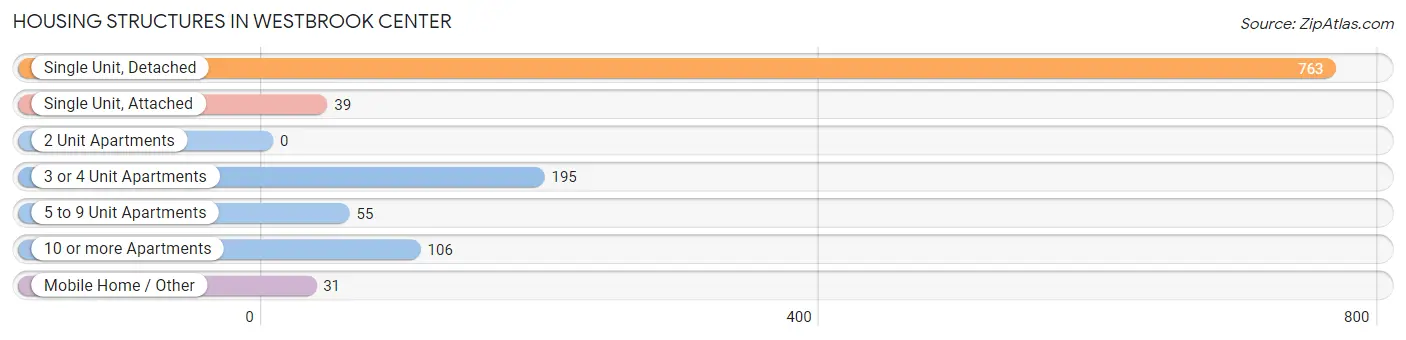
| Structure Type | # Housing Units | % Housing Units |
| Single Unit, Detached | 763 | 64.2% |
| Single Unit, Attached | 39 | 3.3% |
| 2 Unit Apartments | 0 | 0.0% |
| 3 or 4 Unit Apartments | 195 | 16.4% |
| 5 to 9 Unit Apartments | 55 | 4.6% |
| 10 or more Apartments | 106 | 8.9% |
| Mobile Home / Other | 31 | 2.6% |
| Total | 1,189 | 100.0% |
Housing Structures by Occupancy in Westbrook Center
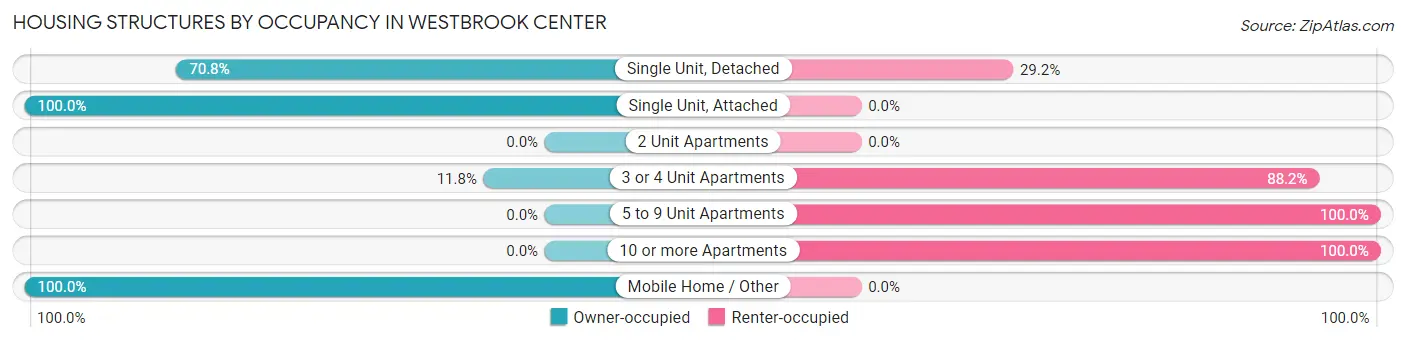
| Structure Type | Owner-occupied | Renter-occupied |
| Single Unit, Detached | 540 (70.8%) | 223 (29.2%) |
| Single Unit, Attached | 39 (100.0%) | 0 (0.0%) |
| 2 Unit Apartments | 0 (0.0%) | 0 (0.0%) |
| 3 or 4 Unit Apartments | 23 (11.8%) | 172 (88.2%) |
| 5 to 9 Unit Apartments | 0 (0.0%) | 55 (100.0%) |
| 10 or more Apartments | 0 (0.0%) | 106 (100.0%) |
| Mobile Home / Other | 31 (100.0%) | 0 (0.0%) |
| Total | 633 (53.2%) | 556 (46.8%) |
Housing Structures by Number of Rooms in Westbrook Center
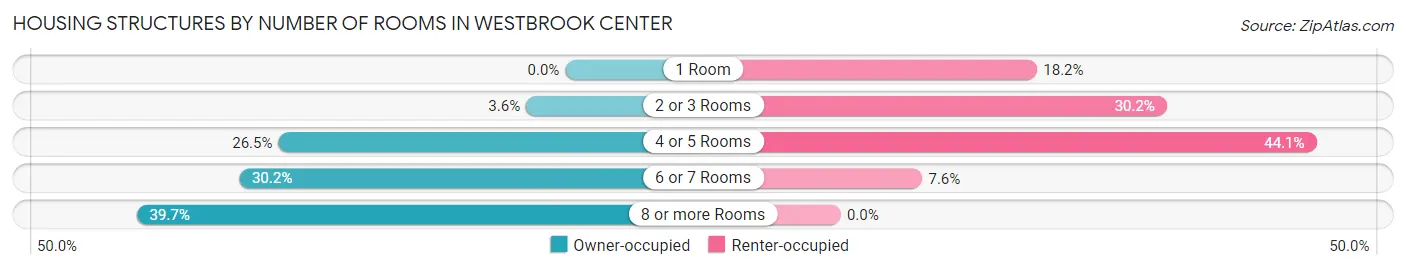
| Number of Rooms | Owner-occupied | Renter-occupied |
| 1 Room | 0 (0.0%) | 101 (18.2%) |
| 2 or 3 Rooms | 23 (3.6%) | 168 (30.2%) |
| 4 or 5 Rooms | 168 (26.5%) | 245 (44.1%) |
| 6 or 7 Rooms | 191 (30.2%) | 42 (7.5%) |
| 8 or more Rooms | 251 (39.7%) | 0 (0.0%) |
| Total | 633 (100.0%) | 556 (100.0%) |
Housing Structure by Heating Type in Westbrook Center
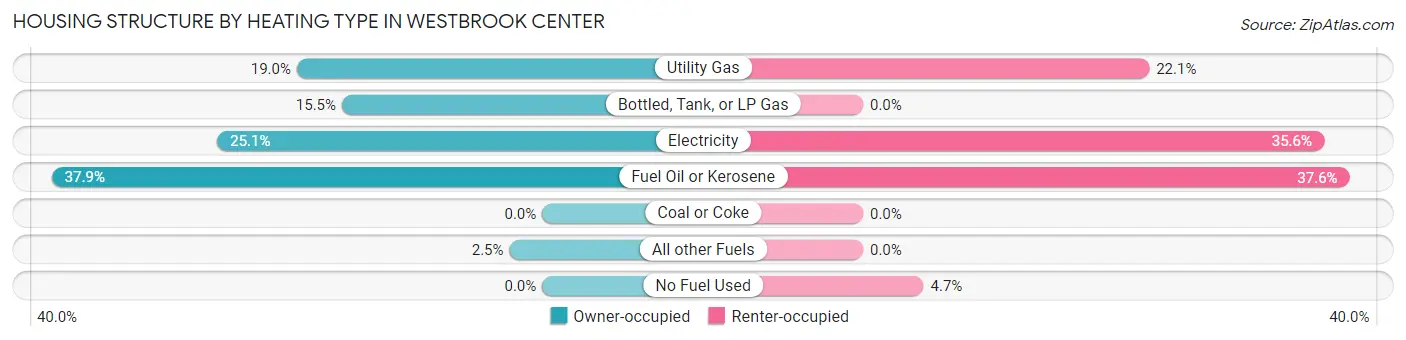
| Heating Type | Owner-occupied | Renter-occupied |
| Utility Gas | 120 (19.0%) | 123 (22.1%) |
| Bottled, Tank, or LP Gas | 98 (15.5%) | 0 (0.0%) |
| Electricity | 159 (25.1%) | 198 (35.6%) |
| Fuel Oil or Kerosene | 240 (37.9%) | 209 (37.6%) |
| Coal or Coke | 0 (0.0%) | 0 (0.0%) |
| All other Fuels | 16 (2.5%) | 0 (0.0%) |
| No Fuel Used | 0 (0.0%) | 26 (4.7%) |
| Total | 633 (100.0%) | 556 (100.0%) |
Household Vehicle Usage in Westbrook Center
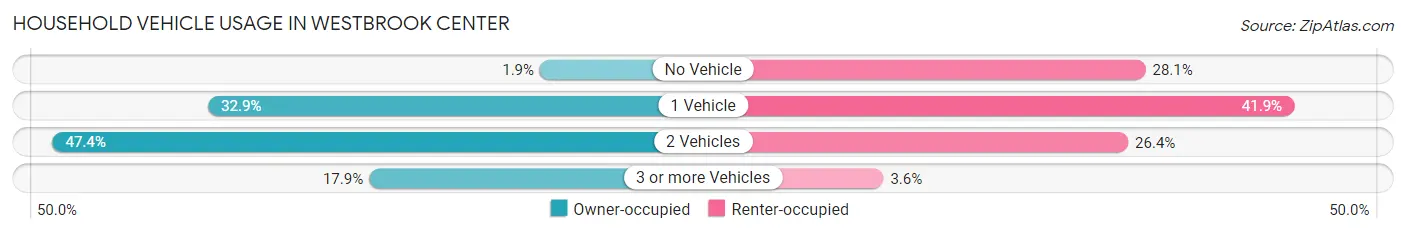
| Vehicles per Household | Owner-occupied | Renter-occupied |
| No Vehicle | 12 (1.9%) | 156 (28.1%) |
| 1 Vehicle | 208 (32.9%) | 233 (41.9%) |
| 2 Vehicles | 300 (47.4%) | 147 (26.4%) |
| 3 or more Vehicles | 113 (17.8%) | 20 (3.6%) |
| Total | 633 (100.0%) | 556 (100.0%) |
Real Estate & Mortgages in Westbrook Center
Real Estate and Mortgage Overview in Westbrook Center
| Characteristic | Without Mortgage | With Mortgage |
| Housing Units | 361 | 272 |
| Median Property Value | $419,700 | $562,500 |
| Median Household Income | $101,294 | $161 |
| Monthly Housing Costs | $1,089 | $131 |
| Real Estate Taxes | $6,070 | $0 |
Property Value by Mortgage Status in Westbrook Center
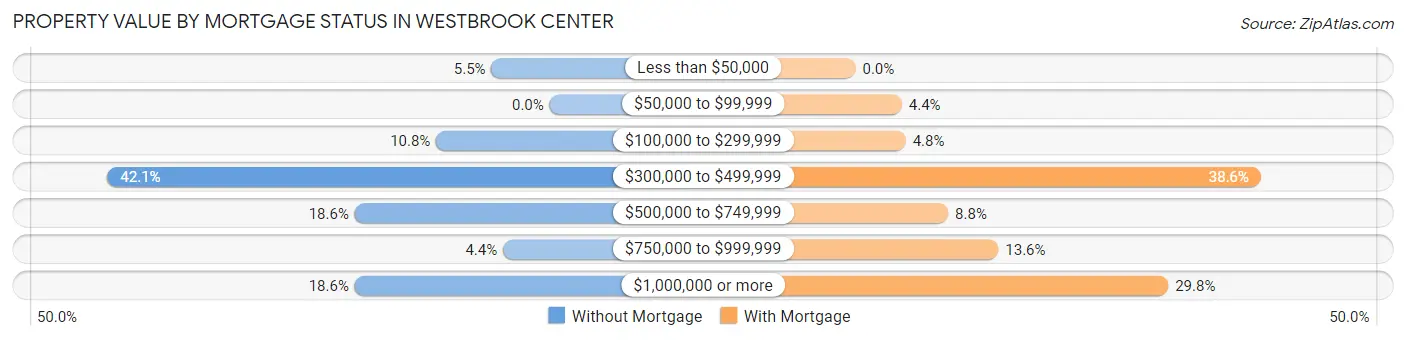
| Property Value | Without Mortgage | With Mortgage |
| Less than $50,000 | 20 (5.5%) | 0 (0.0%) |
| $50,000 to $99,999 | 0 (0.0%) | 12 (4.4%) |
| $100,000 to $299,999 | 39 (10.8%) | 13 (4.8%) |
| $300,000 to $499,999 | 152 (42.1%) | 105 (38.6%) |
| $500,000 to $749,999 | 67 (18.6%) | 24 (8.8%) |
| $750,000 to $999,999 | 16 (4.4%) | 37 (13.6%) |
| $1,000,000 or more | 67 (18.6%) | 81 (29.8%) |
| Total | 361 (100.0%) | 272 (100.0%) |
Household Income by Mortgage Status in Westbrook Center
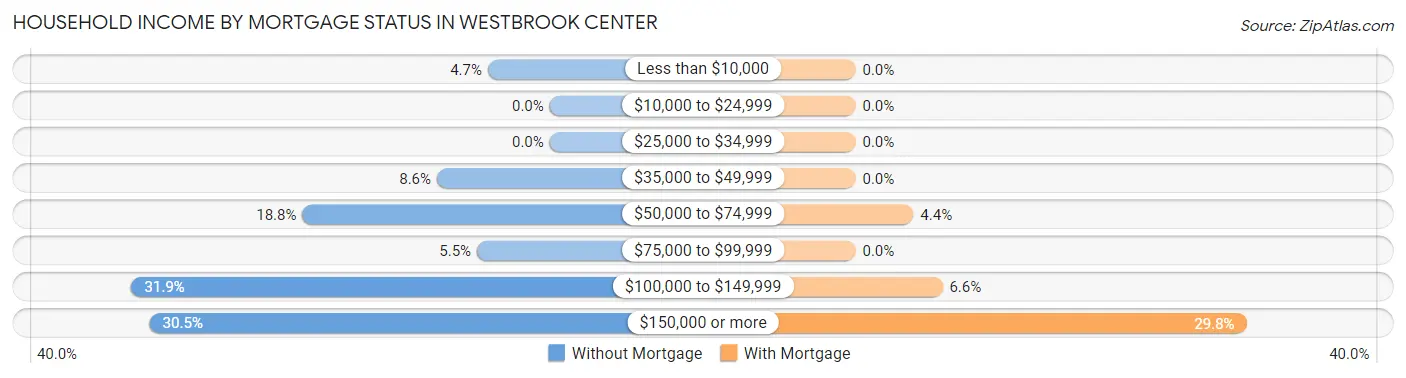
| Household Income | Without Mortgage | With Mortgage |
| Less than $10,000 | 17 (4.7%) | 0 (0.0%) |
| $10,000 to $24,999 | 0 (0.0%) | 0 (0.0%) |
| $25,000 to $34,999 | 0 (0.0%) | 0 (0.0%) |
| $35,000 to $49,999 | 31 (8.6%) | 0 (0.0%) |
| $50,000 to $74,999 | 68 (18.8%) | 12 (4.4%) |
| $75,000 to $99,999 | 20 (5.5%) | 0 (0.0%) |
| $100,000 to $149,999 | 115 (31.9%) | 18 (6.6%) |
| $150,000 or more | 110 (30.5%) | 81 (29.8%) |
| Total | 361 (100.0%) | 272 (100.0%) |
Property Value to Household Income Ratio in Westbrook Center
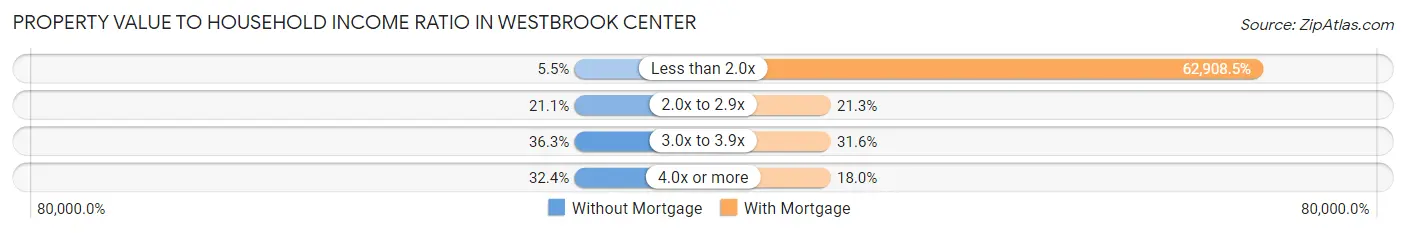
| Value-to-Income Ratio | Without Mortgage | With Mortgage |
| Less than 2.0x | 20 (5.5%) | 171,111 (62,908.5%) |
| 2.0x to 2.9x | 76 (21.0%) | 58 (21.3%) |
| 3.0x to 3.9x | 131 (36.3%) | 86 (31.6%) |
| 4.0x or more | 117 (32.4%) | 49 (18.0%) |
| Total | 361 (100.0%) | 272 (100.0%) |
Real Estate Taxes by Mortgage Status in Westbrook Center
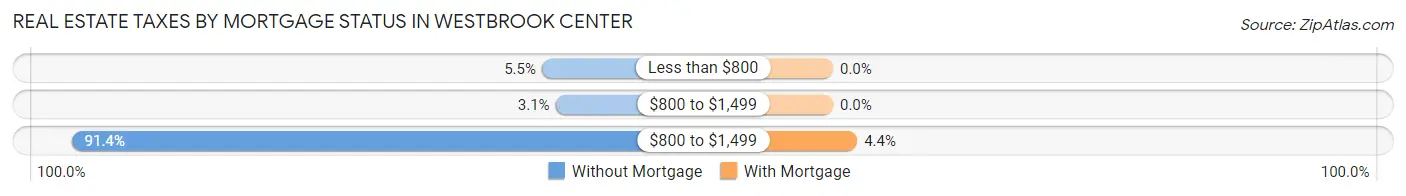
| Property Taxes | Without Mortgage | With Mortgage |
| Less than $800 | 20 (5.5%) | 0 (0.0%) |
| $800 to $1,499 | 11 (3.0%) | 0 (0.0%) |
| $800 to $1,499 | 330 (91.4%) | 12 (4.4%) |
| Total | 361 (100.0%) | 272 (100.0%) |
Health & Disability in Westbrook Center
Health Insurance Coverage by Age in Westbrook Center
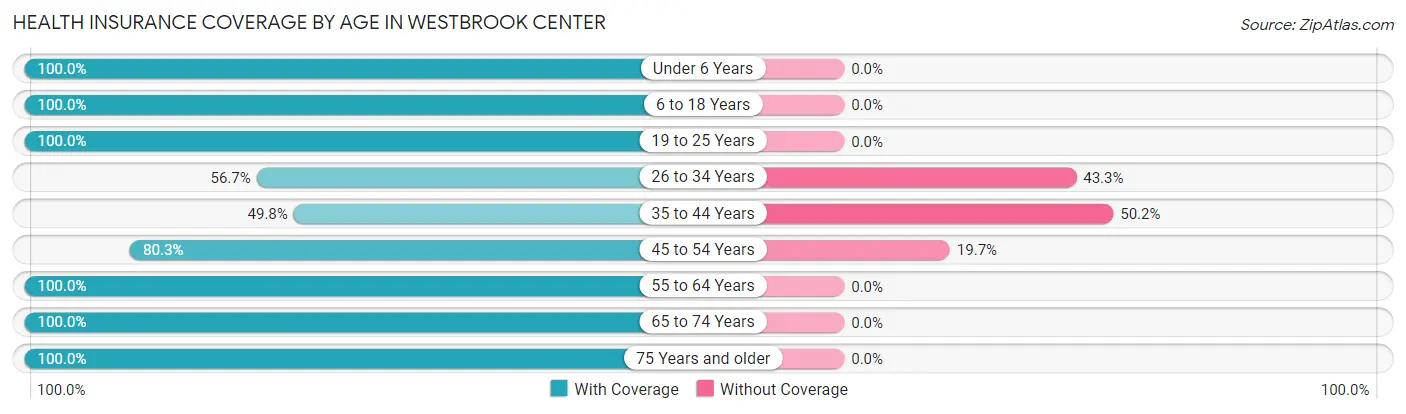
| Age Bracket | With Coverage | Without Coverage |
| Under 6 Years | 33 (100.0%) | 0 (0.0%) |
| 6 to 18 Years | 147 (100.0%) | 0 (0.0%) |
| 19 to 25 Years | 128 (100.0%) | 0 (0.0%) |
| 26 to 34 Years | 261 (56.7%) | 199 (43.3%) |
| 35 to 44 Years | 144 (49.8%) | 145 (50.2%) |
| 45 to 54 Years | 155 (80.3%) | 38 (19.7%) |
| 55 to 64 Years | 264 (100.0%) | 0 (0.0%) |
| 65 to 74 Years | 515 (100.0%) | 0 (0.0%) |
| 75 Years and older | 267 (100.0%) | 0 (0.0%) |
| Total | 1,914 (83.4%) | 382 (16.6%) |
Health Insurance Coverage by Citizenship Status in Westbrook Center
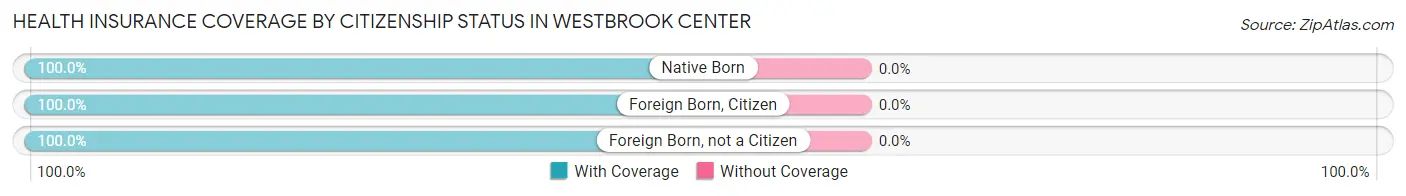
| Citizenship Status | With Coverage | Without Coverage |
| Native Born | 33 (100.0%) | 0 (0.0%) |
| Foreign Born, Citizen | 147 (100.0%) | 0 (0.0%) |
| Foreign Born, not a Citizen | 128 (100.0%) | 0 (0.0%) |
Health Insurance Coverage by Household Income in Westbrook Center
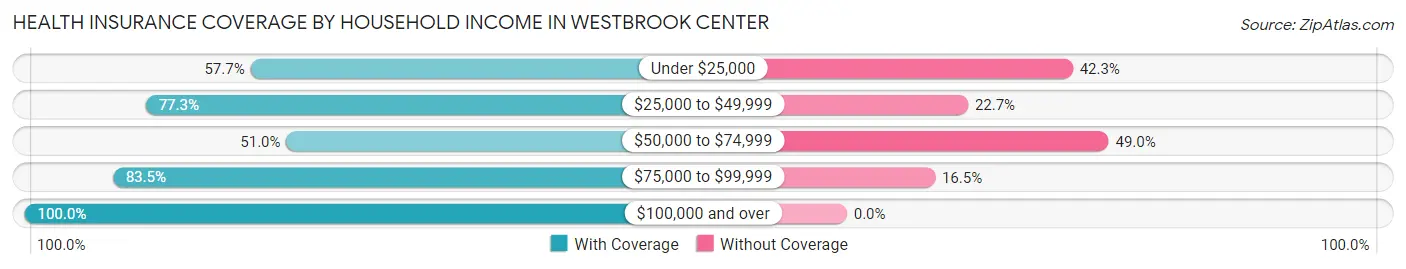
| Household Income | With Coverage | Without Coverage |
| Under $25,000 | 139 (57.7%) | 102 (42.3%) |
| $25,000 to $49,999 | 218 (77.3%) | 64 (22.7%) |
| $50,000 to $74,999 | 185 (51.0%) | 178 (49.0%) |
| $75,000 to $99,999 | 192 (83.5%) | 38 (16.5%) |
| $100,000 and over | 1,125 (100.0%) | 0 (0.0%) |
Public vs Private Health Insurance Coverage by Age in Westbrook Center
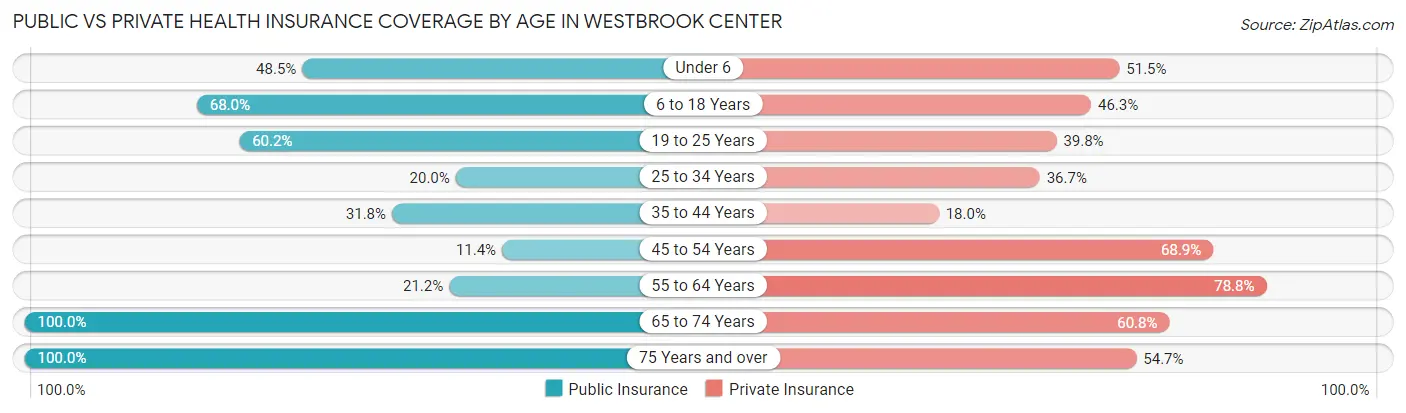
| Age Bracket | Public Insurance | Private Insurance |
| Under 6 | 16 (48.5%) | 17 (51.5%) |
| 6 to 18 Years | 100 (68.0%) | 68 (46.3%) |
| 19 to 25 Years | 77 (60.2%) | 51 (39.8%) |
| 25 to 34 Years | 92 (20.0%) | 169 (36.7%) |
| 35 to 44 Years | 92 (31.8%) | 52 (18.0%) |
| 45 to 54 Years | 22 (11.4%) | 133 (68.9%) |
| 55 to 64 Years | 56 (21.2%) | 208 (78.8%) |
| 65 to 74 Years | 515 (100.0%) | 313 (60.8%) |
| 75 Years and over | 267 (100.0%) | 146 (54.7%) |
| Total | 1,237 (53.9%) | 1,157 (50.4%) |
Disability Status by Sex by Age in Westbrook Center
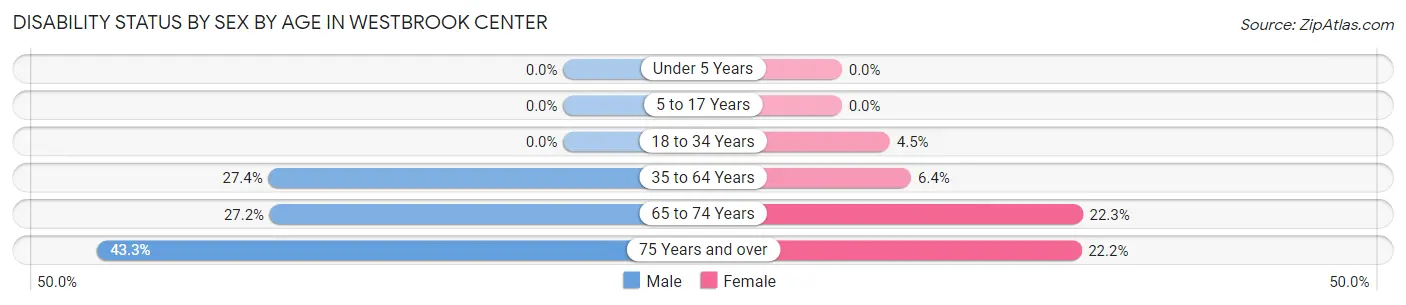
| Age Bracket | Male | Female |
| Under 5 Years | 0 (0.0%) | 0 (0.0%) |
| 5 to 17 Years | 0 (0.0%) | 0 (0.0%) |
| 18 to 34 Years | 0 (0.0%) | 9 (4.5%) |
| 35 to 64 Years | 119 (27.4%) | 20 (6.4%) |
| 65 to 74 Years | 61 (27.2%) | 65 (22.3%) |
| 75 Years and over | 61 (43.3%) | 28 (22.2%) |
Disability Class by Sex by Age in Westbrook Center
Disability Class: Hearing Difficulty
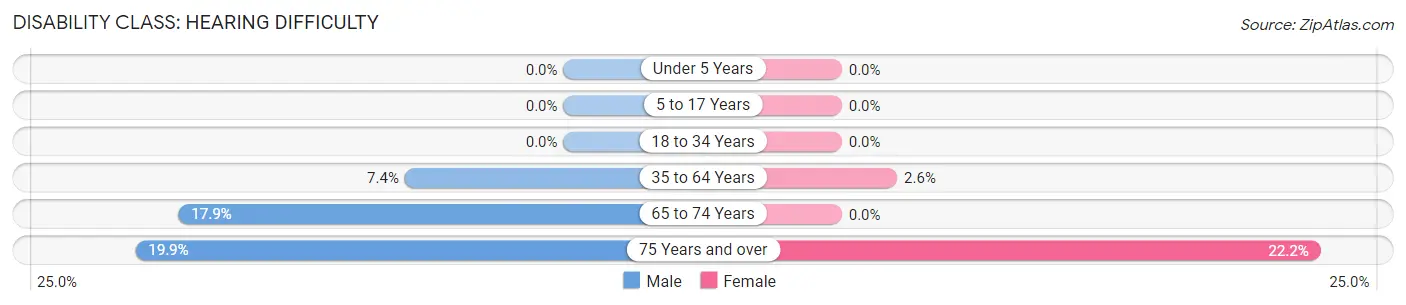
| Age Bracket | Male | Female |
| Under 5 Years | 0 (0.0%) | 0 (0.0%) |
| 5 to 17 Years | 0 (0.0%) | 0 (0.0%) |
| 18 to 34 Years | 0 (0.0%) | 0 (0.0%) |
| 35 to 64 Years | 32 (7.4%) | 8 (2.6%) |
| 65 to 74 Years | 40 (17.9%) | 0 (0.0%) |
| 75 Years and over | 28 (19.9%) | 28 (22.2%) |
Disability Class: Vision Difficulty
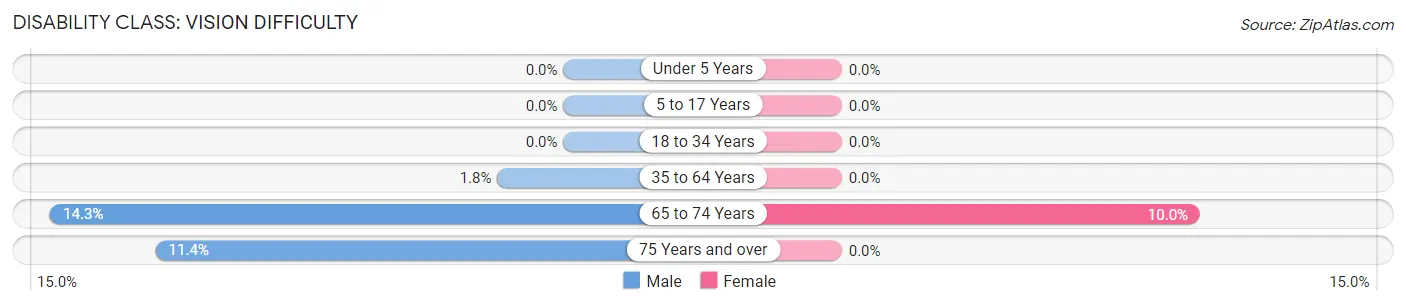
| Age Bracket | Male | Female |
| Under 5 Years | 0 (0.0%) | 0 (0.0%) |
| 5 to 17 Years | 0 (0.0%) | 0 (0.0%) |
| 18 to 34 Years | 0 (0.0%) | 0 (0.0%) |
| 35 to 64 Years | 8 (1.8%) | 0 (0.0%) |
| 65 to 74 Years | 32 (14.3%) | 29 (10.0%) |
| 75 Years and over | 16 (11.4%) | 0 (0.0%) |
Disability Class: Cognitive Difficulty
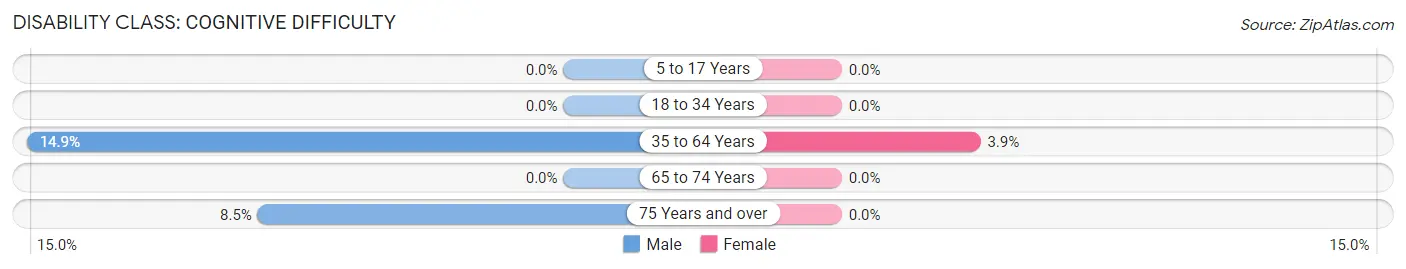
| Age Bracket | Male | Female |
| 5 to 17 Years | 0 (0.0%) | 0 (0.0%) |
| 18 to 34 Years | 0 (0.0%) | 0 (0.0%) |
| 35 to 64 Years | 65 (14.9%) | 12 (3.9%) |
| 65 to 74 Years | 0 (0.0%) | 0 (0.0%) |
| 75 Years and over | 12 (8.5%) | 0 (0.0%) |
Disability Class: Ambulatory Difficulty
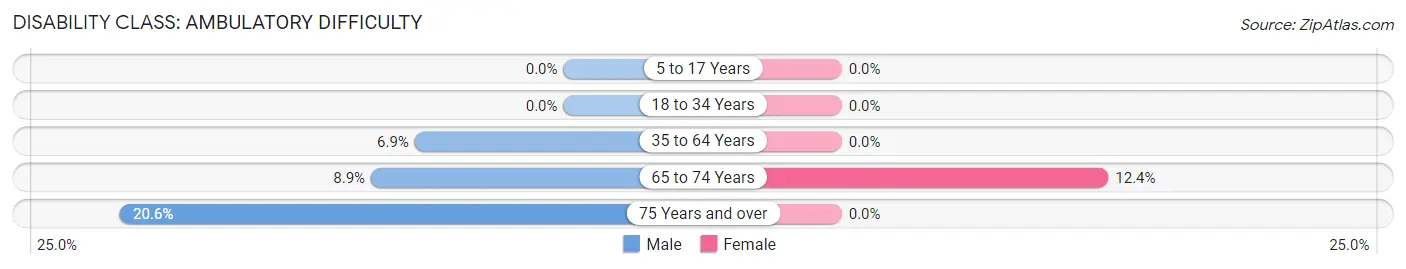
| Age Bracket | Male | Female |
| 5 to 17 Years | 0 (0.0%) | 0 (0.0%) |
| 18 to 34 Years | 0 (0.0%) | 0 (0.0%) |
| 35 to 64 Years | 30 (6.9%) | 0 (0.0%) |
| 65 to 74 Years | 20 (8.9%) | 36 (12.4%) |
| 75 Years and over | 29 (20.6%) | 0 (0.0%) |
Disability Class: Self-Care Difficulty
| Age Bracket | Male | Female |
| 5 to 17 Years | 0 (0.0%) | 0 (0.0%) |
| 18 to 34 Years | 0 (0.0%) | 0 (0.0%) |
| 35 to 64 Years | 0 (0.0%) | 0 (0.0%) |
| 65 to 74 Years | 0 (0.0%) | 0 (0.0%) |
| 75 Years and over | 0 (0.0%) | 0 (0.0%) |
Technology Access in Westbrook Center
Computing Device Access in Westbrook Center
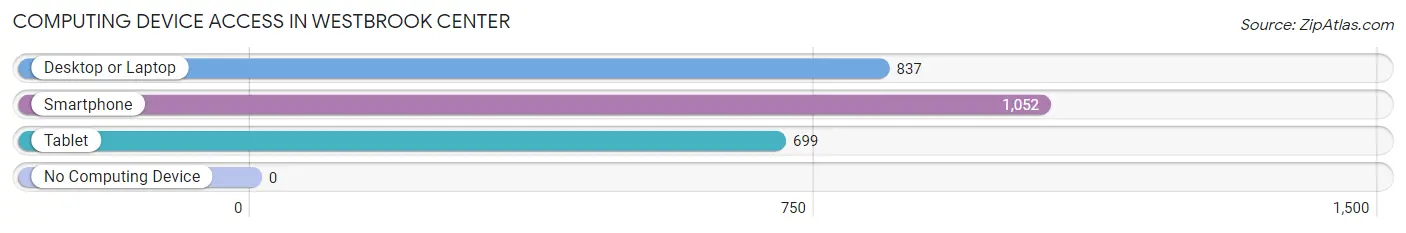
| Device Type | # Households | % Households |
| Desktop or Laptop | 837 | 70.4% |
| Smartphone | 1,052 | 88.5% |
| Tablet | 699 | 58.8% |
| No Computing Device | 0 | 0.0% |
| Total | 1,189 | 100.0% |
Internet Access in Westbrook Center
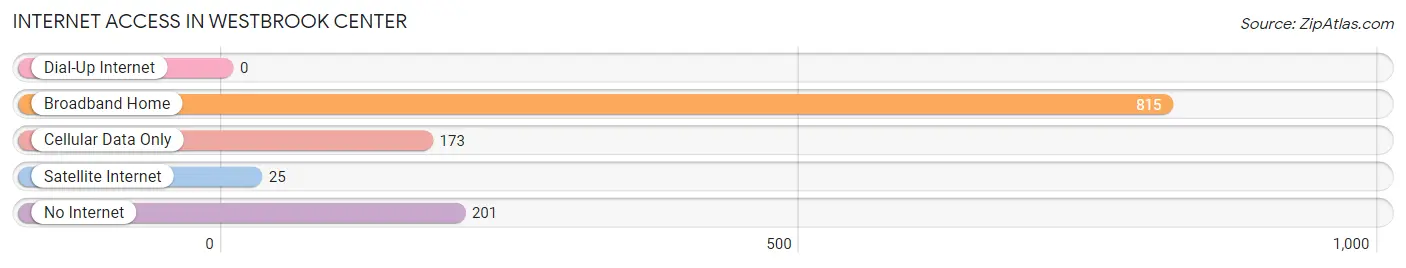
| Internet Type | # Households | % Households |
| Dial-Up Internet | 0 | 0.0% |
| Broadband Home | 815 | 68.5% |
| Cellular Data Only | 173 | 14.5% |
| Satellite Internet | 25 | 2.1% |
| No Internet | 201 | 16.9% |
| Total | 1,189 | 100.0% |
Westbrook Center Summary
Westbrook Center is a census-designated place (CDP) located in Middlesex County, Connecticut. It is situated in the town of Westbrook, and is part of the greater New Haven metropolitan area. As of the 2010 census, the population of Westbrook Center was 1,845.
History
The area that is now Westbrook Center was originally inhabited by the Wangunk Native American tribe. The first European settlers arrived in the area in the 1630s, and the town of Westbrook was officially established in 1635. The town was named after the Westbrook River, which runs through the area.
In the late 19th century, Westbrook Center began to develop as a small village. The first post office was established in 1871, and the first school was built in 1876. The village was officially incorporated as a CDP in 1960.
Geography
Westbrook Center is located in the southeastern corner of Middlesex County, Connecticut. It is situated on the banks of the Westbrook River, and is bordered by the towns of Clinton, Old Saybrook, and Westbrook. The CDP has a total area of 2.2 square miles, all of which is land.
The terrain of Westbrook Center is mostly flat, with some rolling hills. The climate is humid continental, with hot, humid summers and cold, snowy winters.
Economy
The economy of Westbrook Center is largely based on tourism and retail. The town is home to several small businesses, including restaurants, shops, and galleries. There are also several marinas and boatyards located in the area.
The town is also home to several large employers, including the Westbrook Country Club, the Westbrook Yacht Club, and the Westbrook Marina.
Demographics
As of the 2010 census, there were 1,845 people living in Westbrook Center. The racial makeup of the town was 94.3% White, 1.2% African American, 0.7% Native American, 0.7% Asian, 0.1% Pacific Islander, 1.2% from other races, and 1.7% from two or more races. Hispanic or Latino of any race were 3.2% of the population.
The median household income in Westbrook Center was $68,750, and the median family income was $76,250. The per capita income was $30,945. About 4.3% of families and 5.3% of the population were below the poverty line.
Common Questions
What is Per Capita Income in Westbrook Center?
Per Capita income in Westbrook Center is $56,164.
What is the Median Family Income in Westbrook Center?
Median Family Income in Westbrook Center is $136,184.
What is the Median Household income in Westbrook Center?
Median Household Income in Westbrook Center is $69,544.
What is Income or Wage Gap in Westbrook Center?
Income or Wage Gap in Westbrook Center is 32.6%.
Women in Westbrook Center earn 67.4 cents for every dollar earned by a man.
What is Inequality or Gini Index in Westbrook Center?
Inequality or Gini Index in Westbrook Center is 0.51.
What is the Total Population of Westbrook Center?
Total Population of Westbrook Center is 2,317.
What is the Total Male Population of Westbrook Center?
Total Male Population of Westbrook Center is 1,270.
What is the Total Female Population of Westbrook Center?
Total Female Population of Westbrook Center is 1,047.
What is the Ratio of Males per 100 Females in Westbrook Center?
There are 121.30 Males per 100 Females in Westbrook Center.
What is the Ratio of Females per 100 Males in Westbrook Center?
There are 82.44 Females per 100 Males in Westbrook Center.
What is the Median Population Age in Westbrook Center?
Median Population Age in Westbrook Center is 51.2 Years.
What is the Average Family Size in Westbrook Center
Average Family Size in Westbrook Center is 2.5 People.
What is the Average Household Size in Westbrook Center
Average Household Size in Westbrook Center is 1.9 People.
How Large is the Labor Force in Westbrook Center?
There are 1,352 People in the Labor Forcein in Westbrook Center.
What is the Percentage of People in the Labor Force in Westbrook Center?
63.2% of People are in the Labor Force in Westbrook Center.
What is the Unemployment Rate in Westbrook Center?
Unemployment Rate in Westbrook Center is 3.6%.