Pemberwick, CT Map & Demographics
Pemberwick Map
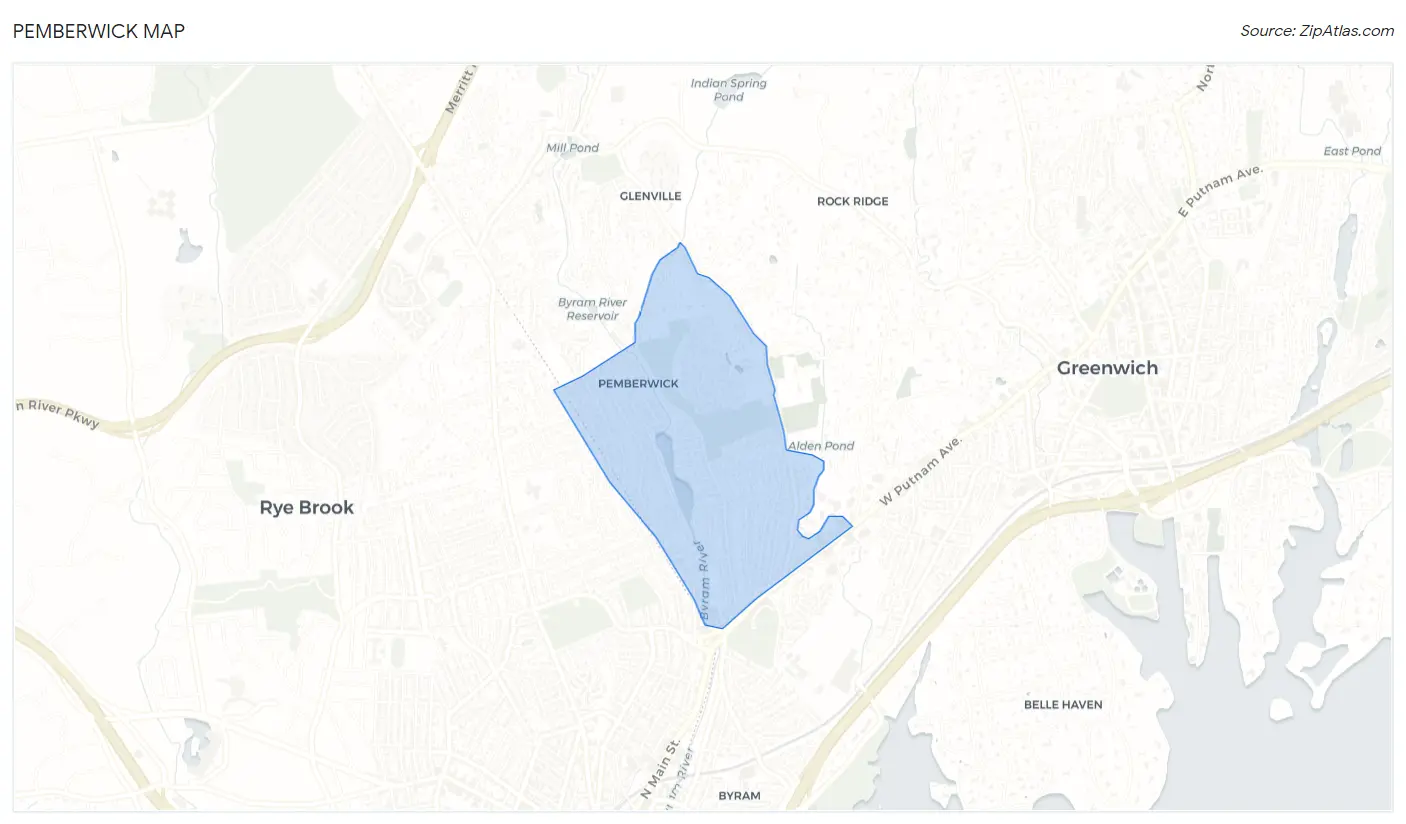
Pemberwick Overview
$61,935
PER CAPITA INCOME
$133,980
AVG FAMILY INCOME
$122,546
AVG HOUSEHOLD INCOME
25.6%
WAGE / INCOME GAP [ % ]
74.4¢/ $1
WAGE / INCOME GAP [ $ ]
0.44
INEQUALITY / GINI INDEX
3,212
TOTAL POPULATION
1,508
MALE POPULATION
1,704
FEMALE POPULATION
88.50
MALES / 100 FEMALES
113.00
FEMALES / 100 MALES
48.1
MEDIAN AGE
2.9
AVG FAMILY SIZE
2.5
AVG HOUSEHOLD SIZE
1,967
LABOR FORCE [ PEOPLE ]
71.4%
PERCENT IN LABOR FORCE
5.4%
UNEMPLOYMENT RATE
Income in Pemberwick
Income Overview in Pemberwick
Per Capita Income in Pemberwick is $61,935, while median incomes of families and households are $133,980 and $122,546 respectively.
| Characteristic | Number | Measure |
| Per Capita Income | 3,212 | $61,935 |
| Median Family Income | 972 | $133,980 |
| Mean Family Income | 972 | $167,927 |
| Median Household Income | 1,297 | $122,546 |
| Mean Household Income | 1,297 | $149,814 |
| Income Deficit | 972 | $0 |
| Wage / Income Gap (%) | 3,212 | 25.57% |
| Wage / Income Gap ($) | 3,212 | 74.43¢ per $1 |
| Gini / Inequality Index | 3,212 | 0.44 |
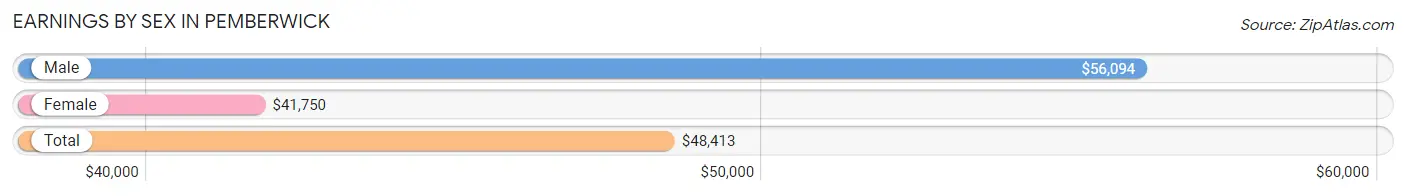
Earnings by Sex in Pemberwick
Average Earnings in Pemberwick are $48,413, $56,094 for men and $41,750 for women, a difference of 25.6%.
| Sex | Number | Average Earnings |
| Male | 972 (49.1%) | $56,094 |
| Female | 1,007 (50.9%) | $41,750 |
| Total | 1,979 (100.0%) | $48,413 |
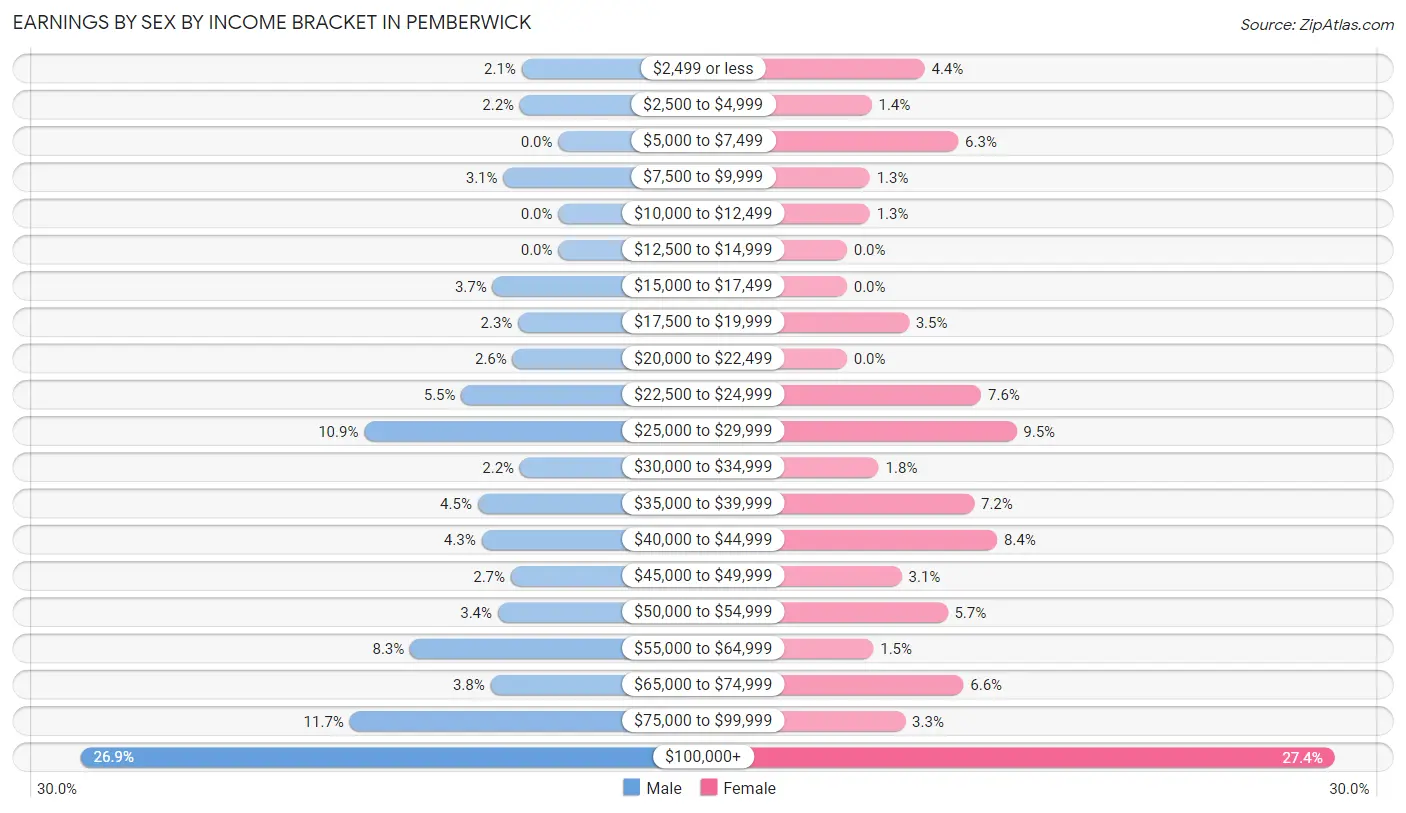
Earnings by Sex by Income Bracket in Pemberwick
The most common earnings brackets in Pemberwick are $100,000+ for men (261 | 26.9%) and $100,000+ for women (276 | 27.4%).
| Income | Male | Female |
| $2,499 or less | 20 (2.1%) | 44 (4.4%) |
| $2,500 to $4,999 | 21 (2.2%) | 14 (1.4%) |
| $5,000 to $7,499 | 0 (0.0%) | 63 (6.3%) |
| $7,500 to $9,999 | 30 (3.1%) | 13 (1.3%) |
| $10,000 to $12,499 | 0 (0.0%) | 13 (1.3%) |
| $12,500 to $14,999 | 0 (0.0%) | 0 (0.0%) |
| $15,000 to $17,499 | 36 (3.7%) | 0 (0.0%) |
| $17,500 to $19,999 | 22 (2.3%) | 35 (3.5%) |
| $20,000 to $22,499 | 25 (2.6%) | 0 (0.0%) |
| $22,500 to $24,999 | 53 (5.4%) | 76 (7.5%) |
| $25,000 to $29,999 | 106 (10.9%) | 96 (9.5%) |
| $30,000 to $34,999 | 21 (2.2%) | 18 (1.8%) |
| $35,000 to $39,999 | 44 (4.5%) | 72 (7.1%) |
| $40,000 to $44,999 | 42 (4.3%) | 85 (8.4%) |
| $45,000 to $49,999 | 26 (2.7%) | 31 (3.1%) |
| $50,000 to $54,999 | 33 (3.4%) | 57 (5.7%) |
| $55,000 to $64,999 | 81 (8.3%) | 15 (1.5%) |
| $65,000 to $74,999 | 37 (3.8%) | 66 (6.6%) |
| $75,000 to $99,999 | 114 (11.7%) | 33 (3.3%) |
| $100,000+ | 261 (26.9%) | 276 (27.4%) |
| Total | 972 (100.0%) | 1,007 (100.0%) |
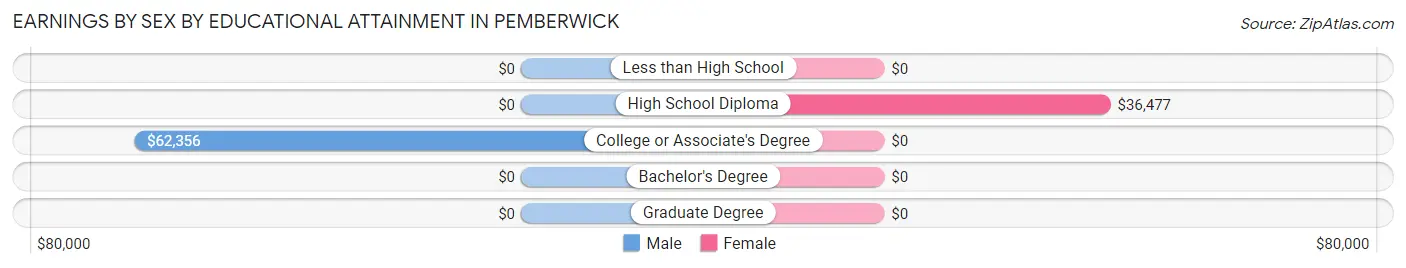
Earnings by Sex by Educational Attainment in Pemberwick
Average earnings in Pemberwick are $60,433 for men and $42,235 for women, a difference of 30.1%. Men with an educational attainment of college or associate's degree enjoy the highest average annual earnings of $62,356, while those with college or associate's degree education earn the least with $62,356. Women with an educational attainment of high school diploma earn the most with the average annual earnings of $36,477, while those with high school diploma education have the smallest earnings of $36,477.
| Educational Attainment | Male Income | Female Income |
| Less than High School | - | - |
| High School Diploma | - | - |
| College or Associate's Degree | $62,356 | $0 |
| Bachelor's Degree | - | - |
| Graduate Degree | - | - |
| Total | $60,433 | $42,235 |
Family Income in Pemberwick
Family Income Brackets in Pemberwick
According to the Pemberwick family income data, there are 315 families falling into the $200,000+ income range, which is the most common income bracket and makes up 32.4% of all families.
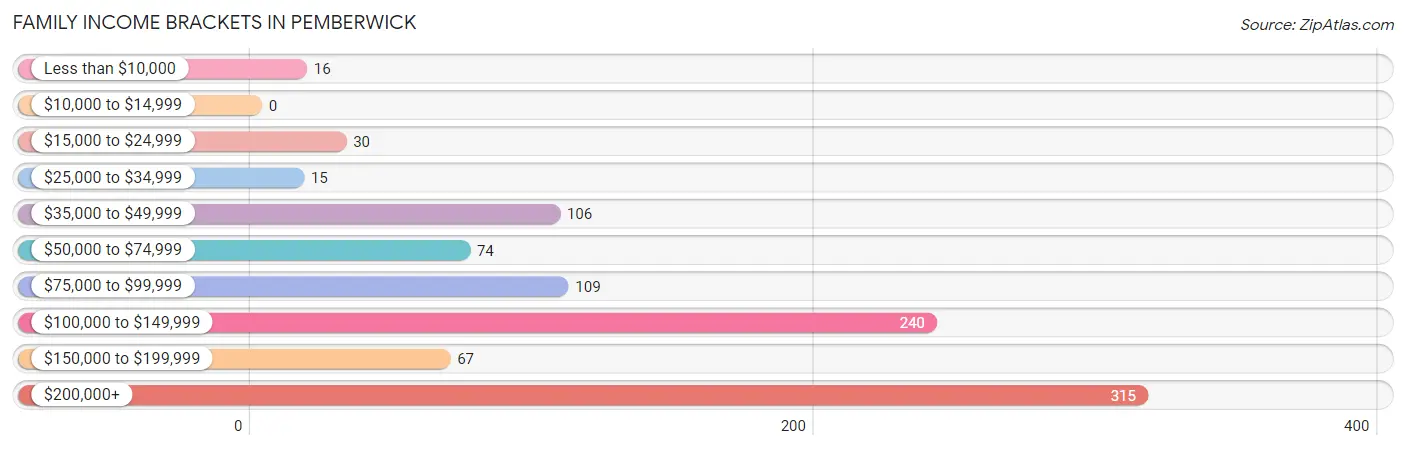
| Income Bracket | # Families | % Families |
| Less than $10,000 | 16 | 1.6% |
| $10,000 to $14,999 | 0 | 0.0% |
| $15,000 to $24,999 | 30 | 3.1% |
| $25,000 to $34,999 | 15 | 1.5% |
| $35,000 to $49,999 | 106 | 10.9% |
| $50,000 to $74,999 | 74 | 7.6% |
| $75,000 to $99,999 | 109 | 11.2% |
| $100,000 to $149,999 | 240 | 24.7% |
| $150,000 to $199,999 | 67 | 6.9% |
| $200,000+ | 315 | 32.4% |
Family Income by Famaliy Size in Pemberwick
4-person families (213 | 21.9%) account for the highest median family income in Pemberwick with $190,987 per family, while 2-person families (557 | 57.3%) have the highest median income of $66,636 per family member.
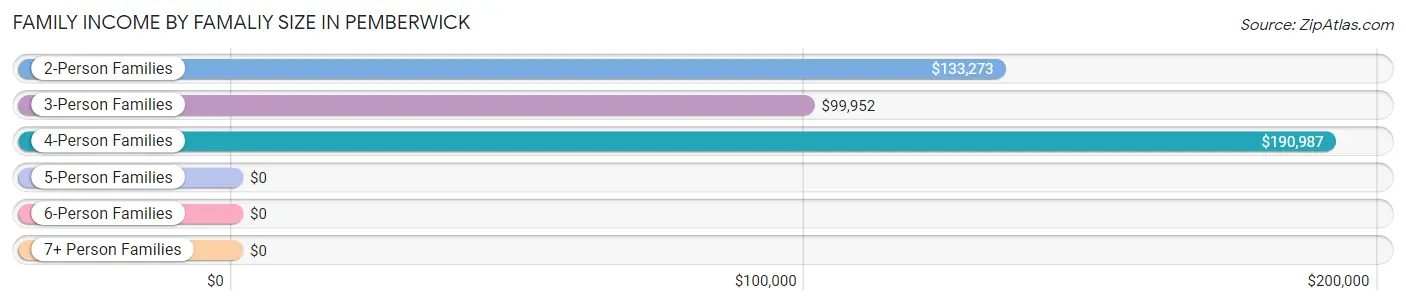
| Income Bracket | # Families | Median Income |
| 2-Person Families | 557 (57.3%) | $133,273 |
| 3-Person Families | 157 (16.2%) | $99,952 |
| 4-Person Families | 213 (21.9%) | $190,987 |
| 5-Person Families | 36 (3.7%) | $0 |
| 6-Person Families | 9 (0.9%) | $0 |
| 7+ Person Families | 0 (0.0%) | $0 |
| Total | 972 (100.0%) | $133,980 |
Family Income by Number of Earners in Pemberwick
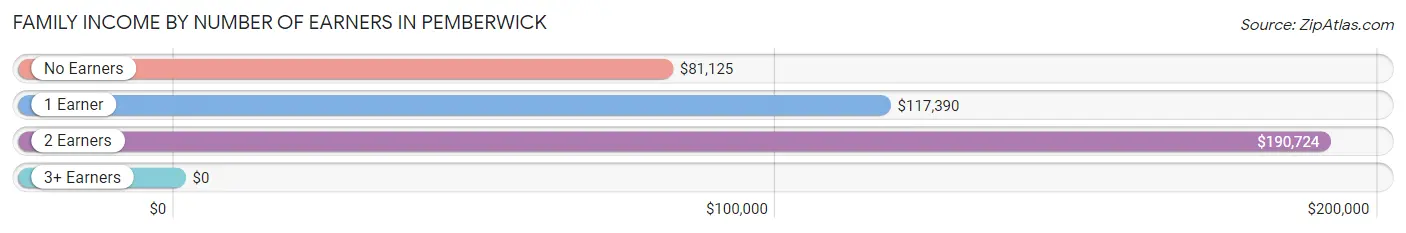
| Number of Earners | # Families | Median Income |
| No Earners | 68 (7.0%) | $81,125 |
| 1 Earner | 323 (33.2%) | $117,390 |
| 2 Earners | 479 (49.3%) | $190,724 |
| 3+ Earners | 102 (10.5%) | $0 |
| Total | 972 (100.0%) | $133,980 |
Household Income in Pemberwick
Household Income Brackets in Pemberwick
With 377 households falling in the category, the $200,000+ income range is the most frequent in Pemberwick, accounting for 29.1% of all households. In contrast, only 16 households (1.2%) fall into the $25,000 to $34,999 income bracket, making it the least populous group.
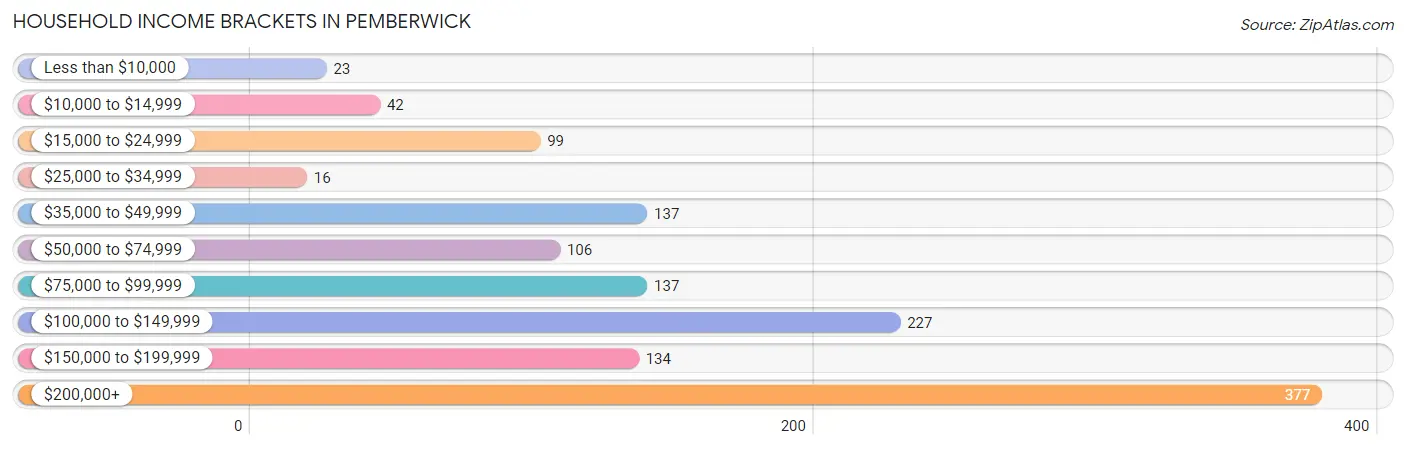
| Income Bracket | # Households | % Households |
| Less than $10,000 | 23 | 1.8% |
| $10,000 to $14,999 | 42 | 3.2% |
| $15,000 to $24,999 | 99 | 7.6% |
| $25,000 to $34,999 | 16 | 1.2% |
| $35,000 to $49,999 | 137 | 10.6% |
| $50,000 to $74,999 | 106 | 8.2% |
| $75,000 to $99,999 | 137 | 10.6% |
| $100,000 to $149,999 | 227 | 17.5% |
| $150,000 to $199,999 | 134 | 10.3% |
| $200,000+ | 377 | 29.1% |
Household Income by Householder Age in Pemberwick
The median household income in Pemberwick is $122,546, with the highest median household income of $163,159 found in the 25 to 44 years age bracket for the primary householder. A total of 433 households (33.4%) fall into this category.
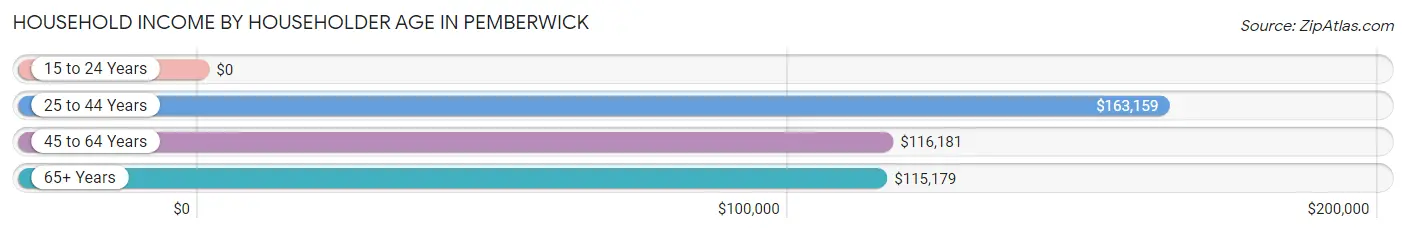
| Income Bracket | # Households | Median Income |
| 15 to 24 Years | 0 (0.0%) | $0 |
| 25 to 44 Years | 433 (33.4%) | $163,159 |
| 45 to 64 Years | 447 (34.5%) | $116,181 |
| 65+ Years | 417 (32.2%) | $115,179 |
| Total | 1,297 (100.0%) | $122,546 |
Poverty in Pemberwick
Income Below Poverty by Sex and Age in Pemberwick
With 5.0% poverty level for males and 5.5% for females among the residents of Pemberwick, 15 year old males and 16 and 17 year old females are the most vulnerable to poverty, with 17 males (100.0%) and 13 females (59.1%) in their respective age groups living below the poverty level.
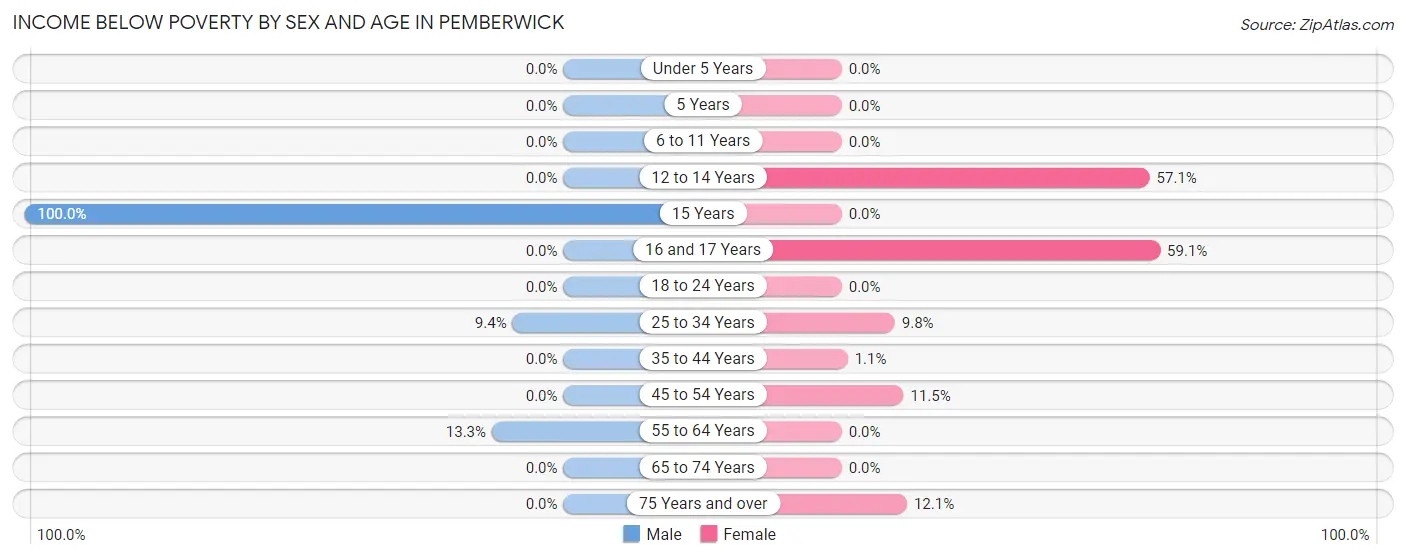
| Age Bracket | Male | Female |
| Under 5 Years | 0 (0.0%) | 0 (0.0%) |
| 5 Years | 0 (0.0%) | 0 (0.0%) |
| 6 to 11 Years | 0 (0.0%) | 0 (0.0%) |
| 12 to 14 Years | 0 (0.0%) | 12 (57.1%) |
| 15 Years | 17 (100.0%) | 0 (0.0%) |
| 16 and 17 Years | 0 (0.0%) | 13 (59.1%) |
| 18 to 24 Years | 0 (0.0%) | 0 (0.0%) |
| 25 to 34 Years | 17 (9.4%) | 18 (9.8%) |
| 35 to 44 Years | 0 (0.0%) | 3 (1.1%) |
| 45 to 54 Years | 0 (0.0%) | 29 (11.5%) |
| 55 to 64 Years | 41 (13.3%) | 0 (0.0%) |
| 65 to 74 Years | 0 (0.0%) | 0 (0.0%) |
| 75 Years and over | 0 (0.0%) | 19 (12.1%) |
| Total | 75 (5.0%) | 94 (5.5%) |
Income Above Poverty by Sex and Age in Pemberwick
According to the poverty statistics in Pemberwick, males aged under 5 years and females aged under 5 years are the age groups that are most secure financially, with 100.0% of males and 100.0% of females in these age groups living above the poverty line.
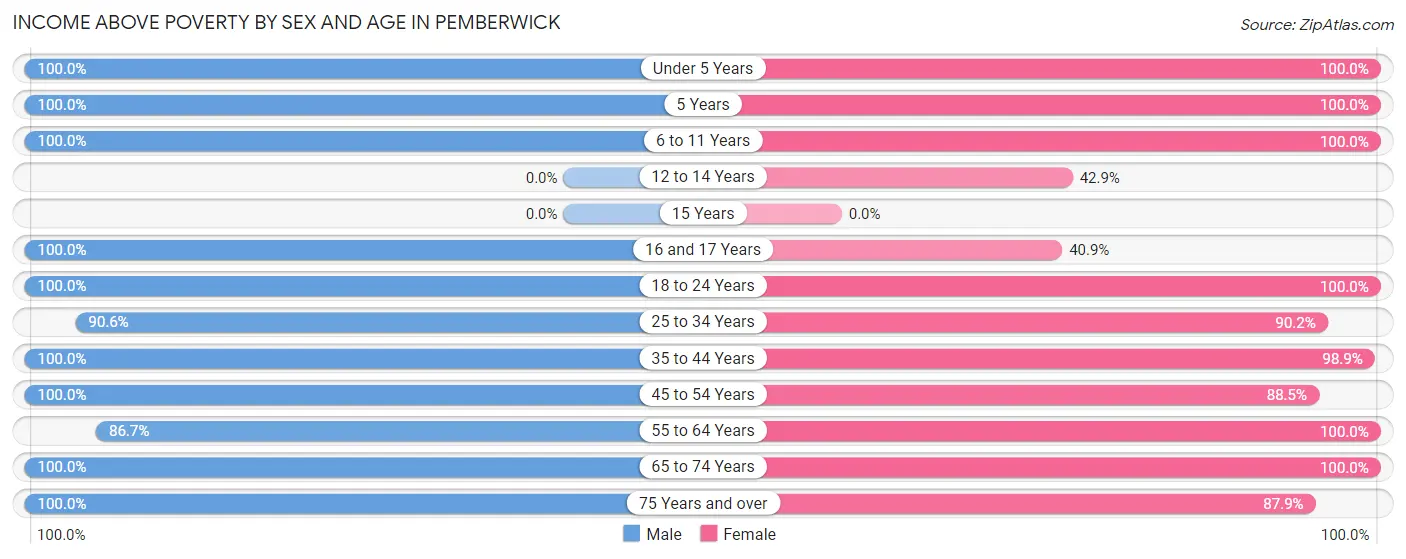
| Age Bracket | Male | Female |
| Under 5 Years | 55 (100.0%) | 91 (100.0%) |
| 5 Years | 32 (100.0%) | 21 (100.0%) |
| 6 to 11 Years | 105 (100.0%) | 115 (100.0%) |
| 12 to 14 Years | 0 (0.0%) | 9 (42.9%) |
| 15 Years | 0 (0.0%) | 0 (0.0%) |
| 16 and 17 Years | 64 (100.0%) | 9 (40.9%) |
| 18 to 24 Years | 138 (100.0%) | 33 (100.0%) |
| 25 to 34 Years | 163 (90.6%) | 165 (90.2%) |
| 35 to 44 Years | 210 (100.0%) | 269 (98.9%) |
| 45 to 54 Years | 75 (100.0%) | 224 (88.5%) |
| 55 to 64 Years | 268 (86.7%) | 342 (100.0%) |
| 65 to 74 Years | 192 (100.0%) | 194 (100.0%) |
| 75 Years and over | 131 (100.0%) | 138 (87.9%) |
| Total | 1,433 (95.0%) | 1,610 (94.5%) |
Income Below Poverty Among Married-Couple Families in Pemberwick
The poverty statistics for married-couple families in Pemberwick show that 2.1% or 17 of the total 821 families live below the poverty line. Families with no children have the highest poverty rate of 3.2%, comprising of 17 families. On the other hand, families with 1 or 2 children have the lowest poverty rate of 0.0%, which includes 0 families.
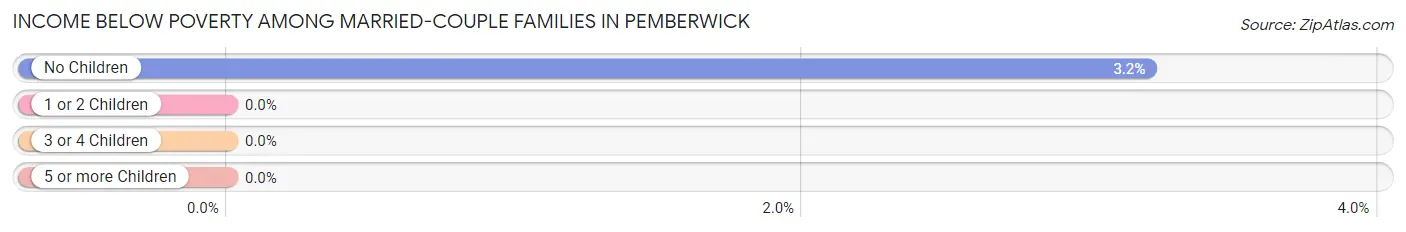
| Children | Above Poverty | Below Poverty |
| No Children | 514 (96.8%) | 17 (3.2%) |
| 1 or 2 Children | 290 (100.0%) | 0 (0.0%) |
| 3 or 4 Children | 0 (0.0%) | 0 (0.0%) |
| 5 or more Children | 0 (0.0%) | 0 (0.0%) |
| Total | 804 (97.9%) | 17 (2.1%) |
Income Below Poverty Among Single-Parent Households in Pemberwick
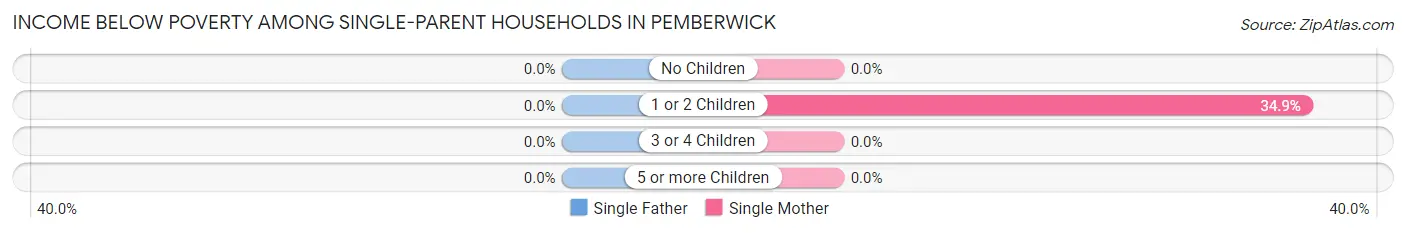
| Children | Single Father | Single Mother |
| No Children | 0 (0.0%) | 0 (0.0%) |
| 1 or 2 Children | 0 (0.0%) | 29 (34.9%) |
| 3 or 4 Children | 0 (0.0%) | 0 (0.0%) |
| 5 or more Children | 0 (0.0%) | 0 (0.0%) |
| Total | 0 (0.0%) | 29 (21.2%) |
Income Below Poverty Among Married-Couple vs Single-Parent Households in Pemberwick
The poverty data for Pemberwick shows that 17 of the married-couple family households (2.1%) and 29 of the single-parent households (19.2%) are living below the poverty level. Within the married-couple family households, those with no children have the highest poverty rate, with 17 households (3.2%) falling below the poverty line. Among the single-parent households, those with 1 or 2 children have the highest poverty rate, with 29 household (34.9%) living below poverty.
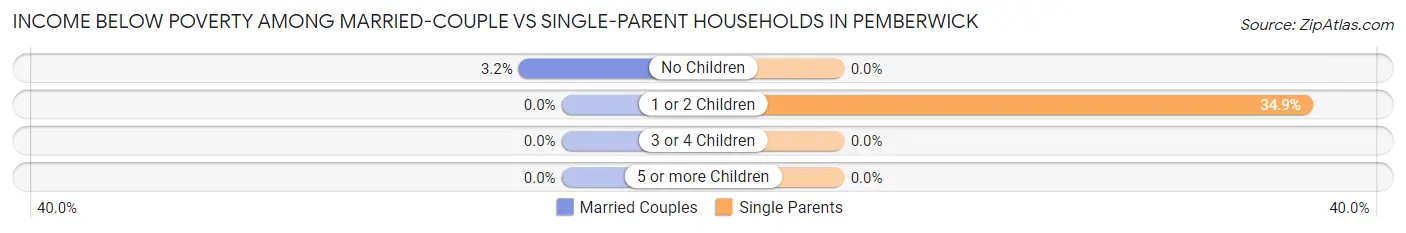
| Children | Married-Couple Families | Single-Parent Households |
| No Children | 17 (3.2%) | 0 (0.0%) |
| 1 or 2 Children | 0 (0.0%) | 29 (34.9%) |
| 3 or 4 Children | 0 (0.0%) | 0 (0.0%) |
| 5 or more Children | 0 (0.0%) | 0 (0.0%) |
| Total | 17 (2.1%) | 29 (19.2%) |
Race in Pemberwick
The most populous races in Pemberwick are White / Caucasian (2,586 | 80.5%), Hispanic or Latino (323 | 10.1%), and Asian (252 | 7.9%).
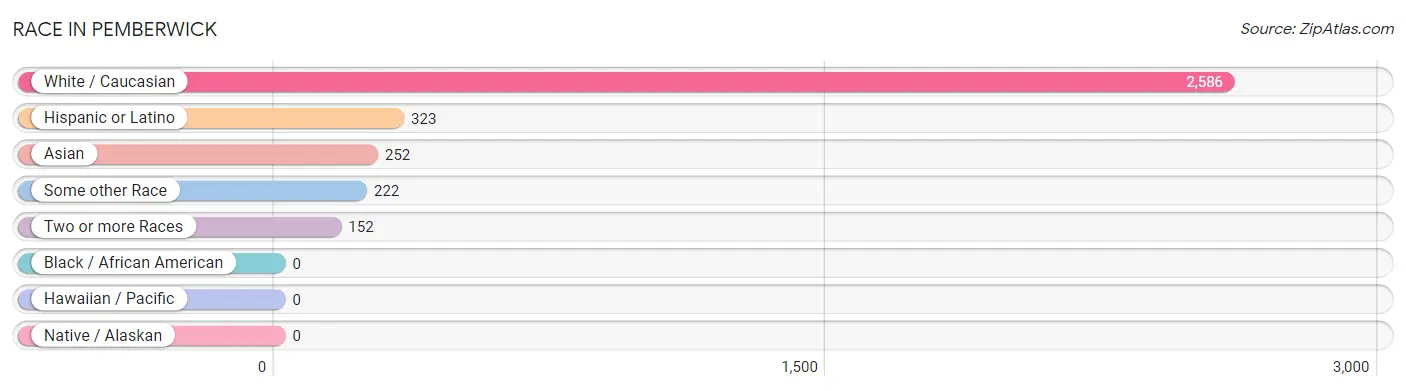
| Race | # Population | % Population |
| Asian | 252 | 7.9% |
| Black / African American | 0 | 0.0% |
| Hawaiian / Pacific | 0 | 0.0% |
| Hispanic or Latino | 323 | 10.1% |
| Native / Alaskan | 0 | 0.0% |
| White / Caucasian | 2,586 | 80.5% |
| Two or more Races | 152 | 4.7% |
| Some other Race | 222 | 6.9% |
| Total | 3,212 | 100.0% |
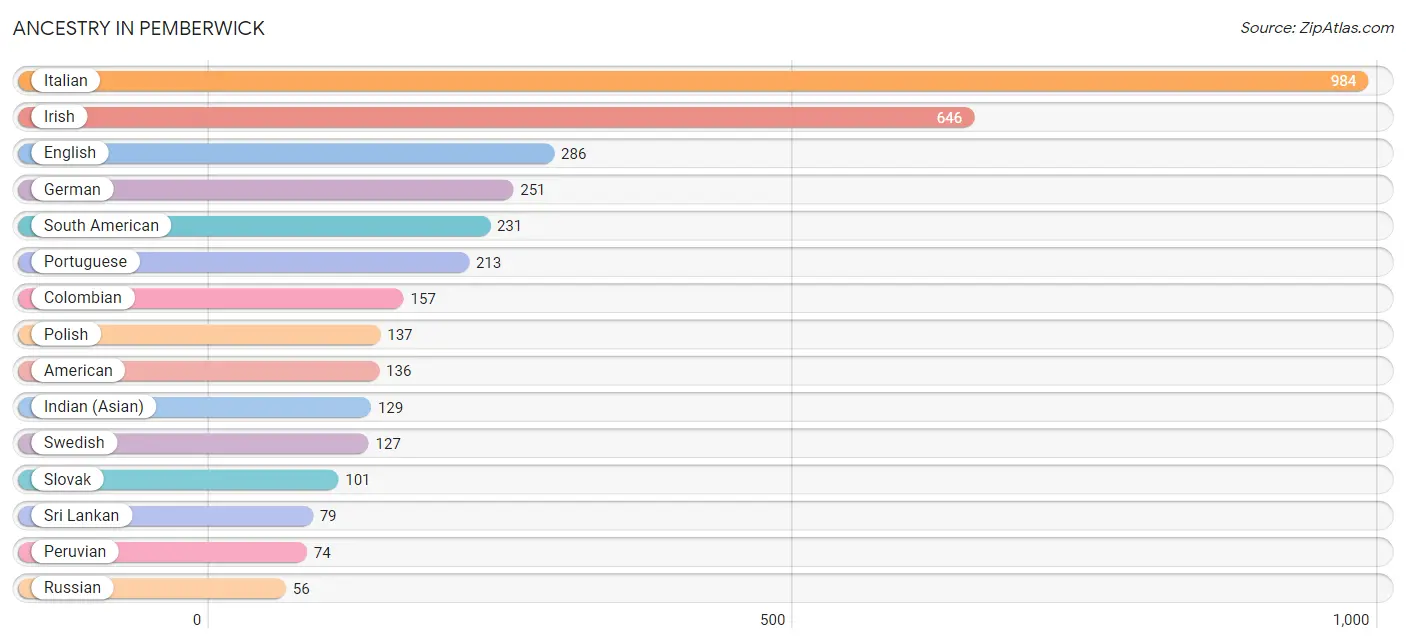
Ancestry in Pemberwick
The most populous ancestries reported in Pemberwick are Italian (984 | 30.6%), Irish (646 | 20.1%), English (286 | 8.9%), German (251 | 7.8%), and South American (231 | 7.2%), together accounting for 74.7% of all Pemberwick residents.
| Ancestry | # Population | % Population |
| Albanian | 20 | 0.6% |
| American | 136 | 4.2% |
| Austrian | 18 | 0.6% |
| Bermudan | 14 | 0.4% |
| Bhutanese | 7 | 0.2% |
| Brazilian | 37 | 1.1% |
| British | 12 | 0.4% |
| Burmese | 22 | 0.7% |
| Colombian | 157 | 4.9% |
| Danish | 32 | 1.0% |
| Dominican | 12 | 0.4% |
| Dutch | 27 | 0.8% |
| English | 286 | 8.9% |
| European | 9 | 0.3% |
| Filipino | 12 | 0.4% |
| French | 48 | 1.5% |
| German | 251 | 7.8% |
| Indian (Asian) | 129 | 4.0% |
| Irish | 646 | 20.1% |
| Italian | 984 | 30.6% |
| Korean | 25 | 0.8% |
| Latvian | 17 | 0.5% |
| Lithuanian | 29 | 0.9% |
| Northern European | 8 | 0.3% |
| Peruvian | 74 | 2.3% |
| Polish | 137 | 4.3% |
| Portuguese | 213 | 6.6% |
| Puerto Rican | 51 | 1.6% |
| Romanian | 55 | 1.7% |
| Russian | 56 | 1.7% |
| Scottish | 23 | 0.7% |
| Slovak | 101 | 3.1% |
| South American | 231 | 7.2% |
| Sri Lankan | 79 | 2.5% |
| Swedish | 127 | 4.0% | View All 35 Rows |
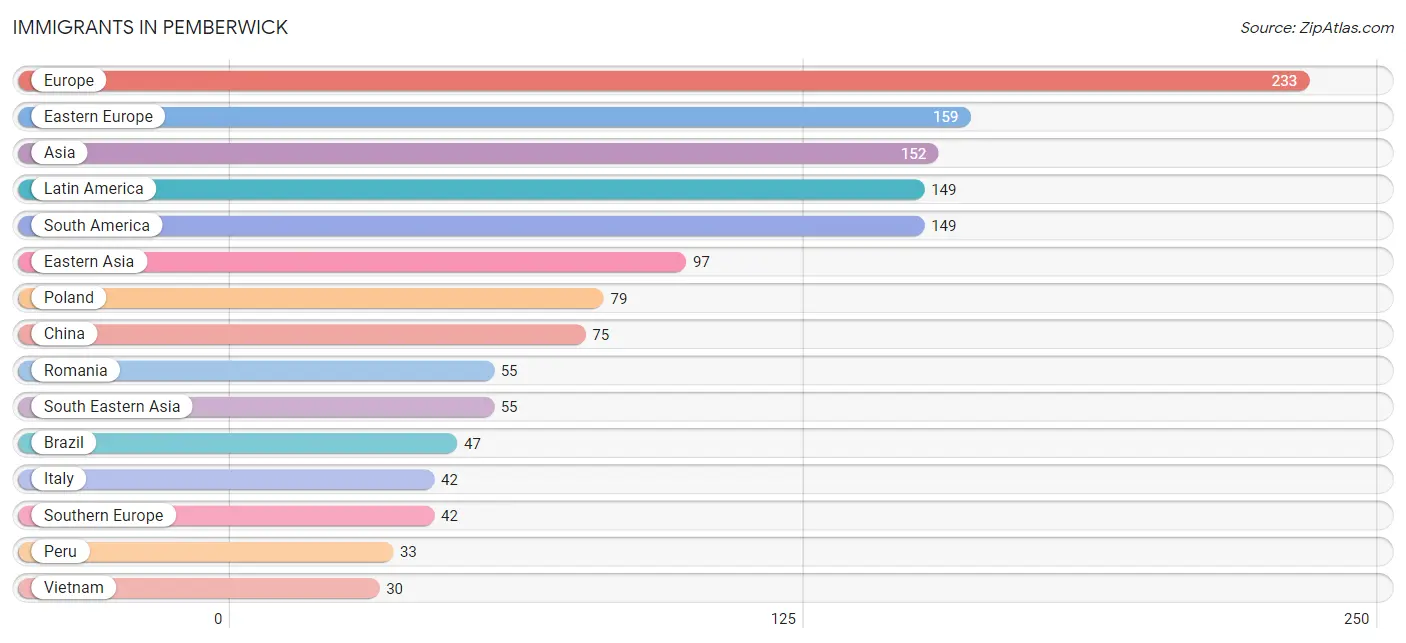
Immigrants in Pemberwick
The most numerous immigrant groups reported in Pemberwick came from Europe (233 | 7.2%), Eastern Europe (159 | 5.0%), Asia (152 | 4.7%), Latin America (149 | 4.6%), and South America (149 | 4.6%), together accounting for 26.2% of all Pemberwick residents.
| Immigration Origin | # Population | % Population |
| Argentina | 25 | 0.8% |
| Asia | 152 | 4.7% |
| Australia | 23 | 0.7% |
| Austria | 18 | 0.6% |
| Brazil | 47 | 1.5% |
| Canada | 9 | 0.3% |
| China | 75 | 2.3% |
| Colombia | 22 | 0.7% |
| Eastern Asia | 97 | 3.0% |
| Eastern Europe | 159 | 5.0% |
| Ecuador | 22 | 0.7% |
| Europe | 233 | 7.2% |
| Italy | 42 | 1.3% |
| Korea | 22 | 0.7% |
| Latin America | 149 | 4.6% |
| Northern Europe | 14 | 0.4% |
| Oceania | 23 | 0.7% |
| Peru | 33 | 1.0% |
| Philippines | 25 | 0.8% |
| Poland | 79 | 2.5% |
| Romania | 55 | 1.7% |
| Russia | 25 | 0.8% |
| Scotland | 14 | 0.4% |
| South America | 149 | 4.6% |
| South Eastern Asia | 55 | 1.7% |
| Southern Europe | 42 | 1.3% |
| Taiwan | 12 | 0.4% |
| Vietnam | 30 | 0.9% |
| Western Europe | 18 | 0.6% | View All 29 Rows |
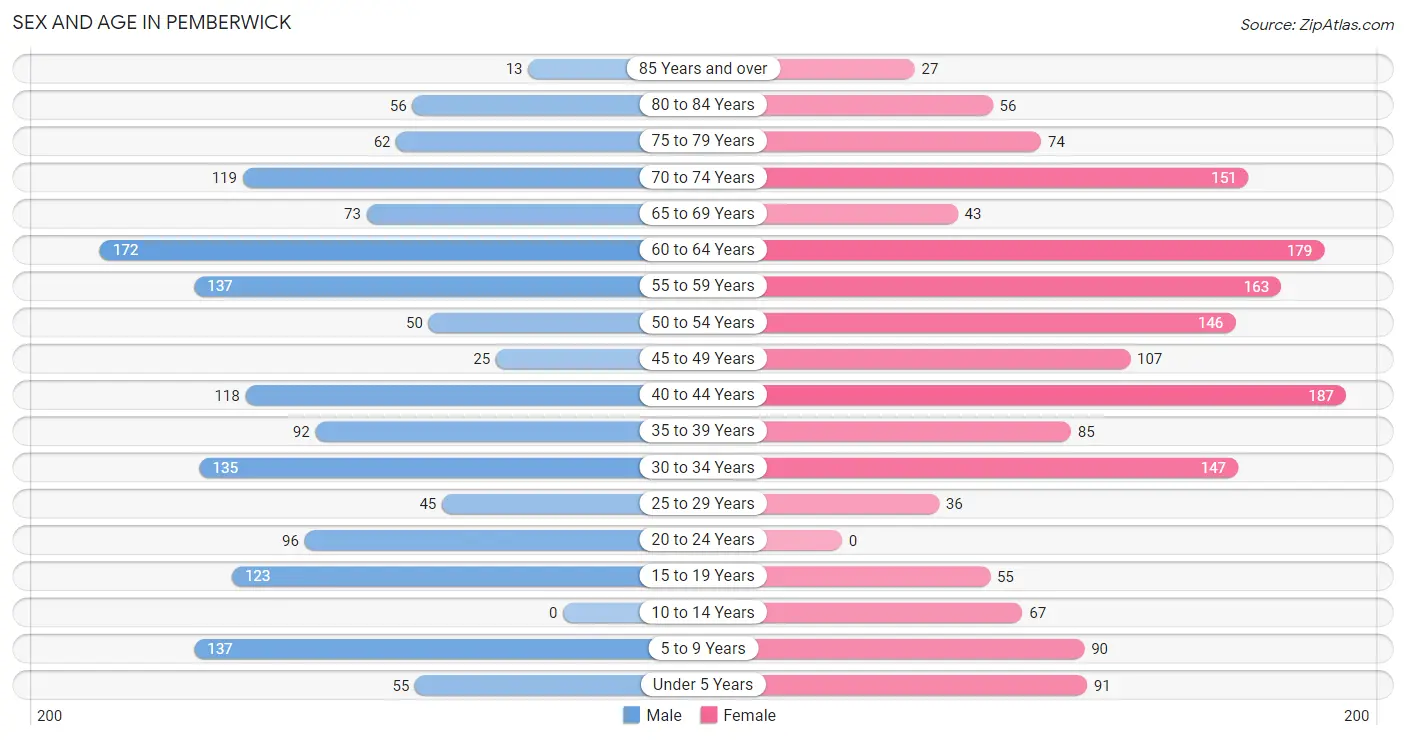
Sex and Age in Pemberwick
Sex and Age in Pemberwick
The most populous age groups in Pemberwick are 60 to 64 Years (172 | 11.4%) for men and 40 to 44 Years (187 | 11.0%) for women.
| Age Bracket | Male | Female |
| Under 5 Years | 55 (3.6%) | 91 (5.3%) |
| 5 to 9 Years | 137 (9.1%) | 90 (5.3%) |
| 10 to 14 Years | 0 (0.0%) | 67 (3.9%) |
| 15 to 19 Years | 123 (8.2%) | 55 (3.2%) |
| 20 to 24 Years | 96 (6.4%) | 0 (0.0%) |
| 25 to 29 Years | 45 (3.0%) | 36 (2.1%) |
| 30 to 34 Years | 135 (8.9%) | 147 (8.6%) |
| 35 to 39 Years | 92 (6.1%) | 85 (5.0%) |
| 40 to 44 Years | 118 (7.8%) | 187 (11.0%) |
| 45 to 49 Years | 25 (1.7%) | 107 (6.3%) |
| 50 to 54 Years | 50 (3.3%) | 146 (8.6%) |
| 55 to 59 Years | 137 (9.1%) | 163 (9.6%) |
| 60 to 64 Years | 172 (11.4%) | 179 (10.5%) |
| 65 to 69 Years | 73 (4.8%) | 43 (2.5%) |
| 70 to 74 Years | 119 (7.9%) | 151 (8.9%) |
| 75 to 79 Years | 62 (4.1%) | 74 (4.3%) |
| 80 to 84 Years | 56 (3.7%) | 56 (3.3%) |
| 85 Years and over | 13 (0.9%) | 27 (1.6%) |
| Total | 1,508 (100.0%) | 1,704 (100.0%) |
Families and Households in Pemberwick
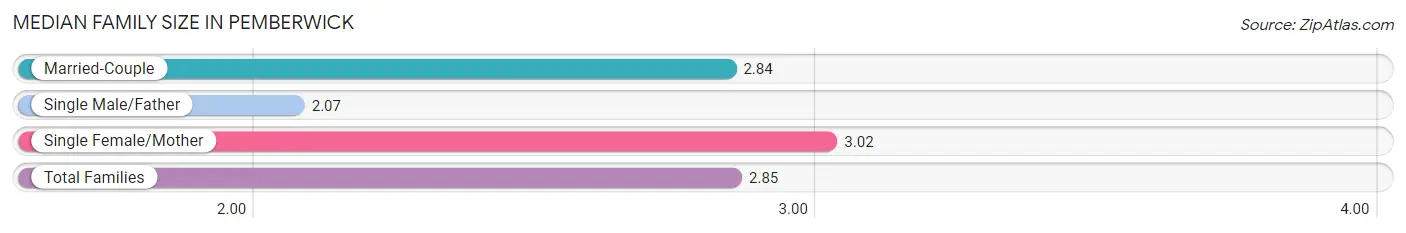
Median Family Size in Pemberwick
The median family size in Pemberwick is 2.85 persons per family, with single female/mother families (137 | 14.1%) accounting for the largest median family size of 3.02 persons per family. On the other hand, single male/father families (14 | 1.4%) represent the smallest median family size with 2.07 persons per family.
| Family Type | # Families | Family Size |
| Married-Couple | 821 (84.5%) | 2.84 |
| Single Male/Father | 14 (1.4%) | 2.07 |
| Single Female/Mother | 137 (14.1%) | 3.02 |
| Total Families | 972 (100.0%) | 2.85 |
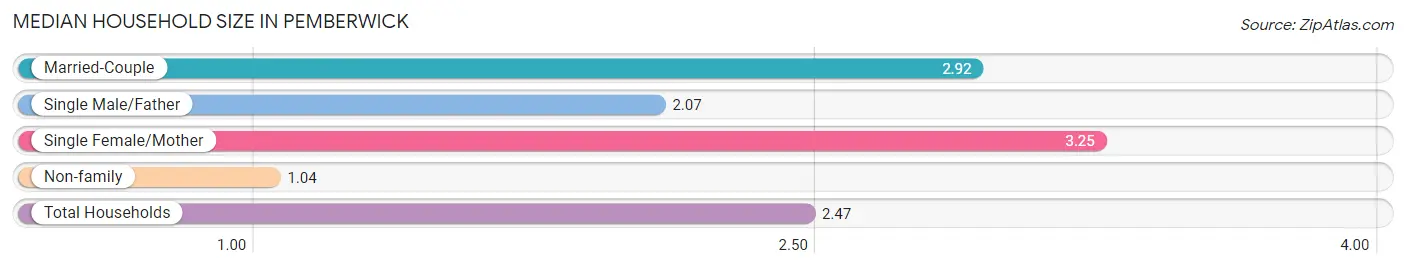
Median Household Size in Pemberwick
The median household size in Pemberwick is 2.47 persons per household, with single female/mother households (137 | 10.6%) accounting for the largest median household size of 3.25 persons per household. non-family households (325 | 25.1%) represent the smallest median household size with 1.04 persons per household.
| Household Type | # Households | Household Size |
| Married-Couple | 821 (63.3%) | 2.92 |
| Single Male/Father | 14 (1.1%) | 2.07 |
| Single Female/Mother | 137 (10.6%) | 3.25 |
| Non-family | 325 (25.1%) | 1.04 |
| Total Households | 1,297 (100.0%) | 2.47 |
Household Size by Marriage Status in Pemberwick
Out of a total of 1,297 households in Pemberwick, 972 (74.9%) are family households, while 325 (25.1%) are nonfamily households. The most numerous type of family households are 2-person households, comprising 499, and the most common type of nonfamily households are 1-person households, comprising 309.
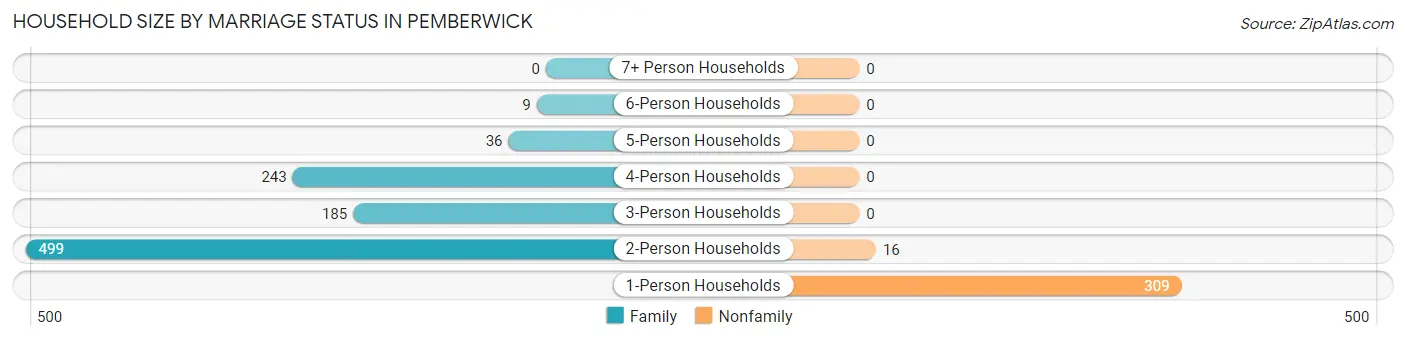
| Household Size | Family Households | Nonfamily Households |
| 1-Person Households | - | 309 (23.8%) |
| 2-Person Households | 499 (38.5%) | 16 (1.2%) |
| 3-Person Households | 185 (14.3%) | 0 (0.0%) |
| 4-Person Households | 243 (18.7%) | 0 (0.0%) |
| 5-Person Households | 36 (2.8%) | 0 (0.0%) |
| 6-Person Households | 9 (0.7%) | 0 (0.0%) |
| 7+ Person Households | 0 (0.0%) | 0 (0.0%) |
| Total | 972 (74.9%) | 325 (25.1%) |
Female Fertility in Pemberwick
Fertility by Age in Pemberwick
Average fertility rate in Pemberwick is 24.0 births per 1,000 women. Women in the age bracket of 20 to 34 years have the highest fertility rate with 82.0 births per 1,000 women. Women in the age bracket of 20 to 34 years acount for 100.0% of all women with births.
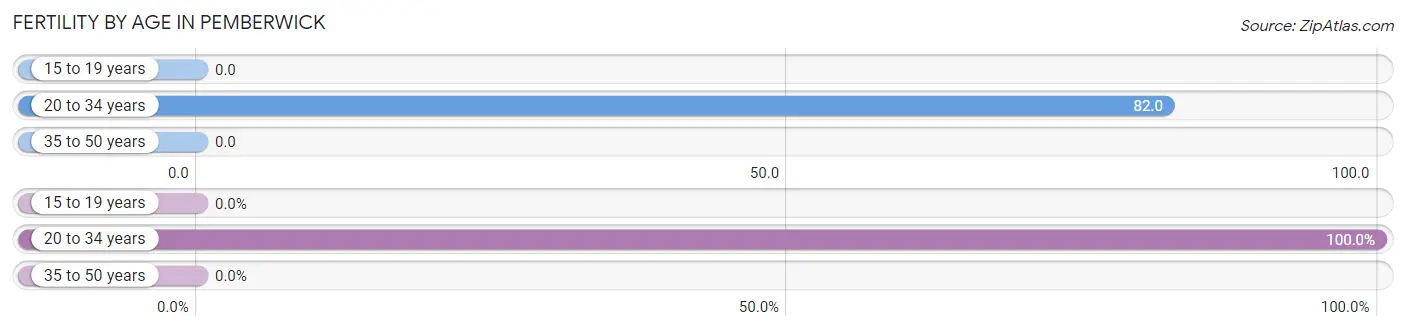
| Age Bracket | Women with Births | Births / 1,000 Women |
| 15 to 19 years | 0 (0.0%) | 0.0 |
| 20 to 34 years | 15 (100.0%) | 82.0 |
| 35 to 50 years | 0 (0.0%) | 0.0 |
| Total | 15 (100.0%) | 24.0 |
Fertility by Age by Marriage Status in Pemberwick
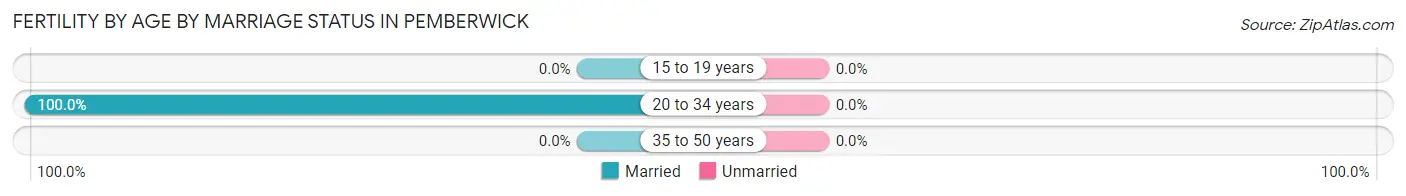
| Age Bracket | Married | Unmarried |
| 15 to 19 years | 0 (0.0%) | 0 (0.0%) |
| 20 to 34 years | 15 (100.0%) | 0 (0.0%) |
| 35 to 50 years | 0 (0.0%) | 0 (0.0%) |
| Total | 15 (100.0%) | 0 (0.0%) |
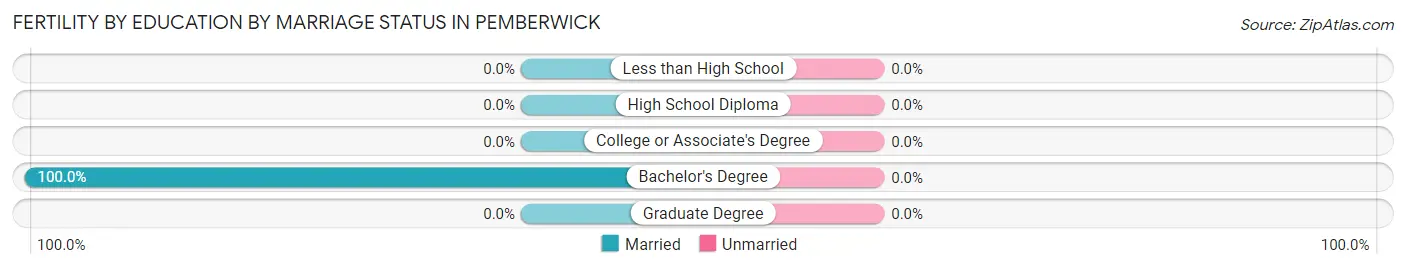
Fertility by Education in Pemberwick
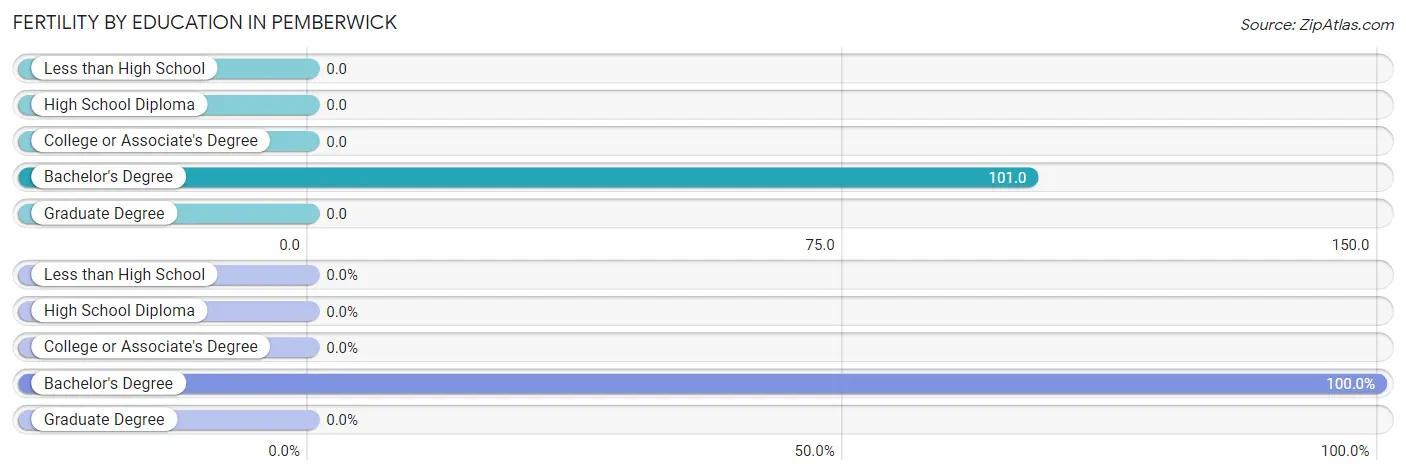
| Educational Attainment | Women with Births | Births / 1,000 Women |
| Less than High School | 0 (0.0%) | 0.0 |
| High School Diploma | 0 (0.0%) | 0.0 |
| College or Associate's Degree | 0 (0.0%) | 0.0 |
| Bachelor's Degree | 15 (100.0%) | 101.0 |
| Graduate Degree | 0 (0.0%) | 0.0 |
| Total | 15 (100.0%) | 24.0 |
Fertility by Education by Marriage Status in Pemberwick
| Educational Attainment | Married | Unmarried |
| Less than High School | 0 (0.0%) | 0 (0.0%) |
| High School Diploma | 0 (0.0%) | 0 (0.0%) |
| College or Associate's Degree | 0 (0.0%) | 0 (0.0%) |
| Bachelor's Degree | 15 (100.0%) | 0 (0.0%) |
| Graduate Degree | 0 (0.0%) | 0 (0.0%) |
| Total | 15 (100.0%) | 0 (0.0%) |
Employment Characteristics in Pemberwick
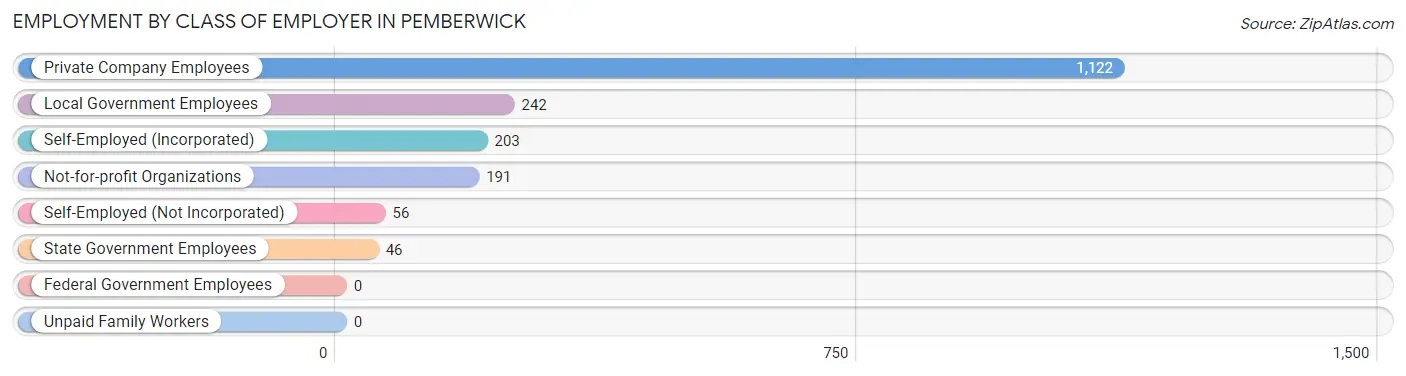
Employment by Class of Employer in Pemberwick
Among the 1,860 employed individuals in Pemberwick, private company employees (1,122 | 60.3%), local government employees (242 | 13.0%), and self-employed (incorporated) (203 | 10.9%) make up the most common classes of employment.
| Employer Class | # Employees | % Employees |
| Private Company Employees | 1,122 | 60.3% |
| Self-Employed (Incorporated) | 203 | 10.9% |
| Self-Employed (Not Incorporated) | 56 | 3.0% |
| Not-for-profit Organizations | 191 | 10.3% |
| Local Government Employees | 242 | 13.0% |
| State Government Employees | 46 | 2.5% |
| Federal Government Employees | 0 | 0.0% |
| Unpaid Family Workers | 0 | 0.0% |
| Total | 1,860 | 100.0% |
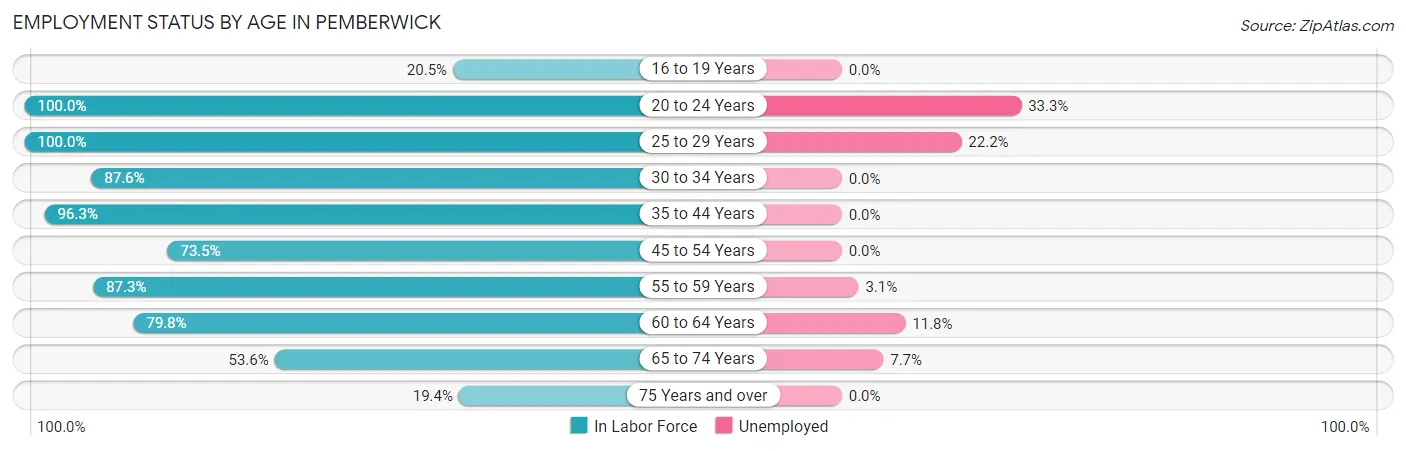
Employment Status by Age in Pemberwick
According to the labor force statistics for Pemberwick, out of the total population over 16 years of age (2,755), 71.4% or 1,967 individuals are in the labor force, with 5.4% or 106 of them unemployed. The age group with the highest labor force participation rate is 20 to 24 years, with 100.0% or 96 individuals in the labor force. Within the labor force, the 20 to 24 years age range has the highest percentage of unemployed individuals, with 33.3% or 32 of them being unemployed.
| Age Bracket | In Labor Force | Unemployed |
| 16 to 19 Years | 33 (20.5%) | 0 (0.0%) |
| 20 to 24 Years | 96 (100.0%) | 32 (33.3%) |
| 25 to 29 Years | 81 (100.0%) | 18 (22.2%) |
| 30 to 34 Years | 247 (87.6%) | 0 (0.0%) |
| 35 to 44 Years | 464 (96.3%) | 0 (0.0%) |
| 45 to 54 Years | 241 (73.5%) | 0 (0.0%) |
| 55 to 59 Years | 262 (87.3%) | 8 (3.1%) |
| 60 to 64 Years | 280 (79.8%) | 33 (11.8%) |
| 65 to 74 Years | 207 (53.6%) | 16 (7.7%) |
| 75 Years and over | 56 (19.4%) | 0 (0.0%) |
| Total | 1,967 (71.4%) | 106 (5.4%) |
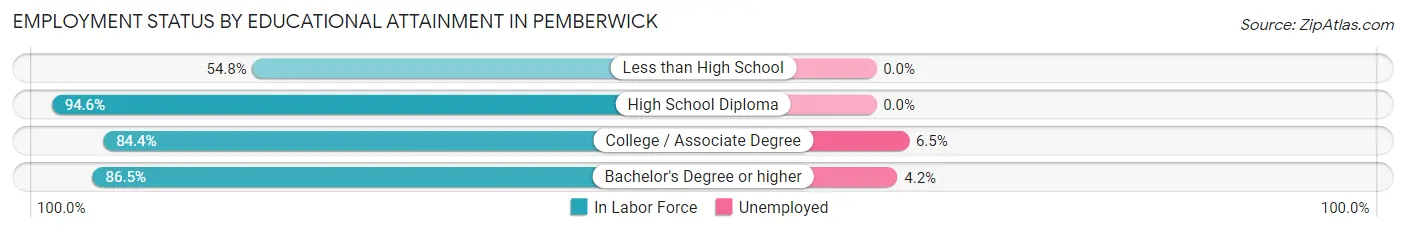
Employment Status by Educational Attainment in Pemberwick
According to labor force statistics for Pemberwick, 86.3% of individuals (1,574) out of the total population between 25 and 64 years of age (1,824) are in the labor force, with 3.7% or 58 of them being unemployed. The group with the highest labor force participation rate are those with the educational attainment of high school diploma, with 94.6% or 282 individuals in the labor force. Within the labor force, individuals with college / associate degree education have the highest percentage of unemployment, with 6.5% or 18 of them being unemployed.
| Educational Attainment | In Labor Force | Unemployed |
| Less than High School | 34 (54.8%) | 0 (0.0%) |
| High School Diploma | 282 (94.6%) | 0 (0.0%) |
| College / Associate Degree | 276 (84.4%) | 21 (6.5%) |
| Bachelor's Degree or higher | 984 (86.5%) | 48 (4.2%) |
| Total | 1,574 (86.3%) | 67 (3.7%) |
Employment Occupations by Sex in Pemberwick
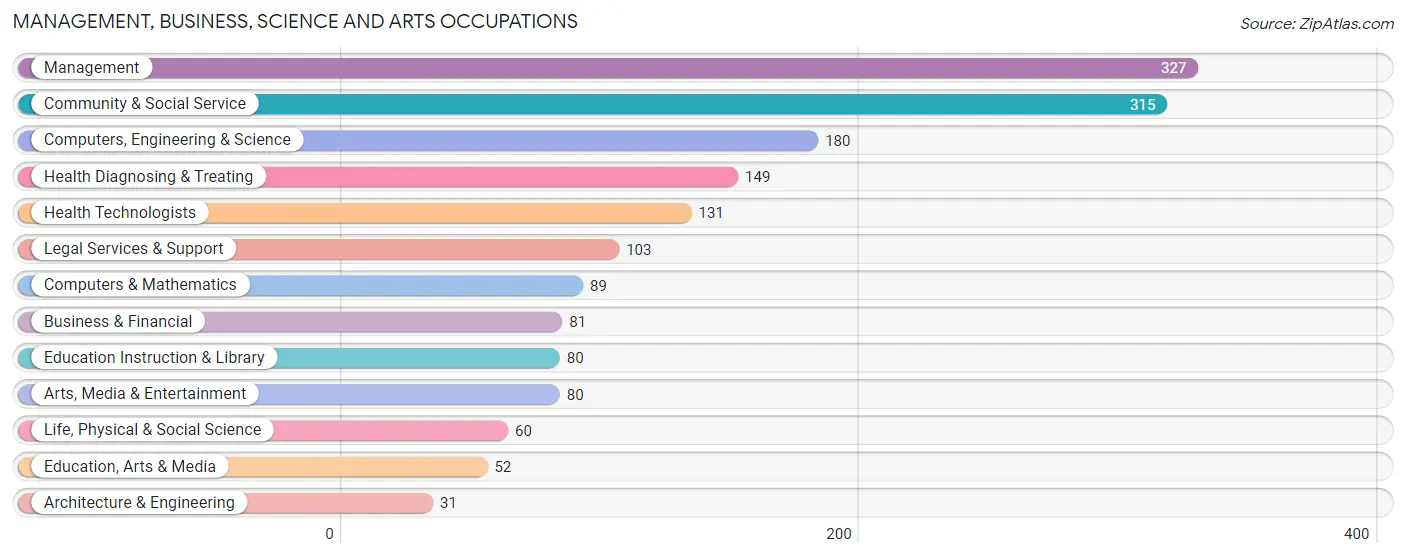
Management, Business, Science and Arts Occupations
The most common Management, Business, Science and Arts occupations in Pemberwick are Management (327 | 17.6%), Community & Social Service (315 | 16.9%), Computers, Engineering & Science (180 | 9.7%), Health Diagnosing & Treating (149 | 8.0%), and Health Technologists (131 | 7.0%).
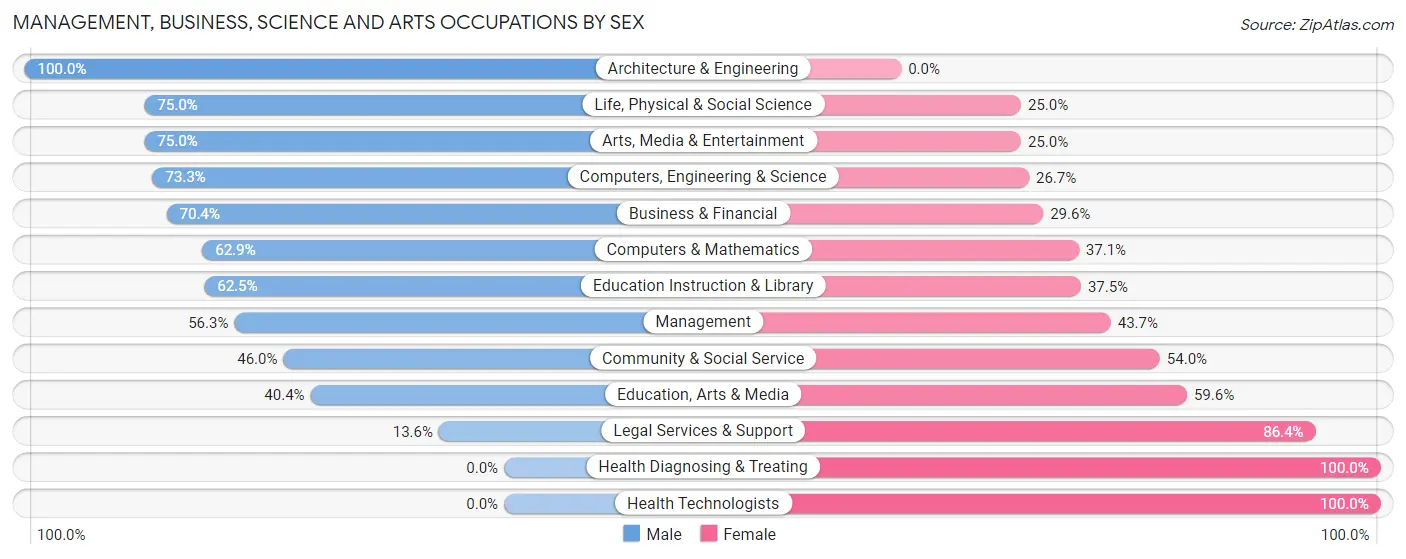
Management, Business, Science and Arts Occupations by Sex
Within the Management, Business, Science and Arts occupations in Pemberwick, the most male-oriented occupations are Architecture & Engineering (100.0%), Life, Physical & Social Science (75.0%), and Arts, Media & Entertainment (75.0%), while the most female-oriented occupations are Health Diagnosing & Treating (100.0%), Health Technologists (100.0%), and Legal Services & Support (86.4%).
| Occupation | Male | Female |
| Management | 184 (56.3%) | 143 (43.7%) |
| Business & Financial | 57 (70.4%) | 24 (29.6%) |
| Computers, Engineering & Science | 132 (73.3%) | 48 (26.7%) |
| Computers & Mathematics | 56 (62.9%) | 33 (37.1%) |
| Architecture & Engineering | 31 (100.0%) | 0 (0.0%) |
| Life, Physical & Social Science | 45 (75.0%) | 15 (25.0%) |
| Community & Social Service | 145 (46.0%) | 170 (54.0%) |
| Education, Arts & Media | 21 (40.4%) | 31 (59.6%) |
| Legal Services & Support | 14 (13.6%) | 89 (86.4%) |
| Education Instruction & Library | 50 (62.5%) | 30 (37.5%) |
| Arts, Media & Entertainment | 60 (75.0%) | 20 (25.0%) |
| Health Diagnosing & Treating | 0 (0.0%) | 149 (100.0%) |
| Health Technologists | 0 (0.0%) | 131 (100.0%) |
| Total (Category) | 518 (49.2%) | 534 (50.8%) |
| Total (Overall) | 898 (48.3%) | 962 (51.7%) |
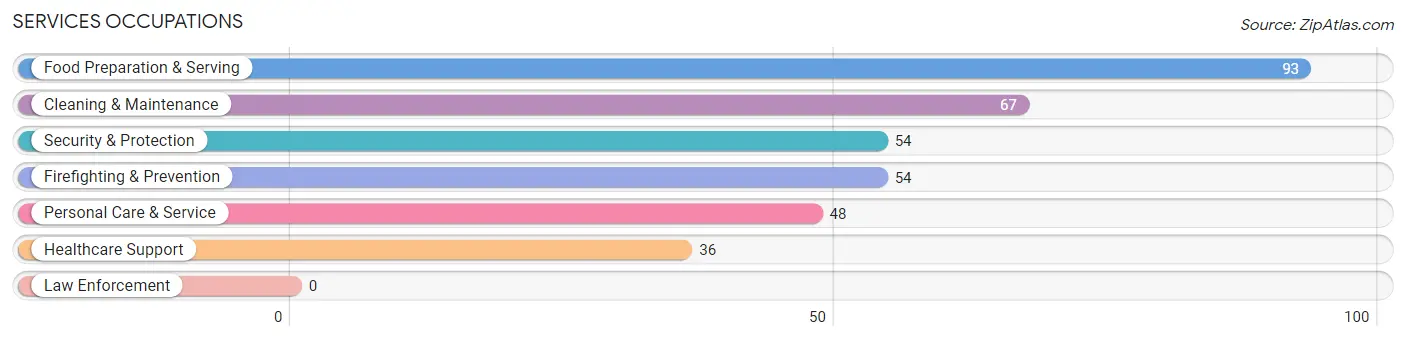
Services Occupations
The most common Services occupations in Pemberwick are Food Preparation & Serving (93 | 5.0%), Cleaning & Maintenance (67 | 3.6%), Security & Protection (54 | 2.9%), Firefighting & Prevention (54 | 2.9%), and Personal Care & Service (48 | 2.6%).
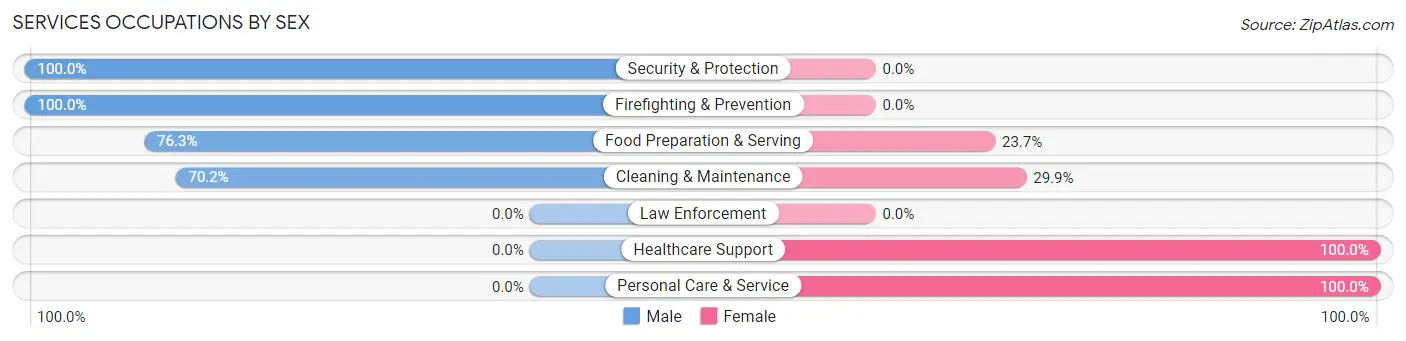
Services Occupations by Sex
Within the Services occupations in Pemberwick, the most male-oriented occupations are Security & Protection (100.0%), Firefighting & Prevention (100.0%), and Food Preparation & Serving (76.3%), while the most female-oriented occupations are Healthcare Support (100.0%), Personal Care & Service (100.0%), and Cleaning & Maintenance (29.8%).
| Occupation | Male | Female |
| Healthcare Support | 0 (0.0%) | 36 (100.0%) |
| Security & Protection | 54 (100.0%) | 0 (0.0%) |
| Firefighting & Prevention | 54 (100.0%) | 0 (0.0%) |
| Law Enforcement | 0 (0.0%) | 0 (0.0%) |
| Food Preparation & Serving | 71 (76.3%) | 22 (23.7%) |
| Cleaning & Maintenance | 47 (70.2%) | 20 (29.8%) |
| Personal Care & Service | 0 (0.0%) | 48 (100.0%) |
| Total (Category) | 172 (57.7%) | 126 (42.3%) |
| Total (Overall) | 898 (48.3%) | 962 (51.7%) |
Sales and Office Occupations
The most common Sales and Office occupations in Pemberwick are Office & Administration (245 | 13.2%), and Sales & Related (102 | 5.5%).
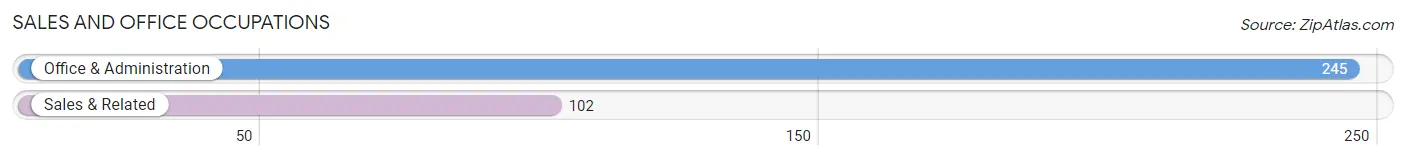
Sales and Office Occupations by Sex
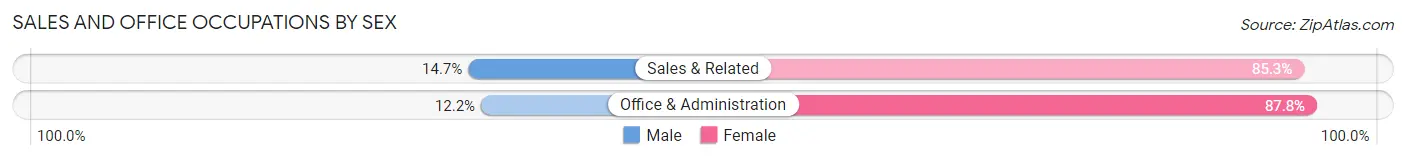
| Occupation | Male | Female |
| Sales & Related | 15 (14.7%) | 87 (85.3%) |
| Office & Administration | 30 (12.2%) | 215 (87.8%) |
| Total (Category) | 45 (13.0%) | 302 (87.0%) |
| Total (Overall) | 898 (48.3%) | 962 (51.7%) |
Natural Resources, Construction and Maintenance Occupations
The most common Natural Resources, Construction and Maintenance occupations in Pemberwick are , and Construction & Extraction (48 | 2.6%).
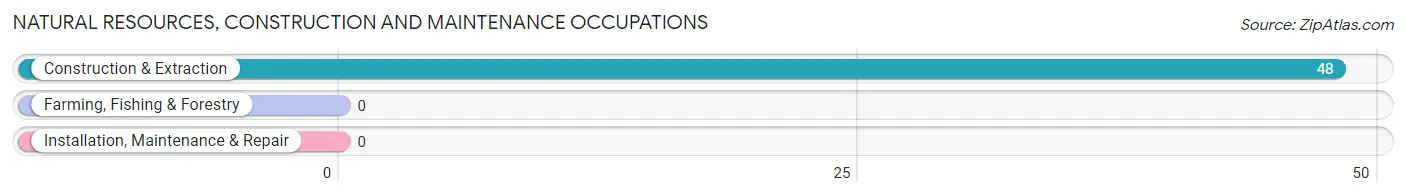
Natural Resources, Construction and Maintenance Occupations by Sex
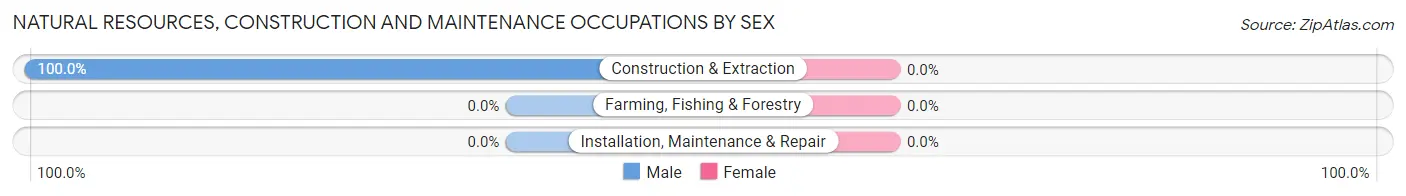
| Occupation | Male | Female |
| Farming, Fishing & Forestry | 0 (0.0%) | 0 (0.0%) |
| Construction & Extraction | 48 (100.0%) | 0 (0.0%) |
| Installation, Maintenance & Repair | 0 (0.0%) | 0 (0.0%) |
| Total (Category) | 48 (100.0%) | 0 (0.0%) |
| Total (Overall) | 898 (48.3%) | 962 (51.7%) |
Production, Transportation and Moving Occupations
The most common Production, Transportation and Moving occupations in Pemberwick are Transportation (65 | 3.5%), and Production (50 | 2.7%).
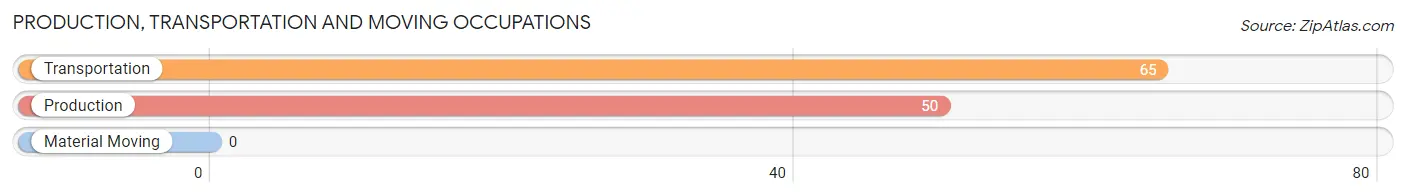
Production, Transportation and Moving Occupations by Sex
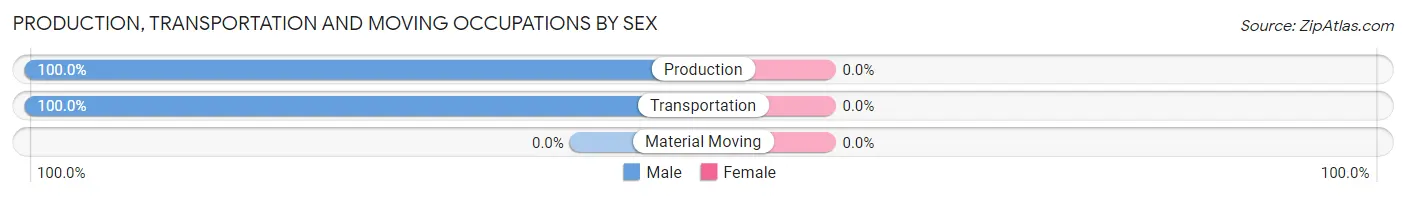
| Occupation | Male | Female |
| Production | 50 (100.0%) | 0 (0.0%) |
| Transportation | 65 (100.0%) | 0 (0.0%) |
| Material Moving | 0 (0.0%) | 0 (0.0%) |
| Total (Category) | 115 (100.0%) | 0 (0.0%) |
| Total (Overall) | 898 (48.3%) | 962 (51.7%) |
Employment Industries by Sex in Pemberwick
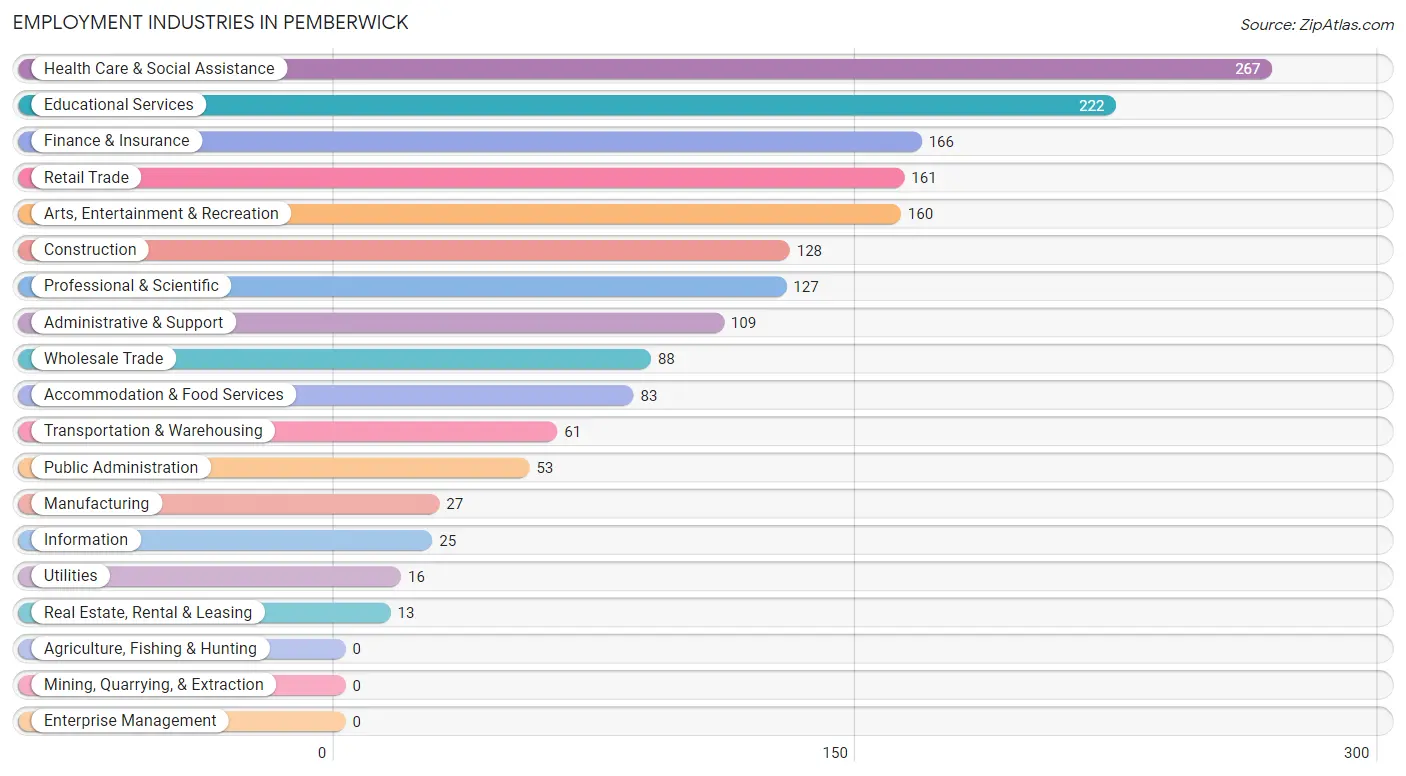
Employment Industries in Pemberwick
The major employment industries in Pemberwick include Health Care & Social Assistance (267 | 14.3%), Educational Services (222 | 11.9%), Finance & Insurance (166 | 8.9%), Retail Trade (161 | 8.7%), and Arts, Entertainment & Recreation (160 | 8.6%).
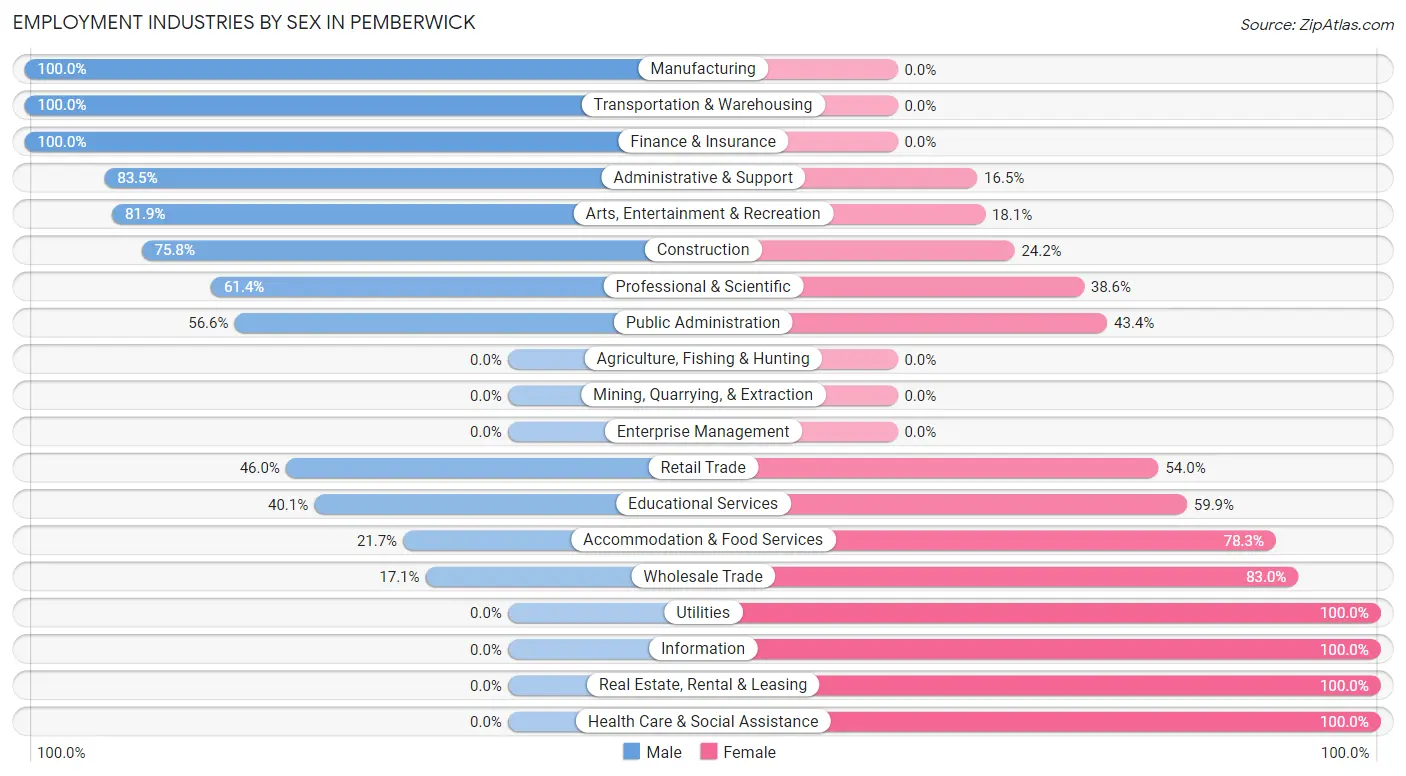
Employment Industries by Sex in Pemberwick
The Pemberwick industries that see more men than women are Manufacturing (100.0%), Transportation & Warehousing (100.0%), and Finance & Insurance (100.0%), whereas the industries that tend to have a higher number of women are Utilities (100.0%), Information (100.0%), and Real Estate, Rental & Leasing (100.0%).
| Industry | Male | Female |
| Agriculture, Fishing & Hunting | 0 (0.0%) | 0 (0.0%) |
| Mining, Quarrying, & Extraction | 0 (0.0%) | 0 (0.0%) |
| Construction | 97 (75.8%) | 31 (24.2%) |
| Manufacturing | 27 (100.0%) | 0 (0.0%) |
| Wholesale Trade | 15 (17.1%) | 73 (83.0%) |
| Retail Trade | 74 (46.0%) | 87 (54.0%) |
| Transportation & Warehousing | 61 (100.0%) | 0 (0.0%) |
| Utilities | 0 (0.0%) | 16 (100.0%) |
| Information | 0 (0.0%) | 25 (100.0%) |
| Finance & Insurance | 166 (100.0%) | 0 (0.0%) |
| Real Estate, Rental & Leasing | 0 (0.0%) | 13 (100.0%) |
| Professional & Scientific | 78 (61.4%) | 49 (38.6%) |
| Enterprise Management | 0 (0.0%) | 0 (0.0%) |
| Administrative & Support | 91 (83.5%) | 18 (16.5%) |
| Educational Services | 89 (40.1%) | 133 (59.9%) |
| Health Care & Social Assistance | 0 (0.0%) | 267 (100.0%) |
| Arts, Entertainment & Recreation | 131 (81.9%) | 29 (18.1%) |
| Accommodation & Food Services | 18 (21.7%) | 65 (78.3%) |
| Public Administration | 30 (56.6%) | 23 (43.4%) |
| Total | 898 (48.3%) | 962 (51.7%) |
Education in Pemberwick
School Enrollment in Pemberwick
The most common levels of schooling among the 691 students in Pemberwick are elementary school (189 | 27.4%), college / undergraduate (182 | 26.3%), and high school (125 | 18.1%).
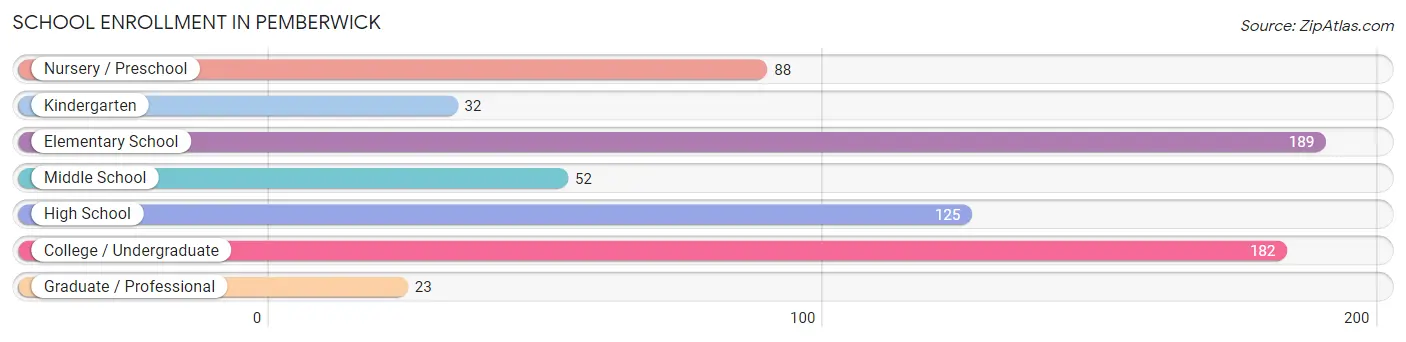
| School Level | # Students | % Students |
| Nursery / Preschool | 88 | 12.7% |
| Kindergarten | 32 | 4.6% |
| Elementary School | 189 | 27.4% |
| Middle School | 52 | 7.5% |
| High School | 125 | 18.1% |
| College / Undergraduate | 182 | 26.3% |
| Graduate / Professional | 23 | 3.3% |
| Total | 691 | 100.0% |
School Enrollment by Age by Funding Source in Pemberwick
Out of a total of 691 students who are enrolled in schools in Pemberwick, 204 (29.5%) attend a private institution, while the remaining 487 (70.5%) are enrolled in public schools. The age group of 20 to 24 year olds has the highest likelihood of being enrolled in private schools, with 64 (100.0% in the age bracket) enrolled. Conversely, the age group of 5 to 9 year old has the lowest likelihood of being enrolled in a private school, with 227 (100.0% in the age bracket) attending a public institution.
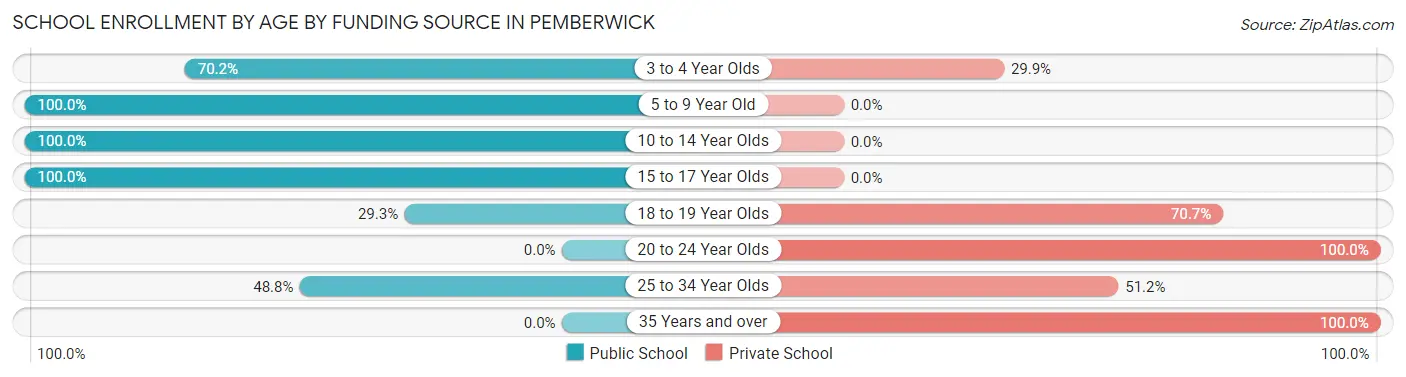
| Age Bracket | Public School | Private School |
| 3 to 4 Year Olds | 47 (70.2%) | 20 (29.8%) |
| 5 to 9 Year Old | 227 (100.0%) | 0 (0.0%) |
| 10 to 14 Year Olds | 67 (100.0%) | 0 (0.0%) |
| 15 to 17 Year Olds | 103 (100.0%) | 0 (0.0%) |
| 18 to 19 Year Olds | 22 (29.3%) | 53 (70.7%) |
| 20 to 24 Year Olds | 0 (0.0%) | 64 (100.0%) |
| 25 to 34 Year Olds | 21 (48.8%) | 22 (51.2%) |
| 35 Years and over | 0 (0.0%) | 45 (100.0%) |
| Total | 487 (70.5%) | 204 (29.5%) |
Educational Attainment by Field of Study in Pemberwick
Business (364 | 23.8%), education (190 | 12.4%), social sciences (176 | 11.5%), communications (103 | 6.7%), and science & technology (102 | 6.7%) are the most common fields of study among 1,528 individuals in Pemberwick who have obtained a bachelor's degree or higher.
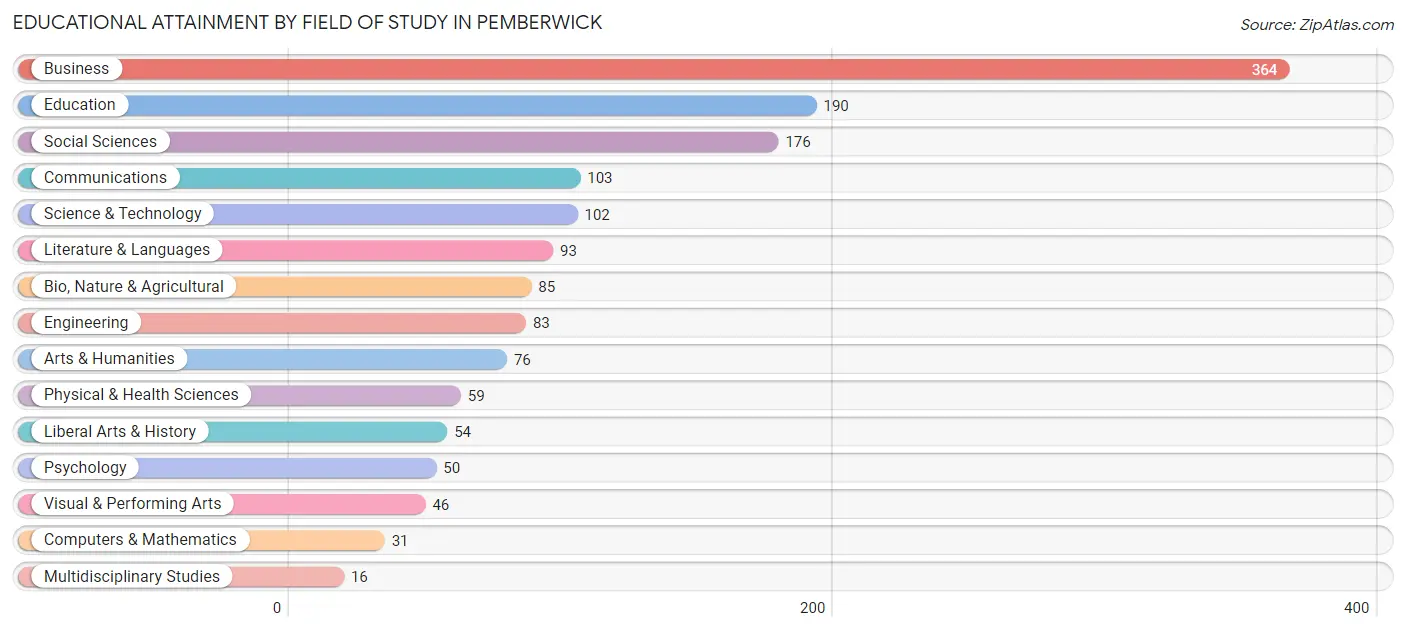
| Field of Study | # Graduates | % Graduates |
| Computers & Mathematics | 31 | 2.0% |
| Bio, Nature & Agricultural | 85 | 5.6% |
| Physical & Health Sciences | 59 | 3.9% |
| Psychology | 50 | 3.3% |
| Social Sciences | 176 | 11.5% |
| Engineering | 83 | 5.4% |
| Multidisciplinary Studies | 16 | 1.1% |
| Science & Technology | 102 | 6.7% |
| Business | 364 | 23.8% |
| Education | 190 | 12.4% |
| Literature & Languages | 93 | 6.1% |
| Liberal Arts & History | 54 | 3.5% |
| Visual & Performing Arts | 46 | 3.0% |
| Communications | 103 | 6.7% |
| Arts & Humanities | 76 | 5.0% |
| Total | 1,528 | 100.0% |
Transportation & Commute in Pemberwick
Vehicle Availability by Sex in Pemberwick
The most prevalent vehicle ownership categories in Pemberwick are males with 2 vehicles (432, accounting for 48.1%) and females with 2 vehicles (484, making up 44.9%).
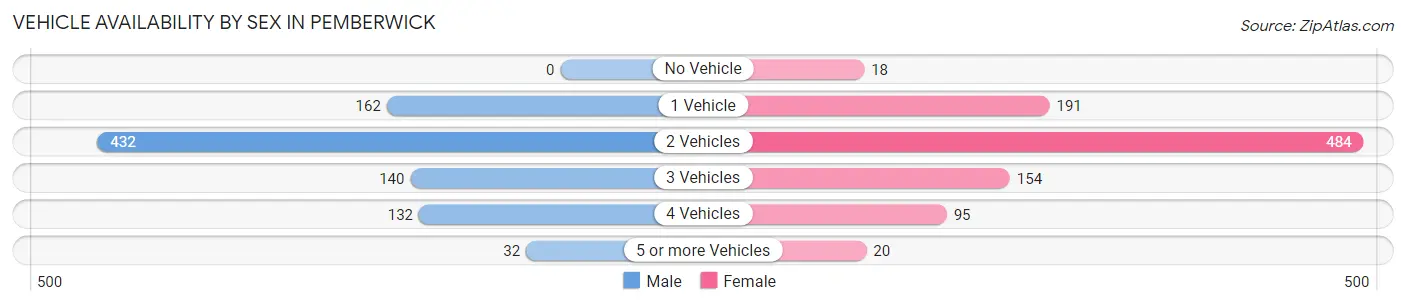
| Vehicles Available | Male | Female |
| No Vehicle | 0 (0.0%) | 18 (1.9%) |
| 1 Vehicle | 162 (18.0%) | 191 (19.9%) |
| 2 Vehicles | 432 (48.1%) | 484 (50.3%) |
| 3 Vehicles | 140 (15.6%) | 154 (16.0%) |
| 4 Vehicles | 132 (14.7%) | 95 (9.9%) |
| 5 or more Vehicles | 32 (3.6%) | 20 (2.1%) |
| Total | 898 (100.0%) | 962 (100.0%) |
Commute Time in Pemberwick
The most frequently occuring commute durations in Pemberwick are 15 to 19 minutes (400 commuters, 25.4%), 10 to 14 minutes (354 commuters, 22.5%), and 5 to 9 minutes (235 commuters, 14.9%).
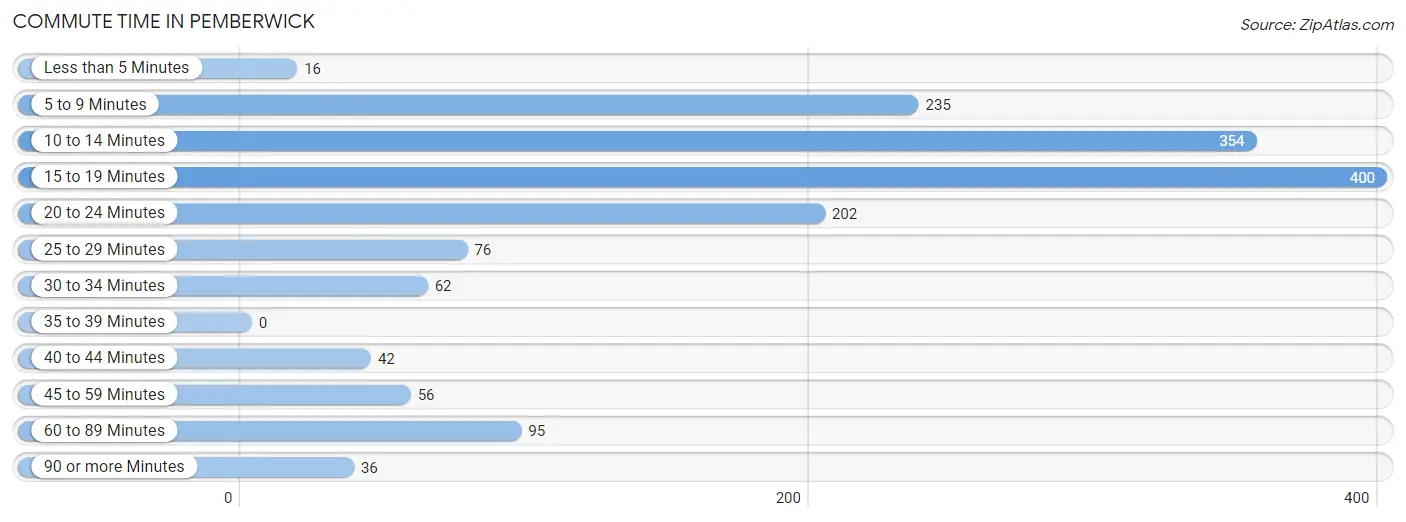
| Commute Time | # Commuters | % Commuters |
| Less than 5 Minutes | 16 | 1.0% |
| 5 to 9 Minutes | 235 | 14.9% |
| 10 to 14 Minutes | 354 | 22.5% |
| 15 to 19 Minutes | 400 | 25.4% |
| 20 to 24 Minutes | 202 | 12.8% |
| 25 to 29 Minutes | 76 | 4.8% |
| 30 to 34 Minutes | 62 | 3.9% |
| 35 to 39 Minutes | 0 | 0.0% |
| 40 to 44 Minutes | 42 | 2.7% |
| 45 to 59 Minutes | 56 | 3.6% |
| 60 to 89 Minutes | 95 | 6.0% |
| 90 or more Minutes | 36 | 2.3% |
Commute Time by Sex in Pemberwick
The most common commute times in Pemberwick are 5 to 9 minutes (165 commuters, 21.4%) for males and 15 to 19 minutes (283 commuters, 35.2%) for females.
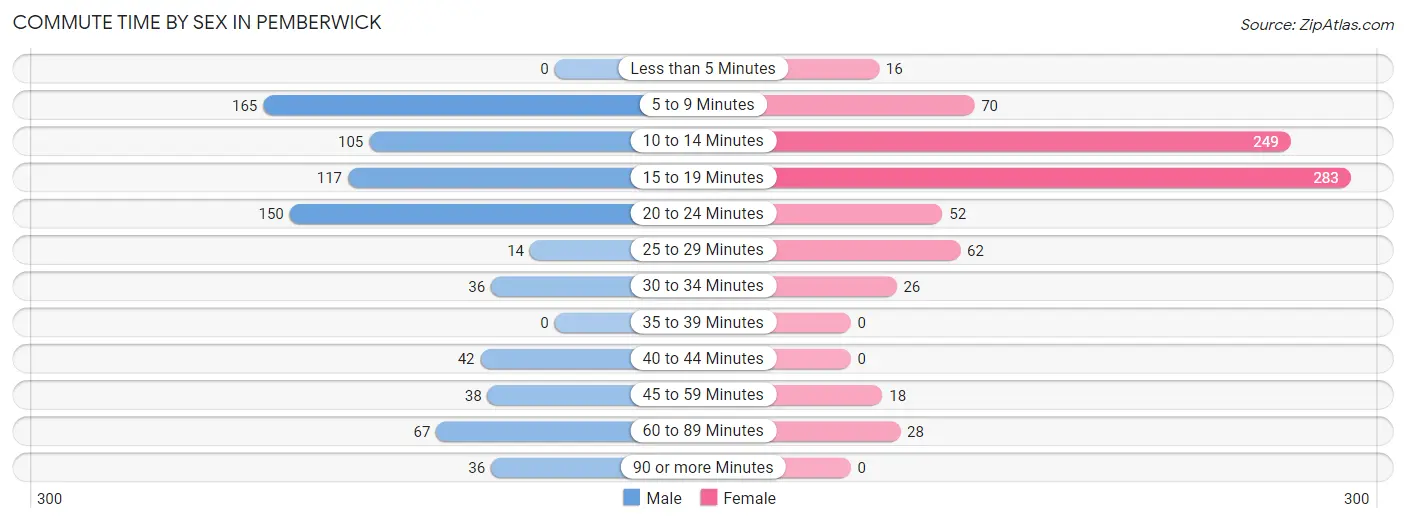
| Commute Time | Male | Female |
| Less than 5 Minutes | 0 (0.0%) | 16 (2.0%) |
| 5 to 9 Minutes | 165 (21.4%) | 70 (8.7%) |
| 10 to 14 Minutes | 105 (13.6%) | 249 (31.0%) |
| 15 to 19 Minutes | 117 (15.2%) | 283 (35.2%) |
| 20 to 24 Minutes | 150 (19.5%) | 52 (6.5%) |
| 25 to 29 Minutes | 14 (1.8%) | 62 (7.7%) |
| 30 to 34 Minutes | 36 (4.7%) | 26 (3.2%) |
| 35 to 39 Minutes | 0 (0.0%) | 0 (0.0%) |
| 40 to 44 Minutes | 42 (5.4%) | 0 (0.0%) |
| 45 to 59 Minutes | 38 (4.9%) | 18 (2.2%) |
| 60 to 89 Minutes | 67 (8.7%) | 28 (3.5%) |
| 90 or more Minutes | 36 (4.7%) | 0 (0.0%) |
Time of Departure to Work by Sex in Pemberwick
The most frequent times of departure to work in Pemberwick are 7:00 AM to 7:29 AM (186, 24.2%) for males and 8:30 AM to 8:59 AM (190, 23.6%) for females.
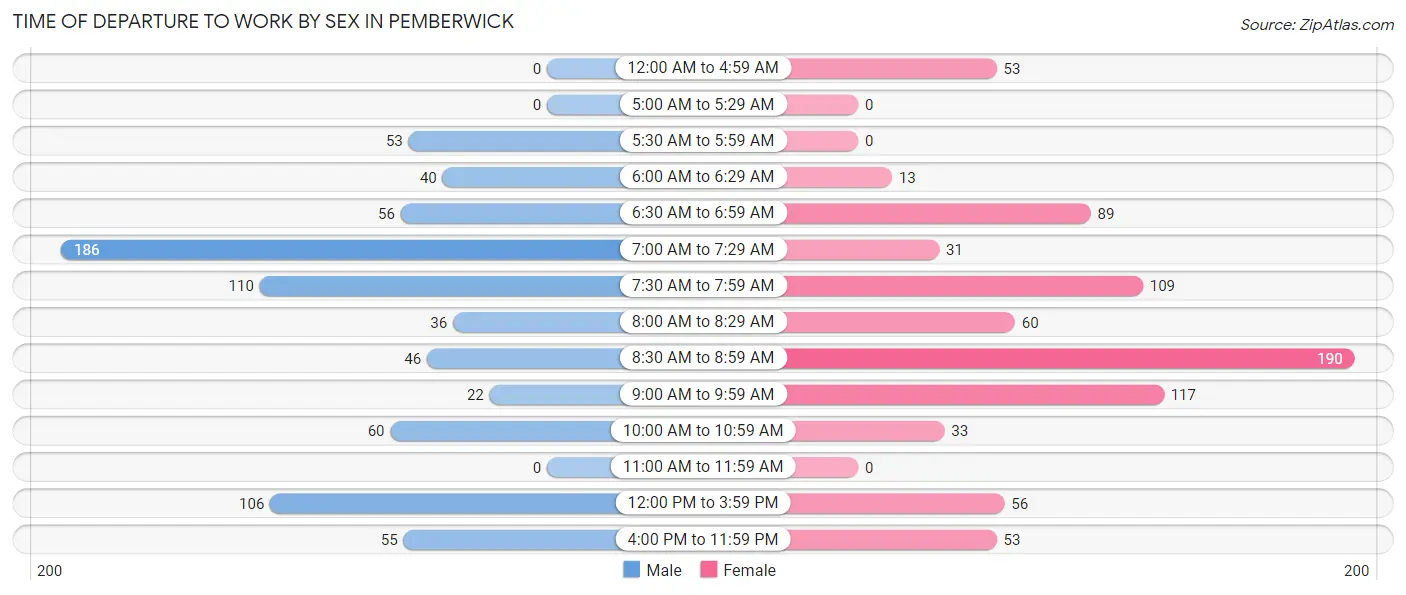
| Time of Departure | Male | Female |
| 12:00 AM to 4:59 AM | 0 (0.0%) | 53 (6.6%) |
| 5:00 AM to 5:29 AM | 0 (0.0%) | 0 (0.0%) |
| 5:30 AM to 5:59 AM | 53 (6.9%) | 0 (0.0%) |
| 6:00 AM to 6:29 AM | 40 (5.2%) | 13 (1.6%) |
| 6:30 AM to 6:59 AM | 56 (7.3%) | 89 (11.1%) |
| 7:00 AM to 7:29 AM | 186 (24.2%) | 31 (3.9%) |
| 7:30 AM to 7:59 AM | 110 (14.3%) | 109 (13.6%) |
| 8:00 AM to 8:29 AM | 36 (4.7%) | 60 (7.5%) |
| 8:30 AM to 8:59 AM | 46 (6.0%) | 190 (23.6%) |
| 9:00 AM to 9:59 AM | 22 (2.9%) | 117 (14.5%) |
| 10:00 AM to 10:59 AM | 60 (7.8%) | 33 (4.1%) |
| 11:00 AM to 11:59 AM | 0 (0.0%) | 0 (0.0%) |
| 12:00 PM to 3:59 PM | 106 (13.8%) | 56 (7.0%) |
| 4:00 PM to 11:59 PM | 55 (7.1%) | 53 (6.6%) |
| Total | 770 (100.0%) | 804 (100.0%) |
Housing Occupancy in Pemberwick
Occupancy by Ownership in Pemberwick
Of the total 1,297 dwellings in Pemberwick, owner-occupied units account for 862 (66.5%), while renter-occupied units make up 435 (33.5%).
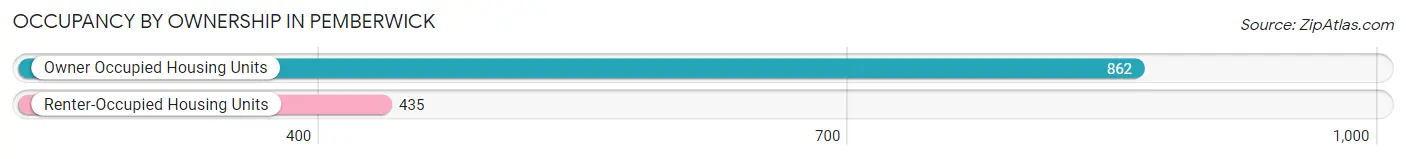
| Occupancy | # Housing Units | % Housing Units |
| Owner Occupied Housing Units | 862 | 66.5% |
| Renter-Occupied Housing Units | 435 | 33.5% |
| Total Occupied Housing Units | 1,297 | 100.0% |
Occupancy by Household Size in Pemberwick
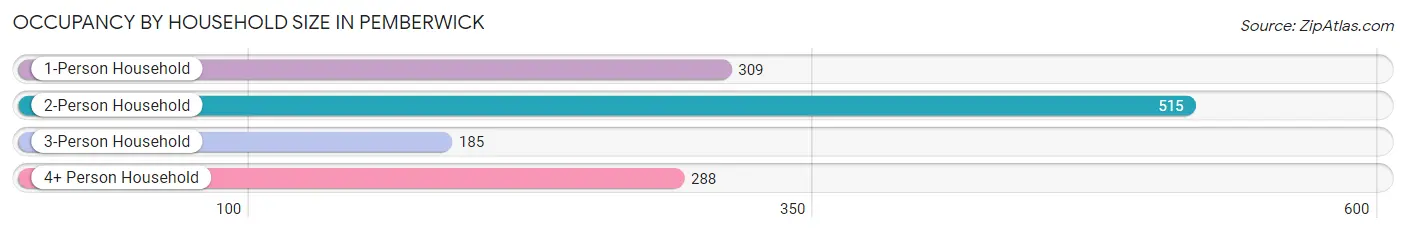
| Household Size | # Housing Units | % Housing Units |
| 1-Person Household | 309 | 23.8% |
| 2-Person Household | 515 | 39.7% |
| 3-Person Household | 185 | 14.3% |
| 4+ Person Household | 288 | 22.2% |
| Total Housing Units | 1,297 | 100.0% |
Occupancy by Ownership by Household Size in Pemberwick
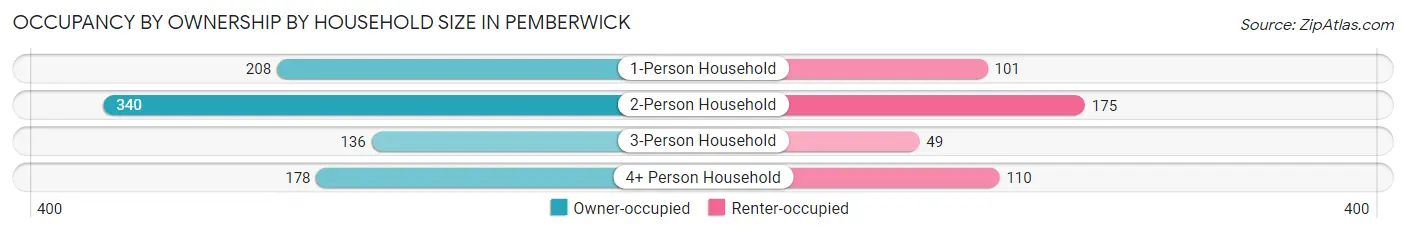
| Household Size | Owner-occupied | Renter-occupied |
| 1-Person Household | 208 (67.3%) | 101 (32.7%) |
| 2-Person Household | 340 (66.0%) | 175 (34.0%) |
| 3-Person Household | 136 (73.5%) | 49 (26.5%) |
| 4+ Person Household | 178 (61.8%) | 110 (38.2%) |
| Total Housing Units | 862 (66.5%) | 435 (33.5%) |
Occupancy by Educational Attainment in Pemberwick
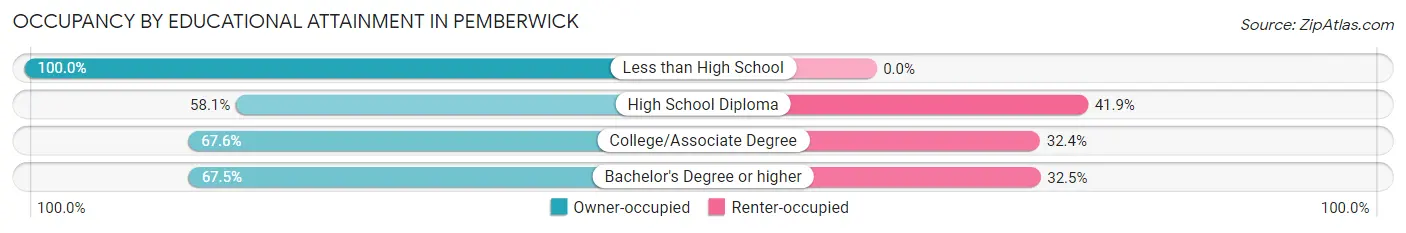
| Household Size | Owner-occupied | Renter-occupied |
| Less than High School | 22 (100.0%) | 0 (0.0%) |
| High School Diploma | 126 (58.1%) | 91 (41.9%) |
| College/Associate Degree | 177 (67.6%) | 85 (32.4%) |
| Bachelor's Degree or higher | 537 (67.5%) | 259 (32.5%) |
Occupancy by Age of Householder in Pemberwick
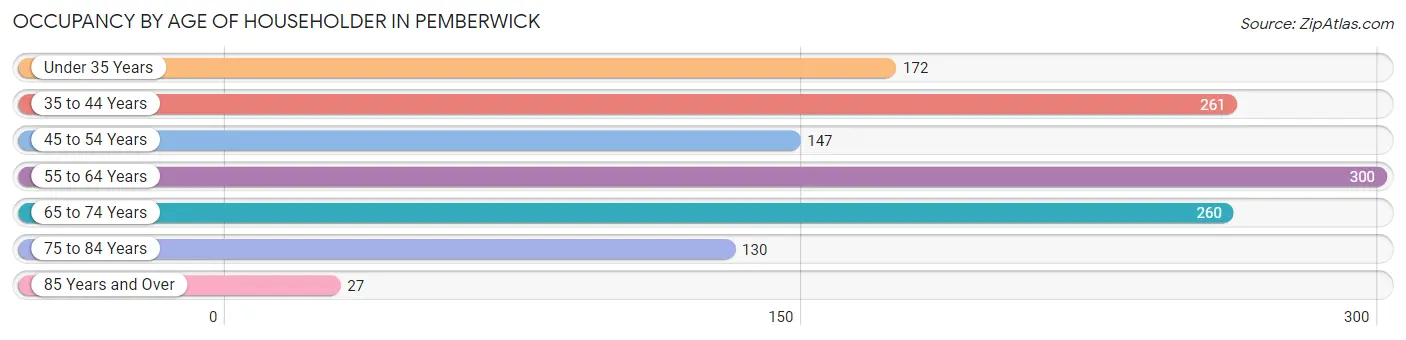
| Age Bracket | # Households | % Households |
| Under 35 Years | 172 | 13.3% |
| 35 to 44 Years | 261 | 20.1% |
| 45 to 54 Years | 147 | 11.3% |
| 55 to 64 Years | 300 | 23.1% |
| 65 to 74 Years | 260 | 20.1% |
| 75 to 84 Years | 130 | 10.0% |
| 85 Years and Over | 27 | 2.1% |
| Total | 1,297 | 100.0% |
Housing Finances in Pemberwick
Median Income by Occupancy in Pemberwick
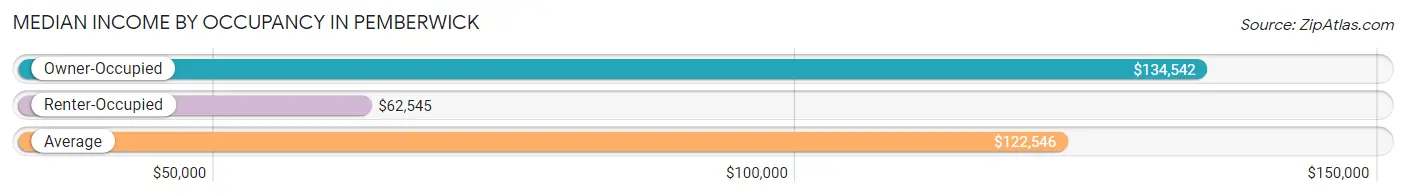
| Occupancy Type | # Households | Median Income |
| Owner-Occupied | 862 (66.5%) | $134,542 |
| Renter-Occupied | 435 (33.5%) | $62,545 |
| Average | 1,297 (100.0%) | $122,546 |
Occupancy by Householder Income Bracket in Pemberwick
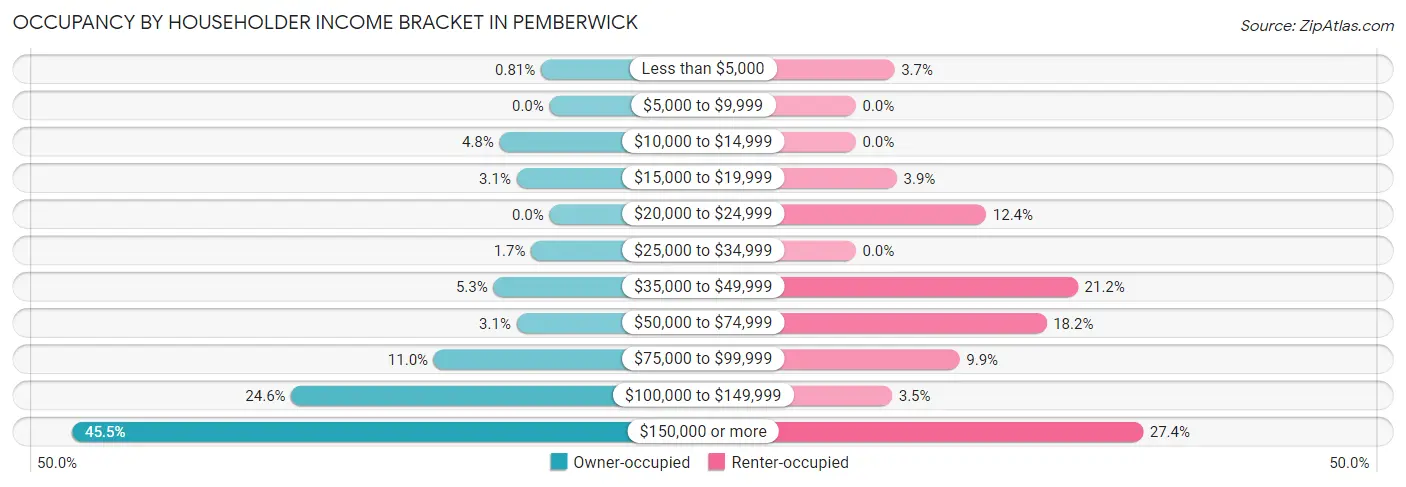
| Income Bracket | Owner-occupied | Renter-occupied |
| Less than $5,000 | 7 (0.8%) | 16 (3.7%) |
| $5,000 to $9,999 | 0 (0.0%) | 0 (0.0%) |
| $10,000 to $14,999 | 41 (4.8%) | 0 (0.0%) |
| $15,000 to $19,999 | 27 (3.1%) | 17 (3.9%) |
| $20,000 to $24,999 | 0 (0.0%) | 54 (12.4%) |
| $25,000 to $34,999 | 15 (1.7%) | 0 (0.0%) |
| $35,000 to $49,999 | 46 (5.3%) | 92 (21.1%) |
| $50,000 to $74,999 | 27 (3.1%) | 79 (18.2%) |
| $75,000 to $99,999 | 95 (11.0%) | 43 (9.9%) |
| $100,000 to $149,999 | 212 (24.6%) | 15 (3.5%) |
| $150,000 or more | 392 (45.5%) | 119 (27.4%) |
| Total | 862 (100.0%) | 435 (100.0%) |
Monthly Housing Cost Tiers in Pemberwick
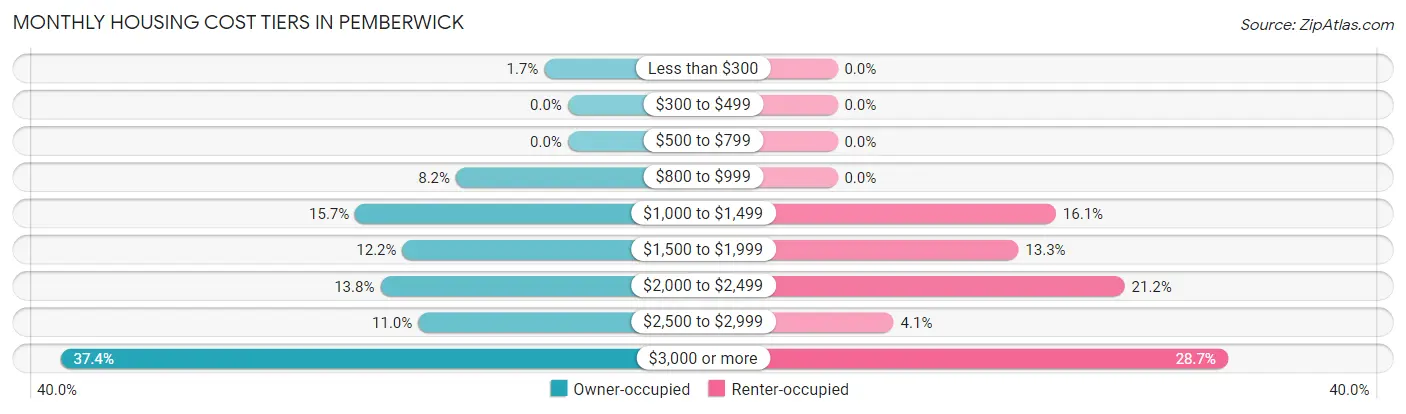
| Monthly Cost | Owner-occupied | Renter-occupied |
| Less than $300 | 15 (1.7%) | 0 (0.0%) |
| $300 to $499 | 0 (0.0%) | 0 (0.0%) |
| $500 to $799 | 0 (0.0%) | 0 (0.0%) |
| $800 to $999 | 71 (8.2%) | 0 (0.0%) |
| $1,000 to $1,499 | 135 (15.7%) | 70 (16.1%) |
| $1,500 to $1,999 | 105 (12.2%) | 58 (13.3%) |
| $2,000 to $2,499 | 119 (13.8%) | 92 (21.1%) |
| $2,500 to $2,999 | 95 (11.0%) | 18 (4.1%) |
| $3,000 or more | 322 (37.3%) | 125 (28.7%) |
| Total | 862 (100.0%) | 435 (100.0%) |
Physical Housing Characteristics in Pemberwick
Housing Structures in Pemberwick
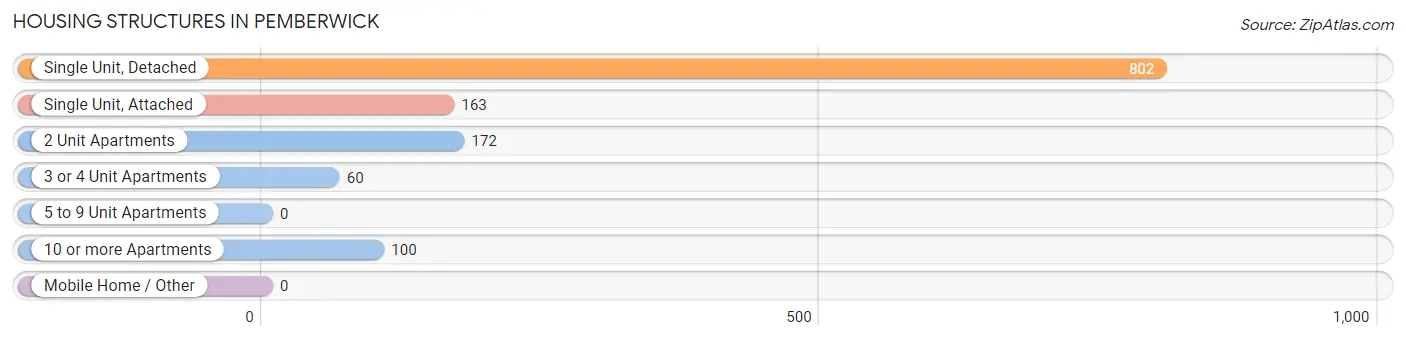
| Structure Type | # Housing Units | % Housing Units |
| Single Unit, Detached | 802 | 61.8% |
| Single Unit, Attached | 163 | 12.6% |
| 2 Unit Apartments | 172 | 13.3% |
| 3 or 4 Unit Apartments | 60 | 4.6% |
| 5 to 9 Unit Apartments | 0 | 0.0% |
| 10 or more Apartments | 100 | 7.7% |
| Mobile Home / Other | 0 | 0.0% |
| Total | 1,297 | 100.0% |
Housing Structures by Occupancy in Pemberwick
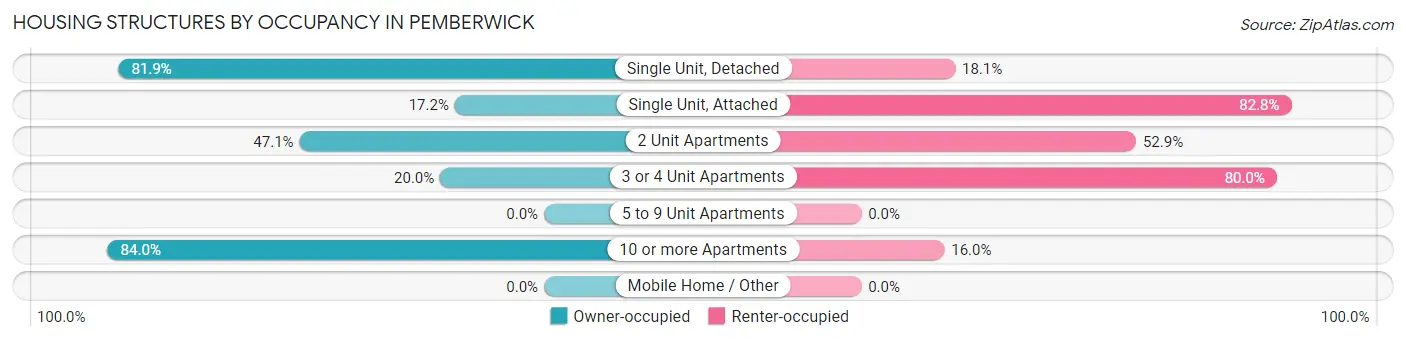
| Structure Type | Owner-occupied | Renter-occupied |
| Single Unit, Detached | 657 (81.9%) | 145 (18.1%) |
| Single Unit, Attached | 28 (17.2%) | 135 (82.8%) |
| 2 Unit Apartments | 81 (47.1%) | 91 (52.9%) |
| 3 or 4 Unit Apartments | 12 (20.0%) | 48 (80.0%) |
| 5 to 9 Unit Apartments | 0 (0.0%) | 0 (0.0%) |
| 10 or more Apartments | 84 (84.0%) | 16 (16.0%) |
| Mobile Home / Other | 0 (0.0%) | 0 (0.0%) |
| Total | 862 (66.5%) | 435 (33.5%) |
Housing Structures by Number of Rooms in Pemberwick
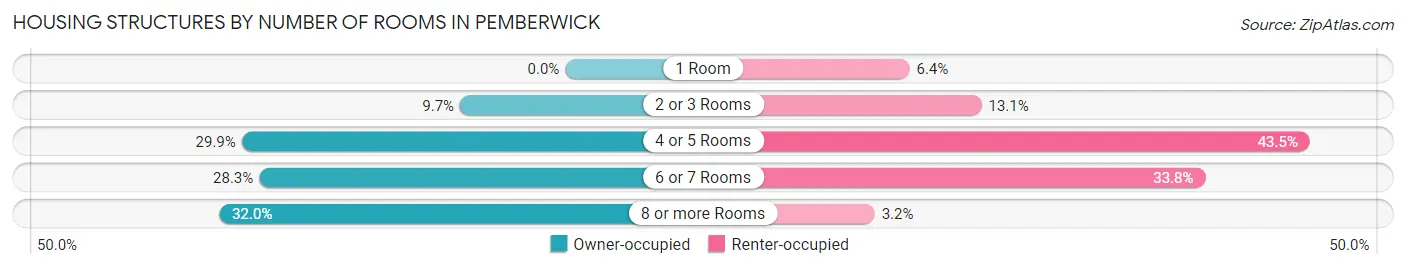
| Number of Rooms | Owner-occupied | Renter-occupied |
| 1 Room | 0 (0.0%) | 28 (6.4%) |
| 2 or 3 Rooms | 84 (9.7%) | 57 (13.1%) |
| 4 or 5 Rooms | 258 (29.9%) | 189 (43.4%) |
| 6 or 7 Rooms | 244 (28.3%) | 147 (33.8%) |
| 8 or more Rooms | 276 (32.0%) | 14 (3.2%) |
| Total | 862 (100.0%) | 435 (100.0%) |
Housing Structure by Heating Type in Pemberwick
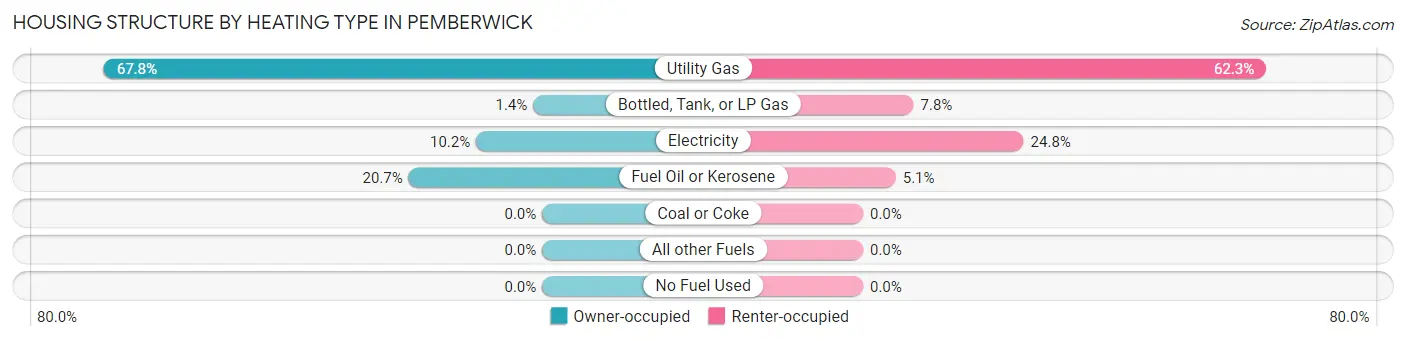
| Heating Type | Owner-occupied | Renter-occupied |
| Utility Gas | 584 (67.7%) | 271 (62.3%) |
| Bottled, Tank, or LP Gas | 12 (1.4%) | 34 (7.8%) |
| Electricity | 88 (10.2%) | 108 (24.8%) |
| Fuel Oil or Kerosene | 178 (20.6%) | 22 (5.1%) |
| Coal or Coke | 0 (0.0%) | 0 (0.0%) |
| All other Fuels | 0 (0.0%) | 0 (0.0%) |
| No Fuel Used | 0 (0.0%) | 0 (0.0%) |
| Total | 862 (100.0%) | 435 (100.0%) |
Household Vehicle Usage in Pemberwick
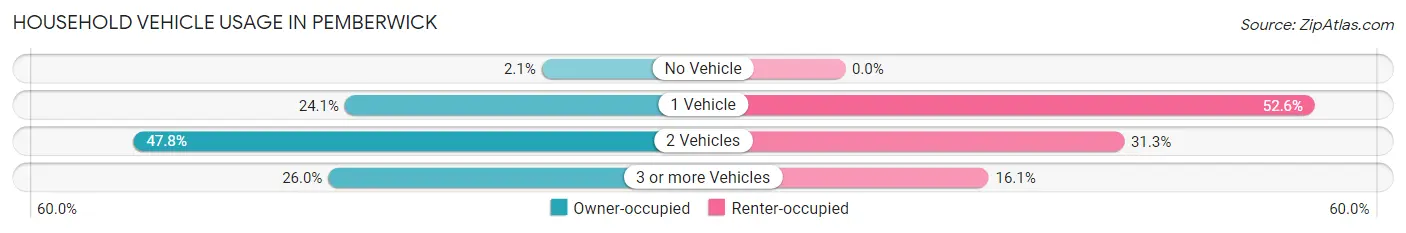
| Vehicles per Household | Owner-occupied | Renter-occupied |
| No Vehicle | 18 (2.1%) | 0 (0.0%) |
| 1 Vehicle | 208 (24.1%) | 229 (52.6%) |
| 2 Vehicles | 412 (47.8%) | 136 (31.3%) |
| 3 or more Vehicles | 224 (26.0%) | 70 (16.1%) |
| Total | 862 (100.0%) | 435 (100.0%) |
Real Estate & Mortgages in Pemberwick
Real Estate and Mortgage Overview in Pemberwick
| Characteristic | Without Mortgage | With Mortgage |
| Housing Units | 301 | 561 |
| Median Property Value | $954,100 | $707,800 |
| Median Household Income | $112,330 | $356 |
| Monthly Housing Costs | $1,249 | $309 |
| Real Estate Taxes | $6,607 | $0 |
Property Value by Mortgage Status in Pemberwick
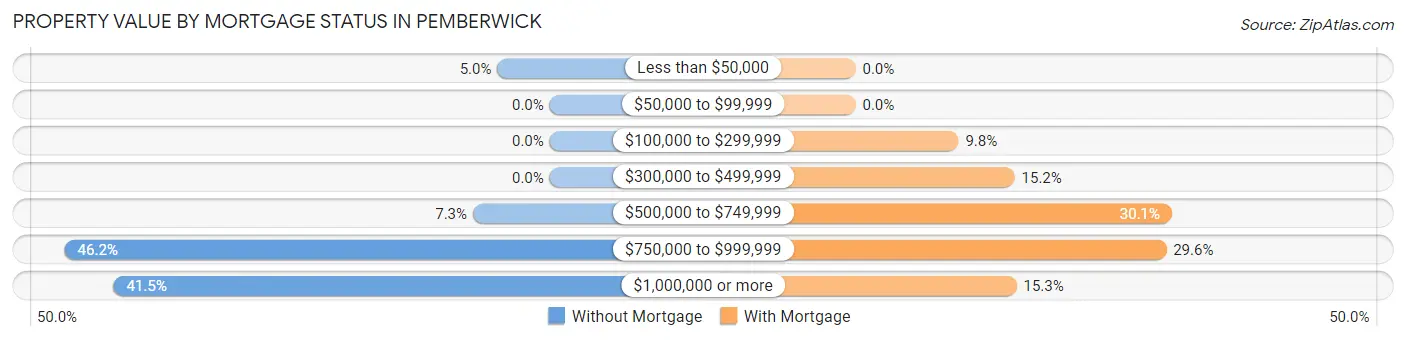
| Property Value | Without Mortgage | With Mortgage |
| Less than $50,000 | 15 (5.0%) | 0 (0.0%) |
| $50,000 to $99,999 | 0 (0.0%) | 0 (0.0%) |
| $100,000 to $299,999 | 0 (0.0%) | 55 (9.8%) |
| $300,000 to $499,999 | 0 (0.0%) | 85 (15.1%) |
| $500,000 to $749,999 | 22 (7.3%) | 169 (30.1%) |
| $750,000 to $999,999 | 139 (46.2%) | 166 (29.6%) |
| $1,000,000 or more | 125 (41.5%) | 86 (15.3%) |
| Total | 301 (100.0%) | 561 (100.0%) |
Household Income by Mortgage Status in Pemberwick
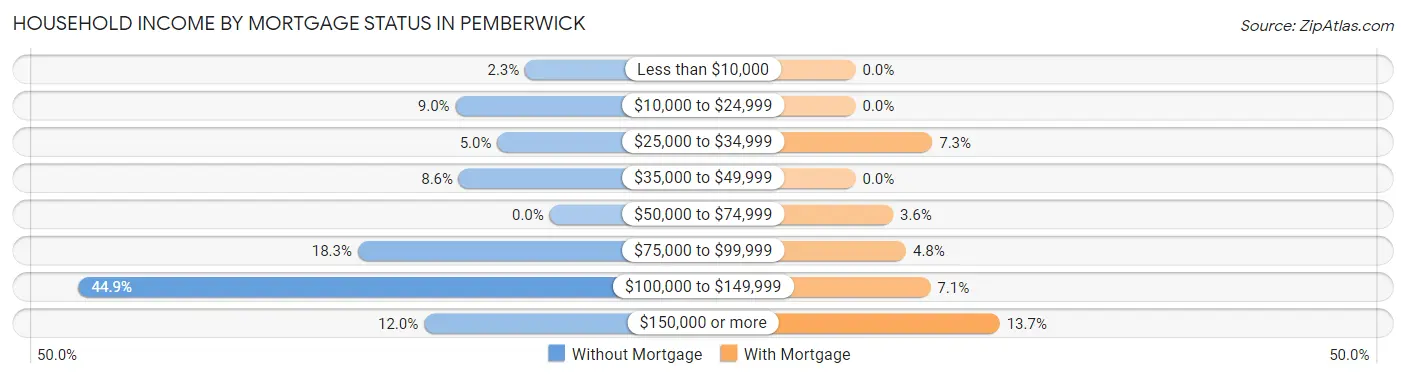
| Household Income | Without Mortgage | With Mortgage |
| Less than $10,000 | 7 (2.3%) | 0 (0.0%) |
| $10,000 to $24,999 | 27 (9.0%) | 0 (0.0%) |
| $25,000 to $34,999 | 15 (5.0%) | 41 (7.3%) |
| $35,000 to $49,999 | 26 (8.6%) | 0 (0.0%) |
| $50,000 to $74,999 | 0 (0.0%) | 20 (3.6%) |
| $75,000 to $99,999 | 55 (18.3%) | 27 (4.8%) |
| $100,000 to $149,999 | 135 (44.9%) | 40 (7.1%) |
| $150,000 or more | 36 (12.0%) | 77 (13.7%) |
| Total | 301 (100.0%) | 561 (100.0%) |
Property Value to Household Income Ratio in Pemberwick
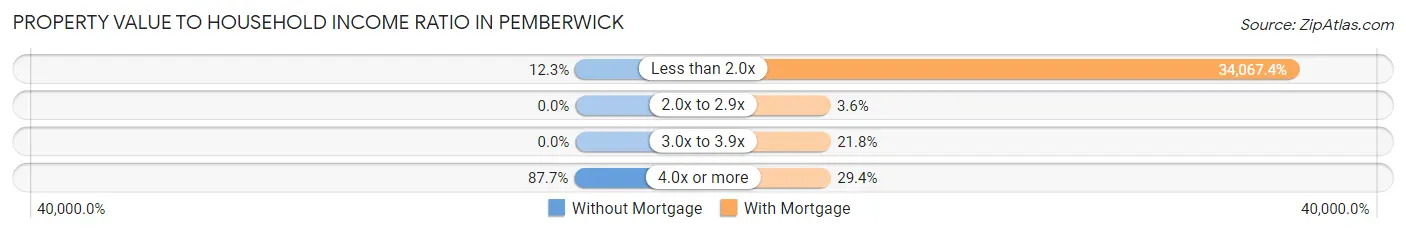
| Value-to-Income Ratio | Without Mortgage | With Mortgage |
| Less than 2.0x | 37 (12.3%) | 191,118 (34,067.4%) |
| 2.0x to 2.9x | 0 (0.0%) | 20 (3.6%) |
| 3.0x to 3.9x | 0 (0.0%) | 122 (21.7%) |
| 4.0x or more | 264 (87.7%) | 165 (29.4%) |
| Total | 301 (100.0%) | 561 (100.0%) |
Real Estate Taxes by Mortgage Status in Pemberwick
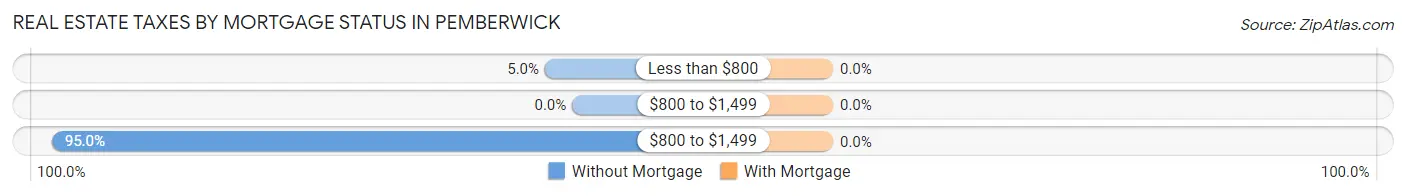
| Property Taxes | Without Mortgage | With Mortgage |
| Less than $800 | 15 (5.0%) | 0 (0.0%) |
| $800 to $1,499 | 0 (0.0%) | 0 (0.0%) |
| $800 to $1,499 | 286 (95.0%) | 0 (0.0%) |
| Total | 301 (100.0%) | 561 (100.0%) |
Health & Disability in Pemberwick
Health Insurance Coverage by Age in Pemberwick
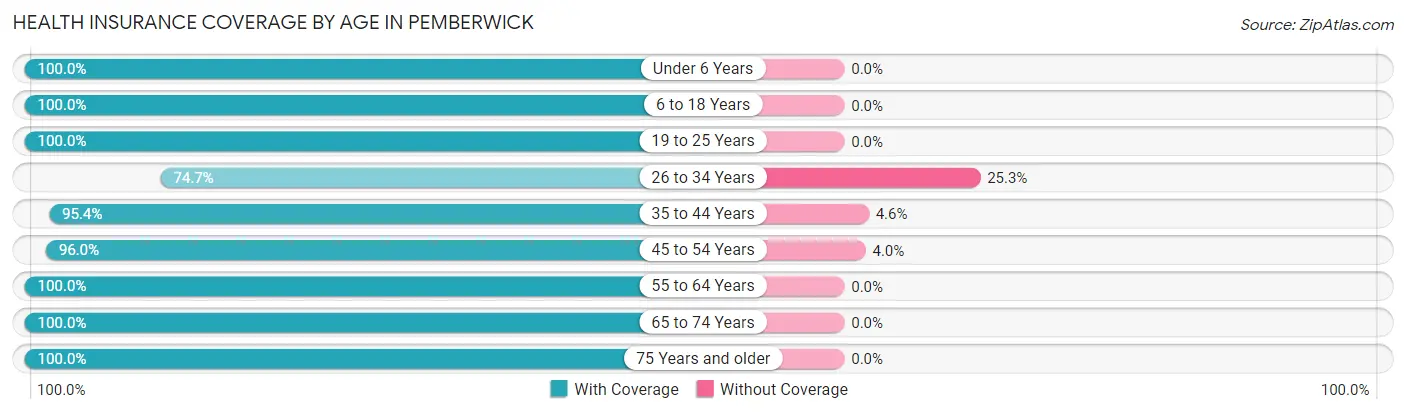
| Age Bracket | With Coverage | Without Coverage |
| Under 6 Years | 199 (100.0%) | 0 (0.0%) |
| 6 to 18 Years | 399 (100.0%) | 0 (0.0%) |
| 19 to 25 Years | 116 (100.0%) | 0 (0.0%) |
| 26 to 34 Years | 271 (74.7%) | 92 (25.3%) |
| 35 to 44 Years | 460 (95.4%) | 22 (4.6%) |
| 45 to 54 Years | 315 (96.0%) | 13 (4.0%) |
| 55 to 64 Years | 651 (100.0%) | 0 (0.0%) |
| 65 to 74 Years | 386 (100.0%) | 0 (0.0%) |
| 75 Years and older | 288 (100.0%) | 0 (0.0%) |
| Total | 3,085 (96.1%) | 127 (4.0%) |
Health Insurance Coverage by Citizenship Status in Pemberwick
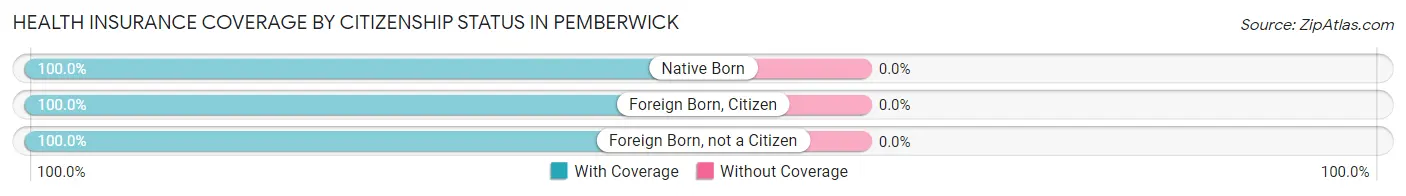
| Citizenship Status | With Coverage | Without Coverage |
| Native Born | 199 (100.0%) | 0 (0.0%) |
| Foreign Born, Citizen | 399 (100.0%) | 0 (0.0%) |
| Foreign Born, not a Citizen | 116 (100.0%) | 0 (0.0%) |
Health Insurance Coverage by Household Income in Pemberwick
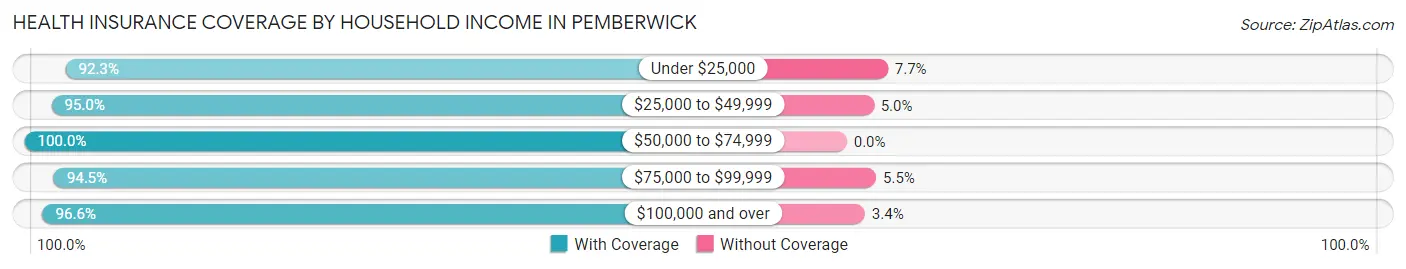
| Household Income | With Coverage | Without Coverage |
| Under $25,000 | 216 (92.3%) | 18 (7.7%) |
| $25,000 to $49,999 | 358 (95.0%) | 19 (5.0%) |
| $50,000 to $74,999 | 191 (100.0%) | 0 (0.0%) |
| $75,000 to $99,999 | 379 (94.5%) | 22 (5.5%) |
| $100,000 and over | 1,938 (96.6%) | 68 (3.4%) |
Public vs Private Health Insurance Coverage by Age in Pemberwick
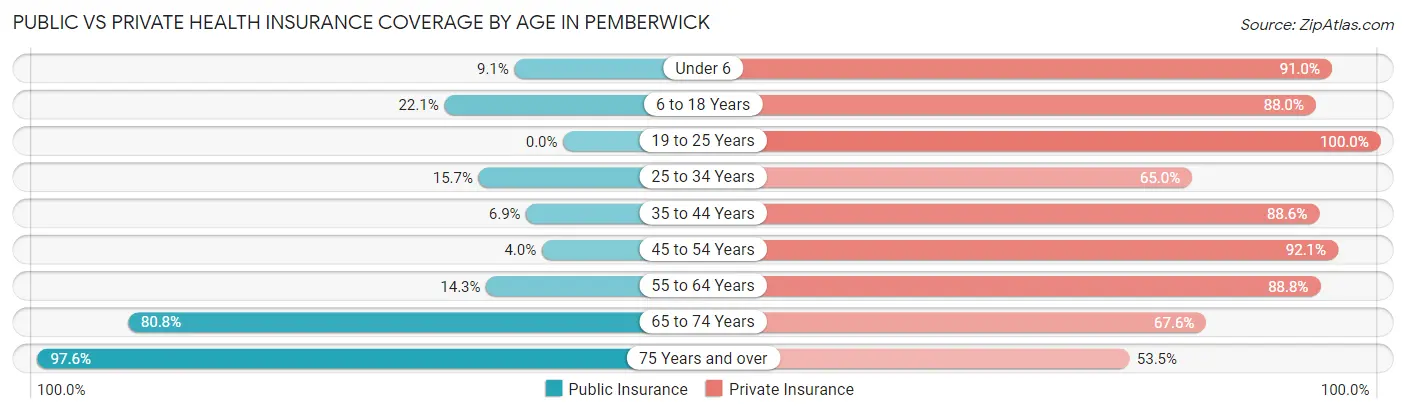
| Age Bracket | Public Insurance | Private Insurance |
| Under 6 | 18 (9.0%) | 181 (90.9%) |
| 6 to 18 Years | 88 (22.1%) | 351 (88.0%) |
| 19 to 25 Years | 0 (0.0%) | 116 (100.0%) |
| 25 to 34 Years | 57 (15.7%) | 236 (65.0%) |
| 35 to 44 Years | 33 (6.9%) | 427 (88.6%) |
| 45 to 54 Years | 13 (4.0%) | 302 (92.1%) |
| 55 to 64 Years | 93 (14.3%) | 578 (88.8%) |
| 65 to 74 Years | 312 (80.8%) | 261 (67.6%) |
| 75 Years and over | 281 (97.6%) | 154 (53.5%) |
| Total | 895 (27.9%) | 2,606 (81.1%) |
Disability Status by Sex by Age in Pemberwick
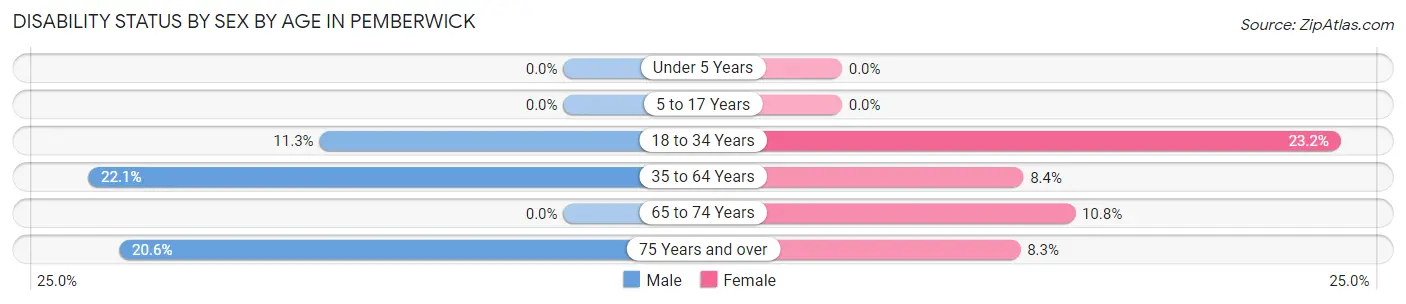
| Age Bracket | Male | Female |
| Under 5 Years | 0 (0.0%) | 0 (0.0%) |
| 5 to 17 Years | 0 (0.0%) | 0 (0.0%) |
| 18 to 34 Years | 36 (11.3%) | 50 (23.2%) |
| 35 to 64 Years | 131 (22.1%) | 73 (8.4%) |
| 65 to 74 Years | 0 (0.0%) | 21 (10.8%) |
| 75 Years and over | 27 (20.6%) | 13 (8.3%) |
Disability Class by Sex by Age in Pemberwick
Disability Class: Hearing Difficulty
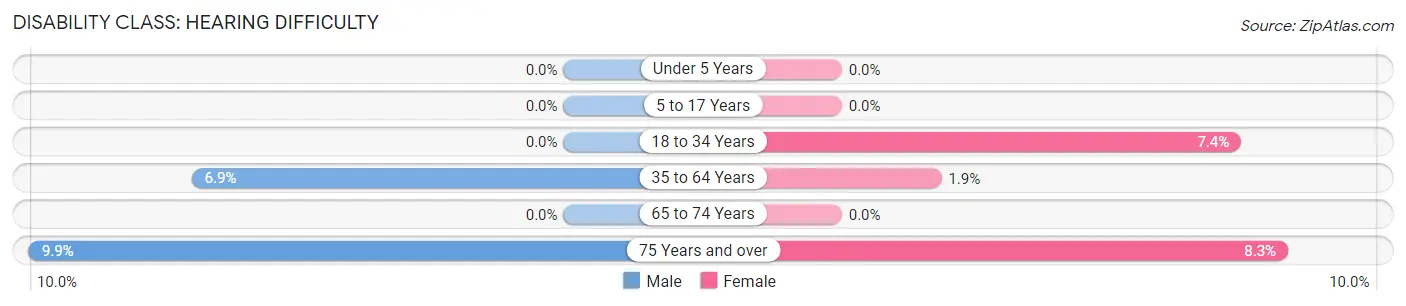
| Age Bracket | Male | Female |
| Under 5 Years | 0 (0.0%) | 0 (0.0%) |
| 5 to 17 Years | 0 (0.0%) | 0 (0.0%) |
| 18 to 34 Years | 0 (0.0%) | 16 (7.4%) |
| 35 to 64 Years | 41 (6.9%) | 16 (1.8%) |
| 65 to 74 Years | 0 (0.0%) | 0 (0.0%) |
| 75 Years and over | 13 (9.9%) | 13 (8.3%) |
Disability Class: Vision Difficulty
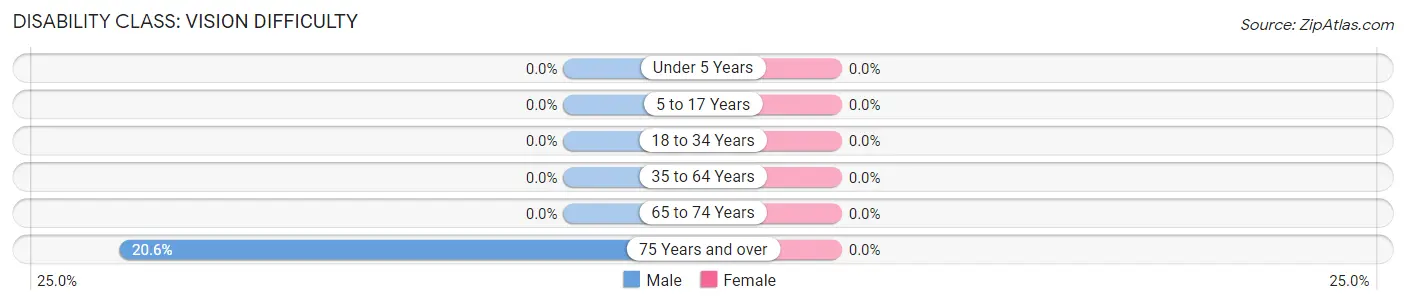
| Age Bracket | Male | Female |
| Under 5 Years | 0 (0.0%) | 0 (0.0%) |
| 5 to 17 Years | 0 (0.0%) | 0 (0.0%) |
| 18 to 34 Years | 0 (0.0%) | 0 (0.0%) |
| 35 to 64 Years | 0 (0.0%) | 0 (0.0%) |
| 65 to 74 Years | 0 (0.0%) | 0 (0.0%) |
| 75 Years and over | 27 (20.6%) | 0 (0.0%) |
Disability Class: Cognitive Difficulty
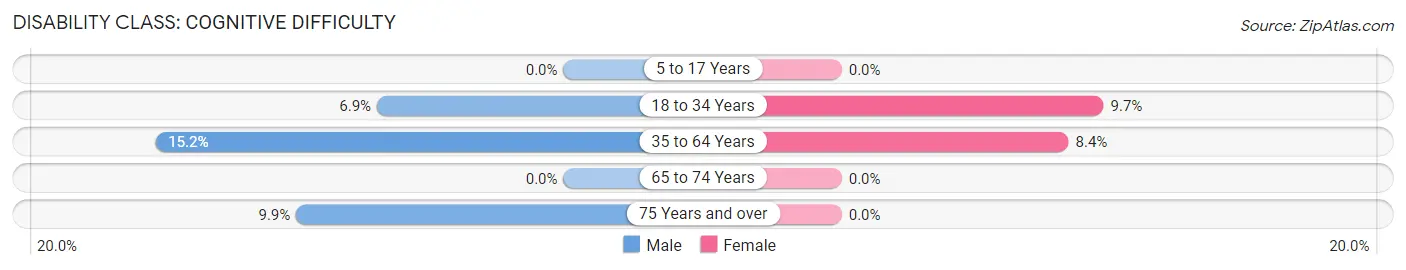
| Age Bracket | Male | Female |
| 5 to 17 Years | 0 (0.0%) | 0 (0.0%) |
| 18 to 34 Years | 22 (6.9%) | 21 (9.7%) |
| 35 to 64 Years | 90 (15.1%) | 73 (8.4%) |
| 65 to 74 Years | 0 (0.0%) | 0 (0.0%) |
| 75 Years and over | 13 (9.9%) | 0 (0.0%) |
Disability Class: Ambulatory Difficulty
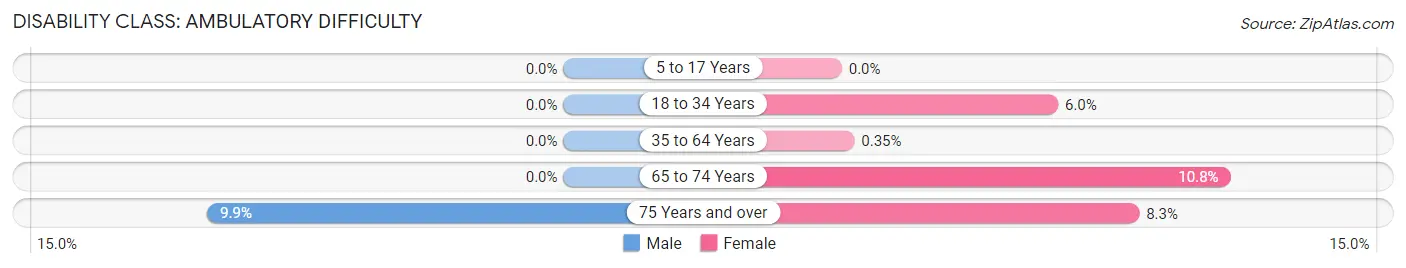
| Age Bracket | Male | Female |
| 5 to 17 Years | 0 (0.0%) | 0 (0.0%) |
| 18 to 34 Years | 0 (0.0%) | 13 (6.0%) |
| 35 to 64 Years | 0 (0.0%) | 3 (0.4%) |
| 65 to 74 Years | 0 (0.0%) | 21 (10.8%) |
| 75 Years and over | 13 (9.9%) | 13 (8.3%) |
Disability Class: Self-Care Difficulty
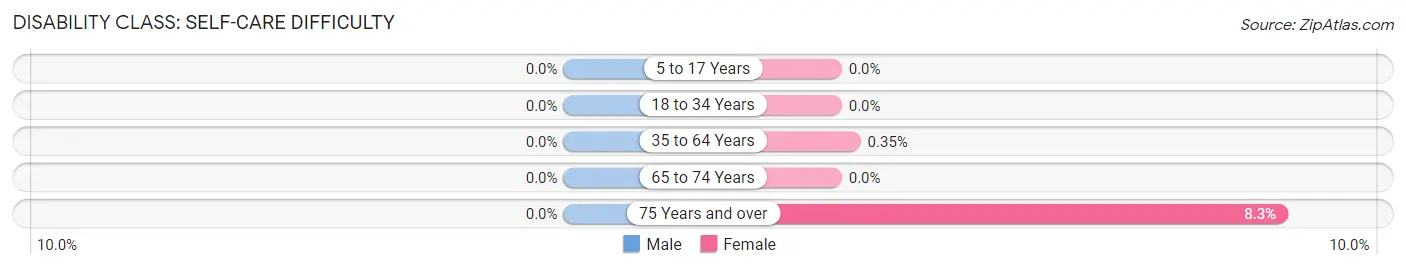
| Age Bracket | Male | Female |
| 5 to 17 Years | 0 (0.0%) | 0 (0.0%) |
| 18 to 34 Years | 0 (0.0%) | 0 (0.0%) |
| 35 to 64 Years | 0 (0.0%) | 3 (0.4%) |
| 65 to 74 Years | 0 (0.0%) | 0 (0.0%) |
| 75 Years and over | 0 (0.0%) | 13 (8.3%) |
Technology Access in Pemberwick
Computing Device Access in Pemberwick
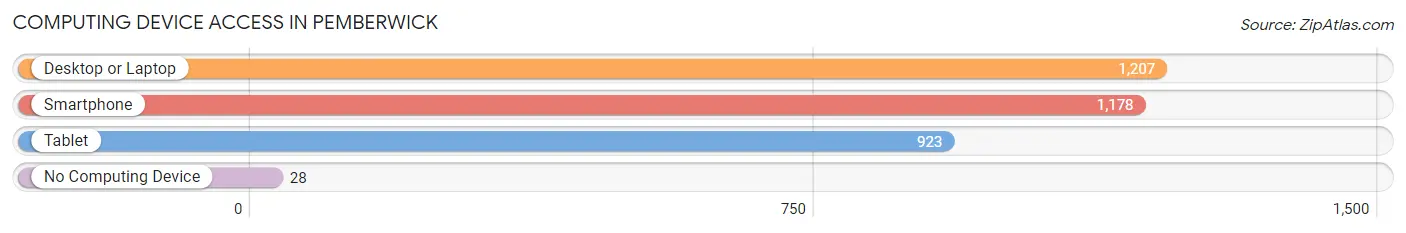
| Device Type | # Households | % Households |
| Desktop or Laptop | 1,207 | 93.1% |
| Smartphone | 1,178 | 90.8% |
| Tablet | 923 | 71.2% |
| No Computing Device | 28 | 2.2% |
| Total | 1,297 | 100.0% |
Internet Access in Pemberwick
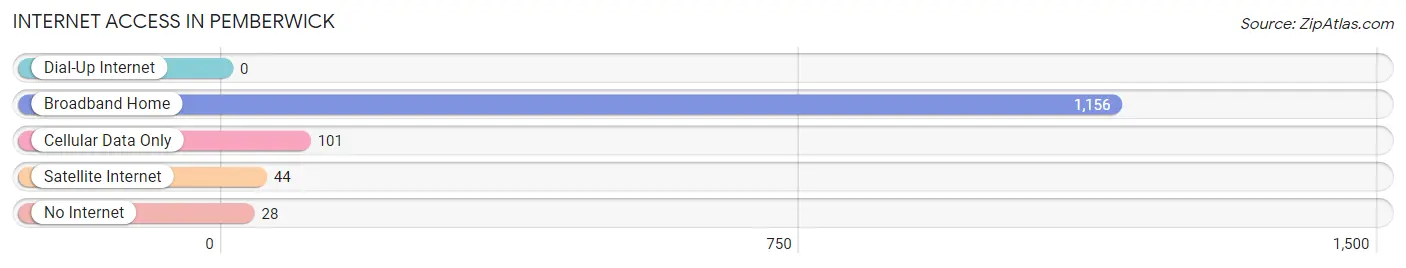
| Internet Type | # Households | % Households |
| Dial-Up Internet | 0 | 0.0% |
| Broadband Home | 1,156 | 89.1% |
| Cellular Data Only | 101 | 7.8% |
| Satellite Internet | 44 | 3.4% |
| No Internet | 28 | 2.2% |
| Total | 1,297 | 100.0% |
Pemberwick Summary
Pemberwick is a small, unincorporated community located in the town of Greenwich, Connecticut. It is situated on the Long Island Sound, just east of the Byram River. The area is bordered by the towns of Stamford, Darien, and New Canaan. Pemberwick is a quiet, residential neighborhood with a population of approximately 1,000 people.
History
Pemberwick was originally part of the town of Greenwich, which was established in 1665. The area was first settled in the late 1600s by English settlers. The name Pemberwick is derived from the name of the original settler, John Pember, who was granted a large tract of land in the area in 1690.
In the late 1700s, Pemberwick was a thriving agricultural community. The area was known for its dairy farms, orchards, and vegetable gardens. In the early 1800s, the area began to transition from an agricultural to a residential community. By the mid-1800s, Pemberwick had become a popular summer destination for wealthy New Yorkers.
Geography
Pemberwick is located in the southwestern corner of Greenwich, Connecticut. It is bordered by the towns of Stamford, Darien, and New Canaan. The area is situated on the Long Island Sound, just east of the Byram River. The terrain is mostly flat, with some rolling hills. The area is known for its scenic views of the Long Island Sound and the Byram River.
Economy
Pemberwick is primarily a residential community, with no major industries or businesses. The area is home to a few small businesses, such as a convenience store, a gas station, and a few restaurants. The majority of the population is employed in the nearby towns of Stamford, Darien, and New Canaan.
Demographics
As of the 2010 census, the population of Pemberwick was 1,000. The racial makeup of the area was 94.2% White, 2.2% African American, 0.7% Asian, 0.3% Native American, and 2.6% from other races. The median household income was $90,000, and the median age was 43.
Pemberwick is a quiet, residential community with a strong sense of community. The area is known for its scenic views of the Long Island Sound and the Byram River. It is a popular destination for families and retirees looking for a peaceful, suburban lifestyle.
Common Questions
What is Per Capita Income in Pemberwick?
Per Capita income in Pemberwick is $61,935.
What is the Median Family Income in Pemberwick?
Median Family Income in Pemberwick is $133,980.
What is the Median Household income in Pemberwick?
Median Household Income in Pemberwick is $122,546.
What is Income or Wage Gap in Pemberwick?
Income or Wage Gap in Pemberwick is 25.6%.
Women in Pemberwick earn 74.4 cents for every dollar earned by a man.
What is Inequality or Gini Index in Pemberwick?
Inequality or Gini Index in Pemberwick is 0.44.
What is the Total Population of Pemberwick?
Total Population of Pemberwick is 3,212.
What is the Total Male Population of Pemberwick?
Total Male Population of Pemberwick is 1,508.
What is the Total Female Population of Pemberwick?
Total Female Population of Pemberwick is 1,704.
What is the Ratio of Males per 100 Females in Pemberwick?
There are 88.50 Males per 100 Females in Pemberwick.
What is the Ratio of Females per 100 Males in Pemberwick?
There are 113.00 Females per 100 Males in Pemberwick.
What is the Median Population Age in Pemberwick?
Median Population Age in Pemberwick is 48.1 Years.
What is the Average Family Size in Pemberwick
Average Family Size in Pemberwick is 2.9 People.
What is the Average Household Size in Pemberwick
Average Household Size in Pemberwick is 2.5 People.
How Large is the Labor Force in Pemberwick?
There are 1,967 People in the Labor Forcein in Pemberwick.
What is the Percentage of People in the Labor Force in Pemberwick?
71.4% of People are in the Labor Force in Pemberwick.
What is the Unemployment Rate in Pemberwick?
Unemployment Rate in Pemberwick is 5.4%.