Cities with the Highest Percentage of Population Employed in Utilities in Connecticut
RELATED REPORTS & OPTIONS
Utilities
Connecticut
Compare Cities
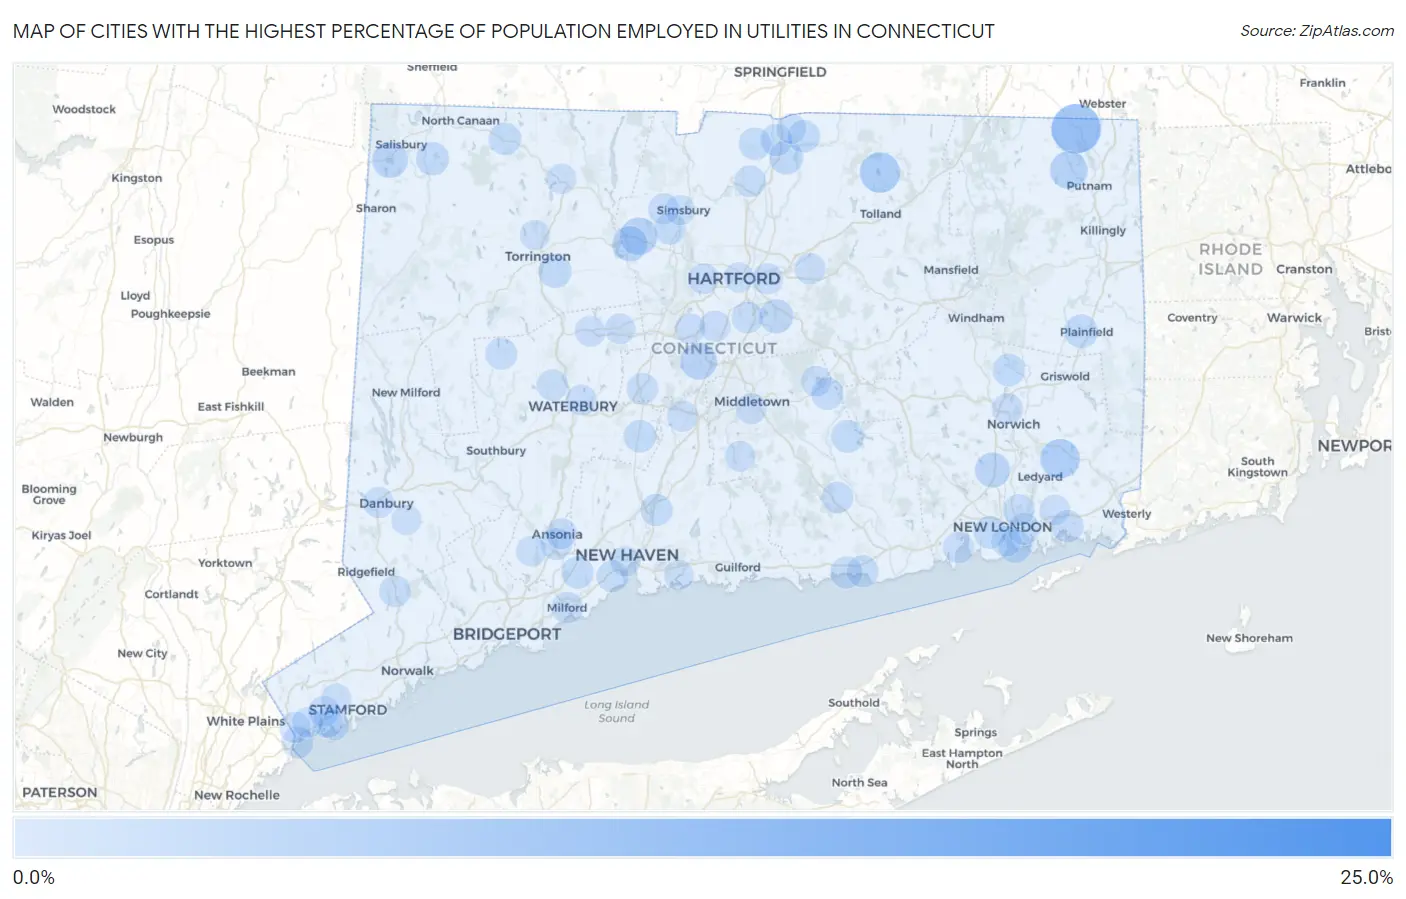
Map of Cities with the Highest Percentage of Population Employed in Utilities in Connecticut
0.0%
25.0%
Cities with the Highest Percentage of Population Employed in Utilities in Connecticut
| City | % Employed | vs State | vs National | |
| 1. | Witches Woods | 23.3% | 0.69%(+22.6)#1 | 0.84%(+22.5)#128 |
| 2. | Route 7 Gateway | 10.2% | 0.69%(+9.50)#2 | 0.84%(+9.36)#514 |
| 3. | Quinebaug | 9.6% | 0.69%(+8.93)#3 | 0.84%(+8.79)#559 |
| 4. | Darien Downtown | 5.3% | 0.69%(+4.65)#4 | 0.84%(+4.51)#1,310 |
| 5. | Crystal Lake | 5.2% | 0.69%(+4.49)#5 | 0.84%(+4.34)#1,386 |
| 6. | Mashantucket | 4.8% | 0.69%(+4.07)#6 | 0.84%(+3.92)#1,577 |
| 7. | Botsford | 4.3% | 0.69%(+3.63)#7 | 0.84%(+3.49)#1,839 |
| 8. | South Woodstock | 3.9% | 0.69%(+3.19)#8 | 0.84%(+3.04)#2,126 |
| 9. | Canton Valley | 3.7% | 0.69%(+3.02)#9 | 0.84%(+2.87)#2,277 |
| 10. | Kensington | 3.4% | 0.69%(+2.73)#10 | 0.84%(+2.58)#2,522 |
| 11. | Mechanicsville | 3.2% | 0.69%(+2.52)#11 | 0.84%(+2.37)#2,732 |
| 12. | Lakeville | 3.0% | 0.69%(+2.30)#12 | 0.84%(+2.15)#2,966 |
| 13. | Ball Pond | 2.9% | 0.69%(+2.16)#13 | 0.84%(+2.02)#3,136 |
| 14. | Collinsville | 2.8% | 0.69%(+2.06)#14 | 0.84%(+1.92)#3,269 |
| 15. | Oxoboxo River | 2.6% | 0.69%(+1.94)#15 | 0.84%(+1.80)#3,452 |
| 16. | Glastonbury Center | 2.2% | 0.69%(+1.49)#16 | 0.84%(+1.35)#4,222 |
| 17. | Southwood Acres | 2.1% | 0.69%(+1.42)#17 | 0.84%(+1.28)#4,382 |
| 18. | Stratford Downtown | 2.1% | 0.69%(+1.36)#18 | 0.84%(+1.22)#4,529 |
| 19. | Plainfield Village | 2.0% | 0.69%(+1.30)#19 | 0.84%(+1.15)#4,684 |
| 20. | Falls Village | 1.8% | 0.69%(+1.13)#20 | 0.84%(+0.989)#5,084 |
| 21. | Northwest Harwinton | 1.8% | 0.69%(+1.09)#21 | 0.84%(+0.943)#5,222 |
| 22. | Groton | 1.7% | 0.69%(+1.04)#22 | 0.84%(+0.896)#5,354 |
| 23. | New Canaan | 1.7% | 0.69%(+0.996)#23 | 0.84%(+0.851)#5,496 |
| 24. | Waterford | 1.6% | 0.69%(+0.901)#24 | 0.84%(+0.756)#5,821 |
| 25. | Moodus | 1.5% | 0.69%(+0.808)#25 | 0.84%(+0.663)#6,158 |
| 26. | Baltic | 1.5% | 0.69%(+0.788)#26 | 0.84%(+0.643)#6,235 |
| 27. | Compo | 1.5% | 0.69%(+0.775)#27 | 0.84%(+0.630)#6,293 |
| 28. | Hazardville | 1.5% | 0.69%(+0.767)#28 | 0.84%(+0.622)#6,315 |
| 29. | Cheshire Village | 1.4% | 0.69%(+0.740)#29 | 0.84%(+0.595)#6,423 |
| 30. | Norfolk | 1.4% | 0.69%(+0.732)#30 | 0.84%(+0.587)#6,456 |
| 31. | Litchfield Borough | 1.4% | 0.69%(+0.676)#31 | 0.84%(+0.531)#6,655 |
| 32. | Suffield Depot | 1.3% | 0.69%(+0.613)#32 | 0.84%(+0.468)#6,919 |
| 33. | Poplar Plains | 1.3% | 0.69%(+0.594)#33 | 0.84%(+0.449)#7,021 |
| 34. | Orange | 1.3% | 0.69%(+0.589)#34 | 0.84%(+0.444)#7,041 |
| 35. | North Haven | 1.3% | 0.69%(+0.580)#35 | 0.84%(+0.435)#7,081 |
| 36. | Mystic | 1.3% | 0.69%(+0.565)#36 | 0.84%(+0.420)#7,155 |
| 37. | Thompsonville | 1.2% | 0.69%(+0.550)#37 | 0.84%(+0.405)#7,212 |
| 38. | East Hampton | 1.2% | 0.69%(+0.541)#38 | 0.84%(+0.396)#7,259 |
| 39. | Westbrook Center | 1.2% | 0.69%(+0.537)#39 | 0.84%(+0.392)#7,281 |
| 40. | Saybrook Manor | 1.2% | 0.69%(+0.511)#40 | 0.84%(+0.366)#7,426 |
| 41. | Stonington Borough | 1.2% | 0.69%(+0.501)#41 | 0.84%(+0.356)#7,476 |
| 42. | Bethlehem Village | 1.2% | 0.69%(+0.490)#42 | 0.84%(+0.345)#7,537 |
| 43. | Northford | 1.2% | 0.69%(+0.488)#43 | 0.84%(+0.343)#7,543 |
| 44. | Derby | 1.2% | 0.69%(+0.486)#44 | 0.84%(+0.341)#7,553 |
| 45. | Tashua | 1.2% | 0.69%(+0.460)#45 | 0.84%(+0.315)#7,682 |
| 46. | Weatogue | 1.2% | 0.69%(+0.460)#46 | 0.84%(+0.315)#7,683 |
| 47. | Long Hill | 1.1% | 0.69%(+0.421)#47 | 0.84%(+0.276)#7,878 |
| 48. | West Haven | 1.1% | 0.69%(+0.418)#48 | 0.84%(+0.273)#7,901 |
| 49. | Byram | 1.1% | 0.69%(+0.418)#49 | 0.84%(+0.273)#7,903 |
| 50. | Windsor Locks | 1.1% | 0.69%(+0.363)#50 | 0.84%(+0.218)#8,199 |
| 51. | Woodmont Borough | 1.0% | 0.69%(+0.352)#51 | 0.84%(+0.207)#8,257 |
| 52. | Greens Farms | 1.0% | 0.69%(+0.317)#52 | 0.84%(+0.172)#8,446 |
| 53. | Milford City Balance | 1.0% | 0.69%(+0.314)#53 | 0.84%(+0.169)#8,465 |
| 54. | Trumbull Center | 1.00% | 0.69%(+0.304)#54 | 0.84%(+0.159)#8,516 |
| 55. | Wethersfield | 0.97% | 0.69%(+0.280)#55 | 0.84%(+0.135)#8,666 |
| 56. | Georgetown | 0.96% | 0.69%(+0.272)#56 | 0.84%(+0.127)#8,709 |
| 57. | Plantsville | 0.95% | 0.69%(+0.259)#57 | 0.84%(+0.114)#8,795 |
| 58. | Chester Center | 0.93% | 0.69%(+0.243)#58 | 0.84%(+0.097)#8,901 |
| 59. | Oakville | 0.89% | 0.69%(+0.203)#59 | 0.84%(+0.058)#9,179 |
| 60. | Conning Towers Nautilus Park | 0.89% | 0.69%(+0.197)#60 | 0.84%(+0.052)#9,210 |
| 61. | Niantic | 0.87% | 0.69%(+0.175)#61 | 0.84%(+0.030)#9,367 |
| 62. | Pemberwick | 0.86% | 0.69%(+0.168)#62 | 0.84%(+0.023)#9,406 |
| 63. | Newington | 0.79% | 0.69%(+0.096)#63 | 0.84%(-0.049)#9,948 |
| 64. | Groton Long Point Borough | 0.78% | 0.69%(+0.089)#64 | 0.84%(-0.056)#9,997 |
| 65. | Manchester | 0.73% | 0.69%(+0.042)#65 | 0.84%(-0.103)#10,333 |
| 66. | Norwich | 0.73% | 0.69%(+0.039)#66 | 0.84%(-0.106)#10,351 |
| 67. | East Hartford | 0.73% | 0.69%(+0.038)#67 | 0.84%(-0.107)#10,353 |
| 68. | Tokeneke | 0.72% | 0.69%(+0.027)#68 | 0.84%(-0.118)#10,449 |
| 69. | West Simsbury | 0.70% | 0.69%(+0.013)#69 | 0.84%(-0.132)#10,558 |
| 70. | Meriden | 0.70% | 0.69%(+0.004)#70 | 0.84%(-0.141)#10,632 |
| 71. | Ansonia | 0.69% | 0.69%(+0.002)#71 | 0.84%(-0.143)#10,651 |
| 72. | Danbury | 0.66% | 0.69%(-0.034)#72 | 0.84%(-0.179)#10,979 |
| 73. | Middletown | 0.64% | 0.69%(-0.055)#73 | 0.84%(-0.200)#11,165 |
| 74. | Old Greenwich | 0.61% | 0.69%(-0.080)#74 | 0.84%(-0.225)#11,386 |
| 75. | Sandy Hook | 0.59% | 0.69%(-0.098)#75 | 0.84%(-0.243)#11,564 |
| 76. | Cos Cob | 0.59% | 0.69%(-0.100)#76 | 0.84%(-0.245)#11,580 |
| 77. | Waterbury | 0.59% | 0.69%(-0.104)#77 | 0.84%(-0.249)#11,623 |
| 78. | Durham | 0.58% | 0.69%(-0.114)#78 | 0.84%(-0.259)#11,709 |
| 79. | West Hartford | 0.57% | 0.69%(-0.122)#79 | 0.84%(-0.267)#11,776 |
| 80. | Naugatuck Borough | 0.56% | 0.69%(-0.131)#80 | 0.84%(-0.276)#11,858 |
| 81. | Lake Pocotopaug | 0.56% | 0.69%(-0.134)#81 | 0.84%(-0.279)#11,888 |
| 82. | New Britain | 0.54% | 0.69%(-0.151)#82 | 0.84%(-0.296)#12,040 |
| 83. | Bristol | 0.52% | 0.69%(-0.172)#83 | 0.84%(-0.317)#12,242 |
| 84. | Terryville | 0.50% | 0.69%(-0.187)#84 | 0.84%(-0.332)#12,379 |
| 85. | Shelton | 0.49% | 0.69%(-0.201)#85 | 0.84%(-0.346)#12,499 |
| 86. | Noroton Heights | 0.47% | 0.69%(-0.217)#86 | 0.84%(-0.362)#12,657 |
| 87. | Riverside | 0.46% | 0.69%(-0.228)#87 | 0.84%(-0.373)#12,747 |
| 88. | New London | 0.46% | 0.69%(-0.236)#88 | 0.84%(-0.381)#12,824 |
| 89. | Old Mystic | 0.43% | 0.69%(-0.261)#89 | 0.84%(-0.406)#13,088 |
| 90. | Stamford | 0.42% | 0.69%(-0.272)#90 | 0.84%(-0.417)#13,175 |
| 91. | Greenwich | 0.41% | 0.69%(-0.279)#91 | 0.84%(-0.424)#13,253 |
| 92. | New Haven | 0.39% | 0.69%(-0.297)#92 | 0.84%(-0.442)#13,436 |
| 93. | Bethel | 0.38% | 0.69%(-0.311)#93 | 0.84%(-0.456)#13,547 |
| 94. | Simsbury Center | 0.37% | 0.69%(-0.318)#94 | 0.84%(-0.463)#13,603 |
| 95. | Winsted | 0.37% | 0.69%(-0.321)#95 | 0.84%(-0.466)#13,637 |
| 96. | Torrington | 0.35% | 0.69%(-0.337)#96 | 0.84%(-0.482)#13,790 |
| 97. | Hartford | 0.33% | 0.69%(-0.366)#97 | 0.84%(-0.511)#14,005 |
| 98. | Branford Center | 0.32% | 0.69%(-0.372)#98 | 0.84%(-0.517)#14,046 |
| 99. | Sherwood Manor | 0.32% | 0.69%(-0.376)#99 | 0.84%(-0.521)#14,070 |
| 100. | Daniels Farm | 0.31% | 0.69%(-0.387)#100 | 0.84%(-0.532)#14,149 |
Common Questions
What are the Top 10 Cities with the Highest Percentage of Population Employed in Utilities in Connecticut?
Top 10 Cities with the Highest Percentage of Population Employed in Utilities in Connecticut are:
#1
9.6%
#2
5.2%
#3
4.8%
#4
3.9%
#5
3.7%
#6
3.4%
#7
3.0%
#8
2.8%
#9
2.6%
#10
2.2%
What city has the Highest Percentage of Population Employed in Utilities in Connecticut?
Quinebaug has the Highest Percentage of Population Employed in Utilities in Connecticut with 9.6%.
What is the Percentage of Population Employed in Utilities in the State of Connecticut?
Percentage of Population Employed in Utilities in Connecticut is 0.69%.
What is the Percentage of Population Employed in Utilities in the United States?
Percentage of Population Employed in Utilities in the United States is 0.84%.